
Submitted:
30 October 2023
Posted:
31 October 2023
Read the latest preprint version here
Abstract
Based on the similarity theory, a large-size salt rock horizontal well cavity-leaching test platform was built, and horizontal-well cavity leaching tests with nitrogen cushion were carried out, and based on the cavity-leaching parameters, the extension characteristics of cavity morphology and the influence law of the cavity-leaching parameters were analysed; and through the establishment of numerical models reflecting the actual horizontal-well cavities morphology and characteristics, a long-term stability analysis of the horizontal well cavities was carried out, and in combination with the cavity morphology and characteristics, the distribution characteristics of the horizontal well cavity displacements and the plastic zones in the long-term operation were analysed.
Keywords:
natural gas storage
; bedded salt rock
; multi-stage horizontal cavity leaching
; nitrogen cushion
1. Introduction
Natural gas is a low-carbon, environmentally friendly and high-quality clean energy source, which plays a bridging role in the transition from high-carbon to zero-carbon energy sources and contributes positively to the realization of carbon neutrality [1,2]. In order to reduce environmental pollution, minimize carbon emissions and optimize the energy structure, China has issued a series of domestic policies and plans to support and promote the development of the natural gas industry, guide natural gas consumption in an orderly manner, and gradually cultivate natural gas as one of the main sources of energy in China’s modern clean energy system [3,4]. China’s natural gas consumption is expected to reach 600 billion m3 in 2035 and 670 billion m3 by 2050 [5,6]. However, China’s external dependence on natural gas is high. China imports about 141.3 billion m3 of natural gas in 2020, up to 43% of its total consumption [7,8]. At present, the existing reserve capacity and peaking capacity of China’s gas storage system cannot supply the market demand for natural gas. Therefore, the construction of underground gas storage systems should be massively expanded in order to safeguard national energy security and residents’ quality of life [9,10].
Compared with other natural gas storage media, salt rock is recognised as the best underground natural gas storage site due to its low permeability, high ductility, creep properties and damage self-healing [11,12]. Since the first salt cavern natural gas storage was built in the Soviet Union in 1959, as of the beginning of 2020, 108 salt cavern natural gas storage facilities have been put into operation in 14 countries worldwide, with a working gas capacity of 32.346 billion m3 [13,14]. In 2007, China’s first underground salt cavern natural gas storage was put into operation in Jintan, Jiangsu Province. Up to now, it has been operating safely for 16 years, playing a key role in natural gas peaking for the neighbouring areas [15,16]. In addition, Huai’an, Yun Ying and Pingdingshan are also constructing salt cavern underground natural gas storage facilities. These numbers will continue to increase as natural gas consumption increases. The construction of salt cavern natural gas storage is at its peak [17,18,19,20].
Unlike the thick salt layers and salt domes in Europe and the United States, the salt rocks in China are mainly lacustrine sedimentary rocks. The geological characteristics of such layered salt rocks are thin and numerous salt layers, salt layers often alternating with non-salt interbedded interlayers [21]. There are usually many difficulties in constructing vertical caverns in such formations if conventional single-well leaching methods are used. For example, the height of the salt cavity is limited by the mezzanine, and insoluble impurities accumulated at the bottom of the cavity crowd the cavity’s effective gas storage space [22,23]. In addition, there is also the potential for interlayers collapse and causing shearing damage to casing [24,25]. In order to extract layered salt rocks, Thoms and Gehle proposed a multi-step horizontal cavity leaching method in 1993 [26]. vertical well and a horizontal well are connected in a salt rock formation using directional drilling techniques. A water injection pipe is placed in the horizontal well and a drainage pipe is placed in the vertical well. As dissolution proceeds, the water injection port is gradually moved back in stages [27]. Eventually, a tunnel-type horizontal cavern is formed in the salt formation. The length of such horizontal salt caverns is usually greater than 300 m, and the salt production rate can be up to 700 m3/h, while vertical salt caverns are usually only 60-200 m3/h [27,28]. Obviously, the horizontal well cavity-making technique is more suitable for the construction project of stratified salt rock natural gas storages in China.
However, the large lateral span of horizontal well cavities make them more susceptible to collapses during construction and long-term operation. Berest has documented more than a dozen salt cavern collapses, most of which were due to excessive dissolution of the cavern roof [29,30]. Although sonar detectors are commonly used for monitoring and controlling cavity morphology, on the one hand, the complexity of operation interrupts the cavity building process when sonar detection is carried out, and on the other hand, sonar detectors with a maximum measurement range of about 120 m are not able to carry out measurements of the entire horizontal cavity [31]. Yang measured the velocity distribution of the fluid in the horizontal cavern using particle image velocimetry and divided it into five regions [32,33]. Liu investigated the stability of the horizontal cavern through indoor tests and numerical simulations [34]. It was found that there are three main problems with the multi-stage horizontal cavity leaching method: (1) The use of oil mats increases the project construction cost and the serious pollution of brine. (2) Oil pads cannot completely protect the top plate, and excessive dissolution of the top plate may lead to cavity instability. (3) The concentration of the discharged brine is low and does not meet the minimum standards for salinisation production.
To address the above problems, this paper proposes a nitrogen cushion multi-stage horizontal-well cavity leaching method for constructing salt cavern natural gas storage facilities, i.e., nitrogen is used to replace the oil body for protecting the cavity roof from dissolution during salt cavern construction [35]. Compared with the traditional oil cushion method, the nitrogen cushion method is more environmentally friendly, economical, and does not pollute the brine [36]. Single-well and dual-well cavity leaching methods under the nitrogen cushion method have been studied, but studies on the multi-step horizontal cavity leaching method under the nitrogen cushion are lacking [25,34,37]. In addition, this technique makes the lateral span of the cavity top plate larger [38]. Therefore, there is also a need to analyse the long-term stability of salt cavern natural gas storages.
The main research contents of this paper are: (1) to build a large-size salt rock horizontal well cavity-leaching test platform, and carry out similarity ratio calculation and testing parameters design; (2) to carry out horizontal-well cavity leaching tests with nitrogen cushion; (3) to analyse the expansion law of horizontal-well cavity morphology with the nitrogen cushion technology, and study the influence mechanism and way of the process parameters in the horizontal-well cavity leaching test with nitrogen cushion; and (4) to establish geological and numerical models reflecting the characteristics of the real cavity morphology to evaluate the stability of long-term operation of a gas storage facility.
2. Horizontal-well cavity leaching test
Through the simulation test of horizontal-well cavity leaching test with nitrogen cushion in the laboratory, the influence of the cavity leaching parameters on the cavity morphology, flow field and concentration field of horizontal-well cavity is studied, and the cavity leaching control technology is optimized. The test adopts the "dyeing method", with real-time video recording of the cavity, allowing visualisation of the expansion of the cavity at all stages.
2.1. Construction of leaching test platform
The similarity simulation test is based on the similarity theory, and the laboratory similarity simulation study is carried out for the test that cannot be carried out in the field by establishing a similarity model that can reflect certain characteristics of the field prototype. The field test of salt rock gas storage construction has the disadvantages of long time of cavity dissolution, high cost of test, and difficulty of cavity shape monitoring, etc. Therefore, we build a cavity leaching test platform based on the similarity theory and carry out the indoor similarity simulation test. The relationship between the field prototype and the test model is established through the "magnitude analysis method", and only the key parameters are selected for the similarity simulation in all the similarity tests in this chapter. For the downhole physical problem of brine extraction and cavity building, the key parameters affecting the water-soluble cavity building were selected based on the actual field engineering: geometry l, dissolution time t, density ρ of salt rock, dissolution rate ω, brine concentration in the cavity c, temperature T, and injection flow rate q. The magnitude of each parameter is shown in Table 1:
where there are four fundamental measures L, M, T, and Θ, with L being the length measure, T being the time measure, M being the mass measure, and Θ being the temperature measure. From the second theorem of similarity, this system has three similarity criteria. L, t, ω, T are selected as the basic physical quantities, and the other 3 physical quantities can be expressed by the basic physical quantities, and the physical quantity that needs to be determined in this test is the water injection flow rate, which can be expressed as:
From the principle of chi-squaredness of the equation, we have α = 3; β = -1; λ = 0; γ = 0, and the π term associated with q:
Ditto:
When the similarity ratio of parameters is expressed in terms of K, the geometric similarity ratio can be expressed as:
Where: lp denotes the prototype size and lm denotes the model size. The other parametric similarity ratios are similar, then the relationship between the parametric similarity ratios in equations (2) and (3) can be expressed as:
Sufficient conditions for the similarity of two systems: similarity criterion is constant and single-valued conditions are similar. So to ensure that two systems are similar, the following conditions must be met: (1) the geometrical conditions of the prototype and the model are similar; (2) the physical constants that are significant in the course of the study are proportional; (3) the initial conditions of the two systems are similar; and (4) during the period of the study the boundary conditions of the two systems are similar.
The determination of similarity ratio can be carried out according to the similarity criterion. In this test process, based on the geometric similarity ratio, the density similarity ratio can be obtained from the materials used in the test, and the cavity leaching time similarity ratio can be introduced from the geometric similarity ratio, the density similarity ratio of salt rock and the dissolution rate similarity ratio of salt rock, which in turn introduces the similarity ratios of other parameters, and the relevant similarity ratios in the cavity leaching test are shown in Table 2.
2.2. Experiments design
2.1.1. Test procedure
The test platform is shown in Figure 1. Dimensions of tubes and rubber hoses and connection methods are listed in Table 3. The steps of cavity leaching platform building and cavity leaching test are as follows:
- Select a salt brick with less impurities and no obvious cracks, clean the surface and absorb the moisture, select a more homogeneous cavity surface, and hand-polish the surface so that the surface flatness can meet the test requirements.
- Put the salt bricks flat, cavity surface upward, marking the slotting position with line in the cavity face. Grooving with drill bit diameter of 6mm drilling machine on slotting position of the cavity face, so that the slot width of the same, about 15mm, the upper slot slightly wider.After the completion of grooving, in the cavity surface of the channel around the uniform coverage of a thin layer of transparent epoxy resin adhesive, and covered with transparent plastic sheet for sealing paste, to prevent the subsequent filling of adhesive gel into the groove. Paste the thin plate need to control the dosage, to avoid the gel into the slot. After slotting and sealing, due to the fluidity of the adhesive, in order to avoid displacement of the adhesive before drying, it is necessary to keep the slotting cavity surface placed horizontally and wait for the epoxy resin adhesive to dry.
- Stand the salt-brick cavity-making surface upright, fix the side-by-side casing and gas pipe with volcanic mud, insert the pipe column into the slotted wellhead at the upper end, and subsequently cover the upper surface of the volcanic mud with a layer of AB glue to further ensure the sealing of the wellhead.
- Put the salt brick into the transparent acrylic box as a whole, the length, width and height of the internal dimensions of the acrylic is 1cm more than the length, width and height of the salt brick, and the thickness of the acrylic plate is 5mm. after putting the salt brick into the salt brick, adjust the position of the salt brick so that it is roughly in the centre, and make the cavity surface parallel to the acrylic box. Pour in the evenly mixed transparent epoxy resin glue from the top and fill the gap between the salt brick and the box to complete the overall sealing, and then paste the scale strip on both sides and below the front of the acrylic box. After the glue solidified, the salt brick is placed on a high load-bearing horizontal tabletop, and rubber hoses are used to connect the water tank, flowmeter, water injection tube in turn, and the end port of the brine tube is placed into a beaker, and the sealing of the connection port is carried out to test the airtightness. After opening the valve of the water tank and adjusting the flow meter to the test flow, the corresponding test can be carried out according to the test design parameters.
- Measure the concentration and volume of brine at the mouth of the brine discharge every 10 minutes after the test is opened, and record the shape of the cavity at this time with a video camera, and after the concentration is stable, the measurement interval is changed to 30 minutes; after the completion of a certain stage of the cavity-leaching stage is completed, adjust the water injection pipe, the drainage pipe and the position of the liquid level in accordance with the test programme, and then enter into the next cavity-leaching stage.

Table 3.
Tubes diameter in horizontal-well cavity leaching tests.
| Tubes | Inner diameter (mm) | Outer diameter (mm) | Wall thickness (mm) | Tube length (mm) | Notes |
|---|---|---|---|---|---|
| Casing | 5 | 6 | 0.5 | 60 | Fixed with volcanic clay and AB glue at the upper end of the slot on both sides for inserting the injection tube and drainage tube |
| Stainless tube - nitrogen injection pipe | 3.6 | 4 | 0.2 | 130 | Fixed with volcanic mud and AB glue on the upper end of the slot on both sides |
| Stainless Pipe-Drainage Pipe | 3.6 | 4 | 0.2 | 240 | Inserted into the casing at the right straight well end and wrapped with waterproof tape on the outer layer |
| Rubber Hose 1# | 3 | 5 | 1 | - | Water injection tube inserted into the casing in the inclined well, sealing tube at the upper end of the nitrogen injection pipe |
| Rubber Hose 2# | 4 | 6 | 1 | 6 | Wrapped around the outside of the casing to seal the wellhead on both sides |
| Rubber Hose 3# | 4 | 8 | 2 | - | Externally connected to the flow meter and indirectly connected to the tap |
| Rubber Hose 4# | 7 | 9 | 1 | - | Externally connected to the water tap and connected to the rubber hose 4# |
Figure 1.
Schematic diagram of test platform and pipe column connection.
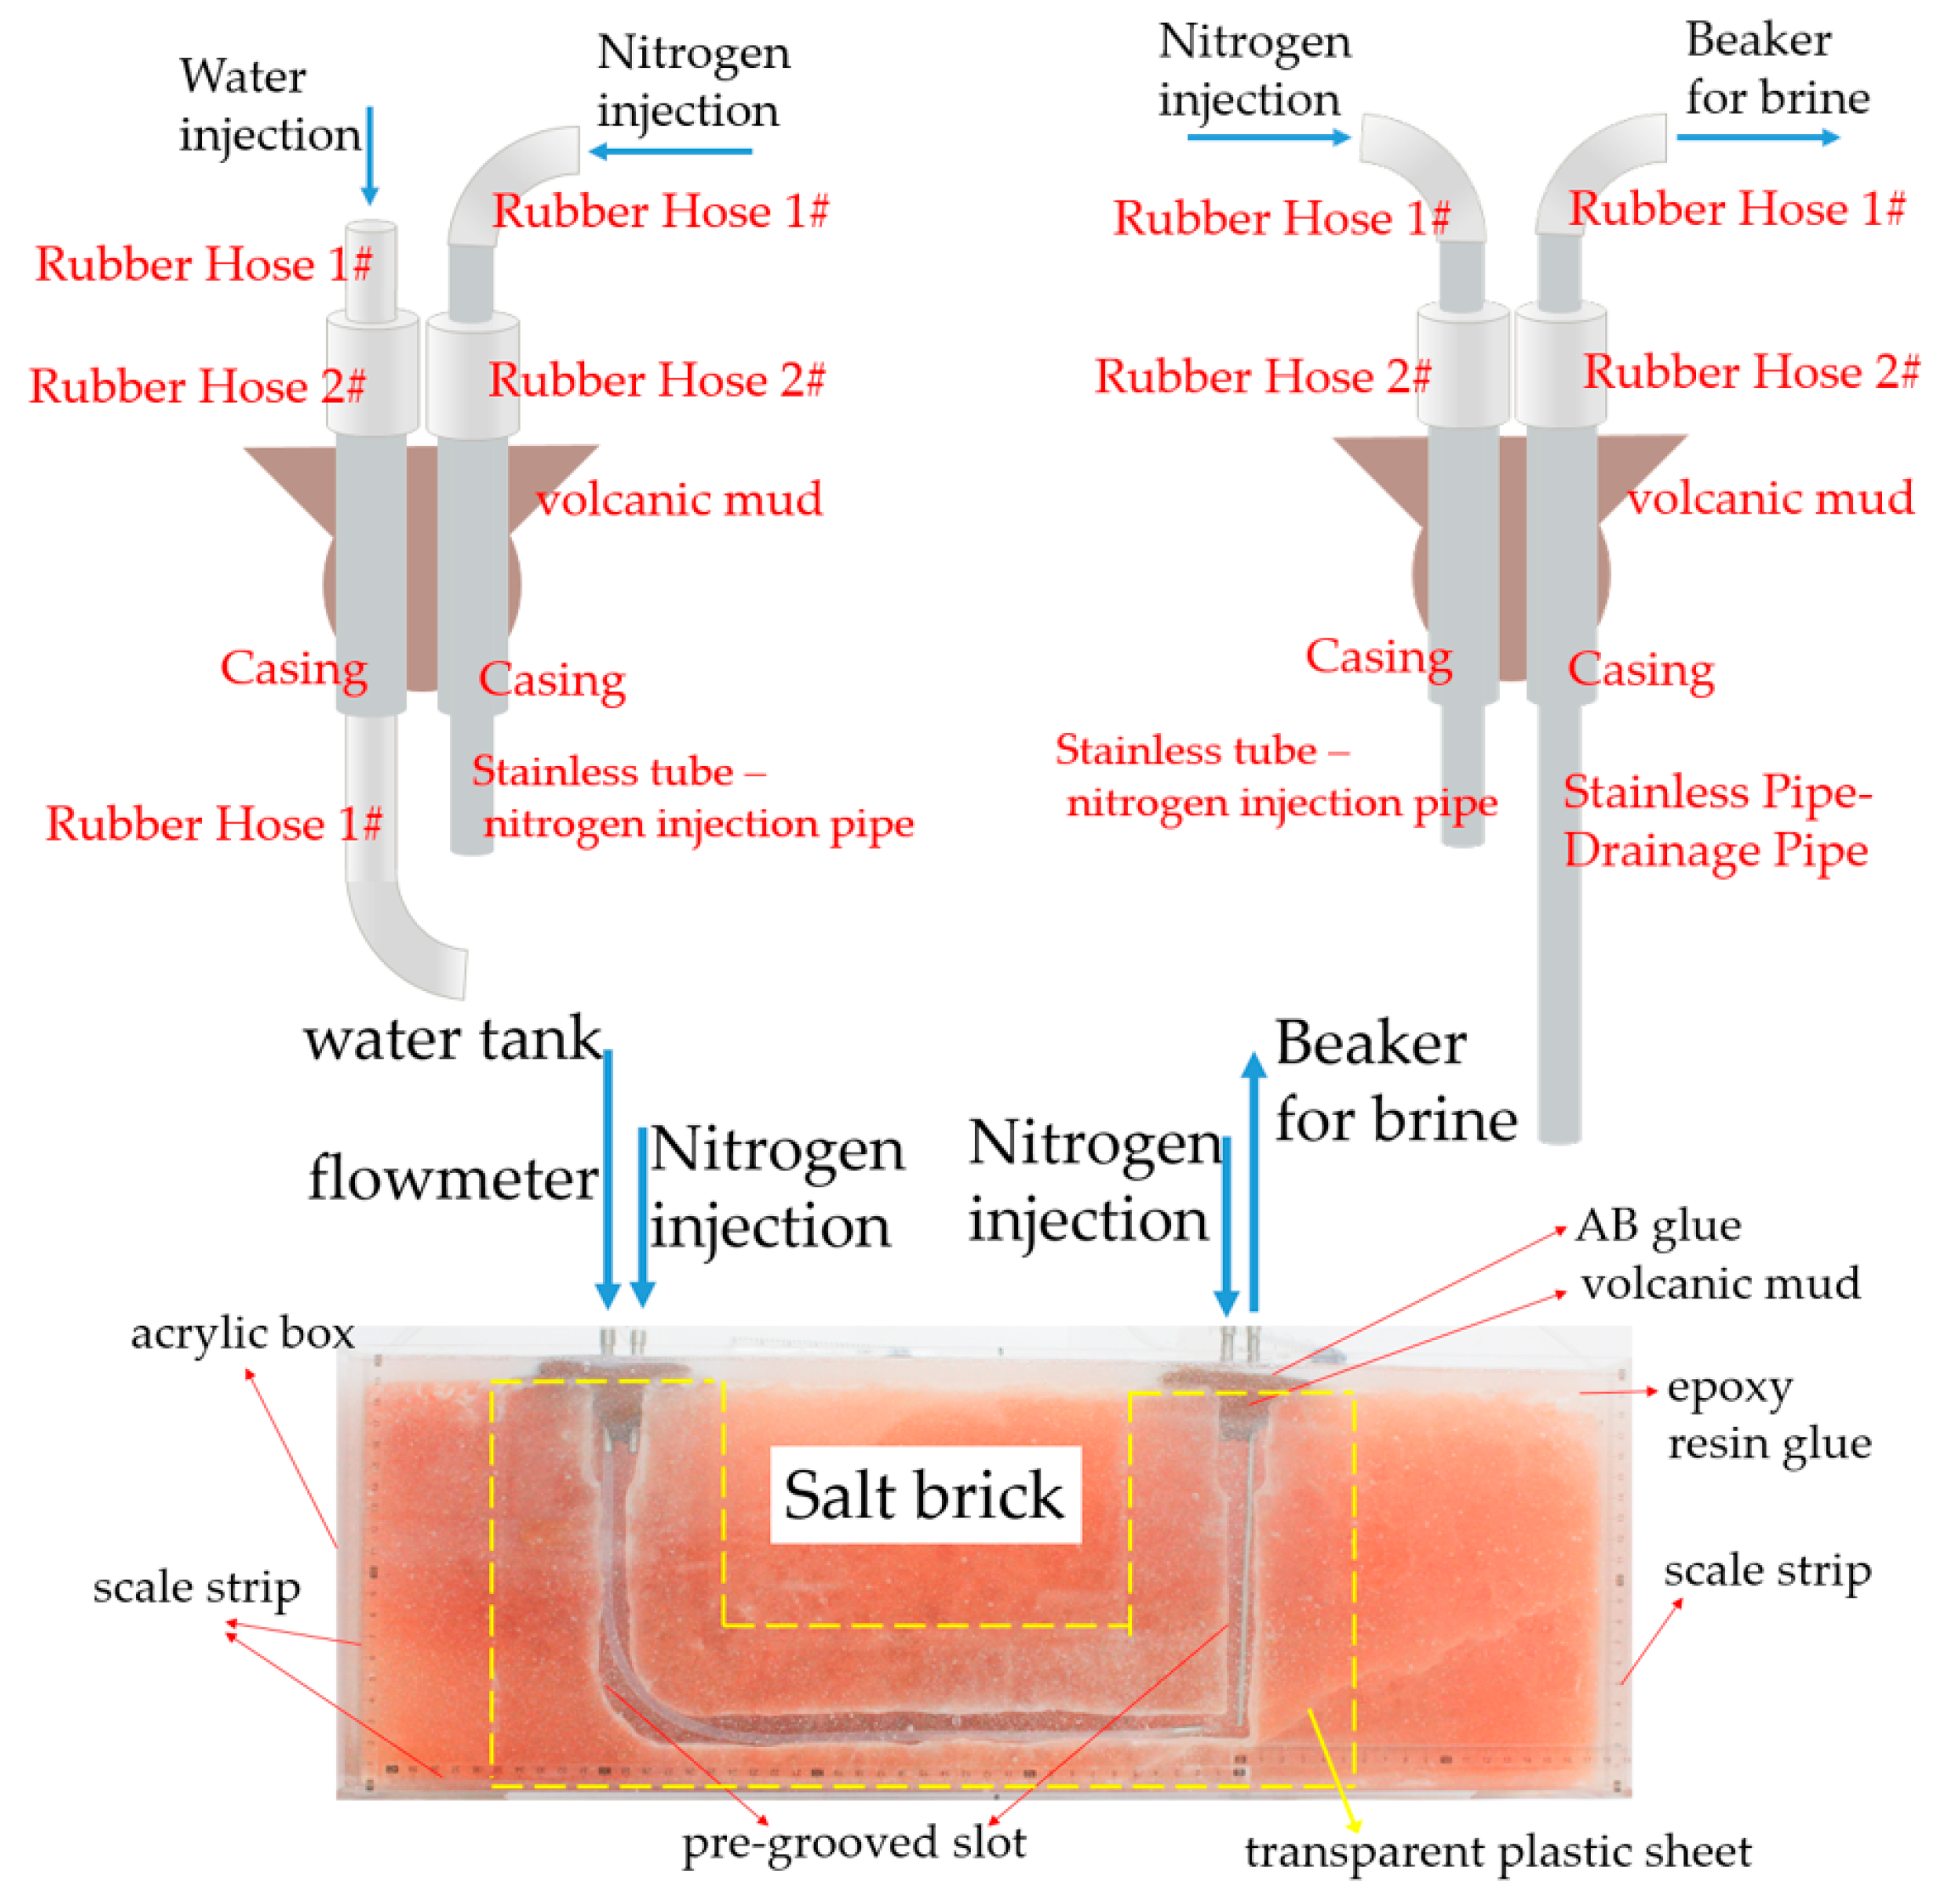
The dyed fresh water is injected into the cavity through the adjustment and control of flow meter to dissolve the salt rock. As both the acrylic box and epoxy resin adhesive are transparent, the expansion process of the horizontal-well cavity is clearly visible, and the position of the tubing column is clearly controllable, which satisfies the visibility requirement. As the cavity is well sealed, the brine in the cavity can be gradually discharged through the drainage pipe. The size of the salt bricks used in the test is selected according to the similarity ratio, and the spacing between the two wells for water injection and drainage can also be adjusted accordingly. The internal dimensions of the acrylic box length, width and height than the size of the salt bricks can be 1 cm. Considering the load-bearing nature of the acrylic box, in the salt brick is larger, the wall thickness of the acrylic box can be appropriately increased. Pipe column connection are consistent with this (Table 3), through the pipe diameter matching can ensure the sealing. Cavity flow control can be achieved through the selection of different ranges of flowmeter, the test process can be controlled and repeaTable
2.2.2. Horizontal-well cavity leaching test with nitrogen cushion in large size salt rock
As the wall of the cavity near the inlet of the inclined well widens faster, i.e., the straight wall side of the cavity dissolves faster in the early stage, and the inclined wall side of the cavity dissolves faster in the later stage, in order to dissolve a more symmetrical cavity on both sides of the cavity, the retreat needs to be carried out gradually in stages, and the salt rock is dissolved in sections. As the cavity volume increases gradually with the erosion, in order to improve the efficiency of the cavity, the flow rate should be increased accordingly after the increase of the cavity volume, and the flow rate also affects the dissolving rate of the cavity. In the case of gradual retreat of the water inlet position of the inclined well, and the flow rate is not fixed, how to adjust the position of the gas-liquid interface with the retreat control and flow rate control to create a regular and symmetrical cavity, and at the same time to ensure the efficiency of the horizontal-well cavity and improve the efficiency of brine extraction, is the main research content of the horizontal-well cavity leaching test with nitrogen cushion research in large size salt rock
The size of the salt bricks used in the test was 600 mm×200 mm×200 mm, the spacing between the straight and inclined wells was 300 mm, the depth of the starting point of the incline was 138 mm below the top surface, the size of the cavity surface was 600 mm×200 mm, and the bottom of the cavity was reserved for the protective layer with a thickness of 20 mm. The flow rate of 3 ml/min in the test corresponds to the flow rate of 15 m3/h in the field, and during the process of cavity leaching, the brine tube is always located at the bottom of the cavity, and the cavity is created in a reverse cycle, and the distance of each retreat of the inclined well is 30 mm. The dissolution of the lower part of the cavity is gradually controlled and promoted by injecting nitrogen to depress the liquid level layer by layer, and the water injection flow rate is adjusted and the well is withdrawn after observing the cavity morphology and expansion. Three groups of nitrogen bedding cavity formation tests were conducted in large-size salt rock, one of which was analysed as a representative group, and the stages of cavity dissolution process are shown in Table 4 below.
2.3. Analysis of test results
Extension of cavity morphology
The expansion process of horizontal-well cavity is shown in Figure 2. With the increase of flow rate and liquid level position, the cavity morphology gradually expands upward and to both sides, and the cavity expansion characteristics at each stage are affected by the flow rate, the wellhead position, and the liquid level position at the same time. In stage 1, affected by the stratification of brine concentration, both sides of the cavity at the highest level of brine dissolve the fastest, and the dissolution rate of the right side is significantly higher than that of the left side due to the fact that the inlet of the inclined well is closer to the right side. In the 3rd stage, affected by the position of the water inlet, the upward dissolution of the right horizontal trough is significantly faster than that of the left horizontal trough. In the later stage, dissolution occurred at the top of the right-side slot, so that the upper wall surface of the cavity was higher than the liquid surface, while dissolution continued above the left-side slot, and there was a close contact between the liquid surface and the cavity wall. In stage 4, the increase of well distance promotes the dissolution of the upper wall of the horizontal trough on the left side, but the dissolution rates on both sides of the horizontal trough are different, so the right side of the upper wall of the horizontal trough appears to be tilted at an angle with the left side. In stage 5, the dissolution surface of the upper wall of the horizontal trough is still high on the right side and low on the left side, but there is no obvious inclined surface on the left and right transition surfaces, showing a relatively gentle transition.
In stage 6, the liquid surface appears to be slightly elevated after the flow rate is increased, and the location of the liquid surface on the right side is still separated from the upper wall of the cavity by about 2 mm, and the whole liquid surface shows stratified segments. In stage 7, the left side of the liquid surface is still close to the left side of the horizontal upper wall, upward dissolution of a very small space to form dissolution bubbles, floating above the liquid surface and close to the wall of the cavity, and further upward dissolution, the formation of irregular upper dissolution surface. In stage 8, there is a slight elevation of the liquid level after the flow rate increase, and the left side still maintains a certain width (about 45 mm) of the brine liquid level in direct contact with the upper wall of the cavity. The right boundary of the brine on the right side of the straight well separates from the upper wall of the chamber, and the lateral extensions on the right side are wider at different brine heights. In stage 9, the liquid level is raised again and remains partly in direct contact with the upper wall of the cavity and partly separated. In the 10th stage, due to the two sides of the cavity are not connected resulting in different air pressure at both ends, the location of the inlet of the inclined well is close to the right side, so the liquid level on the right side rises faster, the pressure is higher and also dissolves faster, while the left side is farther away from the brine discharge pipe, and the space is generated in the dissolution, which results in the pressure decreasing, and therefore there is a larger pressure difference between the inclined well and the straight end of the well.
In the 11th stage, the central part of the cavity dissolves the widest, while the left and right edges of the cavity have no obvious transverse expansion, the whole liquid surface still presents the situation of high left and low right, but the central part of the cavity dissolves faster so that the central part of the cavity appears to have an obvious upward convex shape. In the 12th stage, the cavity in the middle of the convex gradually widened, and the transition surface with both sides gradually narrowed, the highest cavity wall and the widest part of the cavity at the morphology from the curved surface of the convex transition into isosceles trapezoid, and finally expanded to close to the rectangle. In the 13th stage, after the flow rate increases, the highest liquid surface in the cavity is still in close contact with the horizontal upper wall of the cavity, and the upward dissolution continues to occur, but the dissolution of the inner depth of the cavity is shallow. In stage 14, due to the rapid expansion of the highest liquid level, the transition region on both sides transitioned from a sloping surface to an upper wide and lower narrow pattern. In Stage 15, the highest part of the liquid level continued to expand laterally while dissolving upwards, and the gap between the lateral width of the highest part of the liquid level and the width of the widest part of the cavity gradually decreased as a result of the subsequent air connection at the ends of the two wells. In stage 16, the back of the salt bricks dissolved through in this stage because the inlet of the inclined well was kept at the position of 155 mm well spacing for a long time, i.e., the depth of internal dissolution had exceeded the thickness of the salt bricks. In stage 17, the liquid level gradually decreased during the dissolution process, the lower part of the trough dissolved wider, the top surface of the middle of the cavity dissolved fastest and deepest, while the left side of the slant well trough dissolved more slowly.
Brine discharge concentration
Figure 3.
Variation curves of brine discharge concentration during horizontal-well cavity leaching test with nitrogen cushion.
Figure 3.
Variation curves of brine discharge concentration during horizontal-well cavity leaching test with nitrogen cushion.
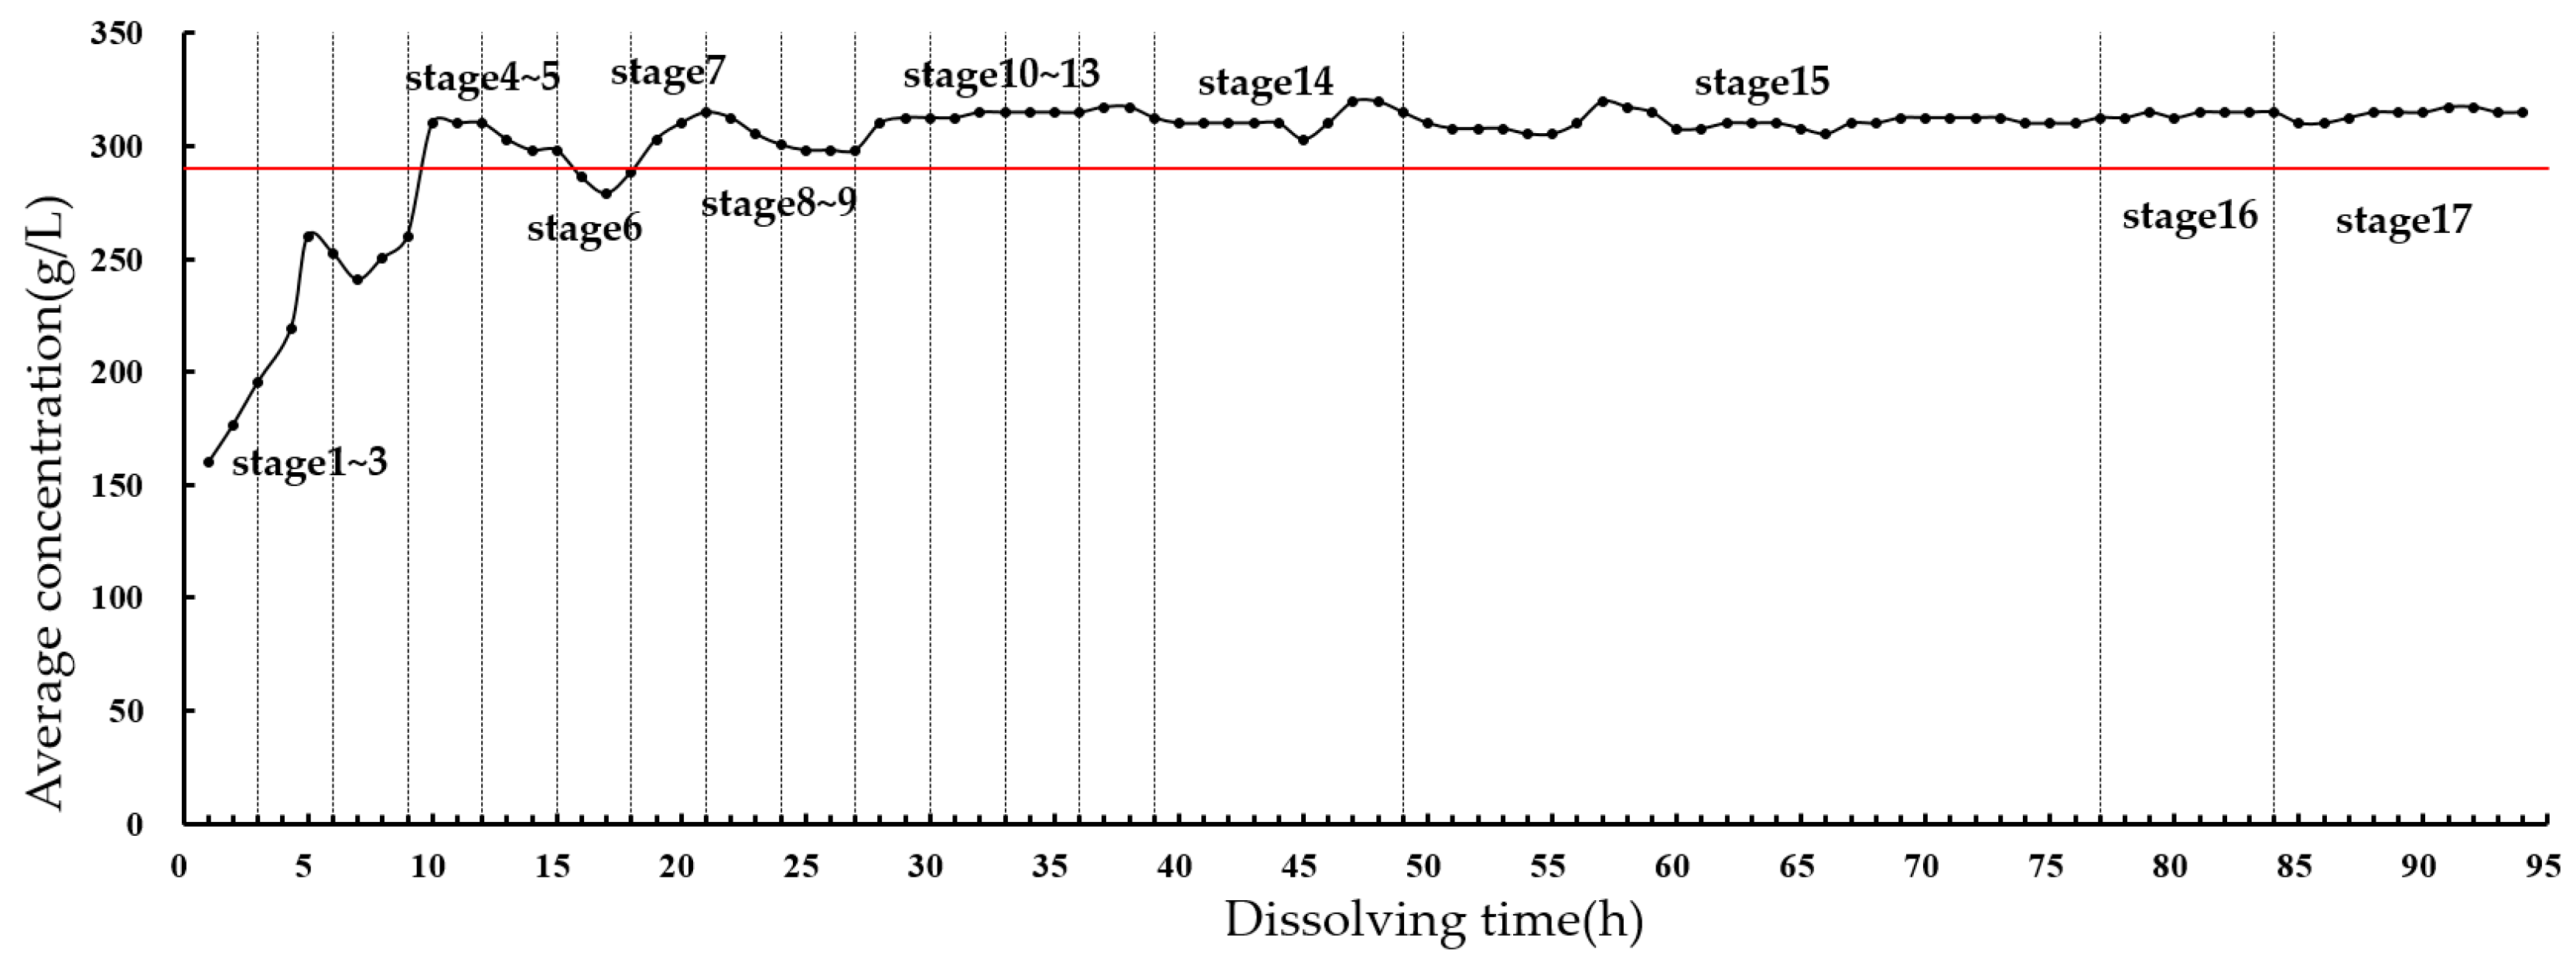
In stages 1 to 3, the concentration increased gradually with the dissolution, and the average brine concentration in stages 1 to 3 was 236.1 g/L. In stages 4 to 6, the brine concentration increased significantly after the well spacing was increased to 35 mm, and the average brine concentration in stages 4 to 6 was 294.1 g/L. In stages 7 to 9, the brine concentration first increased and then decreased with the flow rate after the well spacing was increased to 65 mm, and the average brine concentration in stages 7 to 9 was 302.9 g/L. In stage 10, after backing off the well to 95 mm, the brine concentration remained at a high level, and decreased with the flow rate at 125 mm. In stage 7-9, the average brine concentration was 302.9 g/L. In stage 10, after the well was backed off to a distance of 95 mm, the brine concentration remained at a high level and increased steadily in stage 11-13, where the well spacing was 125 mm, and the average brine concentration in stage 11-13 was 314.9 g/L. In stage 14, the flow rate was increased from 9 ml/min to 12 ml/min, but the brine concentration was minimally affected by the increase in flow rate, and the average brine concentration in stage 14 was 314.0 g/L. The spacing of wells in stages 15 to 17 was 155 mm, and the brine concentration was always maintained at a high level. In stage 17, after the flow rate was increased from 12 ml/min to 15 ml/min, the brine concentration was minimally affected and remained at a high level.
Comparison of 1~3, 4~6, 7~9 stages (well spacing of 5, 35, 65 mm, respectively, the flow rate is increased from 3 ml/min to 6 ml/min and 9 ml/min) can be seen, in the well spacing is small and the cavity volume is small, the brine discharge concentration by the flow rate increase is more affected, the smaller the cavity volume, the smaller the distance, the brine concentration by the flow rate of the larger, with the well spacing, the range of the influence of the clear water is gradually increased, the dissolution area and the amount of the dissolution per unit of time can be increased to make a significant increase in the brine discharge concentration. Comparison of the changes in brine concentration from stage 3 to stage 4, from stage 6 to stage 7, from stage 9 to stage 10, and from stage 10 to stage 11 shows that the incremental increase in brine concentration due to the increase in well spacing gradually becomes smaller. In stages 11 to 13, the well spacing was maintained at 125 mm, and the flow rate was gradually increased from 3 ml/min to 6 ml/min and 9 ml/min, but the brine concentration did not change significantly and did not decrease with the increase of flow rate. The changes of well spacing and flow rate on the brine discharge concentration were also gradually weakened with the increase of cavity volume. When the well spacing is 125 mm and 155 mm, the inlet is near the middle of the two wells, the clear water influence range is larger, the brine volume is also larger, and the brine discharge concentration is always kept at a more stable level in stage 11~17, which is weakly influenced by the well spacing and flow rate.
3. Numerical analysis
3.1. Numerical modelling
The numerical model of the horizontal-well salt cavern is established based on the regional conditions of Jiangsu Jintan salt mine, considering the actual depth and thickness of the salt layer, and the strata with dip angle in the range of 0°~5° are approximated as the horizontal strata. In order to restore the actual shape of the horizontal-well cavity as much as possible after the cavity leaching test, Soildworks was used to model the cavity according to the actual measured cavity data after scaling up. In order to get the actual morphology of the horizontal-well cavity leached in test, the acrylic box and the epoxy resin gel on the surface were disassembled after the cavity test, so that the cavity dissolved in the test was directly exposed, the paraffin was heated until the paraffin melted into wax water, the wax water was poured into the cavity and waited for the paraffin to solidify, and then the paraffin was disassembled, i.e., the cavity was modelled, and the paraffin models of horizontal-well cavities are shown in Figure 4. The three-dimensional dimensions of the paraffin model of the cavity were measured, and subsequently the cavity dimensions were enlarged according to the test similarity ratio, so that the actual geological numerical model of the cavity could be obtained, and thus numerical simulation calculations on horizontal-well cavity could be carried out.
Due to the existence of short edges, small gaps and irregular cuts in the actual model, the geometric model is too complex, which can easily lead to modelling and meshing failures. Therefore, the model was simplified by using geometric patching to combine some of the short edges, narrow cuts and irregular gaps with the surrounding areas. As a result, the final geometric model has some deviations from the actual model, and some surfaces are smoother and more continuous than the actual ones. After the model is built, Hypemesh is used for tetrahedral meshing, and in order to ensure the accuracy and efficiency of the calculation, the mesh division of the near-cavity region is more delicate. The model was converted into Ansys format after meshing, and then imported into Flac3D for the numerical simulation of the stability of the salt cavern gas storage in horizontal wells.
The length, width and height of the numerically calculated stratigraphic model are 800m, 400m and 600m respectively, the thickness of the upper mudstone layer is 210m, the thickness of the middle saltstone layer is 170m, the thickness of the lower mudstone layer is 220m, and the total height is 600 m. The depth of the model is 760m at the top surface, and the depth of the bottom surface is 1,360 m. After the model is built and the mesh is generated, the boundary conditions and the initial conditions are set. The origin of the overall model coordinate system is chosen at the centre of the cavity, the salt layer is parallel to the plane of XY coordinate system, the Z-axis direction is the depth direction of the stratum, the bottom surface of the model is constrained to be displaced in the Z-direction, and the four longitudinal surfaces are constrained by the direction of their corresponding normals. The equivalent uniform load of the overlying rock layer is applied on the top surface of the model, and the initial density is 2.3×10³kg/m3, and the hydrostatic pressure state is used to approximate the initial stress state, i.e., the three-directional principal stresses are equal, σX=σY=σZ, and according to the actual thickness of the stratum and the average density of the stratum, the average uniform load on the top surface of the model is 17.1MPa. The geological model of the horizontal salt cavern storage is as shown in Figure 5, and the boundary constraints and initial stress distribution are also shown in Figure 5.
The effect of creep is not considered in the hydrostatic calculation, and the Mohr-Coulomb model is used for all materials in the model, and the parameters of hydrostatic calculation for salt rock and mudstone are shown in Table 5.
Since the initial creep stage is short and has been stopped in the cavity leaching stage, the elastic strain and initial creep during the operation of the cavity are usually ignored, and only the steady state creep of salt rock is considered in the long-term stability calculation of horizontal-well cavity natural gas storage, and the commonly used Norton-Power model for the steady-state creep of salt rock is as follows:
where, is the steady creep rate, and are the maximum and the minimum principal stresses, is a unit stress, and are two creep parameters,=6×10⁻⁶MPa-3.5 and =3.5 for salt rock.
3.2. Analysis of simulation results
3.2.1. Displacement analysis of Horizontal-well cavity
The displacement values of the cavity perimeter recorded during the operation of the horizontal-well cavity created with nitrogen cushion include 1X~8X, 1Z~8Z, 4Y~5Y. The positions of these numbered points corresponding to the cavity model are shown in Figure 6.
The X-direction displacement of the cavity under different pressures is shown in Figure 7 below, and the maximum X-displacement of both sides of the cavity waist creeping for 50 years is shown in Figure 8. The maximum X-direction displacement is always located at the two sides of the cavity waist, with positive displacement on the left side and negative displacement on the right side, and the cavity waist shows a tendency to contract. The X-displacement gradually decreases from the cavity waist to the middle and inside of the cavity, and except for the cavity waist, the X-displacement in other positions of the model is close to zero. The X displacements on both sides of the cavity waist showed asymmetric distribution, when the pressure was 12MPa, the maximum value of the left side was 2.99485m, located in the lower left side of the cavity; the maximum value of the right side was 2.83489m, located in the middle and lower part of the right side of the cavity waist, the contraction of the left side of the cavity waist was slightly stronger than that of the right side and the difference between the two sides of the cavity waist displacements was gradually reduced with the increase of the internal pressure (Figure 8). displacement was 0.156458m and 0.16125m, respectively, and the left side was slightly larger than the right side. With the increase of internal pressure in the cavity, the displacement in X direction decreases gradually, and the distribution range of the larger value of the displacement decreases, the increase of internal pressure is conducive to reducing the displacement of the cavity waist on both sides.
The curves of 1X~8X displacements with internal pressure at each year point are plotted in Figure 9, with positive X displacements at points 1~6 located on the left side of the cavity and negative X displacements at points 7~8 located on the right side of the cavity. Displacement grows with the growth of creep duration, but the rate of displacement increase gradually decreases, and the effect of creep duration on displacement decreases with the increase of internal pressure. At the same time, the displacement decreases with the increase of the operating internal pressure, and the trend of decreasing displacement reaches the fastest when the creep time is 50 years. When the internal pressure is 12MPa, the displacement of each point of the X-displacement recording point 2X>8X>4X>3X>1X>6X>7X>5X, the maximum displacement is the 2 and 8 points on the left and right sides of the cavity waist, respectively, and the minimum displacement is the 5, 6, and 7 points located in the middle and the inner part of the cavity, and the displacements of the 1, 3, and 4 points located in the transition position are also in the middle, which is in agreement with the displacement distribution in Figure 7.
The Y-displacement cloud map of the cavity perimeter under different internal pressures is shown in Figure 10, and combined with Figure 11, it can be seen that the Y-direction displacement of the cavity perimeter under different internal pressures decreases with the increase of the internal pressure, the cavity perimeter shows a tendency of contraction and the cavity contraction is weakened with the increase of the pressure. The rate of increase of the Y displacement of the pericavity flattens out with the increase of the internal pressure. Due to the constraints of the model, the Y displacement mainly occurs at the inner side of the cavity, and the maximum displacement in the Y direction of the cavity is located at the narrowing depression of the cross-section on both sides of the interior of the cavity (near the point numbered 4), with the displacement of 4Y>5Y (Figure 10 is consistent with the results of Figure 11), which means that the flattened morphology of the cavity and the narrowing of the cross-section are the areas of the distribution of the larger values of Y displacements.
The Z-displacement of the cavity perimeter under different internal pressures is shown in Figure 12. The maximum Z-displacement is located at the centre of the upper and lower sides of the cavity, with negative values at the upper side and positive values at the lower side, and the upper and lower sides show a tendency to contract. The narrowing of the upper part of the cavity, i.e. the inhomogeneous transition zone, divides the cavity laterally, which in turn affects the displacement distribution. The maximum displacement at the upper end of the cavity (maximum subsidence) is distributed in the transverse zone in the central part of the cavity, and the Z-direction displacements in the cavity waist and the inner and outer edges of the cavity are all close to zero. The displacement curves of cavity top subsidence and cavity bottom expansion under each pressure are shown in Figure 13, and the displacement of the top roof is always higher than that of the cavity bottom.
The curves of Z-direction displacements at various points around the cavity under different internal pressures are shown in Figure 14. The displacement values 2Z, 4Z, 5Z, 7Z are positive, and the displacement values 1Z, 3Z, 6Z, 8Z are negative, the displacement increases with the growth of time length and decreases with the increase of internal pressure. The influence of operation lengths on displacements are reduced by the increase of internal pressure, and the amplitude of displacement values with time growth is extremely small at high internal pressures, and the curves are sparsely to densely packed from left to right. At an internal pressure of 12 MPa, the displacement at each point of the Z displacement recording point is 6Z >3Z >8Z >7Z >4Z >2Z >1Z >5Z, and the maximum displacement is located at point 6 across the top plate of the cavity, whereas the minimum displacement is found at points 1 and 5 at the cavity waist and the outer edge, which is in agreement with the displacement distribution in Figure 12.
3.2.2. Ralative volume loss of horizontal-well cavity
Cavity volume shrinkage under different operating pressures with the creep time change curve is shown in Figure 15, the cavity volume shrinkage under different internal pressures with the creep time increases, but the rate of increase with the increase in internal pressure gradually decreases, so the curve in Figure 15(b) from the left to the right is gradually dense and from the left to the right with the increase in the internal pressure and decrease. Figure 15(c) can be seen in the rate of change of the volume shrinkage rate gradually decreases and from bottom to top in order of increasing internal pressure, the volume contraction of the cavity with the increase in pressure and weakened, the cavity volume tends to stabilize, under internal pressure higher than 14MPa cavity volume shrinkage by the length of the operation is less affected.
3.2.3. Plastic zone volume of horizontal-well cavity
Volume versus creep time curves of the plastic zone around the cavity at different internal pressures is shown in Figure 16, the plastic zone volume of the cavity under different internal pressures are increased with the creep time, but the plastic zone volume under different internal pressures grows at different rates. The plastic zone volume is closer within small operating life, the effect of the internal pressure with the increase in the length of the creep significantly increased, the internal pressure of 12MPa creep 50 years of the horizontal cavity plastic zone volume as high as 324.76%, but the volume of the plastic zone after the increase in the internal pressure decreases sharply, the internal pressure of 14MPa and 16MPa creep 50 years of the plastic zone volume maximum value of 94.80% respectively, 17.22%, the internal pressure of 18MPa, 20MPa when the plastic zone volume also increased over time, but the magnitude of change is very small, the internal pressure of 18MPa and 20MPa when the maximum plastic zone volume of 2.47%, 0.14%.
The distribution of the plastic zone around the cavity under different operating pressures is shown in Figure 17, and the plastic zone at an internal pressure of 12 MPa has the largest distribution range, mainly in the vicinity of the cavity waist and the upper and lower top and bottom plates. When the internal pressure is 14 MPa, the plastic zone is mainly distributed near the cavity waist, and when the internal pressure is 18 or 20 MPa, the plastic zone is mainly distributed in the discontinuous transition position of the inner cross-section of the cavity waist, and the distribution range of the plastic zone is very small. With the increase of the internal pressure, the distribution range of the plastic zone around the cavity is significantly reduced, and the increase of the operating pressure of the cavity is conducive to reducing the plastic damage and improving the stability of the cavity.
4. Discussion
In the leaching process of solute, water injection has a certain direction, so the influence of injected fresh water on the concentration distribution has a large inhomogeneity, and the local solute transfer effect is obvious [39]. Since the height of the horizontal-well cavity is much smaller than the length, asymmetric cavity shapes on both sides of the horizontal-well cavity tend to occur during dissolution [40]. The uneven expansion of the upper wall of the cavity also exists, which makes it more difficult to carry out the later sonar cavity measuring work. Influenced by the asymmetric shape of the horizontal-well cavity, the control of nitrogen cushion is also different from the nitrogen cushion control of single-well cavity construction, and the amount of nitrogen injection and nitrogen injection time also need to be controlled in stages. In the early stage of a small horizontal-well cavity and the later stage of a large horizontal-well cavity, the injection port located at different positions have different effects on the concentration distribution in each area of the horizontal-well cavity. At a fixed flow rate, the relative influence of freshwater injection (relative to the entire cavity volume) decreases with increasing cavity volume, while the gravity impact of concentration gradient in the cavity increases [41]. Despite the many differences between horizontal well water-solution mining and single-well water-solution mining, the key to controlling the shape of the cavity is still largely influenced by the concentration distribution [42], i.e., the effect of concentration on dissolution. Although the effective volume of horizontal-well cavity natural gas storage is larger, the cavity control of horizontal-well cavity involves more factors [43,44], thus the economic and construction efficiency, and stability of horizontal-well natural gas storages at later stages also need to be considered in the design of the cavity process parameters [45,46].
In the study of the construction of horizontal-well cavity natural gas storages, the dissolution rate of the salt wall at different positions (different distances and angles) relative to the horizontal injection port (in addition, as the injection port retreats gradually, and the leaching of horizontal-well cavity, the relative position of the salt wall and the injection port changes at the same time), the range and pattern of influence on dissolution of the position of the injection port and the flow rate of the injection on the horizontal-well cavity in different phases (cavity in different volume sizes and different positions of the cavity), the concentration stratification law of brine in the horizontal-well cavity, and the influence law of the position of water inlet and outlet on solute transport are all key points of the experimental study. The design of horizontal-well cavity construction that is compatible with geological conditions, development and practicality verification of a horizontal-well cavity leaching simulation software based on horizontal-well cavity dissolution laws, the cavity measurement technology of large span horizontal-well cavity, and the repair and reconstruction of deformed cavities are all difficult engineering problems that need to be explored urgently.
5. Conclusions
Conclusions of studies in the construction and stability of horizontal-well cavity natural gas storage in this paper are as follows: (1) The distance between the inner wall of the cavity and the injection port not only affects the flow field and convective diffusion rate, but also further affects the distribution of the con-centration field, so that the area close to the injection port dissolves more quickly. In the smaller well distance and smaller cavity volume, the brine discharge concentration is more affected by the flow rate, and the smaller the cavity volume and the smaller the well distance, the more the brine discharge concentration is affected by the flow rate. (2) The process of dissolution, the increase of the cavity volume, the flow rate, and the height of the liquid level produce a dynamic coupling effect, and due to the large lateral span of the horizontal wells, the liquid level produces the phenomenon of not being horizontal and the phenomenon of not connecting the two wells’ air pressure. Dissolution and the increase of the cavity, the evolution of air pressure, the location of the water inlet and the location of the brine discharge pipe will have an impact on the movement and distribution of the liquid surface location. The location of the liquid surface is also the location of the lowest brine con-centration, and thus the lateral and upper dissolution are greatly affected by the loca-tion of the liquid surface. (3) Due to the horizontal span of the cavity of the horizontal well, the force difference between the centre of the cavity and the outer edge of the cavity is large, the supporting effect of high air pressure at different locations in the cavity also has a different degree of influence, high air pressure in the reduction of the overall displacement value, volume contraction and plastic zone at the same time, but also has a certain impact on the uneven transition zone of the cavity cross-section, therefore, the stability control of the cavity should be considered in the early stage of the cavity morphology control and the later control of the pressure adaption. In order to guarantee the stability of the natural gas horizontal-well cavity storage in long-term operation, the internal pressure in the cavity is recommended to be higher than 14 MPa. The irregular transition and narrowing of the cavity section are the weak areas of force, which should be avoided as much as possible in the cavity construction.
Author Contributions
Con-ceptualization, methodology, writing—original draft preparation, Dan Lu; formal analysis, funding acquisition, Jie Chen; writing—review and editing, Fei Wu; validation, funding acquisition, Deyi Jiang; software, project administration, Wei Liu; data curation, Bowen Ding; investigation, Xinyu Luo; visualization, funding acquisition, Yanfei Kang; resources, funding acquisition, Yi He.
Funding
This research was funded by the National Natural Science Foundation of China (Grant Numbers 52022014, 51834003, 52204088) and the China Postdoctoral Science Foundation (Grant Numbers 2023M730427).
Conflicts of Interest
The authors declare no conflict of interest.
References
- Ahmed DS, El-Hiti GA, Yousif E, Hameed AS, Abdalla M. New Eco-Friendly Phosphorus Organic Polymers as Gas Storage Media. Polymers (Basel) 2017, 9, 336. [CrossRef] [PubMed]
- Hadi AG, Jawad K, Yousif E, El-Hiti GA, Alotaibi MH, Ahmed DS. Synthesis of Telmisartan Organotin(IV) Complexes and their use as Carbon Dioxide Capture Media. Molecules 2019, 24, 1631. [CrossRef] [PubMed]
- Xie M, Min J, Fang X, Sun C, Zhang Z. Policy selection based on China’s natural gas security evaluation and comparison. ENERGY 2022, 247, 123460. [CrossRef]
- Li J-M, Dong X-C, Jiang Q-Z, Dong K-Y. Urban natural gas demand and factors analysis in China: Perspectives of price and income elasticities. Pet Sci 2022, 19, 429–40. [CrossRef]
- Capros P, Zazias G, Evangelopoulou S, Kannavou M, Fotiou T, Siskos P, et al. Energy-system modelling of the EU strategy towards climate-neutrality. ENERGY POLICY 2019, 134, 110960. [CrossRef]
- Rodrigues R, Pietzcker R, Fragkos P, Price J, McDowall W, Siskos P, et al. Narrative-driven alternative roads to achieve mid-century CO2 net neutrality in Europe. ENERGY 2022, 239, 121908. [CrossRef]
- Yang C, Wang T, Li Y, Yang H, Li J, Qu D, et al. Feasibility analysis of using abandoned salt caverns for large-scale underground energy storage in China. Appl Energy 2015, 137, 467–81. [CrossRef]
- Zhu K, Zhao Y, Xu X, Hao L. Measuring the natural gas supply security performance of China’s natural gas suppliers: A comprehensive framework using FAHP-Entropy-PROOTHEE method. J Clean Prod 2022, 345, 131093. [CrossRef]
- Wang T, Yan X, Yang H, Yang X, Jiang T, Zhao S. A new shape design method of salt cavern used as underground gas storage. Appl Energy 2013, 104, 50–61. [CrossRef]
- Yang C, Wang T. Advance in deep underground energy storage. Chinese Journal of Rock Mechanics and Engineering 2022, 41, 1729–1759.
- Li Z, Yang Z, Fan J, Fourmeau M, Jiang D, Nelias D. Fatigue Mechanical Properties of Salt Rocks Under High Stress Plateaus: The Interaction Between Creep and Fatigue. Rock Mech Rock Eng 2022, 55, 6627–42. [CrossRef]
- Malyukov, V.P., Shepilev, A.A. Innovative Technologies for Construction of Horizontal and Double-Deck Underground Tanks in Rock Salt. In: Chaplina, T. (eds) Processes in GeoMedia—Volume IV. Springer Geology. Springer, Cham. 2022.
- Zhang B, Lv B, Wu Y, et al. Development and Trend of Salt-Cavern Gas Storage in Domestic and Abroad. China Well and Rock Salt 2021, 52, 21–24.
- Lux K-H. Design of salt caverns for the storage of natural gas, crude oil and compressed air: Geomechanical aspects of construction, operation and abandonment. Geol Soc Lond Spec Publ 2009, 313, 93–128. [CrossRef]
- Chen Y, Wei J. Physical model test of Jintan underground gas storage cavern group. Geomech Eng 2022, 30, 45–9.
- He T, Wang T, Wang D, Xie D, Dong Z, Zhang H, et al. Integrity analysis of wellbores in the bedded salt cavern for energy storage. ENERGY 2023, 263, 125841. [CrossRef]
- Ma H. A Preliminary Study on the Development Current Situation of Salt Cavern Gas Storage in Domestic. China Well and Rock Salt 2021, 52, 12–15.
- Williams JDO, Williamson JP, Parkes D, Evans DJ, Kirk KL, Sunny N, et al. Does the United Kingdom have sufficient geological storage capacity to support a hydrogen economy? Estimating the salt cavern storage potential of bedded halite formations. J Energy Storage 2022, 53, 105109. [CrossRef]
- Lankof L, Urbańczyk K, Tarkowski R. Assessment of the potential for underground hydrogen storage in salt domes. Renew Sustain Energy Rev 2022, 160, 112309. [CrossRef]
- Korzeniowski W, Poborska-Młynarska K, Skrzypkowski K, Zagórski K, Chromik M. Cutting Niches in Rock Salt by Means of a High-Pressure Water Jet in Order to Accelerate the Leaching of Storage Caverns for Hydrogen or Hydrocarbons. Energies 2020, 13, 1911. [CrossRef]
- Shi X, Chen Q, Ma H, Li Y, Wang T, Zhang C. Geomechanical investigation for abandoned salt caverns used for solid waste disposal. Bull Eng Geol Environ 2021, 80, 1205–18. [CrossRef]
- Wang J, Wang N, Xu K, Xia. J. Calculation method for effective cavity volume of salt cavern gas storage. Oil & Gas Storage and Transportation, 2021.
- Yu P, An optimization mass-balance method for calculating the leaching volume of salt-cavern underground gas storage. Petrochemical Industry Application 2020, 39, 4.
- Jiang D, Wang Y, Liu W, Li L, Qiao W, Chen J, et al. Construction simulation of large-spacing-two-well salt cavern with gas cushion and stability evaluation of cavern for gas storage. J Energy Storage 2022, 48, 103932. [CrossRef]
- Jiang D, Li Z, Liu W, Ban F, Chen J, Wang Y, et al. Construction simulating and controlling of the two-well-vertical(TWV) salt caverns with gas cushion. J Nat Gas Sci Eng 2021, 96, 104291. [CrossRef]
- Thoms R, Gehle R. Feasibility of controlled solution mining from horizontal wells. Solut Min Res Inst 1993.
- Li J, Shi X, Zhang S. Construction modeling and parameter optimization of multi-step horizontal energy storage salt caverns. Energy 2020, 203, 117840. [CrossRef]
- Liu W, Zhang Z, Fan J, Jiang D, Daemen JJK. Research on the Stability and Treatments of Natural Gas Storage Caverns With Different Shapes in Bedded Salt Rocks. IEEE Access 2020, 8, 18995–9007. [CrossRef]
- Bérest, P. Cases, causes and classifications of craters above salt caverns. Int J Rock Mech Min Sci 2017, 100, 318–29. [Google Scholar] [CrossRef]
- Tongtao W, Chunhe Y, Jiasong C, et al. Geomechanical investigation of roof failure of China’s first gas storage salt cavern[J]. Engineering Geology 2018, S001379521830200X.
- Li J, Yang C, Shi X, Xu W, Li Y, Daemen JJK. Construction modeling and shape prediction of horizontal salt caverns for gas/oil storage in bedded salt. J Pet Sci Eng 2020, 190, 107058. [CrossRef]
- Yang J, Li H, Yang C, Li Y, Wang T, Shi X, et al. Physical simulation of flow field and construction process of horizontal salt cavern for natural gas storage. J Nat Gas Sci Eng 2020, 82, 103527. [CrossRef]
- Yang J, Weil M, Gu F. Environmental-economic analysis of the secondary use of electric vehicle batteries in the load shifting of communication base stations: A case study in China. J Energy Storage 2022, 55, 105823. [CrossRef]
- Li D, Liu W, Jiang D, Chen J, Fan J, Qiao W. Quantitative investigation on the stability of salt cavity gas storage with multiple interlayers above the cavity roof. J Energy Storage 2021, 44, 103298. [CrossRef]
- Cui K. Roof with Nitrogen Protection Technology of Underground Gas Storage During the Construction of Cavern Dissolution. China Well and Rock Salt 2016, 47, 15-16+23.
- Wang J, An G, Wang W, Jia J, Liu C, Miao S, et al. Solution-mining-under-nitrogen technology for salt-cavern gas storage and field test. Oil & Gas Storage and Transportation 2021, 40, 802–808.
- Li D, Liu W, Li X, Tang H, Xu G, Jiang D, et al. Physical simulation and feasibility evaluation for construction of salt cavern energy storage with recycled light brine under gas cushion. J Energy Storage 2022, 55, 105643. [CrossRef]
- Zhang G, Zhang H, Liu Y, Wang T, Wang Z. Surrounding rock stability of horizontal cavern reconstructed for gas storage. J ENERGY STORAGE 2023, 59, 106534. [CrossRef]
- Malyukov, V. Studies of the Construction of Horizontal Underground Workings-Tanks Under the Impact of Solution on Rock Salt. PMMEEP 2022: Physical and Mathematical Modeling of Earth and Environment Processes—2022, pp 387–393.
- Wan J. Influence of tubing/oil-blanket lifting on construction and geometries of two-well-horizontal salt caverns. Tunnelling and Underground Space Technology 2020, 108.
- Saberian A. A preliminary model horizontal well leaching, SMRI Paper, San Antonio, 1995.
- Wang J, Wang Z, Zeng Q, et al. Simulation of Flow Field of Solution Mining Salt Cavities for Underground Gas Storage. Journal of Energy Resources Technology 2022, 145, 1–19.
- Zhang G, Zhang H, et al. Surrounding rock stability of horizontal cavern reconstructed for gas storage. Journal of Energy Storage 2023, 59, 106534.
- Xing, W., Zhao, J., Hou, Z. et al. Horizontal natural gas caverns in thin-bedded rock salt formations. Environ Earth Sci 2015, 73, 6973–6985. [CrossRef]
- Li, Qingdong & Ning, Zexu & Liu, Jia & Xu, Wenjie & Zhan, Liangtong & Liu, Jiqin & Chen, Yunmin & Shi, Xilin & Chen, Xiangsheng & Li, Jinlong. Stability and economic evaluation of multi-step horizontal salt caverns with different step distances in bedded salt formations. Journal of Energy Storage 2023, 57, 106192.
- Wang J, Wang X, Long-term stability analysis and evaluation of horizontal salt cavern gas storage. Journal of Energy Storage 2023, 66, 107413. [CrossRef]
Figure 2.
Cavity expansion diagram for horizontal-well cavity leaching test with nitrogen cushion.

Figure 4.
Paraffin models of horizontal-well cavity created with nitrogen cushion.
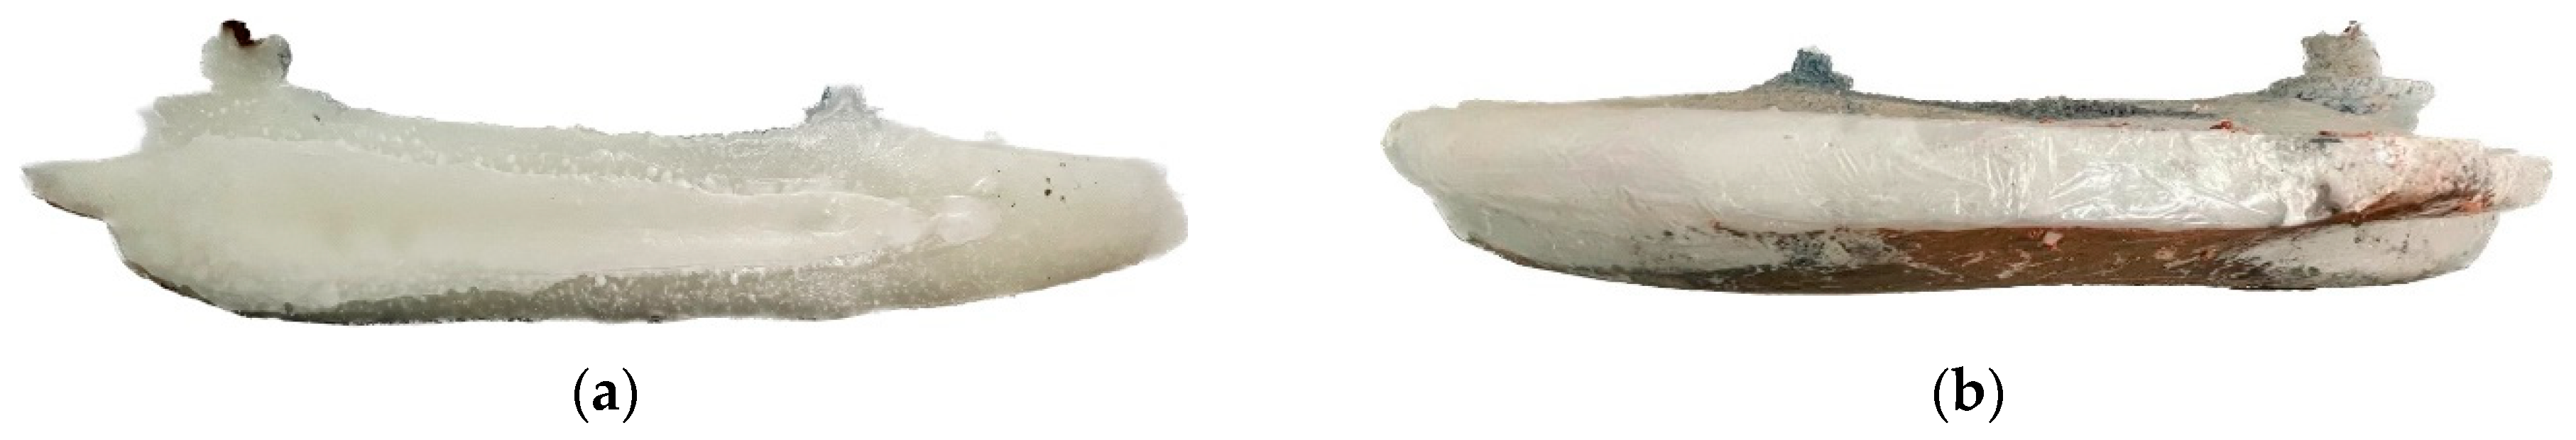
Figure 5.
Geological model of horizontal-well cavity natural gas storage.
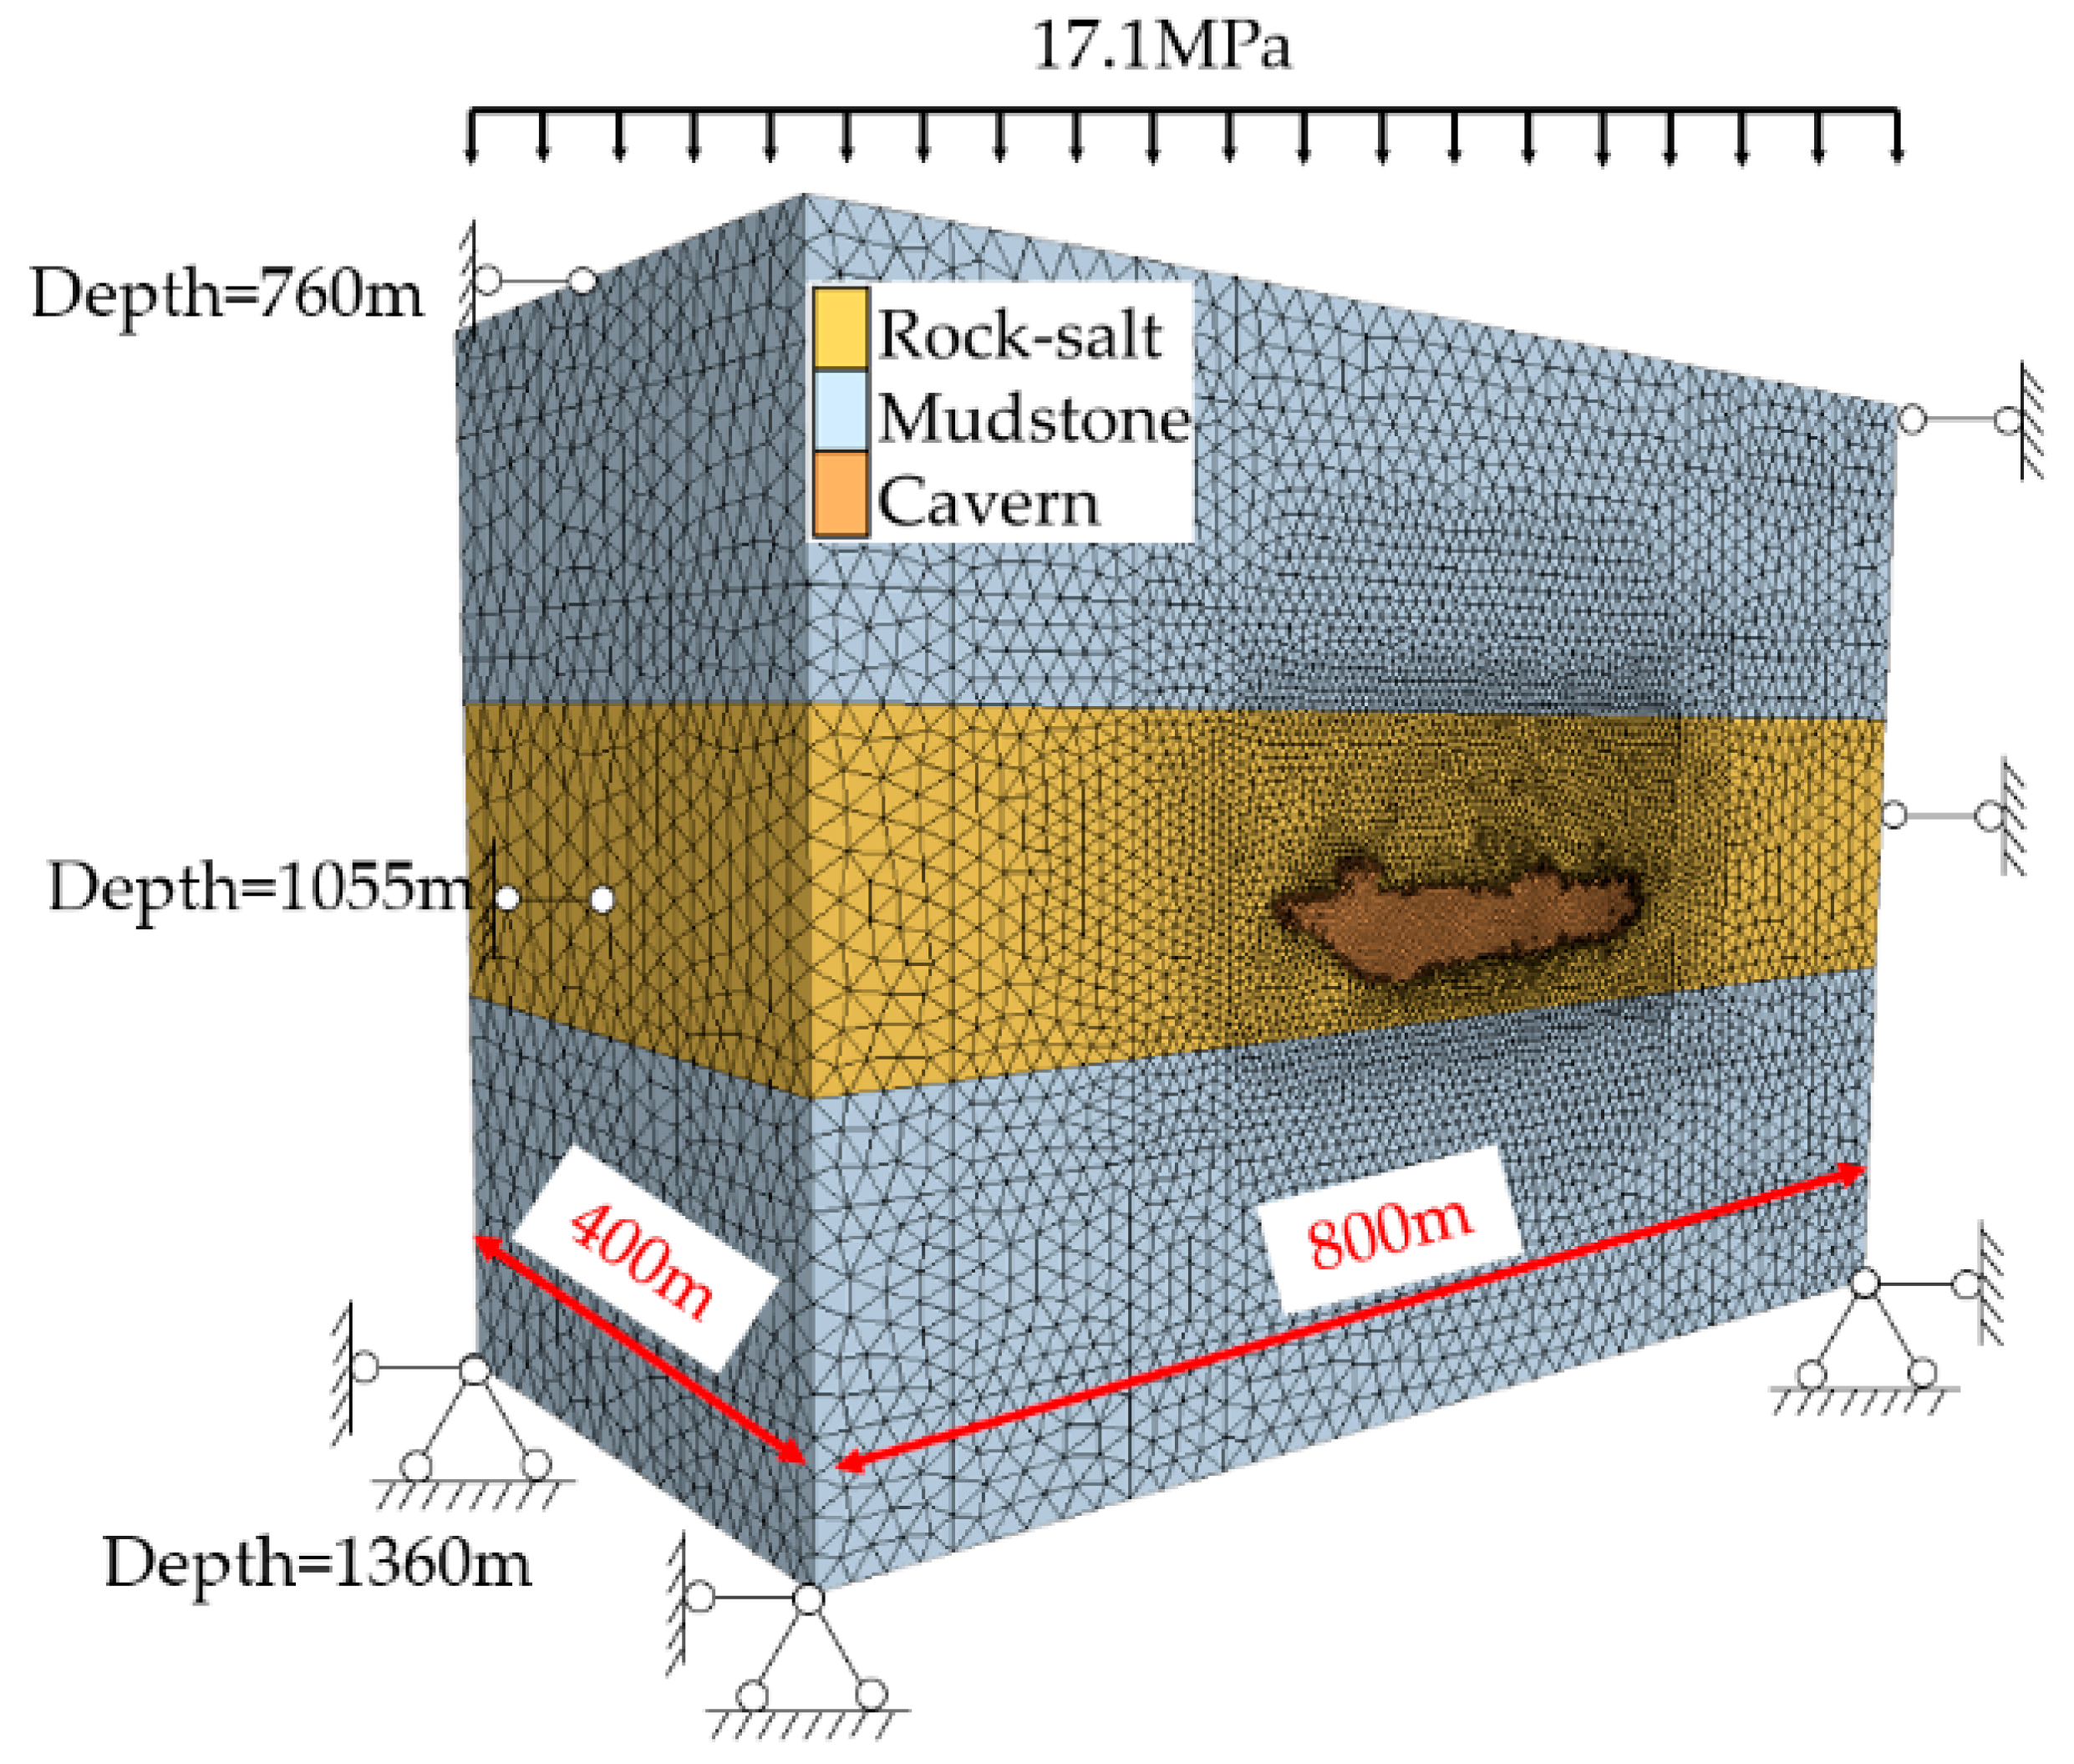
Figure 6.
Location of displacement recording points for horizontal well created with nitrogen cushion cavities, (a)front view; (b)rear view, (c)top view).
Figure 6.
Location of displacement recording points for horizontal well created with nitrogen cushion cavities, (a)front view; (b)rear view, (c)top view).
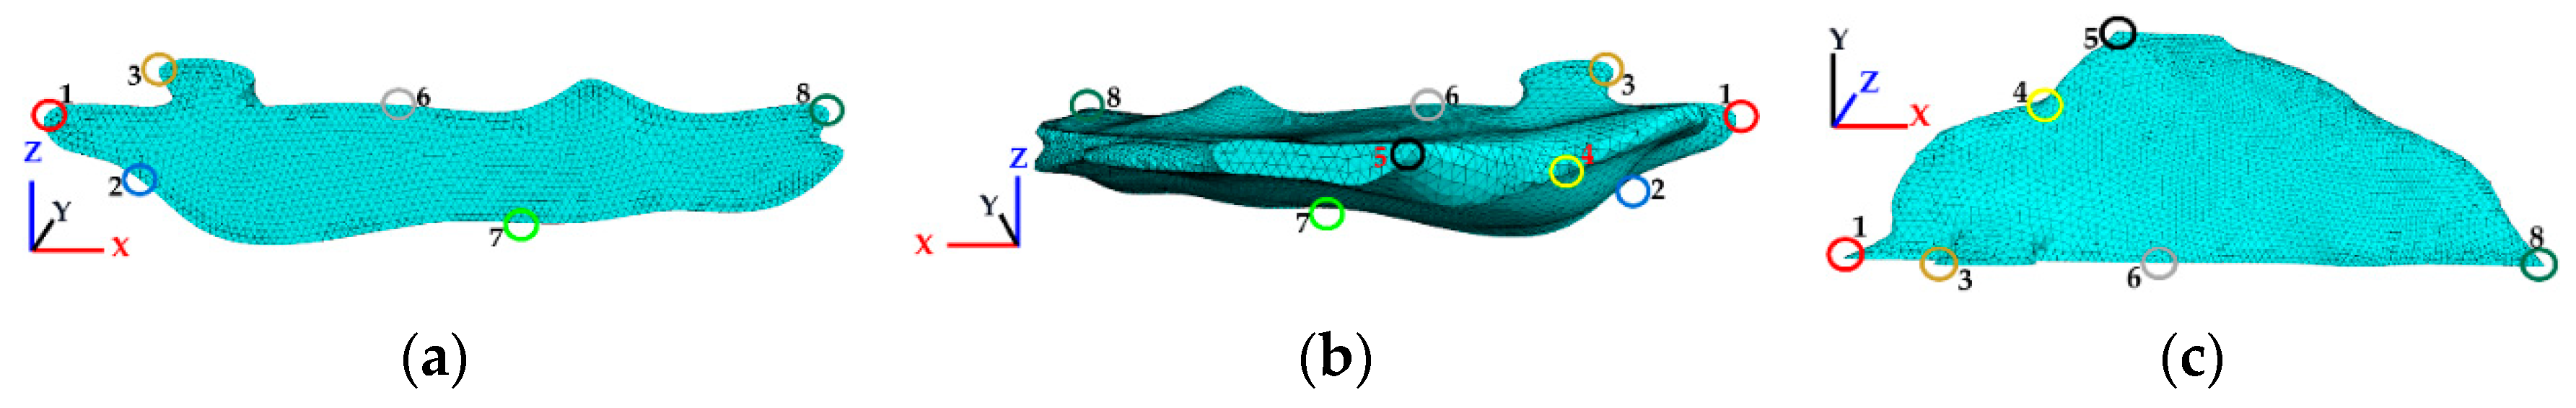
Figure 7.
Cloud map of X-direction displacement around the perimeter of the horizontal-well cavity created with nitrogen cushion (50 years), (a) p=12MPa; (b) p=14MPa; (c) p=16MPa; (d) p=18MPa; (e) p=20MPa.
Figure 7.
Cloud map of X-direction displacement around the perimeter of the horizontal-well cavity created with nitrogen cushion (50 years), (a) p=12MPa; (b) p=14MPa; (c) p=16MPa; (d) p=18MPa; (e) p=20MPa.
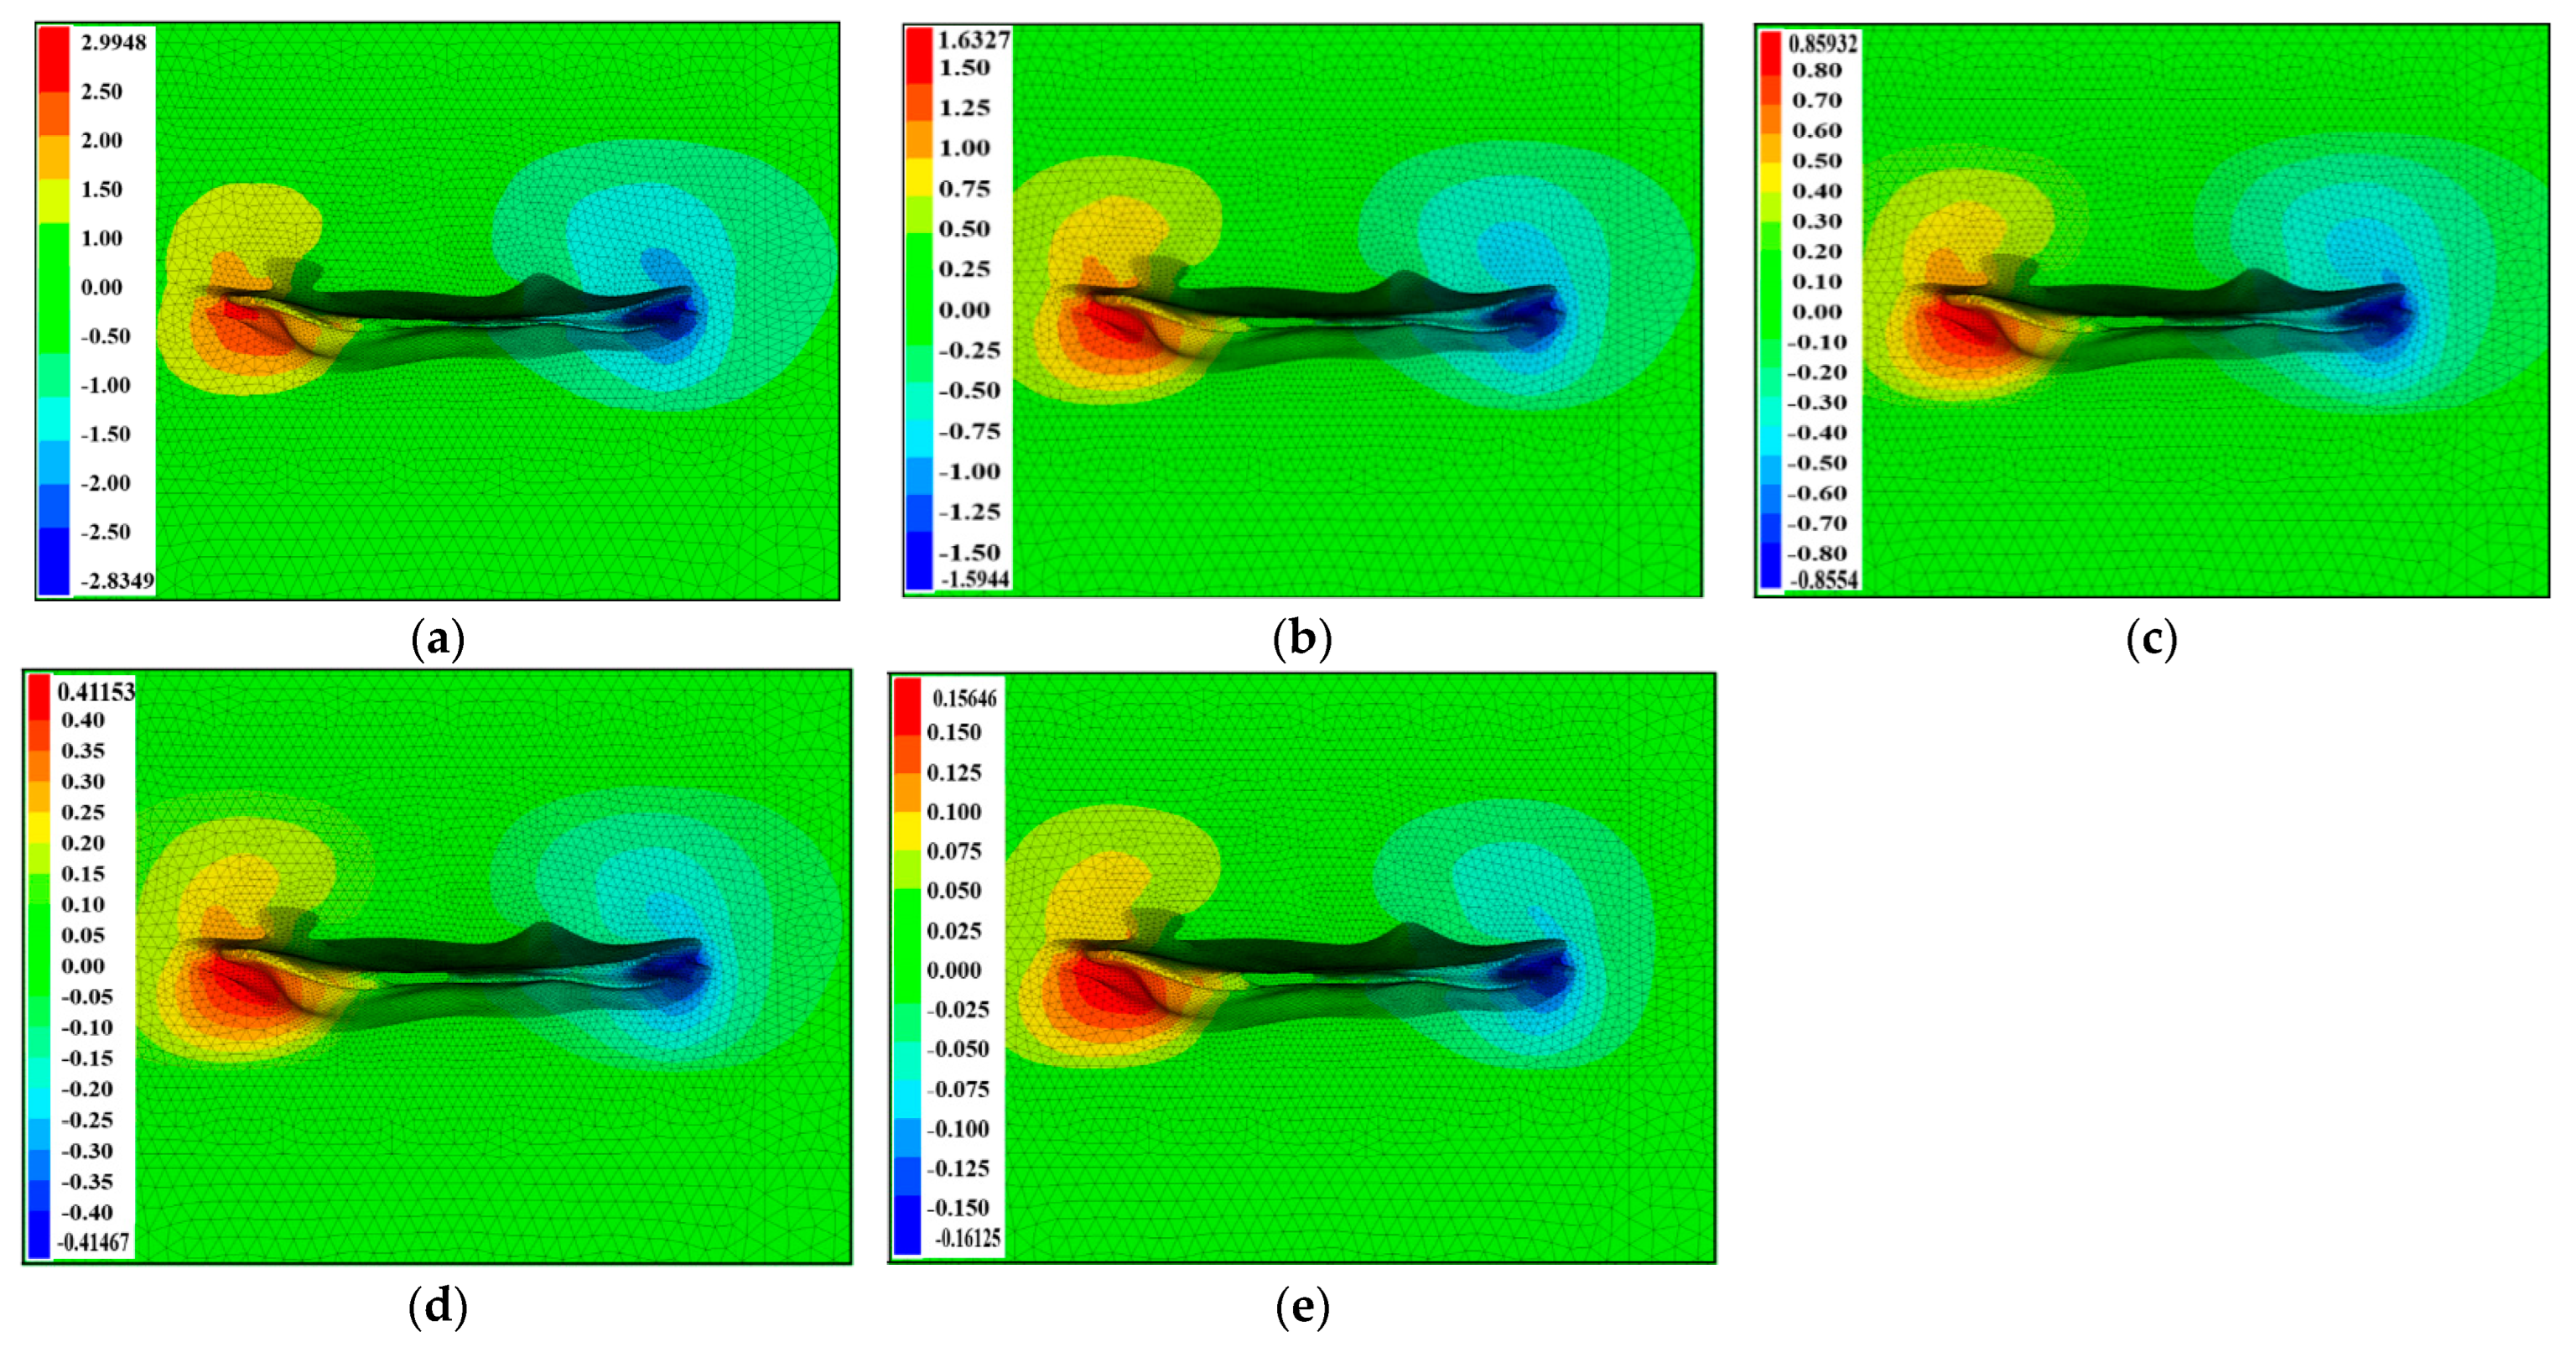
Figure 8.
Maximum X-displacement of the cavity perimeter of the horizontal-well cavity created with nitrogen cushion (50 years).
Figure 8.
Maximum X-displacement of the cavity perimeter of the horizontal-well cavity created with nitrogen cushion (50 years).
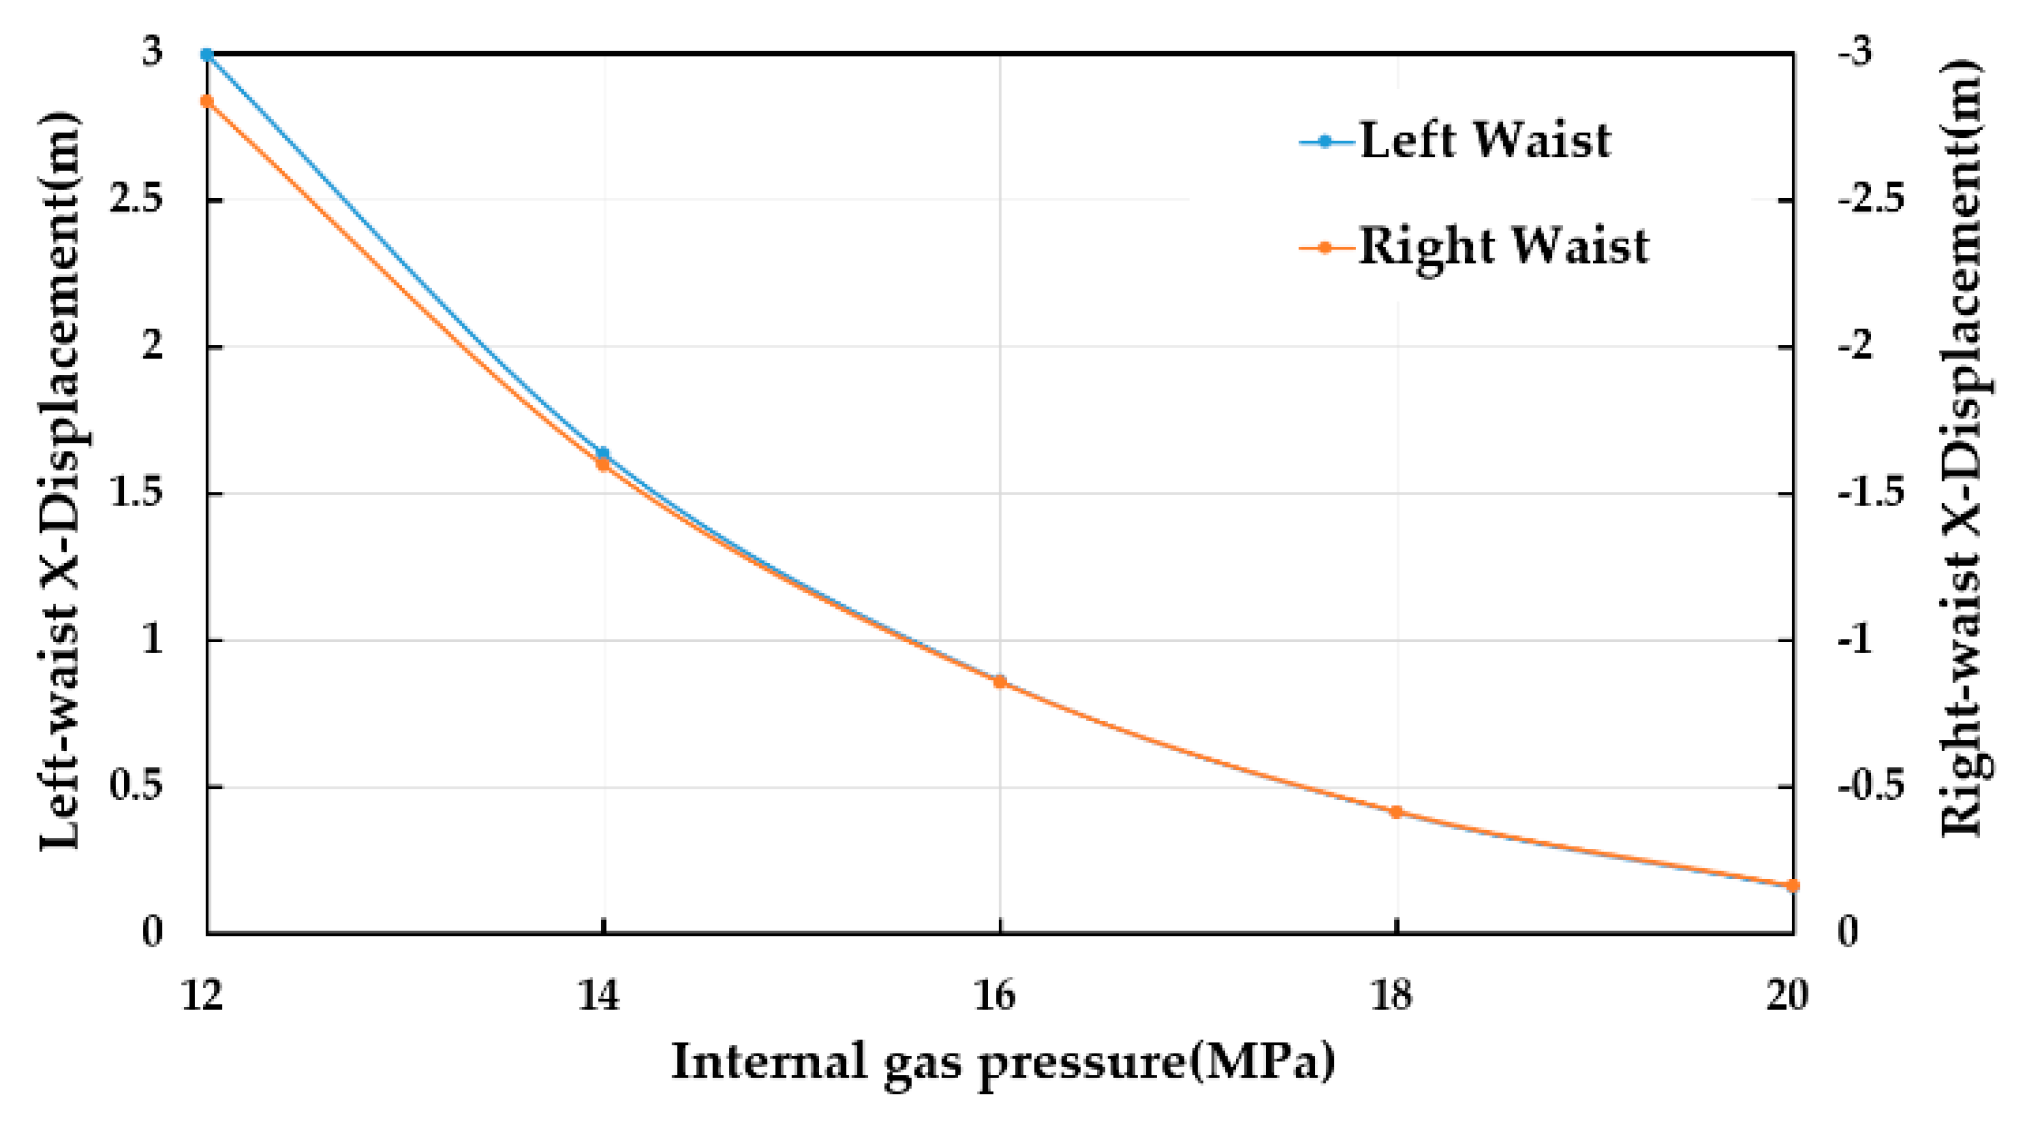
Figure 9.
Logging points 1~8X displacement curves of the horizontal-well cavity created with nitrogen cushion, (a) 1X; (b) 2X; (c) 3X; (d) 4X; (e) 5X; (f) 6X; (g) 7X; (h) 8X.
Figure 9.
Logging points 1~8X displacement curves of the horizontal-well cavity created with nitrogen cushion, (a) 1X; (b) 2X; (c) 3X; (d) 4X; (e) 5X; (f) 6X; (g) 7X; (h) 8X.
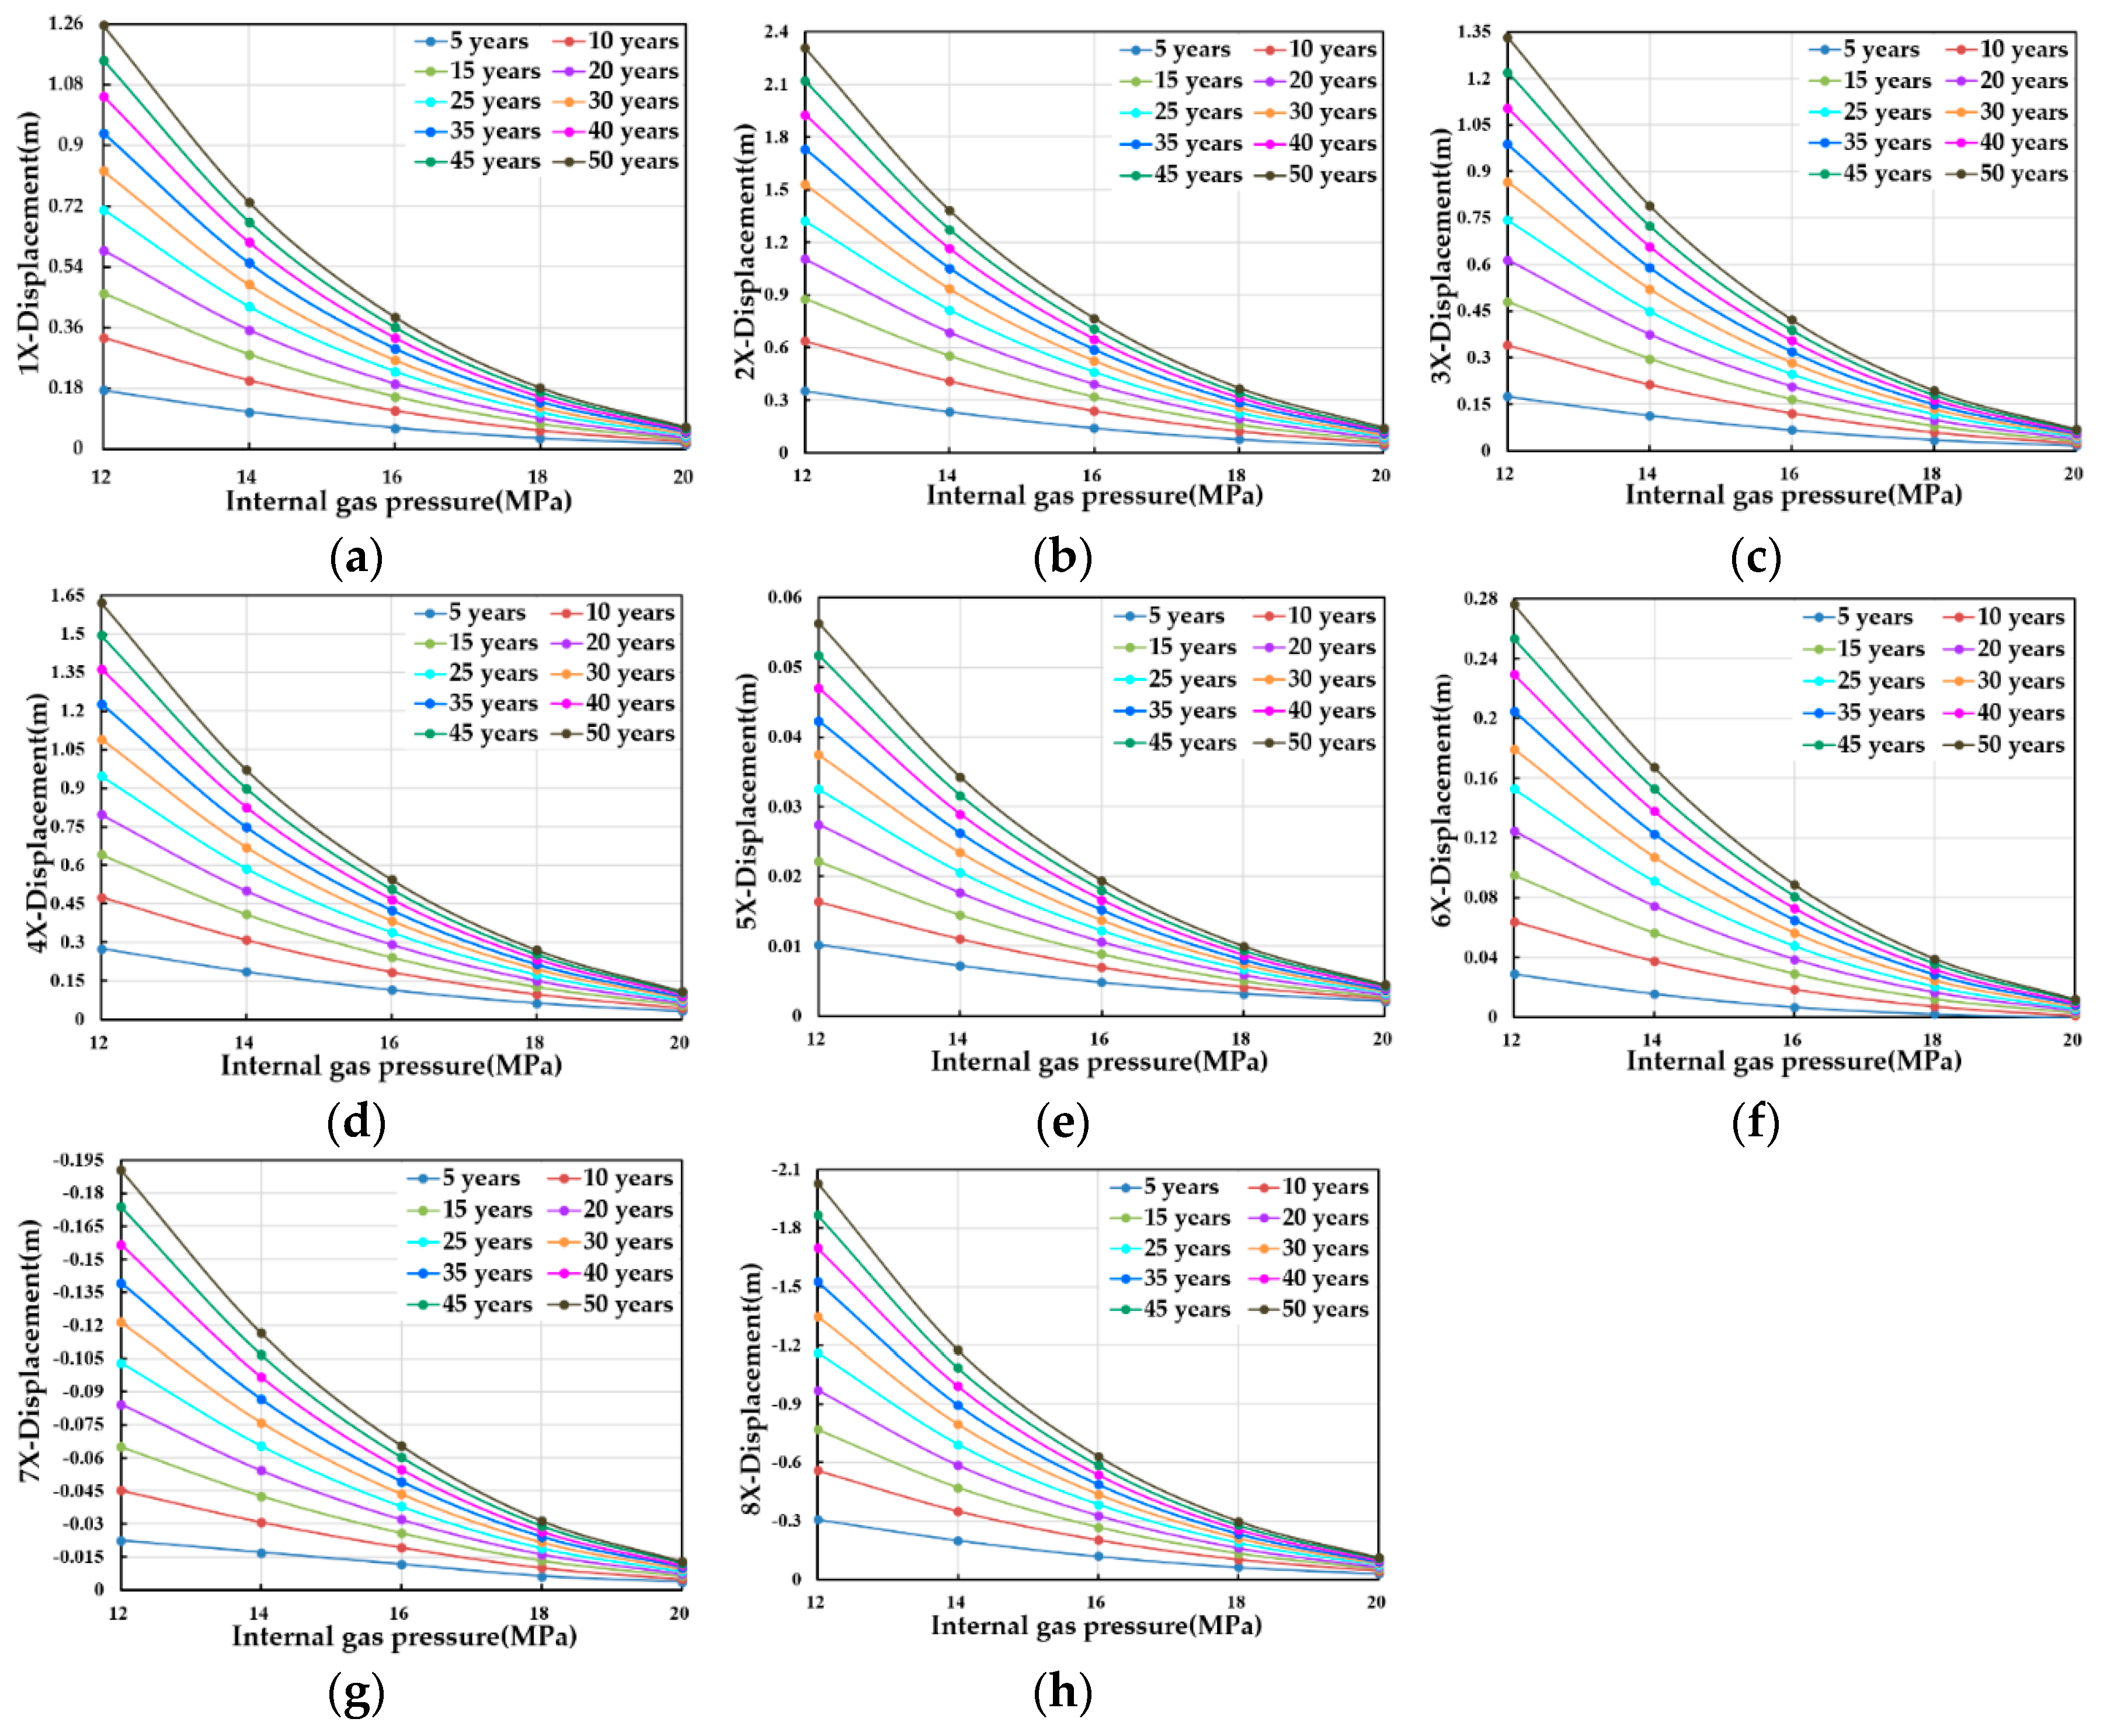
Figure 10.
Cloud map of Y-direction displacement around the perimeter of the horizontal-well cavity created with nitrogen cushion (50 years), (a) p=12MPa; (b) p=14MPa; (c) p=16MPa; (d) p=18MPa; (e) p=20MPa.
Figure 10.
Cloud map of Y-direction displacement around the perimeter of the horizontal-well cavity created with nitrogen cushion (50 years), (a) p=12MPa; (b) p=14MPa; (c) p=16MPa; (d) p=18MPa; (e) p=20MPa.
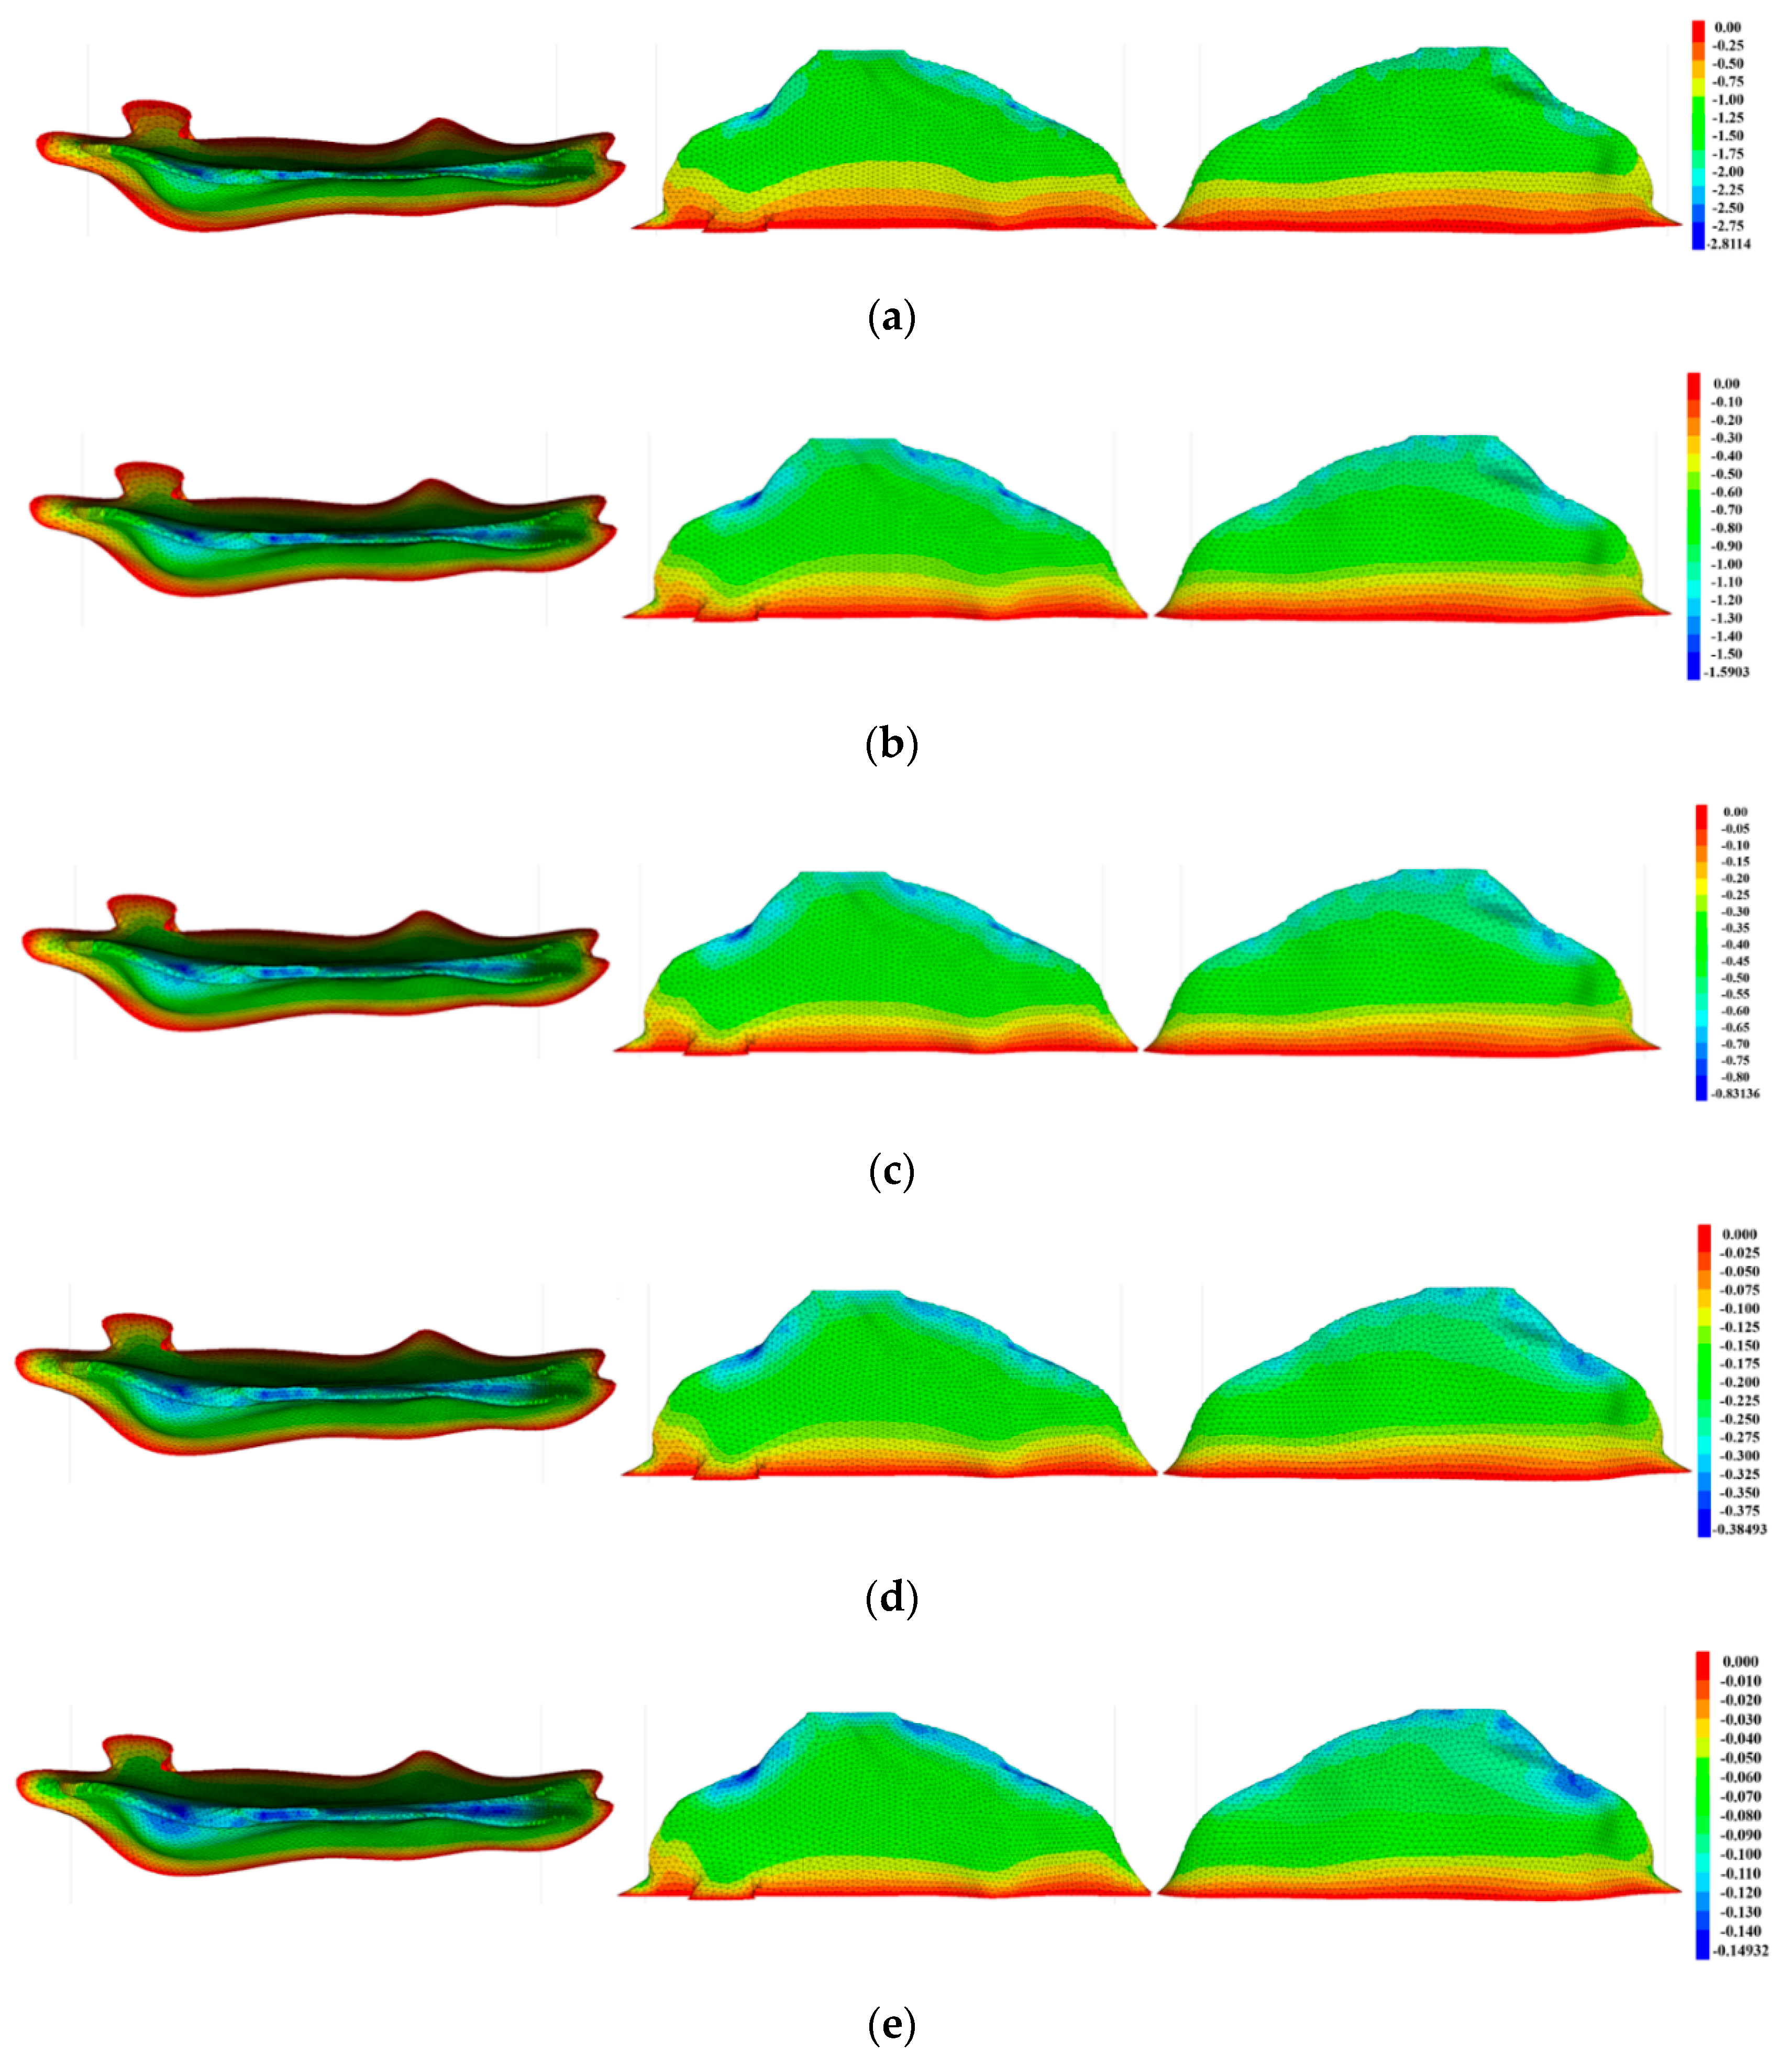
Figure 11.
Y-displacement of the cavity perimeter of the horizontal-well cavity created with nitrogen cushion (50 years): (a)Ymax; (b) 4Y; (c) 5Y.
Figure 11.
Y-displacement of the cavity perimeter of the horizontal-well cavity created with nitrogen cushion (50 years): (a)Ymax; (b) 4Y; (c) 5Y.
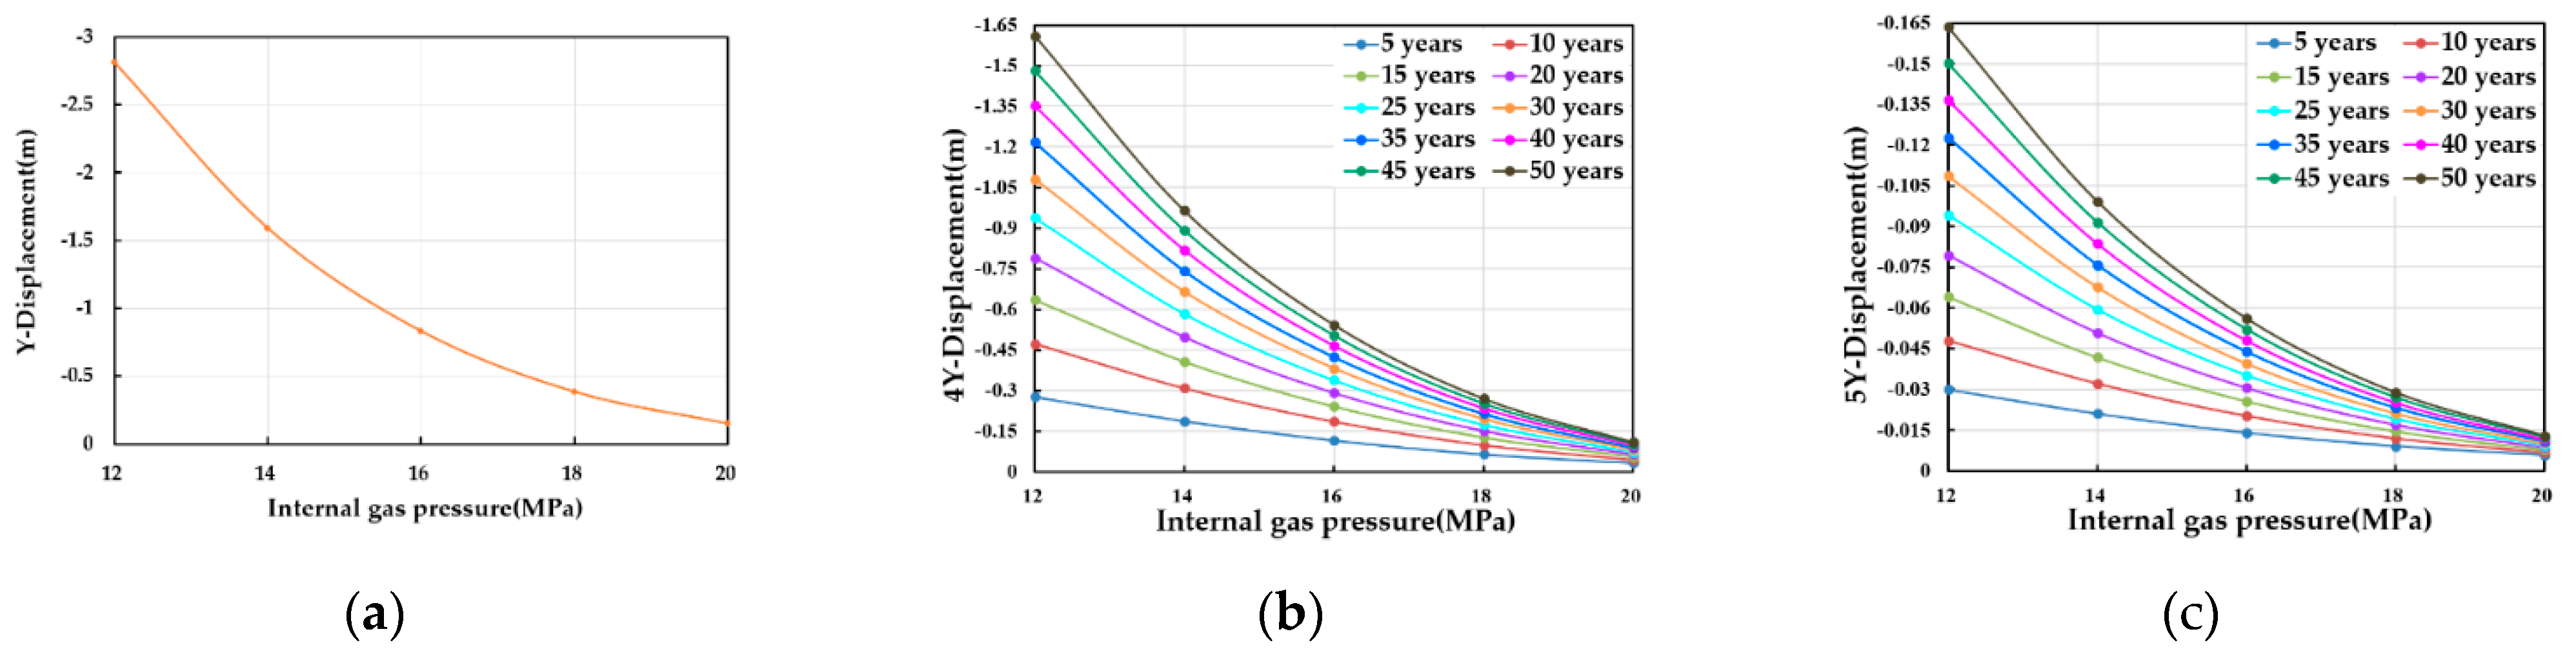
Figure 12.
Cloud map of Z-direction displacement around the perimeter of the horizontal-well cavity created with nitrogen cushion (50 years), (a) p=12MPa; (b) p=14MPa; (c) p=16MPa; (d) p=18MPa; (e) p=20MPa.
Figure 12.
Cloud map of Z-direction displacement around the perimeter of the horizontal-well cavity created with nitrogen cushion (50 years), (a) p=12MPa; (b) p=14MPa; (c) p=16MPa; (d) p=18MPa; (e) p=20MPa.
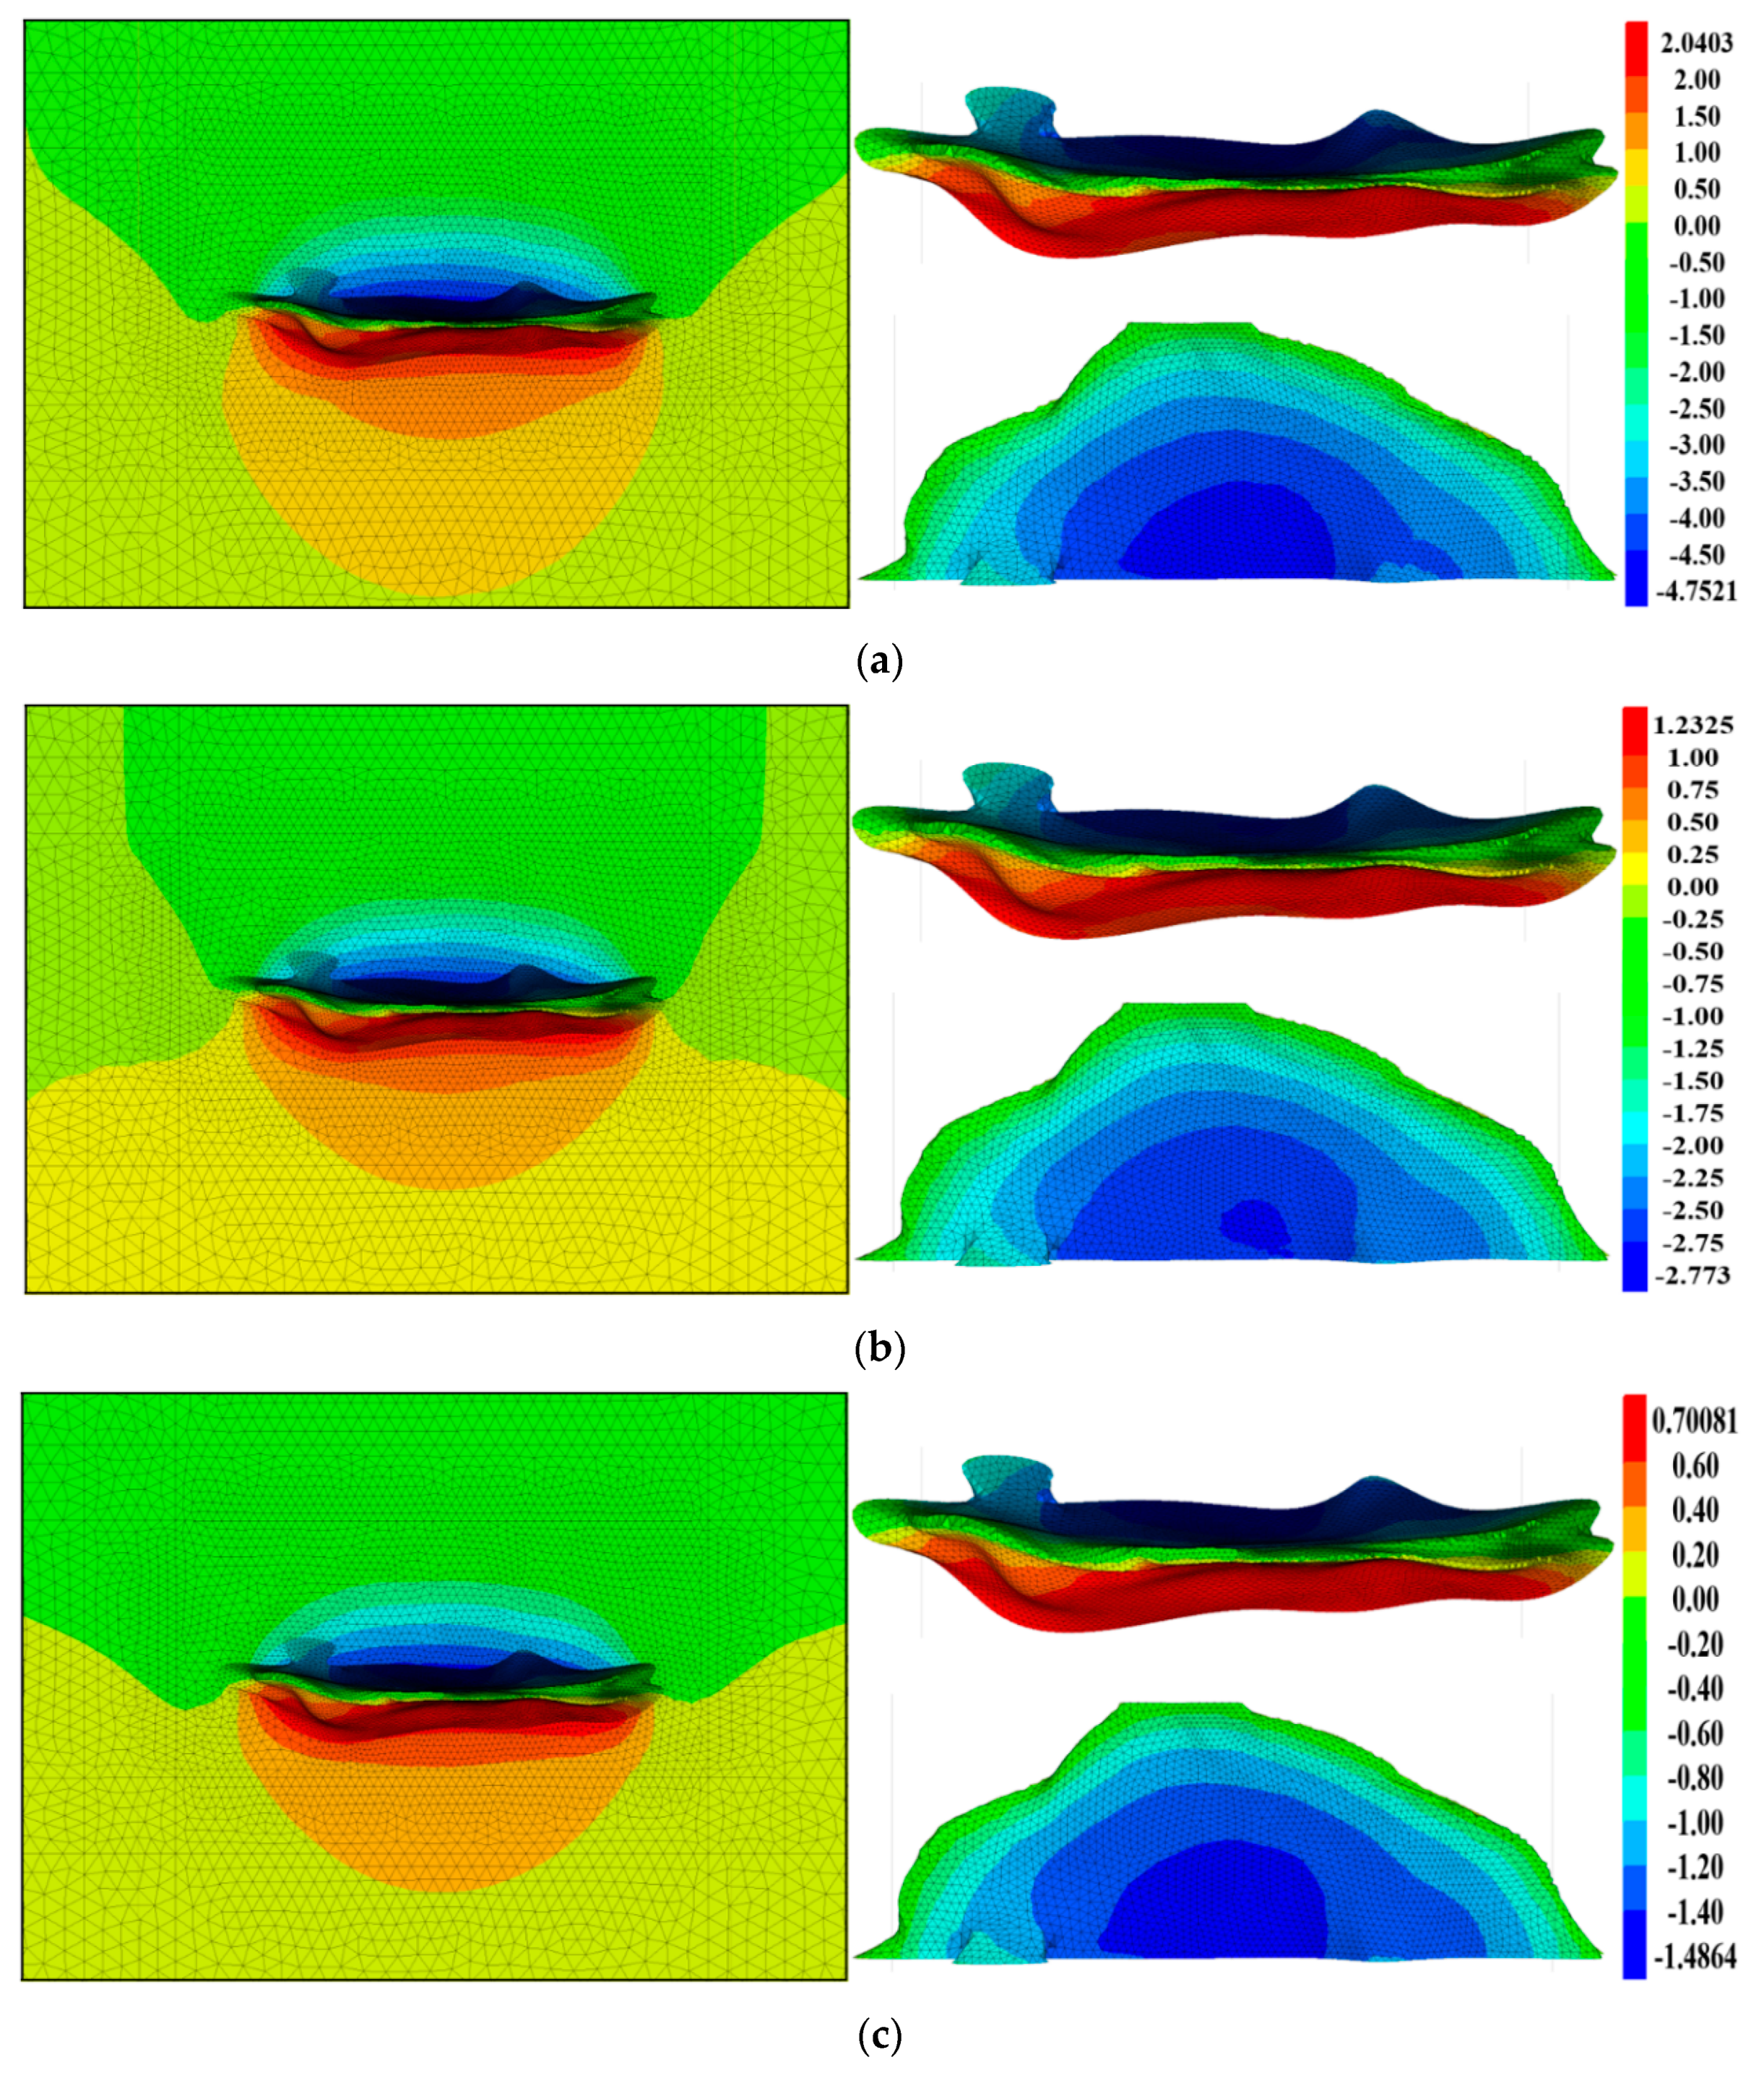
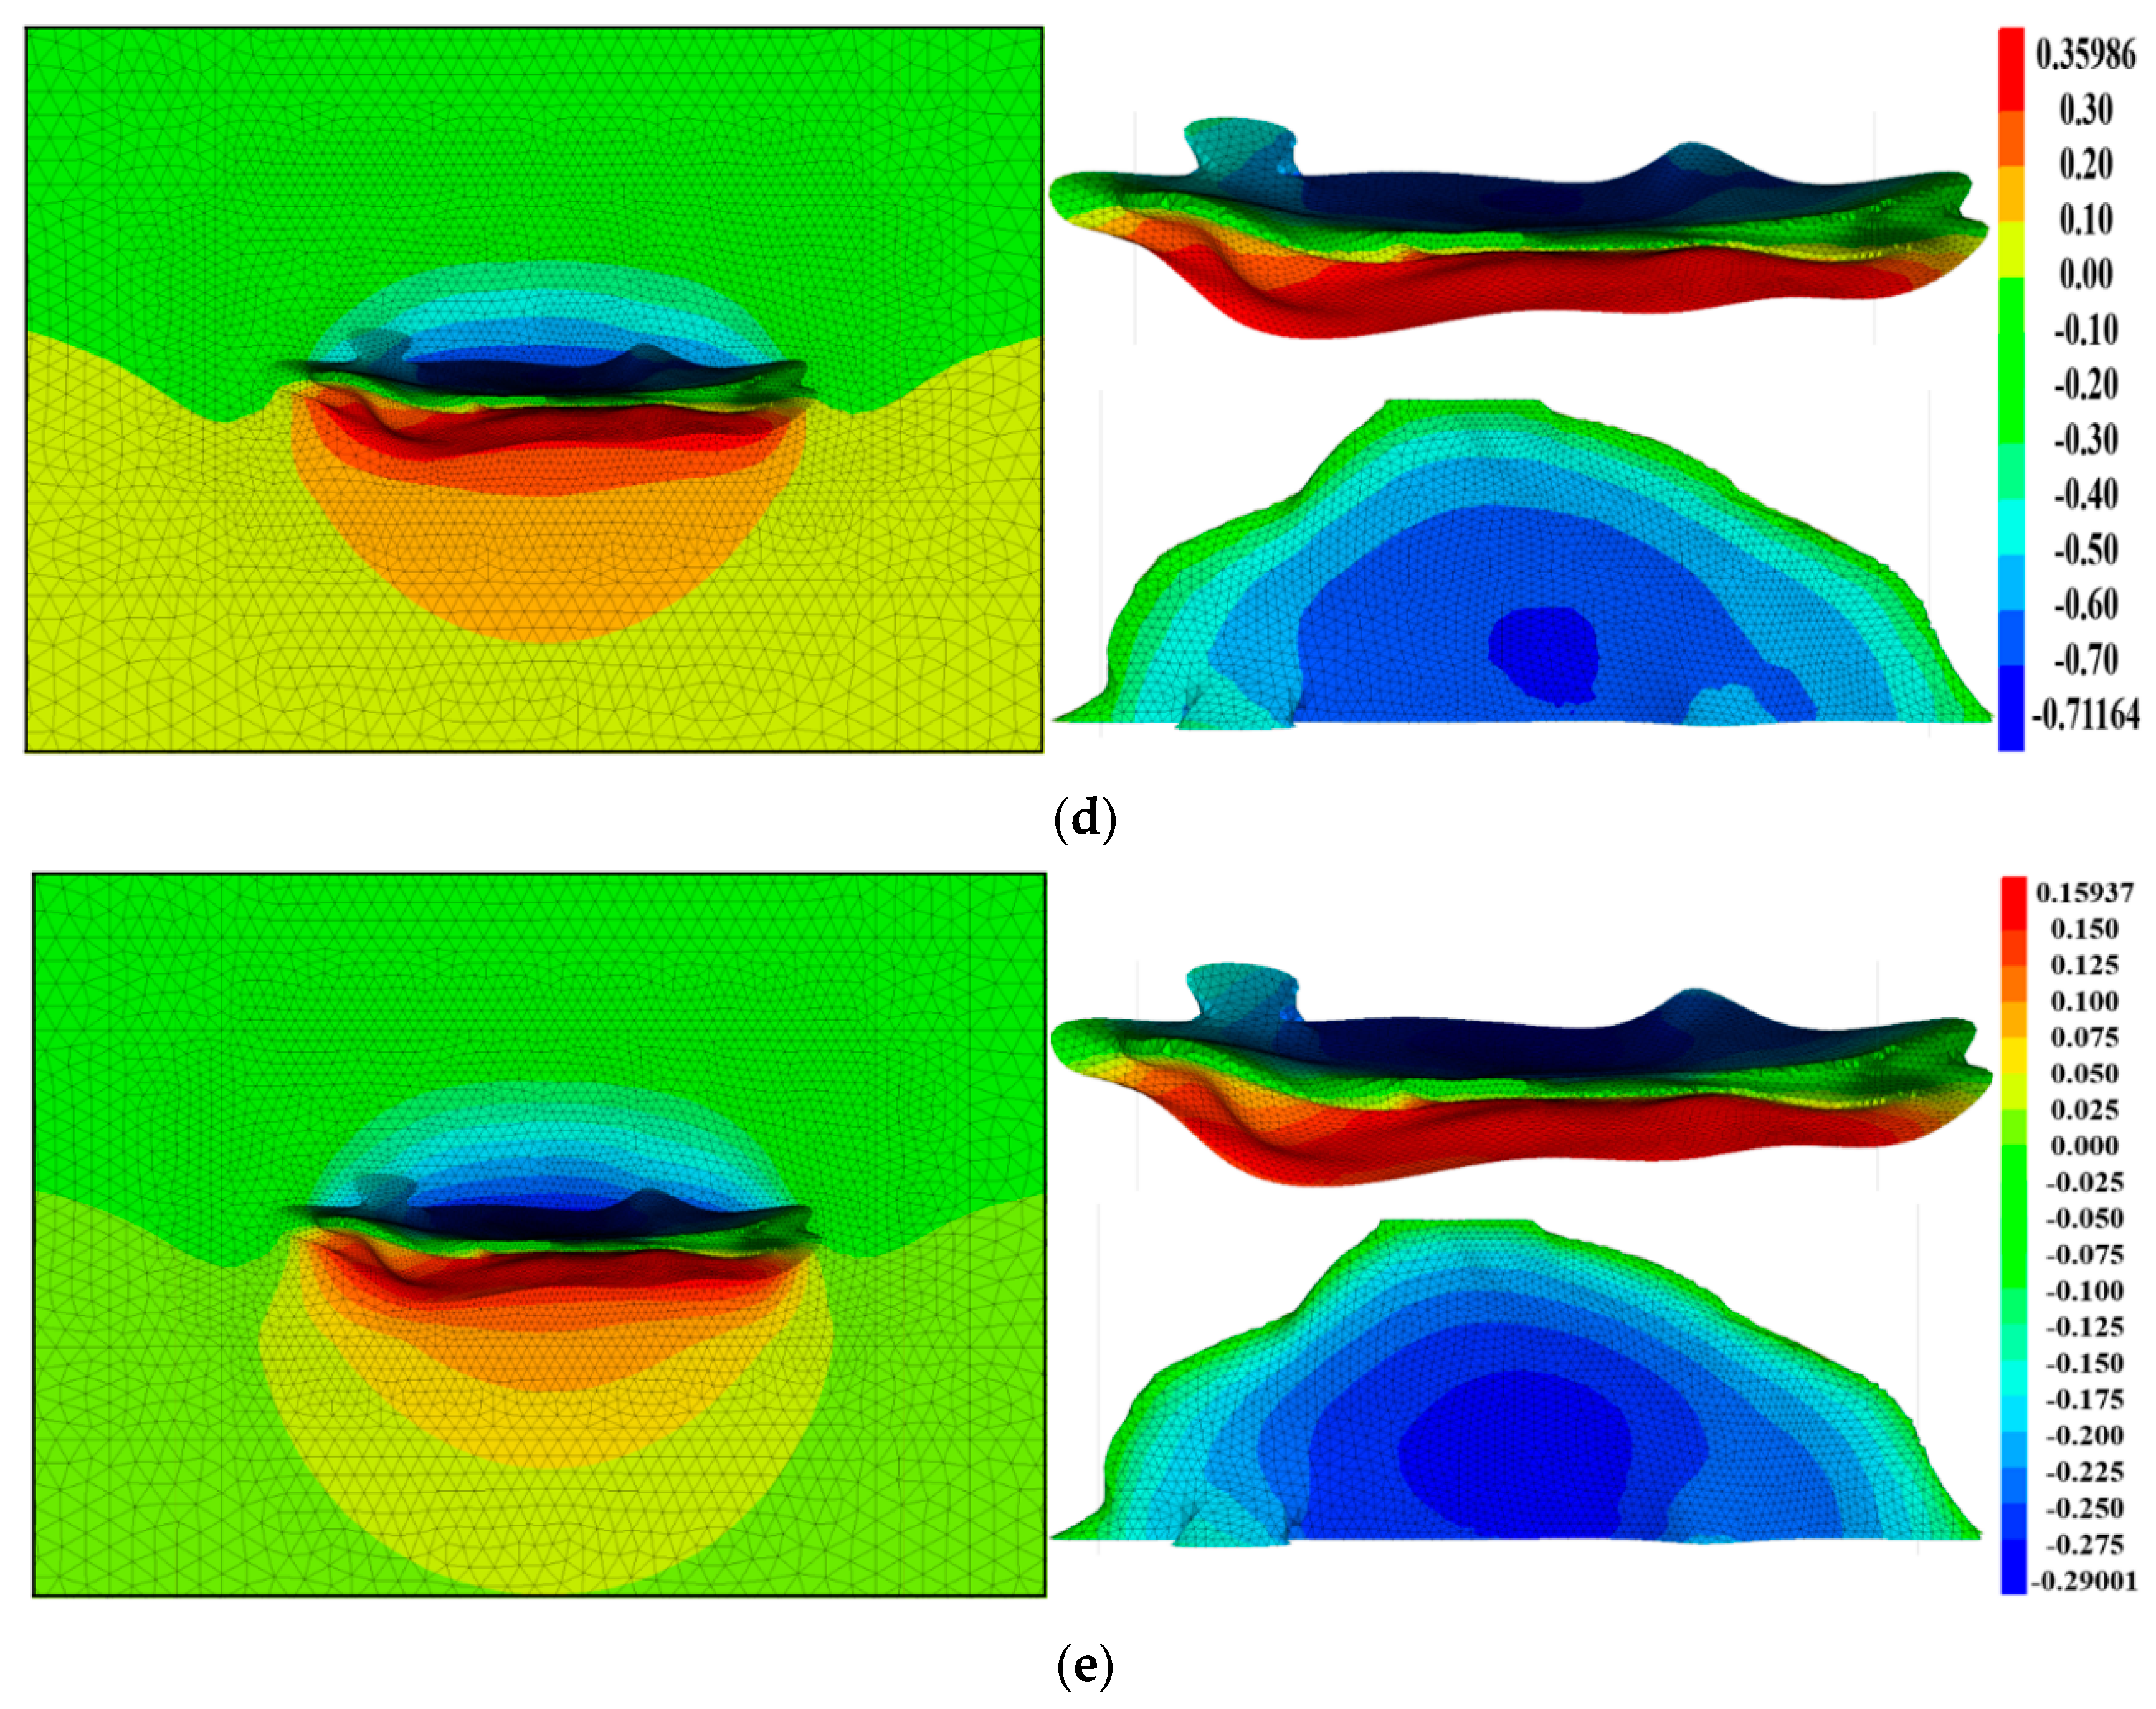
Figure 13.
Maximum Z-displacement of the cavity perimeter of the horizontal-well cavity created with nitrogen cushion (50 years).
Figure 13.
Maximum Z-displacement of the cavity perimeter of the horizontal-well cavity created with nitrogen cushion (50 years).
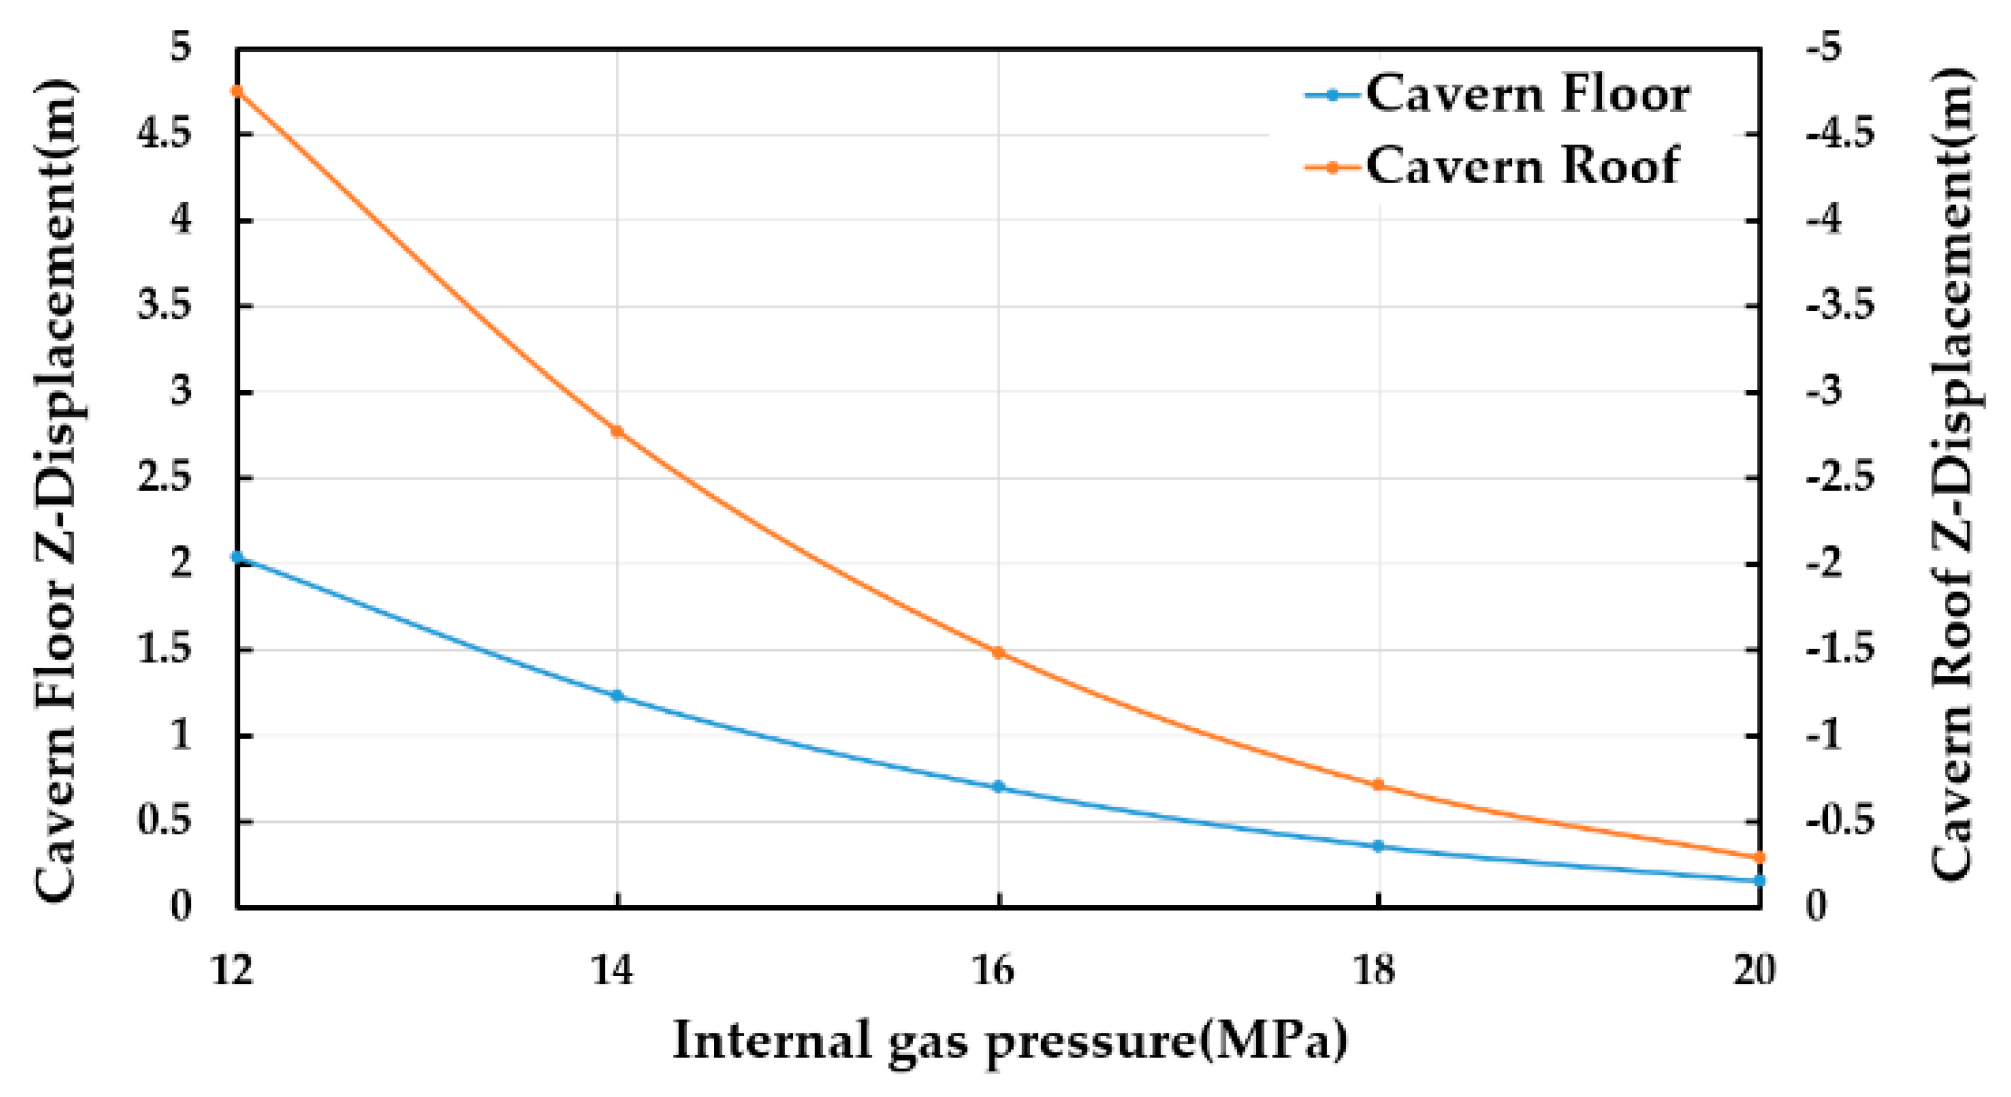
Figure 14.
Logging points 1-8Z displacement curves of the horizontal-well cavity created with nitrogen cushion. (a) 1Z; (b) 3Z; (c) 6Z; (d) 8Z; (e) 2Z; (f) 4Z; (g) 5Z; (h) 7Z.
Figure 14.
Logging points 1-8Z displacement curves of the horizontal-well cavity created with nitrogen cushion. (a) 1Z; (b) 3Z; (c) 6Z; (d) 8Z; (e) 2Z; (f) 4Z; (g) 5Z; (h) 7Z.
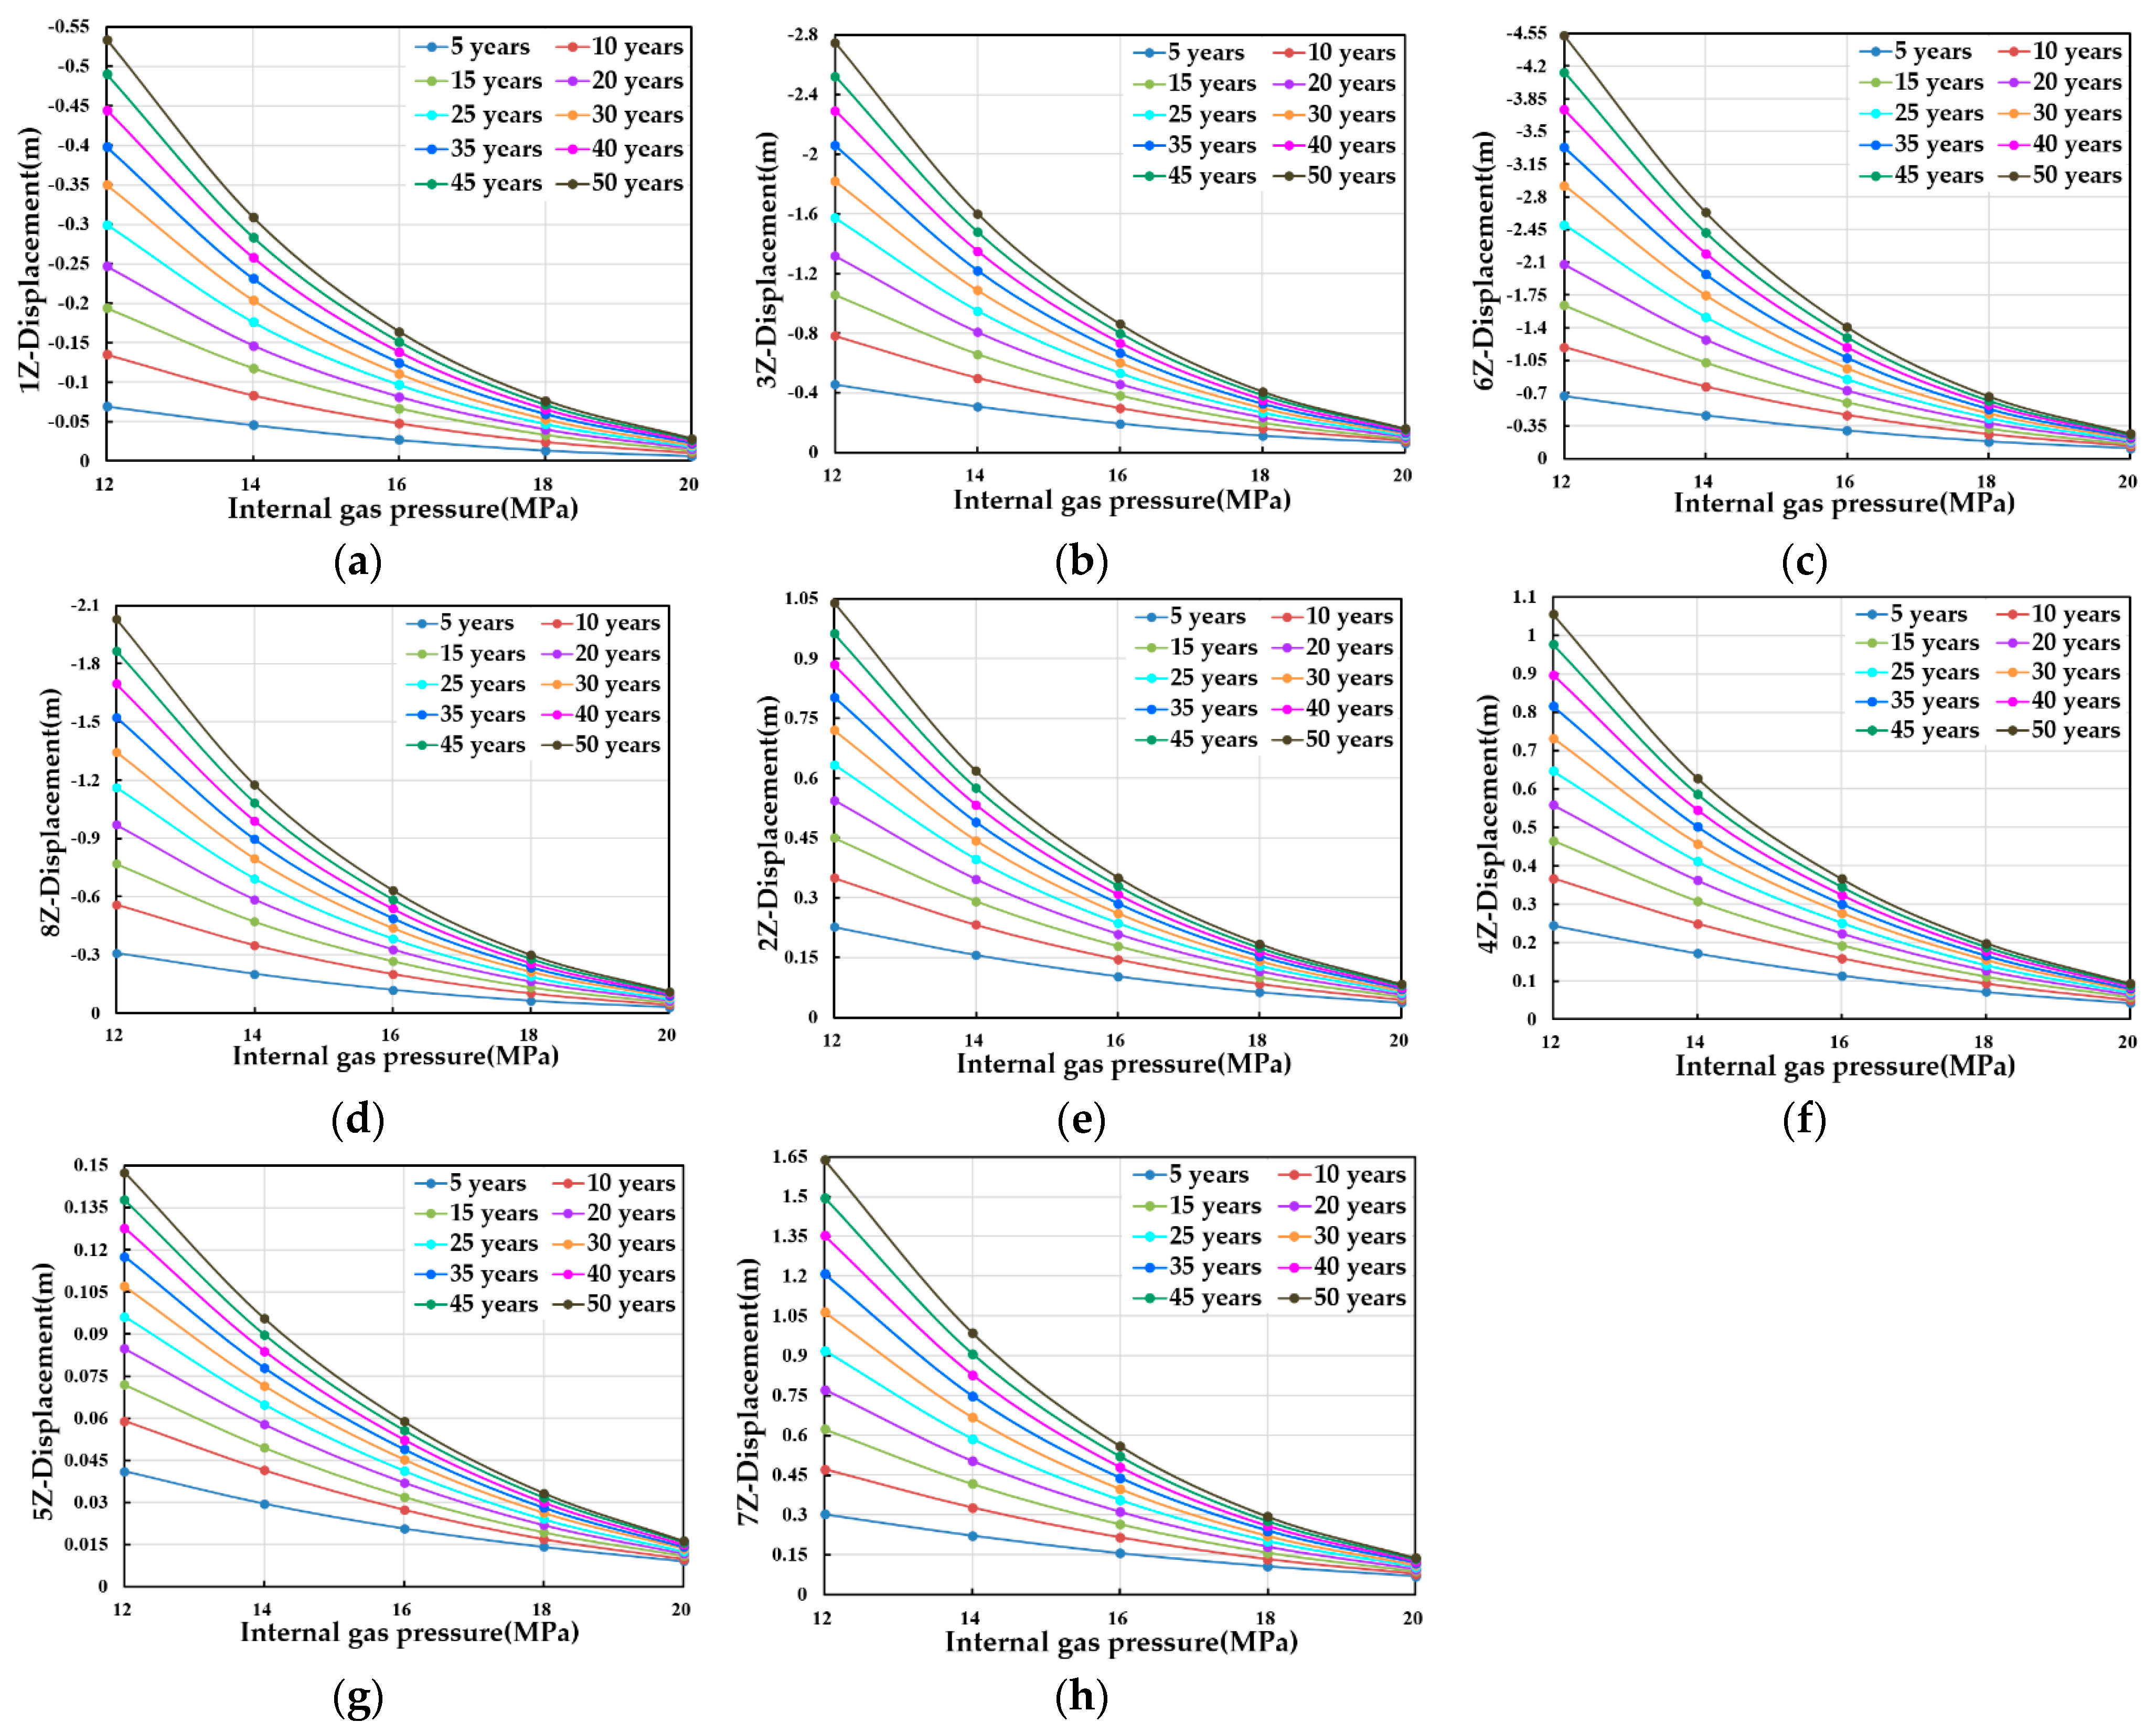
Figure 15.
Horizontal-well cavity created with nitrogen cushion: (a) Ralative volume loss versus time curves; (b) Ralative volume loss versus internal pressure curves; (c) RVL rate versus time curves.
Figure 15.
Horizontal-well cavity created with nitrogen cushion: (a) Ralative volume loss versus time curves; (b) Ralative volume loss versus internal pressure curves; (c) RVL rate versus time curves.
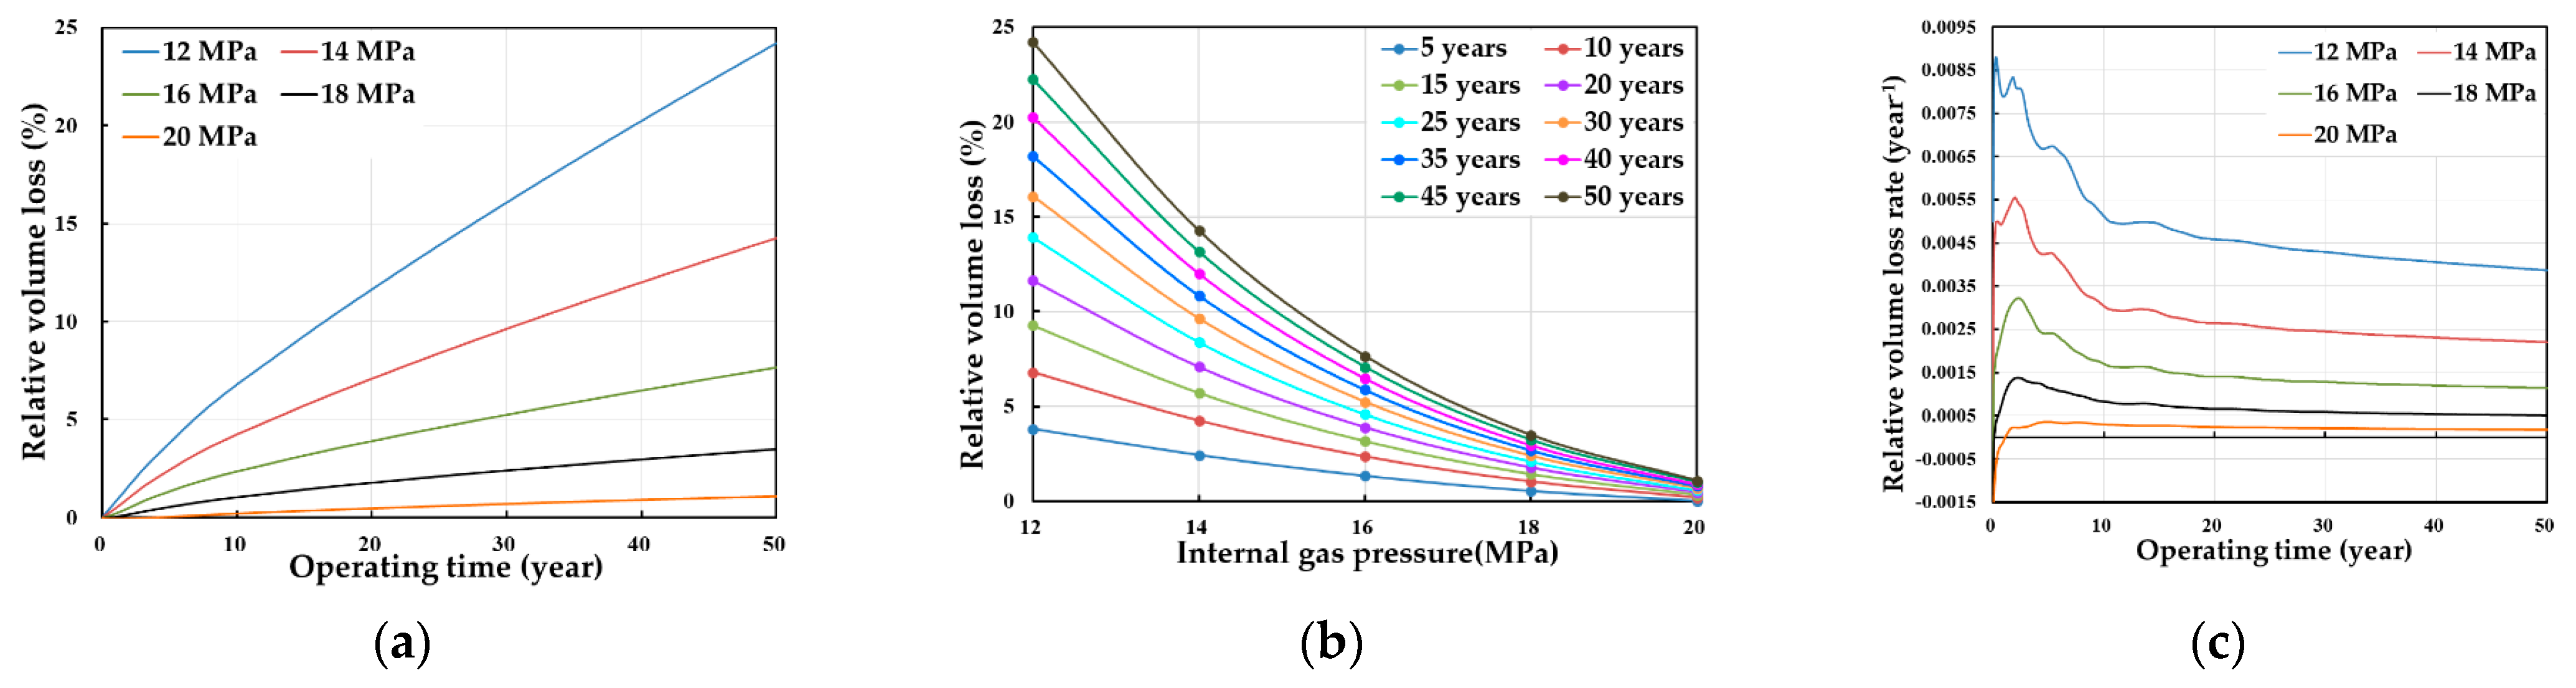
Figure 16.
Horizontal-well cavity created with nitrogen cushion: (a) Volume of plastic zone versus time curves; (b) Volume of plastic zone versus internal pressure curves.
Figure 16.
Horizontal-well cavity created with nitrogen cushion: (a) Volume of plastic zone versus time curves; (b) Volume of plastic zone versus internal pressure curves.
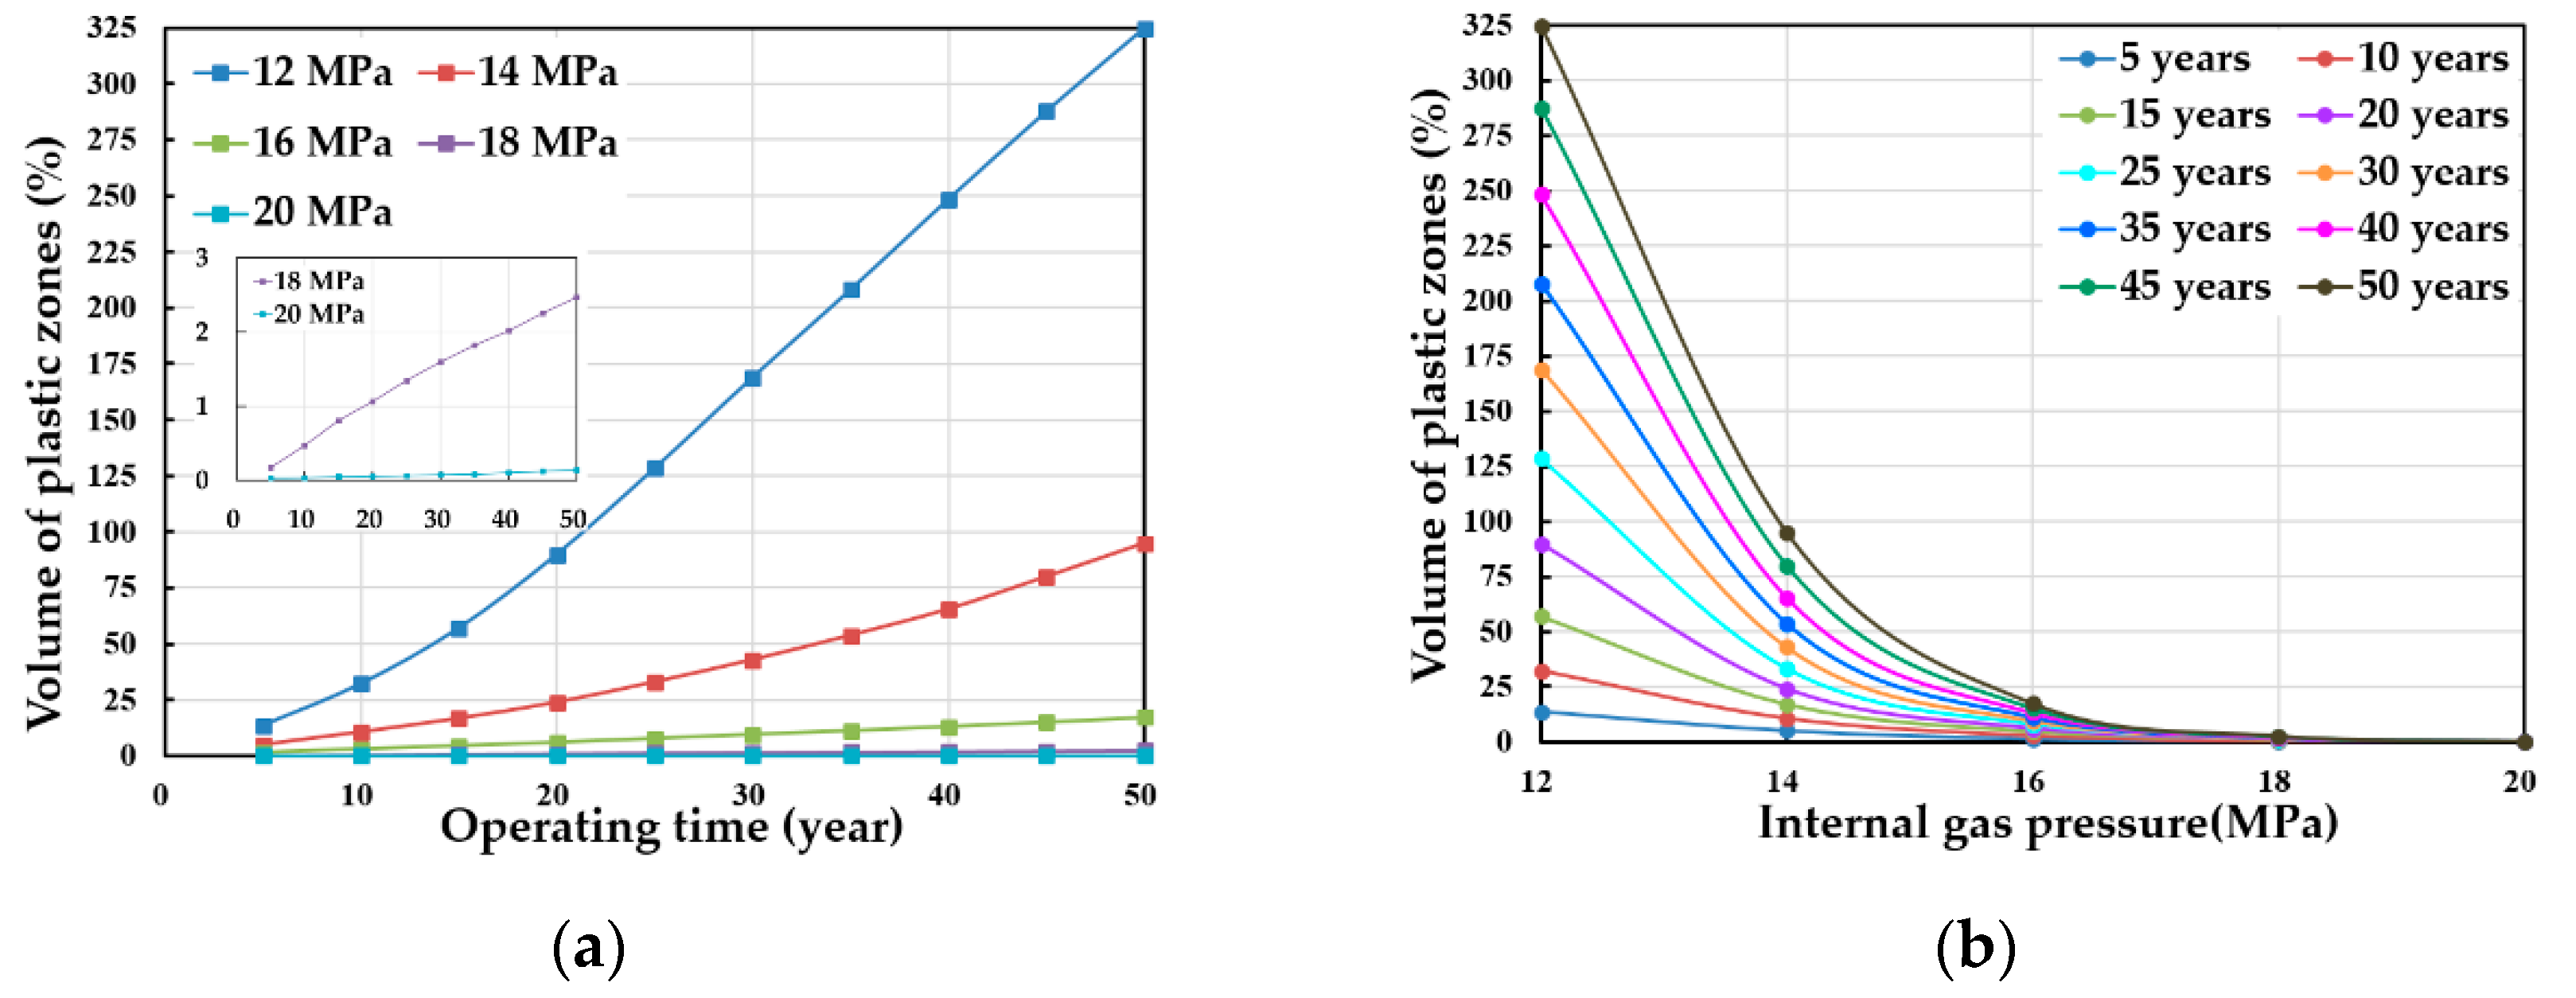
Figure 17.
Distribution of plastic zones around horizontal-well cavity created with nitrogen cushion, (a) p=12MPa; (b) p=14MPa; (c) p=16MPa; (d) p=18MPa; (e) p=20MPa.
Figure 17.
Distribution of plastic zones around horizontal-well cavity created with nitrogen cushion, (a) p=12MPa; (b) p=14MPa; (c) p=16MPa; (d) p=18MPa; (e) p=20MPa.
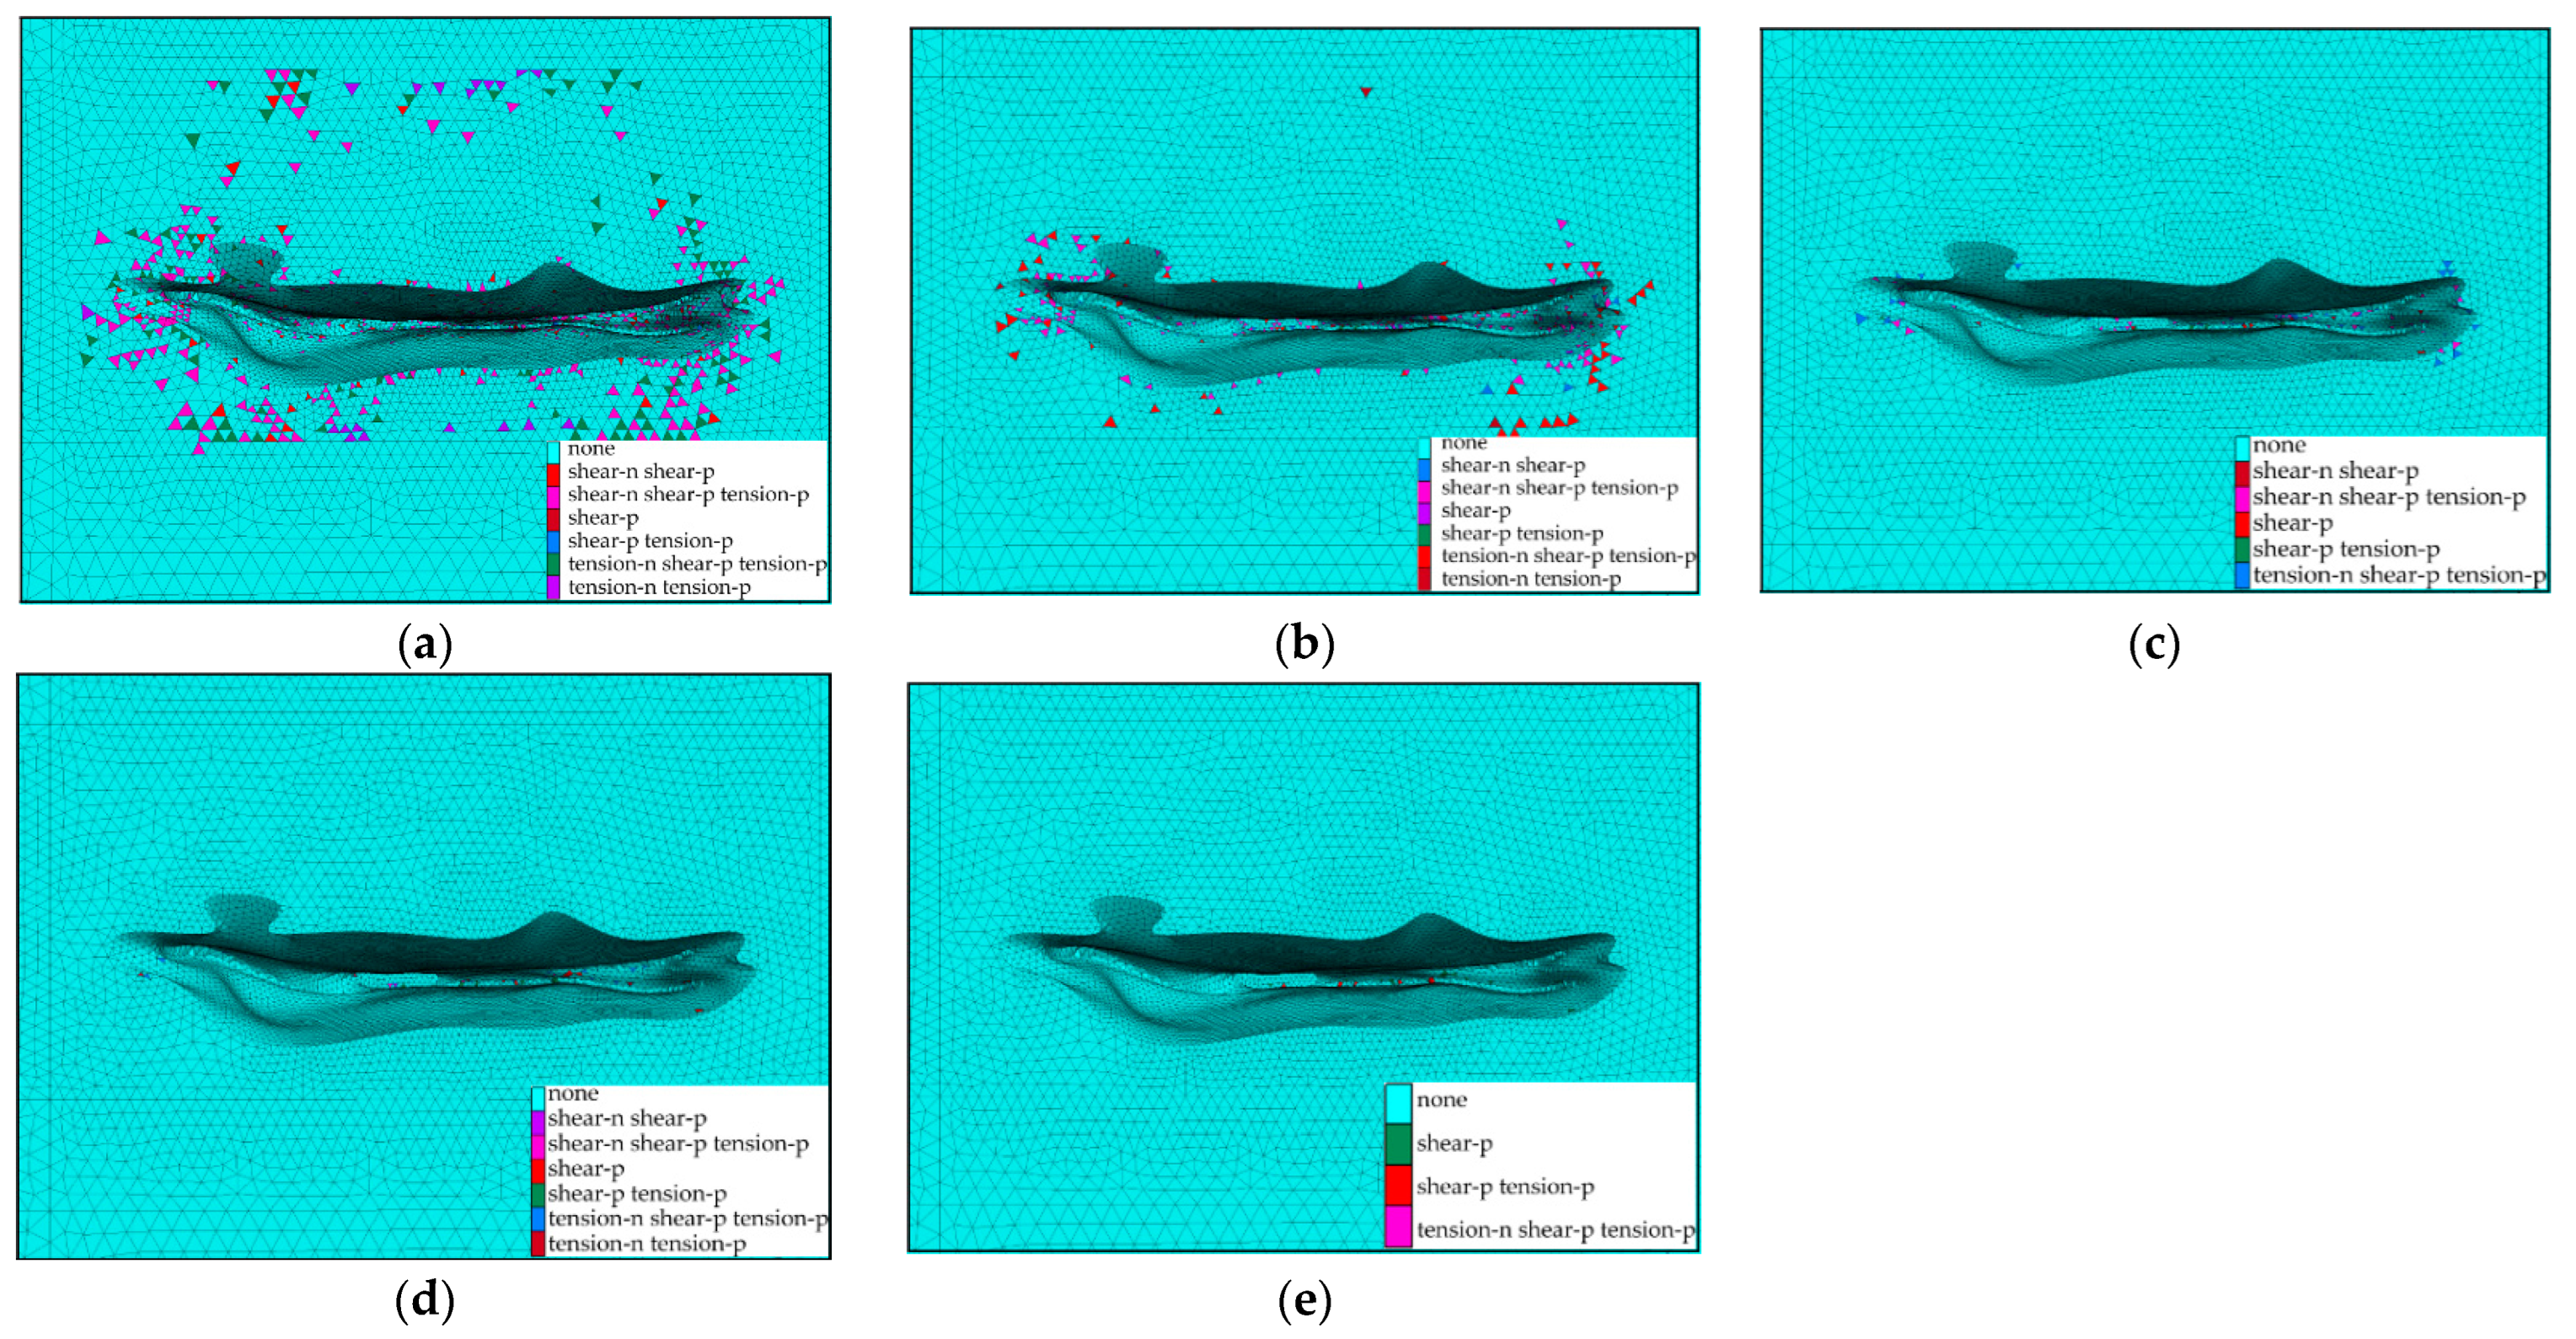
Table 1.
Parameters-Dimension
| Parameters | Dimension(unit) | Parameters | Dimension(unit) |
|---|---|---|---|
| l | L | c | ML-3 |
| t | T | T | Θ |
| ρ | ML-3 | q | L3T-1 |
| ω | ML-2T-1 |
Table 2.
Relevant similarity ratios in the cavity leaching test.
| Parameters | Cavity diameter /m |
Density of salt rock /kg·m-3 | Dissolution rate of the brine/g·cm-2·h-1 | Mining time/h | Brine concentration/g·L-1 | Flow rate/ ml·min-1 |
|---|---|---|---|---|---|---|
| Prototype | 125 | 2176 | 3.68 | - | - | 50 m3/h |
| Model | 0.25 | 2117 | 1.42 | - | - | 10 ml/min |
| Similarity Ratio | 500 | 1 | 2.59 | 1500 | 1 | 83333 |
Table 4.
Phase divisions of the cavity leaching test with nitrogen cushion.
| Stage | Duration (h) | Flow rate (ml/min) |
Wellhead distance (mm) |
|---|---|---|---|
| 1 | 3 | 3 | 5 |
| 2 | 3 | 6 | 5 |
| 3 | 3 | 9 | 5 |
| 4 | 3 | 3 | 35 |
| 5 | 3 | 6 | 35 |
| 6 | 3 | 9 | 35 |
| 7 | 3 | 3 | 65 |
| 8 | 3 | 6 | 65 |
| 9 | 3 | 9 | 65 |
| 10 | 3 | 3 | 95 |
| 11 | 3 | 3 | 125 |
| 12 | 3 | 6 | 125 |
| 13 | 3 | 9 | 125 |
| 14 | 10 | 12 | 125 |
| 15 | 28 | 12 | 155 |
| 16 | 7 | 12 | 155 |
| 17 | 10 | 15 | 155 |
Table 5.
Material setting parameters for hydrostatic calculation.
| Lithology | Modulus of elasticity (GPa) | Poisson’s ratio | Cohesive force (MPa) |
internal friction angle(°) | Tensile strength (MPa) |
|---|---|---|---|---|---|
| mudstone | 10 | 0.27 | 2.5 | 35 | 1.5 |
| Rock salt | 15 | 0.3 | 1.75 | 37.5 | 1.25 |
Disclaimer/Publisher’s Note: The statements, opinions and data contained in all publications are solely those of the individual author(s) and contributor(s) and not of MDPI and/or the editor(s). MDPI and/or the editor(s) disclaim responsibility for any injury to people or property resulting from any ideas, methods, instructions or products referred to in the content. |
© 2023 by the authors. Licensee MDPI, Basel, Switzerland. This article is an open access article distributed under the terms and conditions of the Creative Commons Attribution (CC BY) license (http://creativecommons.org/licenses/by/4.0/).
Copyright: This open access article is published under a Creative Commons CC BY 4.0 license, which permit the free download, distribution, and reuse, provided that the author and preprint are cited in any reuse.


