Submitted:
27 October 2023
Posted:
30 October 2023
You are already at the latest version
Abstract
Urban mobility and sustainable transportation are fundamental for the European Union's goal of achieving climate neutrality by 2050. The EU encourages national governments to prioritize zero-emission urban transport systems that emphasize safety, accessibility, and inclusiveness. Promoting walking plays a fundamental role in sustainable urban mobility, offering advantages such as emission reduction, better air quality, and enhanced public health. Recent research underscores the importance of creating appealing and safe pedestrian environments to encourage walking. These efforts align with the United Nations' Agenda 2030 sustainability goals, particularly Objective 11, which aims to build inclusive, safe, and sustainable cities and communities. This paper explores the factors influencing pedestrians' willingness to walk and categorizes them into four main groups: Physical Characteristics, Comfort, Safety, and Attractiveness. Significantly, the study reveals that the importance of these factors varies based on demographics, mainly the age of the users. Understanding these factors and their relative significance for pedestrian satisfaction is crucial for shaping effective policies and urban planning strategies aimed at promoting sustainable mobility. By prioritizing pedestrian satisfaction and addressing the specific needs and preferences of diverse groups, cities can create more walkable and environmentally friendly urban environments. These findings offer valuable insights for policymakers and urban planners working toward EU climate-neutral objectives and enhancing the well-being of citizens.
Keywords:
Walking Environment
; User Satisfaction
; Sustainable Urban Mobility
; Urban Sustainability
; Pedestrian Infrastructure
; Road Safety and Walking
1. Introduction
The EU is committed to becoming climate-neutral by 2050. To achieve this, the transport sector must undergo a transformation that will require a 90% reduction in greenhouse gas emissions, ensuring modes of transport alternatives that reflect the principles of sustainable mobility. In the EU, transport emissions now account for around 25% of the EU's total greenhouse gas emissions and have increased in recent years. The goal of being the first climate-neutral continent by 2050 requires ambitious changes in the transport sector. In this context, urban mobility plays a fundamental role.
To date, 70% of European Union citizens live in cities where 23% of all greenhouse gas emissions from transport are generated. To reduce these emissions - by at least 55% by 2030 and 90% by 2050 - the EU is incentivizing policies to encourage national governments to develop safe, accessible, inclusive, affordable, smart, resilient and above all with zero emissions urban transport systems.
In cities, the main challenge is to create conditions that can allow the development of synergies between road safety measures and sustainability. To this end, all policies should aim to discourage the use of cars in the city, and to create safer infrastructure for vulnerable users (pedestrians and cyclists). Reducing the number of cars will reduce CO2 emissions, improve air quality, ease traffic congestion and help make the population more active and healthier. Even more ambitious goals can be achieved by identifying interventions to allow safe and economic access to mobility for all members of society, in particular for the disabled and for the growing percentage of elderly people.
The challenges that road networks in urban areas are called to face are also contemplated in the sustainability objectives and the related targets identified by the ONU Agenda 2030. In particular, Objective 11 of the Agenda (Sustainable cities and communities) aims to making cities and human settlements inclusive, safe, long-lasting and sustainable. This objective provides for the guarantee of access for all users to safe and inclusive green surfaces and public spaces, especially for women and children, the elderly and people with disabilities.
Following the objectives set by the EU, in many European countries the transport policies are aimed at providing more space for active mobility (pedestrian and cyclist) reflecting a different conception for transport and urban policies, more sustainable, therefore focused on health, inclusiveness, equity and livability [1]
An essential element of sustainable urban mobility planning is active mode of transport, including walking. Therefore, in light of the increase in urban sustainability, walking must be recognized as an important mode of urban transport [2]. It has been known for some time that in order to achieve more sustainable urban mobility, intervention strategies must aim at discouraging the use of private cars and encouraging active modes and the use of public transport. In light of the increase in urban sustainability, walking must be recognized as an important mode of urban transport.
Previous studies have shown that interventions that improve pedestrian infrastructure are needed to encourage walking [3] and that the built environment is crucial in encouraging or deterring walking [4]. People often do not walk the shortest path when walking, but they prefer more attractive routes, even if longer, regardless of the trip purpose, length, and time of day [5]. [6] proposed sustainability-oriented, eco-design urban street design criteria. This study introduces “complete streets” design criteria through the addition of design criteria related to the aesthetics, environment, livability, and safety. The sustainable complete streets criteria should always be included during the planning, design, and operation of roadways by Administrations, managers and designers, when designing for new streets or redeveloped streets.
The literature review indicates that factors influencing walking could be divided into two sectors: socio-economic factors, depending on the users’ individual features (i.e. age, sex, means of transport mainly used, etc.) and the characteristics of pedestrian paths. [7] shows that age of the users plays a fundamental role in defining aspects that are intended to encourage and improve neighborhood walkability. However, different results were found with regard to sex. The number of walking stops is greater for men in some contexts [8] while the opposite is true in other contexts [9,10]. From [11] it appears that urban environments influence the experience of walking. In particular, socially active urban squares and pedestrian streets are highly stimulating, as well as narrower streets, as more details are closer to the eyes.
Areas with high residential densities are usually characterized by more pedestrian activity [12]. They usually attract services and retail, which helps to reduce the walking distances to these destinations.
Population growth, especially in large cities, has led to an increase in the ownership and use of cars with consequent negative social and environmental impacts. To remedy these problems, transport policies today aim to encourage green mobility. The main objective of sustainable mobility strategies is to reduce the number and duration of motorized vehicle travelers. The fundamental aspects to encourage green mobility are: more space for people, safer roads, and time [13,14].
Users' judgment of the road environment plays an important role in their willingness to walk [15,16]. Pedestrian perceptions have great value in the planning process of the street environment. Some studies have shown that user judgment is a subjective parameter, it varies as a function of parameters such as individual preferences, cultural values and climate [17]. In order to identify and create a desirable walking environment, the pedestrians are the most appropriate group to assess their attitude towards the streets [18].
One successful approach to increasing the number of walking trips in an urban area is to increase overall user satisfaction with pedestrian infrastructure. The relationship between the quality of the street environment and pedestrian satisfaction is widely recognized as a determining factor in the success of sustainable mobility policies [19].
Therefore, local governments need to focus their economic resources on measures that increase pedestrian satisfaction in order to strengthen the relationship between satisfaction and willingness to walk. In order to define effective measures to improve user satisfaction, it is necessary to make a proper assessment of the importance that users attach to the factors that make up the street environment
This study is based on the conviction that knowledge of the dynamics of transport demand and defining a strategic intervention plan based on users' judgments are of paramount importance for national and local mobility policies aimed at curbing pollutant emissions, saving energy and improving the distribution of transport modes (to the benefit of a more sustainable socioeconomic and environmental level). Therefore, the objective of this article is to identify the attributes of the road system that have a major influence on pedestrians' judgment of road environment. It is considered that different categories of pedestrians could make different judgments.
The questions this study aims to answer are: Which of the scientifically accepted factors that influence willingness to walk are considered most important by citizens? Which of these factors actually influence pedestrian satisfaction? Are user judgments influenced by user characteristics? Answering these questions is critical before establishing policies for sustainable mobility, especially in locations that are not very walkable, as in the case study of this research.
2. Materials and Methods
This study is based on the hypothesis that the user's willingness to walk is directly related to satisfaction with the street environment, since the greater the satisfaction, the greater the probability that the user will make his trips on foot within that street environment. This hypothesis has recently been explored in the field of transport, in particular to evaluate users' willingness to use public transport [20,21] or bike sharing services [19].
The researches highlight that satisfaction is comparing level of expectation and perceived performance. Traditionally, satisfaction is estimated, through Importance Performance Analysis (IPA), as the product of two components: Importance of the products or services offered by and performance of organizations in providing these services [22].
Therefore, to define intervention priorities in order to increase the performance offered by the road environment, it is essential to identify the importance that users attribute to each aspect of this environment. For this reason, this study classifies the factors that can influence users' choice to walk according to their importance. The method used in this study to make this comparison is the Importance Grid (IG) based on the three-factor theory of customer satisfaction [23]. This evaluation is based on the comparison between the importance declared by the respondents and that indirectly measured. Recent studies show that using direct and indirect measures of the same value together leads to more accurate interpretations of the value itself [24]. This approach has recently been used in the field of transportation [19,25,26,27], but never to classify typical pedestrian infrastructure factors.
Many studies have shown that users' choices of transport modes are linked to their demographic characteristics [28,29]. For this reason, the analysis carried out in this study was initially carried out for the entire sample of respondents and then for the different categories of users.
2.1. Importance Grid Analysis
The importance grid analysis was developed to categorize service attributes according to customer needs. IG comes from a different interpretation of Importance Performance Analysis (IPA) based on the principle that the relationship between performance and importance is causal, i.e., any change in performance is accompanied by a change in importance. Consequently, the applicability of the original IPA must be questioned because importance changes when the performance of an attribute improves [30].
In scientific research, this analysis technique was introduced by [31], who identified factors of customer satisfaction by indicating the explicit importance and implicit weights of derived attributes in a two-dimensional importance grid. In particular, [31] proposes that by combining explicitly and implicitly derived attribute importance weights in a two dimensioned importance grid three satisfaction factors can be identified (Figure 1).
Generally, the explicit importance value is obtained by asking each interviewee to evaluate the importance of a particular element on the basis of a Likert scale and defining the average value among all respondents, while the implicit importance consists in obtaining the importance value for each item as multiple regression, structural equation modeling, or partial correlation. In this study, since the explicit importance scores were obtained using a Likert scale, it was considered appropriate to use an optimal scaling regression to evaluate the implicit importance scores. Namely, the optimal scaling regression performs a quantification of a qualitative variable expressed on an ordinal scale. In the quantification process, an optimal procedure associates the categories of the variable with values that have numerical properties and thus can be subjected to quantitative statistical techniques. In particular, in the case of ordinal variables, the original order of the categories is maintained even after quantification. There are many statistical techniques that can be considered as optimal scaling. In this study, we chose the CATREG technique (categorical regression with optimal scaling using alternating least squares). In the CATREG approach, each value of a variable can be considered as a category, the categories being labels for nominal variables, rank numbers for ordinal variables, and values for continuous variables. This technique quantifies categorical variables, including the response variable, simultaneously optimizing the multiple regression coefficient.
Furthermore, in order to insert the values within the GI, the average declared importance scores were normalized, so as to always have values between 0 and 1. The mean or median of the weights of both importances is used to identify the 4 quadrants into which the IG is divided.
In this study, the three-factor theory of [31] has been readapted in order to define the factors that most influence the choice of road users to walk. As quality of service attributes fall into three categories, as defined by [31], factors influencing road users' willingness to walk can also be ranked in the same way using the importance grid. In particular, they are:
- Basic factors: these are minimum requirements that cause dissatisfaction if not fulfilled but do not lead to user satisfaction if fulfilled or exceeded. That is, those factors that the user expects to find, and not finding them would generate dissatisfaction. The user regards the basic factors as prerequisites, he takes them for granted and therefore does not explicitly demand them. Therefore, these factors must always be provided.
- Performance factors: these factors lead to satisfaction if fulfilled or exceeded and lead to dissatisfaction if not fulfilled. Performance factors are characterized by a linear relationship between their presence and the user's willingness to walk. Therefore, the higher the performance of these factors on the road environment, the greater the user's willingness to walk. They are divided into important factors and irrelevant factors according to their position in the Importance grid. Governments must focus their resources on increasing these factors, especially the important ones.
- Excitement factors: these are the factors that increase user's willingness to walk if present but do not reduce user's willingness if they are not present. The excitement factors are those that the user does not expect and, when they are provided, give rise to a lot of appreciation (the relationship between fulfillment and satisfaction, in this case, is exponential). Therefore, the Governments must focus on the performance of these factors only after having guaranteed those of the performance factors.
2.2. Data collection
Both the direct and indirect measurement of the importance that users attribute to certain aspects of the street environment on their willingness to walk is based on responses to a specially designed questionnaire. A questionnaire was specially designed after a careful review of the literature. A total of 25 attributes were identified to evaluate their influence on users’ willingness to walk (Table 1). According to the hierarchy of walking needs proposed by previous studied [32,33], in this paper, the walkability attributes were classified into four principal factors relating to pedestrian path: physical characteristics, comfort, safety and attractiveness.
The questionnaire was structured on Google Forms and consisted of a set of multiple-choice questions divided into two sections. The first aimed at collecting personal information, such as gender, age, employment, means of transport mainly used and number of inhabitants of the place of residence (5 questions). The second part asked to evaluate the attributes presented in Table 1 (24 questions) For the questions of the second part to the participants were asked to rank the influence of each attribute on their willingness to walk by using a five-point Likert scale, ranging from 1 (high unwillingness) to 5 (high willingness).
3. Results
3.1. Sample Description
The online questionnaire has been posted on the DICAr website (the site of the Civil Engineering and Architecture Department of the University of Catania) and it was advertised through social media. All responses to the questionnaire were anonymous.
A sample of 562 respondents to the online questionnaire was obtained. In Table 2 the main sample’s socio-demographic characteristics are reported. Respondents are divided almost equally between males and females, with a very slight prevalence of males (51,25%) and most of them are between 21 and 35 years old (41,99%). Only a small part of the respondents (27,76) lives in a big city (population greater than 50,000).
3.2. Analysis
To determine the statistical significance of the sample, the data set from the online questionnaire was subjected to a factorial ANOVA test. Table 3 shows the results of the analysis of variance for the total sample of respondents and for the subgroups in terms of categories of respondents (male/female and age groups). In all ANOVA tests, the dependent variable is consistently the respondents' willingness to walk, while the independent variables are the factors that the respondents were asked to evaluate.
The results of the ANOVA tests show that all samples are statistically significant (p < 0.005), i.e., consist of independent observations. This allows to continue the study by performing the analysis for the total sample as well as for all considered categories of respondents.
The first step in analyzing the data derived from the questionnaire was to evaluate the average values of explicit importance for each factor, considering first the total sample of respondents and then the individual categories of respondents. The average importance values obtained in this way are shown in Tab.4.

Table 4.
Average values of explicit importance.
| Total | Men | Women | Age0 | Age1 | Age2 | Age3 | |
|---|---|---|---|---|---|---|---|
| PC1 | 0.701 | 0.689 | 0.714 | 0.659 | 0.682 | 0.732 | 0.773 |
| PC2 | 0.722 | 0.712 | 0.734 | 0.675 | 0.686 | 0.750 | 0.852 |
| PC3 | 0.744 | 0.722 | 0.766 | 0.722 | 0.697 | 0.790 | 0.841 |
| PC4 | 0.513 | 0.503 | 0.524 | 0.464 | 0.485 | 0.612 | 0.534 |
| PC5 | 0.568 | 0.578 | 0.557 | 0.552 | 0.551 | 0.576 | 0.625 |
| C1 | 0.680 | 0.665 | 0.695 | 0.631 | 0.669 | 0.728 | 0.716 |
| C2 | 0.676 | 0.681 | 0.672 | 0.623 | 0.661 | 0.674 | 0.795 |
| C3 | 0.748 | 0.726 | 0.772 | 0.683 | 0.739 | 0.772 | 0.835 |
| C4 | 0.754 | 0.760 | 0.748 | 0.734 | 0.767 | 0.737 | 0.773 |
| C5 | 0.688 | 0.672 | 0.704 | 0.651 | 0.686 | 0.710 | 0.716 |
| C6 | 0.739 | 0.708 | 0.772 | 0.675 | 0.750 | 0.799 | 0.727 |
| C7 | 0.839 | 0.816 | 0.863 | 0.798 | 0.850 | 0.853 | 0.852 |
| S1 | 0.548 | 0.536 | 0.560 | 0.524 | 0.536 | 0.594 | 0.557 |
| S2 | 0.736 | 0.724 | 0.748 | 0.710 | 0.712 | 0.786 | 0.773 |
| S3 | 0.682 | 0.667 | 0.699 | 0.647 | 0.665 | 0.723 | 0.727 |
| S4 | 0.609 | 0.613 | 0.606 | 0.611 | 0.595 | 0.656 | 0.585 |
| S5 | 0.593 | 0.590 | 0.597 | 0.583 | 0.581 | 0.616 | 0.614 |
| S6 | 0.593 | 0.580 | 0.606 | 0.567 | 0.591 | 0.620 | 0.602 |
| S7 | 0.765 | 0.745 | 0.786 | 0.738 | 0.748 | 0.826 | 0.773 |
| S8 | 0.731 | 0.710 | 0.754 | 0.714 | 0.737 | 0.759 | 0.705 |
| A1 | 0.712 | 0.667 | 0.759 | 0.659 | 0.710 | 0.746 | 0.750 |
| A2 | 0.812 | 0.790 | 0.836 | 0.786 | 0.824 | 0.839 | 0.784 |
| A3 | 0.681 | 0.658 | 0.704 | 0.635 | 0.686 | 0.746 | 0.648 |
| A4 | 0.794 | 0.757 | 0.832 | 0.726 | 0.805 | 0.817 | 0.830 |
| Mean | 0.693 | 0.678 | 0.709 | 0.657 | 0.684 | 0.727 | 0.724 |
As described in Section 2.1, the implicit importance was calculated using CATREG-type optimal scaling regression. In particular, zero-order correlations were considered, i.e., those between the transformed independent variables and the transformed dependent variable. The implicit importance values obtained in this way are listed in Table 5.
3.3. Factors classification based on IG
Once the explicit importance and implicit importance values are known, it is possible to classify the factors that may influence users' decision to walk, identified in Table 1, using Importance Grids (IG), according to the theory of three factors. The average values of the two importance factors were used to classify the 4 quadrants of the Importance Grid. The following figures show the Importance Grids for each user category considered.
Figure 2 shows that about 80% of the factors considered fell into the quadrants representing the performance factors, with the important performance factors minimally outweighing the unimportant factors. Among the performance factors, good artificial lighting system of the path (C7) and the high artistic / landscape value of the streetscape (A2) were the most important for the entire sample. On the other hand, the least relevant aspect is the reduced slope of the path (PC4). Only 3 aspects are classified as basic factors and 2 are excitement factors.
The distribution of points on IG reflects a pronounced linear relationship between the explicit importance and implicit importance scores for all factors. This means that there are no points near the vertices top left (Excitement Factors) and bottom right (Basic Factors). Therefore, no factor was perceived as particularly exciting and none was highly expected by users (Basic factors).
Even for the items that characterize the user category "gender", the majority of factors (83%) fall into the quadrants that represent the “Performance Factors” (Figure 3). Moreover, similar to IG for the whole sample, there are linear relationships between the explicit and implicit importance scores for all factors in both graphs. In addition, the absence of points near the outer corners of the quadrants is noted in both the lower right and upper left.
Figure 4 shows the Importance Grids (IG) for the four items in the "age" category. Respondents in age group 3 (> 65 years) indicate the highest number of important performance factors and no basic factors. In addition, the unimportant performance factors for this user category do not follow the typical linear trend. In other words, this suggests that these users lack a true awareness of the factors that fall in the lower left quadrant.
4. Discussion
The following subsections discuss the classifications within the three factors identified as influential on users' willingness to walk, divided into the four main categories (Physical Characteristics, Comfort, Safety, and Attractiveness) into which they were categorized.
4.1. Physical Characteristics
From the entirety of the respondents, it appears that the adequate width of the sidewalk and the good condition of the sidewalk surface are considered as “Basic Factors”. These factors are those that pedestrians expect to encounter on their routes and therefore do not significantly increase their willingness to walk. The only factor from the physical characteristics of the sidewalk" category that has an impact on users' willingness to walk is the continuity of the sidewalk, although it is relatively close to the average importance scores and has no particular influence. None of the factors in this category are considered "Excitement factors”, i.e., factors that users do not expect and that, when present, significantly increase their satisfaction with walking.
When comparing the gender-specific diagrams (Figure 3), it is noticeable that there is no difference in the judgments of men and women about the physical characteristics of the sidewalk. The lack of a consistent gender difference in participation in walking for transportation was previously demonstrated in [56]. However, when analyzing the subgroups of the sample based on gender, the only difference compared to the analysis of the entire sample relates to the rating of PC2 (adequate sidewalk width), which serves as a positive influencing factor for both men and women.
Figure 4 shows that the four respondent groups, differentiated by age, assign different importance to the elements of the Physical Characteristics of the path category. Consistent with [57], all respondents agree that the longitudinal slope of the path is insignificant. Nevertheless, the first three age groups (in ascending order of age) also consider PC5, the absence of driveways, to be unimportant. For the older respondents, however, this factor is a source of excitement. This result is consistent with the findings of a study by [58], which reported that older pedestrians are more affected by accidents at driveways. Furthermore, older pedestrians represent the user category for whom elements related to the physical characteristics of pedestrian paths have the greatest influence on their willingness to walk.
4.2. Comfort
Of the factors in this category, four out of seven are considered significantly influential on their willingness to walk by all subgroups of respondents. In addition, for the total sample and the subgroups represented by women, elderly, and young people aged 21 to 35, C1 (absence of obstacles on the pedestrian path) is ranked as an excitement factor.
It is noteworthy that older pedestrians do not rank any of the comfort factors as unimportant to performance and do not consider any as a fundamental factor. For this user category, five of the comfort factors are considered important to performance and two serve as excitement factors. This indicates that this user category has the highest needs in terms of pedestrian mobility. This result is consistent with numerous studies in the literature. [57] concludes that a senior-friendly city should be characterized primarily by obstacle-free sidewalks with flat, non-slip surfaces, sufficient width, and well-maintained public benches at regular intervals. While the presence of obstacles or obstructions on the pedestrian path is considered irrelevant for younger respondents, as they usually have better physical abilities than older people and can overcome obstacles more easily.
4.3. Safety
Regarding the factors that belong to the Safety category, we note that half of the factors in this category (S1, S4, S5, S6) are considered unimportant by both the total sample and both gender groups (Figure 2 and Figure 3). Factors that positively influence willingness to walk include ease of crossing at intersections (S7) and low flows of vehicular traffic (S2). Women also consider the convenience of crossing out of intersections (S8) to be an influential factor. The statement by respondents in this survey that safety issues have little influence on their willingness to walk seems to contradict numerous studies that cite pedestrian safety as one of the most important factors for walkability [59]. This can be explained in line with a study by [60], which assumes that the road environment in which pedestrians experience walking influences their judgments. In the city where this survey was conducted, the frequency of walking in daily life is low, the road safety culture is poor, and attitudes that protect or prioritize pedestrians are lacking.
The presence of speed limits for vehicular traffic (S3) is considered to be a factor that would increase the willingness to walk unconsciously, both for the total sample and separately for men and women. However, this result is not obtained when the age group analyses are considered individually; only respondents between the ages of 50 and 65 rank S3 as an Excitement Factor (EF).
When looking at the results for age-based subgroups, it is noticeable that there are five factors that are rated as irrelevant. For younger respondents, S3 is actually considered an unimportant factor. The presence of speed limits on the roadway adjacent to the pedestrian path is only consciously viewed as a positive factor influencing willingness to walk by older respondents. Due to their increased susceptibility to road accidents, older people attribute greater importance and awareness to such safety measures. In contrast, younger road users (first and second age groups) do not attach much importance to the presence of legally imposed speed limits on vehicular traffic when they decide to walk. This observation is significant because it may reflect greater confidence in their ability to safely cross streets with fast-moving traffic.
4.4. Attractiveness
The attractiveness of pedestrian paths has a positive influence on respondents' willingness to walk for almost all factors. For women and younger people, the presence of other pedestrians (A3) is a subconscious factor that positively influences their willingness. However, for men and older people, this factor is considered unimportant. These results can be justified by the fact that women and younger people associate the presence of other pedestrians with a higher level of safety around walking.
High perception of security is considered a relevant performance factor by all subgroups in the sample, which is consistent with many studies in the literature showing that this factor is more important for women [61,62].
In contrast, older people indicate that the presence of other pedestrians does not influence their decision to walk, while they consider all other factors related to the attractiveness of the path to be relevant [7,63]. This may be due to several factors. First, older people may have different priorities and considerations when it comes to walking. They may place more importance on factors such as the quality of the path, its maintenance, and amenities such as seating and shade, which directly affect their comfort and overall walking experience. Second, older people may have more experience and confidence in navigating pedestrian environments, which could lead them to pay less attention to the presence of other pedestrians. They may rely on their own judgment and confidence when it comes to managing potential safety risks because they have developed increased awareness and personal safety practices over the years. In addition, older people may have a more structured and predictable daily routine, which means they are less influenced by the variable factor of encountering other pedestrians along the way. They may have set times for their walks or specific routes they prefer, which may reduce the importance of the presence of others in their decision-making process.
5. Conclusions
This study is based on the three-factor theory of user satisfaction that contradicts the traditional view that the relative factors importance is adequately represented as a point estimate. Instead, it must be evaluated based on user satisfaction.
This theory defines an importance hierarchy: basic factors have to be identified and fulfilled; they are of utmost relevance if delivered at an unsatisfactory level but do not effect satisfaction if their performance is high. The opposite is true for excitement factors. Performance factors both influence satisfaction and dissatisfaction depending on their performance level.
To answer the research questions posed in this study, an online survey was conducted, and the data collected was processed and presented in an Importance Grid. The main findings of this study are as follows:
- ➢
- In the realm of Physical Characteristics, factors such as sidewalk width and surface condition are considered "Basic Factors." They are expected and don't significantly boost willingness to walk. However, sidewalk continuity, though not a dominant influence, does affect willingness. Gender-based differences in judgments are notably absent in this regard.
- ➢
- Comfort factors, on the other hand, assume significance. Among them, the absence of obstacles on pedestrian paths stands out as an excitement factor. This is especially pronounced among older pedestrians, highlighting their higher mobility needs.
- ➢
- When it comes to Safety, it's intriguing to note that half of the factors in this category are perceived as factors of irrelevant importance by both the total sample and gender-based subgroups. Yet, ease of intersection crossing and low vehicular traffic flow are positively linked to willingness to walk. The significance of pedestrian safety varies, influenced by the walking culture and road safety attitudes prevalent in the survey location.
- ➢
- The Attractiveness of pedestrian paths, in general, amplifies willingness to walk. For women and younger individuals, the presence of other pedestrians contributes positively, as it's associated with heightened security. Contrarily, this factor is deemed unimportant by men and older pedestrians, who emphasize the relevance of other attractiveness factors.
In sum, this study aligns with the three-factor theory of user satisfaction, emphasizing the need to intervene on the factors that users consider to be of greatest importance to enhance the walking experience. In particular, the following implications emerge that the urban network manager must implement: verify that all the basic factors are satisfied, intervene on the relevant performance factors and satisfy the excitation factors if he still has resources available. The insights are invaluable for urban planning and pedestrian infrastructure development, especially to cater to the diverse needs and expectations of pedestrians across different age groups and genders in order to encourage walking.
Author Contributions
Conceptualization, N.D. and S.L.; methodology, N.D. and S.L.; software, N.D. and S.L.; validation, S.L.; formal analysis, N.D.; investigation, N.D. and S.L.; resources, N.D. and S.L.; data curation, S.L.; writing—original draft preparation, N.D. and S.L.; writing—review and editing, N.D. and S.L.; visualization, N.D.; supervision, S.L. All authors have read and agreed to the published version of the manuscript.
Funding
This research received no external funding.
Institutional Review Board Statement
Not applicable to this study because effects on humans are essentially nonexistent.
Informed Consent Statement
Not applicable to this study because no subjects were involved in the research trials.
Data Availability Statement
No new data has been created.
Conflicts of Interest
The authors declare no conflict of interest.
References
- Anciaes, P.; Jones, P. Transport policy for liveability – Valuing the impacts on movement, place, and society. Transp. Res. A: Policy Pract. 2020, 132, 157–173. [Google Scholar] [CrossRef]
- Aldred, R.; Croft, J. Evaluating active travel and health economic impacts of small streetscape schemes: An exploratory study in London. J. Transp. Health. 2019, 12, 86–96. [Google Scholar] [CrossRef]
- Larrañaga, A. M.; Rizzi, L. I.; Arellana, J.; Strambi, O.; Cybis, H. B. B. The influence of built environment and travel attitudes on walking: A case study of Porto Alegre, Brazil. Int. J. Sustain. Transp. 2016, 10, 332–342. [Google Scholar] [CrossRef]
- Frank, L. D.; Sallis, J. F.; Saelens, B. E.; Leary, L.; Cain, K.; Conway, T. L.; Hess, P. M. The development of a walkability index: application to the Neighborhood Quality of Life Study. Br. J. Sports Med. 2010, 44, 924–933. [Google Scholar] [CrossRef] [PubMed]
- Salazar Miranda, A.; Fan, Z.; Duarte, F.; Ratti, C. Desirable streets: Using deviations in pedestrian trajectories to measure the value of the built environment. Comput. Environ. Urban Syst. 2021, 86, 101563. [Google Scholar] [CrossRef]
- Montella, A.; Chiaradonna, S.; Mihiel, A. C. d. S.; Lovegrove, G.; Nunziante, P.; Rella Riccardi, M. Sustainable Complete Streets Design Criteria and Case Study in Naples, Italy. Sustainability (Basel, Switzerland) 2022, 14, 13142. [Google Scholar] [CrossRef]
- Distefano, N.; Pulvirenti, G.; Leonardi, S. Neighbourhood walkability: Elderly's priorities. Res. Transp. Bus. Manag. 2021, 40, 100547. [Google Scholar] [CrossRef]
- Bentley, R.; Blakely, T.; Kavanagh, A.; Aitken, Z.; King, T.; McElwee, P.; Giles-Corti, B.; Turrell, G. A Longitudinal Study Examining Changes in Street Connectivity, Land Use, and Density of Dwellings and Walking for Transport in Brisbane, Australia. Environ. Health Persp. 2018, 126, 057003. [Google Scholar] [CrossRef] [PubMed]
- Nosal Hoy, K.; Puławska-Obiedowska, S. The Travel Behaviour of Polish Women and Adaptation of Transport Systems to Their Needs. Sustainability (Basel, Switzerland) 2021, 13, 2693. [Google Scholar] [CrossRef]
- Montoya-Robledo, V.; Escovar-Álvarez, G. Domestic workers’ commutes in Bogotá: Transportation, gender and social exclusion. Transp. Res. A: Policy Pract. 2020, 139, 400–411. [Google Scholar] [CrossRef]
- Hillnhütter, H. Stimulating urban walking environments – Can we measure the effect? Environ. Plan. B: Urban Anal. City Sci. 2022, 49, 275–289. [Google Scholar] [CrossRef]
- Ribeiro, A. I.; Hoffimann, E. Development of a Neighbourhood Walkability Index for Porto Metropolitan Area. How Strongly Is Walkability Associated with Walking for Transport? Int. J. Environ. Res. Public Health. 2018, 15, 2767. [Google Scholar] [CrossRef] [PubMed]
- Wey, W.; Huang, J. Urban sustainable transportation planning strategies for livable City's quality of life. Habitat Int. 2018, 82, 9–27. [Google Scholar] [CrossRef]
- Almatar, K. M. Towards sustainable green mobility in the future of Saudi Arabia cities: Implication for reducing carbon emissions and increasing renewable energy capacity. Heliyon 2023, 9, e13977. [Google Scholar] [CrossRef] [PubMed]
- Wang, H.; Yang, Y. Neighbourhood walkability: A review and bibliometric analysis. Cities 2019, 93, 43–61. [Google Scholar] [CrossRef]
- Van Dyck, D.; Veitch, J.; De Bourdeaudhuij, I.; Thornton, L.; Ball, K. Environmental perceptions as mediators of the relationship between the objective built environment and walking among socio-economically disadvantaged women. Int. J. Behav. Nutr. Phys. Act. 2013, 10, 108. [Google Scholar] [CrossRef] [PubMed]
- Forsyth, A. What is a walkable place? The walkability debate in urban design. Urban Des. Int. 2015, 20, 274–292. [Google Scholar] [CrossRef]
- Sisiopiku, V. P.; Akin, D. Pedestrian behaviors at and perceptions towards various pedestrian facilities: an examination based on observation and survey data. Transp. Res. F: Traffic Psychol. 2003, 6, 249–274. [Google Scholar] [CrossRef]
- Julio, R.; Monzon, A.; Susilo, Y. O. Identifying key elements for user satisfaction of bike-sharing systems: a combination of direct and indirect evaluations. Transportation (Dordrecht) 2022. [Google Scholar] [CrossRef]
- Echaniz Beneitez, E.; Ho, C. Q.; Dell´Olio, L.; Rodríguez Gutiérrez, A. ; Universidad de Cantabria Comparing best-worst and ordered logit approaches for user satisfaction in transit services. 2019. [CrossRef]
- Fang, D.; Xue, Y.; Cao, J.; Sun, S. Exploring satisfaction of choice and captive bus riders: An impact asymmetry analysis. Transp. Res. D Transp. Environ. 2021, 93, 102798. [Google Scholar] [CrossRef]
- Martilla, J. A.; James, J. C. Importance-Performance Analysis. J. Mark. 1977, 41, 77–79. [Google Scholar] [CrossRef]
- Kano, N.; Seraku, N.; Takahashi, F.; Tsuji, S. Attractive Quality and Must-Be Quality. Qual. Eng. J. Jpn. Soc. Qual. Control. 1984, 14, 147–156. [Google Scholar] [CrossRef] [PubMed]
- Danioni, F.; Coen, S.; Rosnati, R.; Barni, D. The relationship between direct and indirect measures of values: Is social desirability a significant moderator? Rev. Eur. Psychol. Appl. 2020, 70, 100524. [Google Scholar] [CrossRef]
- Wu, X.; Cao, J.; Huting, J. Using three-factor theory to identify improvement priorities for express and local bus services: An application of regression with dummy variables in the Twin Cities. Transp. Res. Part A Policy. Pract. 2018, 113, 184–196. [Google Scholar] [CrossRef]
- Zhang, C.; Cao, X.; Nagpure, A.; Agarwal, S. Exploring rider satisfaction with transit service in Indore, India: an application of the three-factor theory. Transp. Lett. 2019, 11, 469–477. [Google Scholar] [CrossRef]
- Cao, J.; Cao, X. Comparing importance-performance analysis and three-factor theory in assessing rider satisfaction with transit. J. Transp. Land Use 2017, 10, 837–854. [Google Scholar] [CrossRef]
- Obregón-Biosca, S. A. Choice of transport in urban and periurban zones in metropolitan area. J. Transp. Geogr. 2022, 100, 103331. [Google Scholar] [CrossRef]
- Tatum, K.; Parnell, K.; Cekic, T. I.; Knieling, J. Driving factors of sustainable transportation: Satisfaction with mode choices and mobility challenges in oxfordshire and hamburg. Int. J. Transp. Dev. Integr. 2019, 3, 55–66. [Google Scholar] [CrossRef]
- Sampson, S. E.; Showalter, M. J. The Performance-Importance Response Function: Observations and Implications. Serv. Ind. J. 1999, 19, 1–25. [Google Scholar] [CrossRef]
- Vavra, T. G. Improving Your Measurement of Customer Satisfaction; ASQ Quality Press: La Vergne, 2001. [Google Scholar]
- Alfonzo, M. A. To Walk or Not to Walk? The Hierarchy of Walking Needs. Environ. Behav. 2005, 37, 808–836. [Google Scholar] [CrossRef]
- Abdulla, K.; Abdelmonem, M. G.; Selim, G. Understanding Walkability in the Libyan Urban Space: Policies, Perceptions and Smart Design for Sustainable Tripoli. 2016.
- Abou-Senna, H.; Radwan, E.; Mohamed, A. Investigating the correlation between sidewalks and pedestrian safety. Accid. Anal. Prev. 2022, 166, 106548. [Google Scholar] [CrossRef] [PubMed]
- Aghaabbasi, M.; Moeinaddini, M.; Zaly Shah, M.; Asadi-Shekari, Z. A new assessment model to evaluate the microscale sidewalk design factors at the neighbourhood level. J. Transp. Health. 2017, 5, 97–112. [Google Scholar] [CrossRef]
- Kang, L.; Xiong, Y.; Mannering, F. L. Statistical analysis of pedestrian perceptions of sidewalk level of service in the presence of bicycles. Transp. Res. A: Policy Pract. 2013, 53, 10–21. [Google Scholar] [CrossRef]
- Asadi-Shekari, Z.; Moeinaddini, M.; Zaly Shah, M. A pedestrian level of service method for evaluating and promoting walking facilities on campus streets. Land use policy 2014, 38, 175–193. [Google Scholar] [CrossRef]
- Arellana, J.; Saltarín, M.; Larrañaga, A. M.; Alvarez, V.; Henao, C. A. Urban walkability considering pedestrians' perceptions of the built environment: a 10-year review and a case study in a medium-sized city in Latin America. Transp. Rev. 2020, 40, 183–203. [Google Scholar] [CrossRef]
- Fonseca, F.; Papageorgiou, G.; Tondelli, S.; Ribeiro, P.; Conticelli, E.; Jabbari, M.; Ramos, R. Perceived Walkability and Respective Urban Determinants: Insights from Bologna and Porto. Sustainability (Basel, Switzerland) 2022, 14, 9089. [Google Scholar] [CrossRef]
- Ferrer, S.; Ruiz, T.; Mars, L. A qualitative study on the role of the built environment for short walking trips. Transp. Res. F: Traffic Psychol. 2015, 33, 141–160. [Google Scholar] [CrossRef]
- Zhu, M.; Sze, N. N.; Newnam, S. Effect of urban street trees on pedestrian safety: A micro-level pedestrian casualty model using multivariate Bayesian spatial approach. Accid. Anal. Prev. 2022, 176, 106818. [Google Scholar] [CrossRef]
- Troped, P. J.; Cromley, E. K.; Fragala, M. S.; Melly, S. J.; Hasbrouck, H. H.; Gortmaker, S. L.; Brownson, R. C. Development and Reliability and Validity Testing of an Audit Tool for Trail/Path Characteristics: The Path Environment Audit Tool (PEAT). J. Phys. Act. Health 2006, 3, S158–S175. [Google Scholar] [CrossRef]
- Van Eggermond, M. A. B.; Erath, A. Pedestrian and transit accessibility on a micro level. J. Transp. Land Use 2016, 9, 127–143. [Google Scholar] [CrossRef]
- Barón, L.; Otila da Costa, J.; Soares, F.; Faria, S.; Prudêncio Jacques, M. A.; Fraga de Freitas, E. Effect of Built Environment Factors on Pedestrian Safety in Portuguese Urban Areas. Appl. Syst. Innov. 2021, 4, 28. [Google Scholar] [CrossRef]
- Galanis, A.; Botzoris, G.; Eliou, N. Pedestrian road safety in relation to urban road type and traffic flow. Transp. Res. Procedia 2017, 24, 220–227. [Google Scholar] [CrossRef]
- Distefano, N.; Leonardi, S. Evaluation of the Effectiveness of Traffic Calming Measures by SPEIR Methodology: Framework and Case Studies. Sustainability (Basel, Switzerland) 2022, 14, 7325. [Google Scholar] [CrossRef]
- Ortega, E.; Martín, B. ; De Isidro, Á; Cuevas-Wizner, R. Street walking quality of the 'Centro' district, Madrid. J. Maps 2020, 16, 184–194. [Google Scholar] [CrossRef]
- Canale, S.; Distefano, N.; Leonardi, S. Comparative analysis of pedestrian accidents risk at unsignalized intersections. Balt. J. Road Bridge Eng. 2015, 10, 283–292. [Google Scholar] [CrossRef]
- Papadimitriou, E.; Lassarre, S.; Yannis, G. Human factors of pedestrian walking and crossing behaviour. Transp. Res. Procedia 2017, 25, 2002–2015. [Google Scholar] [CrossRef]
- Li, X.; Santi, P.; Courtney, T. K.; Verma, S. K.; Ratti, C. Investigating the association between streetscapes and human walking activities using Google Street View and human trajectory data. Trans. GIS 2018, 22, 1029–1044. [Google Scholar] [CrossRef]
- Adams, M. A.; Frank, L. D.; Schipperijn, J.; Smith, G.; Chapman, J.; Christiansen, L. B.; Coffee, N.; Salvo, D.; du Toit, L.; Dygrýn, J.; Hino, A. A. F.; Lai, P.; Mavoa, S.; Pinzón, J. D.; Van de Weghe, N.; Cerin, E.; Davey, R.; Macfarlane, D.; Owen, N.; Sallis, J. F. International variation in neighborhood walkability, transit, and recreation environments using geographic information systems: the IPEN adult study. Int. J. Health Geogr. 2014, 13, 43. [Google Scholar] [CrossRef] [PubMed]
- Salem, D.; Khalifa, S. I.; Tarek, S. Using Landscape Qualities to Enhance Walkability in Two Types of Egyptian Urban Communities. Civ. Eng. Archit. 2022, 10, 1798–1813. [Google Scholar] [CrossRef]
- Taleai, M.; Taheri Amiri, E. Spatial multi-criteria and multi-scale evaluation of walkability potential at street segment level: A case study of tehran. Sustain. Cities Soc. 2017, 31, 37–50. [Google Scholar] [CrossRef]
- Lizárraga, C.; Martín-Blanco, C.; Castillo-Pérez, I.; Chica-Olmo, J. Do University Students’ Security Perceptions Influence Their Walking Preferences and Their Walking Activity? A Case Study of Granada (Spain). Sustainability (Basel, Switzerland) 2022, 14, 1880. [Google Scholar] [CrossRef]
- Lucchesi, S. T.; Larranaga, A. M.; Ochoa, J. A. A.; Samios, A. A. B.; Cybis, H. B. B. The role of security and walkability in subjective wellbeing: A multigroup analysis among different age cohorts. Res. Transp. Bus. Manag. 2021, 40, 100559. [Google Scholar] [CrossRef]
- Pollard, T. M.; Wagnild, J. M. Gender differences in walking (for leisure, transport and in total) across adult life: a systematic review. BMC Public Health 2017, 17, 341. [Google Scholar] [CrossRef] [PubMed]
- Bonatto, D. d. A. M.; Alves, F. B. Application of Walkability Index for Older Adults' Health in the Brazilian Context: The Case of Vitória-ES, Brazil. Int. J. Environ. Res. Public Health 2022, 19, 1483. [Google Scholar] [CrossRef] [PubMed]
- Das, S.; Bibeka, A.; Sun, X.; Zhou, H.; Jalayer, M. Elderly Pedestrian Fatal Crash-Related Contributing Factors: Applying Empirical Bayes Geometric Mean Method. Transp. Res. Rec. 2019, 2673, 254–263. [CrossRef]
- Maisel, J. L. Impact of Older Adults’ Neighborhood Perceptions on Walking Behavior. J Aging Phys. Act. 2016, 24, 247–255. [Google Scholar] [CrossRef] [PubMed]
- Yoh, K.; Khaimook, S.; Doi, K.; Yamamoto, T. Study on influence of walking experience on traffic safety attitudes and values among foreign residents in Japan. IATSS Res. 2022, 46, 161–170. [Google Scholar] [CrossRef]
- Basu, N.; Haque, M. M.; King, M.; Kamruzzaman, M.; Oviedo-Trespalacios, O. The unequal gender effects of the suburban built environment on perceptions of security. J. Transp. Health 2021, 23, 101243. [Google Scholar] [CrossRef]
- Paydar, M.; Kamani-Fard, A.; Etminani-Ghasrodashti, R. Perceived security of women in relation to their path choice toward sustainable neighborhood in Santiago, Chile. Cities 2017, 60, 289–300. [Google Scholar] [CrossRef]
- Leonardi, S.; Distefano, N.; Pulvirenti, G. Identification of road safety measures for elderly pedestrians based on K-means clustering and hierarchical cluster analysis. Arch. Transp. 2020, 56, 107–118. [Google Scholar] [CrossRef]
Figure 1.
The Importance Grid.
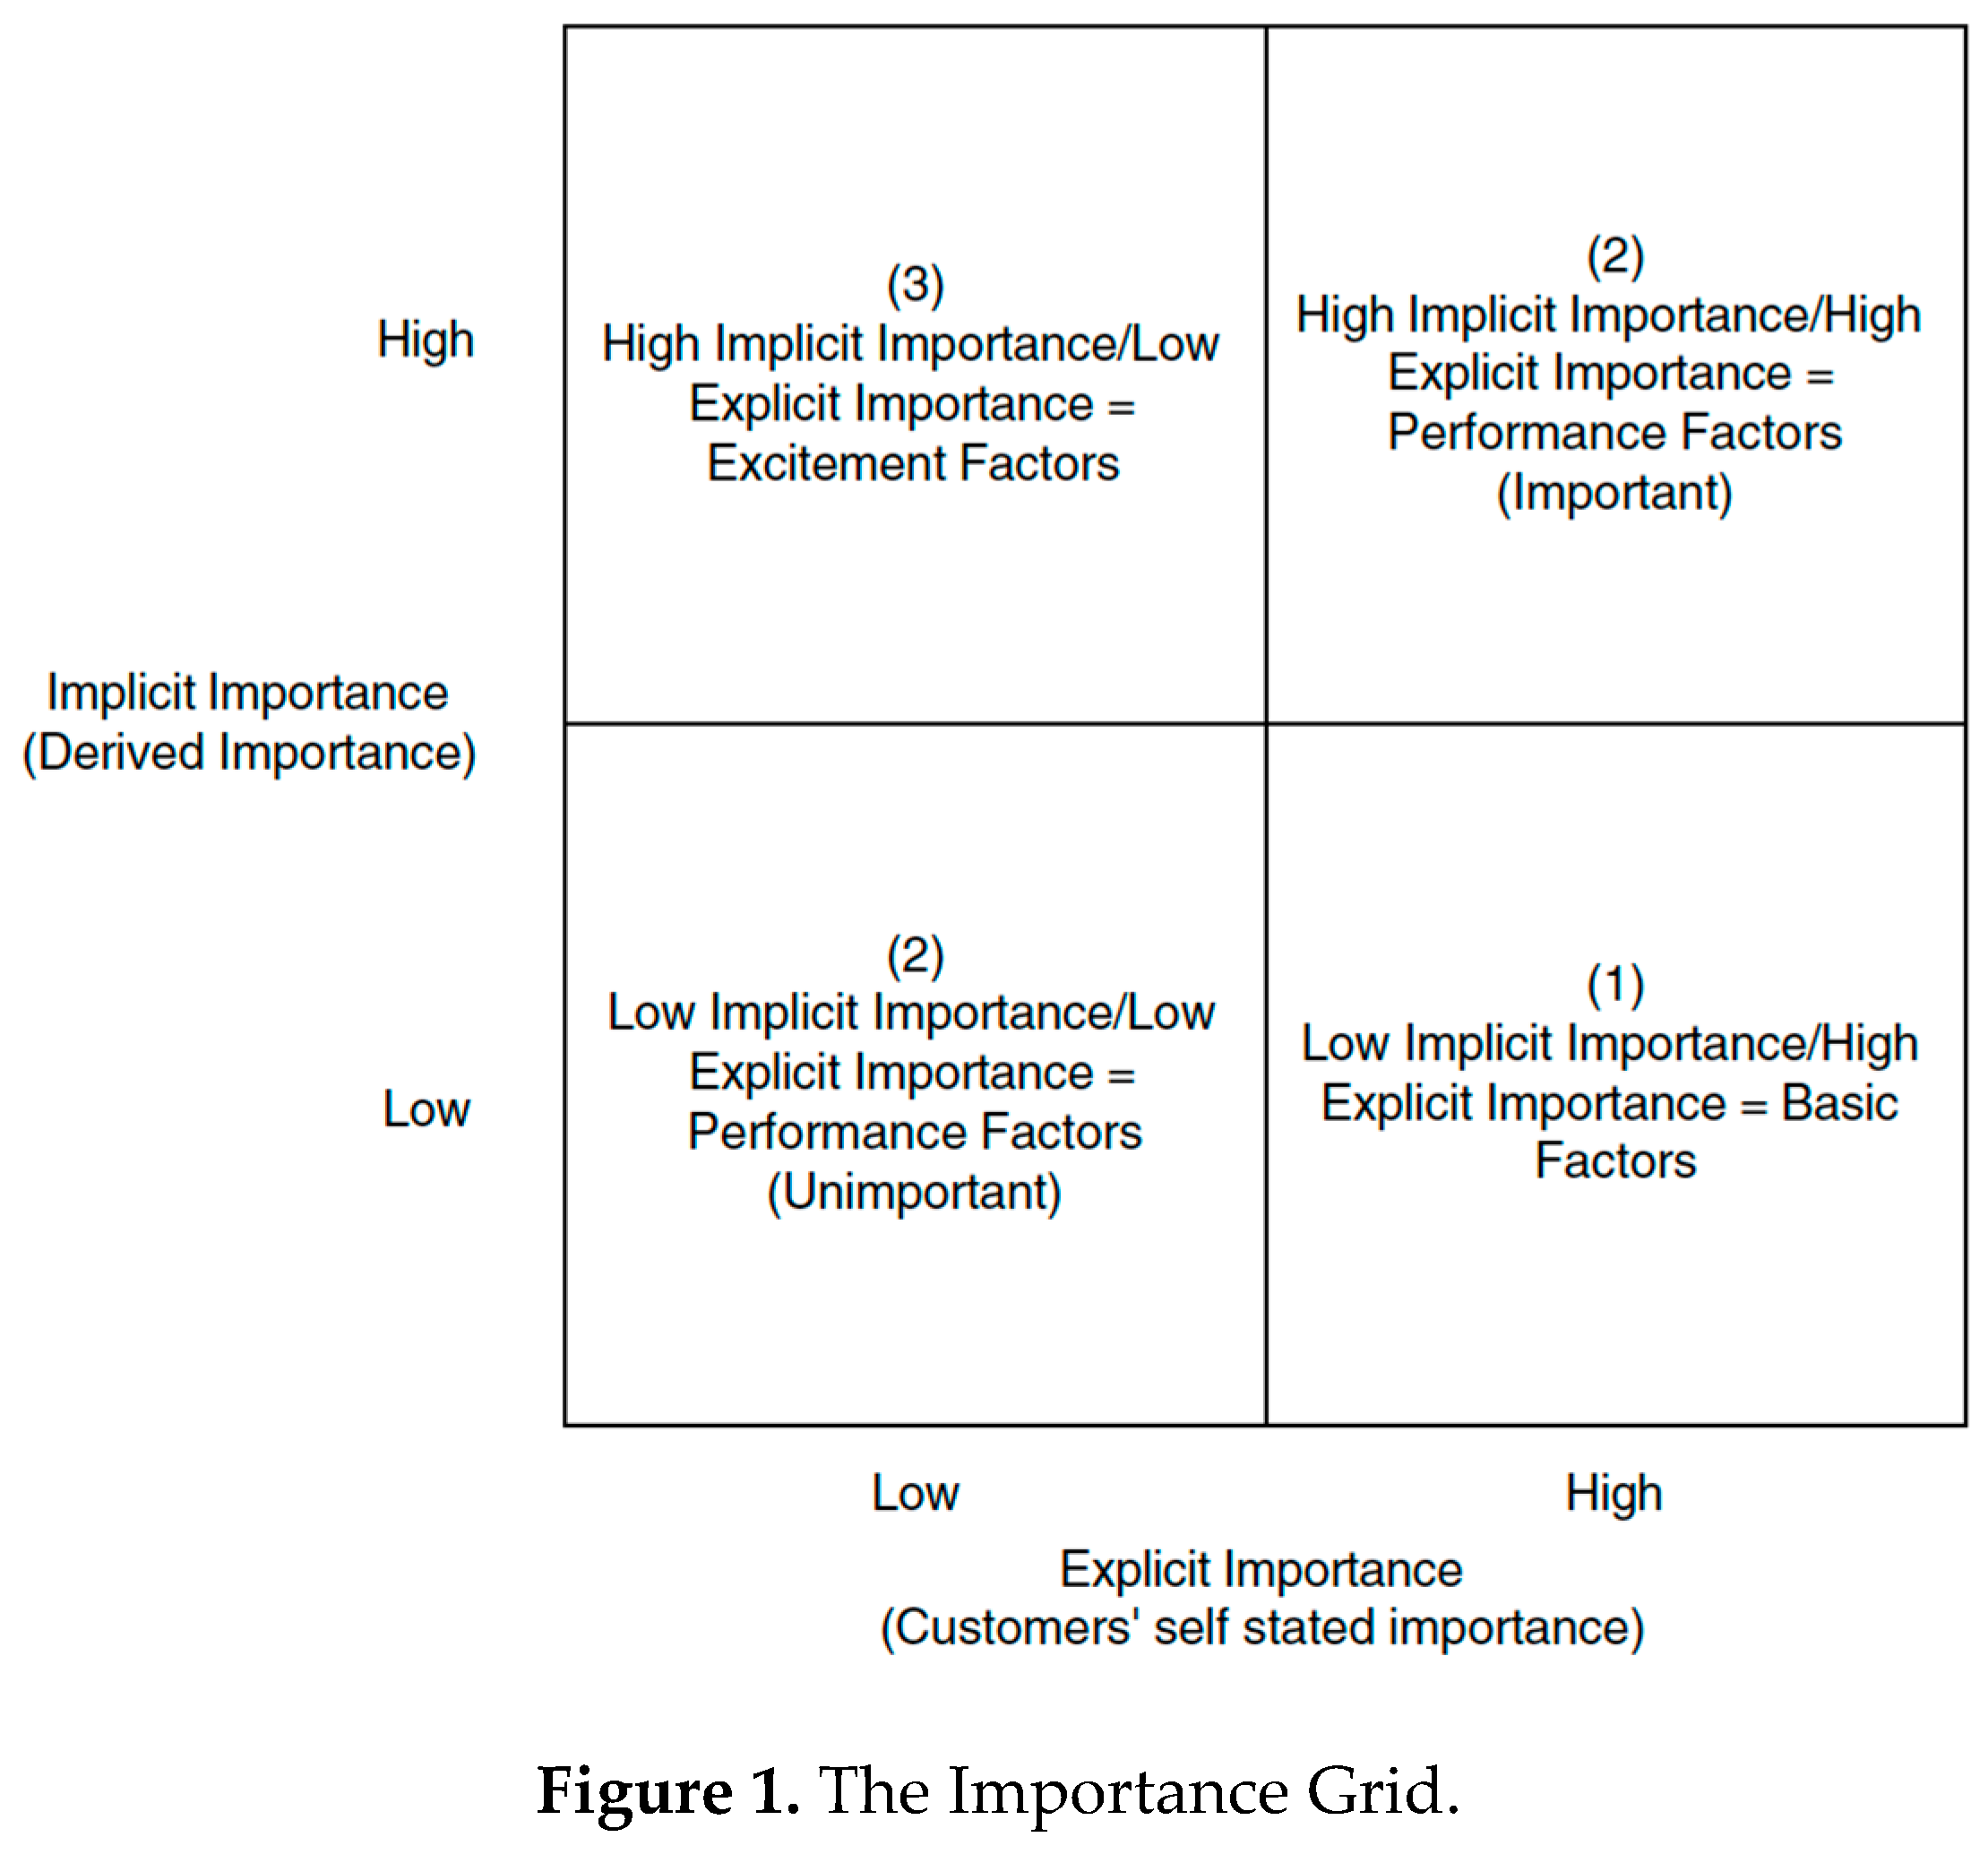
Figure 2.
Importance Grid for total number of respondents.
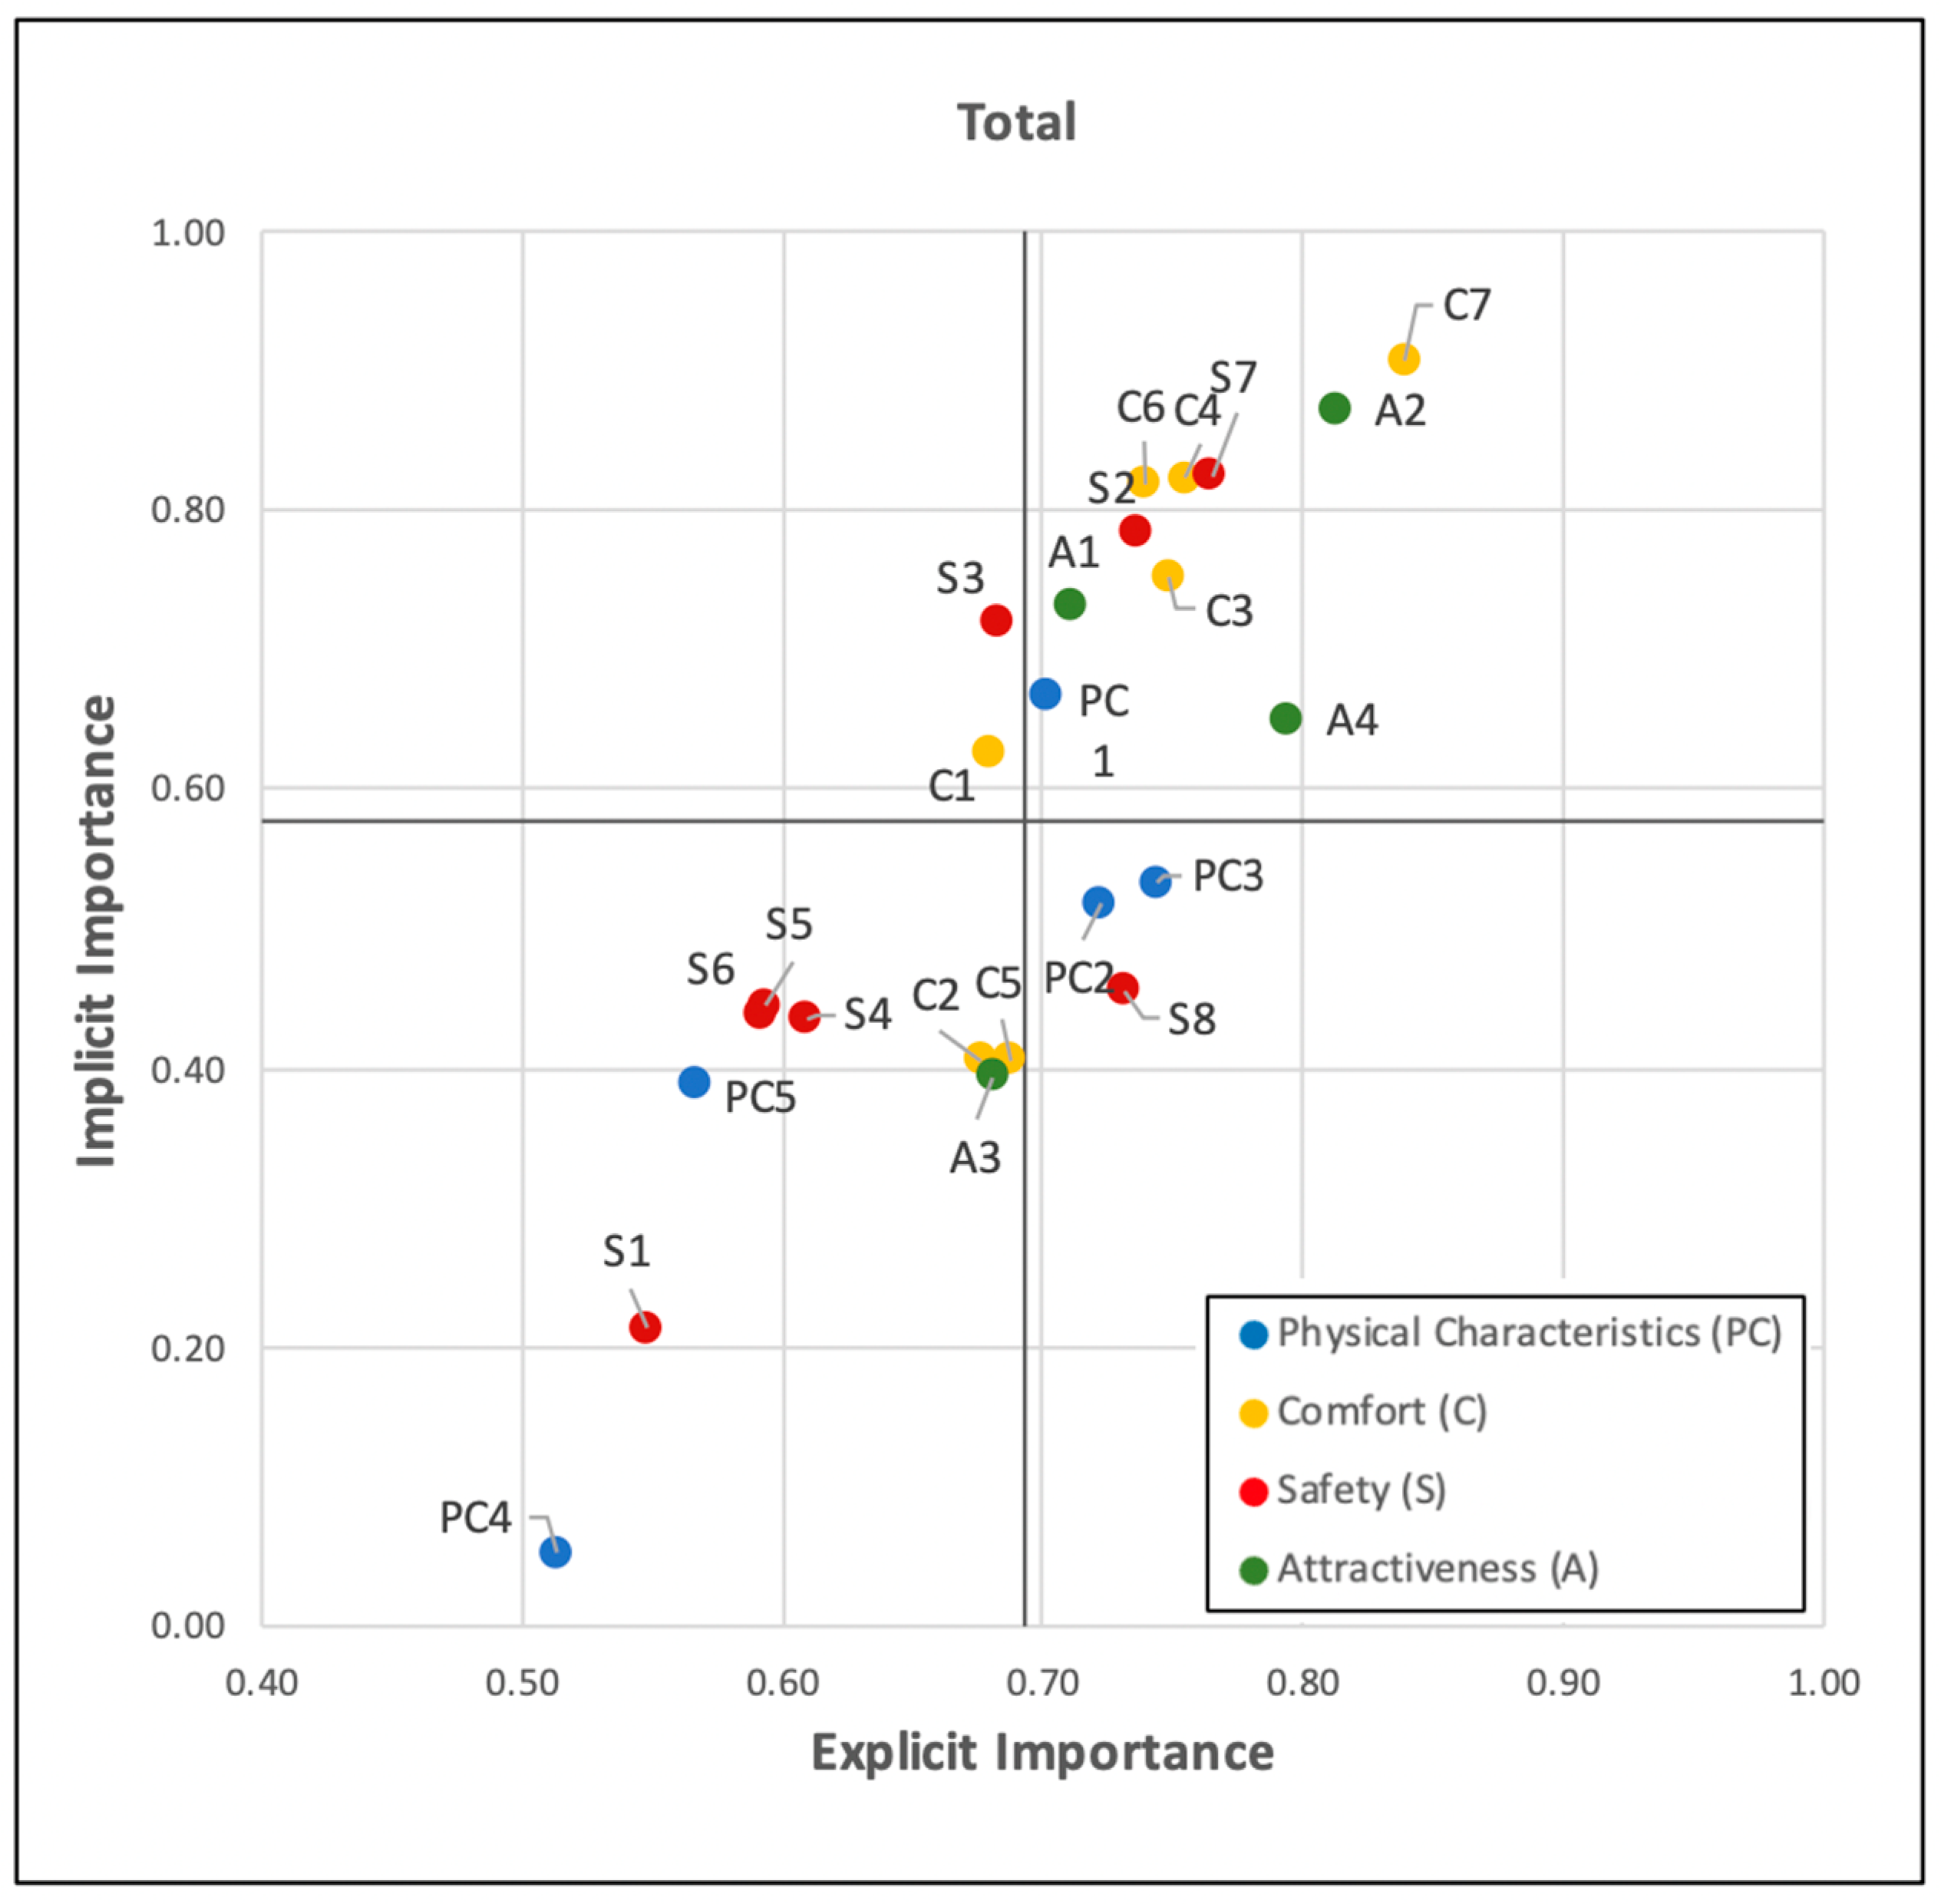
Figure 3.
Importance Grids for respondent’s gender.
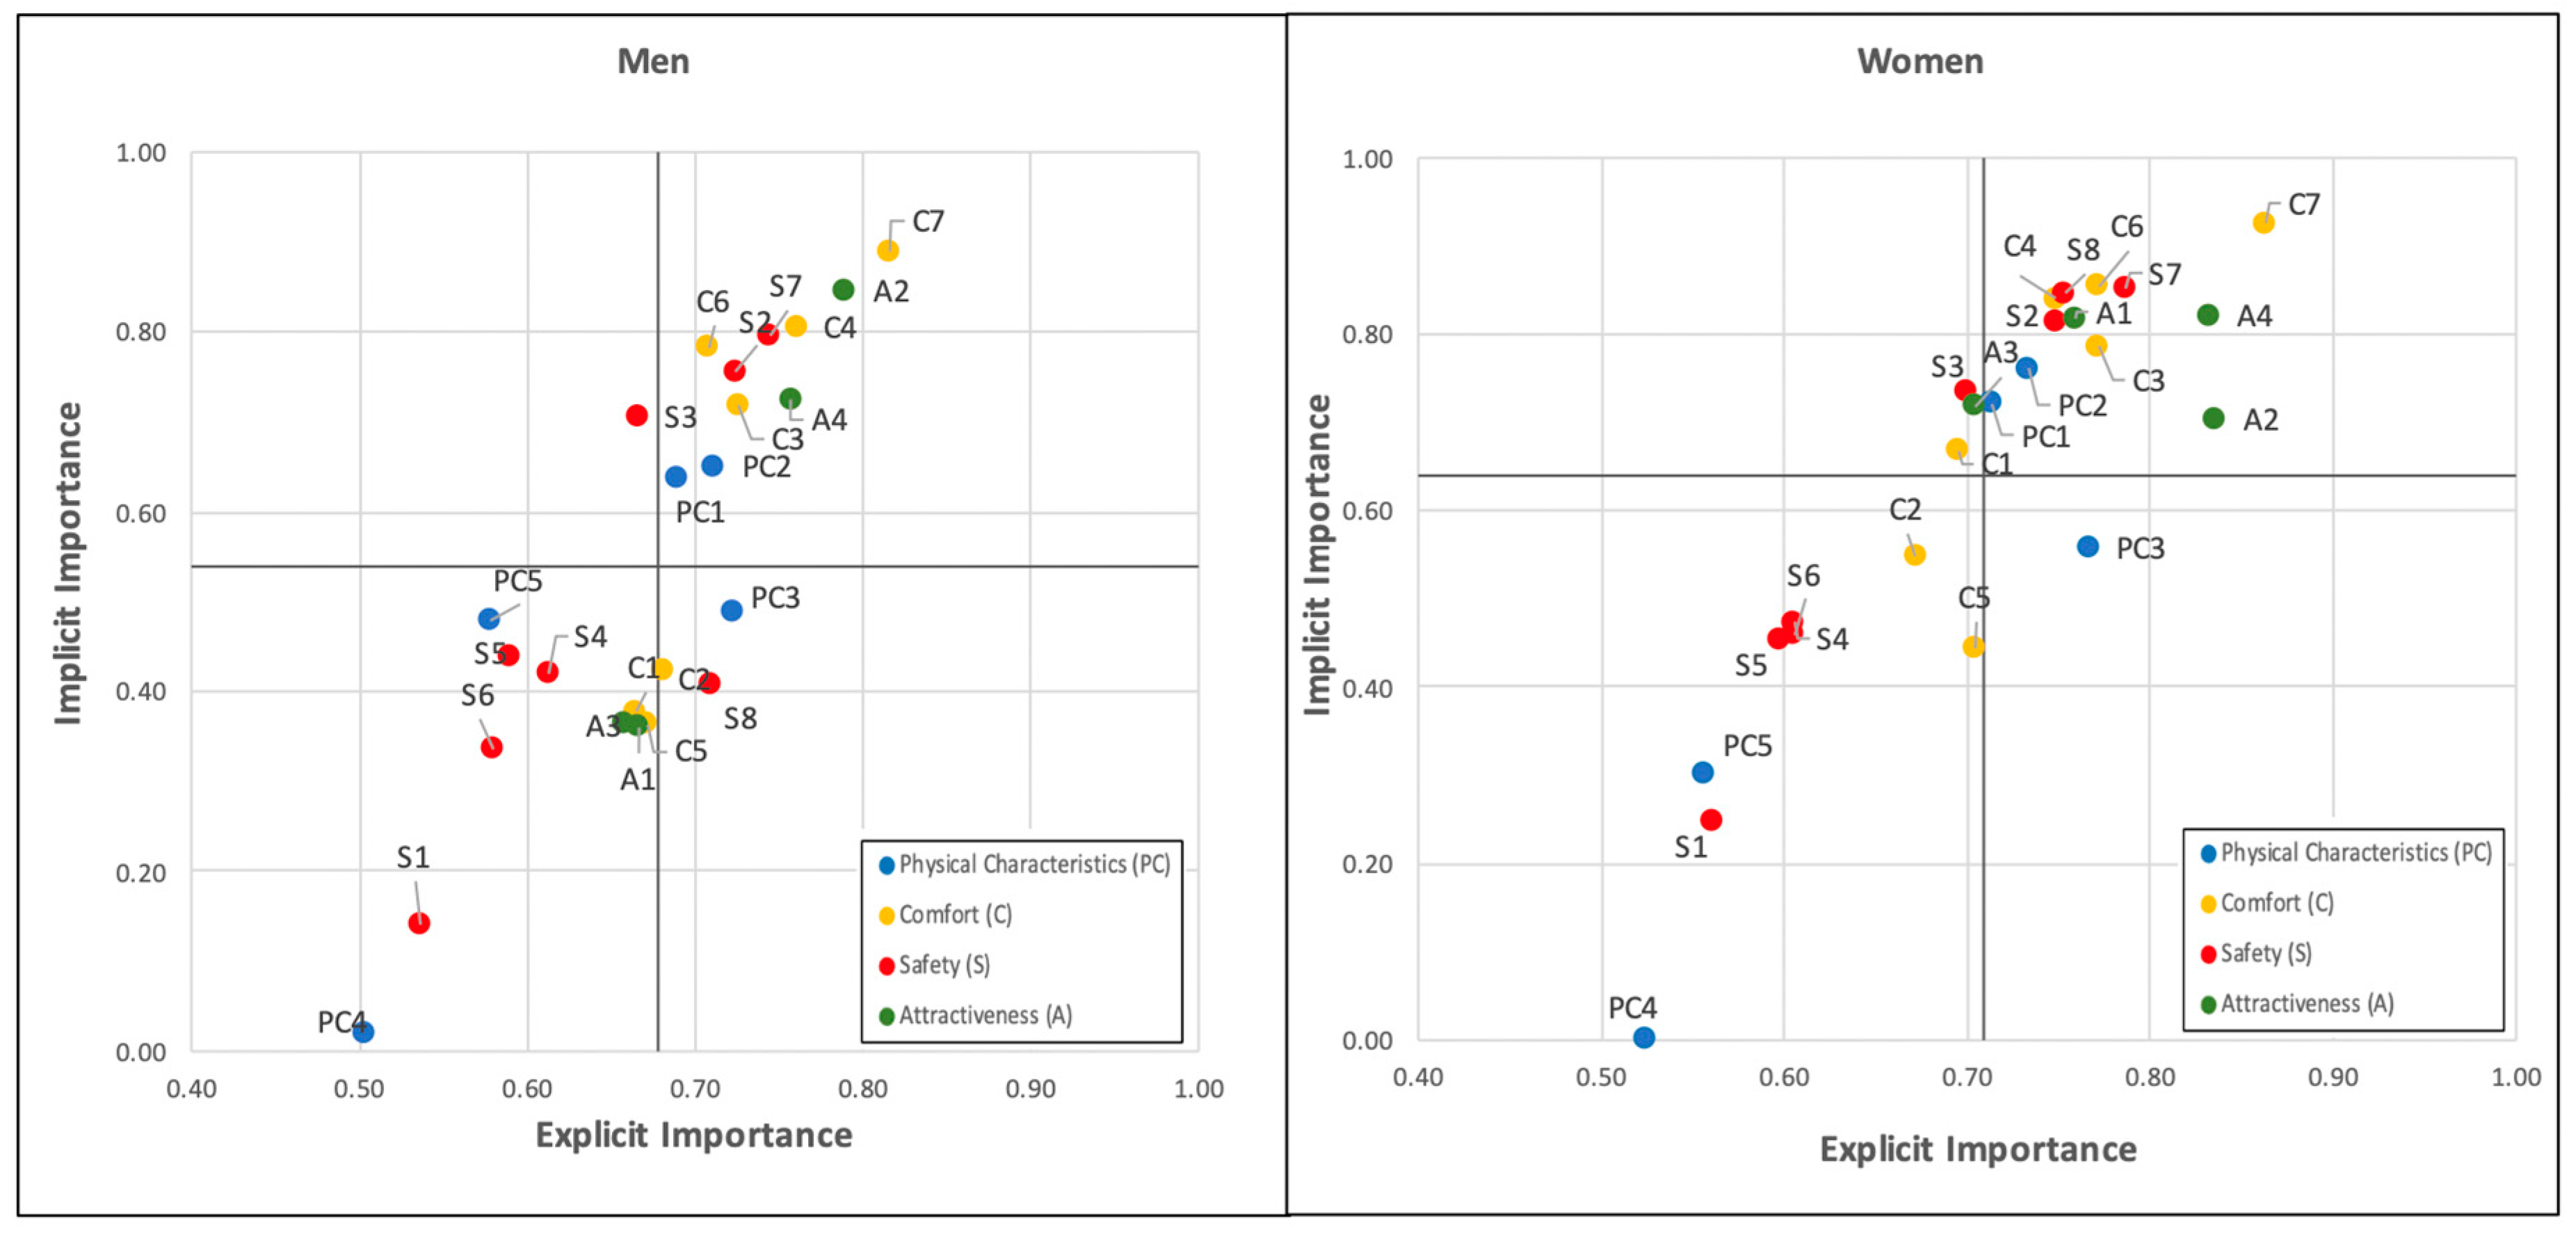
Figure 4.
Importance Grids for respondent’s age.
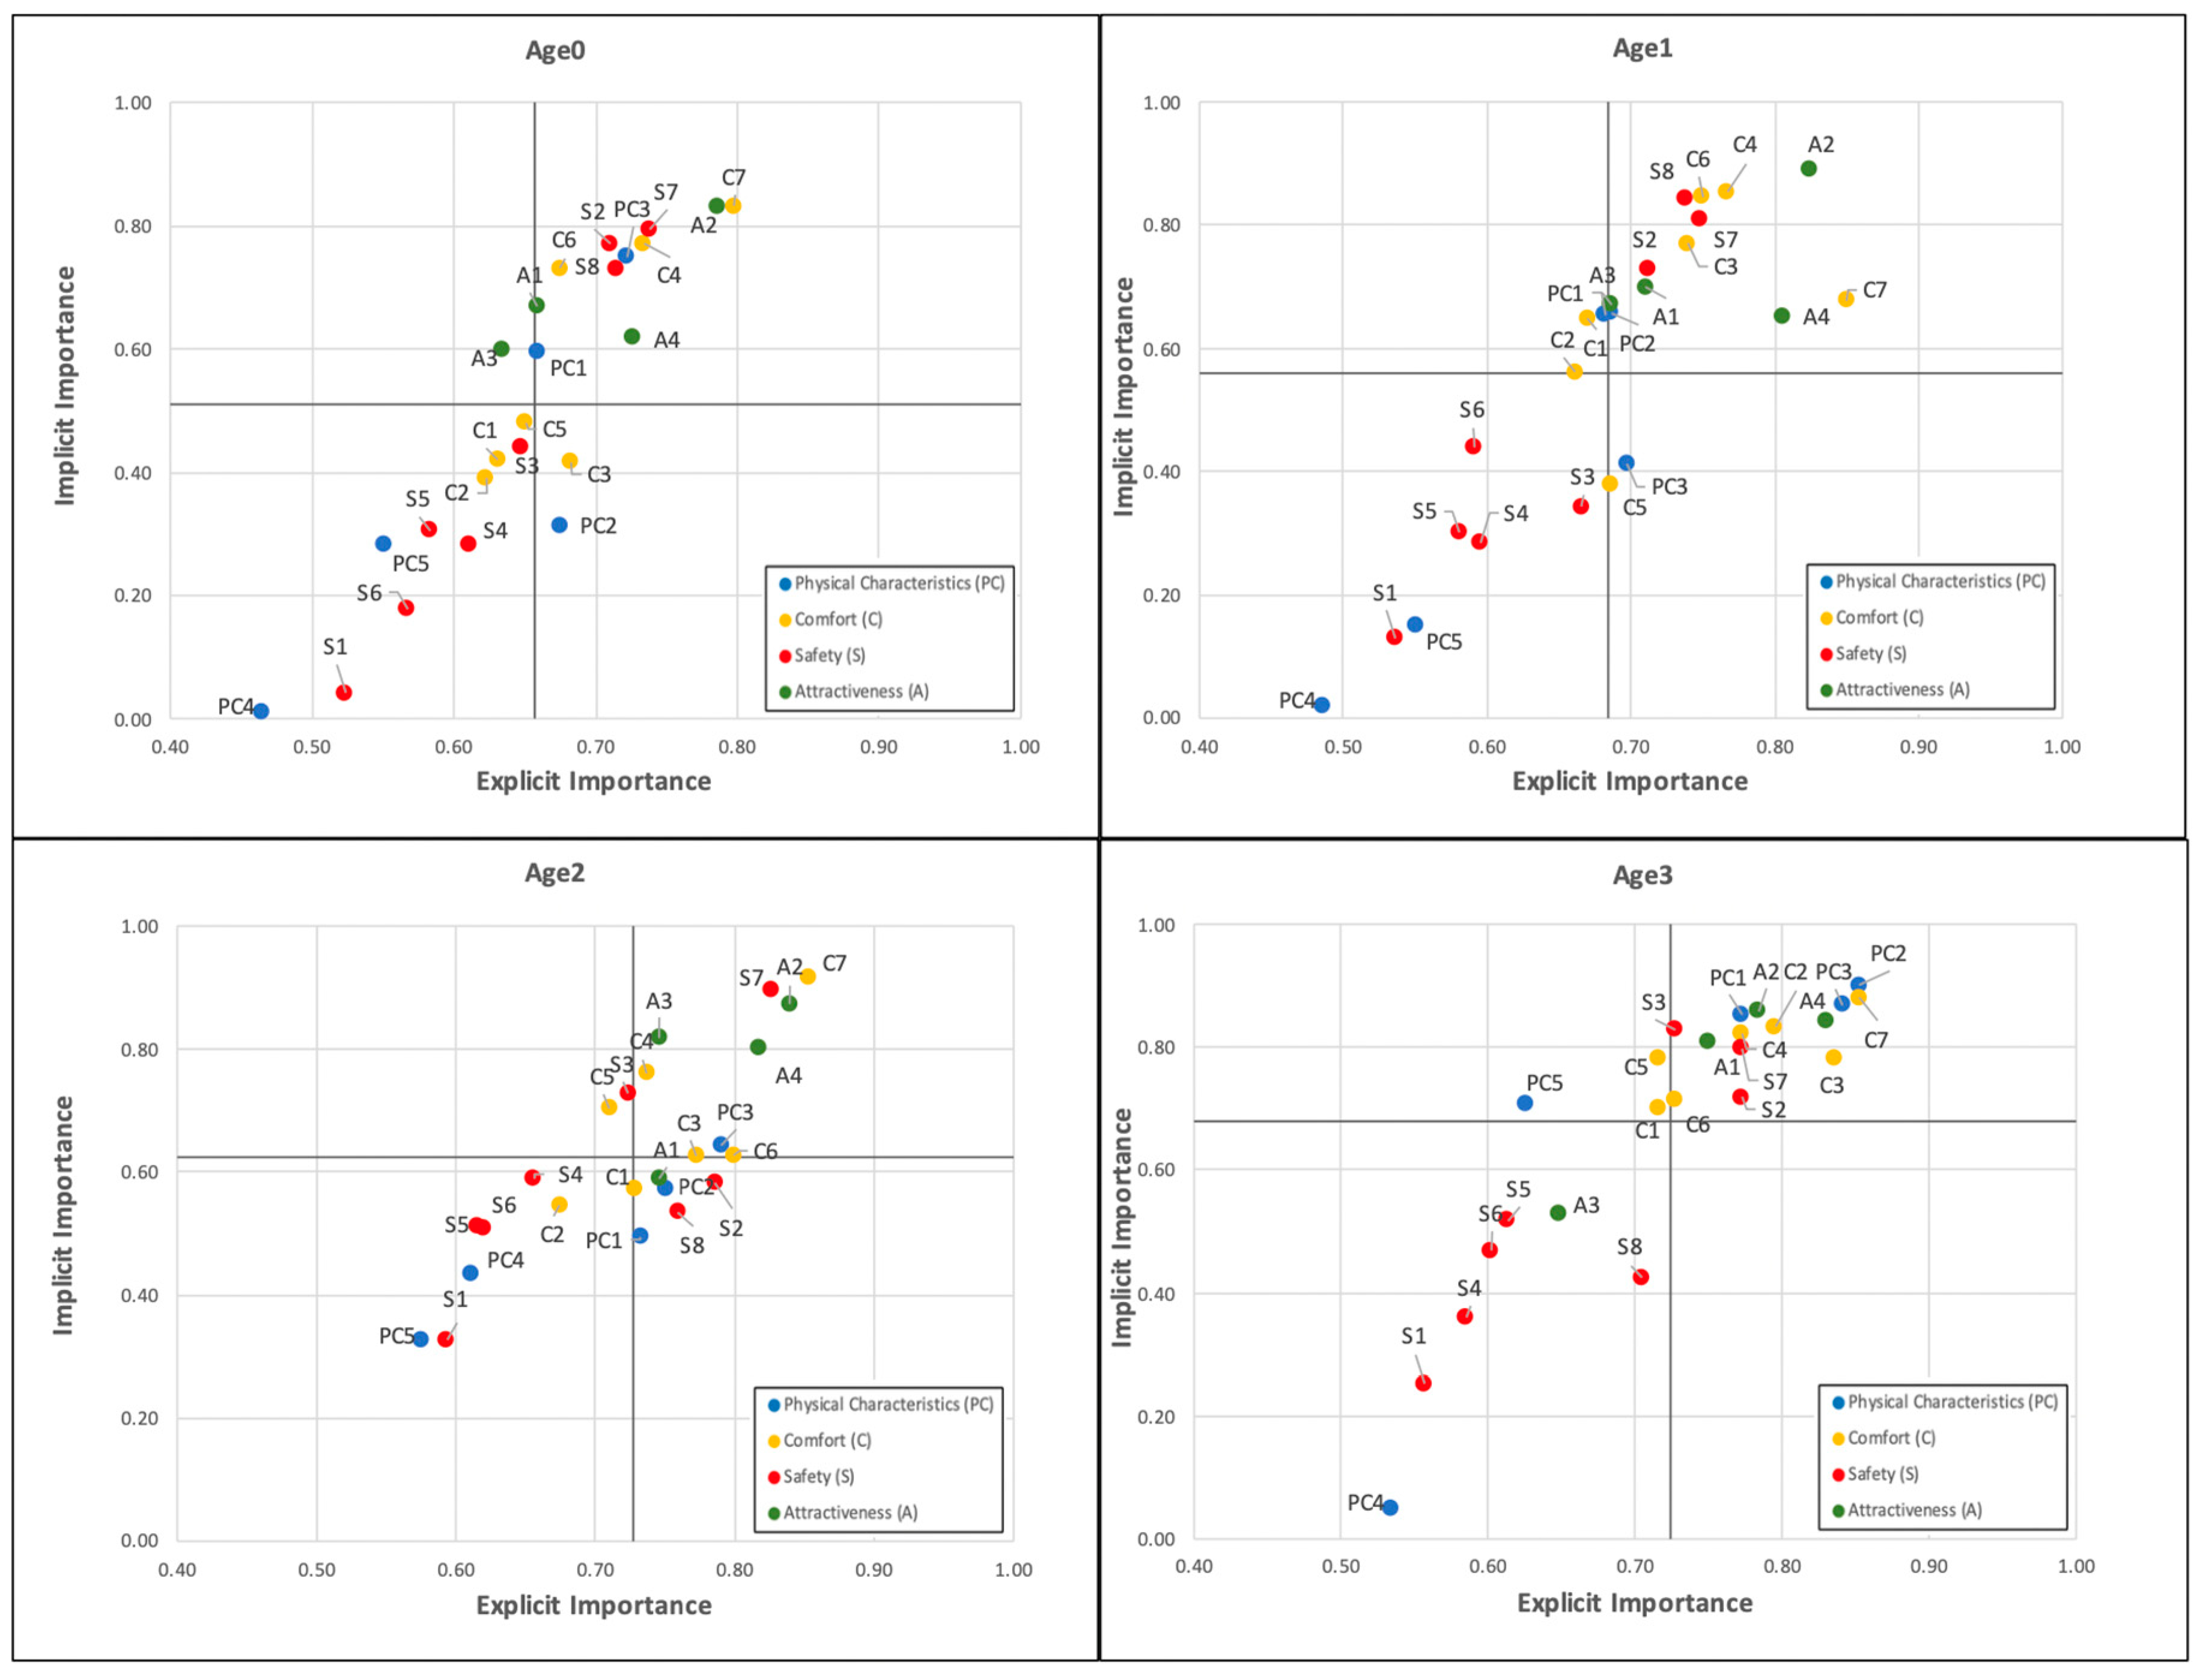
Table 1.
Summary of the aspects that can influence pedestrian mobility included in the questionnaire and studies investigating them.
Table 1.
Summary of the aspects that can influence pedestrian mobility included in the questionnaire and studies investigating them.
| Item | Reference Literature | |
|---|---|---|
| Pedestrian infrastructure items relating to the Physical Characteristics (PC) | ||
| PC1 | Continuity of the sidewalk | [34] |
| PC2 | Sidewalk width | [35] |
| PC3 | Good condition of the sidewalk surface | [36] |
| PC4 | Reduced slope of the path | [35,37] |
| PC5 | Absence of driveways | [35,37] |
| Pedestrian infrastructure items relating to the Comfort (C) | ||
| C1 | Absence of fixed obstacles (trees, poles, etc.) | [38,39] |
| C2 | Absence of obstacles or obstructions (parked vehicles, merchandise from shops, etc.) | [38,40] |
| C3 | Cleaning of the pedestrian path | [35] |
| C4 | Presence of protection from atmospheric agents (trees, porches, etc.) | [35,41] |
| C5 | Presence of benches or seats | [37,42] |
| C6 | Ease of getting to a public transport stop | [43] |
| C7 | Good artificial lighting system of the path | [37,40] |
| Pedestrian infrastructure items relating to the Safety (S) | ||
| S1 | Not excessive width of the carriageway | [44] |
| S2 | Low flows of vehicular traffic | [40,45] |
| S3 | Presence of speed limits for vehicular flows | [45] |
| S4 | Presence of traffic calming measures on the carriageway | [46] |
| S5 | Presence of a parking lane adjacent to the pedestrian path | [36,44] |
| S6 | Absence of large parking areas | [47] |
| S7 | Ease of crossing at intersections | [48] |
| S8 | Ease of crossing out of intersections | [48,49] |
| Pedestrian infrastructure items relating to Attractiveness (A) | ||
| A1 | Presence of commercial activities (bars, shops, etc.) | [50,51] |
| A2 | High artistic / landscape value of the streetscape | [50,52] |
| A3 | Presence of other pedestrians | [40,53] |
| A4 | High perception of security | [54,55] |
Table 2.
Sample socio-demographic characteristics.
| Variable | Items | Total | % |
|---|---|---|---|
| Gender | 0: Male | 288 | 51.25 |
| 1: Female | 274 | 48.75 | |
| Age | 0: <20 years | 126 | 22.42 |
| 1: 21-35 years | 236 | 41.99 | |
| 2: 36-65 years | 112 | 19.93 | |
| 3: >65 years | 88 | 15.66 | |
| Place of Residence (Number of inhabitants) |
0: Less than 20,000 | 200 | 35.59 |
| 1: Between 20,000 and 50,000 | 206 | 36.65 | |
| 2: Greater than 50,000 | 156 | 27.76 |
Table 3.
ANOVA Test.
| Mean Square | F | p-value | |
|---|---|---|---|
| Total | 8.333 | 67.316 | 0.000 |
| Men | 4.548 | 31.517 | 0.000 |
| Women | 4.313 | 38.890 | 0.000 |
| Age0 | 1.732 | 8.735 | <0.001 |
| Age1 | 3.957 | 49.169 | 0.000 |
| Age2 | 1.694 | 8.316 | <0.001 |
| Age3 | 1.977 | 6.412 | <0.001 |
Table 5.
Values of implicit importance.
| Total | Men | Women | Age0 | Age1 | Age2 | Age3 | |
|---|---|---|---|---|---|---|---|
| PC1 | 0.668 | 0.638 | 0.721 | 0.596 | 0.654 | 0.494 | 0.853 |
| PC2 | 0.518 | 0.649 | 0.762 | 0.314 | 0.657 | 0.571 | 0.901 |
| PC3 | 0.533 | 0.489 | 0.558 | 0.749 | 0.413 | 0.643 | 0.868 |
| PC4 | 0.053 | 0.02 | 0 | 0.01 | 0.02 | 0.435 | 0.049 |
| PC5 | 0.389 | 0.479 | 0.303 | 0.283 | 0.15 | 0.325 | 0.707 |
| C1 | 0.627 | 0.378 | 0.668 | 0.42 | 0.649 | 0.571 | 0.701 |
| C2 | 0.405 | 0.422 | 0.548 | 0.391 | 0.562 | 0.546 | 0.833 |
| C3 | 0.752 | 0.719 | 0.787 | 0.416 | 0.771 | 0.626 | 0.780 |
| C4 | 0.823 | 0.806 | 0.841 | 0.771 | 0.854 | 0.76 | 0.822 |
| C5 | 0.405 | 0.363 | 0.444 | 0.48 | 0.38 | 0.703 | 0.782 |
| C6 | 0.818 | 0.782 | 0.854 | 0.731 | 0.845 | 0.627 | 0.714 |
| C7 | 0.907 | 0.889 | 0.926 | 0.832 | 0.677 | 0.917 | 0.881 |
| S1 | 0.214 | 0.141 | 0.247 | 0.042 | 0.13 | 0.327 | 0.253 |
| S2 | 0.784 | 0.756 | 0.814 | 0.771 | 0.73 | 0.582 | 0.719 |
| S3 | 0.72 | 0.707 | 0.734 | 0.442 | 0.344 | 0.728 | 0.828 |
| S4 | 0.435 | 0.42 | 0.474 | 0.282 | 0.285 | 0.589 | 0.360 |
| S5 | 0.445 | 0.439 | 0.455 | 0.305 | 0.302 | 0.511 | 0.517 |
| S6 | 0.437 | 0.336 | 0.459 | 0.178 | 0.44 | 0.509 | 0.469 |
| S7 | 0.824 | 0.796 | 0.852 | 0.794 | 0.81 | 0.896 | 0.797 |
| S8 | 0.455 | 0.409 | 0.847 | 0.729 | 0.844 | 0.534 | 0.425 |
| A1 | 0.731 | 0.36 | 0.818 | 0.669 | 0.7 | 0.589 | 0.810 |
| A2 | 0.873 | 0.847 | 0.705 | 0.831 | 0.891 | 0.873 | 0.858 |
| A3 | 0.393 | 0.363 | 0.718 | 0.597 | 0.671 | 0.818 | 0.530 |
| A4 | 0.65 | 0.725 | 0.82 | 0.617 | 0.653 | 0.801 | 0.842 |
| Mean | 0.577 | 0.539 | 0.640 | 0.510 | 0.560 | 0.624 | 0.679 |
Disclaimer/Publisher’s Note: The statements, opinions and data contained in all publications are solely those of the individual author(s) and contributor(s) and not of MDPI and/or the editor(s). MDPI and/or the editor(s) disclaim responsibility for any injury to people or property resulting from any ideas, methods, instructions or products referred to in the content. |
© 2023 by the authors. Licensee MDPI, Basel, Switzerland. This article is an open access article distributed under the terms and conditions of the Creative Commons Attribution (CC BY) license (http://creativecommons.org/licenses/by/4.0/).
Copyright: This open access article is published under a Creative Commons CC BY 4.0 license, which permit the free download, distribution, and reuse, provided that the author and preprint are cited in any reuse.


