Submitted:
30 October 2023
Posted:
30 October 2023
You are already at the latest version
Abstract
The effects of co-addition CeO2 and SiC particles on the morphology, surface cracks, microstructure, precipitated phases and wear property of plasma beam spraying Fe55-based coatings on 1025 steel were investigated by optical microscopy (OM), scanning electron microscopy (SEM), energy-dispersive X-ray spectrometer (EDS), ultra-deep field microscope and wet sand rubber wheel friction tester, respectively. The results showed that the dendrite exhibited a directional growth pattern perpendicular to the substrate and the transitional states of microstructure with the co-addition CeO2 and SiC particles. With addition of CeO2 or SiC affected the flowability of molten steel at macro level, leading to a reduction in the liquid phase diffusion coefficient DL of Cr and C and resulted in a decrease in the G/R ratio. The dendrites changed into equiaxed grains. The main phase composition of Fe55 welding layer is Cr7C3, γ-Fe. The grain boundaries consisted mainly of a reticular eutectic structure. The worn-out uniformly surface of the Fe55+1.5 wt% SiC+0.01wt% CeO2 with Ra was 0.28 μm was smoother than that of other samples. The sub-wear mechanisms during the friction process were microploughing and microcutting. The hardness and toughness of Fe55+1.5 wt% SiC+0.01wt% CeO2 were well-matched, avoiding excessive microcutting and microplastic deformation.
Keywords:
plasma beam spraying method
; co-addition
; CeO2
; microstructure
; wear performance
1. Introduction
Microcutting of mineral particles during slurry transportation could formed gap and led to line seal failure [1]. The failure of sealing is caused by the combined effect of abrasive particles in the two-phase flow of slurry. The main wear behavior is scratch on the sealing surface, liquid corrosion, and erosion[2]. The manufacture and repair of wear-resistant valve sealing surface was of interest to researchers [3]. At present, the laser cladding method (LCM) and the plasma beam spraying method (PSM) were usually applied to manufacture and repair the carbide material layer at the valve sealing surface [4]. The LCM use a laser to form a molten pool on the surface of the substrate and the metal powder is sprayed to achieve metallurgical bonding. The PSM formed a high temperature plasma arc on the surface of the substrate, and the metal powders were heated by the plasma arc to form a liquid droplet which sprayed to the surface of the substrate to achieve metallurgical bonding. The metallurgical bonding effect of PSM was better than that of the LCM. Therefore, PSM was widely used for valve repair [5].
Fe-based powders are widely used in the field of surface repair and enhancement because of the low price and achievable melting temperature. Studies have shown that the type of enhanced phase, content, elemental composition of the alloy powder. PSM parameters have comprehensive effects on the microstructural properties of the welding layer[6]. Ning et al. reported the metal carbides produced by SiC decomposition combined with diffusion elements of the matrix had a positive effect on the increase of hardness[7]. The addition of SiC might not only as enhanced phase, but also as the sources of other carbides. The study by Zhang et al. showed that the formation of free state graphite after the decomposition of SiC particles in steel at high temperature leads to defect generation and degradation of performance [8]. It suggested the decomposition of SiC should be inhibited to avoid defect. Chen et al. showed that CeO2 reduces cracks and defects caused by Ti(C,N) addition to the weld layer and contributes to the improvement of hardness and wear properties[9]. It provided the evidence of the CeO2 can inhibit the defect after the addition of enhanced phase. The study by Gao et al. on the mechanism of CeO2 in refining grain size in Ni-based welding indicated that Ce hinder the growth of grains by generating a drag effect if it accumulates along grain boundaries. This formed many nucleation sites to improve the microstructure. In addition, the addition of Ce may also reduce the fluidity of the molten pool, resulting in a weakening of the grain refining effect[10]. However, the low fluidity might decrease the agglomeration rate of particles in the molten steel and provide the possibility to add ceramic particles without defect. Cai et al. co-added CeO2 and nano-TiC in the welding layer. The results showed that 3 wt% of CeO2 promoted the melting and decomposition of the nano-TiC micro surface and contributed to the uniform distribution of the enhanced phase. However, the excessive amount of CeO2 leads to the decomposition of the enhanced phase and the amount of CeO2 addition should be carefully evaluated[11]. It indicates the co-addition amount of CeO2 and ceramic particles should be matched. Nevertheless, these researchers focus on the improvement of surface hardness and the reduction of the volume of wear. The uniform distribution of the enhanced phase can promote microstructural homogenization has been proven. CeO2 can act as nucleation site for carbides and promote the refinement of M7C3[12]. Therefore, the co- addition of CeO2 and the ceramic particles will promote the hardness homogeneity, which provided theoretical support for the preparation of valve sealing surface materials with uniform microstructure.
In the above study, researchers found that the addition of CeO2 would promote uniform distribution of ceramic particles. These uniformly distributed ceramic particles will result in uniform nucleation of the grains and possibly uniform hardness. Based on these studies, it would be possible to prepare layer with uniform microstructure by co-addition of CeO2 and SiC particles.
Although SiC had been reported to be used as a reinforcement correspondingly in welding layers prepared by LCM [7,13]. However, the effect of co-addition of SiC and CeO2 on the microstructure and wet wear of Fe-based welding layers has rarely been investigated. Therefore, we prepared three different welding layers with different contend addition of CeO2 and SiC particles by PSM in Section 3.2 of this article and compared the microstructure of three different welding layers. In Section 3.3, we compared the wear performance of three different welding layers using a wet sand rubber wheel friction tester. In Section 3.4, The effect of co-addition CeO2 and SiC on wear mechanism were investigated.
2. Materials and Methods
Annealed 1025 carbon steel is commonly used as the base material for valve spool. In this paper, a 1025 steel plate of size 100 mm × 50 mm × 10 mm was selected as the substrate. The surface of the substrate was ground to remove the oxide layer before the surface was spray welded. The Fe55 alloy powder which was widely used as wear resistant layer. Therefore, the Fe55 (purity > 99%, d50 = 150~200 μm, Hebei Hangba Metal Materials Co., Ltd, Xingtai, China) was considered as the matrix material of the welding layer. CeO2 (purity >99%, d50 =100 nm, Hebei Hangba Metal Materials Co., Ltd, Xingtai, China) was used to modify microstructure. SiC (purity >99%, d50 =100~150 μm, Hebei Hangba Metal Materials Co., Ltd, Xingtai, China) was used as enhanced phase. Table 1 and Table 2 showed chemical composition of raw materials. Firstly, since the low addition of CeO2, the powders were premixed in the following steps in order to achieve a homogeneous mixing of CeO2 with the alloy powders: 2 g of Fe55 alloy powder, 1.5 g of SiC and 0.01 g of CeO2 powder were mixed in an Al2O3 ball mill jar for 30 min with 250 rpm. The mixed powder was mixed with the remaining Fe55 alloy powder in a vibrating paddle stirrer (self-made) with a speed of 3000 rpm for 1 h and a vibration frequency of 15 Hz.
Figure 1 showed a schematic diagram of the 3D PSM system and process (DML-V03BD, Shanghai Duo Mu Industrial Co., Shanghai, China). Spraying was performed using a 3D PSM system. The steps were as follows: (1) The homogeneous powder mixture (Fe55, Fe55+1.5wt% SiC, Fe55+1.5wt% SiC+0.01wt% CeO2) was loaded into the spray tank with continuous stirring using a stirring paddle; (2) To prevent thermal stress cracking of the weld layer, the 1025 steel plate was preheated to 300 °C; (3) The surface oxidation layer was cleaned again before spraying. Ar atmosphere was used to avoid oxidation of the weld surface with a gas flow rate of 5 l/min, ion gas flow rate of 3.5 l/min, welding current of 95 A, scan rate of 6 mm /s, powder transfer rate 1.5 g/s.
Samples with dimensions of 10 mm ×10 mm × 8 mm were cut from the substrate by wire cutting. After grinding and polishing, the samples were etched for 30 s using an alcoholic nitric acid etching solution with a concentration of 4 vol.%. The samples were cleaned with anhydrous alcohol and was dried to observe the microstructure using the optical microscope (BMM-420, Shanghai Batuo Instrument Co., Ltd., Shanghai, China). The experimental samples were observed using Zeiss GeminiSEM 300 field-emission scanning electron microscope (Oberkochen, Germany) equipped with an ener-gy-dispersive X-ray spectrometer (Oberkochen, Germany) for the microstructure charac-terization of the samples. The ultra-deep field microscope (μsurf explorer, NanoFocus AG, Germany) were used to characterize the worn surface. The polished samples were tested for micro-Vickers hardness on a semi-automatic hardness tester (AMH43, LECO, Laboratory Equipment Co., USA). The measurement spacing from substrate to coating was 200 μm. The load was 0.5 kgf and the holding time was 15 s. The indentation depth was determined by the 4-point spacing.
To test the wear resistance and investigated the wear mechanism. The wet sand rubber wheel friction tester shown in Figure 2 (LGM-225, Jinan Liangong Test Technology Co., Jinan, China) was used to test the wear performance of different samples. The samples were polished to a roughness Ra < 0.5 μm before the wear test. SiC particles (purity >99%, d50 =75 nm, Hebei Hangba Metal Materials Co., Ltd, Xingtai, China) were used as the abrasive. 20 N was applied and the wear time was 10 min for 3 times. The rubber wheel linear speed of 3 m/s.
3. Results and Discussion
3.1. Morphology and Chemical Composition of the Raw Powders
Figure 3 showed the SEM micrographs and EDS mapping of Fe55 +1.5wt% SiC powders. The sizes of Fe55 and SiC were about 150 μm. The ball milling speed was low. Most of the SiC had not broken during the ball milling process and remain prismatic. A small part of SiC had broken and smaller SiC with 40~50 μm had generated. Fe55 was mainly Cr, Fe and the rich areas of Fe and Cr overlapped with Ni, indicating that Fe55 was mainly composed of Fe, Cr, Ni elements.
Figure 4 showed SEM micrographs and EDS mapping of Fe55+1.5wt% SiC+0.01wt% CeO2. Due to the low incorporation of CeO2, Ce was not presented in the Figure 4(a-1). The Si rich region overlapped with C as shown in Figure 4(a-2) and Figure 4(a-5). However, the C was not significant. EDS analysis indicated white bright spots scattered on the surface of SiC in Figure 4b were CeO2. The white bright spots overlapped with the region of Ce signal agglomeration in Figure 4b-1. CeO2 had high surface energy resulted in some CeO2 agglomerates with a maximum size of 500 nm. Due to the oxidation on the surface of SiC, the signal of C in SiC was attenuated, leading to the interference of O of CeO2, as shown in Figure 5(b-2) and Figure 4(b-3). The Si and C enriched areas indicated that SiC showed a lamellar structure in Figure 4(b-3) and Figure 4(b-4).
3.2. Morphology of Welding Layer
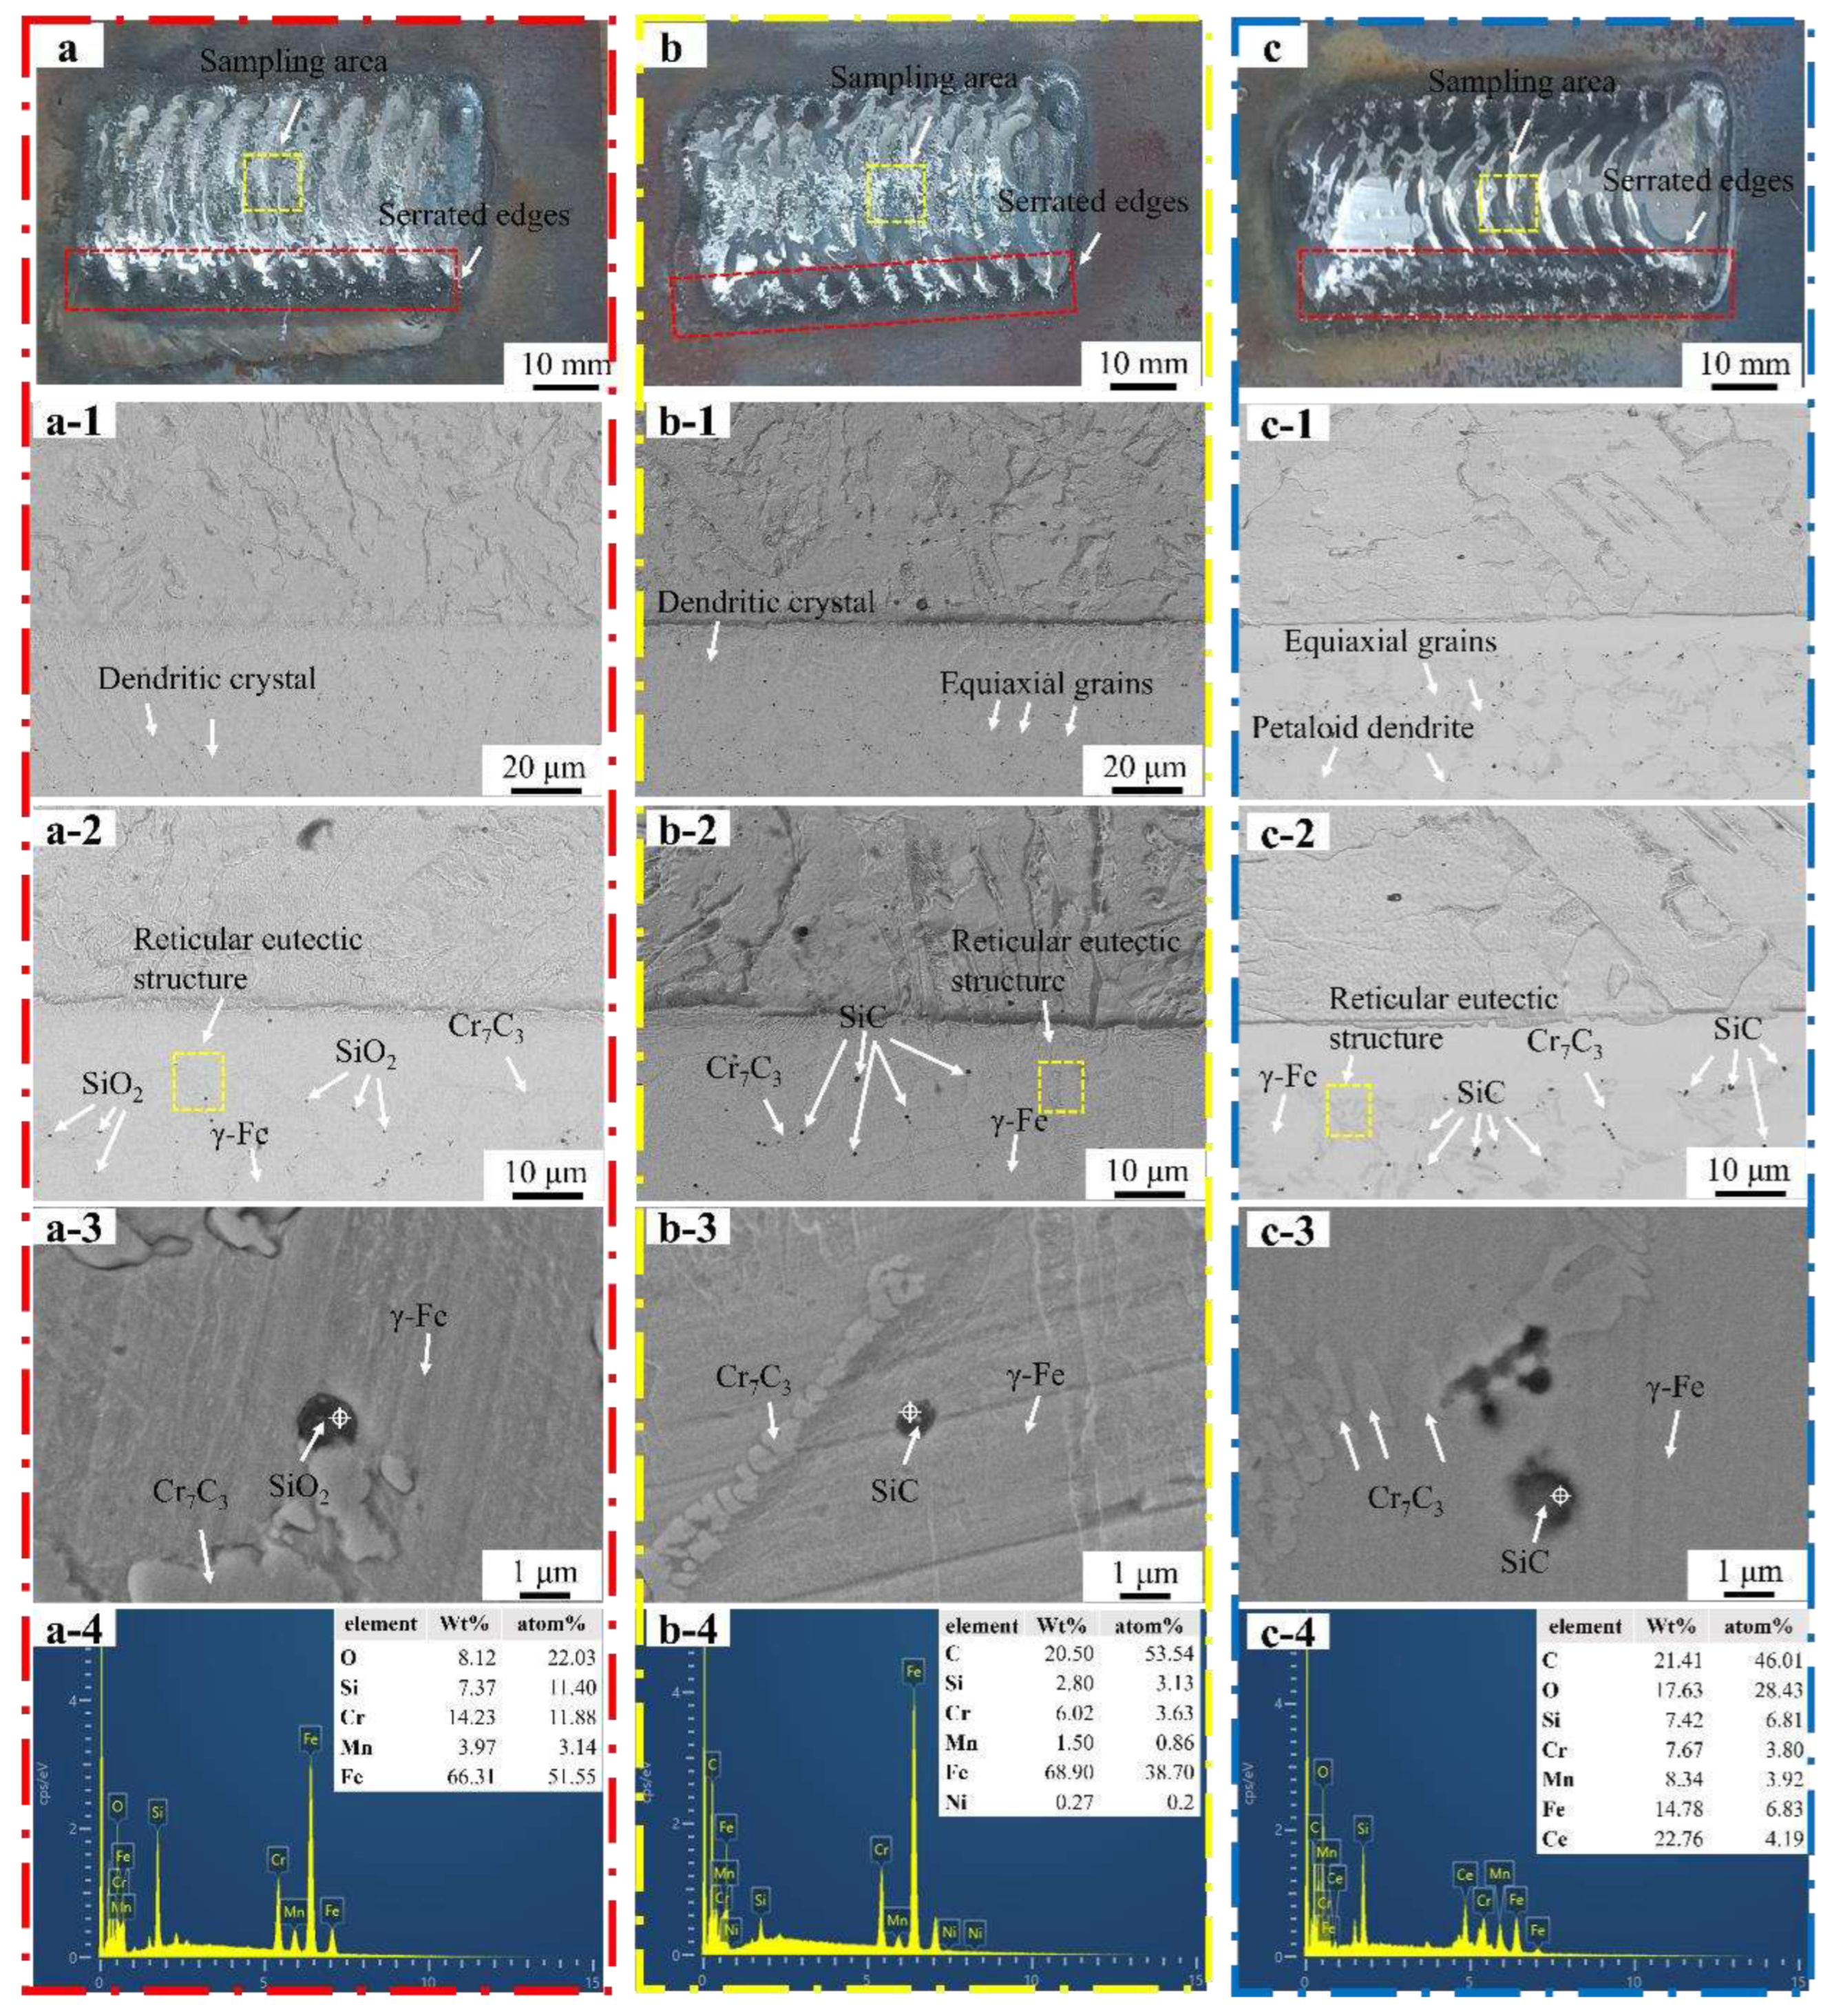
Figure 5a showed that welding path at the surface of Fe55 weld layer was no obvious. The jagged edges (red dashed line) on both sides were not obvious, indicating that it filled by molten steel. The microstructure of the Fe55 welding layer in Figure 5a-1 and Figure 5a-2, which taken from the yellow dashed line in Figure 5a. The welding layer grain boundary was mainly composed of a reticular eutectic structure. The microstructure of Fe55 at the interface was mainly dendritic with differences in grain size. The γ-Fe dendrites grew directionally from 1025 steel substrate into the welding layer. During the solidification process, the substrate side absorbed a large amount of heat input from the plasma arc to maintain high temperature. The other side of the weld layer formed air convection due to shielding gas agitation and took away surface heat and maintains low temperature. A temperature gradient perpendicular to the 1025 steel substrate provided a driving force for dendrite solidification. Therefore, the dendrite exhibited a directional growth pattern perpendicular to the substrate, which was proven in Liu et al’s work[14]. The phase and EDS mapping of Fe55 welding layer were shown in Figure 5a-3 and 5a-4, the Cr7C3 hard phase was small and formed a reticular eutectic organization with γ-Fe since the welding layer was cooled faster. Although the Ar atmosphere isolated the oxygen, the [Si] reacted with [O] according to the reaction equation (1) in the molten steel to inhibit the oxidation of [Fe] and avoid the generation of (FeO) inclusions according to the reaction equation (2).
[Si]+[O] → (SiO2)
[Fe]+[O] → (FeO)
The SiO2 particles distributed along the grain boundaries with a size of 1~2 μm and agglomerated in some areas. the low melting point of SiO2 particles failed to inhibit grain growth.
Figure 5b showed the macrograph of Fe55+1.5wt% SiC. Since the molten steel flowability decreased with SiC addition [10], the welding path and jagged edges (red dashed line) were clearer compared with Fe55. The sample was taken from the yellow dashed line in Figure 5b. The microstructures of the welding layer were shown in Figure 5b-1 and 5b-2. The grain boundaries consisted mainly of a reticular eutectic structure [16]. The grains was composed of γ-Fe [16]. The reticular eutectic structure was mainly composed of γ-Fe and Cr2C3 [13]. The microstructure was dendritic and equiaxed grains. The dendrites grew directionally with the temperature gradient as driving force. In Figure 5b-2, SiC were found on the grain boundaries and inside the grains. The number of dendrites was reduced, indicated that the dendrite growth was inhibited by the particles and form equiaxed. The SiC decomposed to [Si] and [C] at high temperatures according to the reaction equation (3).
SiC→ [Si]+[C]
The [Si] content in the molten steel rose and refined the grains[15]. Moreover, the EDS mapping results of Figure 5b-3 showed that the spherical particles were SiC. It indicated that the SiC were not completely melted and became nucleation points of γ-Fe. The SiC on the grain boundaries inhibited the grain boundary expansion. Therefore, the addition of SiC lead to the formation of equiaxed grains.
Figure 5c showed macrograph of the welding layer of Fe55+1.5wt% SiC+0.01wt% CeO2. The welding path and serrated edges were clearest. The sample was taken from the yellow dashed line in Figure 5c. The microstructures were shown in Figure 5c-1 and 5c-2. The grain boundary was mainly composed of eutectic structure. CeO2 increased the viscosity of the molten steel. The SiC were difficult to agglomerate after stirred and dispersed by the Ar airflow. The distribution of SiC were uniform and acted as nucleation points of γ-Fe, which promoted the formation of equiaxed grains. When the number of grains reached the limit of surface energy, the equiaxed grains fuse with each other to form petaloid grains in order to reduce the surface energy[16]. In Figure 5c-1, SiC were uniformly distributed inside the welding layer and were observed on the grain boundaries and inside the grains. Since the formation of rare earth compounds containing Ce and O by nano CeO2[17], the heterogenous nucleation of primary carbides was promoted. This resulted in larger size of Cr7C3 hard phases than other samples. Some SiC agglomerated in Figure 5c-2. Although the co-addition of CeO2 and SiC increased the viscosity of the molten steel, the collisions and agglomeration of SiC were inevitable under heating and stirring conditions in the molten steel. Figure 5c-3 and 5c-4 showed the phase and EDS mapping results of the Fe55+1.5wt% SiC+0.01wt% CeO2 welding layer. The Ce enrichment was observed on the SiC particles inside the grains where a eutectic structure of Cr7C3 and γ-Fe was formed, as shown in Figure 5c-3. However, the [O] high content was due to the high activity of CeO2 adsorbed the enrichment of inclusions.
Figure 5.
Macrograph and micrograph and EDS analysis of the welding layer. (a) macrograph shape and sampling area of Fe55 welding layer; (b) macrograph and sampling area of Fe55+1.5wt% SiC welding layer; (c) macrograph and sampling area of Fe55+1.5wt% SiC+0.01wt% CeO2 welding layer; (a-1,a-2) micrograph of the interface of Fe55 welding layer; (b-1,b-2) micrograph of the interface of Fe55+1.5wt% SiC welding layer; (c-1,c-2) micrograph of the interface of Fe55+1.5wt% SiC+0.01wt% CeO2 welding layer; (a-3,a-4) Fe55 welding layer phase and EDS mapping; (b-3,b-4) Fe55+1.5wt% SiC welding layer phase and EDS mapping; (c-3,c-4) Fe55+1.5wt% SiC+0.01wt% welding layer phase and EDS mapping.
The schematic diagram of the welding layer was shown in Figure 6. The sides of the weld layer formed a jagged edge (red dashed line). The plasma arc paths (blue dashed line) partially overlapped and formed an overlapping melt pool in the area where the paths overlapping. The overlapping melt pools had a higher temperature gradient[18]. the molten steel in the area where the paths overlap expanded to each other and influenced by the viscosity of the molten steel. The molten steel with low viscosity expanded easily and the welding paths and jagged edges were not clearly visible. The molten steel with high viscosity was difficult to expand. Therefore, the welding paths and jagged edges were clearly visible.
The changed in the solidification microstructure can be explained by Figure 7 and equation (4). Where the liquid temperature gradient was GL, solidification rate was R, and undercooling ΔTS were assumed to be constant due to the high temperature of the plasma arc with 3000 ℃. The addition of SiC or CeO2 affected the flowability of molten steel at macro level. This leaded to a reduction in the liquid phase diffusion coefficient DL of Cr and C and resulted in a decrease in the G/R ratio as shown in Figure 7. The Fe55 had a higher G/R ratio and no SiC or CeO2 to inhibit growth of dendritic. Resulting the microstructure was mainly composed of dendrites. The diffusion coefficient DL of Cr and C elements in molten Fe55, Fe55+1.5%wt SiC and Fe55+1.5wt% SiC+0.01wt% CeO2 decreased with increase of SiC or CeO2. Since Cr and C atoms were components of eutectic structure, the decrease in diffusion coefficient led to uniform distribution of Cr and C atoms. This provided rapid replenishment of atoms for grain boundary formation during the equiaxed crystallization process, which explained the differences in microstructures observed in different samples.
The γ-Fe was mainly strengthened by (Cr, Fe)7C3 carbides. Due to the relatively low density of some (Cr, Fe)7C3 near the fusion line in Fe55, there was a fluctuation in microhardness in Figure 8a. The coarse grains were observed in the heat affected zone in Figure 8b and the microstructure was mainly composed by dendrites. In Fe55+1.5wt% SiC, although the non-uniform distribution of SiC particles resulted in uneven distribution of (Cr,Fe)7C3. The grains of γ-Fe were refined with increasing content of nucleation sites and [Si, C] in Figure 8d. The addition of CeO2 caused the enhance phase be uniformly distributed in γ-Fe, which lead to the transitional states of microstructure in Figure 8c.
3.3. Wear Morphology
Figure 9 presented the test results of the wear mass loss of the sample after a 15 min test under a load of 20N. The change in wear mass loss exhibited a similar trend, with the slope initially increasing and then decreasing as the wear time was prolonged. The wear mass loss of Fe55 was significantly higher than that of other samples. The sample with SiC addition exhibited lowest mass loss. This was because SiC floated to the surface of the solder layer during the spraying process and aggregated, resulting in an increase in surface hardness and enhanced wear resistance. As the wear progressed, the contact area increased, leading to a decrease in the wear rate at 9 minutes. However, at a wear time of 6 minutes, there was a slight increase in the wear rate. The wear mass loss of the Fe55+1.5wt% SiC+0.01wt% CeO2 sample remained stable, but due to its lower surface hardness compared to the sample with only SiC added, the wear mass loss of this sample was higher.
Figure 10a showed the 3D morphology of the surface of Fe55 after wet friction test. The depth of the furrows on the friction surface was marked by color with a not uniform distribution. The blue area indicated deep furrows as well as holes. The yellow and red areas indicated light furrows. The structure of the blue area was mainly γ-Fe with low density of Cr7C3 enhancement, which was easy to be worn. Defects such as inclusions or porosity existed in these areas, which occurred fatigue wear and formation of spalling pits. The Cr7C3 agglomerated in the red region and increased the hardness. Therefore, the furrows were shallow. According to ISO4287 standard, the Ra was 0.75 μm and Rz was 5.87 μm at a Gaussian filter of 0.8 mm. The abrasion roughness is between N5 and N6 as shown in Figure 10b. Figure 10(c-f) showed the worn surface micrograph of Fe55 after wet friction test. Furrows and holes were observed in Figure 10c. However, the furrows were deflected (yellow dashed line), which was a result of the movement of abrasive SiC was blocked by the Cr7C3 hard phase. In the case of abrasive wear, the particle hardness was higher than γ-Fe. Then the abrasive SiC is deflected toward the γ-Fe region with low density of Cr7C3. The edges of the furrows were clearly curled and demonstrated a cut characteristic (blue dashed line). This was formed by the abrasive SiC during the cutting of the low hardness γ-Fe. In Figure 10e, the hidden porosity was exposed during the friction process since the existence of casting defects such as hidden porosity. The fatigue wear on the friction surface resulted in spalling pits. In addition, there were a large number of abrasive debris on the surface, which were hard three-body embedded in soft γ-Fe during movement and could not be washed away. Levy at el examined that when the particles were strong enough not to break up on impacting, the erosion rate became constant[19]. It explains the reason of abrasive SiC embedded in soft γ-Fe. The size of the abrasive debris had a significant difference. Part of the abrasive debris were newly generated, which indicated that not only abrasive wear but also three-body wear had occurred during wet friction[20]. The end point of partial furrows was visible (the red dashed line) in Figure 10f, which was the result of the abrasive SiC be blocked by the Cr7C3 hard phase and unable to deflect to the nearby area.
Figure 11a showed 3D micrograph of Fe55+1.5 wt% SiC after wet friction test. The color distribution of the worn surface was more uniform after the SiC addition. The blue area represented the deep furrows and the microstructure was mainly γ-Fe with low density of Cr7C3. The yellow and red areas represented the lighter furrows with Cr7C3 and SiC. The SiC float up to the surface and agglomerated. [C] generated by decomposition of SiC promotes the growth of Cr7C3 and increased the surface hardness. According to ISO4287 standard, Ra was 0.63 μm and Rz was 5.08 μm at a Gaussian filter of 0.8 mm. Therefore, the roughness was between N5 and N6 as shown in Figure 11b. Figure 11 (c-f) showed the surface micrograph of Fe55+1.5 wt% SiC after wet friction test. The dense furrows were observed in Figure 11c, indicating uniformly wear was promoted on the worn surface. However, there were still deflected furrows on the sample surface. The abrasive SiC was blocked by the Cr7C3 or SiC in γ-Fe and deflected toward the low hardness region. In Figure 11d, porosity was observed, as Ar gas agitation led to the agglomeration of bubbles on the molten steel surface. Partially agglomerated SiC prevented the bubbles from breaking and lead to casting defects. In Figure 11e, significant curly edges on furrows were consistent with the cause of curly edges formation in the Fe55 sample. The number of debris was significantly reduced compared to the sample without the SiC addition in Figure 10e. The abrasive could not embed in γ-Fe and reduced the occurrence of three-body wear for the addition of SiC increased surface hardness. Babu et al. indicated the erosion mechanism changes depending upon the erodent type [21]. As the SiC addition increased the surface hardness, the three-body wear was reduced. The uniform size of the debris was visible in Figure 11f, indicating the SiC addition contributed to the wear uniformity.
Figure 12a showed the 3D morphology of the surface after the friction test of Fe55+1.5wt% SiC+0.01wt% CeO2. The depth of farrows on the wear surface was marked by color. The color distribution of the wear surface was the most uniform among all samples with the co-addition of SiC and CeO2. The hardness of the red area is higher where SiC or Cr7C3 aggregation. There were no deep farrows on the surface of the samples. CeO2 addition promoted the diffuse distribution of SiC and Cr7C3 which bear the friction load uniformly. According to ISO4287 standard, Ra was 0.28 μm and Rz was 2.03 μm at a Gaussian filter of 0.8 mm. The abrasion roughness was between N4 and N5, as shown in Figure 12b. Figure 12 (c-f) showed the surface morphology of Fe55+1.5 wt%SiC+0.01wt%CeO2 after wet friction test. In Figure 12c, dense furrows on the surface indicated that the samples were worn uniformly. In Figure 12d, number of holes was less than other samples in Figure 10d and Figure 12d. It was difficult for the stirring effect of Ar gas to form bubbles on the surface of the welding layer since the viscosity of the molten steel increased by CeO2, which reduced the generation of defects. The furrows showed obvious curled edges in Figure 12e. The uniform size of debris embedded in the surface were found. Therefore, the wear mechanism was abrasive wear and three-body wear[22].
Figure 13 (a-c) showed the morphology of the abrasive debris of Fe55 in different magnification. Different sizes of the abrasive debris were found in Figure 13a. The big debris was formed by the agglomeration of small debris. Meanwhile, the rest of debris was lamellar structure, indicating that the abrasive debris was stripped from the worn surface by microcutting. The unbroken abrasive SiC can be observed. The big debris were formed by the lamellar debris and small abrasive debris agglomeration in Figure 13b. The EDS mapping of Figure 13b were shown in Figure 13e. The results indicated that the main component of big debris was Fe2O3. The Fe element reacted with O element in the water to form fluffy Fe2O3 and adsorbed small debris to form big debris. In Figure 13d, the main components of debris were Fe and Cr. Due to the small size of the debris which can be easily oxidized. Therefore, the O, Fe and Cr elements enrichment areas overlapped. The SiO2 in the welding layer was stripped off resulted in Si enrichment was observed on the debris surface. The C and Cr enrichment areas overlapped in Figure 13e, indicating Cr7C3 was also worn and formed small debris, which explained the occurrence of three-body wear.
Figure 14 (a-c) showed the morphology of debris of Fe55+1.5wt% SiC in different magnification. Strip-shaped debris with length of 250~300 μm marked by the red dashed line showed obvious chipping feature in Figure 14a, which suggested that abrasive wear was the main mechanism. SiC with size of 20~30 μm were also observed, which were produced from the collision and fragmentation between SiC abrasives and hard phases. Due to their small size and high surface energy, agglomeration of debris was observed in Figure 14 (b, c). EDS mapping in Figure 14d indicated the Si enrichment areas correspond to the fragmented SiC particles. Strip-shaped debris mainly consist of Fe and Cr. The region enriched with Cr overlapped with C, indicating that Cr7C3 was peeled off from welding layer. Figure 14e shows the EDS mapping results of Figure 14b where overlapping areas of Si and C enrichment were observed. The SiC had not been fully decomposed and still bear the load. However, the increase in Si content reduced the toughness of welding layer, which explained the reason for strip-shaped debris crack observed in Figure 14a.
Figure 15 showed the morphology of debris of Fe55+1.5wt% SiC+0.01wt% CeO2 in different magnification. Small debris with a flaky shape can be observed to agglomerate into larger debris and showed chipping characteristics in Figure 15a. The flaky shape debris with a uniform size of 0.5~3 μm in Figure 15(b-c) were chipped uniformly by abrasives. In Figure 15d, the flaky shape debris is mainly composed of Cr, Fe, Si, and O elements. However, Ce element was not detected due to low content. As the microstructure was significantly improved resulting in uniformly wear sealing surfaces by co-addition of CeO2 and SiC particles.
3.4. wear Mechanism
The analysis of the SEM microstructure results in Fig. 10-15 indicated that the wear mechanism of the friction system was microcutting and micoploughing. During microcutting, SiC abrasives first formed furrows on the contact surface, causing hard Cr7C3 and soft γ-Fe to peel off from the contact surface and form debris. The amount of debris increased with test time. Although water served as the boundary lubricant for the contact surface, the debris inevitably embedded into the contact surface or escape from the real contact areas by the gaps provided by the topographies of the worn surfaces within the contact zone[23]. This proved that all samples experienced three-body wear.
It is worth noting that, due to the high toughness of γ-Fe, micoploughing can dissipate frictional energy into microplastic deformation. Since water served as the boundary lubricant for the contact surface, some less sharp abrasives were not enough to form microcutting on the contact surface. Instead, they lost their kinetic energy through micoploughing, which dissipated the frictional energy into microplastic deformation and caused curly edges of furrows, as observed in Figure 10d,e, and Figure 12e. The region where micoploughing occurred underwent microplastic deformation in γ-Fe, but excessive microplastic deformation was inhibited by Cr7C3, so these γ-Fe did not peel off from the contact surface. However, literature suggests that microplastic deformation caused by micoploughing leads to plastic fatigue wear [24], resulting in spalling pits caused by plastic fatigue wear in all samples.
When wear began, surface hardness played a key role, with higher hardness indicating stronger wear resistance. Increasing the duration of wear resulted in microplastic deformation. However, when the hardness of the contact surface was excessively high and the toughness was too low, micro-cracks would form and propagate. Costin et al. indicated that the hardness and toughness of wear-resistant materials should be matched[25].
Due to the predominance of dendritic microstructure and coarse grain size in the Fe55 welding layer, its hardness and toughness were the lowest among all the samples. Once microcracks formed, their propagation could not be inhibited. Figure 16a showed the microcrack generated after the friction test on Fe55, with a length of 10 μm, and no evidence of microcrack termination was observed. This indicated that Cr7C3 did not inhibit the microplastic deformation occurring in γ-Fe. The microcracks expanded with increasing of friction time and eventually led to spalling, which explained why the wear mass loss of Fe55 was the highest among all the samples.
When SiC was added to the welding layer, due to its lower density compared to the molten steel, SiC floated to the surface of the molten steel during the melting process. SiC decomposed into Si and C, increasing the number of interstitial solute atoms in the surface of welding layer and enhancing the hardness of γ-Fe. The high hardness prevented the embedding of abrasive particles but could potentially lead to a decrease in toughness. Since hardness determined the wear mass loss in the early stage of friction, the Fe55+1.5wt%SiC sample with the highest surface hardness exhibited the lowest wear loss initially.
However, the results in Figure 5b-2 indicated that the distribution of SiC was non-uniform. This resulted in regions with SiC agglomeration having higher microhardness, while areas without SiC had lower microhardness. The uneven hardness distribution made it easier for microcracks to propagate in the SiC agglomeration regions, with a length of 7 μm in Figure 16b. However, the regions without SiC experienced deep plowing grooves. Therefore, when the friction time reached 15 minutes, the wear mass loss of the Fe55+SiC sample was already approaching that the Fe55+1.5wt% SiC+0.01wt% CeO2 sample with lower surface hardness.
After co-added of SiC and CeO2, CeO2 decomposed into Ce and O during the spraying process. Ce hindered the agglomeration of SiC particles and the diffusion of C and Cr atoms. Resulting in uniform distribution of C and Si in the molten pool. As a result, the microstructure and hardness uniformity were improved, thereby enhancing resistance to microcutting and plastic fatigue wear. During microcutting, the uniformly distributed Cr7C3 hard phase prevented excessive cutting of γ-Fe by abrasive particles, reduced the microcutting volume and prevented the generation of more abrasive particles. In Figure 12f, no significant embedding of abrasive particles as observed in Figure 10f. Figure 8c demonstrated that the microstructure and hardness of the welding layer only varied with temperature gradients. After the high-hardness region on the surface was worn, other regions could still maintain their hardness and toughness, avoiding excessive wear losses. While micoploughing happened, the increased toughness reduced fatigue wear caused by microplastic deformation, and the uniformly distributed Cr7C3 hard phase prevented excessive microplastic deformation. The microcrack shown in Figure 16c with length of 3 μm and exhibit a distinct characteristic of being inhibited.
4. Conclusions
(1) Co-addition of 0.01wt% CeO2 and 1.5 wt% SiC increased the viscosity and decreased G/R ratio of the molten steel. The distribution of SiC were uniform and acted as nucleation points of γ-Fe, which promoted the formation of equiaxed grains.
(2) Co-addition of 0.01wt%CeO2 and 1.5 wt% SiC reduced the liquid phase diffusion coefficient DL, resulting in nucleation points uniformly distributed in γ-Fe. The temperature gradient perpendicular to the steel substrate provided a driving force for dendrite solidification, the dendrite exhibited a directional growth pattern perpendicular to the substrate. Leading to the transitional states of microstructure.
(3) Co-addition of 0.01wt%CeO2 and 1.5 wt% SiC promoted the diffuse distribution of SiC and Cr7C3 which bear the friction load uniformly. The dense furrows on the surface indicated that the samples were worn uniformly.
(4) The sub-wear mechanism of the friction system was microcutting and micoploughing, the uniform distribution of Cr7C3 could prevented excessive microplastic deformation, indicating the hardness and toughness of Fe55+1.5wt% SiC+0.01wt%CeO2 was well-matched.
Author Contributions
Conceptualization, F.H, Z. M., Y.J., X.C. and L.Y.; writing original draft preparation, F.H; writing review and editing, L.Y., X.C., F.H., Z. M., M.S., X.L., and Y.J.; supervision, Y.J., F.H., Z. M., and X.C.; project administration, L.Y., X.C. and Z. M.; funding acquisition, L.Y., X.C. and Z. M. All authors have read and agreed to the published version of the manuscript.
Funding
The work was supported by the Scientific Research Program of Hunan Department of Education 19A126, open fund of key laboratory of new processing technology for nonferrous metal & materials, ministry of education/Guangxi key laboratory of optical and electronic materials and devices (22AA-11 and No. 20KF-4), Guangxi Innovation Driven Development Project (Grant No. AA17204021). and Foundation of introduction of senior talents in Hebei Province (H192003015).
Institutional Review Board Statement
Not applicable.
Informed Consent Statement
Not applicable.
Data Availability Statement
Data sharing is not applicable for this article.
Conflicts of Interest
The authors declare no conflict of interest.
References
- Moses, D.; Haider, G.; Henshaw, J. An investigation of the failure of a 1/4" ball valve. Engineering Failure Analysis 2019, 100, 393-405. [CrossRef]
- Ou, G.; Ouyang, P.; Zheng, Z.; Jin, H.; Bie, K.; Wang, C. Investigation on failure process and structural improvement of a high-pressure coal water slurry valve. Engineering Failure Analysis 2019, 96, 1-17. [CrossRef]
- Yunxia, C.; Wenjun, G.; Rui, K. Coupling behavior between adhesive and abrasive wear mechanism of aero-hydraulic spool valves. Chinese Journal of Aeronautics 2016, 29, 1119-1131. [CrossRef]
- Kanishka, K.; Acherjee, B. A systematic review of additive manufacturing-based remanufacturing techniques for component repair and restoration. Journal of Manufacturing Processes 2023, 89, 220-283. [CrossRef]
- Liu, S.-H.; Trelles, J.P.; Li, C.-J.; Li, C.-X.; Guo, H.-B. A review and progress of multiphase flows in atmospheric and low pressure plasma spray advanced coating. Materials Today Physics 2022, 27. [CrossRef]
- Zhang, Z.; Wang, X.; Zhang, Q.; Liang, Y.; Ren, L.; Li, X. Fabrication of Fe-based composite coatings reinforced by TiC particles and its microstructure and wear resistance of 40Cr gear steel by low energy pulsed laser cladding. Optics & Laser Technology 2019, 119. [CrossRef]
- Ning, J.; Lan, Q.; Zhu, L.; Xu, L.; Yang, Z.; Xu, P.; Xue, P.; Xin, B. Microstructure and mechanical properties of SiC-reinforced Inconel 718 composites fabricated by laser cladding. Surface and Coatings Technology 2023, 463. [CrossRef]
- Zhang, Y.; Zong, B.Y.; Jin, J.; Cao, X. Electroless copper plating on particulate reinforcements and effects on mechanical properties of SiCp/Fe composite. Surface Engineering 2014, 31, 232-239. [CrossRef]
- Chen, L.; Zhao, Y.; Guan, C.; Yu, T. Effects of CeO2 addition on microstructure and properties of ceramics reinforced Fe-based coatings by laser cladding. The International Journal of Advanced Manufacturing Technology 2021, 115, 2581-2593. [CrossRef]
- Gao, Z.; Ren, H.; Geng, H.; Yu, Y.; Gao, Z.; Zhang, C. Effect of CeO2 on Microstructure and Wear Property of Laser Cladding Ni-Based Coatings Fabricated on 35CrMoV Steel. Journal of Materials Engineering and Performance 2022, 31, 9534-9543. [CrossRef]
- Cai, Y.; Luo, Z.; Chen, Y.; Ao, S. Influence of CeO2 on tribological behaviour of TiC/Fe-based composite coating. Surface Engineering 2017, 33, 936-943. [CrossRef]
- Liu, H.; Yuan, X.; Rao, L.; Liu, S.; Shi, Z.; Zhou, Y.; Yang, Q. Refinement mechanism of NbC by CeO2 in hypereutectic Fe-Cr-C hardfacing coating. Journal of Alloys and Compounds 2019, 770, 1016-1028. [CrossRef]
- Wang, F.-c.; Du, X.-d.; Zhan, M.-j.; Lang, J.-w.; Zhou, D.; Liu, G.-f.; Shen, J. Microstructure and Mechanical Properties of Cr-SiC Particles-Reinforced Fe-Based Alloy Coating. Journal of Materials Engineering and Performance 2015, 24, 4673-4680. [CrossRef]
- Liu, Y.-F.; Xia, Z.-Y.; Han, J.-M.; Zhang, G.-L.; Yang, S.-Z. Microstructure and wear behavior of (Cr,Fe)7C3 reinforced composite coating produced by plasma transferred arc weld-surfacing process. Surface and Coatings Technology 2006, 201, 863-867. [CrossRef]
- Wang, Q.; Bai, X.; Sun, B.; Liu, J.; Cai, Z.; Liang, X.; Shen, B. Influence of Si on tribological behavior of laser cladded Fe-based amorphous/crystalline composite coatings. Surface and Coatings Technology 2021, 405. [CrossRef]
- Qi, X.; Li, Y.; Li, F.; Du, J.; Li, C.; Wang, K.; Lu, H.; Yang, B. Improving the properties of remanufactured wear parts of shield tunneling machines by novel Fe-based composite coatings. Ceramics International 2022, 48, 6722-6733. [CrossRef]
- Gou, J.; Wang, Y.; Zhang, Y.; Wang, C.; Wang, G. Dry sliding wear behavior of Fe–Cr–C–B hardfacing alloy modified with nano-CeO2 and its mechanisms of modification. Wear 2021, 484-485. [CrossRef]
- Wang, K.; Ma, Q.; Xu, J.; Liao, T.; Wang, P.; Chen, R.; Qian, Y.; Li, L. Effect of material non-uniformity and residual stress on wear and transient rolling contact behaviour in laminar plasma quenched (LPQ) rails. Wear 2023, 523. [CrossRef]
- Levy, A.V.; Chik, P. The effects of erodent composition and shape on the erosion of steel. Wear 1983, 89, 151-162. [CrossRef]
- Stosiak, M.; Karpenko, M.; Deptuła, A.; Urbanowicz, K.; Skačkauskas, P.; Cieślicki, R.; Deptuła, A.M. Modelling and Experimental Verification of the Interaction in a Hydraulic Directional Control Valve Spool Pair. Applied Sciences 2022, 13. [CrossRef]
- Babu, P.S.; Basu, B.; Sundararajan, G. The influence of erodent hardness on the erosion behavior of detonation sprayed WC-12Co coatings. Wear 2011, 270, 903-913. [CrossRef]
- Ismailov, A.; Järveläinen, M.; Levänen, E. Problematics of friction in a high-speed rubber-wheel wear test system: A case study of irregularly rough steel in water lubricated contact. Wear 2018, 408-409, 65-71. [CrossRef]
- Fischer, A.; Beckmann, C.; Heermant, S.; Wittrock, A.; Telouk, P.; Debus, J.; Wimmer, M.A. Topography rules the ultra-mild wear regime under boundary lubricated gross-slip fretting corrosion. Wear 2023, 522. [CrossRef]
- Su, C.; Feng, G.; Zhi, J.; Zhao, B.; Wu, W. The Effect of Rare Earth Cerium on Microstructure and Properties of Low Alloy Wear-Resistant Steel. Metals 2022, 12. [CrossRef]
- Costin, W.L.; Lavigne, O.; Kotousov, A. A study on the relationship between microstructure and mechanical properties of acicular ferrite and upper bainite. Materials Science and Engineering: A 2016, 663, 193-203. [CrossRef]
Figure 1.
Schematic diagram of 3D PSM system and process. (a) 3D PSM system; (b) schematic diagram of the 3D PSM process.
Figure 1.
Schematic diagram of 3D PSM system and process. (a) 3D PSM system; (b) schematic diagram of the 3D PSM process.
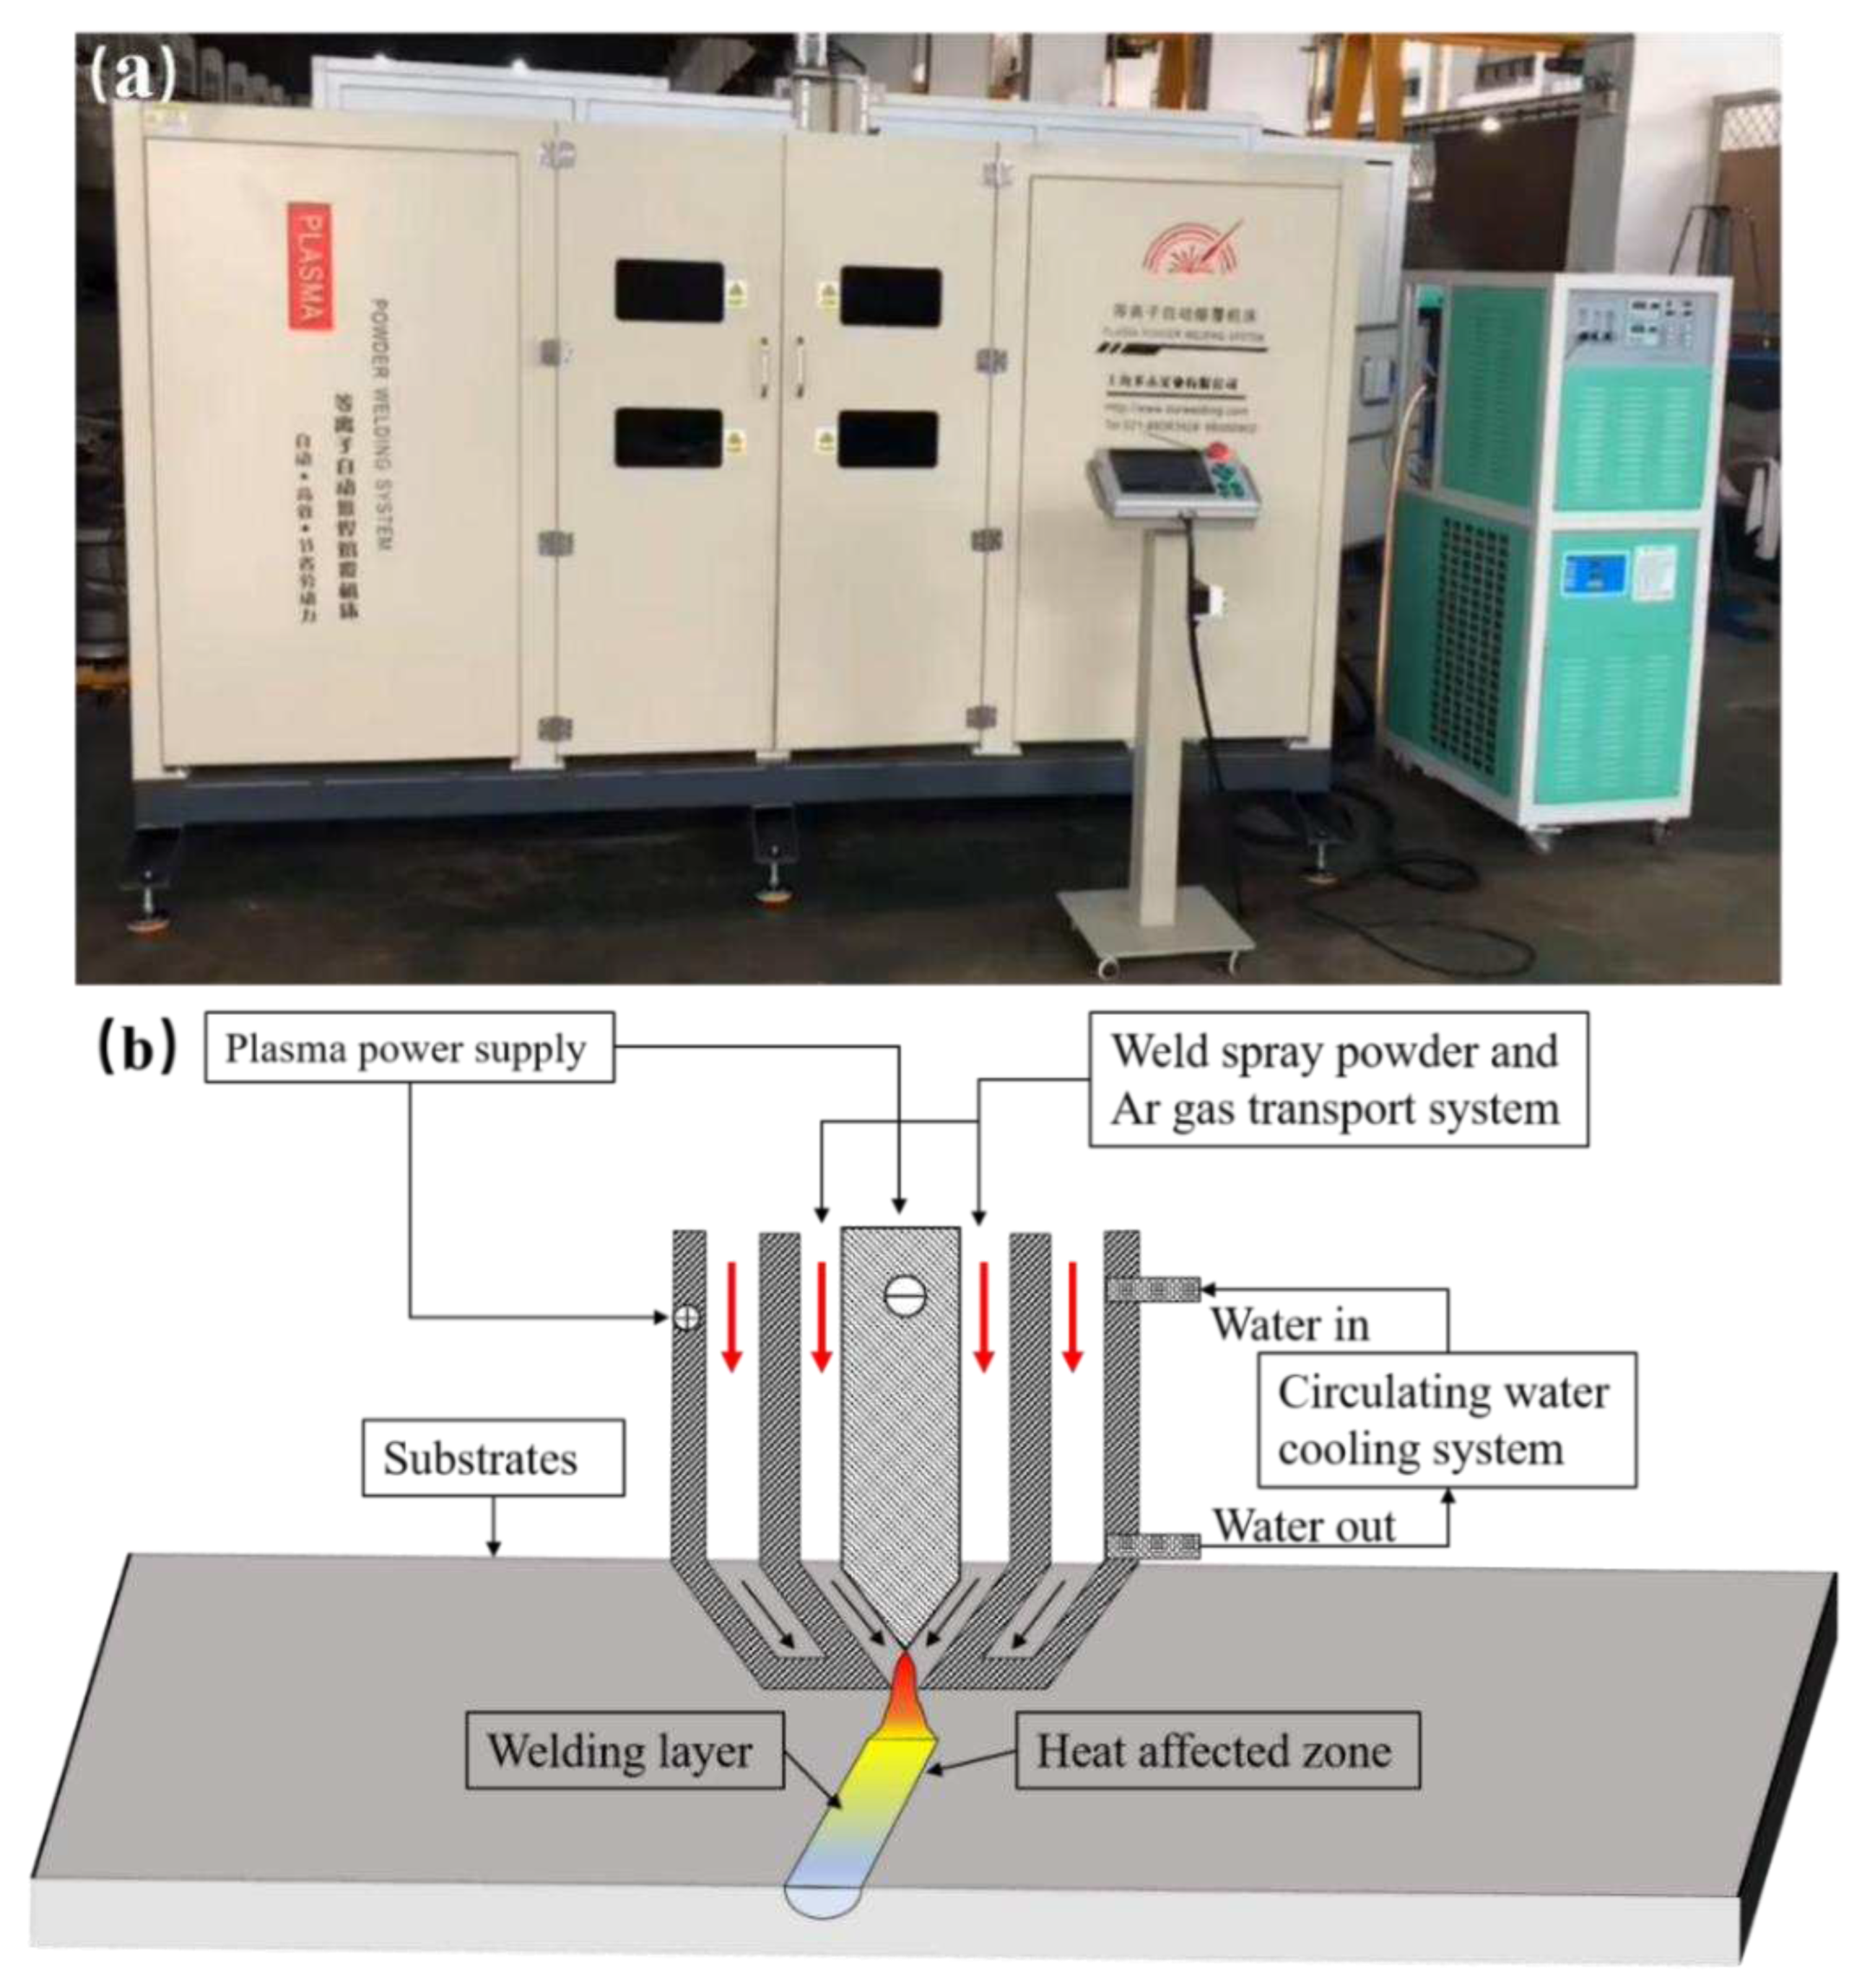
Figure 2.
LGM-225 wet sand rubber wheel friction tester and schematic diagram of wear process (a) tester; (b) schematic diagram of wear process.
Figure 2.
LGM-225 wet sand rubber wheel friction tester and schematic diagram of wear process (a) tester; (b) schematic diagram of wear process.
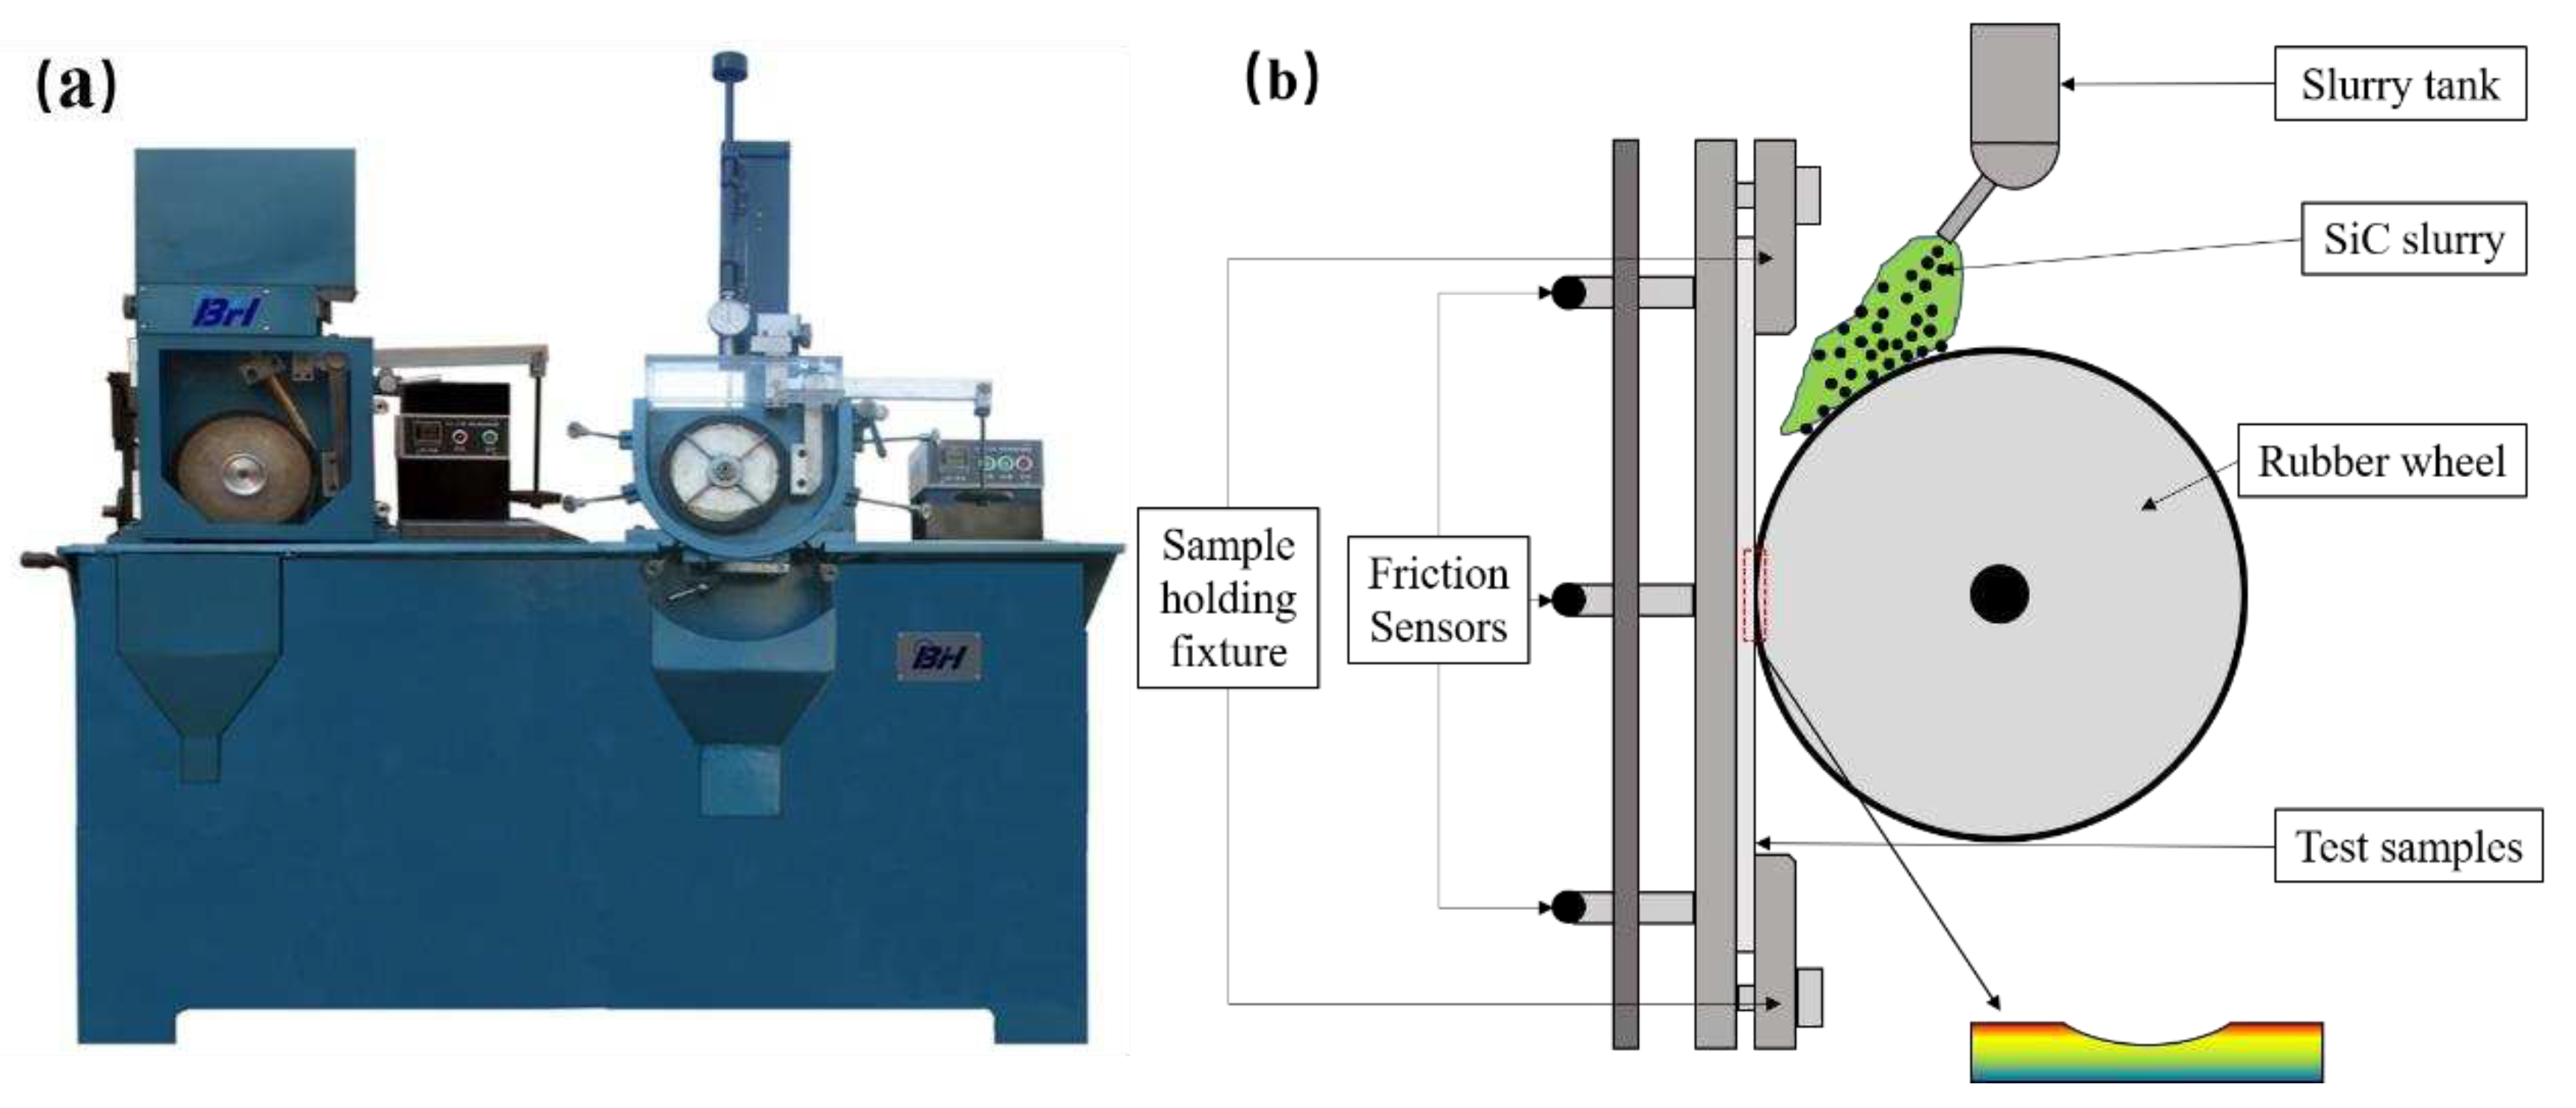
Figure 3.
Powder microstructure and EDS mapping of Fe55+1.5wt% SiC.
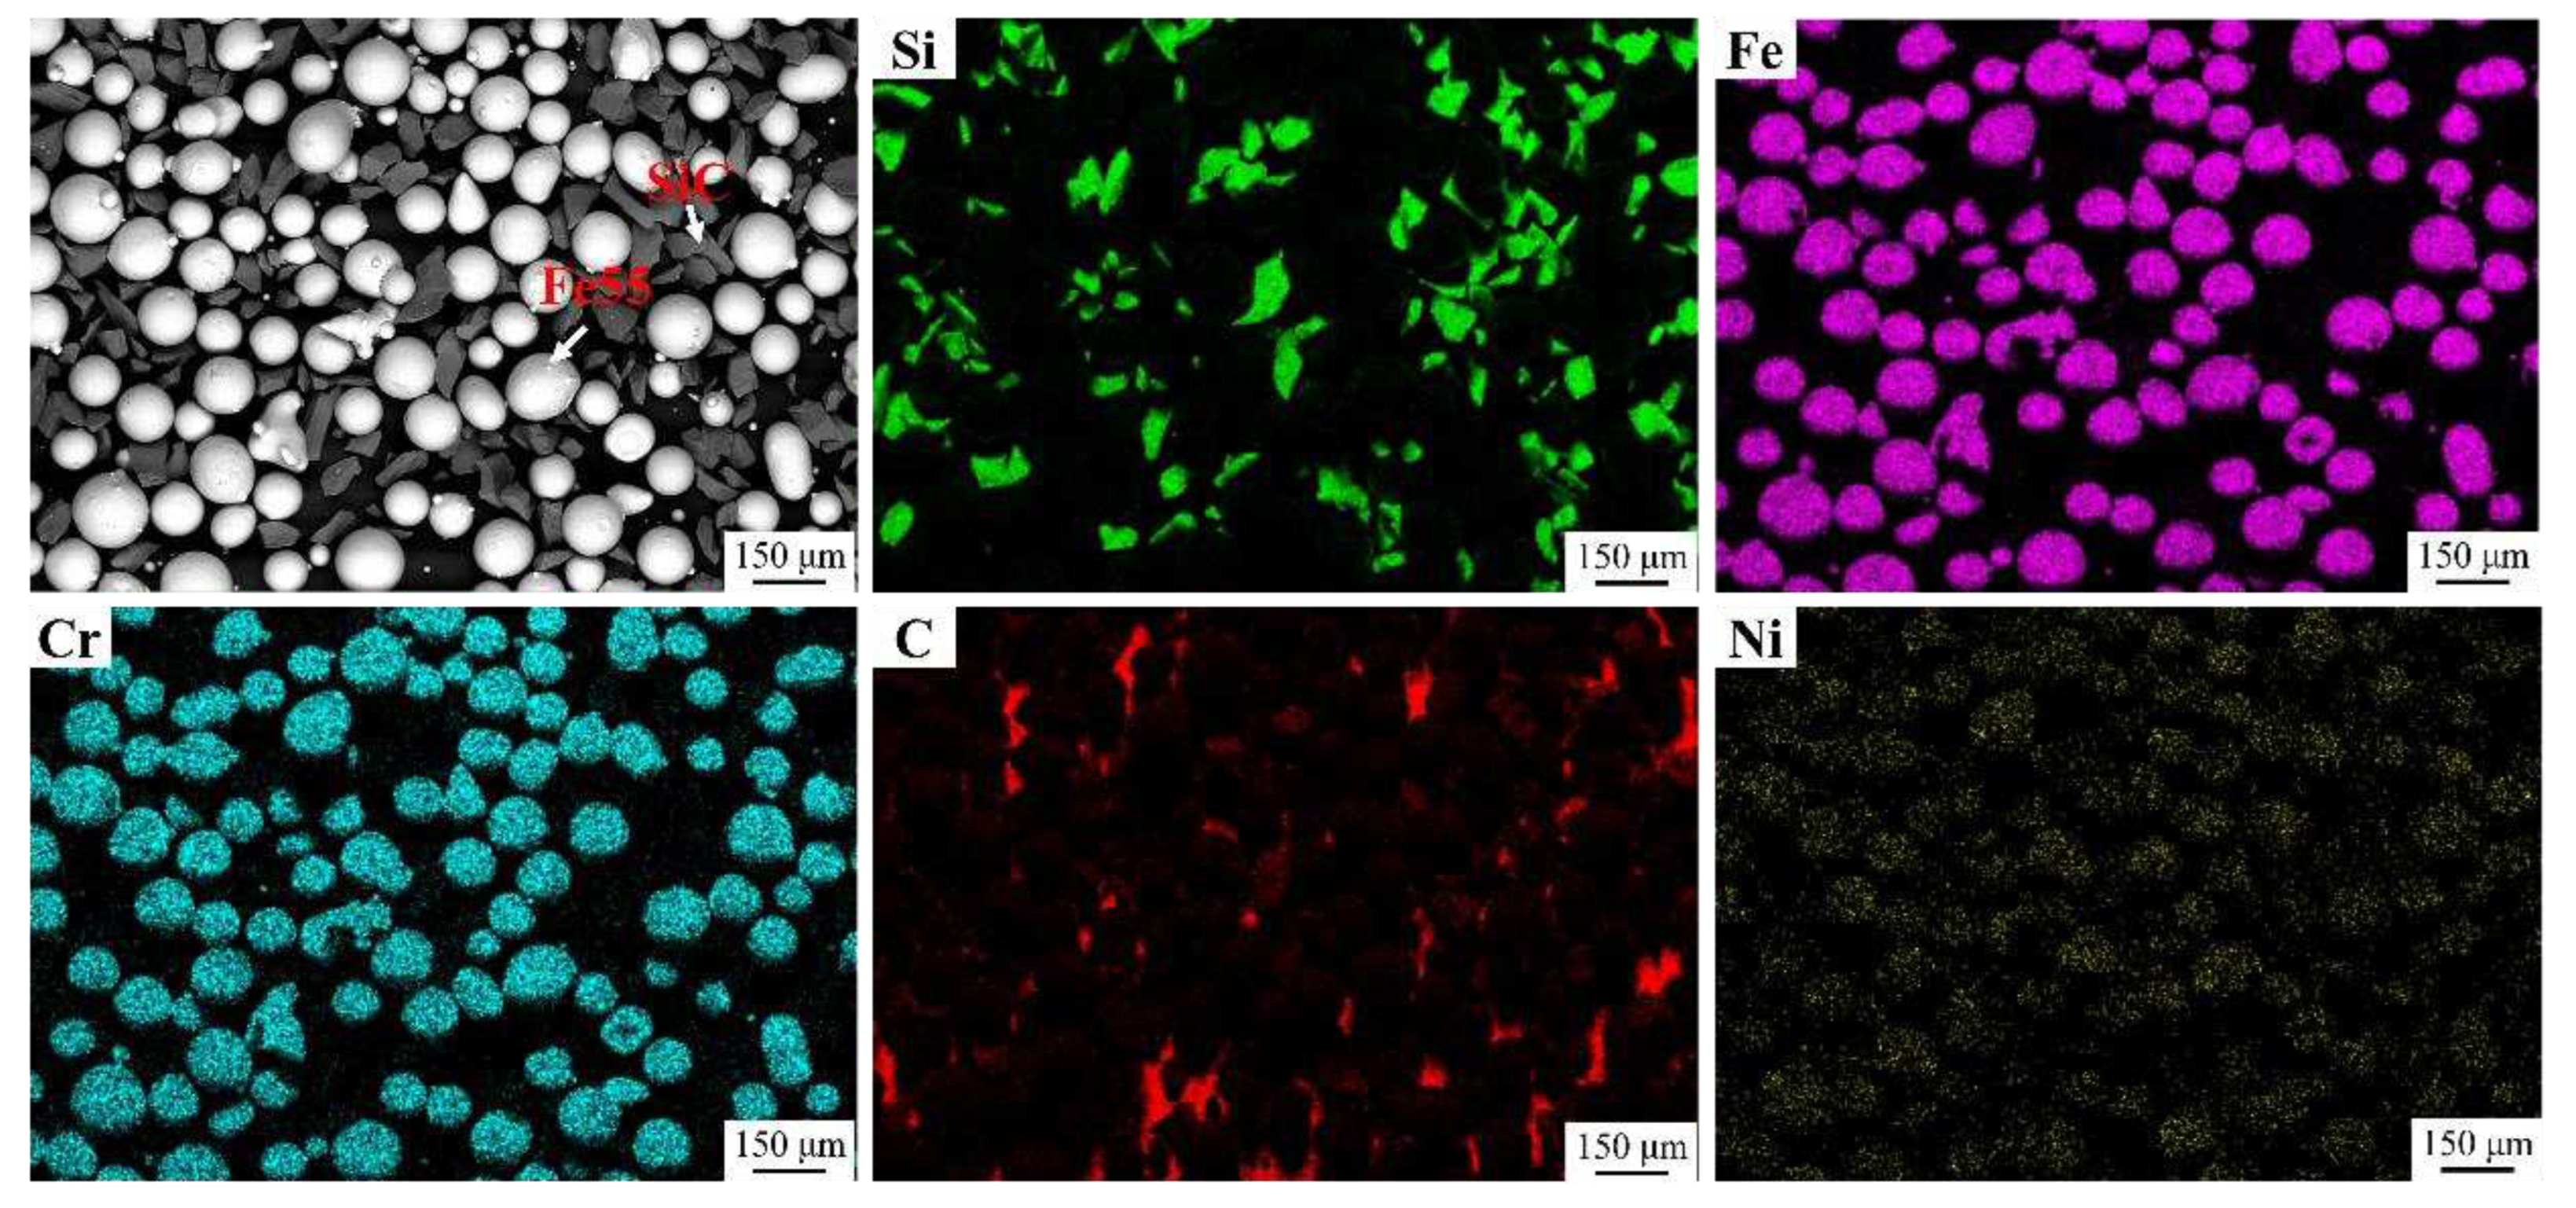
Figure 4.
SEM micrographs and EDS mapping of Fe55+1.5wt% SiC+0.01wt% CeO2 (a) Fe55+1.5wt% SiC+0.01wt% CeO2 SEM micrographs and EDS mapping; (a-1) Ce, (a-2) Si, (a-3) Fe, (a-4) Cr, (a-5) C; (b) SEM micrographs and EDS mapping of SiC particle (b-1) Ce, (b-2) Si, (b-3) Fe, (b-4) Cr, (b-5) C.
Figure 4.
SEM micrographs and EDS mapping of Fe55+1.5wt% SiC+0.01wt% CeO2 (a) Fe55+1.5wt% SiC+0.01wt% CeO2 SEM micrographs and EDS mapping; (a-1) Ce, (a-2) Si, (a-3) Fe, (a-4) Cr, (a-5) C; (b) SEM micrographs and EDS mapping of SiC particle (b-1) Ce, (b-2) Si, (b-3) Fe, (b-4) Cr, (b-5) C.
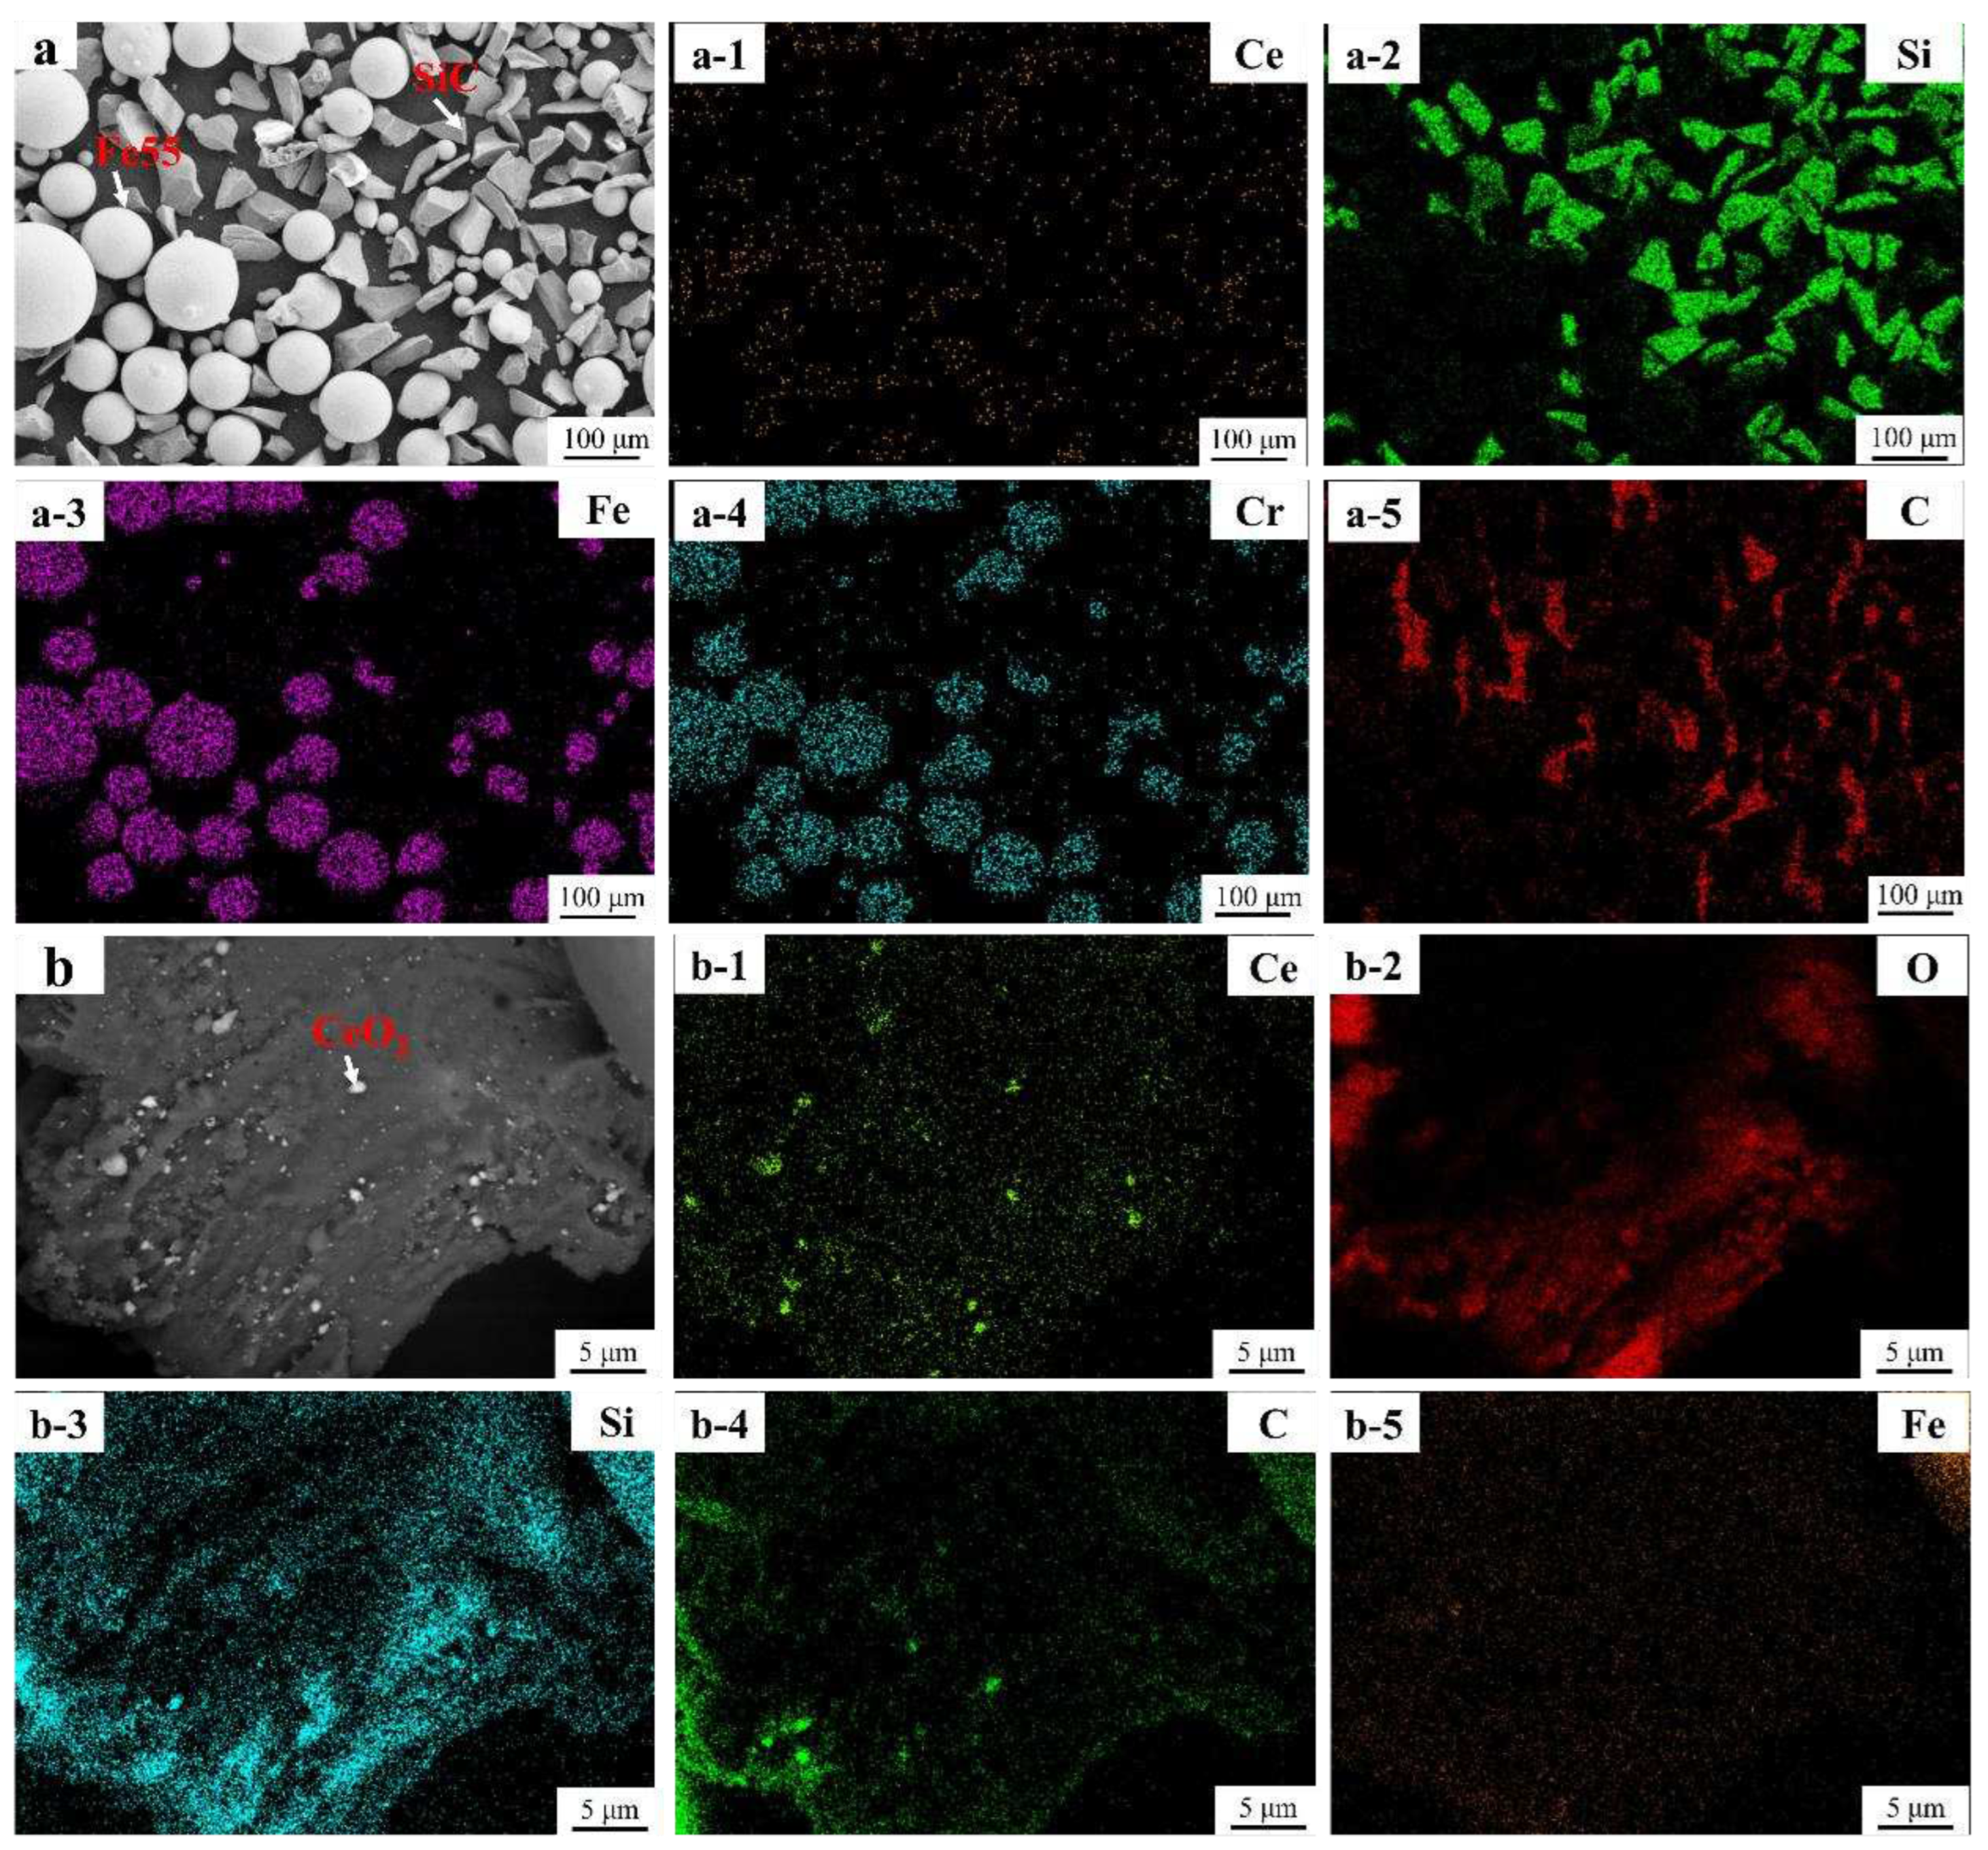
Figure 6.
Schematic diagram of welding layer.
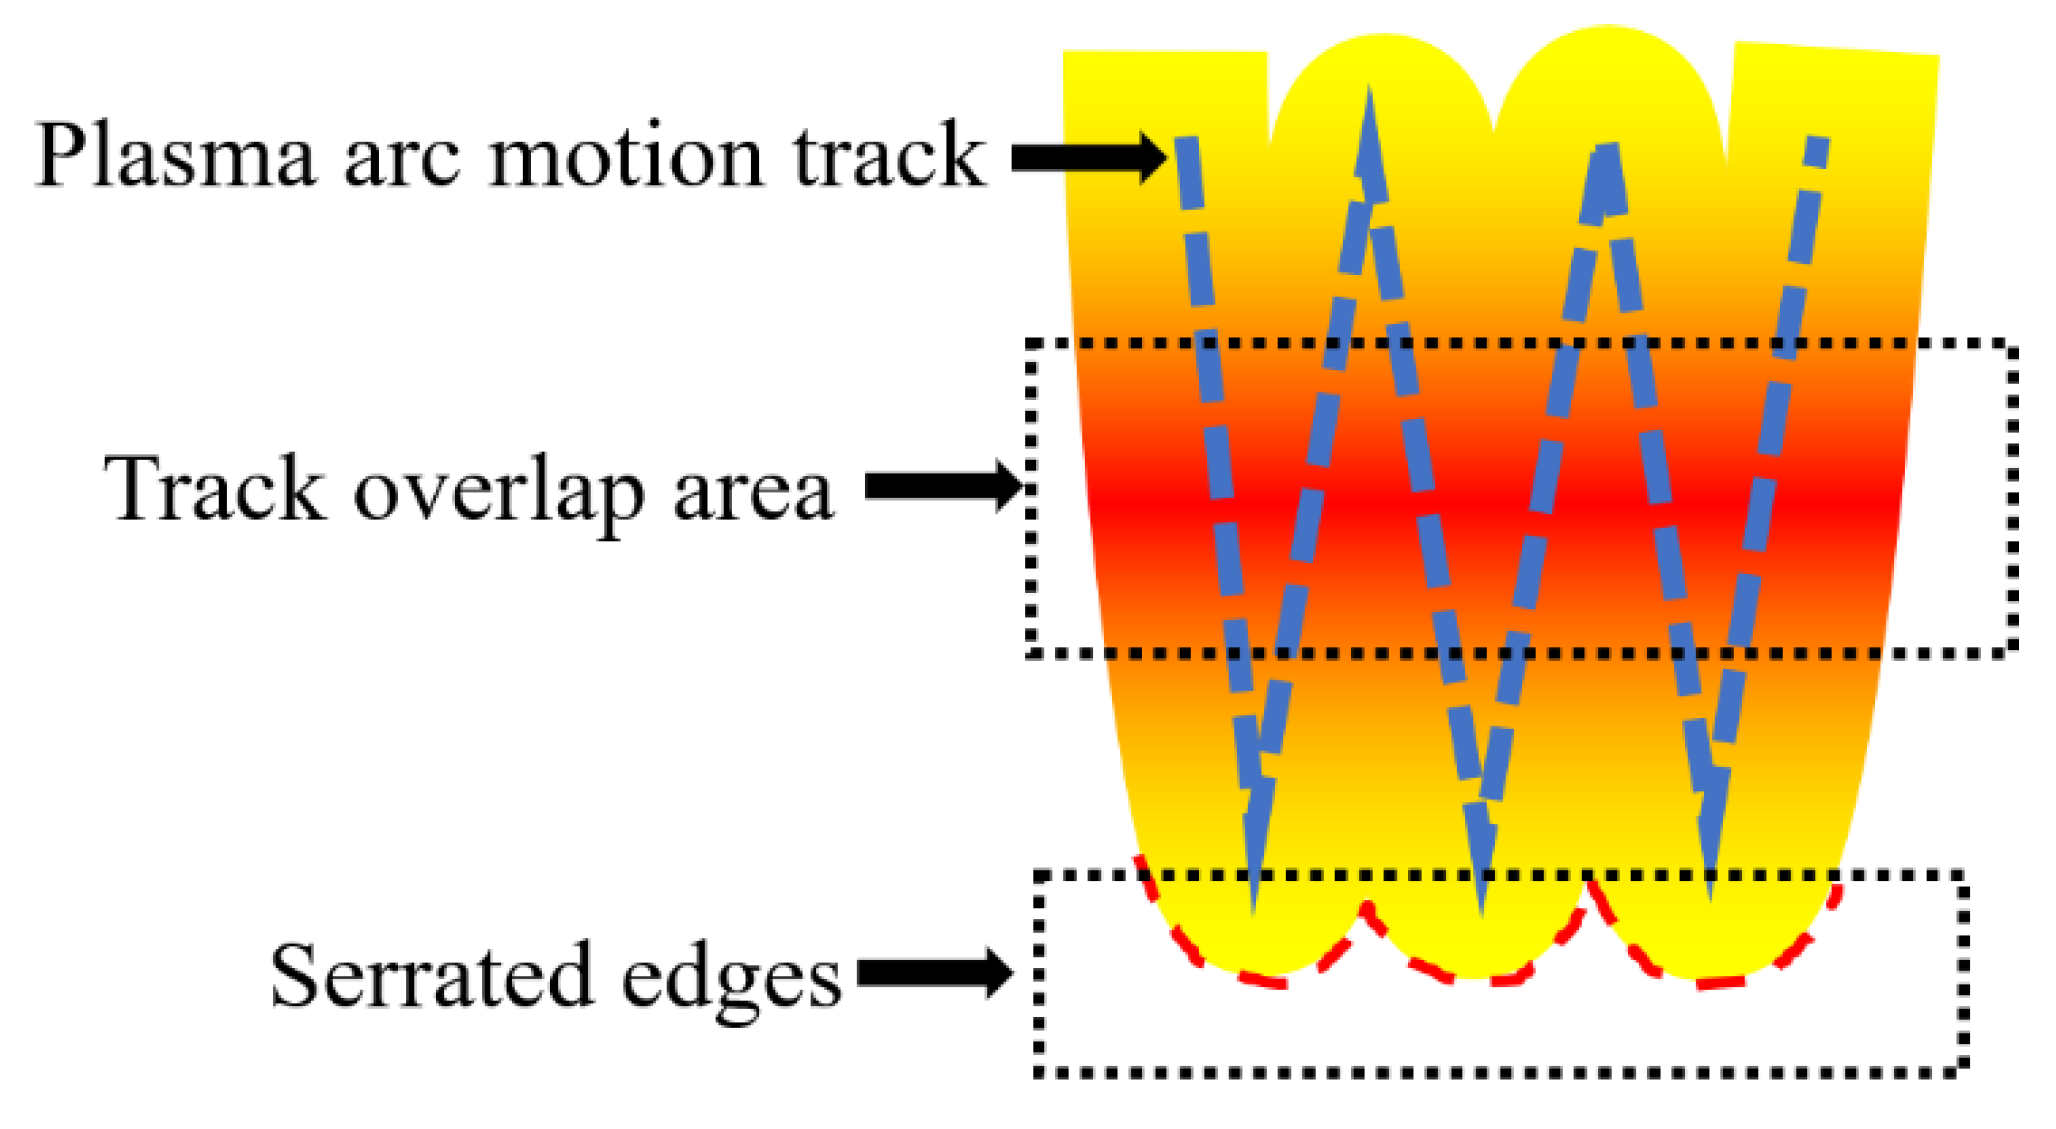
Figure 7.
Effect of G and R on the morphology and dimensions of the solidified microstructure.
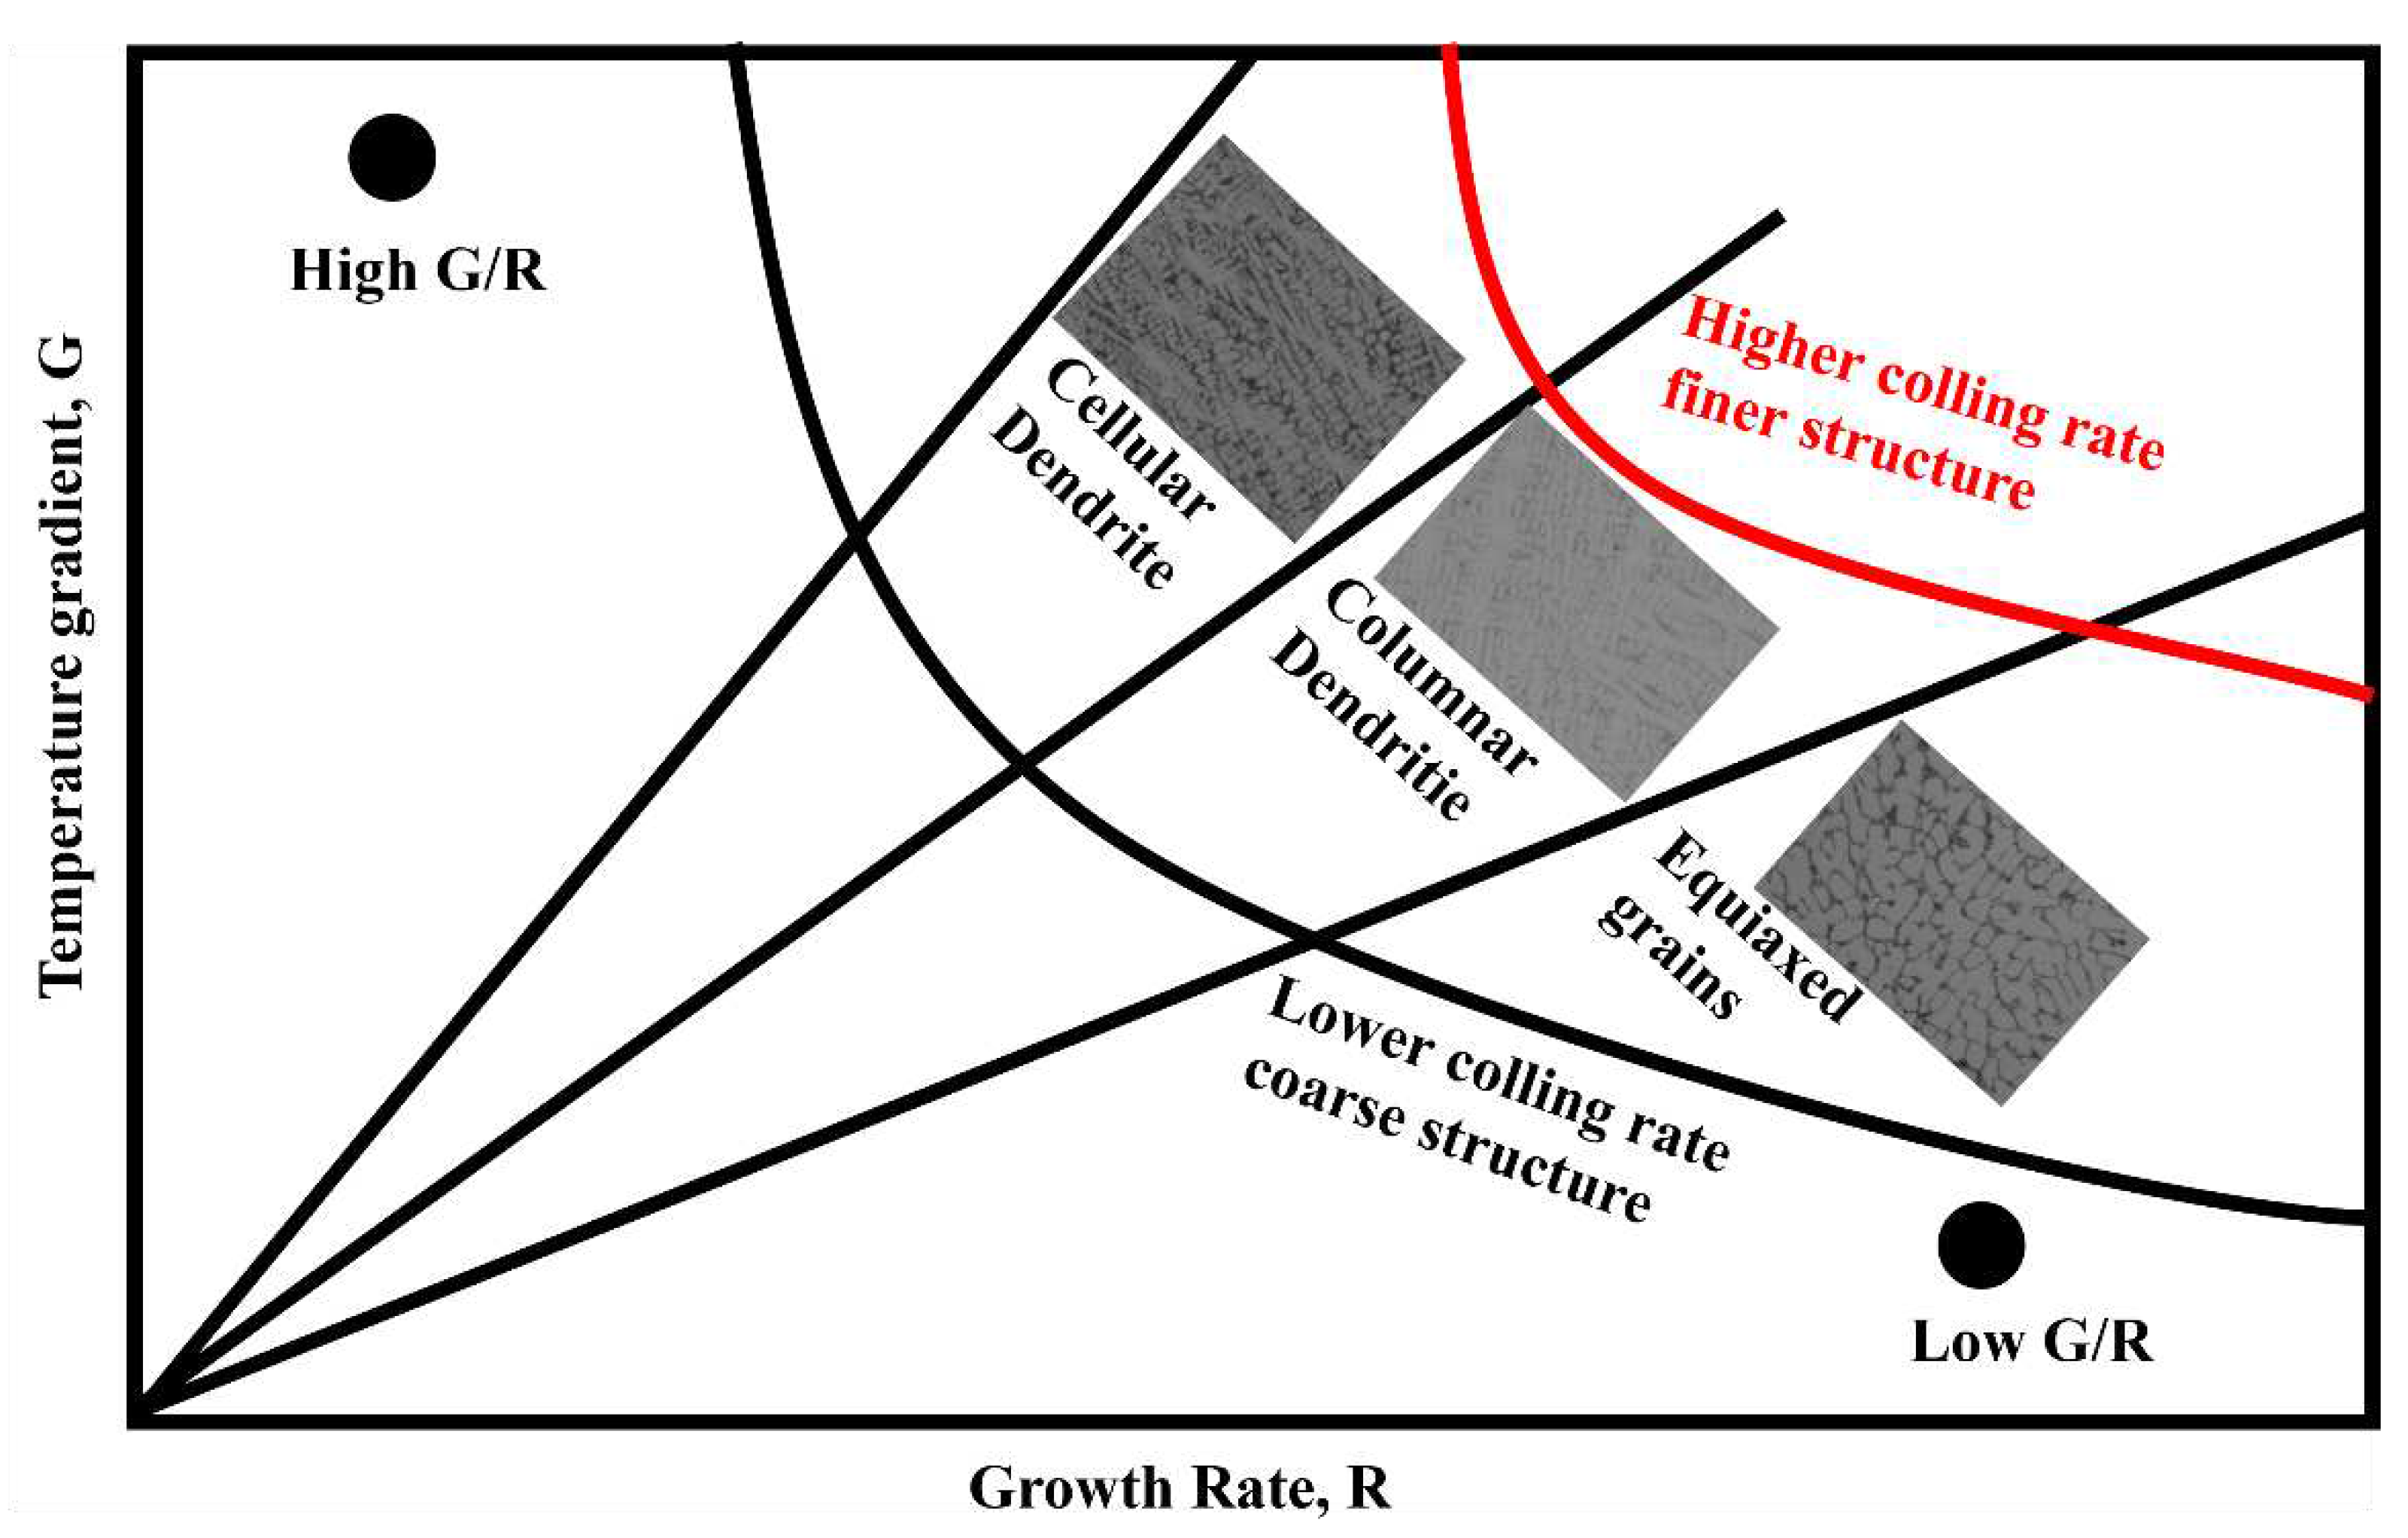
Figure 8.
Microhardness test and welding layer interface. (a) Microhardness; (b) Fe55; (c) Fe55+1.5wt% SiC+0.01wt%CeO2;(d) Fe55+1.5wt% SiC.
Figure 8.
Microhardness test and welding layer interface. (a) Microhardness; (b) Fe55; (c) Fe55+1.5wt% SiC+0.01wt%CeO2;(d) Fe55+1.5wt% SiC.
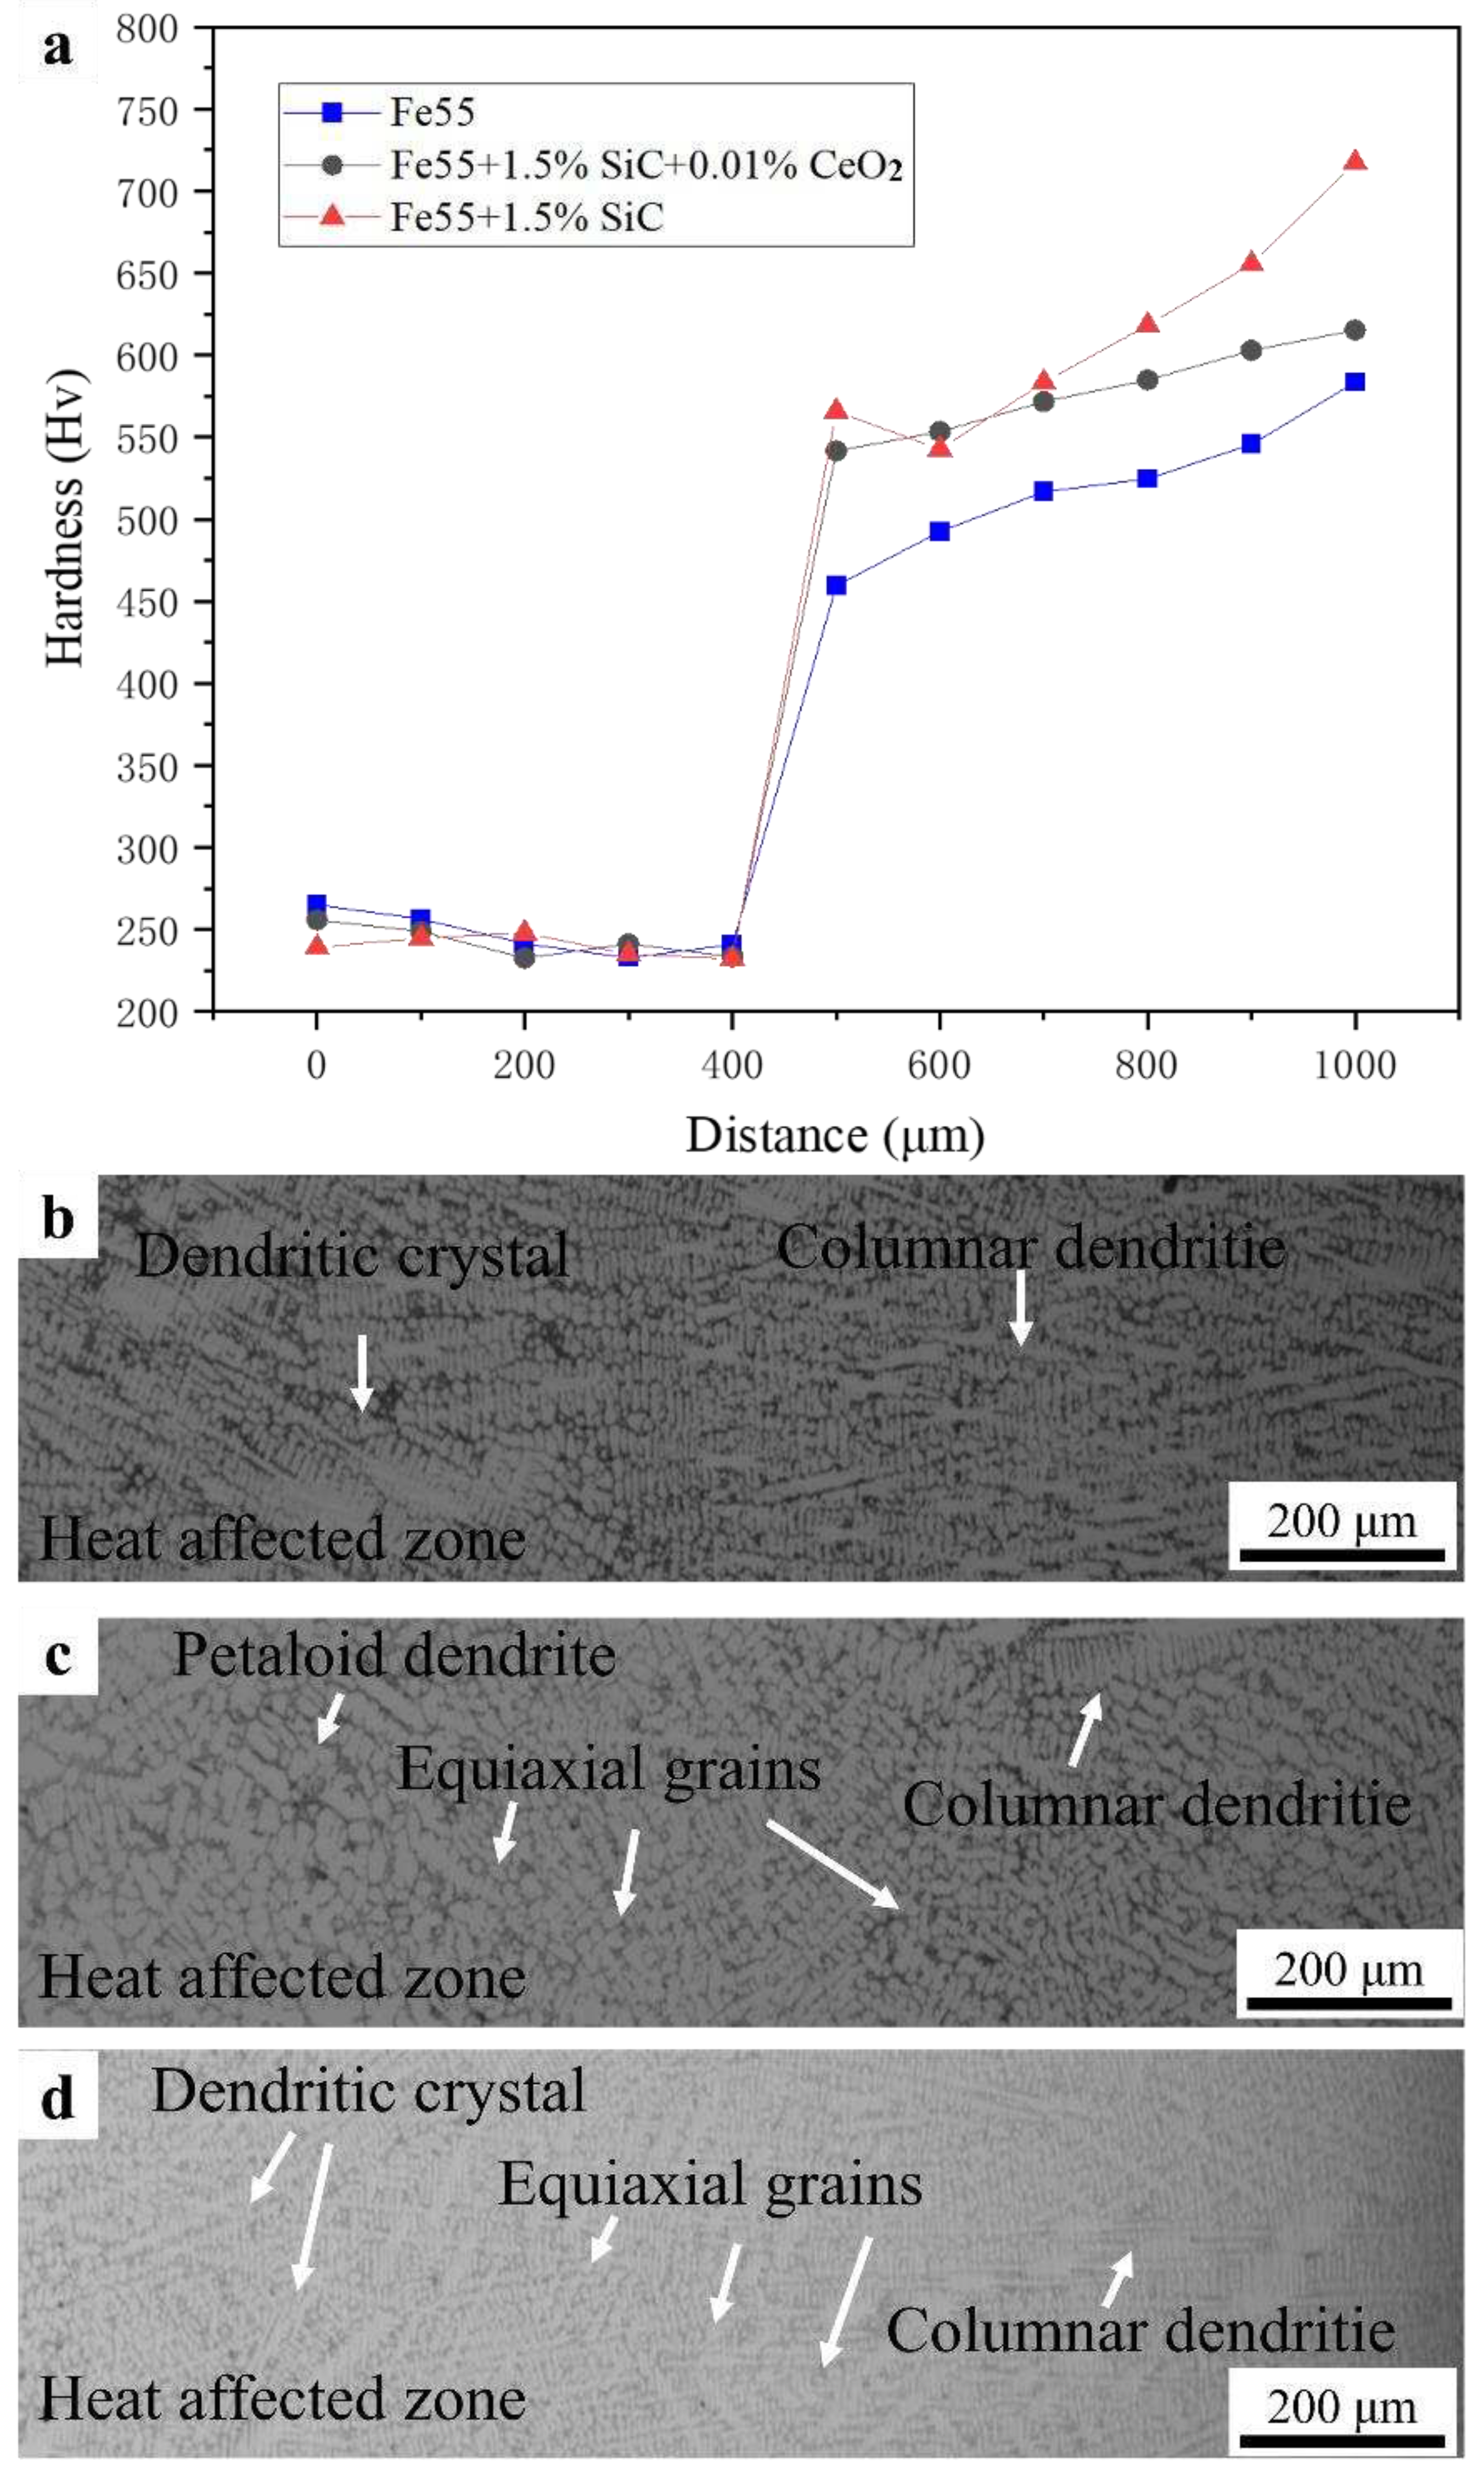
Figure 9.
Wear mass loss of the sample after a 15 min test under 20 N.
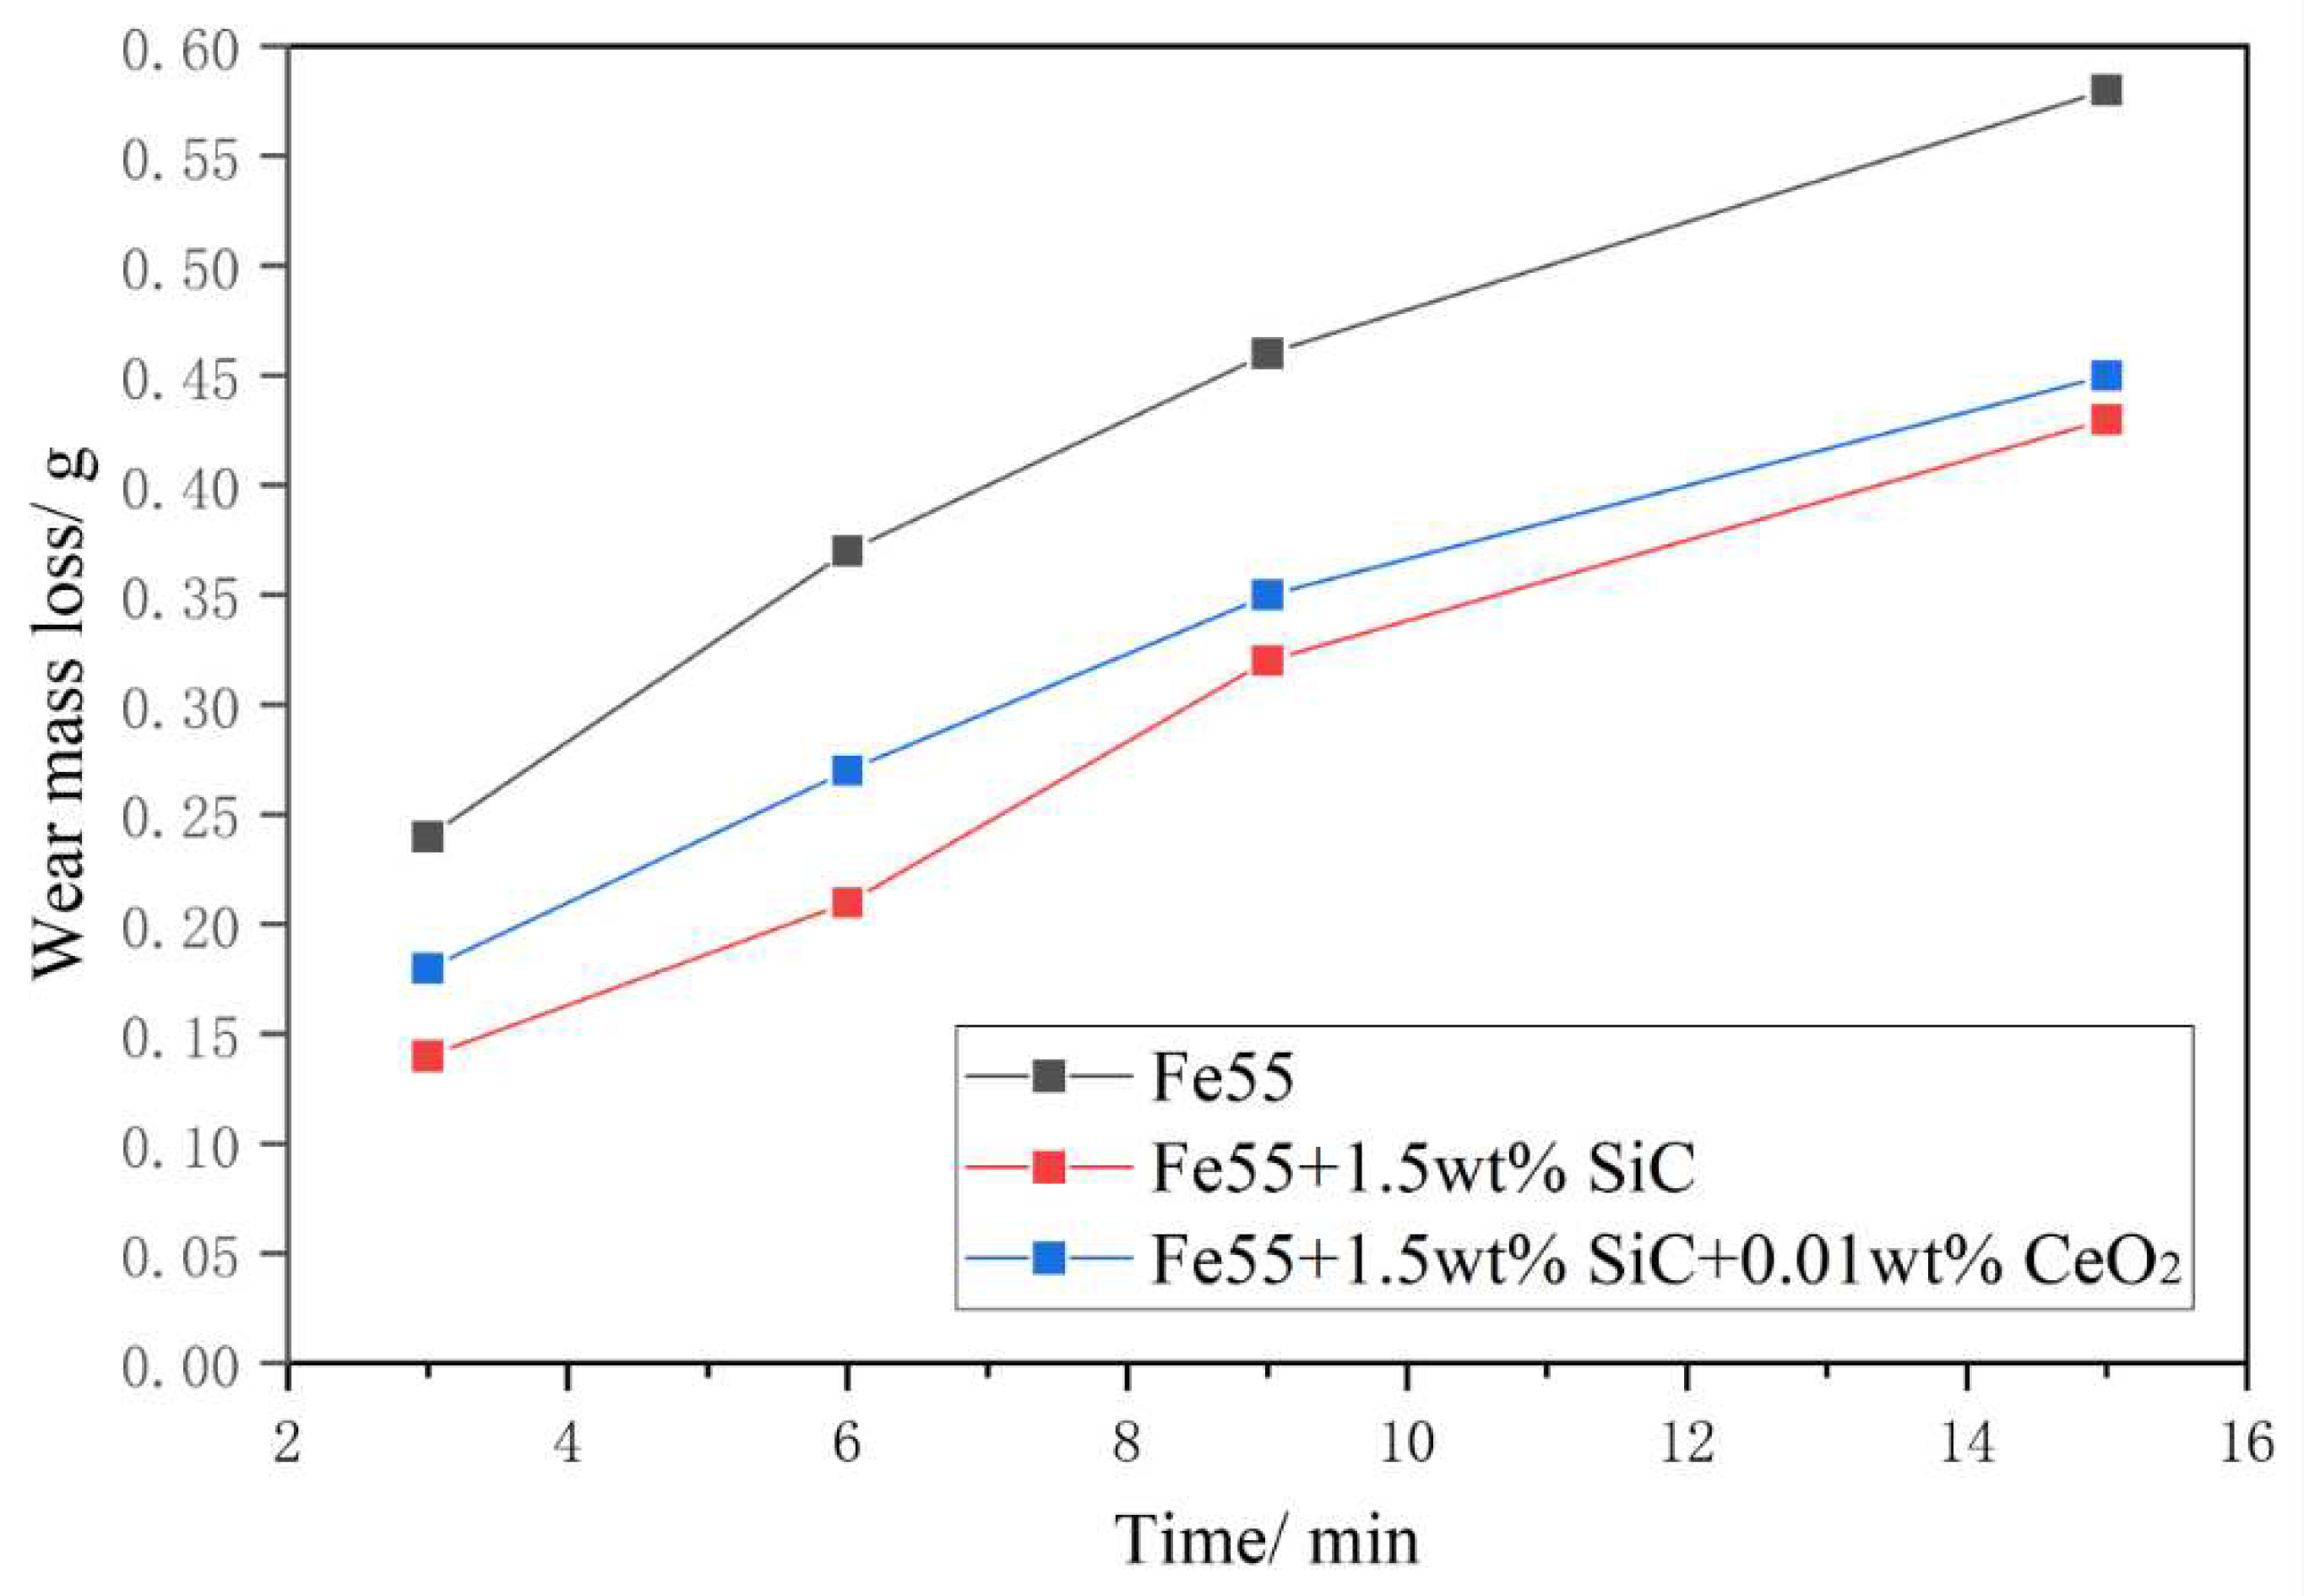
Figure 10.
Roughness and morphology of Fe55 worn surface (a) 3D morphology of the worn surface; (b) Surface roughness value; (c) ×250; (d) ×500; (e) ×2000; (f) ×5000.
Figure 10.
Roughness and morphology of Fe55 worn surface (a) 3D morphology of the worn surface; (b) Surface roughness value; (c) ×250; (d) ×500; (e) ×2000; (f) ×5000.
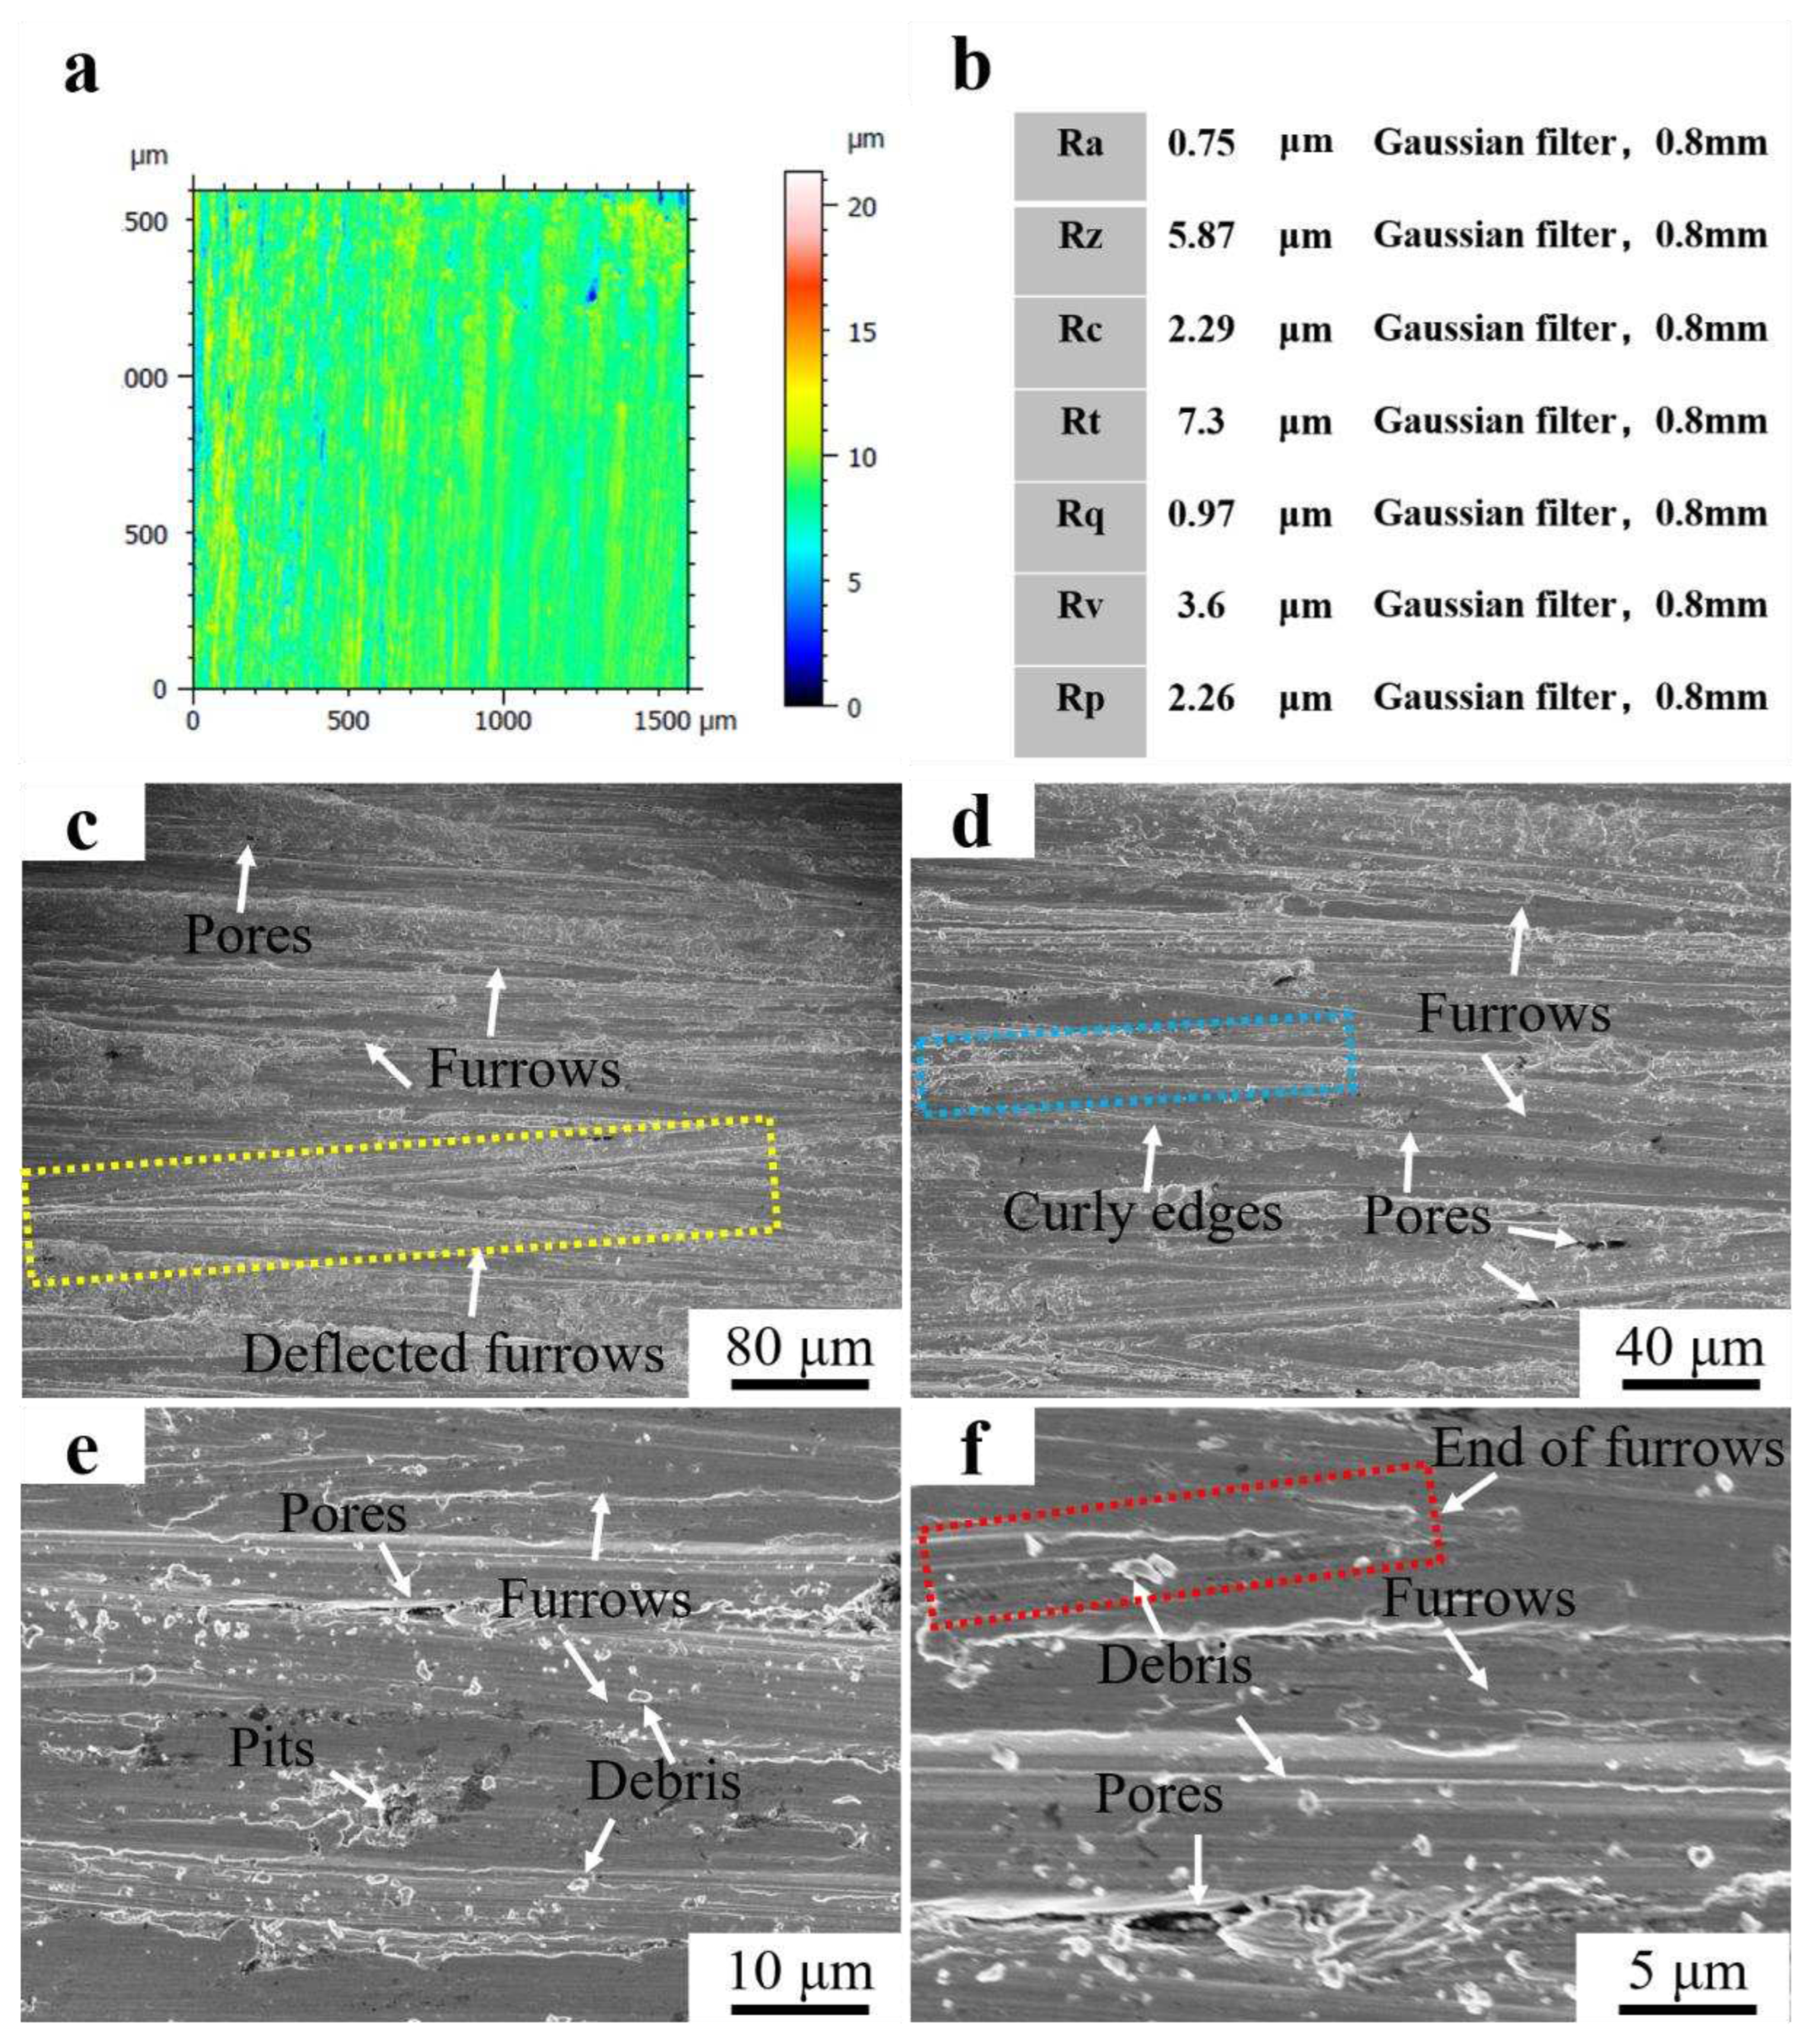
Figure 11.
Roughness and morphology of Fe55+1.5 wt% SiC worn surface. (a) 3D morphology of the worn surface; (b) Surface roughness value; (c) ×250; (d) ×500; (e) ×2000; (f) ×5000.
Figure 11.
Roughness and morphology of Fe55+1.5 wt% SiC worn surface. (a) 3D morphology of the worn surface; (b) Surface roughness value; (c) ×250; (d) ×500; (e) ×2000; (f) ×5000.
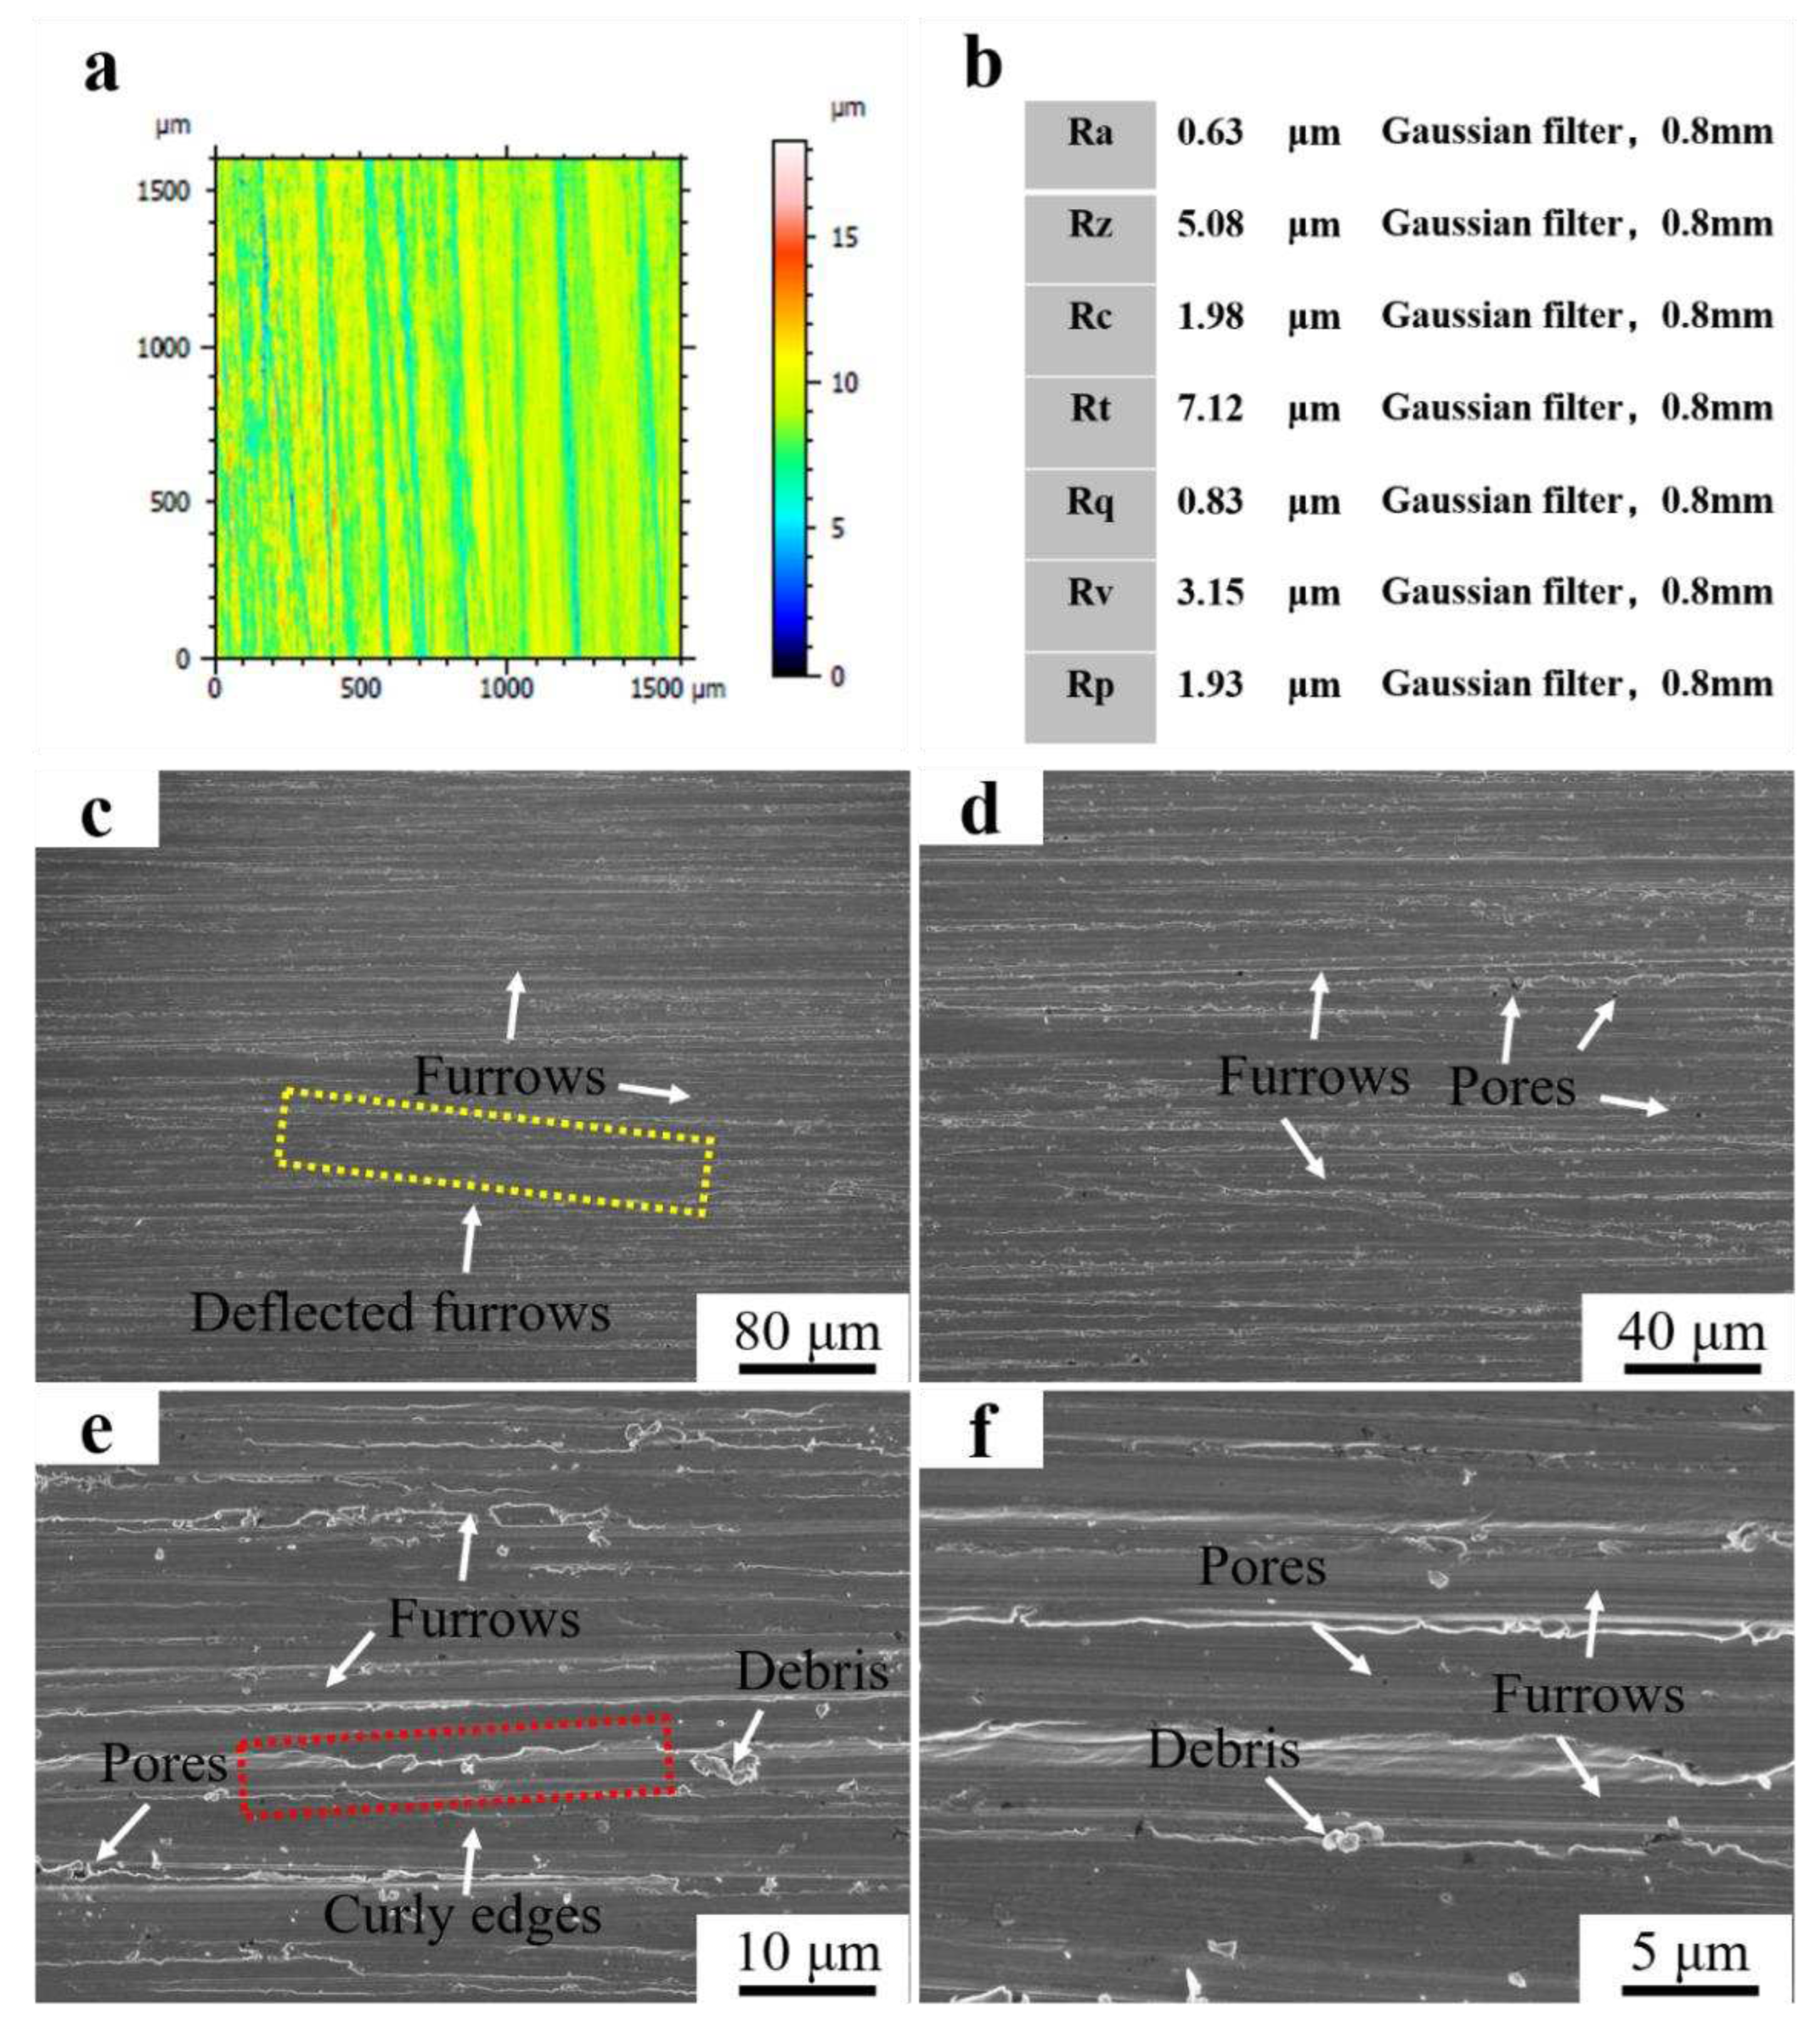
Figure 12.
Roughness and morphology of Fe55+1.5wt% SiC+0.01wt% CeO2 worn surface (a) 3D morphology of the worn surface; (b) Surface roughness value; (c) ×250; (d) ×500; (e) ×2000; (f) ×5000;.
Figure 12.
Roughness and morphology of Fe55+1.5wt% SiC+0.01wt% CeO2 worn surface (a) 3D morphology of the worn surface; (b) Surface roughness value; (c) ×250; (d) ×500; (e) ×2000; (f) ×5000;.

Figure 13.
Morphology of Fe55 debris in different magnification (a) ×250; (b) ×2000; (c) ×5000; (d) EDS mapping ×250; (e) EDS mapping ×2000.
Figure 13.
Morphology of Fe55 debris in different magnification (a) ×250; (b) ×2000; (c) ×5000; (d) EDS mapping ×250; (e) EDS mapping ×2000.
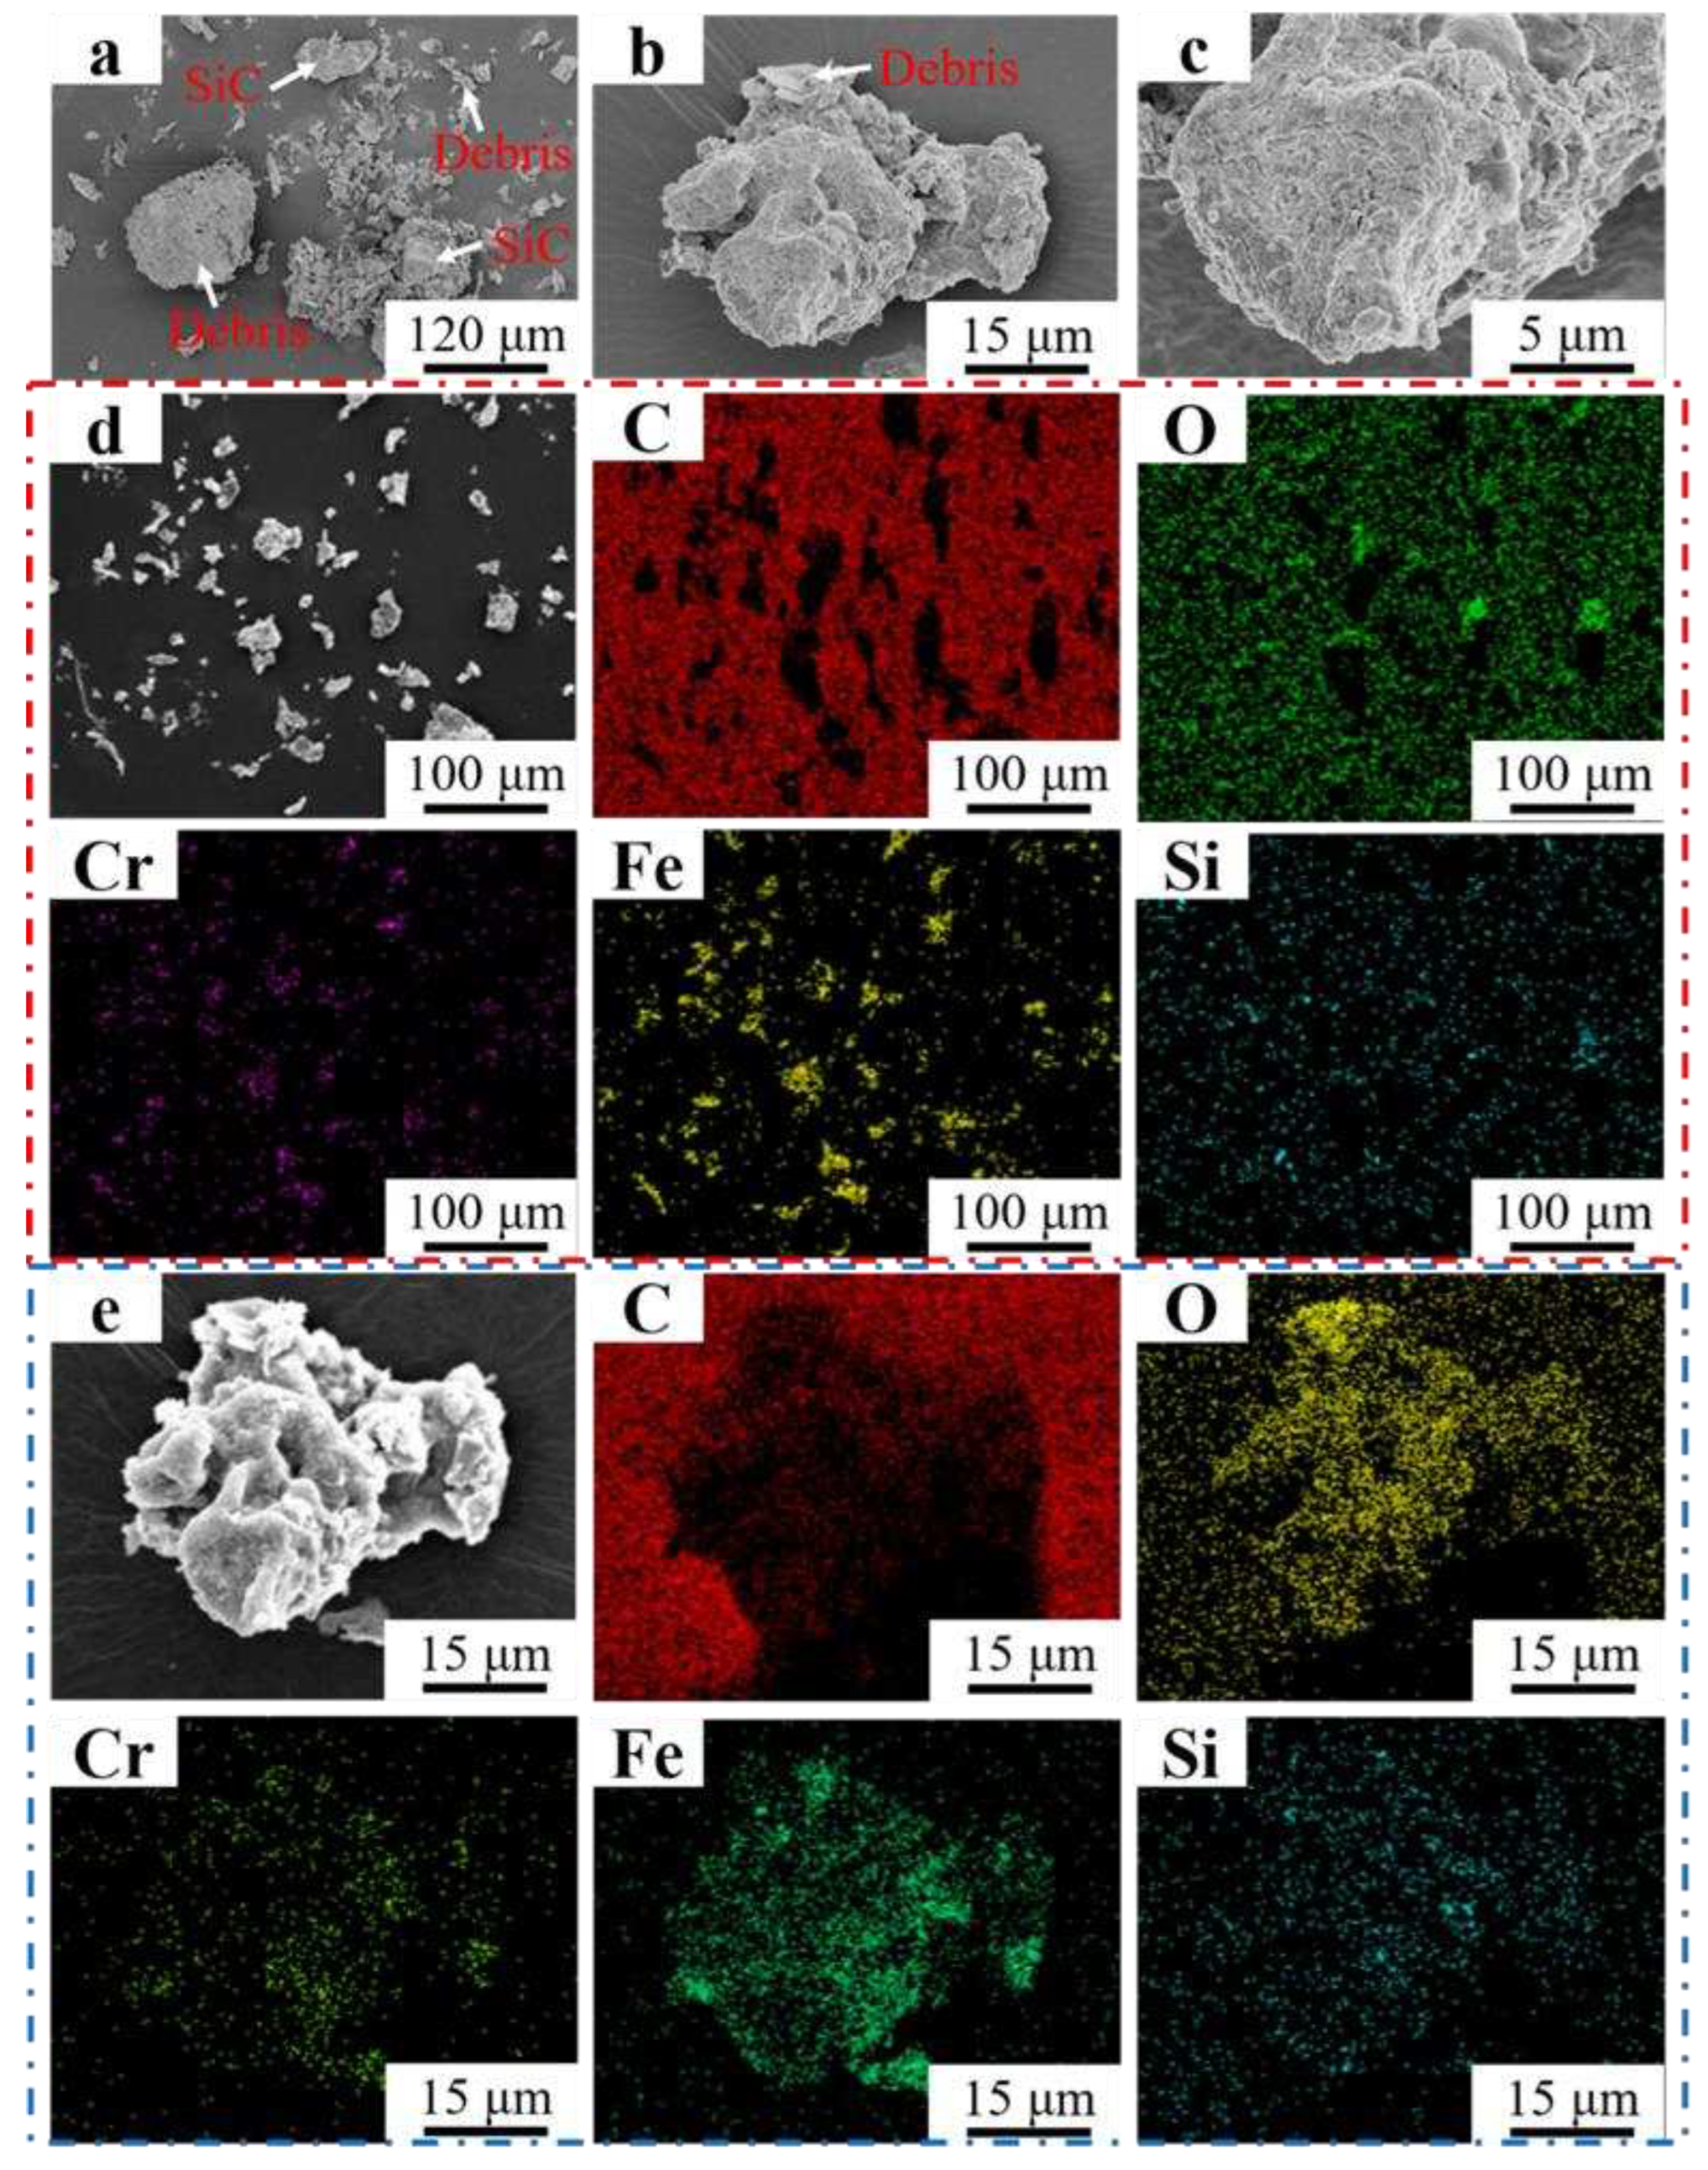
Figure 14.
Morphology of Fe55+1.5wt% SiC debris in different magnification (a) ×250; (b) ×2000; (c) ×5000; (d) EDS mapping ×250; (e) EDS mapping ×2000.
Figure 14.
Morphology of Fe55+1.5wt% SiC debris in different magnification (a) ×250; (b) ×2000; (c) ×5000; (d) EDS mapping ×250; (e) EDS mapping ×2000.
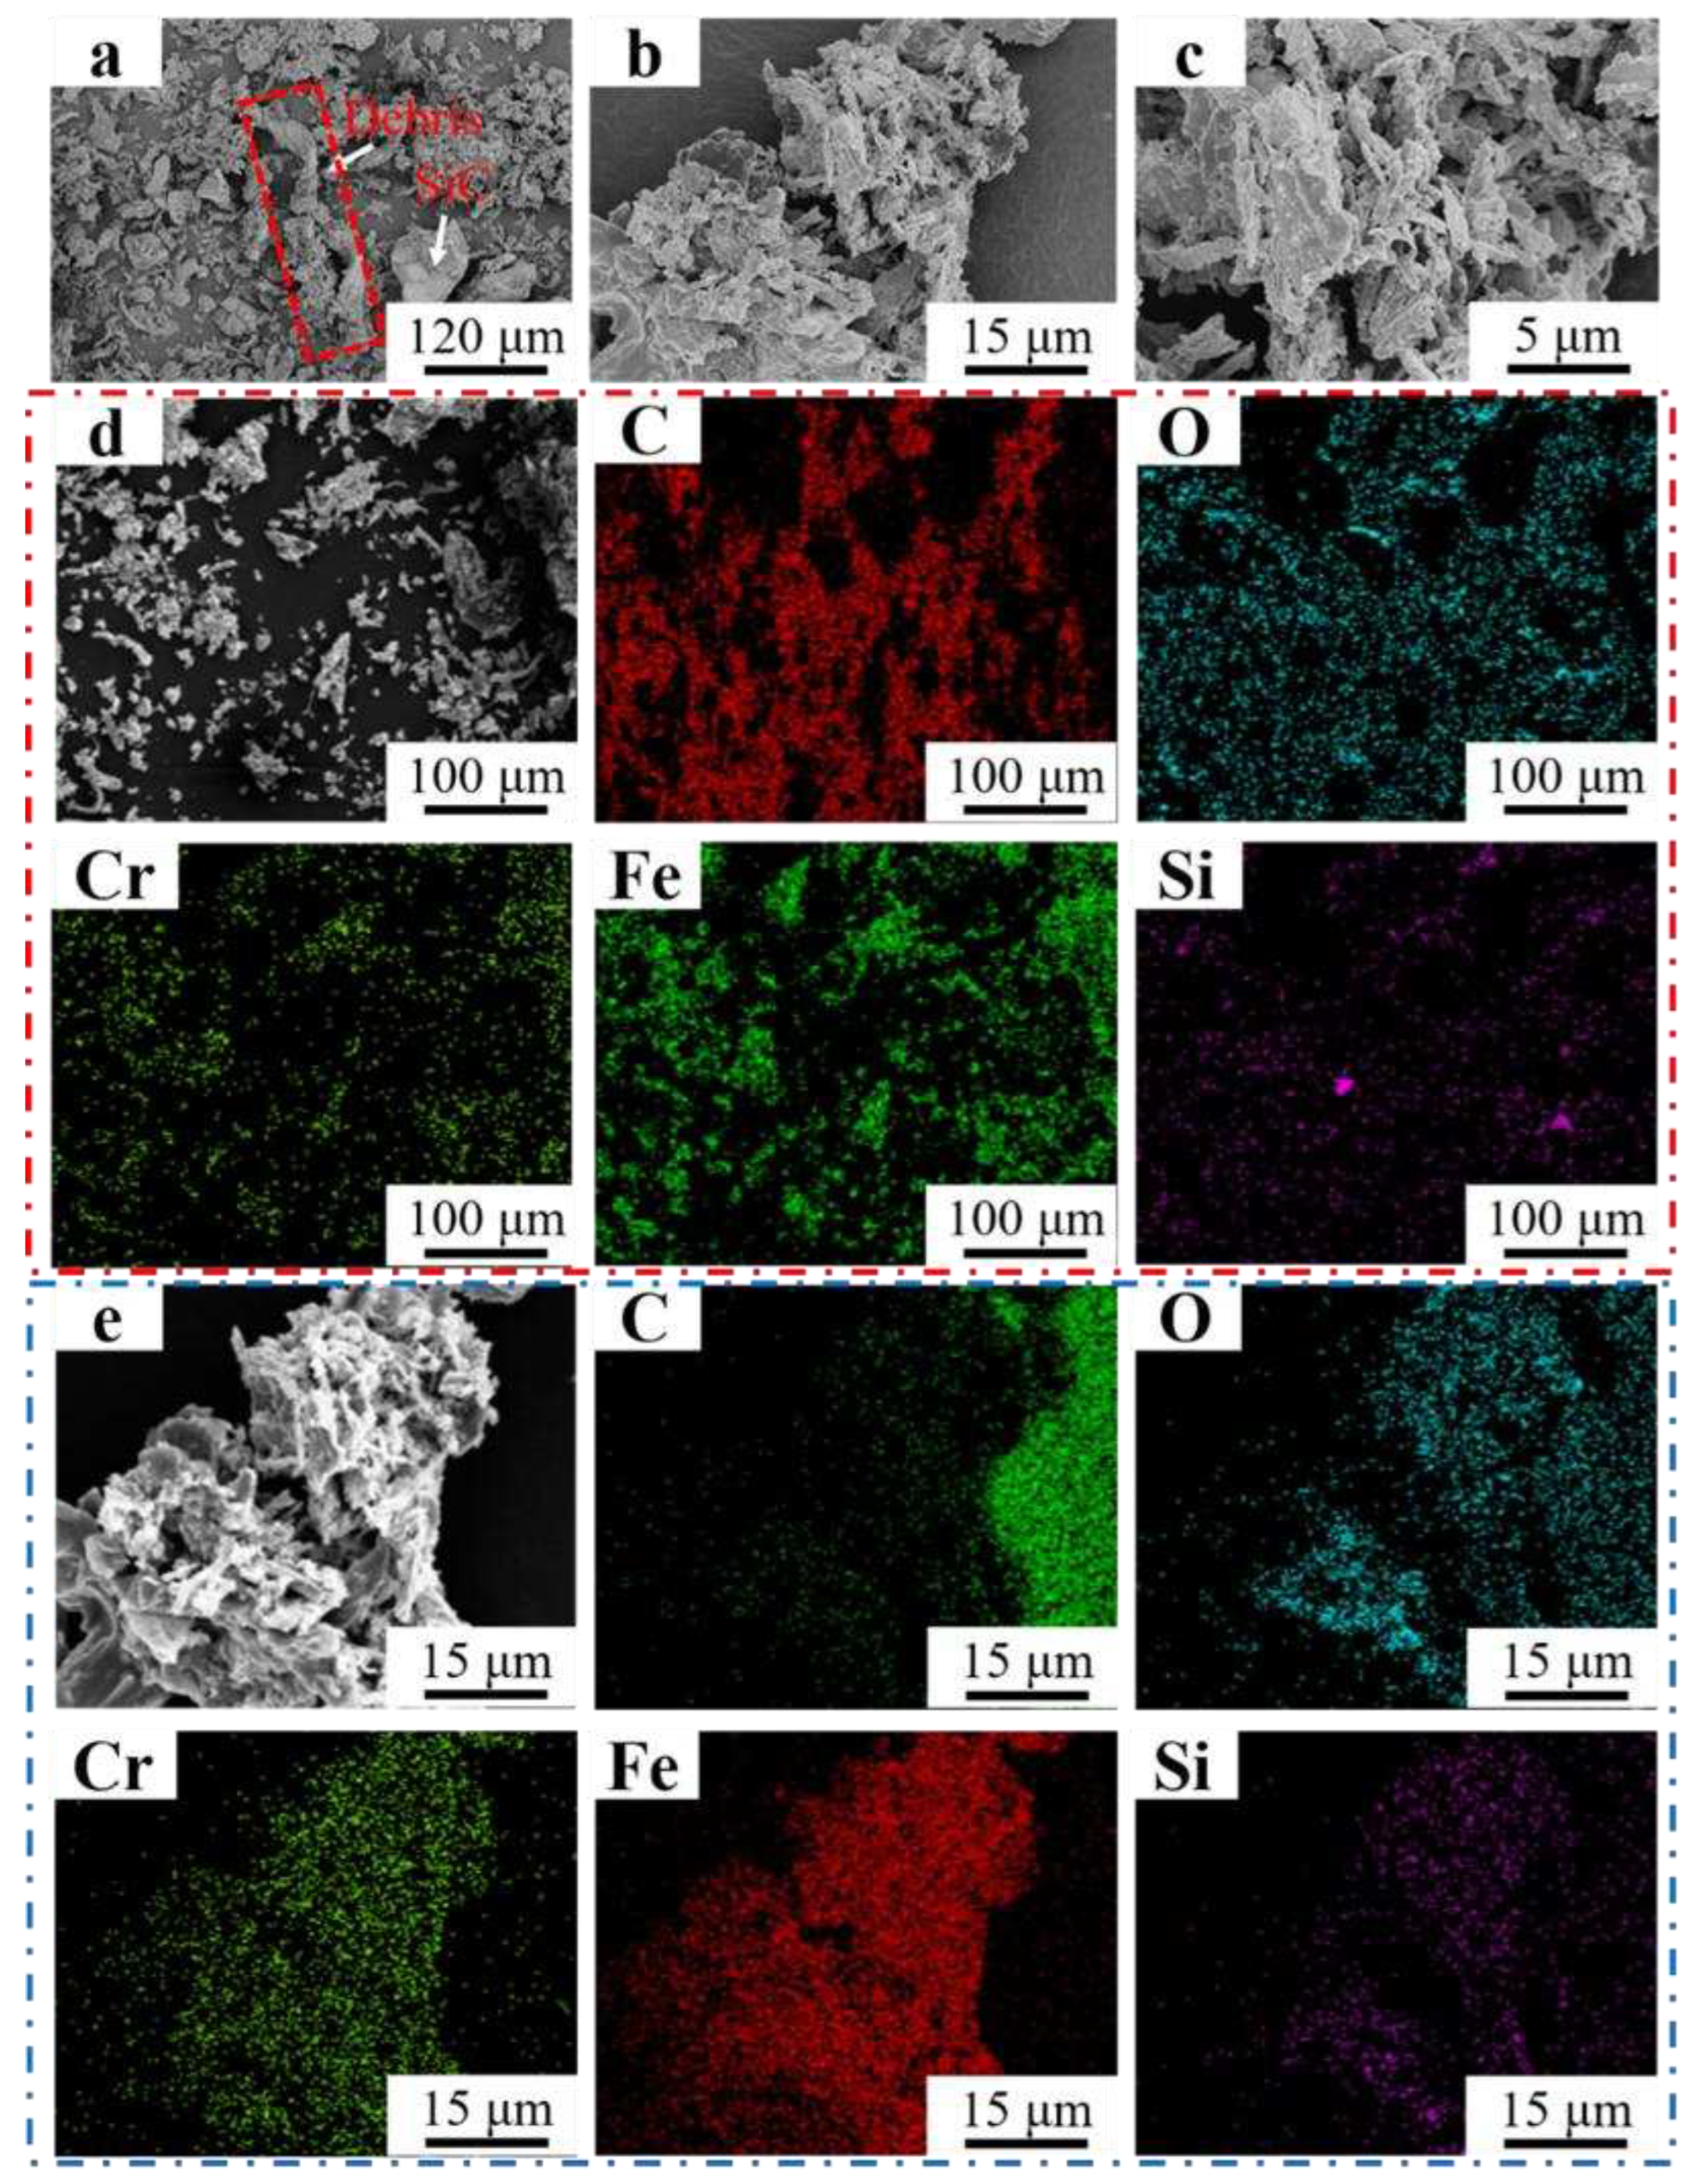
Figure 15.
Morphology of Fe55+1.5wt% SiC+0.01wt% CeO2 debris in different magnification (a) ×250; (b) ×2000; (c) ×5000; (d) EDS mapping ×250; (e) EDS mapping ×2000.
Figure 15.
Morphology of Fe55+1.5wt% SiC+0.01wt% CeO2 debris in different magnification (a) ×250; (b) ×2000; (c) ×5000; (d) EDS mapping ×250; (e) EDS mapping ×2000.
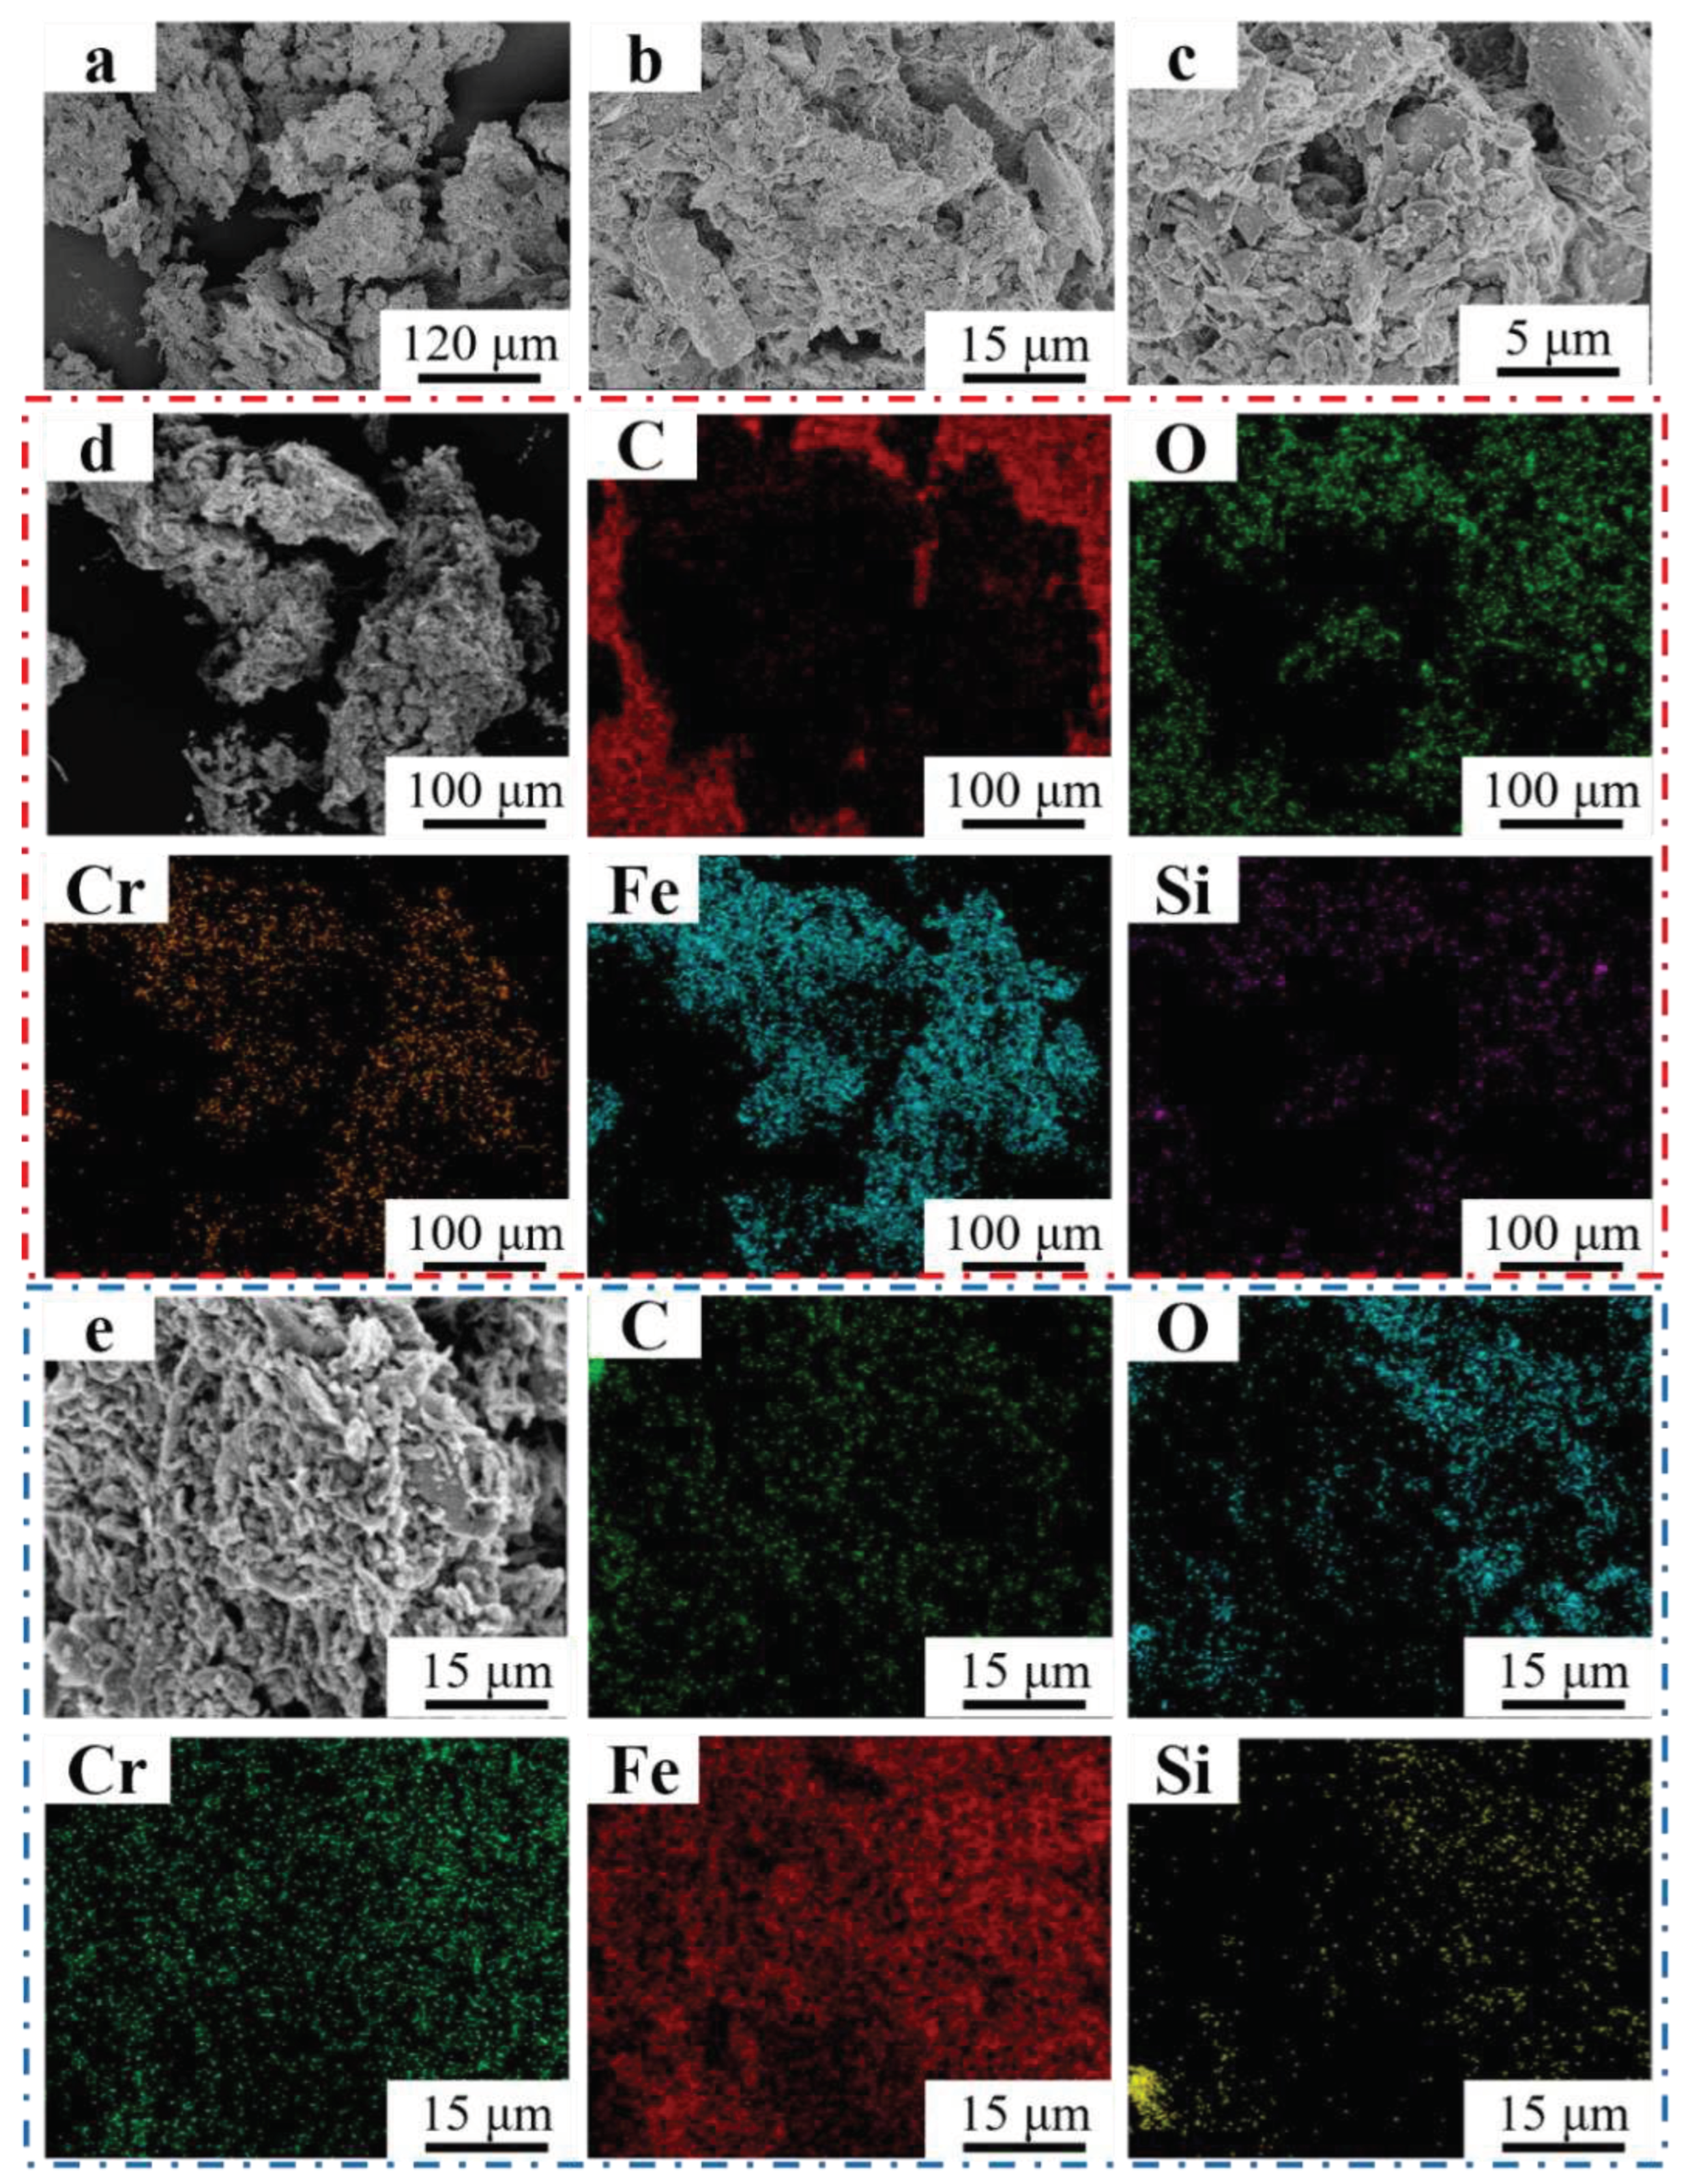
Figure 16.
Microcracks after wet friction test (a) Fe55; (b) Fe55+1.5wt% SiC; (c) Fe55+1.5wt% SiC+0.01wt% CeO2.
Figure 16.
Microcracks after wet friction test (a) Fe55; (b) Fe55+1.5wt% SiC; (c) Fe55+1.5wt% SiC+0.01wt% CeO2.
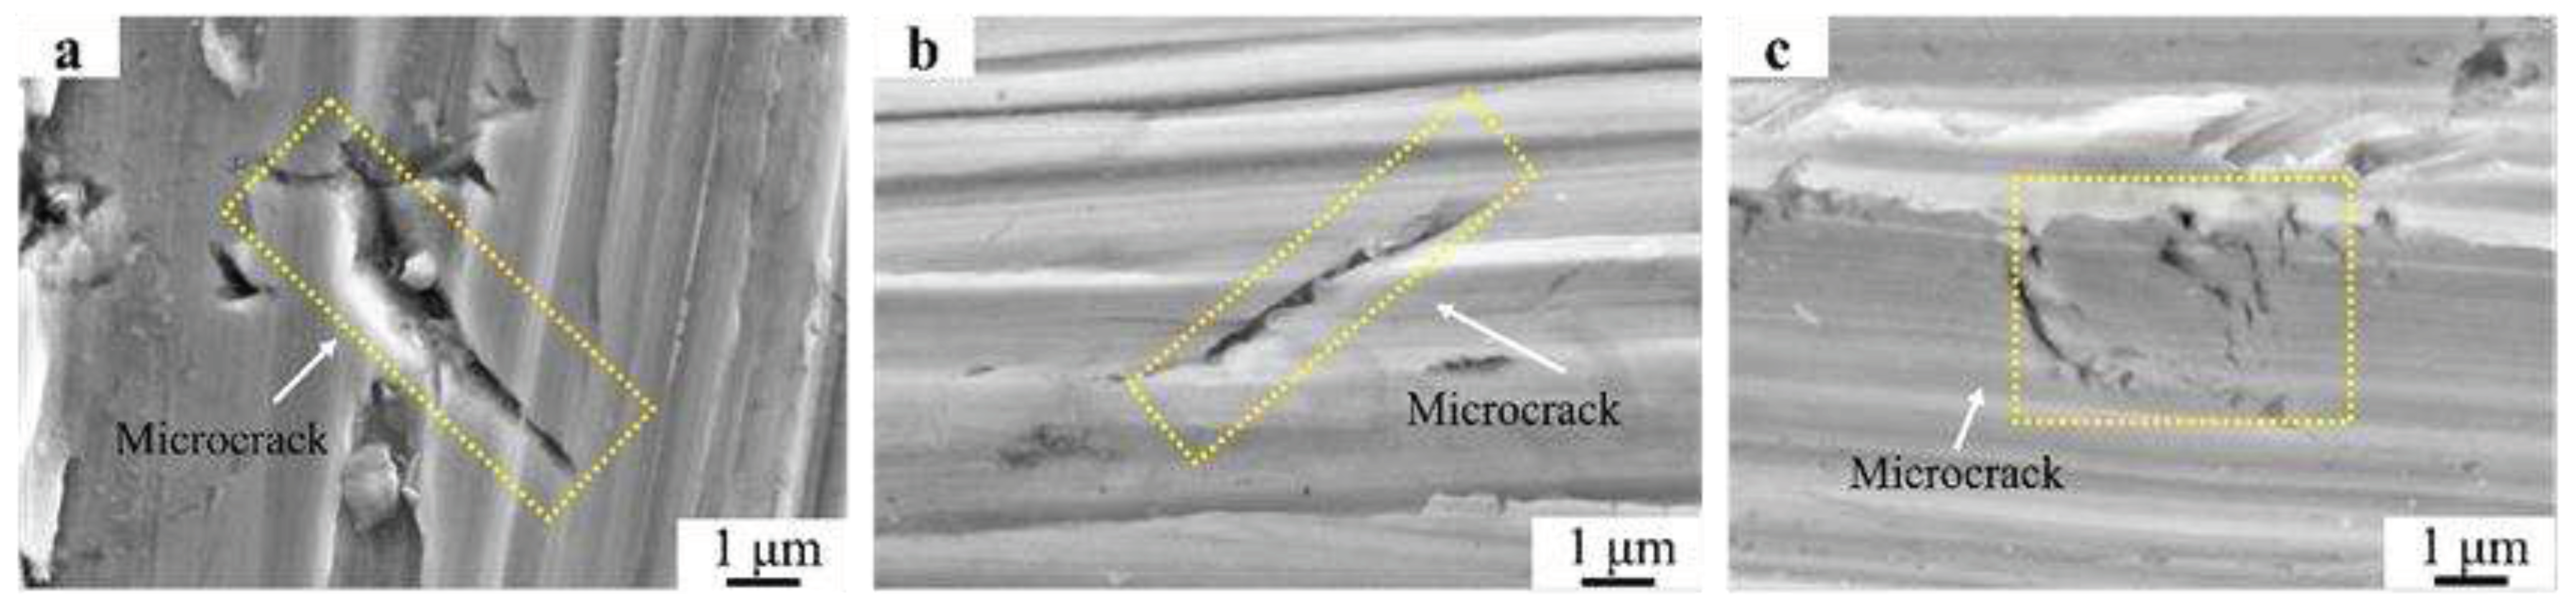

Table 1.
Chemical composition of Fe55.
| Elements | C | Si | B | Cr | Ni | Fe |
|---|---|---|---|---|---|---|
| Wt.% | 0.7-1.0 | 3.0-4.0 | 3.5-4.0 | 16-18 | 10-13 | Balance |
Table 2.
Chemical composition of powders.
| Samples | Fe55 wt% | SiC wt% | CeO2 wt% |
|---|---|---|---|
| Fe55 | 100 | 0 | 0 |
| Fe55+1.5wt% SiC | 98.5 | 1.5 | 0 |
| Fe55+1.5wt% SiC+0.01wt% CeO2 | 98.49 | 1.5 | 0.01 |
Disclaimer/Publisher’s Note: The statements, opinions and data contained in all publications are solely those of the individual author(s) and contributor(s) and not of MDPI and/or the editor(s). MDPI and/or the editor(s) disclaim responsibility for any injury to people or property resulting from any ideas, methods, instructions or products referred to in the content. |
© 2023 by the authors. Licensee MDPI, Basel, Switzerland. This article is an open access article distributed under the terms and conditions of the Creative Commons Attribution (CC BY) license (http://creativecommons.org/licenses/by/4.0/).
Copyright: This open access article is published under a Creative Commons CC BY 4.0 license, which permit the free download, distribution, and reuse, provided that the author and preprint are cited in any reuse.


