
Submitted:
26 October 2023
Posted:
26 October 2023
You are already at the latest version
Abstract
To conduct a precise impact assessment of marine diesel engines, a 200t floating impact platform was utilized to simulate realistic testing conditions. The testing generated the acceleration time curve and the impact response spectrum for the diesel engine. According to the applicable standards, the spectral velocity was chosen as the evaluation index, and an evaluation of the longitudinal, transverse, and vertical impact environment of the diesel engine was conducted. The shock factor interpolation method was corrected using the confidence interval based on normal distribution, and the interpolated confidence interval of the shock factor was determined. The findings reveal that: The 200t-class floating shock platform is capable of providing a reliable shock environment for diesel engine tests. The shock wave serves as the primary external force during the experiment, and the impact of bubble pulsation can be disregarded when assessing using the floating shock platform. To more accurately describe the experimental shock intensity when presented with dispersed data, the confidence interval can be utilized, and the resulting prediction formula provides a higher level of impact safety. The obtained conclusions can serve as a reference for predicting the shock environment of large shipboard equipment using the shock platform.
Keywords:
large-scale floating shock platform (LFSP)
; shock environments
; underwater explosion
; marine diesel engines
; shock spectra
1. Introduction
Shipboard equipment impact resistance is a crucial aspect of a ship's combat effectiveness and survivability [1]. To ensure the ship's survival rate in modern naval warfare, navies have developed numerous impact testing devices to assess the impact resistance of shipboard equipment and have established relevant assessment standards [2-3]. The US standard MID-901D [4] mandates that shipboard equipment weighing less than 181 t must undergo impact testing before being put into service. In order to evaluate medium and large shipboard equipment, the United States constructed a multi-level floating platform to assess various levels of equipment.
China began in the field of impact resistance later and mainly developed its floating impact platform from the research of the American platform. Chen[5] employed the wavelet transform approach to analyze measurement signals from a small floating platform (FSP) and observed that the predominant shock response of the FSP is high-frequency vibration following shock waves' impact. Jiang[6] employed shock wave loads directly applied to the blast-facing surface of the computational flow field to simulate the shock response of the floating platform under far-field explosion conditions. This approach compensates for the finite element software's limitations in far-field calculations. Chen[7] developed a small floating platform using the acoustic solid coupling approach of finite element analysis and verified the effectiveness of the simulation method through actual explosion results. Scholars have conducted experimental and simulation studies on small floating platforms to provide a dependable foundation for medium and large-scale equipment. Chen [8] development of a standard floating platform impact environment test in China was analyzed and compared with the equivalent standard in the US. The results indicate that the impact spectra of both standards are essentially identical. Wang [9-10] analyzed and verified the discrepancy between the impact environment of a medium-sized floating platform based in the UK and a real ship using Fisher's method. Furthermore, they investigated the effect of each parameter of the impact spectrum on the multi-degree-of-freedom system through theory and simulation. Jin[11] systematically designed a medium-sized floating platform and analyzed various typical floating platform structures using finite element analysis. The results indicate that the structural strength of the low bulkhead-box beam structure meets the German standard in terms of its impact environment. Zhang [12] conducted a preliminary investigation into the impact response of the standard floating platform and large floating platform in the installation of equipment when subjected to different blast distances under fluid-structure coupling. The scholars mentioned above conducted research on the U.S. floating platform, which provides a useful reference for China's development of its own floating impact platform. This will aid in the promotion of China's newly developed large-scale shipboard equipment in the field of impact assessment.
In recent years, China has constructed multi-tonnage floating impact platforms, ranging from 50t to 200t. These platforms allow for the testing of newly developed large shipboard equipment, including diesel engines and gas turbines. For the 200-tonne-class floating shock platform, Yang [13] investigated the shock of spherical factors on simulated shock environments and analyzed the low-frequency response of the platform. Zhang [14] analyzed the low-frequency oscillator data of a 200-tonne floating impact platform used for underwater explosion testing. The results indicate that the floating platform's low-frequency response is mainly dominated by the overall rigid body motion, and the difference in low-frequency impact response between its components is not significant. Feng [15] designed a broader cross-drop ratio of the inclined baffle structure through simulations and calibration tests. Insufficient experimental data is available for the 200t-class floating impact platform, which hinders researchers from conducting a thorough study of its impact environment. The impact environment serves as input to resist impact and is crucial for finite element analysis. To address this, the shock factor interpolation method has emerged as a reliable approach. This method fits parameters based on test data, impact factor, and impact response spectrum, which effectively provide impact input for finite element analysis of related equipment, resulting in significant cost savings. Previous research only considers the one-way effect of the transverse longitudinal pendant in impact environmental forecasting methodology and only takes into account its one-way error. However, in actual experiments, the explosion data is discrete and should be allowed to have a certain margin of error. Technical term abbreviations will be explained when used for the first time. This paper suggests using a normal distribution based on the impact environment forecasting method to analyze the data. The method includes the discrete and multi-directional impact factors and utilizes interpolation fitting. It provides a placeability interval that has a higher impact safety, obtained through the interpolation interval formula.
This paper aims to study the characteristics of this platform under the impact environment of marine diesel engines through six underwater explosion tests in the positive longitudinal and positive transverse directions. The study focuses on the main characteristics of the large floating impact platform under diesel engine impact, evaluating the platform's characteristics under both positive longitudinal and positive transverse conditions. No changes are needed as the text already adheres to the given principles.
2. Experimental
2.1. Subject
Middle and high-speed diesel engines, along with related equipment such as accessory pumps, sliding oil filters and coolers, and electric control boxes, are displayed in Figure 1. The medium and high-speed diesel engines are installed together with a test generator and two other types of equipment in the center of the testing platform. The auxiliary generator is installed at the end of the platform and two measurement buffer platforms are installed at the beginning. The B&K4384 acceleration sensor is shown in Figure 2 and the parameters are shown in Table 1.
2.2. Design
Test platform for 200t-level floating impact platform. The platform has a total length of 19m, a total width of 9.1m, and a total height of 7m. The internal effective height is 6m, the double bottom height is 1m, and the ramp height is 0.5m. The maximum draft is 3m, and it can accommodate up to 200t of test equipment.
A diesel engine and associated equipment were utilized to conduct six underwater explosion impact tests in two positive directions: longitudinal and transverse. The experiment utilized an explosive source of 150kg TNT and the design is depicted in Figure 4. The TNT standard explosive source is positioned on the side of the pontoon either transversely (along the width of the ship) or longitudinally (along the length of the ship) for detonation. Experiment: The impact of the experiment is divided into two groups, A and B, with a total of 18 channels designated for measurement points to determine the environmental impact. The measurements are labeled X for lateral, Y for longitudinal, and Z for vertical.
Figure 3.
Schematic diagram of the experiment.
2.3. shock factor
The shock environment's strength resulting from an underwater explosion is commonly determined by the shock factor. As defined in Eq3, this factor is calculated using the shell plate shock factor (HSF).
In the formula, W represents the charge equivalent and R denotes the minimum distance between the explosion source and the ship's hull, while also taking into consideration the seabed reflection coefficient.
During the experiment, external factors like currents, wind, and waves on the port side, as well as the depth of the explosion source cloth, may affect the size of the shock factor. To reduce these effects, we used a positioning system to determine the platform and relative position of the explosion source. Table 1 shows the experimental explosion distance and shell plate shock factor. We will explain any technical term abbreviations used in Table 1 upon first use. Upon analyzing the test data, we found that the shock factor increases when the burst distance is closer, indicating that greater impact energy leads to a more intense degree of explosion. Additionally, the burst distance and the shock factor are inversely proportional.
3. Experimental analysis methods
3.1. Data assessment basis
When installing marine diesel engines for Class A equipment, it's important to ensure the location is suitable for Class I and that the equipment allows for flexible installation. According to GJB1060.1-91[16], if the equipment mass exceeds 5 tonnes, the isolation system, impact spectral velocity, and acceleration should be discounted. After assessing the impact on the environment, the formula shown in Table 2 can be used to discount the diesel engine.
The equation is as follows: m represents the mass of the isolated equipment measured in tonnes, while m0 is a constant mass value of 5 tonnes. Stands for the reduced acceleration spectrum measured in g, and V represents the reduced velocity spectrum measured in meters per second.
3.2. Acceleration data analysis method
As stated in HJB715-2016 [17], the original acceleration data is analyzed using the least squares method to eliminate its trend term. The Butterworth filtering function is used to filter the frequency range between 4-400Hz, which greatly affects the equipment's response. According to ISO18431 [18], the measured acceleration data is transformed into the impact spectrum from the impact environment. By obtaining data from the isotropic displacement value of the low-frequency array and the low-frequency segment curve of the shock spectrum, low-frequency interference is eliminated through frequency filtering. The shock spectrum's frequency is then high-pass filtered to obtain the measured spectrum. Technical terms are defined upon their first use. The captured spectrum is calibrated to derive the calibrated spectrum, which represents the shock environment at the measurement point. When compared to the calibrated spectrum, the captured spectrum meets the required specifications:
1. The spectrum being measured is at least 70% similar to the standard spectrum.
2. There must be at least two points where the measured spectrum intersects the normalized spectrum within one octave of the frequency range below the normalized spectrum.
3. The area under the measured spectrum should not exceed the area under the standard spectrum.
3.3. A shock environment prediction method based on normal distribution
This paper presents an interpolation formula that determines the correlation between three-way spectral velocity and the shell-plate impact factor using experimental data. In addition, confidence intervals for the lognormal distribution are obtained. The S-N (stress-life) curve approach commonly uses the lognormal distribution in fatigue testing, and this method transforms the original non-linear power function formula into a linear representation. The assumption behind this method is that the specimens' structure and testing conditions remain constant throughout the tests. 1. Multiple and distinct data points are collected. 2. The data is distributed over several levels, with each level containing at least three data points of the same magnitude.
When attempting to predict shock environments, several measuring points and challenges arise when collecting data and accounting for the volatility of explosion tests. To account for errors in the statistics of the measuring points, confidence intervals are required. Equations (4) and (5) provide the necessary corrections.
To achieve a 50 percent survival rate, use the following formula:
To achieve a 97.7 percent survival rate, use the following formula::
where V is the spectral velocity, C is the shock factor, a is the slope, b is the intercept, and σ is the standard deviation.
The simulation data and forecasting method presented in Eq. 6 from the literature [13] were compared to normal distribution-based interpolated confidence intervals for validation.
where: is the actual value, is the forecast value, is the relative error of the forecast, and is the maximum relative error.
4. Experimental result and discussion
During offshore explosion impact testing, we arranged 18 channels in the medium and high-speed diesel engine mounting base panel. These channels were divided into two groups, A and B, to measure the impact environment. We numbered the measurement points A1-A9 and placed six channels on the blast face and three channels on the back of the blast face to measure the longitudinal, transverse, and vertical impact acceleration responses of the motor base. We recorded a total of 108 measurement points, with a validity of 76.8%. However, only 27.5% were valid under working conditions 6. Next, the data from various circumstances at standard measuring points is chosen for comparative examination.
4.1. Acceleration time-course curve analysis
In Figure 5, show that the acceleration peaks of longitudinal evaluation Test 1 and Test 2 are similar. In Test 1, the main peak reaches 773.27g at 0.114ms, and a second peak of 132.01g occurs at 1.01ms. For Case 2, the peak acceleration reaches 786.18g at 0.221ms, and a second peak of 254.07g appears at 1.08ms.
Figure 6 illustrates the results of the transverse plumbing examination of Test 3, which revealed two peaks: 982.28g at 0.055ms for the first peak, and 76.79g at 0.894ms for the second. For Tests 4-6, the respective peaks were 888.48g, 637.18g, and 523.03g at 0.114ms, 0.107ms, and 0.110ms, as shown in Figure 6. However, the second peak for Tests 4-6 was not observed.
When comparing Figure 5 and Figure 6, it's clear that the peak acceleration decreases as the shock factor decreases. This follows a linear relationship. Additionally, the longitudinal test condition has a greater shock factor, but the peak acceleration in conditions 1 and 2 is lower than that in conditions 3 and 4. This could be due to the influence of different structures during the transmission of the shock wave in both transverse and longitudinal directions. These structures can weaken the effect. From the measured data, it's apparent that the impact caused by bubble pulsation is significantly smaller than the shock wave for floating impact platform equipment. This equipment is the primary source of external force. Therefore, the effect of bubble pulsation can be disregarded during impact assessments of said equipment.
4.2. Shock environment analysis and assessment
The diesel engine with a limiter has a vertical installation frequency of 14.6 Hz, a horizontal frequency of 22.9 Hz, and a longitudinal frequency of 15.8 Hz. During the explosion impact loading stage, the vibration isolator shows impact stiffness characteristics which cause the installation frequency of the medium and high-speed diesel engine system to increase to around 20 Hz. Based on the analysis, the frequency range that mainly affects the impact response of the medium and high-speed diesel engine is 10 Hz to 100 Hz. The environment's impact characteristics in this frequency range are primarily measured using spectral velocity. Therefore, the strength of the test data's impact is evaluated using spectral velocity as the assessment index. We processed the measured data to obtain the typical impact response spectral curve of A3, which is illustrated in Figure 7 and Figure 8, and the regularised spectral values in Table 3.
Figure 7 and Figure 8 show that the German military standard BV043/085 takes into account the quality of equipment and its impact on the environment when assessing the vertical spectral velocity. The standard requires the velocity to be at 7.0m/s. On the other hand, the GJB1060.1-91 reduces the vertical assessment of spectral velocity to 2.1m/s for equipment weighing more than 5t, as specified in subsection 2.1. Figure 8 and Figure 9 depict six working conditions for longitudinal, horizontal, and vertical assessment, which have met over 70% of the assessment criteria in terms of spectral velocity.
In Figure 7 and Figure 8, we can see that Test 1 has a spectral velocity of 1.85 m/s, which is higher than test 2's velocity of 1.58 m/s. When looking at the longitudinal test cases, only test 1's spectral velocity exceeds that of transverse test 6 (1.81 m/s), while test 2 falls behind the other cases. As we saw in subsection 3.1's acceleration time curve, the impact strength of the longitudinal test conditions is generally lower than that of the transverse test conditions. This is because the shock wave attenuates twice as much along the ship's length than its width.
Figure 7 shows the longitudinal assessment of conditions in the low-frequency stage below 20Hz and below 10Hz. test 2 has significantly higher spectral displacement than test 1, while 10Hz to 20Hz frequencies show consistency between the two. In the high-frequency stage, both conditions are basically the same. For the main frequency range between 10Hz and 100Hz, the spectral velocity of test 1 is slightly higher than that of test 2. This result is in line with the law that indicates the bigger the shock factor, the higher the impact intensity.
In Figure 8, it is evident that spectral displacement significantly differs in transverse vertical assessment conditions below 20Hz. All high-frequency bands, with the exception of test 6, exhibit consistency. The test data reveals that the efficiency of condition 6 is only 5%, which is speculated to be caused by sensor malfunction due to reduced filtering function after several explosion tests. The frequency range of 10Hz to 100Hz has the most significant effect, while the remaining conditions experience a decreasing spectral velocity in consecutive order. Although test 3 has a lower impact than tests 4 and 5, it still meets the assessment requirements. Combining the test data presented in Figure 11, it can be concluded that individual conditions do not meet the assessment requirements when the shock factor is higher. The law indicates that the higher the impact strength, the greater the shock factor. However, overall, the assessment requirements are still being followed.
4.3. Shock environment prediction
According to Figure 9(a) in the literature [13], the maximum error in the transverse direction is 19.3%, with a slope of 0.094. Similarly, the maximum error in the vertical direction is 11.02%, with a slope of 0.11. The prediction equations depend on the slope and impact factor, which determine the strength of the impact intensity. The fit of the method is not significantly different in the transverse direction (0.094) and the vertical direction (0.11), suggesting that the impact intensity suffered in these two directions is similar. Therefore, there is not much variation between the transverse direction and the vertical direction for the same impact factor.
In Figure 9(b), the simulated data are shown to fall within the confidence intervals. The vertical data is mostly distributed between survival rates of 50% and 2.3%, while the lateral data falls completely within the 50% and 97.7% intervals. Confidence intervals provide a more understandable representation of the distribution of lateral and vertical data compared to past methods. Using this data, the fitted shock environment can predict multidirectional shock environments.
Based on Figure 10 and Figure 11, it appears that there is a direct relationship between the impact factor and the spectral velocity. However, Figure 10(b) reveals that the actual data appears to be discontinuous. This can be seen in the longitudinal spectral velocity from Figure 10(a) and the transversal spectral velocity from Figure 11. Figure 11(a) shows a decrease in trend as the impact factor increases, while in Fig. 10(a), the transverse spectral velocity is generally higher than the longitudinal spectral velocity, which differs from previous research. These differences could be due to the lack of experimental data in previous studies or the ideal simulation conditions. Additionally, the impact of complex sea states was not considered.
Based on Figure 10(a) and Figure 11(b), there is a clear positive correlation between the shock factor and the three-way spectral velocity. The vertical spectral velocities consistently fall within the upper 50% survival rate interval, while the horizontal and longitudinal spectral velocities fall within the lower interval. It's important to note that some individual data points fall outside the confidence interval. This indicates that the confidence interval helps to eliminate invalid data and improve the accuracy of the interpolation formula. By integrating the spectral velocity values obtained, the shock intensity can be substituted. This approach is useful for analyzing isolated experimental data and predicting three-way spectral velocity and shock factor.
When predicting the impact of an explosion on the environment, various factors come into play, such as the state of the sea, angle of attack, explosive charge, and distance of the explosion. However, in simulation conditions, the state of the sea is pre-calculated and does not affect the other conditions. The data received from the impact environment is then filtered through LFSP, resulting in accurate data that typically have a greater vertical dimension than horizontal and a greater horizontal dimension than longitudinal.
Figure 9 shows that the forecast formulas for unidirectional data and impact factors using confidence intervals are just as precise as the error analysis approach in simulation circumstances. However, when predicting multidirectional impact environments, confidence intervals are more advantageous.
During the field tests, the impact of the sea state on the blast distance and angle of attack was not consistent, resulting in highly discrete data. In order to effectively handle this, the prediction method based on interval estimation was utilized. When predicting multidirectional impact environments, the multidirectional spectral velocities are uniformly distributed in intervals, which visually demonstrates the characteristics in the specification. For instance, the lateral spectral velocities are 50 to 85 percent of the vertical spectral velocities, and the longitudinal spectral velocities are 25 to 33 percent of the vertical velocities.
Additionally, the distance of the blast in the direction of the measurement point and the effect of the associated structure can lead to a change in the constant b. In the future, experiments will be specifically designed to study the effect of this and to derive more accurate formulae for predicting shock environments.
5. Conclusions
To guarantee that the 200t-class floating impact platform offers the required impact assessment data for the marine diesel engine, six underwater explosion experiments are conducted to assess the impact environment. The characteristics of the impact environment on the marine diesel engine under the large-scale floating impact platform are studied, and the forecasting method for the impact environment is improved. This will provide a reference for the impact environment of large-scale shipborne equipment in the large-scale floating impact platform for impact resistance testing. The key findings are as follows::
(1) External forces are primarily caused by shock waves. When using a 200-ton class floating platform for large shipboard equipment, the impact of shock waves is much greater than that of bubble pulsation. Hence, when evaluating the impact on floating platforms, the impact of bubble pulsation can be ignored.
(2) In the positive longitudinal test, the shock experienced was of lower magnitude than in the positive transverse test. Even though the positive longitudinal shock had to face greater environmental factors, its intensity was still lower than that of the positive transverse shock. This can be attributed to the fact that the shock wave's attenuation distance along the length of the ship was twice the distance along its breadth. Further experimental data is required to explore the sensitivity of both transverse and longitudinal tests.
(3) In some situations, the speed of waves is affected by the sea state and this can impact the environment. When trying to predict the impact of waves moving in one direction, the speed of waves moving in that direction is inversely related to the impact factor, while the speed of waves moving perpendicular to that direction is inversely related to the impact factor when tested in that direction. This means that predicting wave impacts using a one-way prediction technique only works in theory and is difficult to test under different conditions.
(4) By using confidence intervals based on normal distributions, it is possible to predict the impact environment in three directions - longitudinal, vertical, and horizontal. This method is more accurate in evaluating the safety of the impact test compared to the previous unidirectional forecasting method, due to the discrete nature of the experimental data.
Author Contributions
Investigation, Validation, Writing—original draft preparation, Yu Zhang.; Writing—review and editing Jun Li.; Resources, Data curation, Chunhui Zhang.; Supervision, Writing—review and editing, Wei Chen.; Supervision, Data curation, Writing—review and editing Zhipeng Du.; Funding acquisition, Writing—review and editing, Xiaobin Li. All authors have read and agreed to the published version of the manuscript.
Funding
This research was funded by the National Natural Science Foundation of China (51979213).
Institutional Review Board Statement
In this section, you should add the Institutional Review Board Statement and approval number, if relevant to your study.
Informed Consent Statement
Not applicable.
Data Availability Statement
The authors declare that the data presented in this study are available on request.
Acknowledgments
This paper is supported by the National Natural Science Foundation of China (51979213).
Conflicts of Interest
The authors declare no conflicts of interest.
References
- Modern shock theory and application of ships [M]. Beijing: Science Press, 2006.
- FRG Ministry of Defense Equipment Technology and Procurement. Code for ship construction-impact safe⁃ ty: BV0430/85[S]. Koblenz: FRG Ministry of Defense Equipment Technology and Procurement, 1985.
- STIC Military Standards Center. Environmental test methods for military equipment-shock test: GJB150.18-1986[S]. Beijing: Standards Press of China, 1986.
- US Navy. Military specification: shock tests. H.I.(high-impact)shipboard machinery, equipment, and systems, requirements: MIL-S-901D[S]. New York, USA: U.S. NAVY, 1989: 70-72.
- Chen J J, Zhang S H, Mao Q D, et al. Analysis of shock response of small-sized floating platform in underwater explosion [J]. Noise and Vibration Control 2012, 32, 30–33. [Google Scholar]
- Jiang G Y, Jin H, Wang Y L, et al. Study on shock response of floating platform subjected to far-field explosion [J]. Acta Armamentarii 2010, 31, 37–40. [Google Scholar]
- Chen G J, Zhou Q F, Wang S L, et al. Numerical simulation test and validation of a small floating shock platform subjected to undex[J]. Electronic Measurement Technology 2016, 39, 42–44. [Google Scholar]
- CHEN X B, HE B, CHEN H, et al. Test and analysis about the shock environment of standard floating sh-ock platform [J]. Acta Armamentarii 2014, 35, 8–12. [Google Scholar]
- Wang J, Guo J, Yao X L, et al. Discriminant analysis on the shock environment of floating shock platform as opposed to real ship (in Chinese). Journal of Vibration and Shock 2014, 33, 108–112. [Google Scholar] [CrossRef]
- Wang J, Yao X L, Yang D. Impact analysis of shock environment from floating shock platform equipment response[J]. Explosion and Shock Waves 2015, 35, 236–242. [Google Scholar] [CrossRef]
- JIN H, GAO X, Xi H W, et al. Design and impact environment analysis of medium floating shock platform [J]. Modern Applied Physics 2019, 10, 66–71. [Google Scholar] [CrossRef]
- Zhang, W. Numerical simulation for shock resistivity of shipboard equipment on floating shock platform. Journal of Vibration and Shock 2010, 29, 60–63. [Google Scholar]
- Jun, G; Yang, Y; Zhang, Y (Zhang, Yin); Feng, LH. The Spherical Shock Factor Theory of a FSP with an Underwater Added Structure.[J]. Shock & Vibration 2019, 2019, 1–12. [Google Scholar] [CrossRef]
- ZHANG L, DU Z P, WU J B, et al. Low-frequency shock response data analysis of underwater explosion test of 200-ton class floating shock platform[J]. Chinese Journal of Ship Research 2018, 13, 60–65. [CrossRef]
- Feng L H, Han L, Yang Y, et al. A design of oblique baffle structure for optimizing the input environment of a large-scale floating shock platform[J]. Chinese Journal of Ship Research 2019, 14, 14–20. [Google Scholar] [CrossRef]
- Keil, A.H. The response of ships to underwater explosions[J]. Annual Meeting of The SNA3E, New York 1961, 69, 366–410. [Google Scholar]
- Feng L H, Yao X L, Wang Y, et al. Engineering Prediction Method of Ship Impulsive Environment Based on Empirical Eigenfunction [J]. Shipbuilding of China 2010, 51, 65–76. [Google Scholar]
- Gu B, Lang T Q, Liu C D. Research on shock environment of ship based on sample library method [J]. Ship Science and Technology 2013, 35, 11–17. [Google Scholar]
- Cunniff P F, O'hara G J. A procedure for generating shock design values[J]. Journal of Sound Vibration 1989, 134, 155–164. [Google Scholar] [CrossRef]
- National Defense Science and Technology Commission. Ship environmental conditions requirements-mechanical environment: GJB1060.1-91[S]. Beijing: National Defense Science and Technology Commission, 1991.
- People's Liberation Army Navy. Ship impact response spectrum: HJB715-2016[S]. Beijing: People's Liberation Army Navy, 2017.
- Mechanical vibration and shock—Signal processingPart4: Shock-response spectrum analysis: ISO 18431[S].
- IIW. Recommendations for fatigue design of welded joints and components [S]. 2011.
Figure 1.
Diesel engine and measurement point arrangement.
Figure 2.
Acceleration sensors.
Figure 4.
Underwater explosion experiment.
Figure 5.
Acceleration time-course curve of longitudinal test condition.
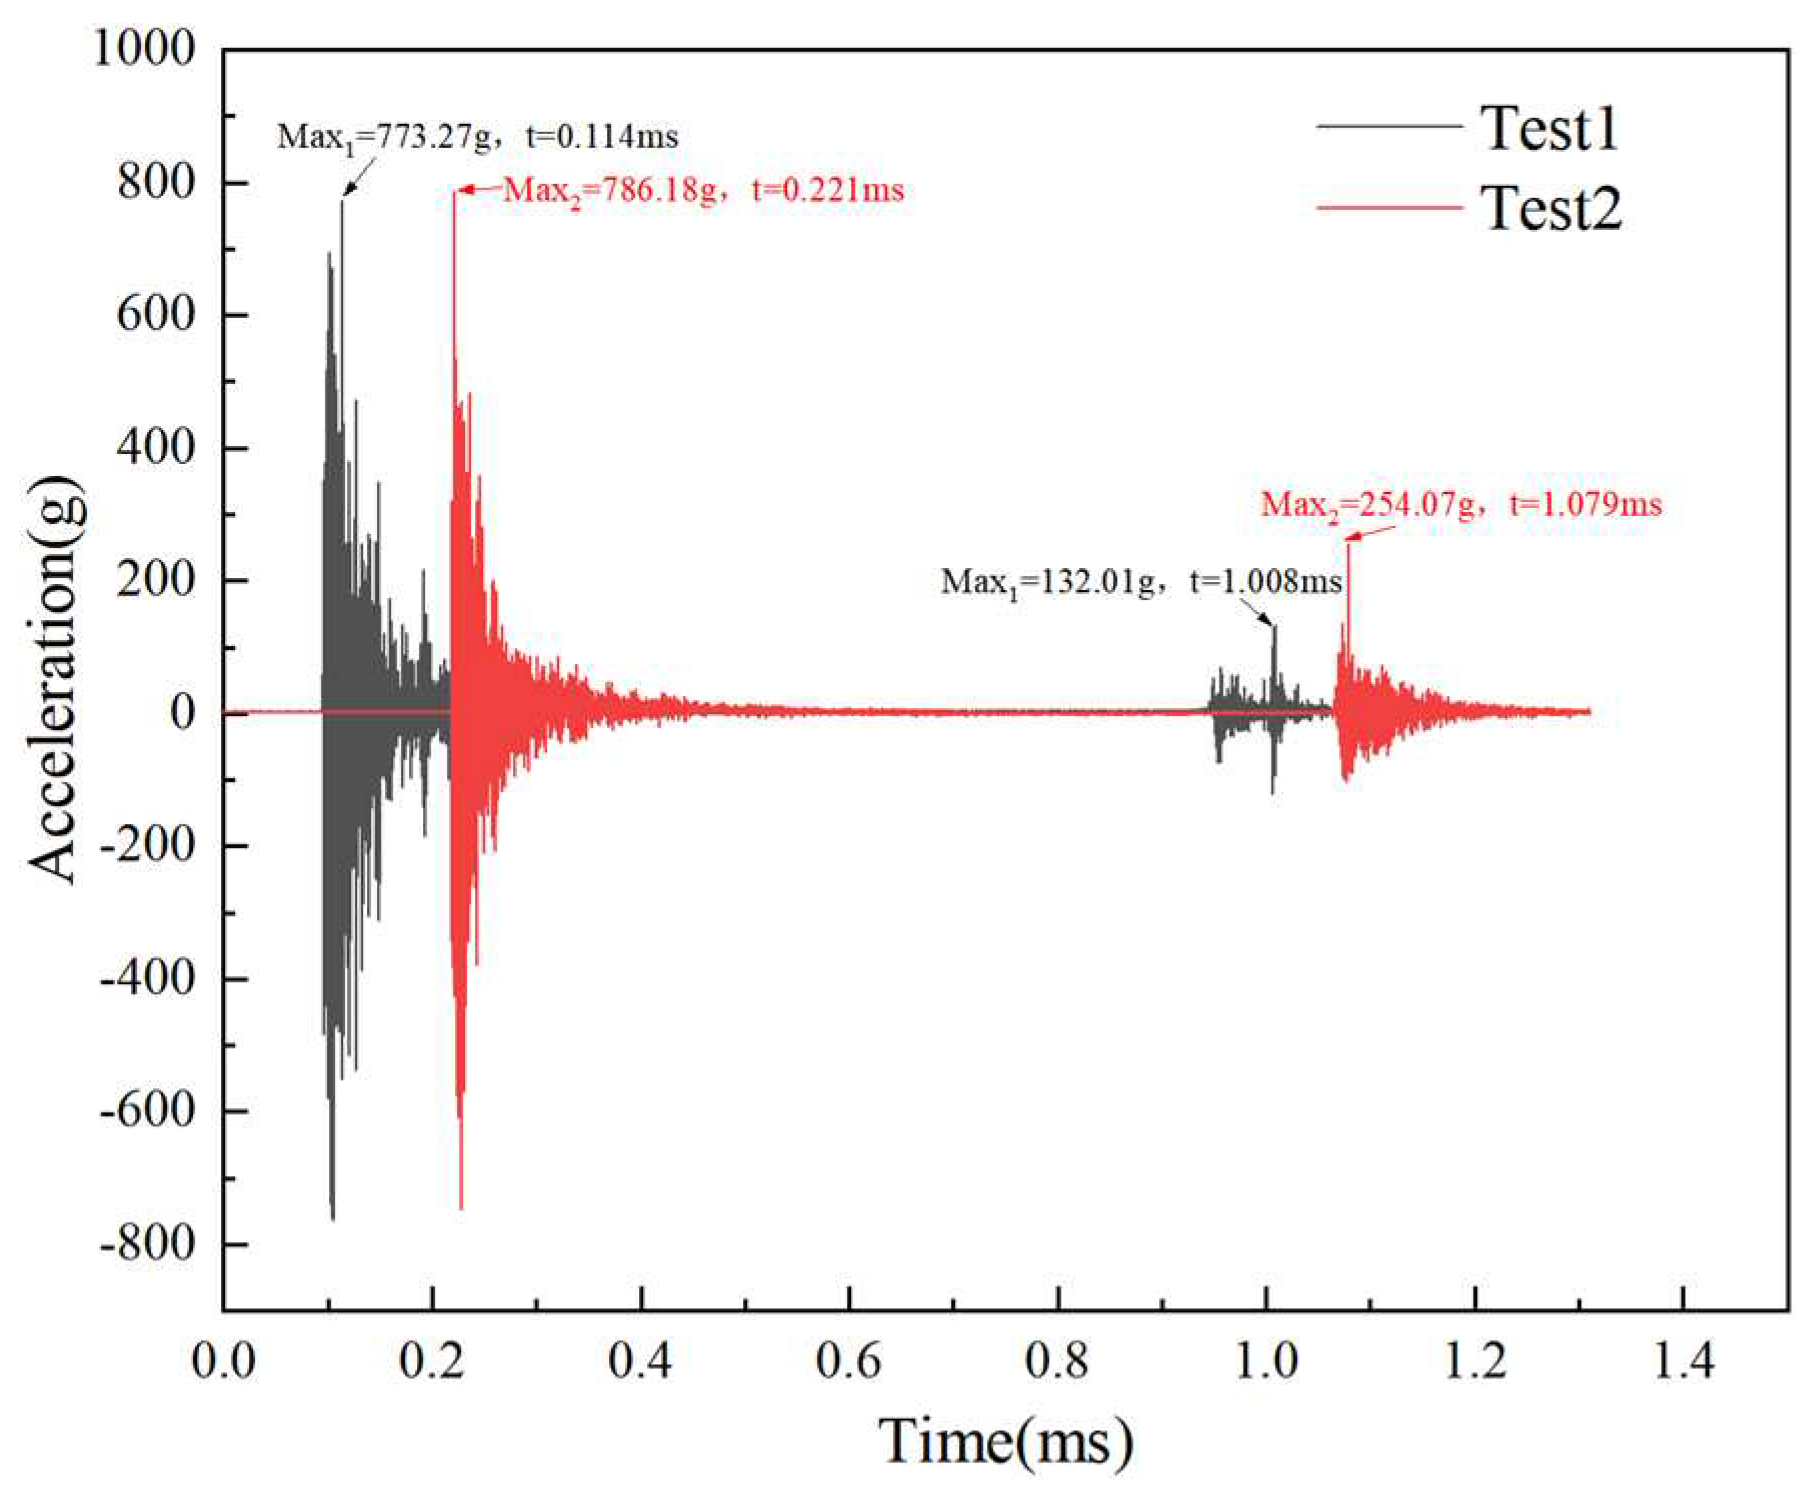
Figure 6.
Acceleration time-course curve of horizontal test condition.
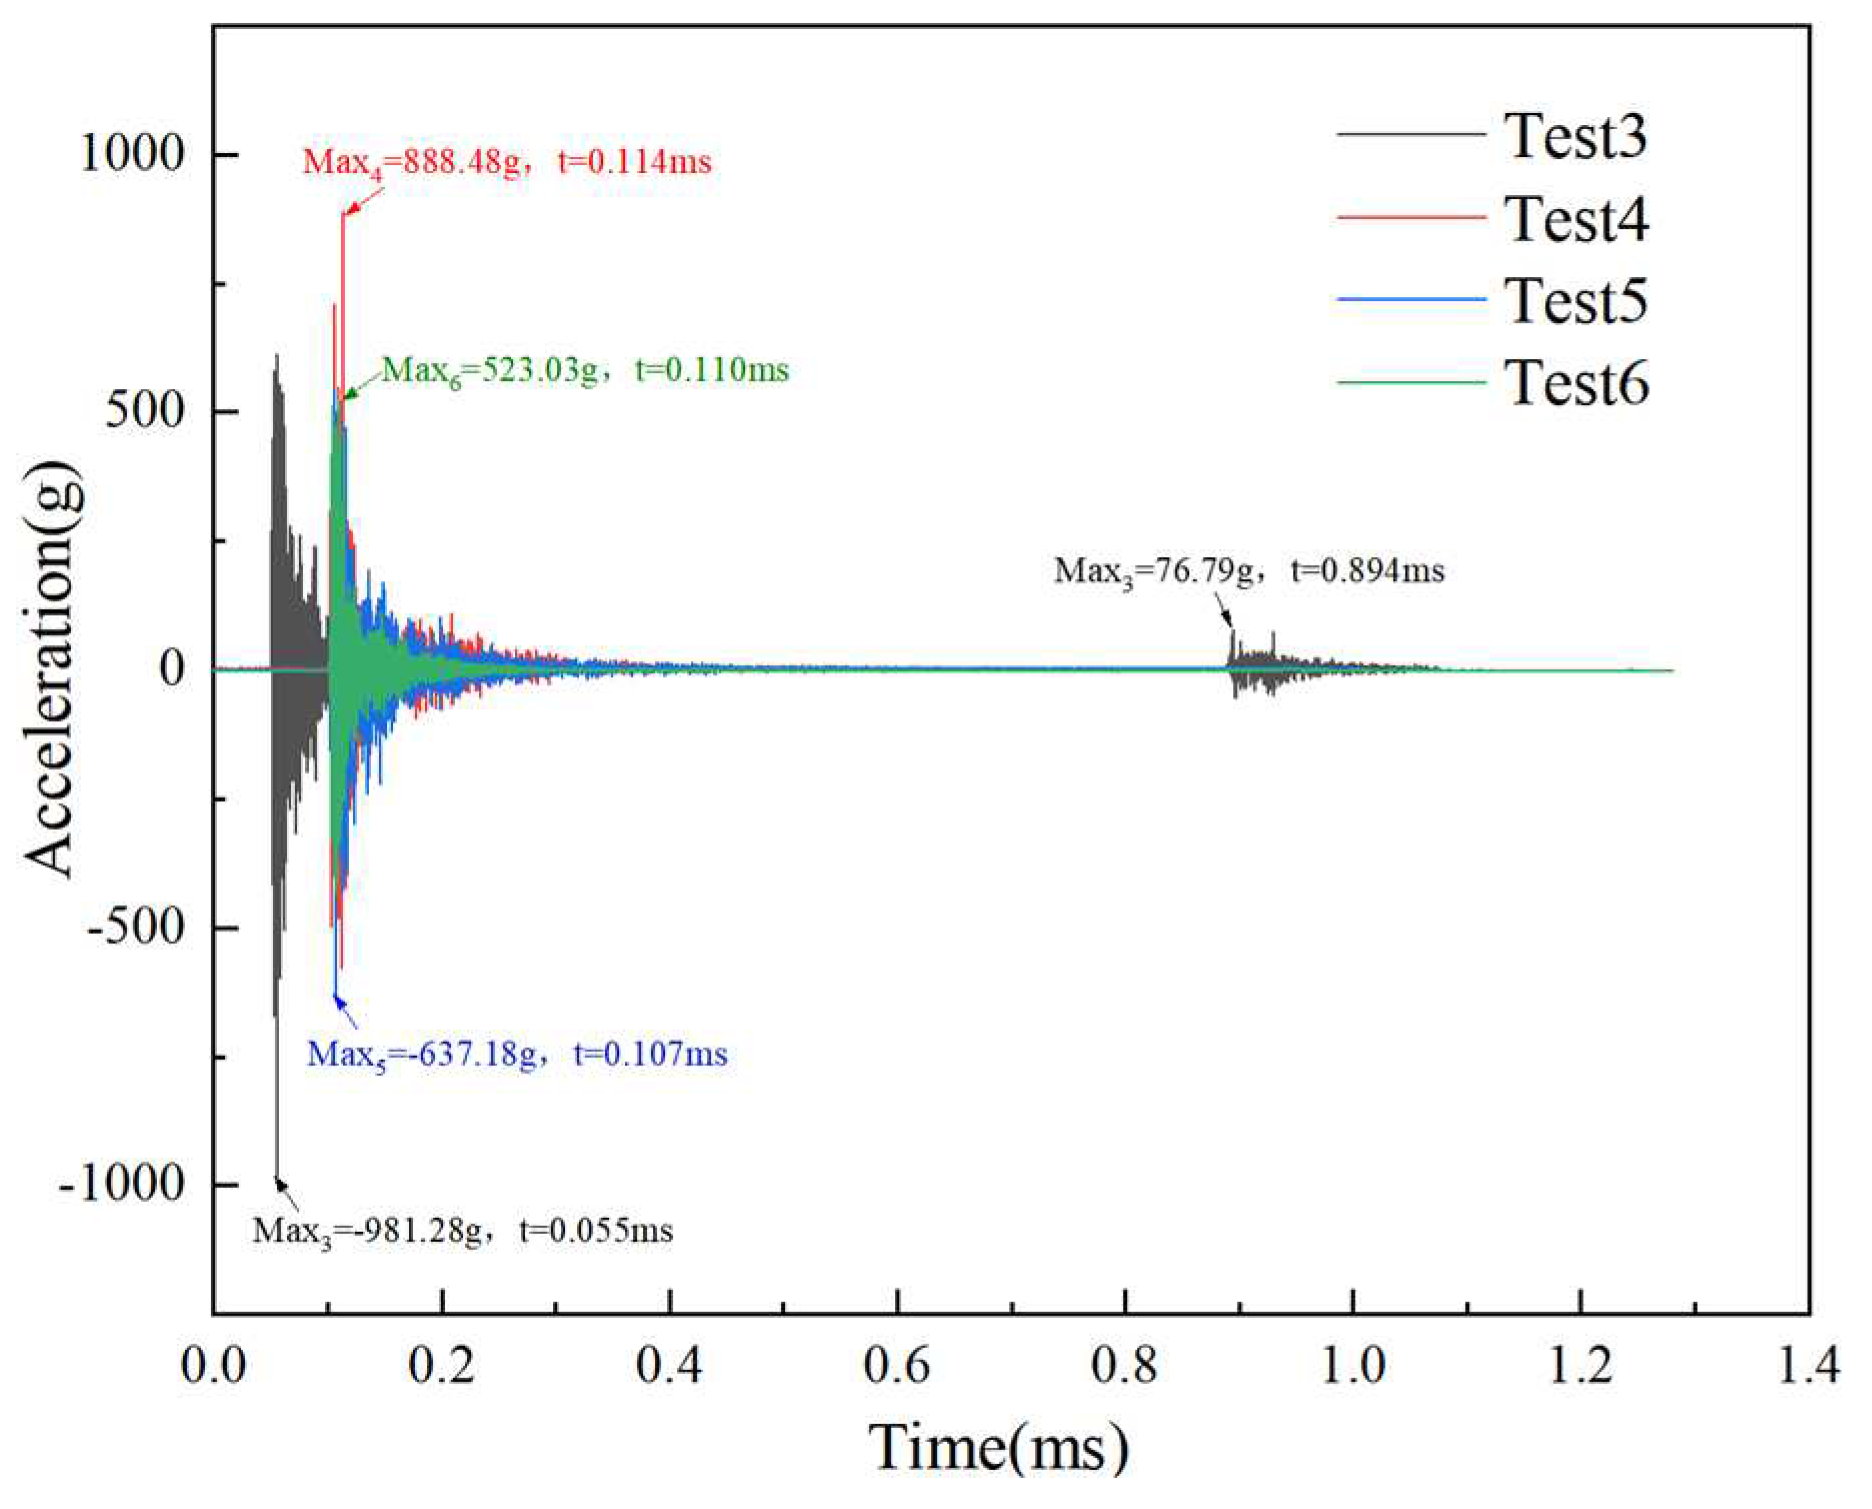
Figure 7.
Typical shock spectrum for longitudinal examination.
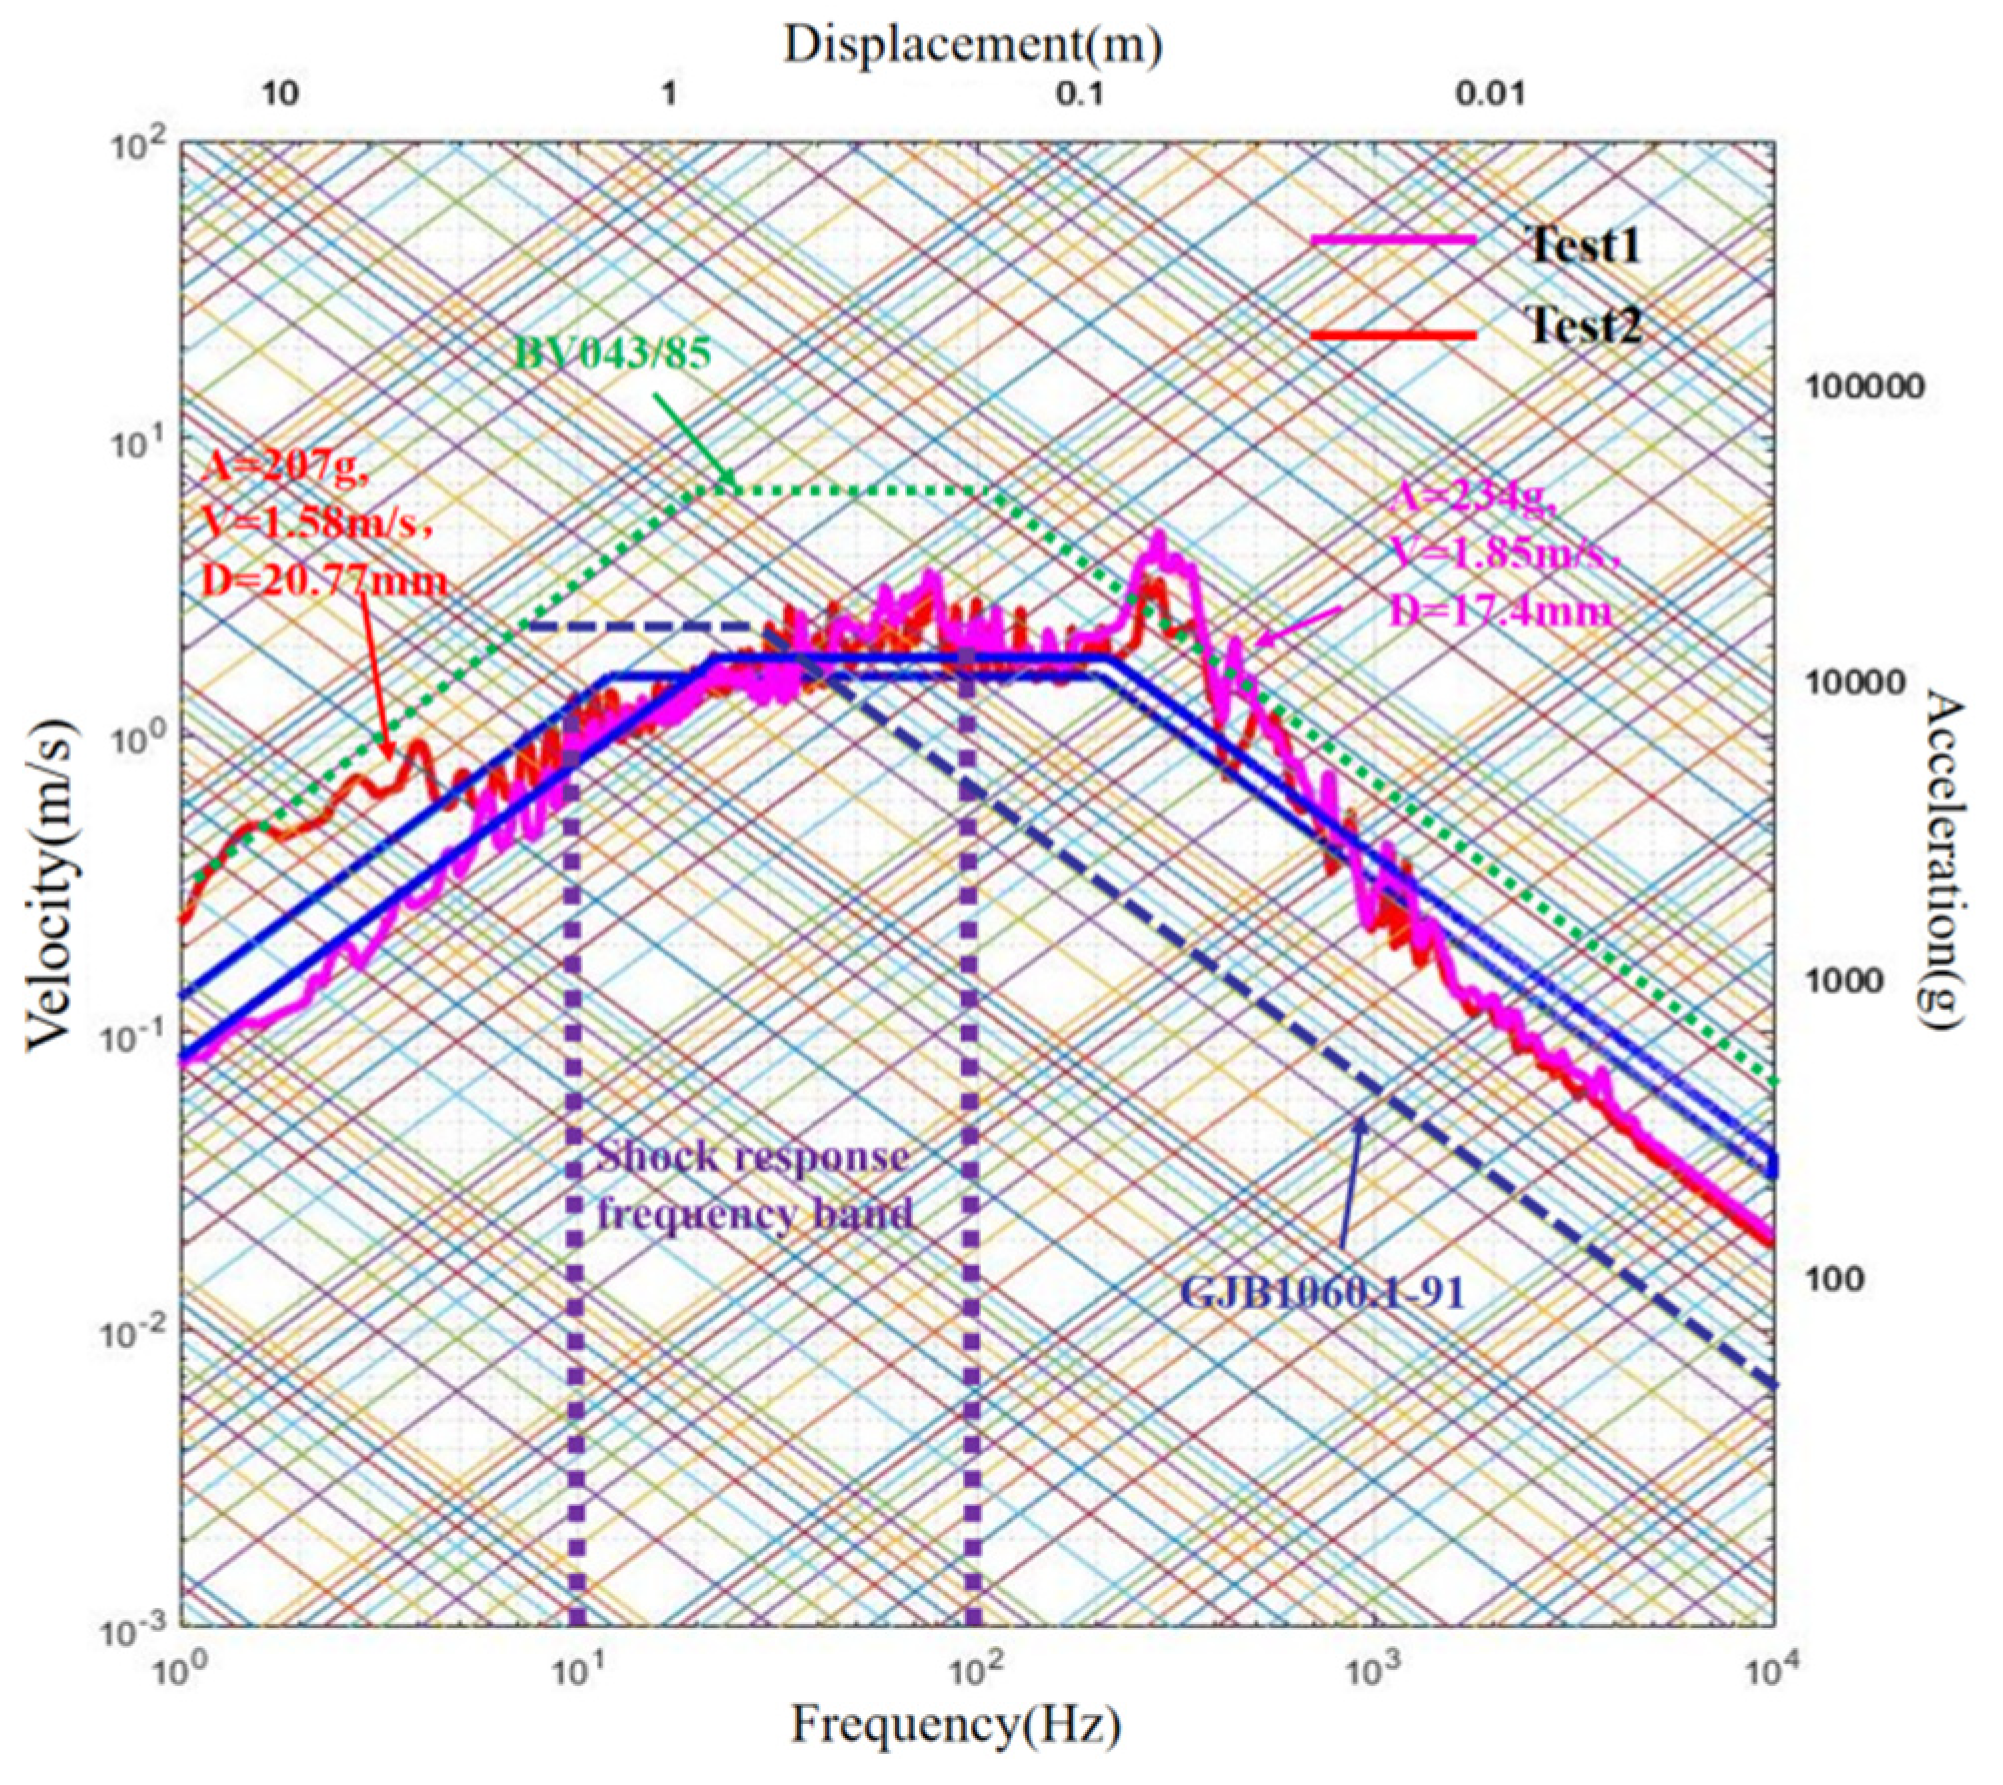
Figure 8.
Typical shock spectrum for horizontal examination.
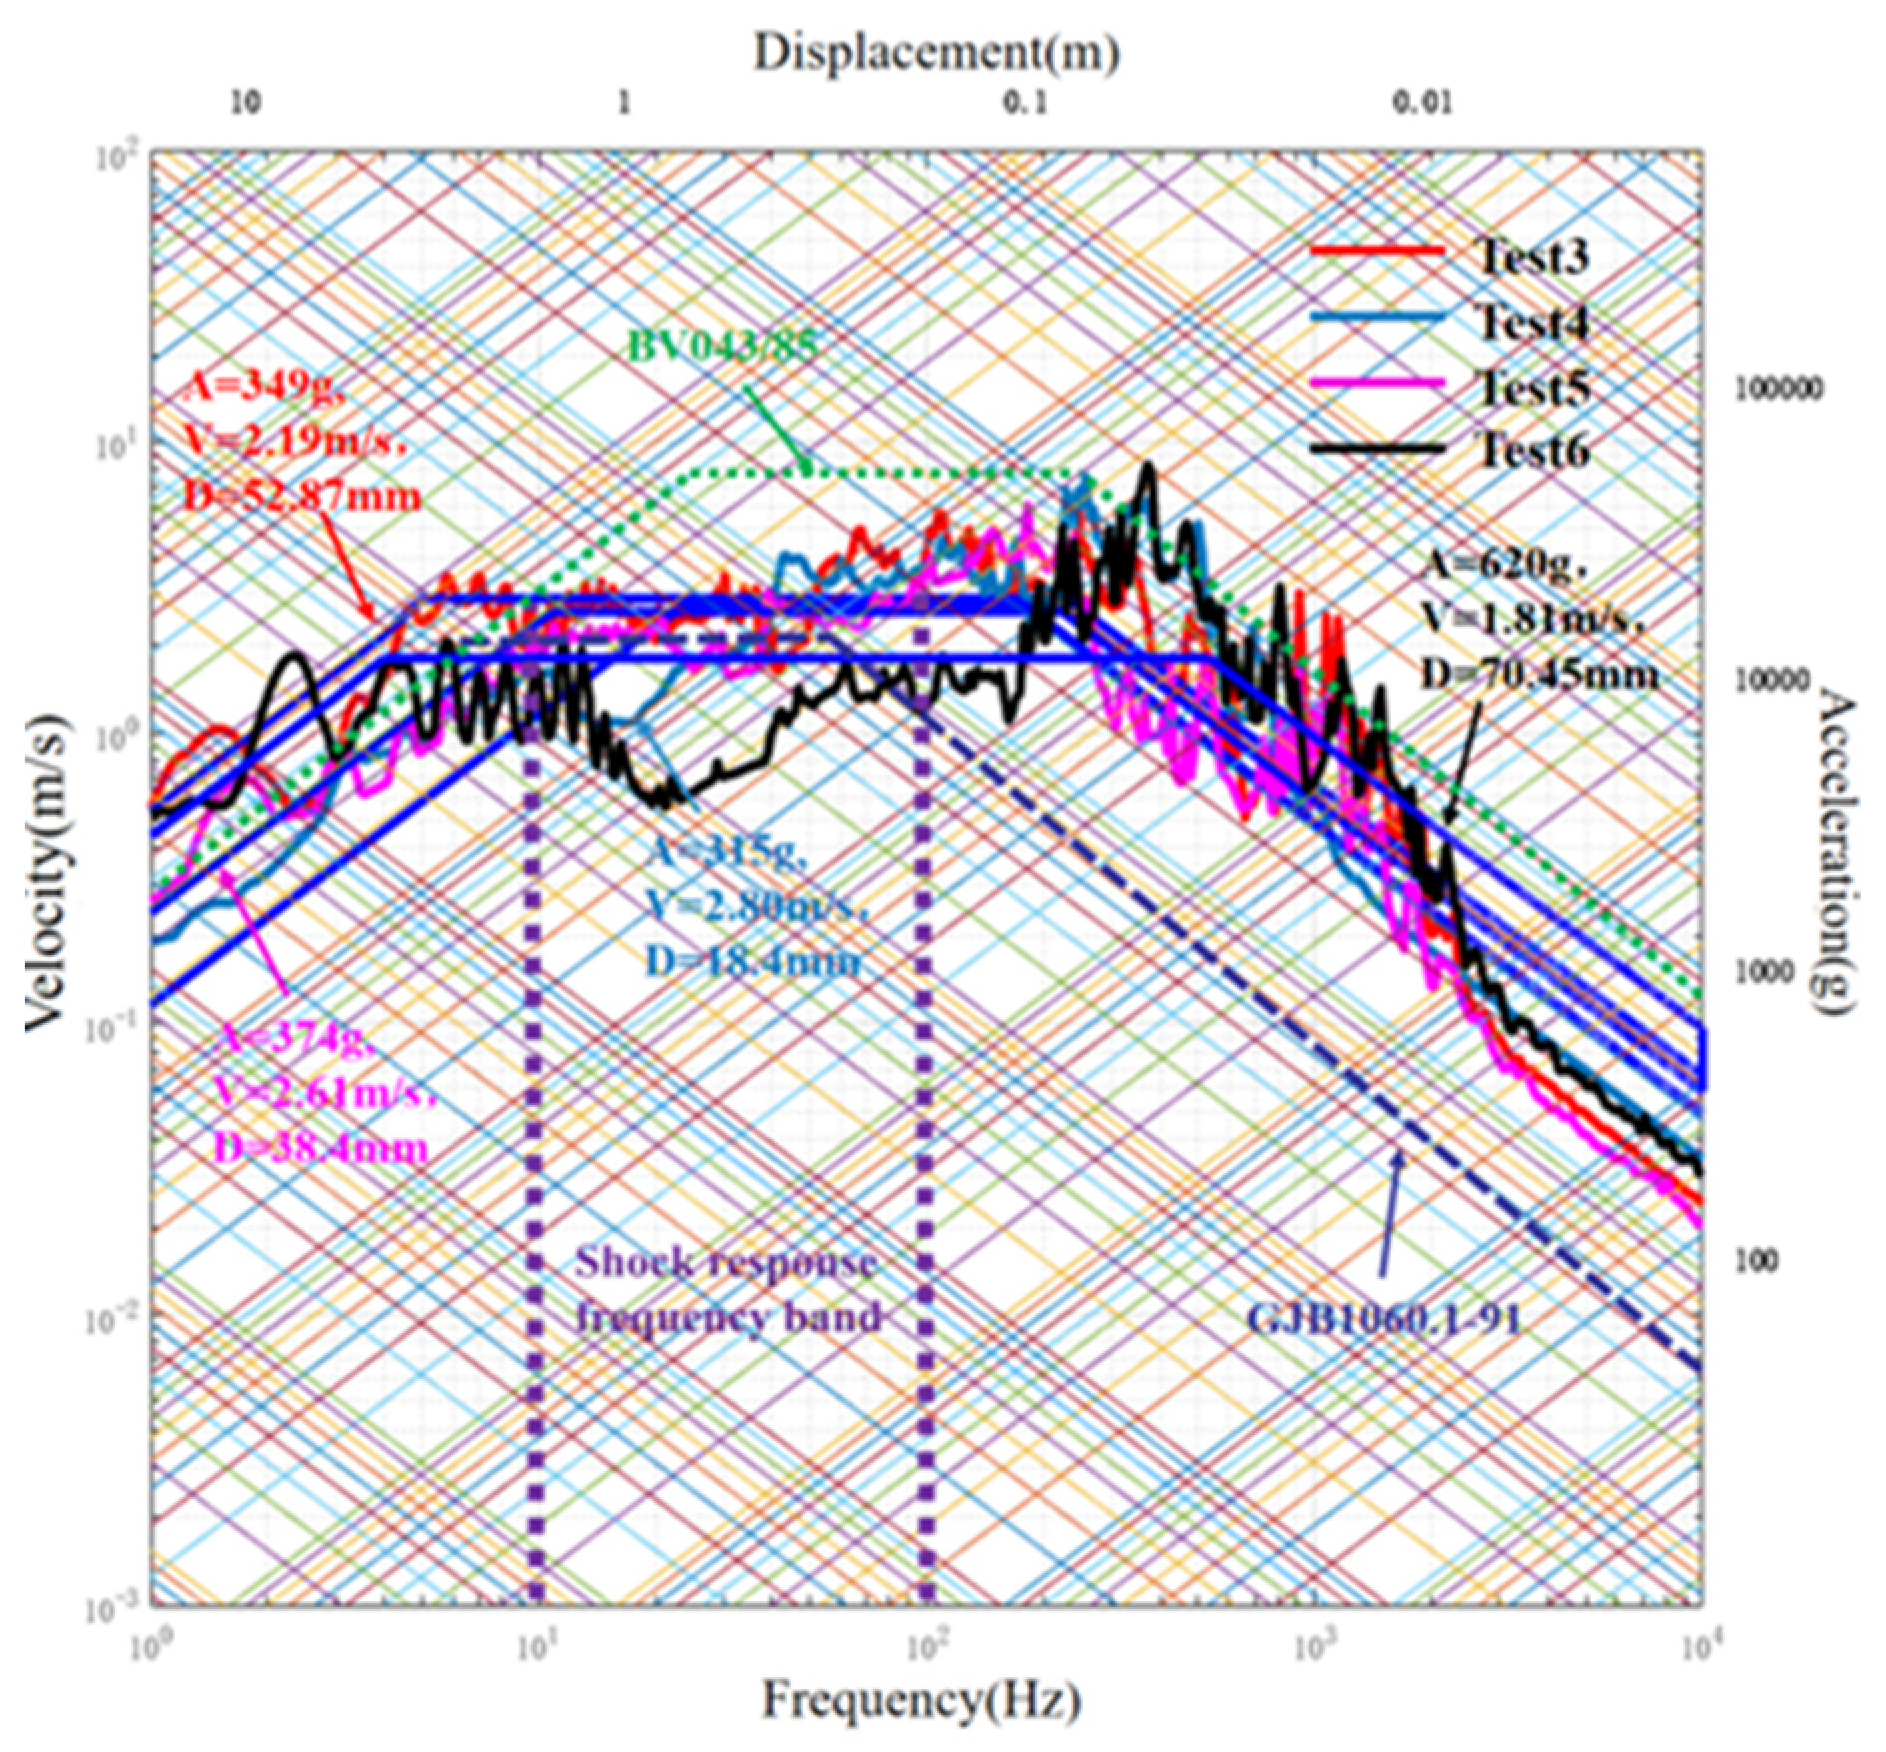
Figure 9.
Comparison of methods for forecasting shock environments (a)Error interpolation formula; (b) Confidence interval forecast.
Figure 9.
Comparison of methods for forecasting shock environments (a)Error interpolation formula; (b) Confidence interval forecast.
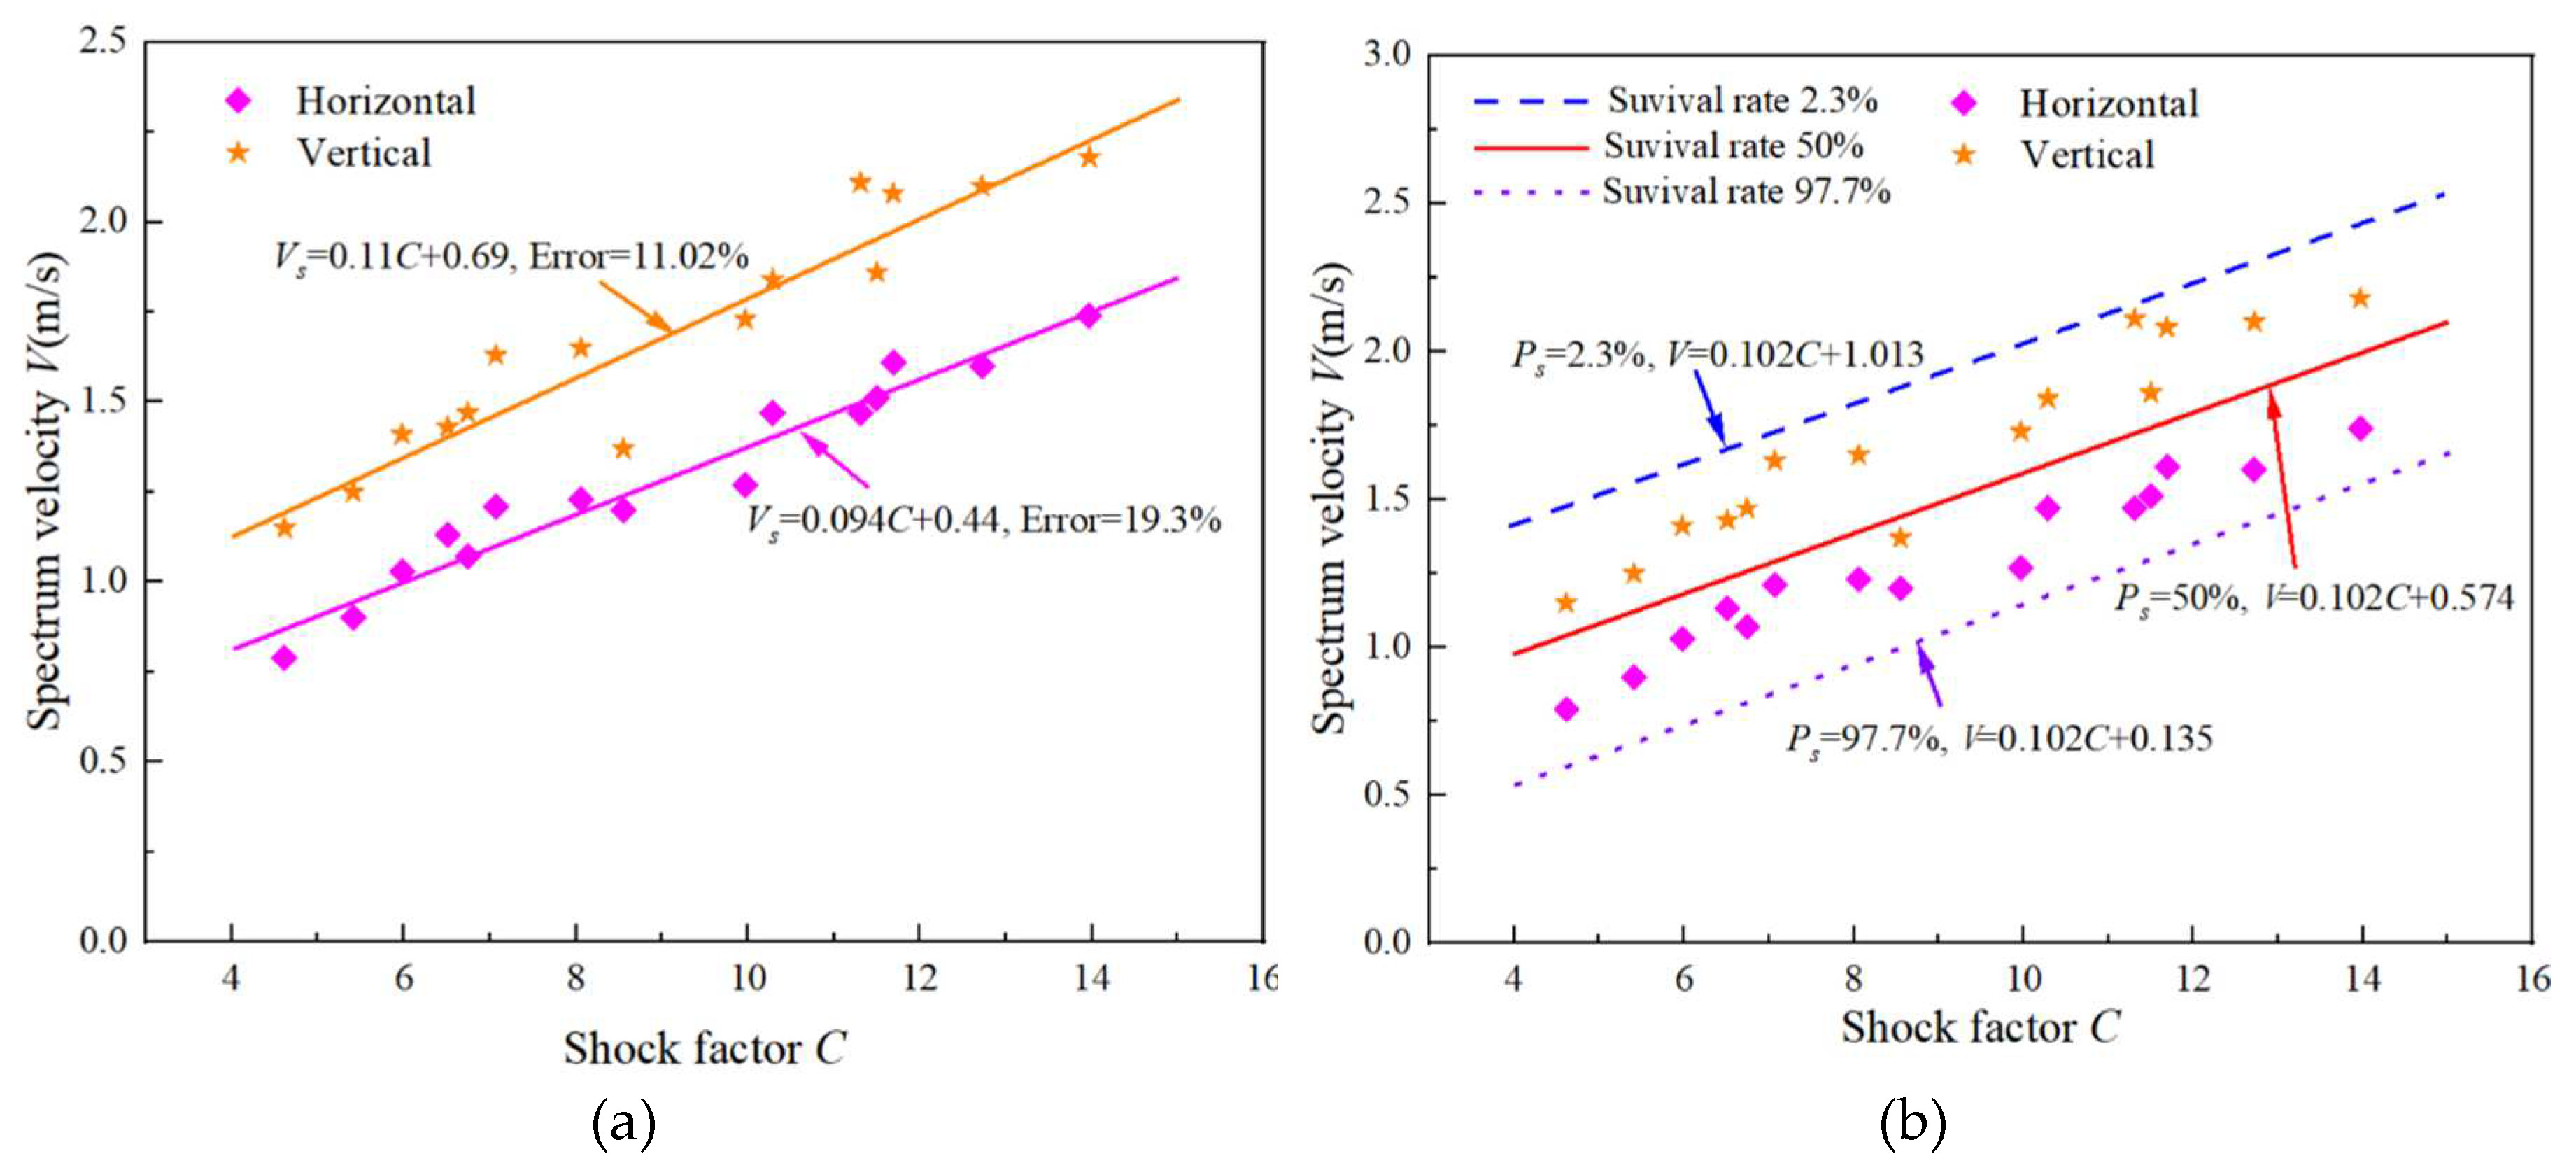
Figure 10.
Longitudinal condition shock environment prediction: (a)Error interpolation formula; (b)Confidence interval forecast.
Figure 10.
Longitudinal condition shock environment prediction: (a)Error interpolation formula; (b)Confidence interval forecast.
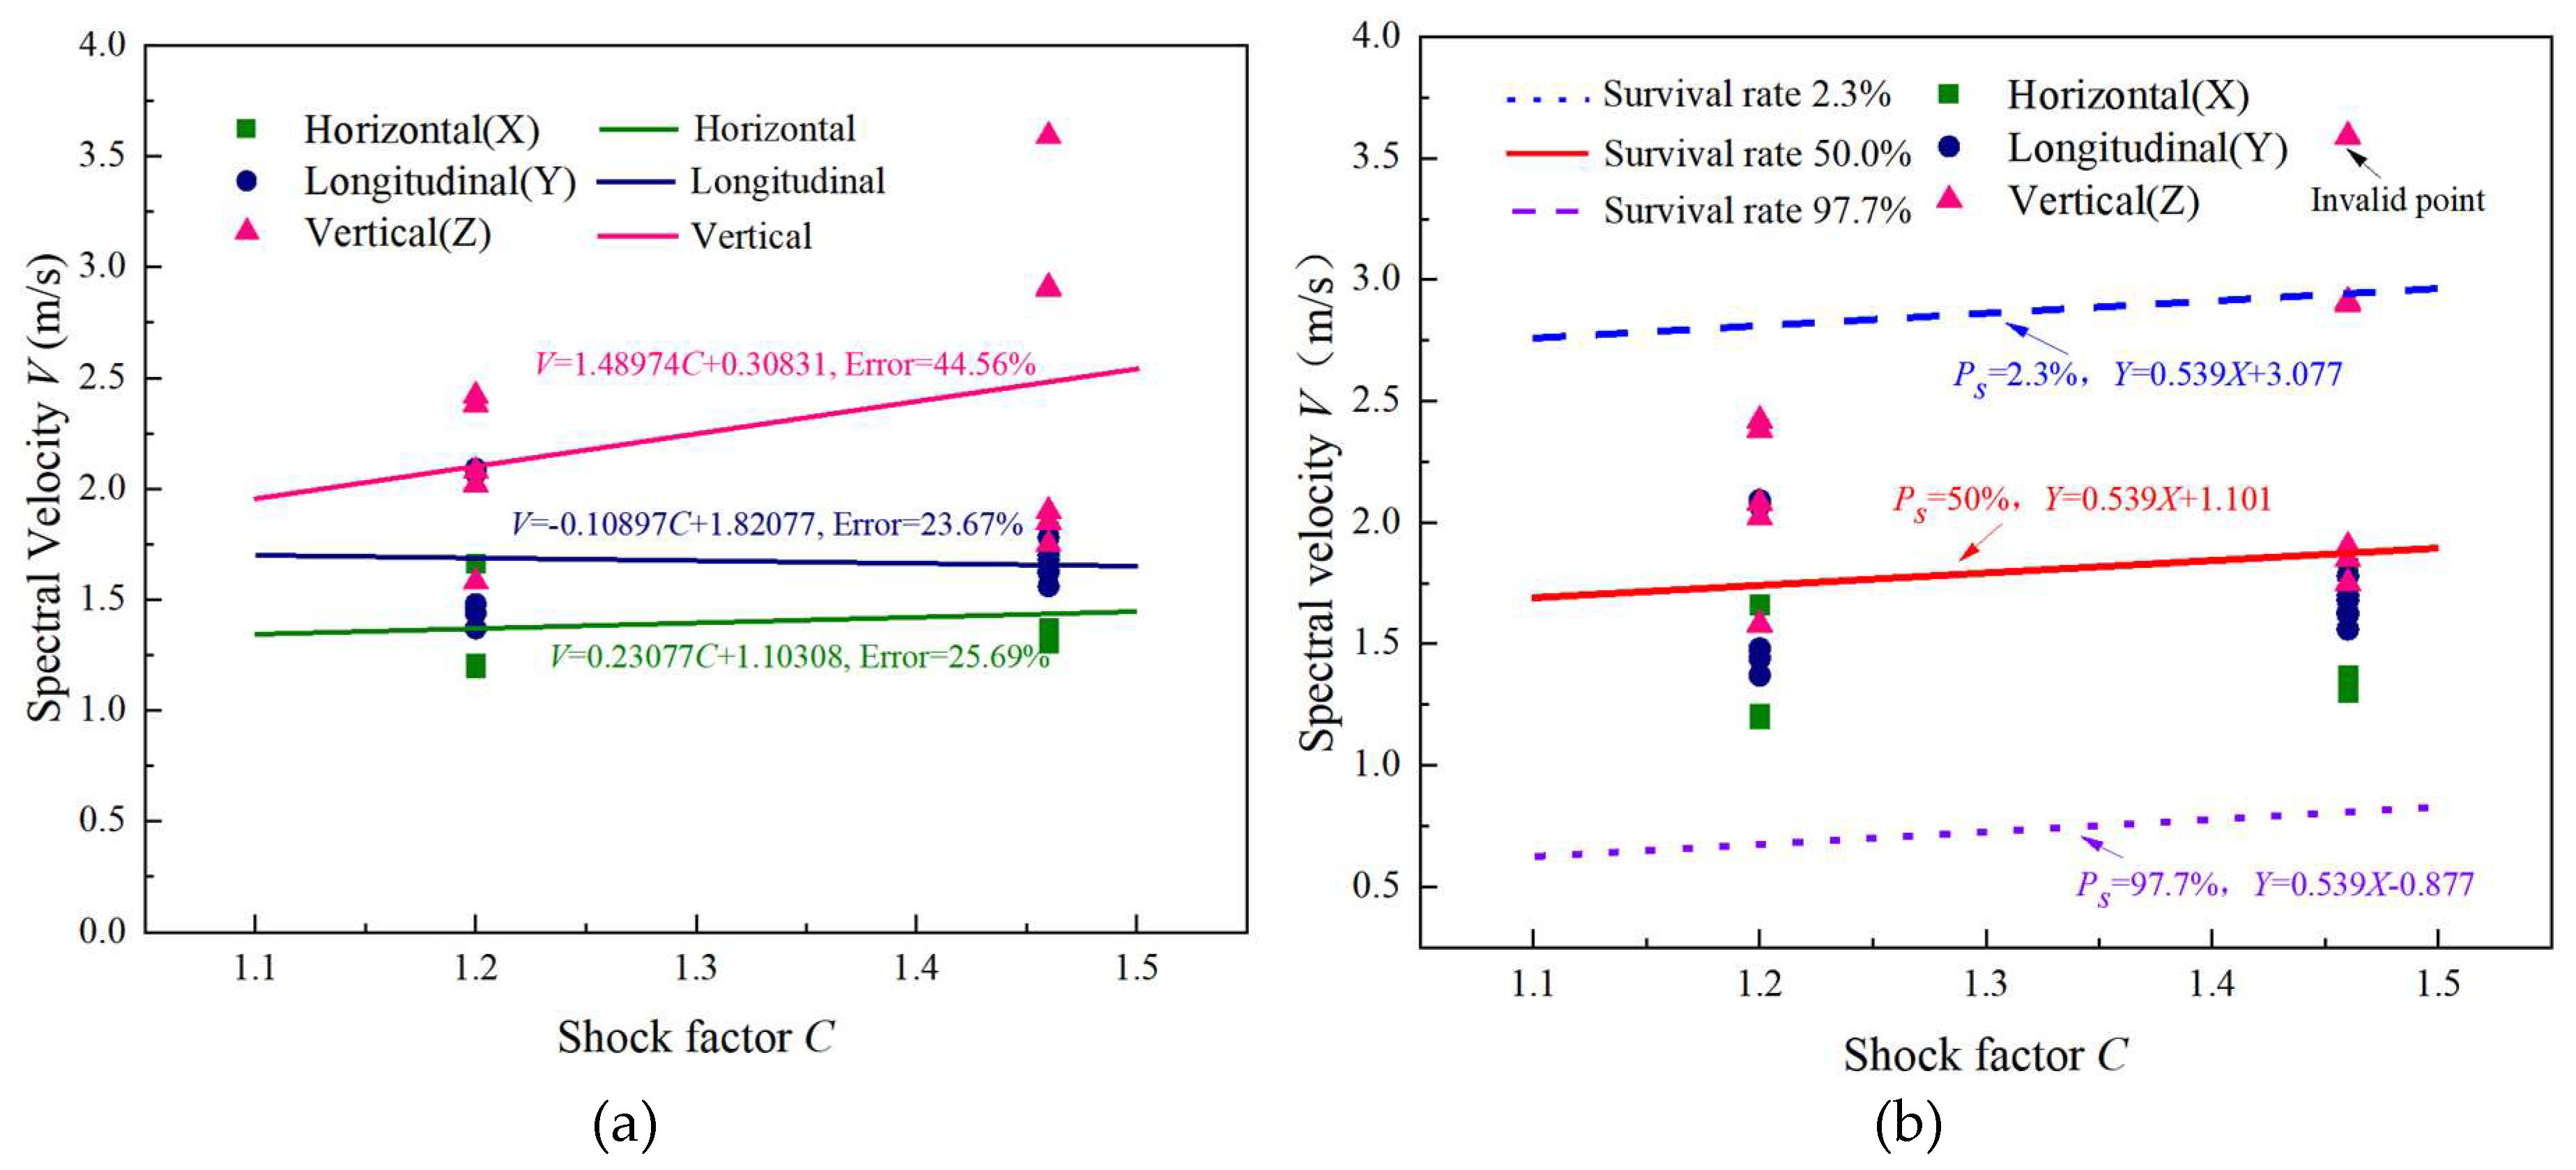
Figure 11.
Horizontal condition shock environment prediction:(a) Error interpolation formula; (b)Confidence interval forecast.
Figure 11.
Horizontal condition shock environment prediction:(a) Error interpolation formula; (b)Confidence interval forecast.
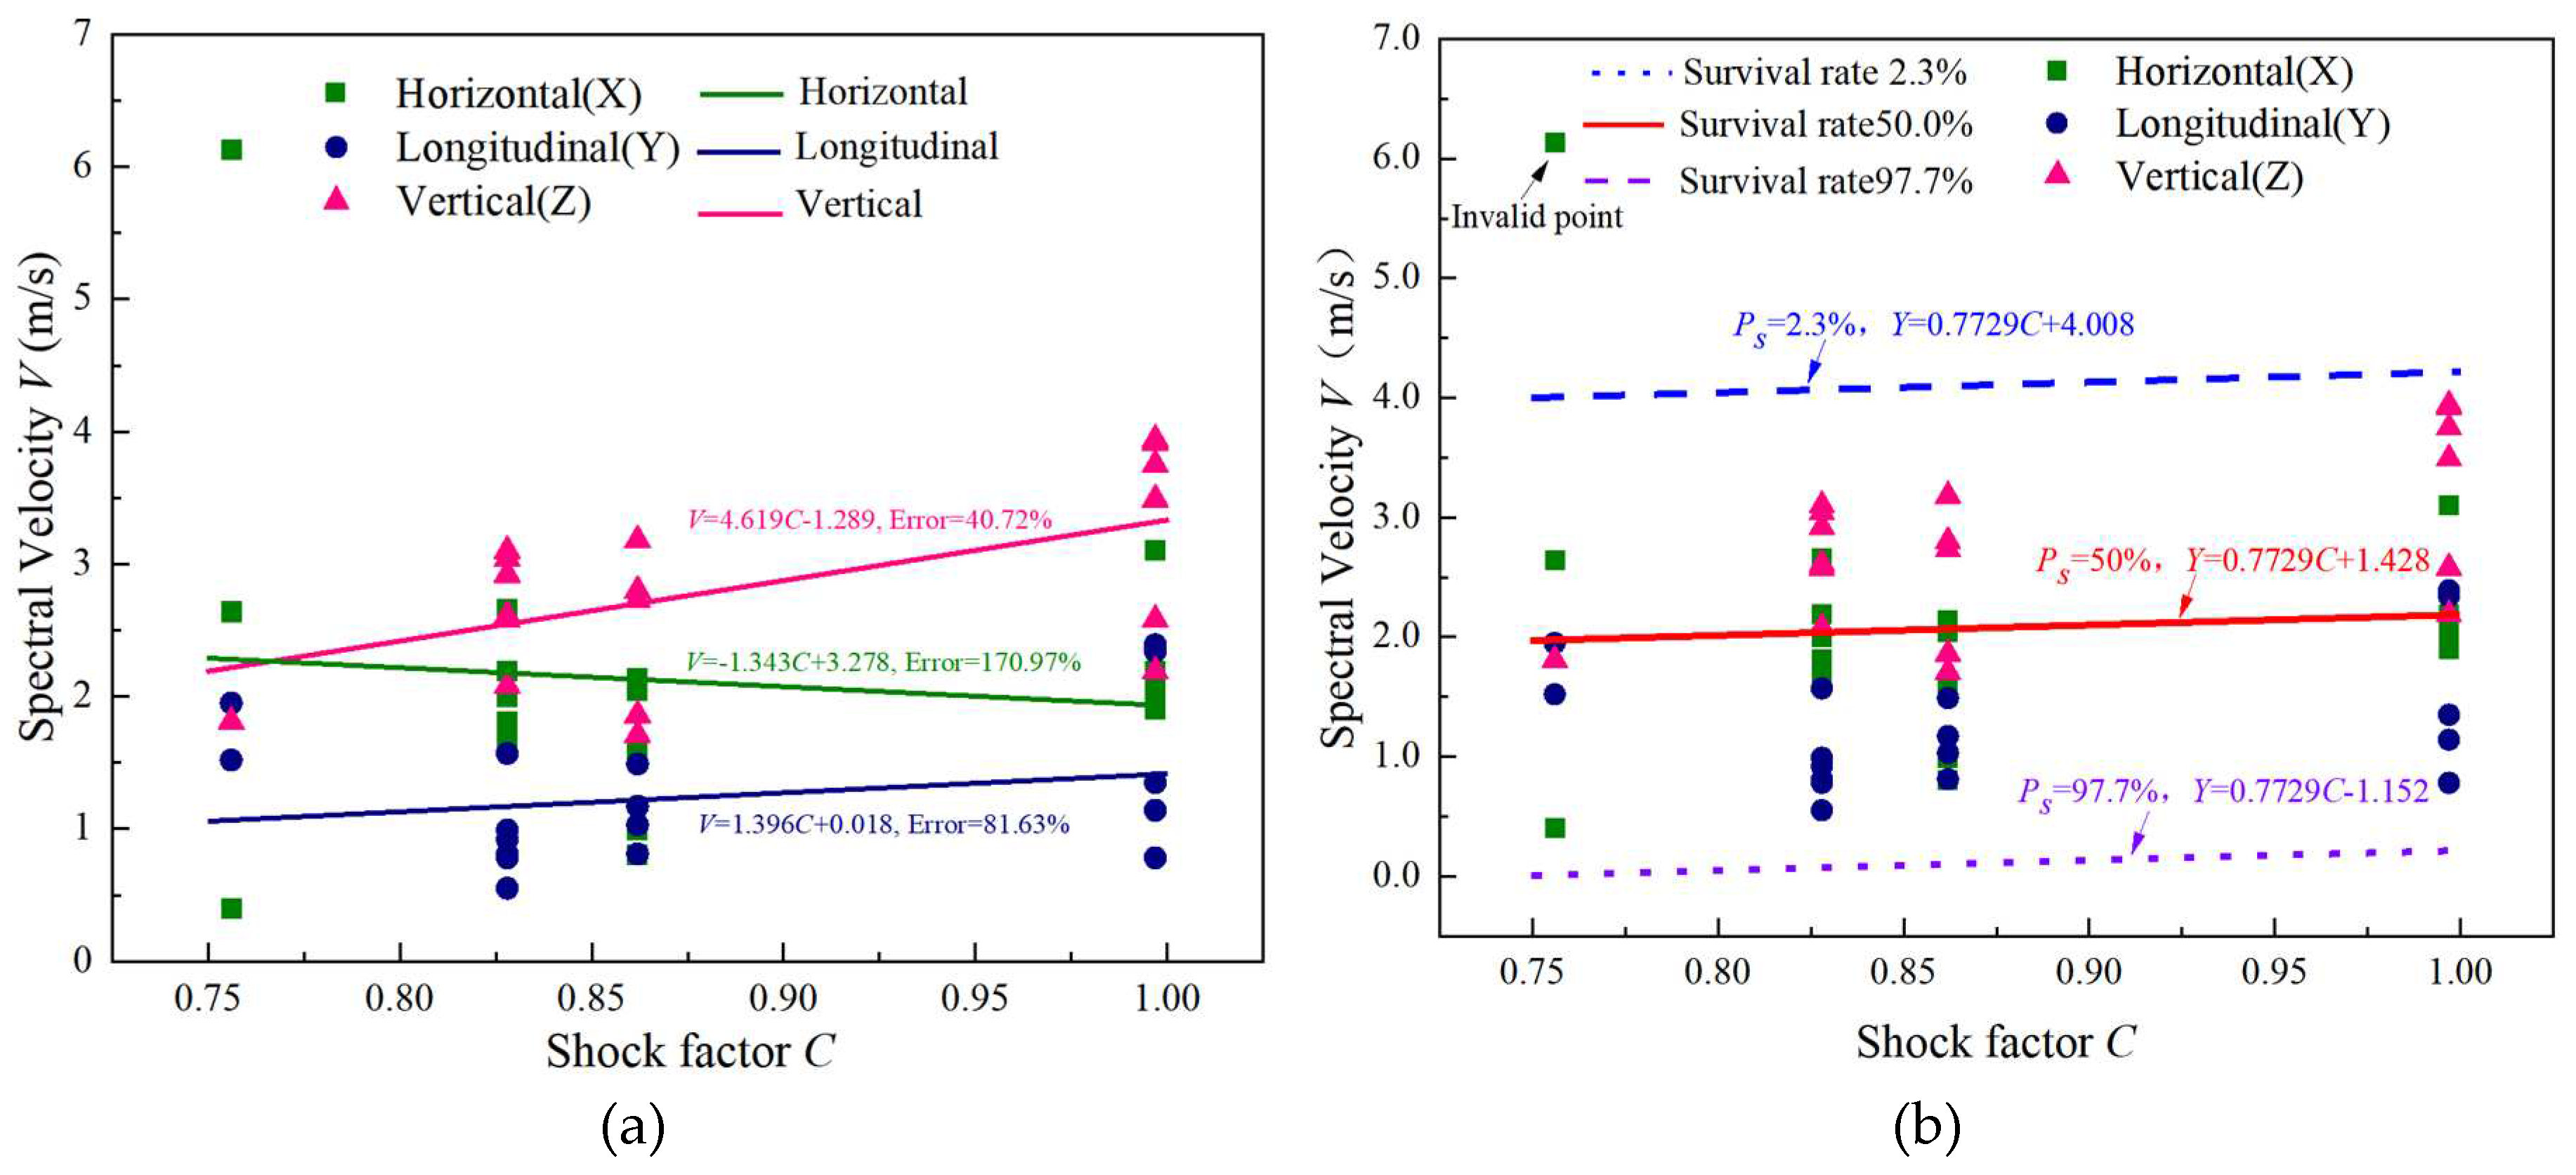

Table 1.
B&K4384 Sensor parameters.
| B&K4384 | Charge sensitivity(pc/g) | Voltage sensitivity(mv/g) | Mounted resonance(KHz) | Frequency range(Hz) |
|---|---|---|---|---|
| Parameters | 9.8 ± 2 % | 8 ± 2 % | 42 | 0.2 ~9100 |
Table 2.
Shock environment assessment requirements.
| Installation part | orientations | Iso-acceleration spectrumA0(g) | Iso-velocity spectrumV0(m/s) | Iso-displacement spectrumD0(cm) |
|---|---|---|---|---|
| Class I | Vertical | 320 | 7.0 | 4.3 |
| Horizontal | 280 | 6.0 | 3.0 | |
| Discounted class I |
Vertical | 63.71 | 2.10 | 4.3 |
| Horizontal | 55.74 | 1.80 | 3.0 | |
| Note: (1) Class I installations refer to the ship's outer plate and/or outer plate stiffener, double tank top, and bulkheads below the main deck; (2)Vertical shock environment = horizontal shock environment. | ||||
Disclaimer/Publisher’s Note: The statements, opinions and data contained in all publications are solely those of the individual author(s) and contributor(s) and not of MDPI and/or the editor(s). MDPI and/or the editor(s) disclaim responsibility for any injury to people or property resulting from any ideas, methods, instructions or products referred to in the content. |
© 2023 by the authors. Licensee MDPI, Basel, Switzerland. This article is an open access article distributed under the terms and conditions of the Creative Commons Attribution (CC BY) license (http://creativecommons.org/licenses/by/4.0/).
Copyright: This open access article is published under a Creative Commons CC BY 4.0 license, which permit the free download, distribution, and reuse, provided that the author and preprint are cited in any reuse.


