Submitted:
25 October 2023
Posted:
25 October 2023
Read the latest preprint version here
Abstract
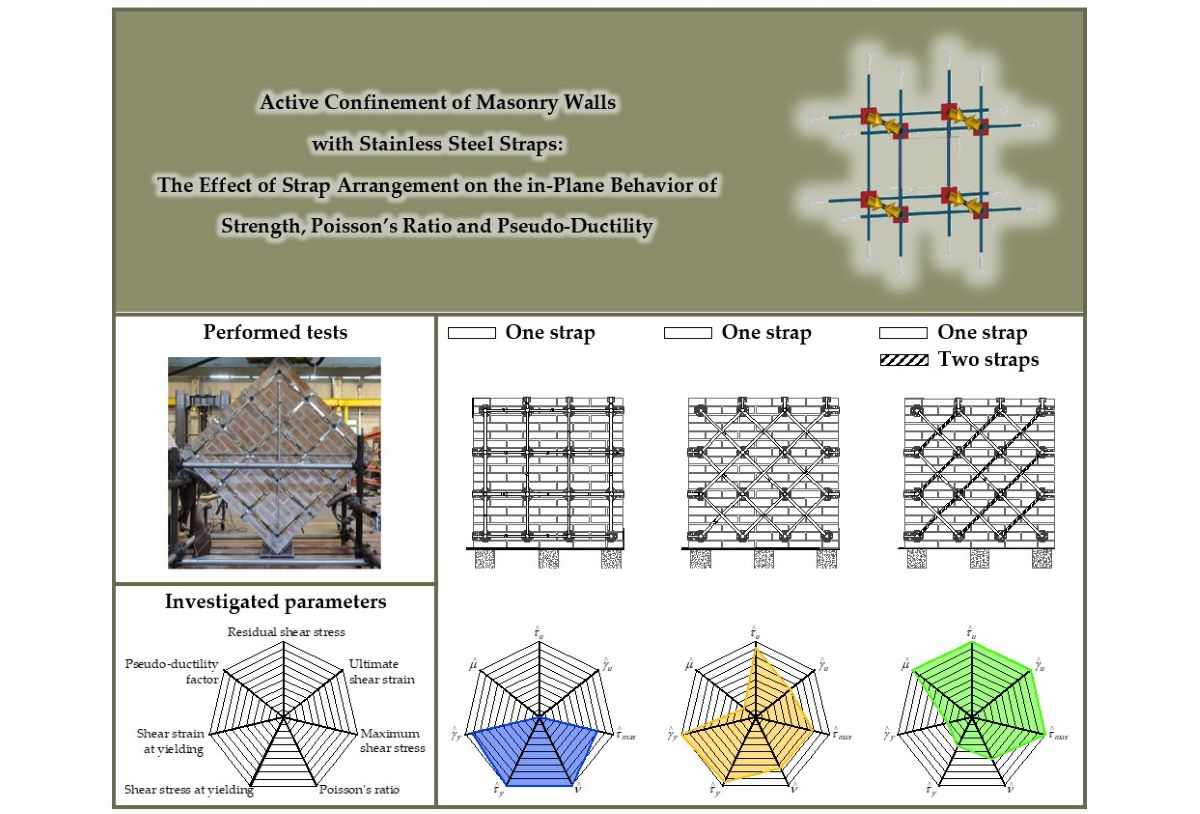
Among all the active confinement techniques, the use of pre-tensioned stainless steel straps has recently gained much attention. The flexibility of the stainless steel straps allows us to bend and pass them through the thickness of the masonry, thus creating a three-dimensional strengthening system between the two opposite facings. The use of the same perforation for the passage of several straps closed in a loop generates a continuous strengthening system that prevents parts of the structure from falling and injuring the occupants during seismic events. However, the perforations can nullify the in-plane strengthening, as they act as cylindrical hinges and make the reinforcement system labile for certain strap arrangements. Diagonal compression tests on square masonry panels performed in the present study show that the straps improve neither strength nor ductility when running along the mortar head and bed joints, arranged in square meshes. Conversely, they improve both strength and ductility when the straps make angles of 45° with the mortar joints. Furthermore, the experimental results show that the straps exert an anisotropic effect that decreases the apparent in-plane Poisson ratio. They also provide new insights into the diagonal compression test and allow formulating a new proposal for the pseudo-ductility factor.
Keywords:
masonry walls
; CAM® System
; shear behavior
; reinforcement arrangement
; diagonal compression test
; pseudo-ductility
; anisotropy
; elastic moduli
; Poisson’s ratio.
1. Introduction
Masonry structures are of great interest for civil engineering, as they constitute the majority of the historic building heritage of many countries and are a building typology still widely used throughout the world. Unfortunately, most of the existing masonry structures date from periods before the introduction of any seismic regulations [1]. Therefore, they are mainly suitable for bearing gravitational loads, while their lateral bearing capacity is poor. This, together with the inherently chaotic nature [2], high seismic mass and limited ductility of the masonry material, makes unreinforced masonry (URM) structures highly vulnerable to seismic shaking [3–7]. The consequences on the safety of those inside or in the immediate vicinity of these structures are dramatic. Suffice it to say that masonry structures are believed to be the cause of about two-thirds of the total death toll from earthquakes over the last 100 years [8]. Therefore, finding a solution for the low tensile strength and poor ductility of masonry units―i.e. the main causes of their seismic vulnerability [9]―is a major concern of civil engineering [10]. This gave rise to the need to reinforce masonry structures and study the behavior of reinforced masonry (RM).
There are two main categories of reinforcement techniques for masonry buildings: passive reinforcements and active reinforcements [11]. The latter category, younger than the first category, is gaining more and more attention from designers [12–15]. Its strength compared to the first category is that it does not require structural damage to occur before going into operation. Contrary to passive reinforcements, in fact, active reinforcements act on structural elements from the moment of their installation.
1.1. General information on the CAM® System
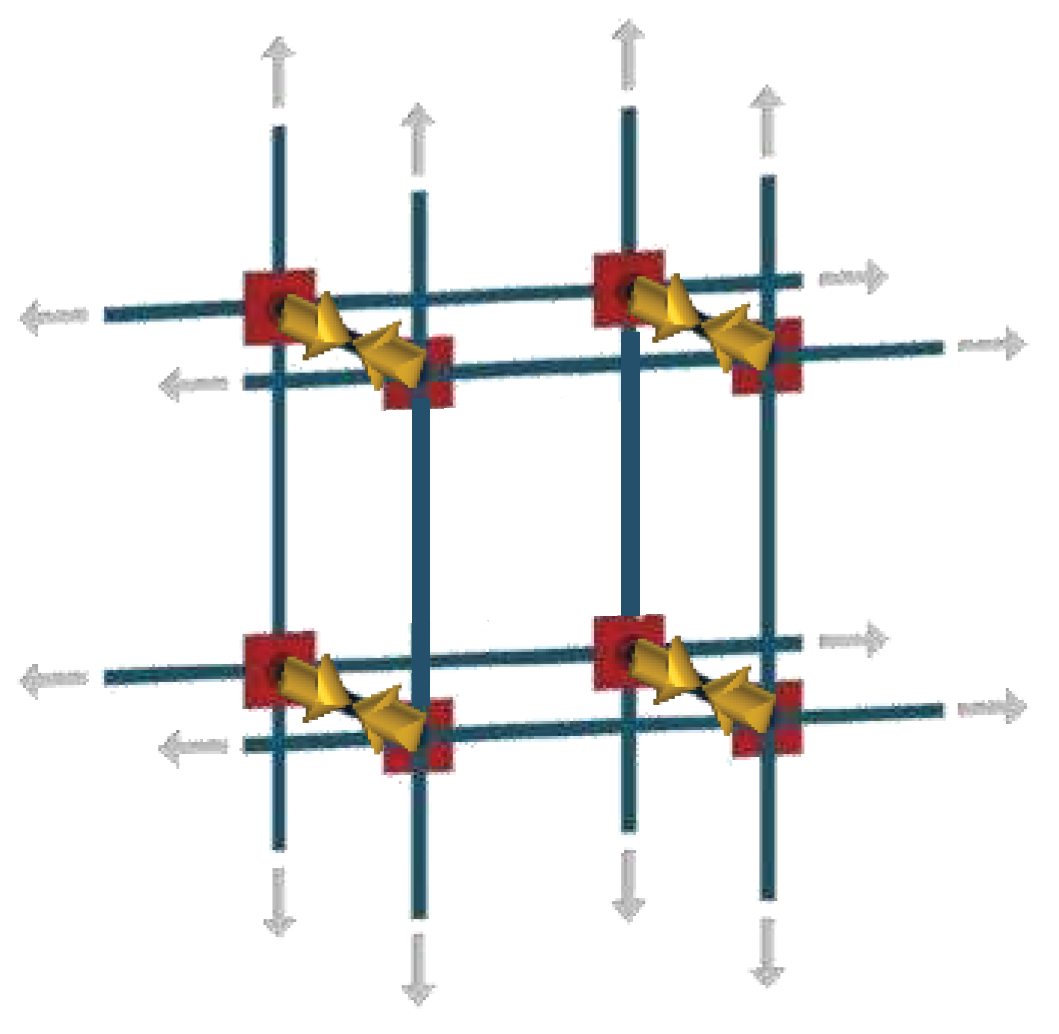
Among the various techniques of active reinforcement, this work focuses on the CAM® System (Active Confinement of Masonry: CAM is the Italian acronym for Active Stitching of Masonry) [16–20]. This system is an evolution of the strengthening method with post-tensioned horizontal and vertical tie rods [21–27]. The evolution consists of the strengthening elements of the CAM® System [28], which are stainless steel straps instead of metal bars. The stainless steel straps pass through the thickness of the masonry thanks to openings made in the masonry by core drilling. Special stainless steel elements protect the edges of the masonry [29] where the stainless steel straps turn around the edges of the wall (Figure S1a) and enter the perforations (Figure S1b). Since up to six stainless steel straps share the same perforation (Figure S2), the CAM® System is a continuous strengthening system (unlike the tie rods system and all other systems in the same strengthening category). This makes it possible to establish effective connections in three dimensions between all the construction elements (roof, floors, and walls)―starting from the foundations of the building―to obtain or re-establish the so-called box-type behavior (Figure S3).
The loop closure of the straps (Figure S4) creates a strong bond between the two opposite faces of the wall. This improves the monolithic behavior of the masonry wall, especially when the masonry wall consists of two or more weakly connected vertical layers. Furthermore, the closure equipment provides the stainless steel straps with a tensile stress, which puts the enclosed portion of masonry in compression (Figure S4). The transmission of stresses from the strengthening system to the masonry at the time of installation is why the CAM® System is an active strengthening system.
When four stainless steel straps share the perforations and the loops have horizontal and vertical directions (Figure S2), the CAM® System replicates the reinforcement scheme with horizontal and vertical ties. In this case, known as a rectangular arrangement, the perforations divide the masonry wall into volume units in the shape of right parallelepipeds (Error! Reference source not found.). The early studies on the CAM® System [16–20,30–32] assumed that the three-dimensional arrangement of the loops provided the parallelepiped volume units with an additional compressive stress field that is hydrostatic, by extension in the three dimensions of the stress transfer mechanism shown in Figure S4. However, further theoretical analyses [11,29] revealed that the CAM® System adds confinement forces only in the transverse direction (Error! Reference source not found.), except for volume units located near the free ends of the masonry wall. Recently, also the numerical results of a FEM simulation [15] confirmed that the confinement provided by the CAM® System to the wall is not isotropic.
Figure 1.
Stress transfer mechanism from the three-dimensional net of stainless steel loops placed in tension to the volume units of the masonry wall [11].
Figure 1.
Stress transfer mechanism from the three-dimensional net of stainless steel loops placed in tension to the volume units of the masonry wall [11].
1.2. The idea behind the experimental program
Seismic events impose two types of dominant loads on structures―the in-plane shear load (Figure 1a) and the out-of-plane bending load (Figure 1b)―which causes two types of dominant failure modes in URM structures [33,34]: the in-plane shear mechanisms and the out-of-plane bending mechanisms. The CAM® System with rectangular arrangement (Error! Reference source not found.) is suitable for increasing the out-of-plane strength of masonry walls when used in conjunction with other strengthening systems [29,35,36]. In the plane of the wall, however, the rectangular arrangement does not bring any increase in strength or stiffness, since the perforation in squares of the wall facings makes the strengthening system labile to horizontal loads [29]. Indeed, the straps of the rectangular arrangement form unbraced rectangular frame structures with hinged nodes (Figure 2a), which sway laterally under the action of horizontal forces. Therefore, the perforations for the common passage of the straps are cylindrical hinges (Figure 2b), around which the loops can rotate freely.
The in-plane lability of the strengthening system with a rectangular arrangement makes the CAM® System useless under horizontal loads. In order to allow the CAM® System with a rectangular arrangement to improve also the in-plane behavior of masonry walls subjected to seismic loads, it is therefore mandatory to eliminate its in-plane lability.
In rectangular frame structures, it is customary to cancel the horizontal displacement of the hinged nodes by bracing the structures along one (Figure 3a) or both diagonals (Figure 3b).
However, bracing is not the only possible solution to remedy the lability of the rectangular arrangement in the CAM® System, because even labile static schemes can be in equilibrium for certain load directions. In fact, there is at least one load direction (in the plane) that keeps a labile static (plane) scheme in equilibrium. When the load has a fixed direction―such as during a seismic event―it is therefore possible to rotate the labile system, in search of an equilibrium configuration. This suggests that it is possible to avoid (expensive) bracing of the CAM® System simply by arranging its straps along the most suitable directions in the plane of the wall [29]. The aim of this work is precisely to verify the relationship between the in-plane arrangement of the straps and the ultimate load in the horizontal direction.
The experimental results demonstrate that the CAM® System with a rectangular arrangement is actually unable to increase the ultimate load under horizontal loads. However, a 45° rotation of the straps makes the rectangular arrangement effective even in the plane of the masonry walls. The paper also offers insight into the elastic moduli, the Poisson’s ratio and the pseudo-ductility factor. Finally, the experimental results provided the opportunity to review some of the most commonly adopted assumptions in the interpretation of the diagonal compression test.
2. Experimental Program
There are two experimental methods suitable for characterizing the mechanical properties of a wall subjected to shear loading: the shear-compression test and the diagonal compression test. The first method consists in applying shear forces along the upper side of the specimen, preventing the points of application of the shear load from undergoing vertical displacements. In the case of a test carried out in the laboratory, the apparatus for transmitting the shear load consists of a steel beam, made integral with the upper side of the specimen. Since the shear load causes the top face of the specimen to rotate about the center of the specimen, the vertical displacement constraint at the top nodes gives rise to positive and negative normal stresses along the specimen-steel beam interface. This causes detachments in the tensioned portion of the interface, as the interface bond is unable to withstand the tensile stresses. Since the detachments modify the transmission of forces from the steel beam to the specimen, this experimental method therefore does not allow replicating the desired static scheme. Figures 32–34 of Reference [37] show the difference between the desired static scheme and the static scheme corresponding to the shear-compression test performed in the laboratory. One solution to avoid differences between the desired and actual static schemes is to carry out the experimental test in-situ, cutting the masonry wall along two vertical (parallel) paths with a length equal to twice the high of the specimen, while the distance between the two cuts fixes the specimen basis [38]. The application of a horizontal force at half-high of the cuts therefore determines a symmetrical load condition (with horizontal axis of symmetry) that nullifies the vertical displacements of the points on the axis of symmetry (line of action of the load). Consequently, the line of action of the load divides the portion of masonry enclosed between the two cuts in two superimposed specimens, both subjected to in-plane shear loading.
The second method is easier to perform than the shear-compression test [39]. It consists of loading one diagonal of a square masonry wall in compression, until failure, which usually involves the formation of cracks along the loaded diagonal. Since the ease of execution does not correspond to an equally easy interpretation of the experimental results (Appendix), the choice made in this experimental program fell on the diagonal compression test also with the aim of highlighting some contradictions in the most commonly used interpretations of this test [40,41].
With a view to having to collect an initial series of indications, preparatory to subsequent investigations, the experimental program consists of only three diagonal compression tests on as many square-shaped masonry specimens. In particular, the specimens are three single-headed masonry walls (Figure 4a), made with 18 rows of solid UNI bricks. The masonry walls have a thickness, , of 120 mm, while the two sides in the plane, of equal length , are 1160 mm long (Figure 4b). Sixteen perforations drilled at regular intervals of 325 mm with a diameter, , of 40 mm (Figure 4b) ensure the passage through the wall thickness of the stainless steel straps of the active reinforcement.
The three specimens differ in the arrangement and number of stainless steel straps per loop (Figure 5):
- Specimen M1-90: one strap per loop along the directions of the mortar head and bed joints (Figure 5a);
2.1. Material Properties
2.1.1. Bricks
The UNI solid bricks measure 250 mm long, 55 mm high and 120 mm deep (L × H × D: 250 × 55 × 120 mm).
The reference standard for the mechanical characterization of bricks is UNI EN 772-1:2015 [42]. This required choosing three bricks from the delivered brick pallet and cutting them into six specimens measuring 50 × 50 × 50 mm (specimen labels: PA1, PA2, PB1, PB2, PC1 and PC2). The mechanical characterization then consisted of a uniaxial compression test (Figure 6a) until failure (Figure 6b). The testing machine was an Amsler compression-testing machine, with a maximum capacity of 588.399 kN (60 t).
The standard converts the compressive strength obtained for the specimens into a value that depends on the dimensions of the specimens (the normalized compressive strength for specimens obtained from bricks). Do this end, it introduces the shape factor, , as the corrective factor for the compressive strength. In the case of specimens of length 50 mm and height 50 mm, takes the value 0.85 [42]. This gave rise to the values of normalized compressive strength in Table 1, with an average value of .
2.1.2. Mortar
The mortar used in the experimental program is weber MP910 of Saint-Gobain Italia S.p.A., a pre-blended mortar of cement with compression resistance class M5 (in compliance with the European standard EN 998-2:2016 [43]). Error! Reference source not found. shows the main technical characteristics of the mortar.
The UNI EN 1015-11:2019 standard [45] for calculating both the flexural strength and the compressive strength consists of carrying out three-point bending flexural tests on molded prismatic specimens, measuring 160 × 40 × 40 mm (Figure 7a). The test procedure contemplates a displacement-controlled mode, with a speed of . Once bending failure of one specimen has occurred, the two halves of the specimen are useful for providing the compressive strength of the mortar, by means of a uniaxial compression test along one of the two directions orthogonal to the prism axis (Figure 7b).
The testing machine used for the mechanical characterization of the mortar (both bending and compression tests) is a Galdabini universal testing machine, with a maximum capacity of 200 kN. The six prisms and related twelve half-prisms provided the strength values in Table 2.
The average flexural strength is equal to and the average compressive strength is equal to This means that the actual compressive strength is 1.66 times the (minimum) compressive strength declared by the manufacturer (Error! Reference source not found.).
2.1.3. Stainless steel straps and seals
The active strengthening system consists of the ring closure of stainless steel straps 16 mm wide and 0.9 mm thick, using folding seals (also made of stainless steel) for pre-tensioned closure. The straps (Figure 8a) and seals (Figure 8b) used in this experimental program are not of the same type patented with the CAM® System. Table 3 collects the mechanical properties declared by the manufacturer (Mauser) for the rolls of stainless steel straps.
Since the seal is notoriously the weak point of CAM® System-like reinforcements [29,30], one of the objectives of the experimental program was to verify how the sealing affects the strength and stiffness of the strapping system. The specimens for determining the tensile strength of clamped and unclamped straps are four and measure 360 × 0.9 × 16 mm each:
- Specimen L2 consists of a piece of steel tape (unclamped strap);
- Specimen L3 consists of a piece of steel tape (unclamped strap);
- Specimen S2 consists of two pieces of steel tape, fastened together by one seal (clamped strap);
- Specimen S3 consists of two pieces of steel tape, fastened together by two seals (clamped strap).
The steel tapes of the specimens belong to two different stainless steel rolls of the same brand (Mauser) and the same characteristics (Table 3).
The reference standard for the mechanical characterization of the stainless steel straps is UNI EN ISO 6892-1:2020 [51]. As with the mortar tests, the testing machine was a Galdabini universal testing machine, with a maximum capacity of 200 kN. Figure 9 shows the results of the tensile tests performed on the four specimens.
The mechanical characterization of the steel tape alone (Specimens L2 and L3) therefore confirmed that is equal to approximately , while was 17% lower than the value declared by the manufacturer (Table 3).
Figure 9 also shows that a value just over markes the functional limit of the clamped straps (Specimens S2 and S3). In fact, the yield strength of Specimens L2 and L3 is approximatively equal to the maximum stress of Specimens S2 and S3. The maximum stress of Specimens S2 and S3 is lower than the maximum stress of Specimens L2 and L3 due to relative sliding movements inside the seals, which tend to open. The addition of a second seal (Specimen S3) does not increase the maximum stress compared to the case of a single seal (Specimen S2). It only increases the ultimate strain, since the second seal counteracts the sliding more effectively. In conclusion, the tensile strength of a clamped strap is approximatively equal to the yield strength of the steel tape that makes up the strap. The failure occurs when one of the two ends of the strap slips off from the seal. The failure is ductile (with both one and two seals), while the failure of the clamping system patented with the CAM® System is brittle [29].
As far as the stiffness is concerned, Figure 9 shows that the initial slopes of Specimens S2 and S3 are significantly lower than the initial slopes of Specimens L2 and L3. This means that the relative sliding movements within the seals occur throughout the entire tensile test, which decreases the stiffness of clamped straps compared to the stiffness of unclamped straps.
2.1.4. Elements for the protection of the edges of masonry walls
As anticipated in Section 0, the CAM® System uses stainless steel rounded angles and funnel plates (Figure S1), which have the task of diffusing the action transmitted by the straps to the masonry. This experimental program replaced the stainless steel protective elements of the CAM® System with the same protective elements as [29,35,36], that is, 3D printed elements made from a PLA (Polymerized Lactic Acid) filament. The PLA filament is one of the most eco-friendly filaments in FDM (Fused Deposition Modeling) 3D printing. In fact, PLA comes from annually renewable resources (cornstarch, tapioca roots, sugarcane, or other sugar-containing crops) and requires less energy to process compared to traditional (petroleum-based) plastics. The amount of carbon dioxide released during the printing process is the same as that removed by the plants used to make the filament, during their life cycle. Once discarded in an exposed natural environment, an object made from PLA filament will naturally decompose.
The 3D printed protective elements are also of two types: rounded angles (Figure 10a) for the protection of the edges of the walls and funnel plates (Figure 10b) for the protection of the new edges generated by the perforations for the passage of the straps. Both types have rounded external corners (in contact with the straps) and 90° internal corners (in contact with the masonry). This allows us to avoid bending the straps at right angles and, at the same time, guarantees the correct positioning of the elements on the wall surface.
The trellis design of the surfaces has the dual function of saving material and improving the adhesion between the protective elements and the masonry. In fact, by filling the cavities of the trellis of the rounded angles (Figure 11a) and of the funnel plates (Figure 11b), the hardened mortar hinders possible relative sliding movements between the protective elements and the masonry.
2.2. Preparation of the specimens
To avoid problems of overturning of the masonry specimens during the coring operations for the passage of the straps, core drilling took place on the individual brick units, before assembling them (Figure 12a). Figure 12b shows the hollow bricks left to dry after the coring operations.
The porous structure of the bricks can absorb part of the binder mixing water, thus compromising the mechanical properties of the mortar. This phenomenon is all the more evident the greater the porosity, the absorption capacity (of the brick) and the environmental temperature, and the lower the relative humidity of the air. To avoid compromising the mechanical properties, the Italian Association of Brick Industrialists (ANDIL) recommends wetting the bricks before use, with different methods depending on the absorption capacity and the time of year [52]. In the specific case of the bricks used in the experimental program (bricks produced industrially in soft paste) and the manufacturing period of the masonry specimens (summer), ANDIL suggests wetting the bricks by immersion in clean water. The pre-wetting of the bricks therefore took place according to ANDIL recommendations, leaving the bricks in clean water until the air bubbles stopped escaping (wetting until saturation) and, once removed from the water, leaving them to drip for at least a quarter of an hour. It is worth noting that the correct dripping of the bricks is an operation of fundamental importance. In fact, saturated bricks laid immediately after removal from the water could cause mortar drippings. Furthermore, the film of water that would remain between the mortar and the brick could cause a lack of adhesion between the two surfaces and reduce the resistance of the joint.
The laying of the bricks took place in accordance with the UNI EN 1015-2:2007 standard [53], which recommends mixing the mortar with 15% water. The use of a plumb guide frame, leveling strings and a spirit level helped to check the verticality of the walls and the horizontality of each course of bricks (Figure 13).
The minimum time required for a brickwork (Brick Masonry) to cure is 7 days. However, to avoid the onset of viscous flows in the subsequent pre-tensioning phase of the active reinforcement, the chosen curing time was 28 days.
To avoid excessive evaporation and facilitate the hydraulic setting of the mortar, the curing of the specimens took place in a saturated environment (at room temperature), after having wetted and wrapped the specimens with cellophane film (a wrapped specimen is visible in the background of Figure 13). The prolonged curing period required cyclically removing the cellophane to re-wet the surfaces of the specimens.
The assembly of the 3D printed protective elements (Section 0) took place once the curing period of the walls was finished. The mortar used for fixing the rounded corners and the funnel plates is the same used for laying the bricks (Section 0). Strengthening then occurred after a further 7-day curing period.
The strapping machine used to close the seals is a product for manual use, by Barbero Mauser brand (Figure 14). When tightening the seals, it allows the application of a pre-tension of up to a maximum of to the straps. This generates a pre-tension equal to approximatively 40% the tensile strength shown in Figure 9 (cross-section dimensions: 16 × 0.9 mm).
2.3. Instrumentation and Test Setup
The testing machines used to carry out the diagonal compression tests are:
- LOSENHAUSEN hydraulic load frame with a load capacity of 200 kN, for Specimen M1-90;
- LOSENHAUSEN UBP hydraulic load frame with a load capacity of 600 kN, for Specimens M1-45 and M2-45.
The test mode was in displacement control for all specimens, with an average load application speed of .
The sensors used to instrument the specimens are:
- Strain gauges produced by Tokyo Sokki Kenkyujo Co., Ltd. (Tokyo, Japan);
- Potentiometers produced by Gefran SpA (Brescia, Italy);
- Linear Variable Differential Transformers (LVDTs) produced by Gefran SpA (Brescia, Italy).
The strain gauges were useful for measuring the strains of some of the straps positioned along the direction of the tensioned diagonal (red elements in Figure 15a, denoted by the initial letter E). The function of the potentiometers was instead to measure the displacement along the two diagonals of the three specimens (blu elements in Figure 15a,b, denoted by the initial letter P). Finally, three LVDTs measured the movements of the testing machine head of both Specimen M1-45 (Figure 15a,b) and Specimen M2-45, to check for any unwanted rotations. This required rigidly attaching the LVDTs to an external fixed system, using metal rods (thick green elements in Figure 15a,b). Specimen M1-90 did not require instrumentation with the LVDTs, as the expected short duration of the load test would hardly have resulted in rotations of the load head.
The strain gauges did not detect significant variations in the strains of the straps of any of the three specimens, at least until the opening of cracks crossing the straps themselves. Therefore, the strain gauge acquisitions are not significant for the purposes of this work.
More useful were the LVDT acquisitions. In particular, LVDT2 and LVDT3 allowed the identification of , the rotation of the front face, assumed equal to the rotation of the middle plane:
where:
- is the displacement acquired by LVDT2 (positive values are downward displacements);
- is the displacement acquired by LVDT3 (positive values are downward displacements);
- is the distance between LVDT2 and LVDT3.
A similar expression gave , the rotation of the vertical cross-section passing though LVDT1 and LVDT2 and assumed equal to the rotation of the vertical cross-section passing through the load heads:
where has the same meaning as in Equation (1) and:
- is the displacement acquired by LVDT1 (positive values are downward displacements);
- is the distance between LVDT1 and LVDT2.
Since the values of and obtained for Specimen M1-45 (Figure 16) and Specimen M2-45 (Figure 17) are very small for the entire duration of the load test, the active reinforcement was able to keep the two specimens in axis despite the progression of the damage phenomena. The values of the rotations are actually so small that it is possible to consider the angles (measured in radians) equal to their tangents (small-angle approximation):
3. Failure mode of the specimens
3.1. Specimen M1-90
This specimen suffered failure along one of the bed joints (the bed joint near the second row of straps from the top, in Figure 18). The failure occurred suddenly at a load value of , without giving any warning signal.
The strengthening system was unable to stop the relative sliding along the broken bed joint. The crisis mode of the strengthening system was in fact that typical of a labile frame (Figure 2a), despite the pre-tension imparted to the straps (Section 0). The perforations made for the passage of the straps through the thickness of the wall therefore behaved like cylindrical hinges (Figure 2b). The relative sliding then ended thanks to the containment action of the protective steel structure built around the specimen (Figure 18). The boundary effects also caused the failure of two funnel plates in the upper left corner (Figure 19a) and lower right corner (Figure 19b) of the mechanism.
The fact that a mechanism has formed confirms the basic assumption of this experimental work, that is, the ineffectiveness of straps arranged along the mortar joints. In reality, since the broken bed joint is very close to a row of perforations, the suspicion arises that this arrangement of the straps is even harmful.
3.1. Specimen M1-45
The failure mode of Specimen M1-45 (Figure 20a) is completely different from that of Specimen M1-90 (Figure 18). Some cracks began to form along the compressed diagonal at a load value of (the maximum load). The cracks appeared in the central area of the specimen and propagated towards the two heads of load application, partly following the mortar joints and partly crossing the bricks (Figure 20b). The failure also involved the funnel plates placed along the compressed diagonal (Figure 20b).
The failure was of a ductile type, with a progressive crack propagation hindered by the action of the straps arranged along the tensioned diagonal. This gave rise to a softening branch after the maximum load (Figure 16), which is not present in the test carried out on Specimen M1-90. At the end of the test, the crack extended along the entire compressed diagonal of the wall, but the strengthening system was almost intact and still able to resist the loads. This allowed the specimen to maintain its shape even after removal from the testing machine (Figure 20a). Since the straps are able to keep the two parts of the wall together after the event that caused it to break, we can say that this arrangement of straps is effective.
The failure mode along the compressed diagonal is that typical of a homogeneous solid subjected to a diagonal compression test. We can therefore say that the effect of a weak pretension with effective arrangement of the straps is to homogenize the wall, which makes the defects and weaknesses of the mortar joints irrelevant.
3.1. Specimen M2-45
As with Specimen M1-45, the crisis was of a ductile type, with a final softening branch (Figure 17). However, the doubling of the reinforcement along the direction of the tensioned diagonal hindered the opening of the cracks along the compressed diagonal to such an extent that the failure mode presented characteristics different from those of Specimen M1-45:
- No primary cracks opened along the compressed diagonal;
- The maximum load () is increased by 30% compared to the maximum load of Specimen M1-45 ();
- The high load values and the lack of cracks along the compressed diagonal meant that the failure occurred due to a combination of the punching effect of the load heads and boundary effects (Figure 21).
In the final stages of the test, a bed joint also partially failed (Figure 21). Since this only occurred at the end of the test, it is a secondary effect caused by the primary mechanism described above. Despite the high degree of damage at the end of the test, the strapping system turned out to be only partially damaged and still able to withstand loads.
This test also resulted in the breaking of some funnel plates (Figure 21). As already noted in [36], this suggests that the maximum load could increase further by replacing the 3D printed plates with metal rings [35].
4. Analysis of the results
In the initial phase of a load test, some coupling phenomena occur between the testing machine and the specimen, which affects the acquisition of the experimental data [54]. This leads to a high degree of uncertainty on the experimental results for low load values and deprives the initial part of the stress/strain curves of any constitutive meaning. Since the initial slope of the stress/strain curve provides the material stiffness in the linear elastic range, it is therefore of paramount importance to define an adequate identification procedure for the reconstruction of the initial linear elastic behavior. The reconstruction procedure adopted here is the one described in Reference [55].
The stress redistribution occurring in the specimen in non-linear range does not affect the value of the maximum principal stress, (the tensile stress in Appendix), computed with the linear elastic solution [56]. For this reason and for the discussion on the interpretation of the diagonal compression test made in Appendix, Equation (A26) will provide the values of the diagonal tensile strength later in this document, as done also in References [38,39,57–59]:
where:
- is the absolute value of the diagonal compression load, , at collapse.;
- is the net transversal area of the specimen.
The size of the wall specimens also motivates this choice, because it is slightly smaller than the minimum specimen size () established by Reference [40] as reasonably representative of a full-size masonry assemblage. Since Equation (5) provides the diagonal tensile strength value recommended by [41] specifically for small walls specimens, it therefore seems more suitable for the interpretation of the experimental results of this work.
Having drilled the masonry wall for the passage of the straps, in Equation (5) is the transversal area of the specimen net of the four perforations of diameter , made along the diagonals:
where ―the coefficient between 0 and 1, relating to the rate of voids in the specimen, with in the absence of voids (Appendix)―takes the value 0.97, as in Reference [60] (for the meaning of , and see Section 0).
It is worth noting that the tensioned straps compress the mid-plane of the masonry wall along the edges of the specimen but not at its center of gravity [11], where the additional compressive stresses are perpendicular to the mid-plane (Error! Reference source not found.). Therefore, the tensile stress in the straps does not change Equation (5), as it refer to the center of gravity of the specimen. This constitutes a substantial difference between the interpretation of the diagonal compression test on masonry wall specimens strengthened with the CAM® System and the interpretation of the diagonal compression test on masonry wall specimens strengthened with other surface strengthening systems, such as FRCM (Fiber Reinforced Cementitious Matrix) materials. In the latter case, in fact, the shear strength is the sum of two contributions [61]: the shear strength of the un-strengthened masonry wall―related to the diagonal tensile strength of masonry, [62,63]―and the in-plane contribution of the FRCM reinforcement in terms of shear force [39,64].
4.1. Shear Stress/Shear Strain Curves
According to the discussion on the interpretation of the diagonal compression test (Appendix), in the remainder of this paper the shear stress will assume the approximated value provided by the RILEM guidelines [41] (Equation (A22)):
with given by Equation (6).
The value used in this work for the shear strain is instead equal to the formulation proposed in [40] and implemented by all the other standards:
where:
- is the shortening in the direction parallel to loading (vertical direction);
- is the extension in the direction perpendicular to loading (horizontal direction);
- is the gage length in the direction parallel to loading (the gage length for the identification of must be equal to the gage length for the identification of [40]).
Using the RILEM proposal for the shear stress (Equation (7)) instead of the ASTM proposal (Equation (A9)) gives an increase of about 50% in the estimated value of and the shear modulus, (or modulus of rigidity, i.e., the modulus of elasticity in shear):
Figure 22 shows the difference between the two formulations in terms of shear stress/shear strain curves, for specimen M1-90.
The comparison between the shear stress/shear strain curves for the three specimens (Figure 23) shows that neither the number of straps nor their arrangement have a significant effect on the tangent at the origin, i.e. the modulus of rigidity . In fact, the differences between the tangents at the origin of Figure 23, better highlighted by the detail in Figure 24, largely fall within the dispersion range of the experimental data. The number and the arrangement of the straps, on the other hand, have a great impact on maximum shear stress (Sections 0 and 0), elastic moduli in uniaxial loading (Section 0), apparent Poisson’s ratio (Section 0) and pseudo-ductility (Section 0).
It is worth noting that it is possible to compare the tangents at the origin in Figure 23 thanks to the reconstruction procedure adopted for low load values (Section 0). The reconstruction procedure, in fact, consists in replacing the initial experimental data in the shear stress-shear strain curve with an approximating straight-line segment [55]. This allows the identification of as the initial slope (tangent modulus) rather than the slope of the line connecting the origin to a point on the ascending branch, with a prefixed shear stress (secant modulus). The mean value of the modulus of rigidity in Figure 23 is:
This value, being independent of the number of straps applied, is reasonably equal to the URM modulus of rigidity.
4.1.1. Contribution of the arrangement of the straps on the maximum shear stress
As far as the effect of the strap arrangement is concerned, the curves plotted in Figure 23 (together with the detail in Figure 24) lead to two main observations, with their respective consequences:
- As assumed in Section 0, the rectangular arrangement with straps parallel to the mortar joints (in both directions) is labile. In fact, after a short horizontal plateau at the maximum shear stress (Figure 24), specimen M1-90 undergoes a brittle failure. This means that the straps crossing the failure planes are unable to counteract the relative displacements activated by the failure process along the slip planes. Due to the forces acting orthogonally to their direction, these straps rotate around the hinged nodes of the CAM-like system, which activates the free nodal displacements of the unbraced scheme shown in Figure 2a. Consequently, the rectangular strengthening system with straps arranged along the mortar joints is ineffective in terms of increasing the maximum load. However, it is not entirely useless: by keeping the various parts that make up the masonry wall together even after the activation of the slip planes, it prevents the debris from falling. In fact, the steel straps do not break at the maximum load. This allows them to act as a debris containment garrison, similar to what rock-fall nets do on rocky slopes. Furthermore, the box-type behavior created by the continuous strengthening system in a building (Figure S3) prevents individual structural elements from out-of-plane overturning and the entire structure from collapsing. Therefore, each structural element undergoes limited horizontal displacements after failure, which allows us to define a pseudo-ductility even for the building that has exceeded the shear strength. This makes the strap arrangement of specimen M1-90 a very useful tool for the (preventive) safety of the structures and, ultimately, for safeguarding the safety of the inhabitants. As a final remark, since specimen M1-90 deviates only slightly from linearity up to the maximum shear stress, it seems reasonable that the straps have no effect on the pre-peak behavior of specimen M1-90. Thus, the maximum shear stress of specimen M1-90 is, to a good approximation, the URM maximum shear stress.
- A rotation of the straps allows the rectangular arrangement to find equilibrium, while remaining a labile configuration. The curves of specimens M1-45 and M2-45 in Figure 23 testify to the effectiveness of the arrangement, since they continue well beyond the first peak, caused by the initiation of the crisis in the masonry. This greatly increases the pseudo-ductility of the strengthened masonry wall (Section 0). The activation of the strengthening system allowed by the rotation of the straps therefore transforms the failure of the specimen from brittle to markedly ductile. The continuation of the curves beyond the peak of first crack (first peak) is possible as the arrangement of the straps is labile but balanced, therefore effective, given the particular load condition. Figure 25 provides an explanation in the Mohr plane of the effectiveness of the arrangement for an actual case of masonry subjected to horizontal (seismic) loading, using the Pole Method (Appendix).
These observations allow for a better understanding of the behavior of an entire masonry wall strengthened with the CAM® System. In particular, Figure 25a shows the actual loading condition―under horizontal seismic loading―that the diagonal compression test aims to simulate. The stress state at the center of gravity, , of Figure 25a is a pure shear stress state (as assumed by the ASTM guidelines), much more similar to that produced at by the shear test than by the diagonal compression test. Therefore, the center of the Mohr circle for the actual load is at the origin of the Mohr plane (Figure 25b). As explained in Appendix, however, the location of the center has no effect on the principal directions found with the RILEM and ASTM guidelines. Furthermore, the axes of Figure 25a make 45° angles with the axes of Figure A4a ( and are parallel to the horizontal and vertical mortar joints, respectively, in both figures). This does not change the positions of the and stress points of Figure A4b, but moves the Mohr pole, , at the point of coordinates (Figure 25b).
Of the two directions of the straps in Figure 25a, one coincides with the first principal direction (the direction of the maximum principal stress, , in Figure 25b), while the other coincides with the second principal direction (the direction of the minimum principal stress, , in Figure 25b). The straps arranged along the first principal direction undergo a tensile stress, while those running along the second principal direction are compressed straps. Since there are no forces applied orthogonally to the straps, the external load does not modify the angles formed by the tensioned straps with the compressed straps although the static scheme of the strengthening system is still labile. This makes it no longer necessary to brace the strengthening system to eliminate the free nodal displacements.
The straps subjected to tension resist the load due to the tensile strength of the steel (straps with positive slope in Figure 25a). This delays the specimen failure as it counteracts the opening of the failure planes. In other words, the tensioned straps have the same function as the bracing strip in Figure 3a. The straps subjected to compression (straps with negative slope in Figure 25a) are instead ineffective as they undergo instability under axial compressive load. This is not a problem since the forces applied along the direction of the compressed straps are not directly responsible for the specimen failure. These straps are not needed (under the load in Figure 25a) just as the strip along the second diagonal in Figure 3a is not needed.
When the horizontal external force reverses due to the oscillatory nature of the seismic action, the two principal directions switch (Figure 26): the direction with positive slope becomes the principal direction of compression (second principal direction) and the direction with negative slope becomes the principal direction of traction (first principal direction). Due to the orthogonality between both the principal directions and the two directions of the straps, the sign of the stress in the straps also reverses. This means that, of the two directions of the straps, one coincides with the direction of the maximum principal stress whatever the direction of the external force. The straps that were in tension under the load in Figure 25a become ineffective, while those that were compressed in Figure 25a now behave as tie rods. This gives rise to a further scheme with a single bracing strip (Figure 3a), but with the bracing strip arranged along the second diagonal.
In conclusion, the arrangement of the straps is effective whatever the direction of the external horizontal force. Furthermore, the coincidence between one of the two directions of the straps and the direction of the maximum principal stress whatever the direction of the external force ensures that the strengthening system has the same effectiveness for both directions of the (horizontal) seismic action. This is a strong point of the rectangular arrangement with straps at compared to the triangular arrangement of the straps [19], as the latter (always balanced) is not always able to ensure the same degree of effectiveness when the external load reverses. Therefore, the rectangular arrangement with the straps oriented at maximizes the effectiveness of the CAM® System compared to other strap arrangements.
4.1.3. Contribution of the number of straps on the maximum shear stress
If the effectiveness of the rectangular strengthening system depends on the arrangement of the straps, the degree of effectiveness depends on the number of straps used. In the arrangement with only one strap per loop (specimen M1-45 in Figure 23), the number of straps is not enough to increase the maximum shear stress, which is almost the same as in specimen M1-90 (the URM maximum shear stress). Nevertheless, as highlighted in Section 0, the use of just one strap per loop in the arrangement is more than sufficient to increase the pseudo-ductility of the masonry wall, considered as a structural element isolated from the rest of the structure (i.e., net of the box-type behavior created by the CAM® System). The ultimate shear strain of specimen M1-45 is, in fact, about 81 times the ultimate shear strain of specimen M1-90 (Error! Reference source not found.). Furthermore, the action of the tensioned straps after the first peak ensures that the specimen has a residual shear load bearing capacity, with a residual shear stress value of about (Figure 23, Error! Reference source not found.). This value is equal to about 63% of the maximum shear stress and 60% of the URM maximum shear stress (Error! Reference source not found.). The residual shear stress value remains nearly constant until the end of the test, which provides the specimen with a long pseudo-plastic branch after the activation of the slip planes in the masonry.
In the case of application of the reinforcement system to an entire masonry building, the benefit in terms of resistance to a seismic action provided by the use of a single strap per loop depends on the structural ductility. That is, it depends on the ability of the single masonry element to bear the high values of shear deformation that characterize the pseudo-plastic phase, when the seismic action persists beyond the peak of first crack of the masonry. On the other hand, the individual masonry elements benefit from the continuity of the reinforcement system, implemented in the building by the CAM® System. Since the continuity of the strengthening system contributes to decreasing the values of the horizontal displacements, we can conclude that even a single strap per loop is useful to increase the seismic resistance beyond the shear strength capacity of the masonry.
In the specimen with two straps per loop along the tensioned direction (specimen M2-45 in Figure 23), the maximum load increases by approximately 26% with respect to specimen M1-90. Also the ultimate shear strain increases in specimen M2-45: it is approximately 138 times the ultimate shear strain of specimen M1-90 (Error! Reference source not found.). After the shear stress drop following the first peak, the tensioned straps allow specimen M2-45 to recover shear stress until it reaches and exceeds the shear stress of first peak. A series of successive peaks follows the first peak, with increasing peak shear stress values, which corresponds to the activation of new slip planes in the masonry. This indicates that the damage to the masonry is a progressive phenomenon and does not occur in a single moment, as instead happens in specimens M1-90. After the phase with increasing values of peak shear stress, specimen M2-45 also shows a pseudo-plastic phase, which is even longer than the pseudo-plastic phase of specimen M1-45. This second time, however, the plastic threshold does not denote a residual shear load bearing capacity, as the maximum shear stress reached in the plastic threshold is also the maximum shear stress attained by the specimen. The absence of a drop in shear stress between the point of maximum shear stress and the pseudo-plastic threshold assures us regarding structural ductility, since large shear strains are not necessary for the structure to benefit from the contribution of the straps. The pseudo-plastic phase is then weakly decreasing, with some shear stress drops, due to the progressive but slow damage to the strengthening system. At the end of the load test, the specimen is still capable of withstanding a shear stress equal to 52% of the maximum shear stress and 65% of the URM maximum shear stress.
It is worth noting that the best-known traditional strengthening techniques share the common feature of increasing only the ductility (path (a) in Figure 27) or the strength (path (b) in Figure 27) of the strengthened structure. A strengthening technique using Fiber Reinforced Polymers (FRPs), for example, increases strength but not ductility, bringing the structure to point (b) along the vertical path in Figure 27. On the other hand, the CAM® System with traditional rectangular arrangement (specimen M1-90) increases ductility but not strength, bringing the structure to point (a) along the horizontal path in Figure 27. The orientation of the straps in the rectangular arrangement does not change this behavior as long as the number of straps per loop is low (specimen M1-45). However, it is possible to improve both ductility and strength by increasing the number of straps per loop in the arrangement (specimen M2-45). This makes the CAM® System a strengthening system capable of increasing both ductility and strength, which brings the structure to point (c) in Figure 27.
Figure 23 (together with the detail in Figure 24) allows drawing one observation that concerns the shear stress of first crack (shear stress of first peak). For specimens M1-90 and M1-45, the shear stress of first crack is equal to the maximum shear stress. The difference between the shear stresses of first crack of specimens M1-90 and M1-45 is small (Figure 24, Error! Reference source not found.) and could be within the dispersion range of the experimental data. However, specimen M1-45 loses linearity at approximately , which corresponds to 73% of the maximum shear stress, while specimen M1-90 is linear up to approximately , which corresponds to 76% of the maximum shear stress (Figure 24, Error! Reference source not found.). This indicates that damage occurs slightly earlier in the specimen with effective strengthening (specimen M1-45) than in the specimen with ineffective strengthening (specimen M1-90). Therefore, it appears that the use of effective strengthening anticipates the onset of damage in the masonry. Specimen M2-45 confirms this conclusion, as the increase in the number of straps considerably decreases the shear stress of first crack, the shear stress at the end of the linear range and the ratio between the latter and the shear stress of first crack. The shear stress at the end of the linear range is, in fact, about 55% of the shear stress of first peak.
A further effect of the number of straps on the damage suffered by the masonry concerns the reduction of the slopes at the exit of the linear range, markedly greater in specimen M2-45 than in specimen M1-45. Since a decrease in the slope of the shear stress/shear strain curve means that the shear stiffness decreases due to damage, the damage that occurs in specimen M2-45 at the exit of the linear range is therefore greater than the damage that occurs in specimen M1-45. Well, the cause-effect link between the increase in the number of straps of the CAM® System and the early appearance of both the damage and the first crack confirms the findings of Reference [11], where this phenomenon finds a theoretical explanation in the Mohr plane.
4.2. Stress/Strain Curves
In most of the scientific literature, it is customary to derive the Young modulus (i.e., the modulus of elasticity in tension and compression) of masonry from the relationship valid for materials in the linear-elastic, homogeneous and isotropic state [65]:
where:
- is the Young modulus;
- is the Poisson ratio, conventionally assumed equal to [34,66–68];
- is the shear modulus, defined by Equation (10).
This paper takes a different approach, based on the interpretation of the diagonal compression test in the Mohr plane. The Pole Method (Appendix), in fact, associates the principal stresses to the directions of the two diagonals (Figure A4), which are also the directions of acquisition of the displacements. This allows for the identification of the stress/strain relationships in both uniaxial tension and uniaxial compression (Figure 28, Figure 29 and Figure 30), with the uniaxial tensile and compressive stresses given by the principal stresses, and , in the RILEM interpretation of the diagonal compression test (Equation (A24)). The strains in uniaxial tension and uniaxial compression– and , respectively–are instead the ratios of the relative displacements between the ends of the horizontal and vertical potentiometers (Section 0) to the initial lengths of the potentiometers:
where the symbols , and take on the same meaning they have in Equation (8).
As usual with brittle materials, in Figure 28, Figure 29 and Figure 30 the stress-strain curves in uniaxial compression occupy the first quadrants and the stress-strain curves in uniaxial tension occupy the third quadrants. Therefore, the stresses along the vertical axes are the sign-changed principal stresses:
and the strains along the horizontal axes are and changed in sign:
Due to the identification procedure adopted for the stress-strain curves under uniaxial loading, all considerations on the effect of the arrangement and the number of straps made for the shear stress/shear strain curves (Section 0) extend to the curves in Figure 28, Figure 29 and Figure 30. In particular, the diagonal tensile strength given by Equation (5) returns almost the same value of for Specimen M1-90 and Specimen M1-45, while the value of in Specimen M2-45 is 1.30 times the value of in Specimen M1-45.
In addition to this, the comparison between the first and third quadrants in Figure 28, Figure 29 and Figure 30 provides new information:
- The ratio of the estimated diagonal tensile strength, :to the estimated diagonal compressive strength, :is a direct consequence of the ratio of the two principal stresses, and in Equation (A24). This value, however, does not comply with the experimental results on tensile and compressive strengths of masonries. In fact, although it is difficult to identify a reliable value of tensile strength with the standard statistical methods, the ratio is usually less than [69].
- Since specimen M1-90 behaves like an URM specimen, the different values assumed by the initial slopes in the two opposite quadrants of Figure 28 would indicate that the tensile stiffness of the URMs is different from the compressive stiffness. This would mean that there is no single Young’s modulus in tension and compression in the URMs, which is physically unacceptable. In particular, Figure 28 shows an estimated Young modulus in compression, , that is significantly lower than the estimated Young modulus in tension, (Error! Reference source not found.).
- The details in Figure 29b and Figure 30b show that and take on different values in both Specimen M1-45 and Specimen M2-45 (Error! Reference source not found.), which is not evident from Figure 29a and Figure 30a. However, although it is reasonable to think that the straps modify the stiffness along the first principal stress direction, the inconsistencies that emerged regarding the discussion on the values of and for Specimen M1-90 do not allow us to reach definitive conclusions on the elastic moduli for the RMs.
It is worth noting that the ASTM interpretation of the diagonal compression test provides the even more unacceptable result and an even greater difference between the two estimated elastic moduli (with ). Therefore, the RILEM approach is undoubtedly an improvement of the ASTM approach. However, the inconsistencies on the ratio and on the estimated Young modulus of Specimen M1-90 seem to indicate that the RILEM interpretation of the diagonal compression test does not provide reliable values for and , which leads to non-reliable values of and . In particular, the RILEM approach seems to underestimate the hydrostatic stress state at the center of the specimen, which is responsible for the translation of the Mohr circle along the horizontal axis. In fact, a further translation along the direction of the negative semi-axis of the would decrease both the ratio and the ratio , leading to results more consistent with the experimental evidence. Since it requires too much space for a complete development, the treatment of this specific aspect will be the subject of a subsequent article [70].
In conclusion, the estimated elastic moduli in Error! Reference source not found. do not provide useful quantitative indication on the effect that the reinforcement has on the elastic properties of masonry walls. Their ratio, however, could have a meaning. Obviously, it is not a meaning related to the numerical value itself, but a meaning related to the trend of the ratio as the number of active straps varies. In fact, remaining established that it is logical to expect a value in specimen M1-90 (that is, in the URMs), the increase of as the straps become active and as the number of straps increases could indicate an anisotropy of the mechanical properties induced by the reinforcement. This actually makes sense, as the straps increase the stiffness along the tensile direction while being ineffective along the compressive direction. Ultimately, it is an effect of the unidirectionality of the active straps, which unites the CAM® System with other uniaxially aligned reinforcement systems. Even the latter, in fact, lead to anisotropy of strength and Young’s modulus [71].
4.3. Poisson’s ratio and apparent Poisson’s ratio
The Poisson effect is the tendency of a material to expand along directions perpendicular to the uniaxial direction of compression and to contract along directions perpendicular to the uniaxial direction of tension. In order to provide a measure of the Poisson effect, it is customary to calculate the negative of the ratio of the strain in directions perpendicular to the direction of uniaxial loading, , to the axial strain, :
where v takes the name of Poisson’s ratio. In the specific case of the tests covered by this paper, is the tensile strain (Equation (14)) and is the compressive strain (Equation (15)).
As already discussed in Reference [72], however, the second member in Equation (22) actually provides a measure of the Poisson effect only as long as it makes sense to treat the acquired data in the context of continuum mechanics. If a crack that propagates in Mode I (Figure 31) crosses one of the two potentiometers, in fact, the relative displacement between the ends of those potentiometers is the sum of two effects: the deformation of the body (rheological effect) and the opening of the crack (non-rheological effect). In these assumptions, the ratios in Equations (14) and (15) no longer provide a pure rheological information, that is, the strain at a given point. They continue to have meaning only in the sense of engineering strains. Consequently, also the ratio in Equation (22) loses all rheological meaning starting from the moment in which the cracks start to propagate in the specimen. For this reason, we will continue to refer to the second member of Equation (22) as the negative of the ratio of the engineering strains along the two diagonals, avoiding calling it Poisson’s ratio. For the sake of brevity, we will denote the second member of Equation (22) as the apparent Poisson’s ratio.
Incidentally, it is worth mentioning that the discussion on the displacements caused by the opening of cracks during a mechanical resistance test assumes a more general meaning, as it allows us to investigate the actual nature of strain-softening in brittle materials [54] and to formulate new constitutive laws in tension [74] and compression [75,76].
The ranges of compressive strains in the figures of the apparent Poisson’s ratio (Figure 32, Figure 33 and Figure 34) are the same as the ranges of in Figure 28 and the details in Figure 29b, Figure 30b, respectively.
Although devoid of actual rheological significance, the curves in Figure 32, Figure 33 and Figure 34 nonetheless provide some useful information. Of particular interest is the comparison between the values of the apparent Poisson’s ratio in the range . Specimen M1-90 is the only one of the three specimens for which the apparent Poisson’s ratio has a decreasing behavior in this range, after an initial constant branch. This may depend on the collapse of the walls of the internal micro-cavities, which occurs for a given critical load value, causing a partial implosion of the specimen.
It is possible that the pre-tensioning operations in specimens M1-45 and M2-45 caused a crushing of the walls of the micro-cavities right along the direction of application of the load, while this did not occur in specimen M1-90. In the latter specimen, in fact, the initial crushing would at most have occurred along directions inclined by with respect to that of application of the load. This could explain the absence of a decreasing behavior in the range for the specimens M1-45 and M2-45, since the crushing of the walls of the micro-cavities in the direction of load application would have occurred before the start of the load test. In support of this hypothesis, the value of the apparent Poisson’s ratio at the end of the range in specimen M1-90 is very similar to the initial value of the apparent Poisson’s ratio in specimen M1-45 (), which differs from specimen M1-90 in the orientation of the straps but not in the number of the straps. This could also explain why the value of in Error! Reference source not found. is lower for specimen M1-45 than for specimen M1-90. The crushing along the direction of load caused by the tensioning of the straps in specimen M1-45, in fact, determines a decrease in the value of tangent at the origin of the curve. In specimen M2-45, the combined action of the greater number of straps along the tensioned diagonal and of the Poisson effect partially compensates for this decrease.
As previously stated, only the initial values of the apparent Poisson’s ratios in Figure 32, Figure 33 and Figure 34 coincide with the actual Poisson’s ratios, v, of the three specimens. The values of v identified as the apparent Poisson’s ratios at the beginning of the tests (Table 4) allow us to draw the following conclusions:
- Since the strengthening system of specimen M1-90 is labile (Section 0), the value v in Table 4 represents the URM Poisson’s ratio. This value is about 52% of the assumption v , usually made to identify the Young’s modulus from the shear modulus with Equation (13). This poses a well-founded reason for uncertainty on the values of Young’s modulus obtained in the literature from the use of Equation (13) with v , which leads to an overestimation of the Young modulus equal to about 11%.
- The Poisson ratios of the specimens with effective strengthening (specimens M1-45 and M2-45) are lower than the Poisson ratio of the specimen with ineffective strengthening (specimen M1-90) and the difference is greater the greater the number of straps. The reason for this is twofold: the possible crushing of the walls of the micro-cavities during the pre-tensioning operations and the confining action of the straps arranged along the direction of the maximum principal stress (horizontal straps), which decreases the value of . The decrease in Poisson’s ratio in RMs compared to URMs makes the use of Equation (13) ―together with the hypothesis v ―even more unacceptable in RMs than in URMs. In fact, the overestimations of the Young modulus for specimen M1-45 and specimen M2-45 would be about 14% and 16%, respectively.
4.4. Pseudo-ductility
Structural ductility is the ability of a building to undergo lateral displacements without collapsing. The pseudo-ductility factor, , is a measure of the ductility of an individual structural element in a building:
where is the ultimate shear strain and is the yield shear strain of the structural element. The pseudo-ductility factor is useful in the design based on the demand capacity phase diagram, to generate a pushover curve for the building.
In masonry wall specimens, finding the ultimate shear strain and the yield shear strain is not easy due to the brittle behavior of masonry and the occurrence of micro-damage phenomena at relatively low load values. There are therefore various proposals in the literature for the identification of and . Some of the more commonly used ones for are:
- The shear strain at the ultimate point of the shear stress-shear strain curve [67];
- The shear strain at the peak point of the shear stress-shear strain curve [77];
- The shear strain at the point on the descending branch of the shear stress-shear strain curve where the shear stress is 80% of the maximum shear stress, [57,66,68,78];
- The shear strain at the point on the descending branch of the shear stress-shear strain curve where the shear stress is 50% of the maximum shear stress, [79].
Given the ability of the CAM® System to avoid the collapse of the structural element even for a high degree of damage (Section 0), it seems reasonable to assume that the value of for the tests performed in this work is the shear strain at the ultimate point of the shear stress-shear strain curve.
The determination of is even more uncertain than that of , due to the lack of a clearly identifiable yield point in the shear stress-shear strain curves. All proposals, however, share the common idea that is the value of shear strain measured at a point of the (actual or linearized) first ascending branch of the shear stress-shear strain curve. In particular, is the shear strain at the point:
- Where the shear stress-shear strain curve exits its linear state [77,80];
- Where the tangent at the origin intersects the horizontal tangent at the peak point of the curve [77];
- Where the second branch of the bilinear approximating relationship ends [81–83];
- Where the area under the experimental curve is equal to the area under the bilinear elasto-plastic approximating relationship [66];
- Where [84]:
- the shear stress is 85% of the maximum shear stress, , if:with: the area below the shear stress-shear strain curve from the first point of the curve to the point corresponding to 80% of the maximum shear stress on the descending branch; the slope of the line connecting the first point of the shear stress-shear strain curve to the point corresponding to 40% of the maximum stress;
- the shear strain takes on the value:
- Where the shear stress is 80% of the maximum shear stress, [78];
- Where the shear stress is 75% of the maximum shear stress, [9,57,80];
- Where the shear stress is 70% of the maximum shear stress, [80].
Despite the numerous existing formulations, it is common opinion that it is necessary to introduce a new definition for the yield shear strain in both the URMs and the RMs [66], since the previous ones often lead to inconsistent results in terms of pseudo-ductility [68]. The proposal made here is to use the apparent Poisson’s ratio as a critical parameter for the identification of in masonry solids. Indeed, since masonry is a brittle material, its yield point is, more properly, the point at which the phenomena of progressive cracking significantly alter its behavior at the mesoscale. Well, being composed of a (constant) rheological quota and a non-rheological quota associated with the opening of cracks in Mode I, the variation of the apparent Poisson ratio is a valid indicator of the propagation of damage phenomena inside the specimen.
The curves in Figure 32, Figure 33 and Figure 34 share the common feature of showing an initial branch where the apparent Poisson’s ratio increases slowly and a second branch, separated from the previous one by a knee point, where the apparent Poisson’s ratio increases much more rapidly. Assuming that the instantaneous increase in the first derivative of the three curves indicates a significant modification of the resistant scheme at the mesoscale, the value of apparent Poisson’s ratio at the knee point () is the critical parameter useful for the new definition of in masonries. Therefore, in the remainder of this paper, is the shear strain at the point where the apparent Poisson’s ratio equals . The corresponding value of shear stress is .
As shown in Table 5, the two specimens with one strap per loop (specimens M1-90 and M1-45) reach the yield shear strain for almost the same value of , even though the Poisson ratio of specimen M1-45 differs from that of specimen M1-90 by 25% (Table 4). Ultimately, this is a consequence of an observation made in Section 0, that is, two specimens with the same number of straps per loop tend to assume the same value of apparent Poisson’s ratio in the early stages of the load test, regardless of the arrangement of the straps. It therefore seems that the value of depends on the number of straps, while it does not depend of the arrangement of the straps. The latter instead has a strong impact on the pseudo-ductility (Table 5), since the arrangement of the straps in specimen M1-90 is ineffective while it is effective in specimen M1-45.
The values of in Table 5 confirm that the strengthening anticipates the onset of damage (Section 0). In fact, both the values of and the ratios are lower in the specimens with effective strengthening (specimens M1-45 and M2-45) compared to the specimen with ineffective strengthening (specimen M1-90), which is a direct consequence of the early occurrence of damage in specimens with effective strengthening. In particular, and the ratio depend on both the arrangement and the percentage of reinforcement, assuming smaller values the more effective the strengthening and the greater the number of straps. Furthermore, taking specimen M1-90 as the reference specimen (the URM specimen), the values of for specimens M1-45 and M2-45 are, respectively, 93% and 42% of the of specimen M1-90 (). Therefore, also the ratio depends on both the arrangement and the percentage of reinforcement, assuming smaller values the more effective the strengthening and the greater the number of straps.
As a final remark, the non-constant value of the ratio could explain why calculating as the shear strain at a fixed percentage of the maximum shear stress can capture the behavior of only some specific reinforcement configurations in URMs and RMs, failing to obtain a generalizable formulation.
4.5. Comparisons
Figure 35 shows the experimental results in the form of radar diagrams, in which the values of each variable, , are adimensionalized and rescaled so that they end up ranging from 0 to 1 (normalization of , also known as Min-Max scaling technique):
where is the maximum value in the dataset attained by the variable and is the minimum physically acceptable value for (in Figure 35, for all variables).
The seven variables in Figure 35 are the normalized values of:
- The residual shear stress at the end of the test ();
- The ultimate shear strain ();
- The maximum shear stress ();
- the Poisson ratio ();
- The shear stress at yielding ();
- The shear strain at yielding ();
- The pseudo-ductility factor ().
The radar diagrams in Figure 35 provide a synthetic and intuitive view of the effects of the strengthening technique on the mechanical properties of the RMs. In particular:
- The larger area covered by specimens M1-45 (Figure 35b) and M2-45 (Figure 35c) compared to specimen M1-90 (Figure 35a) along the axes of the variables , , and is a measure of the increase in both shear strength and ductility, a specific feature of the CAM® System. Of particular relevance are the values along the axis. In fact, since in specimen M1-90 , the strengthening gives the masonry walls a characteristic that the masonry does not possess, that is the ability to withstand shear stresses even for large values of the shear strains, without ever reaching an actual failure. Therefore, the strengthening not only significantly increases the low values of some variables in the ultimate state, such as and , but also gives the masonry walls completely new characteristics.
- The smaller area covered by specimens M1-45 (Figure 35b) and M2-45 (Figure 35c) compared to specimen M1-90 (Figure 35a) along the axes and does not in itself have a negative meaning. It simply indicates that damage occurs earlier in RMs than in URMs, but this has no negative effect on the overall behavior at the ultimate state (governed by the variables , and ) and the shear strength (governed by the variable ).
- The variation of the values of indicates that the strengthening technique decreases the Poisson ratio, which requires evaluation on the single test set-up.
For all of the above observations, the area of the radar diagram that returns a measure of the specimen performance is the one covered by the axes , , and . Therefore, the larger this area, the better the sample performs. This means that the best performance belongs to specimen M2-45 (Figure 35c).
5. Conclusions
This paper investigated the effectiveness of CAM-like systems with stainless steel straps arranged in squares (rectangular arrangement) in increasing the shear strength of masonry walls. The experimental results showed that a non-optimal arrangement of the straps leads to only partial exploitation of the reinforcement. In particular, the effectiveness of CAM-like systems is a function of the direction of the straps, being minimum for straps parallel to the mortar head and bed joints and maximum for straps forming angles of with the mortar joints:
- The straps parallel to the mortar joints (one strap per loop) provide no increase in both shear strength and ductility. However, they are helpful in preventing falling debris, which is a major cause of injury.
- The straps forming angles with the mortar joints (one strap per loop) do not increase the maximum shear stress but provide the masonry wall with the ability to withstand large shear strains without losing shear-bearing capacity.
- By increasing the number of straps per loop in the arrangement, both the maximum shear stress and the ductility increase. This means that the CAM® System is a strengthening system capable of increasing both ductility and shear strength.
As discussed in the paper, these results were partly predictable as a direct consequence of the static analysis of a rectangle made of hinged strips, which is the reference static scheme in the CAM® System with a rectangular arrangement. Precisely the predictability of these results is indeed the main motivation of this work. Besides the expected results, however, the analysis of the experimental results performed in the Mohr plane and the concept of apparent Poisson’s ratio―introduced in previous works―provided some unexpected findings on the mechanical properties of both URMs and RMs. As far as the mechanical properties of the URMs are concerned:
- The static analysis performed in the Mohr plane according to the RILEM interpretation of the diagonal compression test leads to stress/strain curves that are not consistent with the experimental evidence, for the values assumed by both the ratio and the ratio . The reason for this seems to lie in the underestimation of the hydrostatic stress at the center of the specimen by the RILEM approach. Therefore, the interpretation of the diagonal compression test needs a more accurate analysis in the Mohr plane.
- The Poisson ratio, , is much smaller than , which is the value usually taken as a reference in interpreting the experimental results of masonry walls. The experimental program provided the value , which is about 52% of the conventional value .
- In the context of linear elasticity for homogeneous and isotropic materials, the usual overestimation of the Poisson ratio leads to an overestimation of the Young modulus of about 11%, which gives rise to a well-founded doubt on the values of Young’s modulus obtained in the literature from diagonal compression tests.
- The apparent Poisson’s ratio is decreasing for low values of the applied load and increasing for high values of the applied load. The reason for the initial decreasing behavior could be the presence of micro-cavities that collapse during the early stages of the load test.
This second group of results shows that many of the assumptions usually made in the study of masonry are too simplistic and need further investigation. Therefore, the results of this work also provide some useful indications for a better understanding of the mechanical properties of masonry, going beyond the initial intent of a simple insight into the CAM® System.
From the analysis of the results on the RMs, it was possible to conclude that:
- The use of CAM-like strengthening systems anticipates the onset of damage and shortens the length of the initial linear branch.
- The value of depends on the percentage of reinforcement. In particular, the greater the percentage of reinforcement, the lower the value of . This makes it impossible to use a single value for the Poisson ratio in RMs, which is in any case lower than that in URMs.
- Being a greater overestimation in RMs than in URMS, the value of 0.25 usually assumed for the Poisson ratio leads to even greater overestimations of the Young modulus.
- The trend of the apparent Poisson’s ratio is different from the trend of the apparent Poisson’s ratio in diagonal compression tests performed on URMs, since it gives rise to a monotonically non-decreasing function. This could be a consequence of the pre-tensioning of the straps, in particular of those arranged along the direction of the load. In fact, the pre-tension could cause the collapse of the micro-cavities before the start of the load test, which would eliminate the initial decreasing branch in the law of the apparent Poisson’s ratio.
- The experimental program provided evidence of a possible anisotropy caused by the use of straps in CAM-like strengthening systems.
The experimental program therefore provided new insights into Poisson’s ratio and Young’s modulus even for masonry walls strengthened with CAM-like systems.
A final conclusion applies to both URMs and RMs, regarding the value of the yield shear strain, , useful for identifying the pseudo-ductility factor, . Following the common idea that needs a more coherent definition, the new proposal made in this paper is to relate to the law of the apparent Poisson’s ratio: in this paper, is the value of shear strain at which the first derivative of the apparent Poisson’s ratio undergoes a sudden increase. The new proposal for resulted in values of that successfully represent the performance of the three specimens, while the formulations that identify the value of as the shear strain at a fixed percentage of the maximum shear stress do not correctly capture the onset of damage.
Supplementary Materials
The following supporting information can be downloaded at: www.mdpi.com/xxx/s1, Figure S1: Special stainless steel elements for masonry protection: (a) Along the edges at wall ends (rounded angles); (b) Along the edges generated by the perforations (funnel plates); Figure S2: Four stainless steel straps of the CAM® System sharing the same perforation; Figure S3: Box-type behavior: by tying all the construction elements together, the building behaves as a single unit; Figure S4: Stress transfer mechanism from a loop-shaped stainless steel strap placed in tension to the masonry enclosed within it.
Funding
This research received no external funding.
Acknowledgments
The author is grateful to Rebeca Luisa Gherman for her active collaboration in the experimental program.
Conflicts of Interest
The author declares no conflict of interest.
Appendix
Some insights into the interpretation of the diagonal compression test
As mentioned in Section 0, the interpretation of the diagonal compression test is controversial [2], which leads to multiple interpretive models [40,41,56,85–88].
All the interpretations of the diagonal compression test share the common idea that the failure of the specimen occurs at its center of gravity. Therefore, all proposed formulas refer to the stress state at the center of gravity of the specimen.
With reference to the symbols in Figure A1:
- is the diagonal compression load applied during the test;
- is the angle between the direction of loading and the horizontal mortar joints (bed joints);
- is the center of gravity of the wall specimen and origin of the local reference frame;
- and are the axes (of the local reference frame of origin ) parallel, respectively, to the horizontal mortar joints (bed joints) and to the vertical mortar joints (head joints);
- is the normal stress acting―in the direction―on the planes of the infinitesimal neighborhood of that are perpendicular to the axis;
- is the normal stress acting―in the direction―on the planes of the infinitesimal neighborhood of that are perpendicular to the axis;
- is the shear stress―directed along the axis―acting on the planes of the infinitesimal neighborhood of that are perpendicular to the axis (the index designates the unit normal vector to the coordinate plane on which the shear stress acts, the index identifies the coordinate direction along which the shear stress acts).
Figure A1.
Normal and shear stresses in the infinitesimal neighborhood of point A, the center of gravity of the wall specimen.
Figure A1.
Normal and shear stresses in the infinitesimal neighborhood of point A, the center of gravity of the wall specimen.
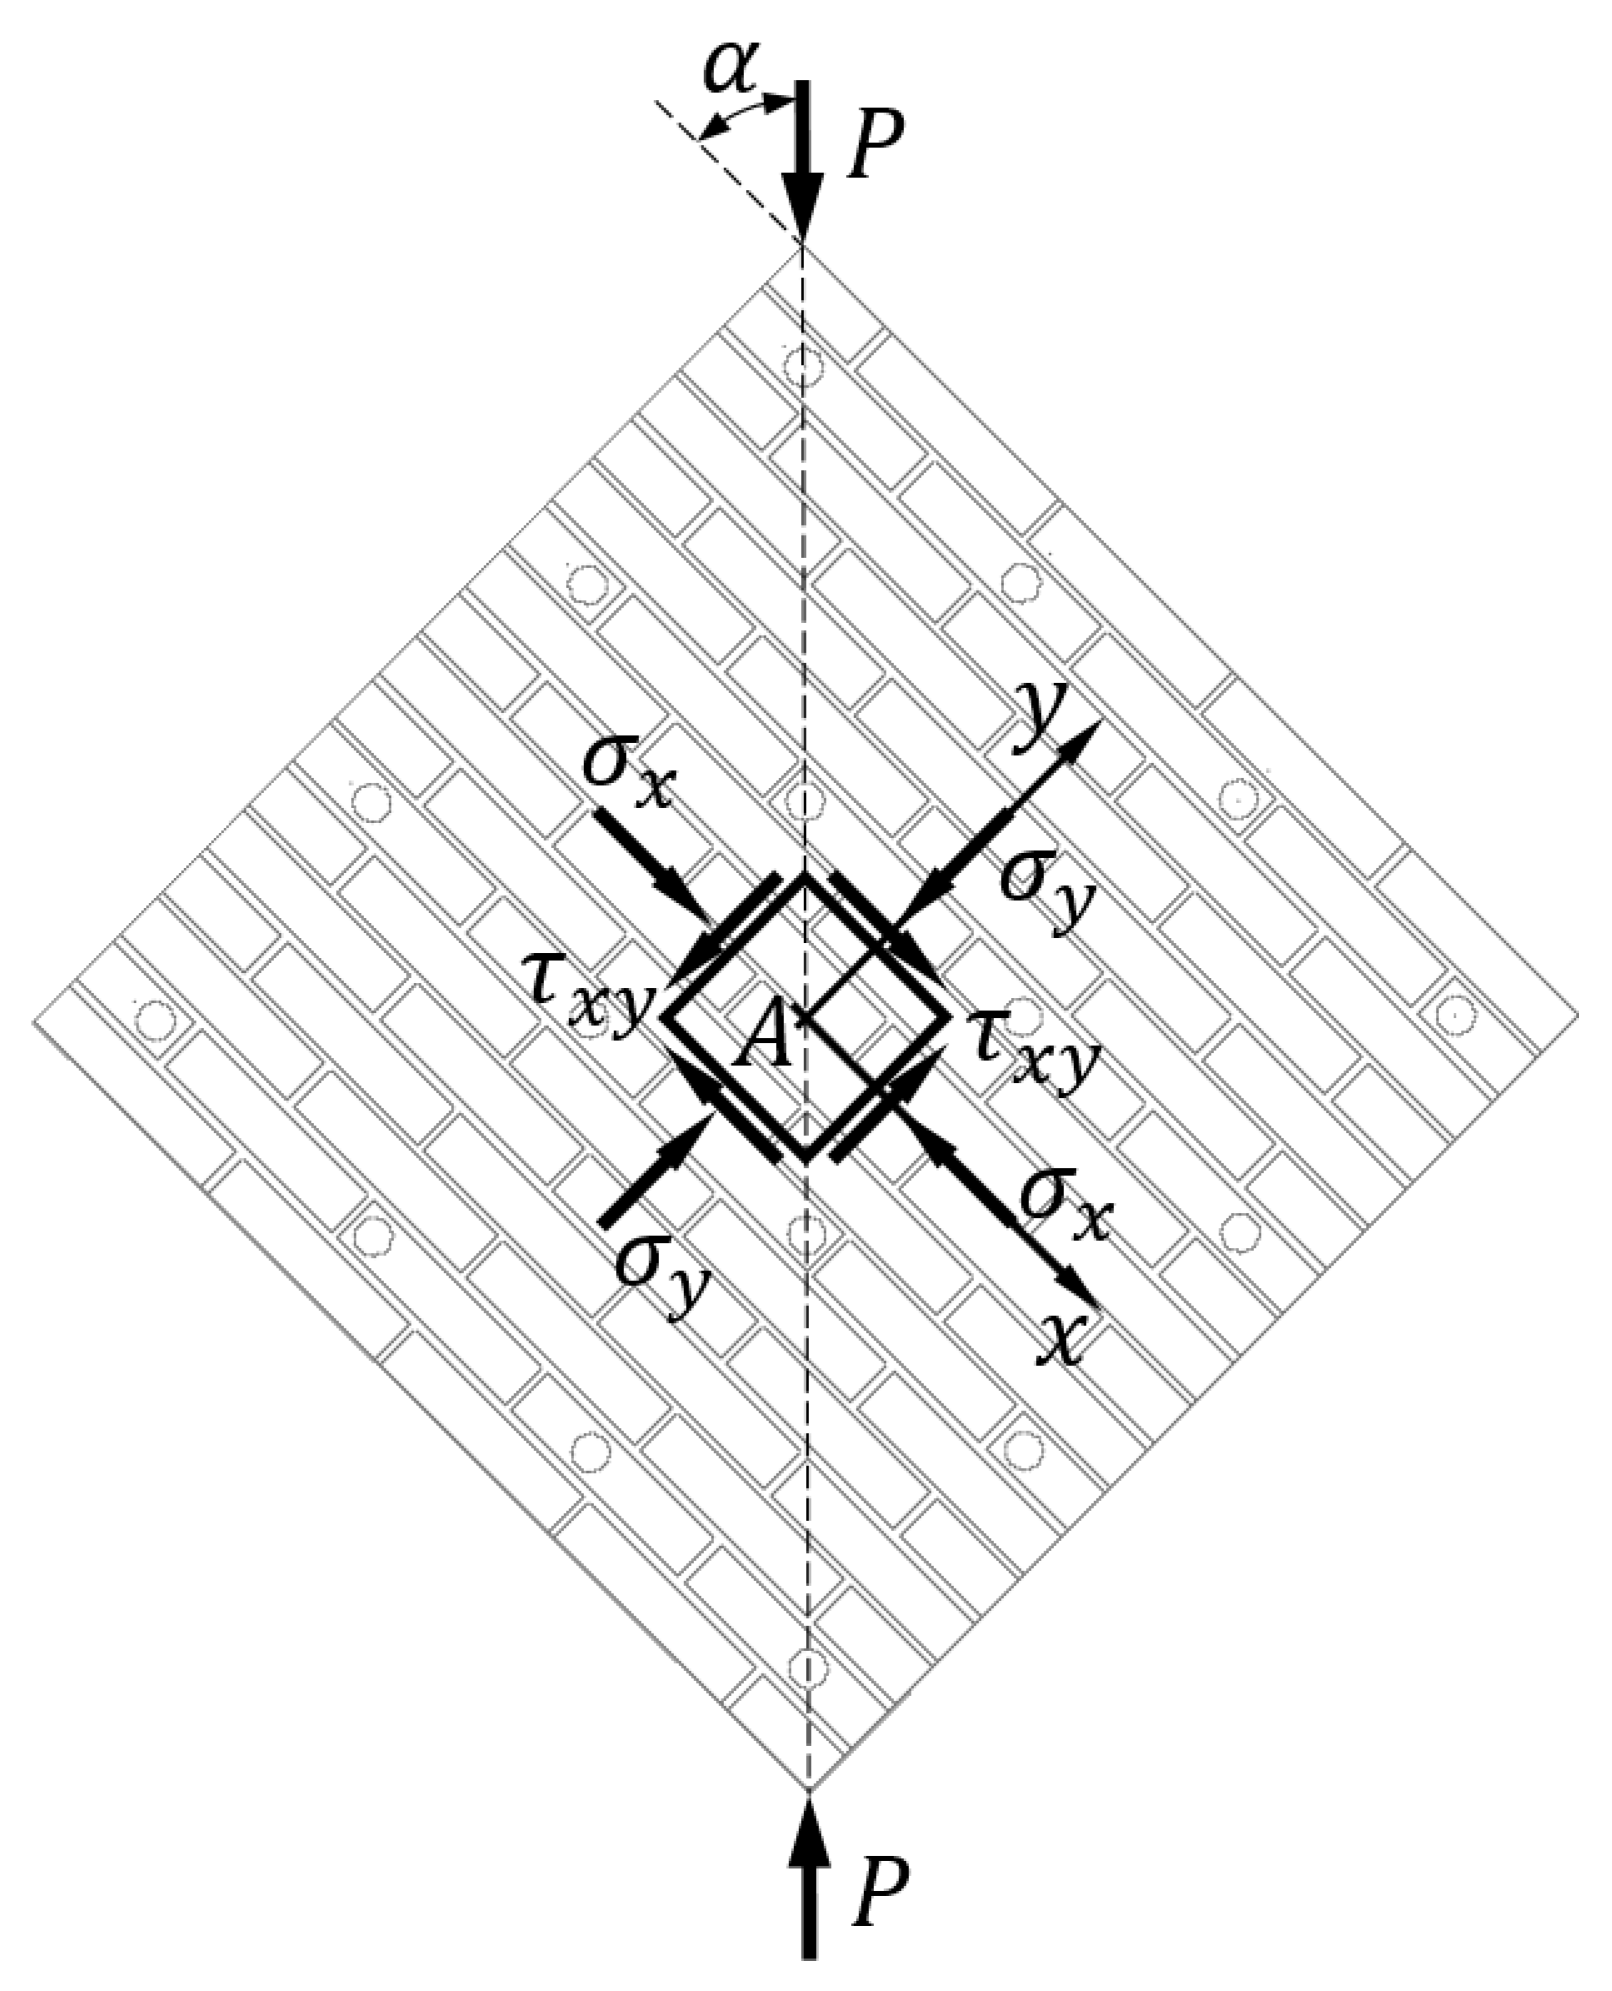
Since , the shear stress―directed along the axis―acting on the planes of the infinitesimal neighborhood of that are perpendicular to the axis, is equal to :
the symbol in Figure A1 represents both the shear stress on the planes perpendicular to the axis and the shear stress on the planes perpendicular to the axis.
In the standard interpretation of the diagonal compression test, the compressive load, , applied along one diagonal of the square specimen causes a diagonal tension failure with the specimen splitting apart parallel to the direction of load [40], starting from its center of gravity. According to the maximum-principal-stress criterion [74,89], this led to the identification of the diagonal tensile strength of masonry,, as the maximum value attained by the maximum principal stress (the tensile stress), at the center of gravity of the specimen:
where , the greater of the two principal normal stresses (principal stresses), and :
has the direction of the diagonal perpendicular to the load (the horizontal diagonal in Figure A1). The maximum-principal-stress criterion, in fact, postulates that the crack propagates in a direction perpendicular to the maximum principal stress (when ).
In most codes and standards, the diagonal tensile strength of masonry,, is calculated as if the center of gravity of the wall were in a stress state of pure shear, assuming a uniform shear stress distribution within the wall:
In particular, the American standard (ASTM E519/E519M – 15 [40]), decomposes along the directions of the head and bed joints, which gives the shear stress:
where is the net transversal area of the specimen of width , height and thickness :
being the percent of the gross area of the unit (the brick) that is solid―for solid units and ungrouted hollow units―expressed as a decimal.
For a loading direction angle equal to (as is the case of a square wall specimen), Equation (A7) takes the form:
and assumes the value:
being the value of at collapse.
Due to the equality between the first and third term in Equation (A6), the value given by Equation (A10) is equal to the pure shear stress, , at collapse, i.e. the pure shear strength of masonry, :
which provides the shear force, :
In the modified Mohr plane, with axes ( and ) normalized with respect to the ratio :
the ASTM interpretation of the diagonal compression test for the reference frame of Figure A1 (also drawn in Figure A2a) gives rise to a Mohr circle centered at the origin, (Figure A2b).
Figure A2.
Stress state for the infinitesimal neighborhood of point : (a) In the reference frame of Figure A1; (b) In the modified Mohr plane, according to the ASTM and RILEM interpretations of the diagonal compression test.
Figure A2.
Stress state for the infinitesimal neighborhood of point : (a) In the reference frame of Figure A1; (b) In the modified Mohr plane, according to the ASTM and RILEM interpretations of the diagonal compression test.
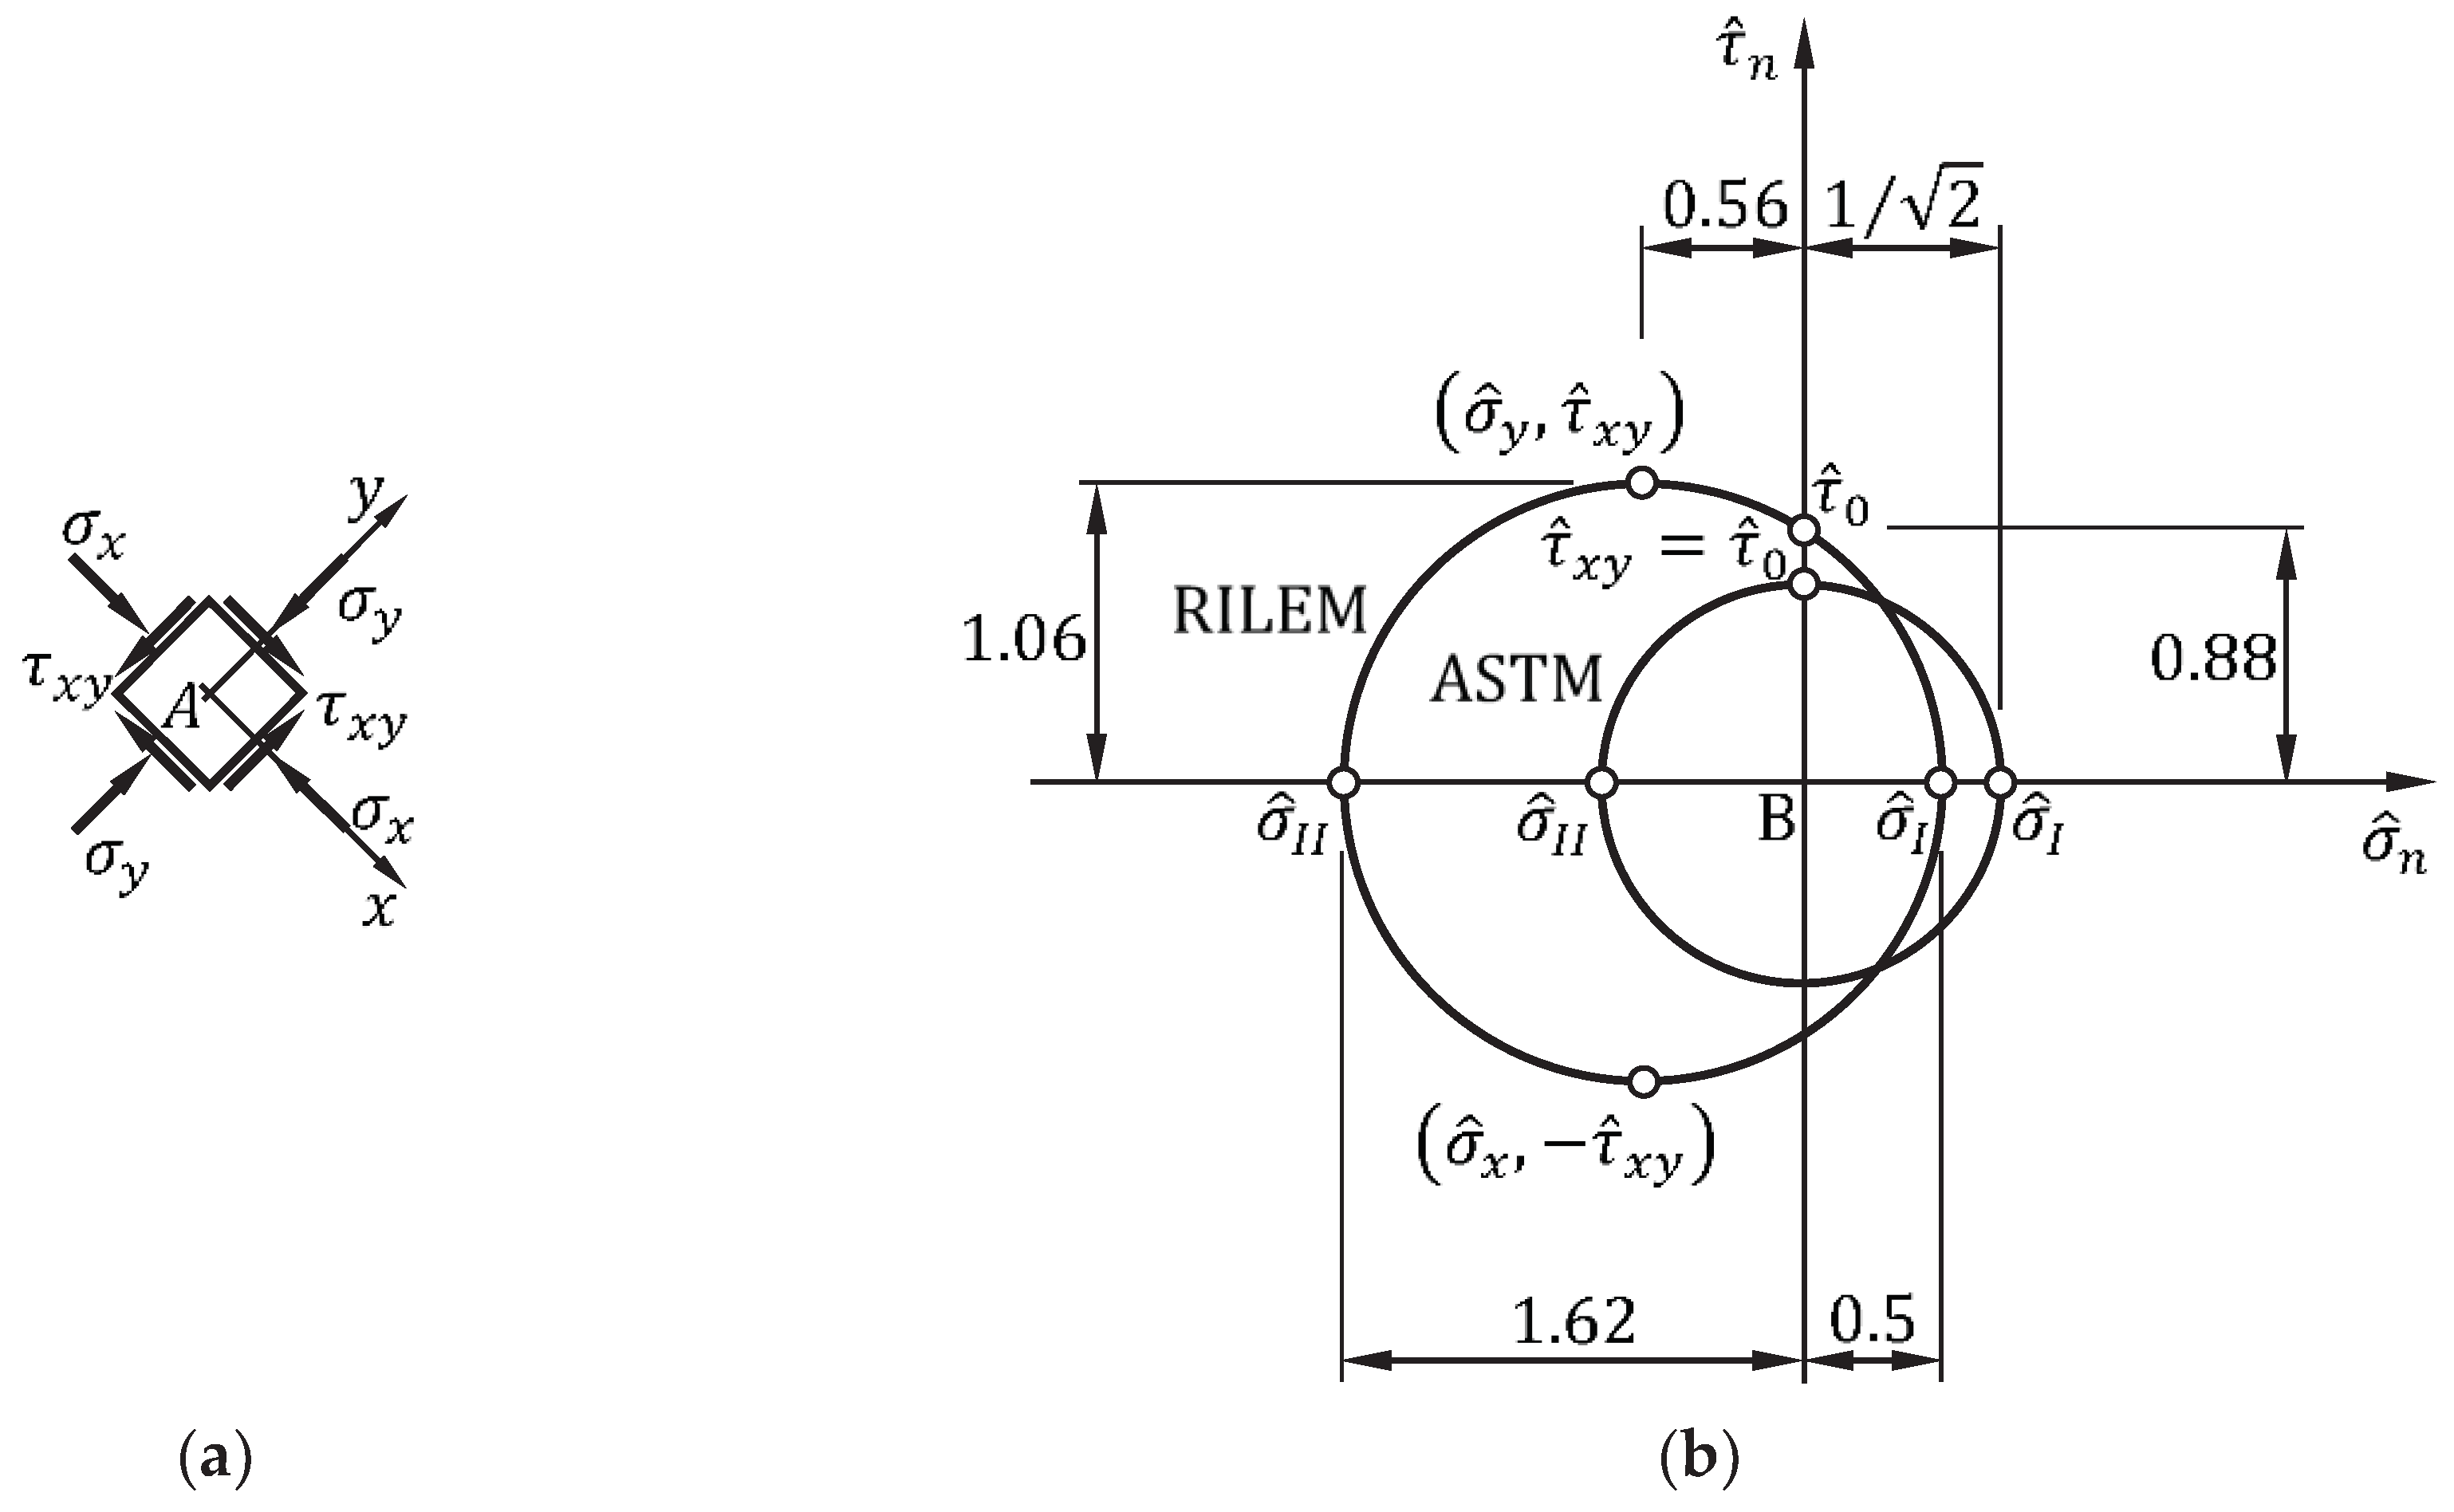
Of course, in Figure A2b the normalization applies to all stress components:
and the principal stresses:
The sign conventions for the normal and shear stress components acting on the plane with unit normal vector are the same in the Mohr plane and in the modified Mohr plane of Figure A2b:
Figure A3.
Stress components acting on the plane with unit normal vector (the plane perpendicular to the outward-pointing line ) in the reference frame of Figure A1: (a) For normal and shear stresses that are positive in the Mohr plane; (b) For normal and shear stresses that are negative in the Mohr plane.
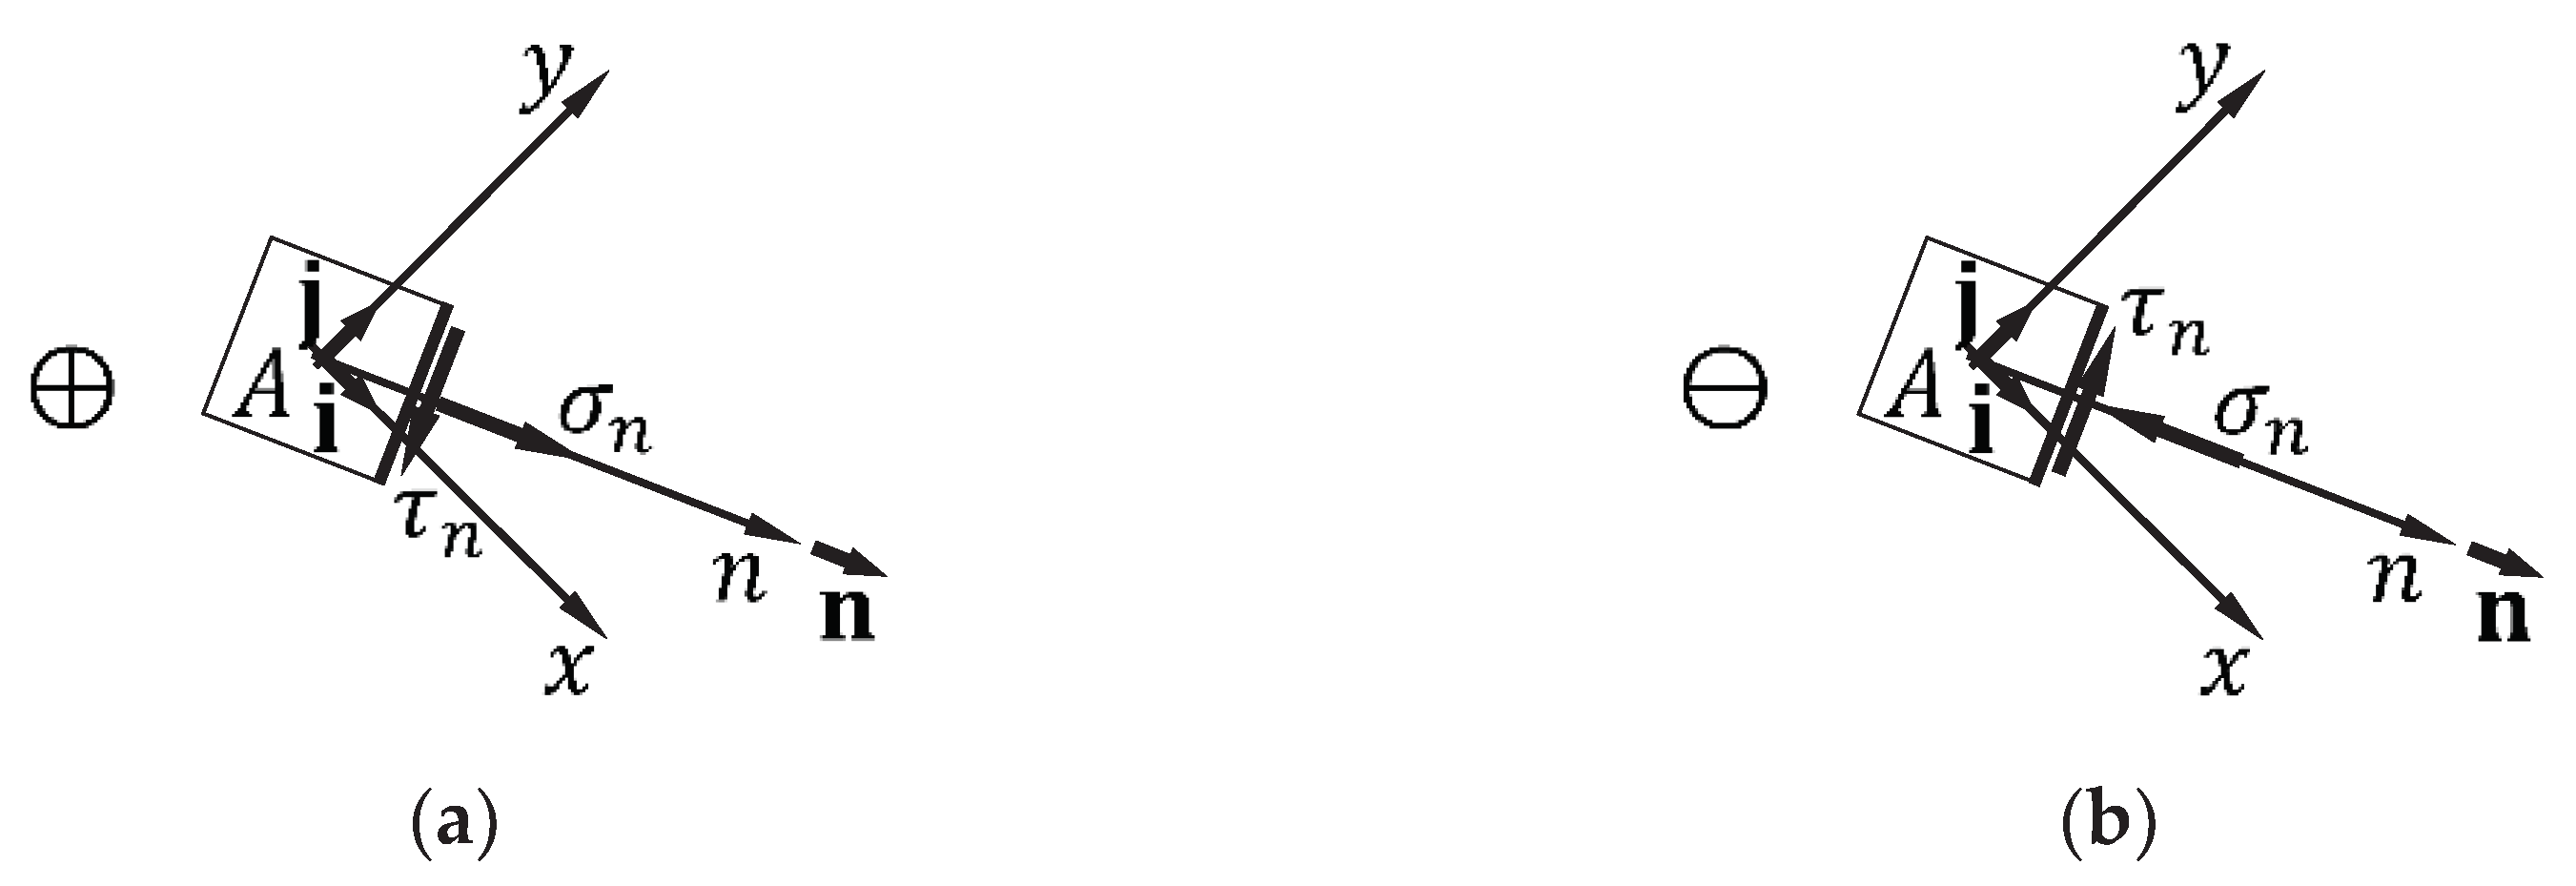
Although adopted by most codes and standards, the hypothesis of pure shear stress state at the center of gravity of the specimen is at odds with the linear elastic solution given by Frocht in 1931 [90], assuming the masonry as an isotropic and homogeneous material. Frocht found that the stress state is not uniform along the diagonal of the wall specimen, as it is characterized by both shear and normal stresses (loading direction angle: ). In particular, he found that the stress state at point is the sum of a pure shear stress state and a hydrostatic stress state. This shifts the center of the Mohr circle for point to the left of the vertical axis―where ―leaving :
where is the shear stress at zero normal stress and load (its normalized value is , in Figure A2b). When , provides the pure shear strength of masonry, .
The experimental results found by Frocht are the basis of the criterion for the assessment of the stress state at the center of gravity of the wall specimen provided by the RILEM guidelines (RILEM LUM B6 1994 [41]). Therefore, the Mohr circle resulting from the RILEM interpretation of the diagonal compression test is the Mohr circle found by Frocht. Figure A2b shows the comparison between the ASTM and RILEM interpretations in the modified Mohr plane.
Since in both the ASTM and the RILEM guidelines, the direction of the maximum principal stress, , is the same for both circles in Figure A2b. To determine the principal directions graphically in the Mohr plane, it is necessary to know the position of the Mohr pole (the Pole Method). The Mohr pole is a unique point, , on the Mohr circle such that the stress state on a plane inclined at any angle from the horizontal is defined by the point of intersection of the Mohr circle with a straight line drawn through the Mohr pole at an angle from the horizontal [91]. The point of intersection takes the name , where is the direction of the unit normal vector to the plane (Figure A3). This establishes a one-to-one relationship between the inclinations of the planes and the straight lines drawn through the Mohr pole, which allows us to locate the Mohr pole on the Mohr circle by exploiting the directions of the planes with known components of normal and shear stresses (Figure A4a). The Mohr pole is therefore the point of the Mohr circle lying on the straight line drawn from the stress point in the direction of the plane on which and (Figure A4b). It is also the point of the Mohr circle lying on the straight line drawn from the stress point in the direction of the plane on which and (Figure A4b). For the local reference frame in Figure A1 (also drawn in Figure A4a), the coordinates of the Mohr pole are (Figure A4b):
for both circles. By the Mohr pole property, a line drawn through the pole and the stress point on the circle is then parallel to the principal plane with principal stress . This line is also perpendicular to the (principal) direction of , which is therefore parallel to the line drawn through the pole and the stress point . The direction of provided by the Pole Method for the reference frame of Figure A1 is horizontal, i.e. the direction of the diagonal perpendicular to the load , for both circles (Figure A4b).
Figure A4.
The Pole Method for the identification of the stress components in the infinitesimal neighborhood of point : (a) Reference frame of Figure A1 for the association between planes with unit normal vector and points of the Mohr plane; (b) Application of the method in the ASTM and RILEM interpretations of the diagonal compression test.
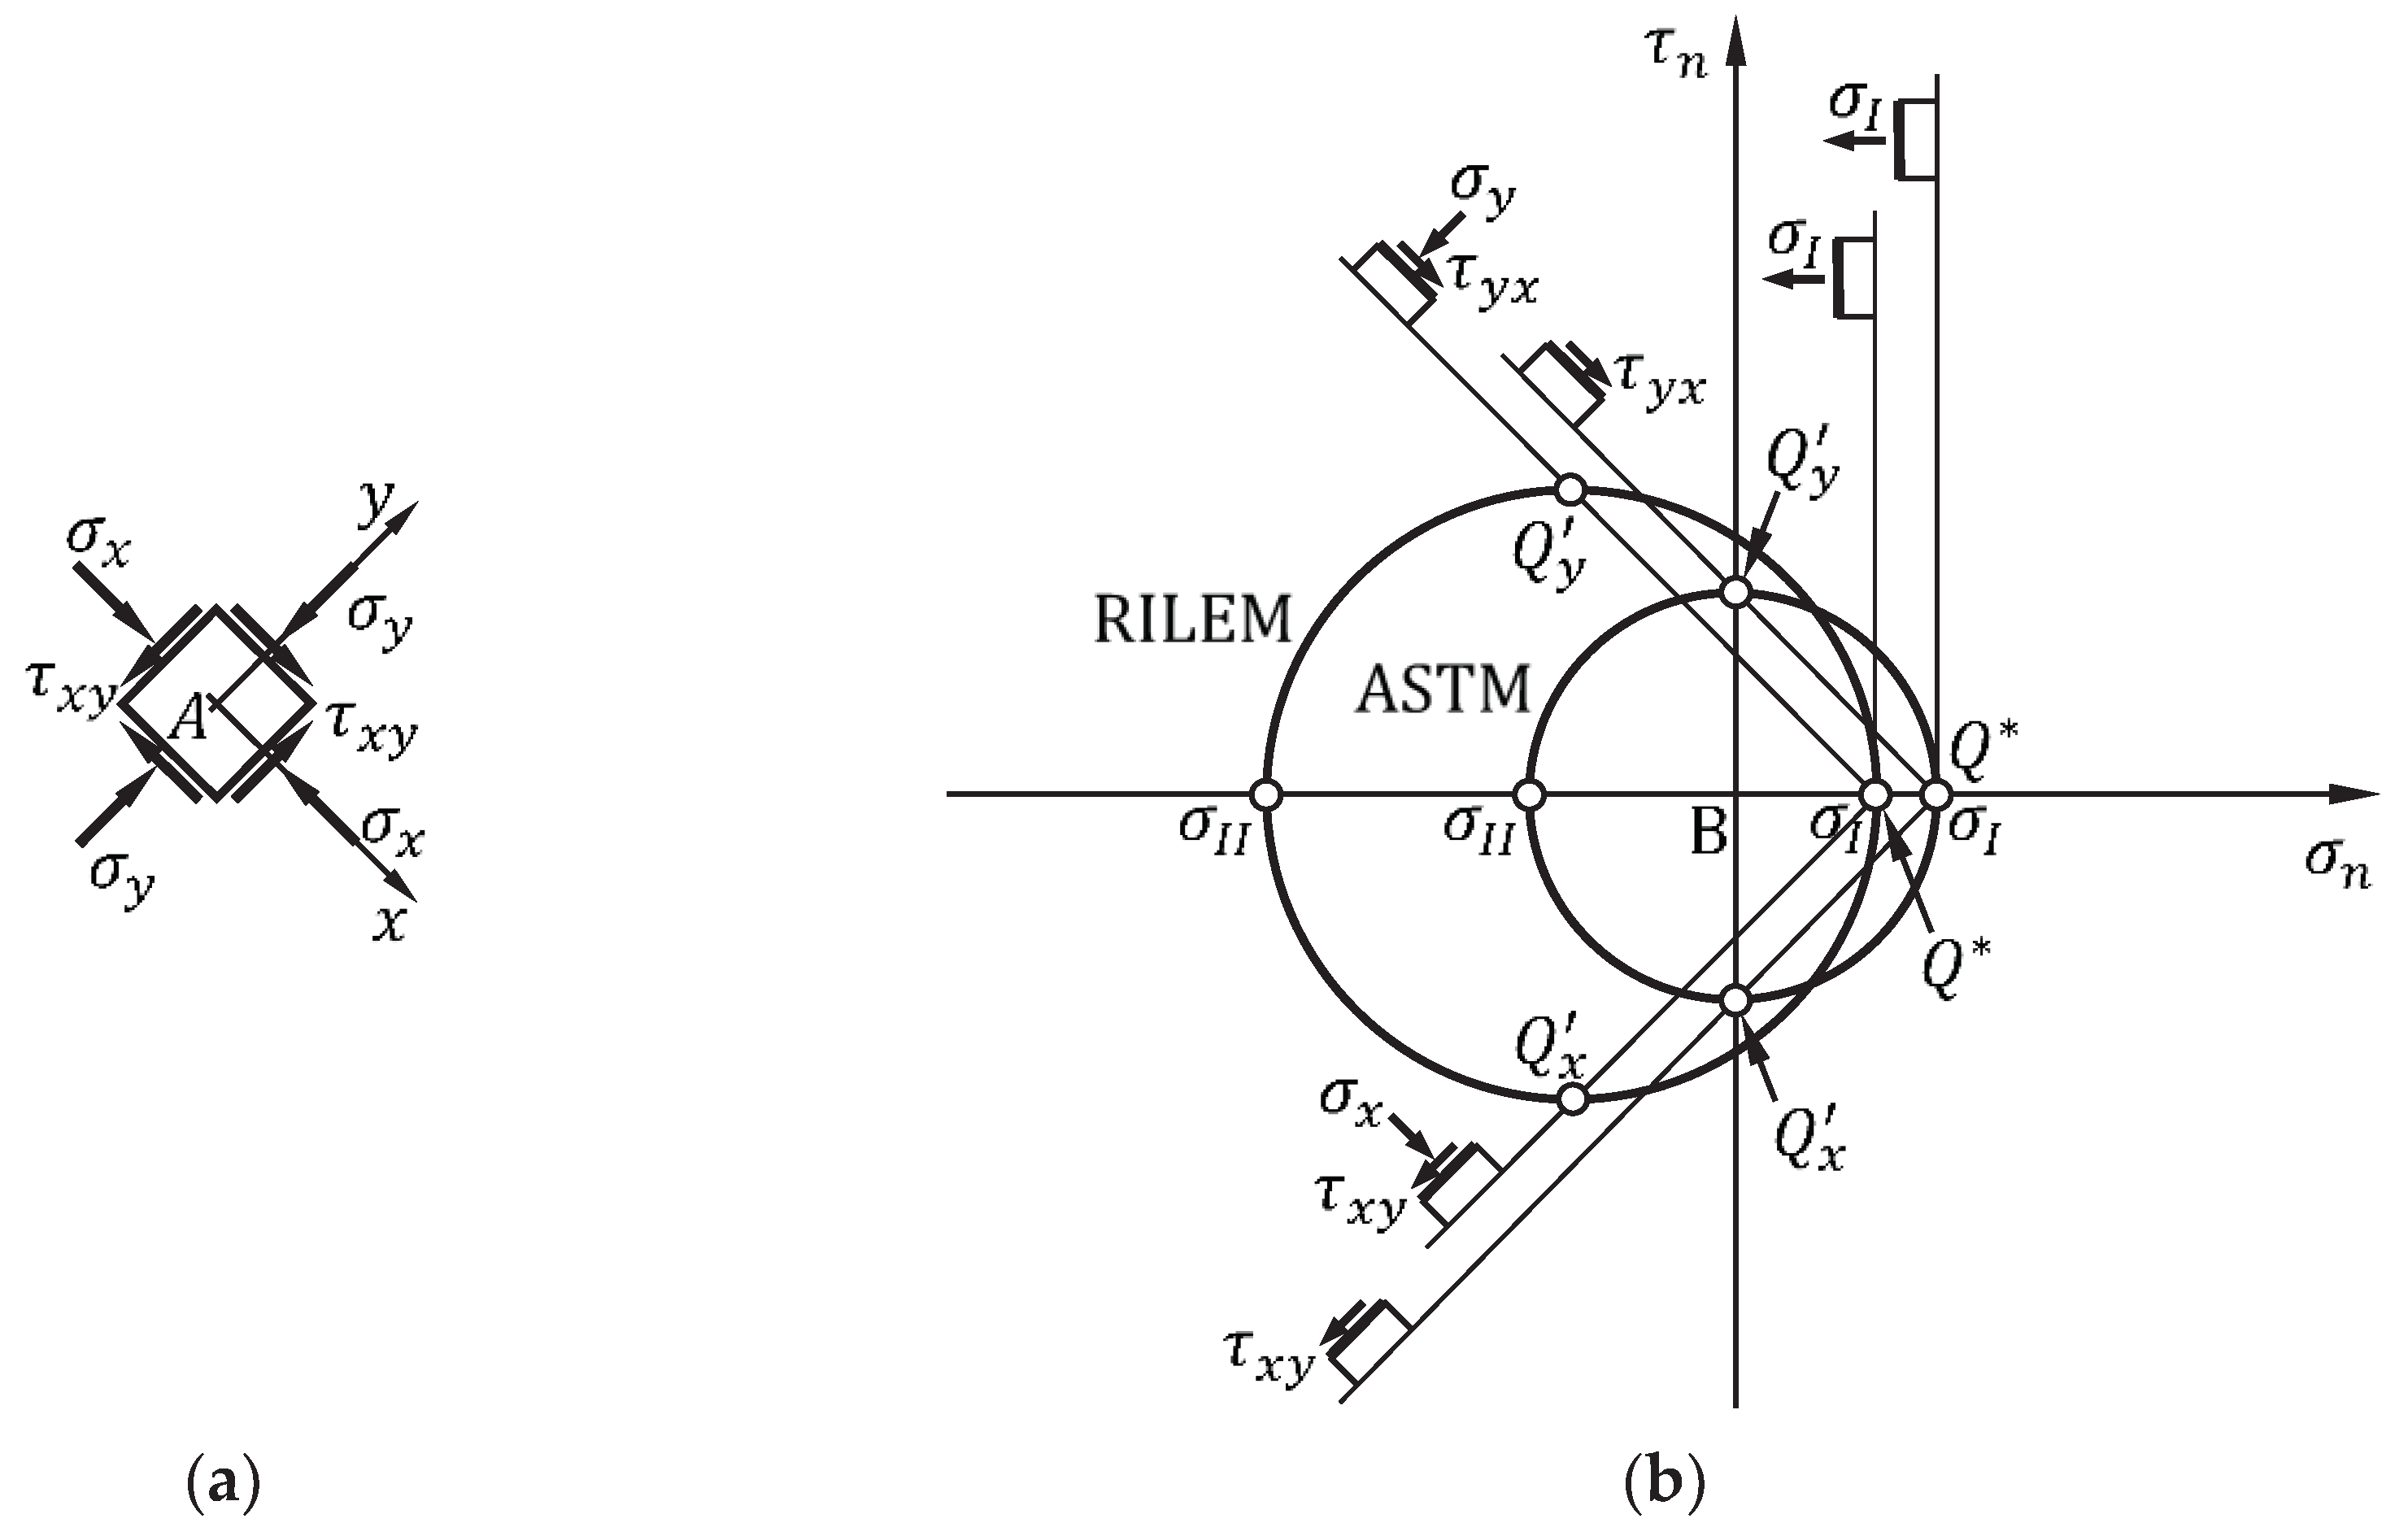
In conclusion, the RILEM value of the diagonal tensile strength of masonry in the linear elastic range is lower than that provided by Equation (A10) in the ASTM guidelines (Figure A2):
while the pure shear strength of masonry is higher than that provided by Equation (A11) in the ASTM guidelines (Figure A2):
It is worth noting that the product of and the value of given by Equation A27 does not provide the shear force, :
for two reasons:
- The straight line connecting the Mohr pole with the stress point of coordinates is not inclined by . Due to the Mohr pole property, this means that the stress point does not provide the stress state acting on the bed joint passing through point A.
- Even if the straight line connecting the Mohr pole with the stress point was at , the non-homogeneous stress state inside the specimen does not allow us to apply the results found for the neighborhood of A to other points and their neighborhoods. Thus, the stress state at the center of gravity A cannot provide information on the shear force applied to the upper and lower faces of the specimen.
Therefore, the first equality in Equation (A12) loses meaning, while the equality between the first and third terms remains valid (because is the component of along the direction of the bed joints (Figure A1)):
References
- Cundari, G.A.; Milani, G.; Failla, G. Seismic vulnerability evaluation of historical masonry churches: Proposal for a general and comprehensive numerical approach to cross-check results. Eng. Fail. Anal. 2017, 82, 208–228. [Google Scholar] [CrossRef]
- Andreini, M.; De Falco, A.; Giresini, L.; Sassu, M. Mechanical Characterization of Masonry Walls with Chaotic Texture: Procedures and Results of In-Situ Tests. Int. J. Archit. Heritage 2014, 8, 376–407. [Google Scholar] [CrossRef]
- Bothara, J.K.; Hiçyilmaz, K.M.O. General observations of building behaviour during the 8th October 2005 Pakistan earthquake. Bull. NZ Soc. Earthquake Eng. 2008, 41, 209–33. [Google Scholar] [CrossRef]
- Zhao, T.; Zhang, X.; Tian, Z. Analysis of earthquake damage to masonry school buildings in Wenchuan earthquake. World Inf. Earthquake Eng. 2009, 25, 150–8. [Google Scholar]
- Kaplan, H.; Bilgin, H.; Yilmaz, S.; Binici, H.; Öztas, A. Structural damages of L’Aquila (Italy) earthquake. Nat. Hazards Earth. Syst. Sci. 2010, 10, 499–507. [Google Scholar] [CrossRef]
- Dizhur, D.; Ismail, N.; Knox, C.; Lumantarna, R.; Ingham, J.M. Performance of unreinforced and retrofitted masonry buildings during the 2010 Darfield earthquake. Bull. NZ Soc. Earthquake Eng. 2010, 43, 321–39. [Google Scholar] [CrossRef]
- Brandonisio, G.; Lucibello, G.; Mele, M.; De Luca, A. Damage and performance evaluation of masonry churches in the 2009 L’Aquila earthquake. Eng. Fail. Anal. 2013, 34, 693–714. [Google Scholar] [CrossRef]
- Ismail, N. Selected strengthening techniques for the seismic retrofit of unreinforced masonry buildings. PhD Thesis, The University of Auckland, New Zealand, 2012. Available online: https://researchspace.auckland.ac.nz/handle/2292/19106.
- Konthesingha, K.M.C.; Masia, M.J.; Petersen, R.B.; Mojsilovic, N.; Simundic, G.; Page, A.W. Static cyclic in-plane shear response of damaged masonry walls retrofitted with NSM FRP strips – An experimental evaluation, Eng. Struct. 2013, 50, 126–136. [Google Scholar] [CrossRef]
- Sayin, B.; Yildizlar, B.; Akcay, C.; Gunes, B. The retrofitting of historical masonry buildings with insufficient seismic resistance using conventional and non-conventional techniques. Eng. Fail. Anal. 2019, 115, 454–463. [Google Scholar] [CrossRef]
- Ferretti, E.; Pascale, G. Some of the Latest Active Strengthening Techniques for Masonry Buildings: A Critical Analysis. Materials 2019, 12, 1151. [Google Scholar] [CrossRef]
- Angiuli, R.; Corvaglia, P.; Micelli, F.; Aiello, M.A. SMA-Based Composites for Active Confinement of Masonry Columns. In Proceedings of the International Conference on Shape Memory and Superelastic Technologies (SMST), Hong Kong, China, 6–9 November 2011. [Google Scholar]
- Micelli, F.; Angiuli, R.; Corvaglia, P.; Aiello, M.A. Passive and SMA-activated confinement of circular masonry columns with basalt and glass fibers composites. Compos Part B-Eng 2014, 67, 348–362. [Google Scholar] [CrossRef]
- Recupero, A.; Spinella, N. The Strengthening of Masonry Walls in Seismic-Prone Areas with the CAM System: Experimental and Numerical Results. Infrastructures 2020, 5, 108. [Google Scholar] [CrossRef]
- Di Re, P.; Greco, M.; Lofrano, E.; Paolone, A. Finite element modeling of masonry elements reinforced with the CAM system. Structures 2022, 44, 740–754. [Google Scholar] [CrossRef]
- Dolce, M.; Nigro, D.; Ponzo, F.C.; Marnetto, R. The CAM system for the retrofit of masonry structures. In Proceedings of the 7th International Seminar on Seismic Isolation, Passive Energy Dissipation and Active Control of Vibrations of Structures, Assisi, Italy, 2–5 October 2001. [Google Scholar]
- Dolce, M.; Ponzo, F.C.; Di Croce, M.; Moroni, C.; Giordano, F.; Nigro, D.; Marnetto, R. Experimental assessment of the CAM and DIS-CAM systems for the seismic upgrading of monumental masonry buildings. In Proceedings of the PROHITECH 2009 1st International Conference on Protection of Historical Constructions, Rome, Italy, 21–24 June 2009; CRC Press/Balkema: Leiden, the Netherlands, 2009; pp. 1021–1028. [Google Scholar]
- Dolce, M.; Ponzo, F.C.; Goretti, A.; Moroni, C.; Giordano, F.; De Canio, G.; Marnetto, R. 3d dynamic tests on 2/3 scale masonry buildings retrofitted with different systems. In Proceedings of the 14th World Conference on Earthquake Engineering, Beijing, China, 12–17 October 2008. [Google Scholar]
- Marnetto, R.; Vari, A.; Marnetto, L.; Leonori, M. Conservare l’Edilizia in Muratura: Il Sistema CAM—Cuciture Attive dei Manufatti [Conserving the Building Heritage in Masonry: The CAM System—Active Confinement of Manufactured Buildings]; Edizioni PREprogetti: Rome, Italy, 2014. [Google Scholar]
- Marnetto, R.; Vari, A. Linee Guida—Cuciture Attive per la Muratura: Procedura Generale per la Progettazione, Modellazione, Calcolo e Verifica di Edifici in Muratura Rinforzati con il Sistema di Cucitura attiva CAM; EDIL CAM Sistemi S.r.l.: Roma, Italy, October 2015. [Google Scholar]
- Al-Manaseer, A.A.; Neis, V.V. Load tests on post-tensioned masonry wall panels. ACI Struct. J. 1987, 84, 467–472. [Google Scholar] [CrossRef] [PubMed]
- Ganz, H.R.; Shaw, G. Stressing masonry’s future. Civil Engineering (New York) 1997, 67, 42–45. [Google Scholar]
- Rosenboom, O.A.; Kowalsky, M.J. Reversed in-plane cyclic behavior of post-tensioned clay brick masonry walls. J. Struct. Eng.-ASCE 2004, 130, 787–798. [Google Scholar] [CrossRef]
- Bean Popehn, J.R.; Schultz, A.E.; Lu, M.; Stolarski, H.K.; Ojard, N.J. Influence of transverse loading on the stability of slender unreinforced masonry walls. Eng. Struct. 2008, 30, 2830–2839. [Google Scholar] [CrossRef]
- Sperbeck, S. Seismic risk assessment of masonry walls and risk reduction by means of prestressing. PhD Thesis, . Technical University of Braunschweig (Germany) and University of Florence (Italy), Italy, 2009. [Google Scholar]
- Preciado, A. Seismic vulnerability reduction of historical masonry towers by external prestressing devices. PhD Thesis, . Technical University of Braunschweig (Germany) and University of Florence (Italy), Italy, 2011. [Google Scholar]
- Ismail, N.; Schultz, A.E.; Ingham, J.M. Out-of-Plane Seismic Performance of Unreinforced Masonry Walls Retrofitted using Post-Tensioning. In Proceedings of the 15th International Brick and Block Masonry Conference, Florianópolis, Santa Caterina, Brazil, 3–6 June 2012. [Google Scholar]
- Ordinanza del Presidente del Consiglio dei Ministri 20 marzo 2003 n.3274. Primi elementi in materia di criteri generali per la classificazione sismica del territorio nazionale e normative tecniche per le costruzioni in zona sismica, G.U. n. Ordinanza del Presidente del Consiglio dei Ministri 20 marzo 2003 n.3274. Primi elementi in materia di criteri generali per la classificazione sismica del territorio nazionale e normative tecniche per le costruzioni in zona sismica, G.U. n. 105 - S.o. n. 72, 8 May.
- Ferretti, E.; Pascale, G. Combined Strengthening Techniques to Improve the Out-of-Plane Performance of Masonry Walls. Materials 2019, 12, 1171. [Google Scholar] [CrossRef] [PubMed]
- Cilia, M.; Cipolla, I.; Colajanni, P.; Marnetto, R.; Recupero, A.; Spinella, N. Prove sperimentali su travi in c.a. rinforzate con metodo CAM®: Valutazione del comportamento a taglio. Progettazione Sismica 2015, VII, 93–108.
- Leonori, M.; Vari, A. L’influenza della tipologia di terreno sui meccanismi locali di collasso degli edifici in muratura e miglioramento sismico con il sistema CAM®. In Dynamic Interaction of Soil and Structure (DISS_15); Proceedings of the 4th International Workshop on Archaeology, Cryptoportici, Hypogea, Geology, Geotechnics, Geophysics, Rome, Italy, 12–13 November 2015; Monti, G., Valente, G., Eds.; Università dell’Aquila, Dipartimento DICEAA—Sapienza, Università di Roma: Rome, Italy, 2015; pp. 1–15.
- Marnetto, R. Sviluppo ed applicazioni delle tecniche antisismiche presso la società TIS SpA di Roma. In Proceedings of the Seminario di Studi sui Sistemi e Tecnologie Antisismici, Rome, CNR, Italy, 12 September 2007; pp. 2–27. [Google Scholar]
- Kalali, A.; Kabir, M.Z. Experimental response of double-wythe masonry panels strengthened with glass fiber reinforced polymers subjected to diagonal compression tests. Eng. Struct. 2012, 39, 24–37. [Google Scholar] [CrossRef]
- Mustafaraj, E.; Yardim, Y. Retrofitting damaged unreinforced masonry using external shear strengthening techniques. J. Build. Eng. 2019, 26, 100913. [Google Scholar] [CrossRef]
- Ferretti, E. Recent advances in the Straps/Strips technique for out-of-plane strengthening of load-bearing masonry walls. Procedia Struct. Integrity 2020, 25, 33–46. [Google Scholar] [CrossRef]
- Ferretti, E. Wire Ropes and CFRP Strips to Provide Masonry Walls with Out-Of-Plane Strengthening. Materials 2019, 12, 2712. [Google Scholar] [CrossRef] [PubMed]
- Ferretti, E.; Casadio, E.; Di Leo, A. Masonry Walls under Shear Test: a CM Modeling. CMES-Comp. Model. Eng. Sci. 2008, 30, 163–190. [Google Scholar] [CrossRef]
- Borri, A.; Corradi, M.; Castori, G.; Sisti, R. REINFORCEMENT OF MASONRY PANELS WITH GFRP GRIDS. In Proceedings of the 9th International Conference on Structural Analysis of Historical Constructions (SAHC2014), Mexico City, Mexico, 14–17 October 2014. [Google Scholar]
- Crisci, G.; Ceroni, F.; Lignola, G.P. Comparison between Design Formulations and Numerical Results for In-Plane FRCM-Strengthened Masonry Walls. Appl. Sci. 2020, 10, 4998. [Google Scholar] [CrossRef]
- Standard Test Method for Diagonal Tension (Shear) in Masonry Assemblages; ASTM E519/E519M–15; ASTM International: West Conshohocken, PA, USA, 2021.
- Diagonal tensile strength of small walls specimens; RILEM LUM B6; In Rilem Recommendations for the Testing and Use of Constructions Materials; RILEM: Sheffield, UK, 1994; pp. 488–489.
- Methods of test for masonry units - Part 1: Determination of compressive strength; UNI EN 772-1:2015; UNI - Ente Italiano di Normazione: Milano, Italy, 2015.
- Specification for mortar for masonry - Part 2: Masonry mortar; UNI EN 998-2:2016; UNI - Ente Italiano di Normazione: Milano, Italy, 2016.
- Methods of test for mortar for masonry - Part 1: Determination of particle size distribution (by sieve analysis); UNI EN 1015−1:2007; UNI - Ente Italiano di Normazione: Milano, Italy, 2007.
- Methods of test for mortar for masonry - Part 11: Determination of flexural and compressive strength of hardened mortar; UNI EN 1015−11:2019; UNI - Ente Italiano di Normazione: Milano, Italy, 2019.
- Fire classification of construction products and building elements - Part 1: Classification using data from reaction to fire tests; UNI EN 13501-1:2019; UNI - Ente Italiano di Normazione: Milano, Italy, 2019.
- Methods of test for mortar for masonry - Part 19: Determination of water vapour permeability of hardened rendering and plastering mortars; UNI EN 1015-19:2008; UNI - Ente Italiano di Normazione: Milano, Italy, 2008.
- Masonry and masonry products - Methods for determining thermal properties; UNI EN 1745:2020; UNI - Ente Italiano di Normazione: Milano, Italy, 2020.
- Methods of test for mortar for masonry - Part 18: Determination of water absorption coefficient due to capillary action of hardened mortar; UNI EN 1015-18:2004; UNI - Ente Italiano di Normazione: Milano, Italy, 2004.
- CLP – Regulation on classification, labelling and packaging of substances and mixtures; Regulation (EC) No 1272/2008; European Parliament and Council: Brussels, Belgium, 2008.
- Metallic materials - Tensile testing - Part 1: Method of test at room temperature (ISO 6892-1:2019); UNI EN ISO 6892-1:2020; UNI - Ente Italiano di Normazione: Milano, Italy, 2020.
- Solutions and correct use of clay facing bricks; ANDIL – Associazione Nazionale degli Industriali dei Laterizi: Roma, Italy, 2014.
- Methods of test for mortar for masonry - Part 2: Bulk sampling of mortars and preparation of test mortars; UNI EN 1015−2:2007; UNI - Ente Italiano di Normazione: Milano, Italy, 2007.
- Ferretti, E. A discussion of strain-softening in concrete. Int. J. Fract. 2004, 126, L3–L10. [Google Scholar] [CrossRef]
- Ferretti, E.; Moretti, M.; Chiusoli, A.; Naldoni, L.; de Fabritiis, F.; Visonà, M. Rice-Husk Shredding as a Means of Increasing the Long-Term Mechanical Properties of Earthen Mixtures for 3D Printing. Materials 2022, 15, 743. [Google Scholar] [CrossRef] [PubMed]
- Brignola, A.; Frumento, S.; Lagomarsino, S.; Podestà, S. Identification of Shear Parameters of Masonry Panels Through the In-Situ Diagonal Compression Test. Int. J. Archit. Herit. 2018, 3, 52–73. [Google Scholar] [CrossRef]
- Dong, F.; Wang, H.; Jiang, F.; Xing, Q.; Yu, J. In-plane shear behavior of masonry panels strengthened with ultra-high ductile concrete (UHDC). Eng. Struct. 2022, 252, 113609. [Google Scholar] [CrossRef]
- Calderini, C.; Cattari, S.; Lagomarsino, S. IDENTIFICATION OF SHEAR MECHANICAL PARAMETERS OF MASONRY PIERS FROM DIAGONAL COMPRESSION TEST. In Proceedings of the 11th Canadian Masonry Symposium, Toronto, Ontario, 31 May – 3 June 2009. [Google Scholar]
- Calderini, C.; Cattari, S.; Lagomarsino, S. The use of the diagonal compression test to identify the shear mechanical parameters of masonry. Constr. Build. Mater. 2010, 24, 677–685. [Google Scholar] [CrossRef]
- Mezrea, P.E. Retrofitting of historical brick masonry walls with textile reinforced mortar (FRCM). MSc thesis (in Turkish), Istanbul Technical University Graduate School of Science Engineering and Technology, 2014.
- Guide for the Design and Construction of Externally Bonded Fibre Reinforced Inorganic Matrix Systems for Strenghtening Existing Structures; CNR-DT 215; Council of National Research (CNR): Rome, Italy, 2018.
- Aggiornamento sulle Norme Tecniche per le Costruzioni; Italian Building Code (IBC); Italian Ministry of Infrastructures and Transportation: Rome, Italy, 2018. (In Italian).
- Commentary on Technical Regulations for Constructions; Italian Building Code Commentary (IBCC), Circolare n.7 C.S.LL.PP.; Italian Ministry of Infrastructures and Transportation: Rome, Italy, 2019. (In Italian).
- Mezrea, P.E.; Ispir, M.; Balci, I.A.; Bal, I.E.; Ilki, A. Diagonal tensile tests on historical brick masonry wallets strengthened with fabric reinforced cementitious mortar. Structures 2021, 33, 935–946. [Google Scholar] [CrossRef]
- Timoshenko, S.P.; Goodier, J.N. Theory of Elasticity, 3rd ed.; McGraw-Hill International Editions: New York, USA, 1970. [Google Scholar]
- Ismail, N.; Petersen, R.B.; Masia, M.J.; Ingham, J.M. Diagonal shear behaviour of unreinforced masonry walletts strengthened using twisted steel bars. Constr. Build. Mater. 2011, 25, 4386–4393. [Google Scholar] [CrossRef]
- Ungureanu, D.; Țăranu, N.; Ghiga, D.A.; Isopescu, D.N.; Mihai, P.; Cozmanciuc, R. Diagonal Tensile Test on Masonry Panels Strengthened with Textile-Reinforced Mortar. Materials 2021, 14, 7021. [Google Scholar] [CrossRef] [PubMed]
- Shahzamani, S. , Eftekhar, M.R. Experimental study on using steel wires via the NSM method to improve the behaviour of masonry panels. Constr. Build. Mater. 2023, 385, 131473. [Google Scholar] [CrossRef]
- Angelillo, M.; Lourenço, P.B.; Milani, G. Masonry behaviour and modelling. In Mechanics of Masonry Structures – CISM International Centre for Mechanical Sciences book series, Angelillo, M., Eds.; Springer: Vienna, Austria, 2014; Volume 551, pp. 1–26. [Google Scholar] [CrossRef]
- Ferretti, E. A new Proposal for the Interpretation of the Diagonal Compression Test on Masonry Wallettes. Buildings, in prep.
- Park, J.G.; Kim, J.-G.; So, K. P.; Hwang, J. Y.; Kim, E. S.; Li, J.; Suh, D.; Lee, Y. H. Anisotropic mechanical properties and strengthening mechanism in superaligned carbon nanotubes-reinforced aluminum. Carbon 2019, 153, 513–524. [Google Scholar] [CrossRef]
- Ferretti, E. Shape-effect in the effective laws of plain and rubberized concrete. CMC-Comput. Mater. Contin. 2012, 30, 237–284. [Google Scholar] [CrossRef]
- Ferretti, E. DECM: A Discrete Element for Multiscale Modeling of Composite Materials Using the Cell Method. Materials 2020, 13, 880. [Google Scholar] [CrossRef] [PubMed]
- Ferretti, E. Cell Method Analysis of Crack Propagation in Tensioned Concrete Plates. CMES-Comp. Model. Eng. Sci. 2009, 54, 253–281. [Google Scholar] [CrossRef]
- Ferretti, E. A discrete nonlocal formulation using local constitutive laws. Int. J. Fract. 2004, 130, L175–L182. [Google Scholar] [CrossRef]
- Ferretti, E. On nonlocality and locality: Differential and discrete formulations. In Proceedings of the 11th International Conference on Fracture 2005—ICF11, Turin, Italy, 20–25 March 2005; International Congress on Fracture (ICF)—Curran Associates, Inc.: New York, USA, 2010; Volume 3, pp. 1728–1733. [Google Scholar]
- Stoica, D. About masonry walls ductility capacities calculation. In Proceedings of the 5th International Conference “Advanced Composite Materials Engineering” (COMAT 2014), Transilvania University of Braşov, Romania, 16-17 October 2014. [Google Scholar]
- Ferretti, F.; Incerti, A.; Mazzotti, C. EXPERIMENTAL STUDY ON THE SHEAR BEHAVIOR OF FRCM STRENGTHENED MASONRY PANELS. In Proceedings of the 12th International Conference on Structural Analysis of Historical Constructions (SAHC 2020), Barcelona, Spain, 30 July 2019. [Google Scholar]
- Konthesingha, K.M.C.; Masia, M.J.; Petersen, R.B.; Page, A.W. Experimental evaluation of static cyclic in-plane shear behavior of unreinforced masonry walls strengthened with NSM FRP strips, J. Compos. Constr. 2014, 19. [Google Scholar] [CrossRef]
- Babaeidarabad, S. Masonry walls strengthened with fabric-reinforced cementitious matrix composite subjected to in-plane and out-of-plane load. PhD Thesis, University of Miami, Florida, USA, 2013. [Google Scholar]
- Li, T.; Galati, N.; Tumialan, J.G.; Nanni, A. Analysis of unreinforced masonry concrete walls strengthened with glass fiber-reinforced polymer bars, ACI Struct. J. 2005, 102, 569–577. [Google Scholar]
- Mahmood, H.; Ingham, J.M. Diagonal Compression Testing of FRP-Retrofitted Unreinforced Clay Brick Masonry Wallettes. J. Compos. Constr. 2011, 15, 810–820. [Google Scholar] [CrossRef]
- Petersen, R.B.; Ismail, N.; Masia, M.J.; Ingham, J.M. Finite element modeling of unreinforced masonry shear walletts strengthened using twisted steel bars. Constr. Build. Mater. 2012, 33, 14–24. [Google Scholar] [CrossRef]
- Standard test methods for cyclic (reversed) load test for shear resistance of vertical elements of the lateral force resisting systems for buildings; ASTM E2126−11; ASTM International: West Conshohocken, PA, USA, 2011.
- Turnšek, V.; Čačovič, F. Some experimental results on the strength of brick masonry walls. In Proceedings of the 2nd International Brick Masonry Conference, Stoke-on-Trent, UK, 12–15 April 1970; pp. 149–156. [Google Scholar]
- Mann, W.; Müller, H. Failure of shear-stressed masonry—An enlarged theory, tests and application to shear-walls. Proc. Br. Ceram. Soc. 1982, 30, 223–235. [Google Scholar]
- Alecci, V.; Fagone, M.; Rotunno, T.; de Stefano, M. Shear strength of brick masonry walls assembled with different types of mortar. Constr. Build. Mater. 2013, 40, 1038–1045. [Google Scholar] [CrossRef]
- Borri, A.; Castori, G.; Corradi, M. Determination of Shear Strength of Masonry Panels Through Different Tests. Int. J. Archit. Herit. 2015, 9, 913–927. [Google Scholar] [CrossRef]
- Aliabadi, M.H. Boundary Element Methods in Linear Elastic Fracture Mechanics, Comprehensive Structural Integrity, 3, 2003, 89–125. [CrossRef]
- Frocht, M.M. Recent advances in photoelasticity. ASME Transactions 1931, 55, (Sept–Dec). [Google Scholar]
- Allison, L. The pole of the Mohr diagram. J. Struct. Geol. 1984, 6, 331–333. [Google Scholar] [CrossRef]
Figure 1.
How a seismic event loads a wall: (a) In the plane of the wall (shear loading in the midplane); (b) Along the direction perpendicular to the plane of the wall (out-of-plane loading).
Figure 1.
How a seismic event loads a wall: (a) In the plane of the wall (shear loading in the midplane); (b) Along the direction perpendicular to the plane of the wall (out-of-plane loading).
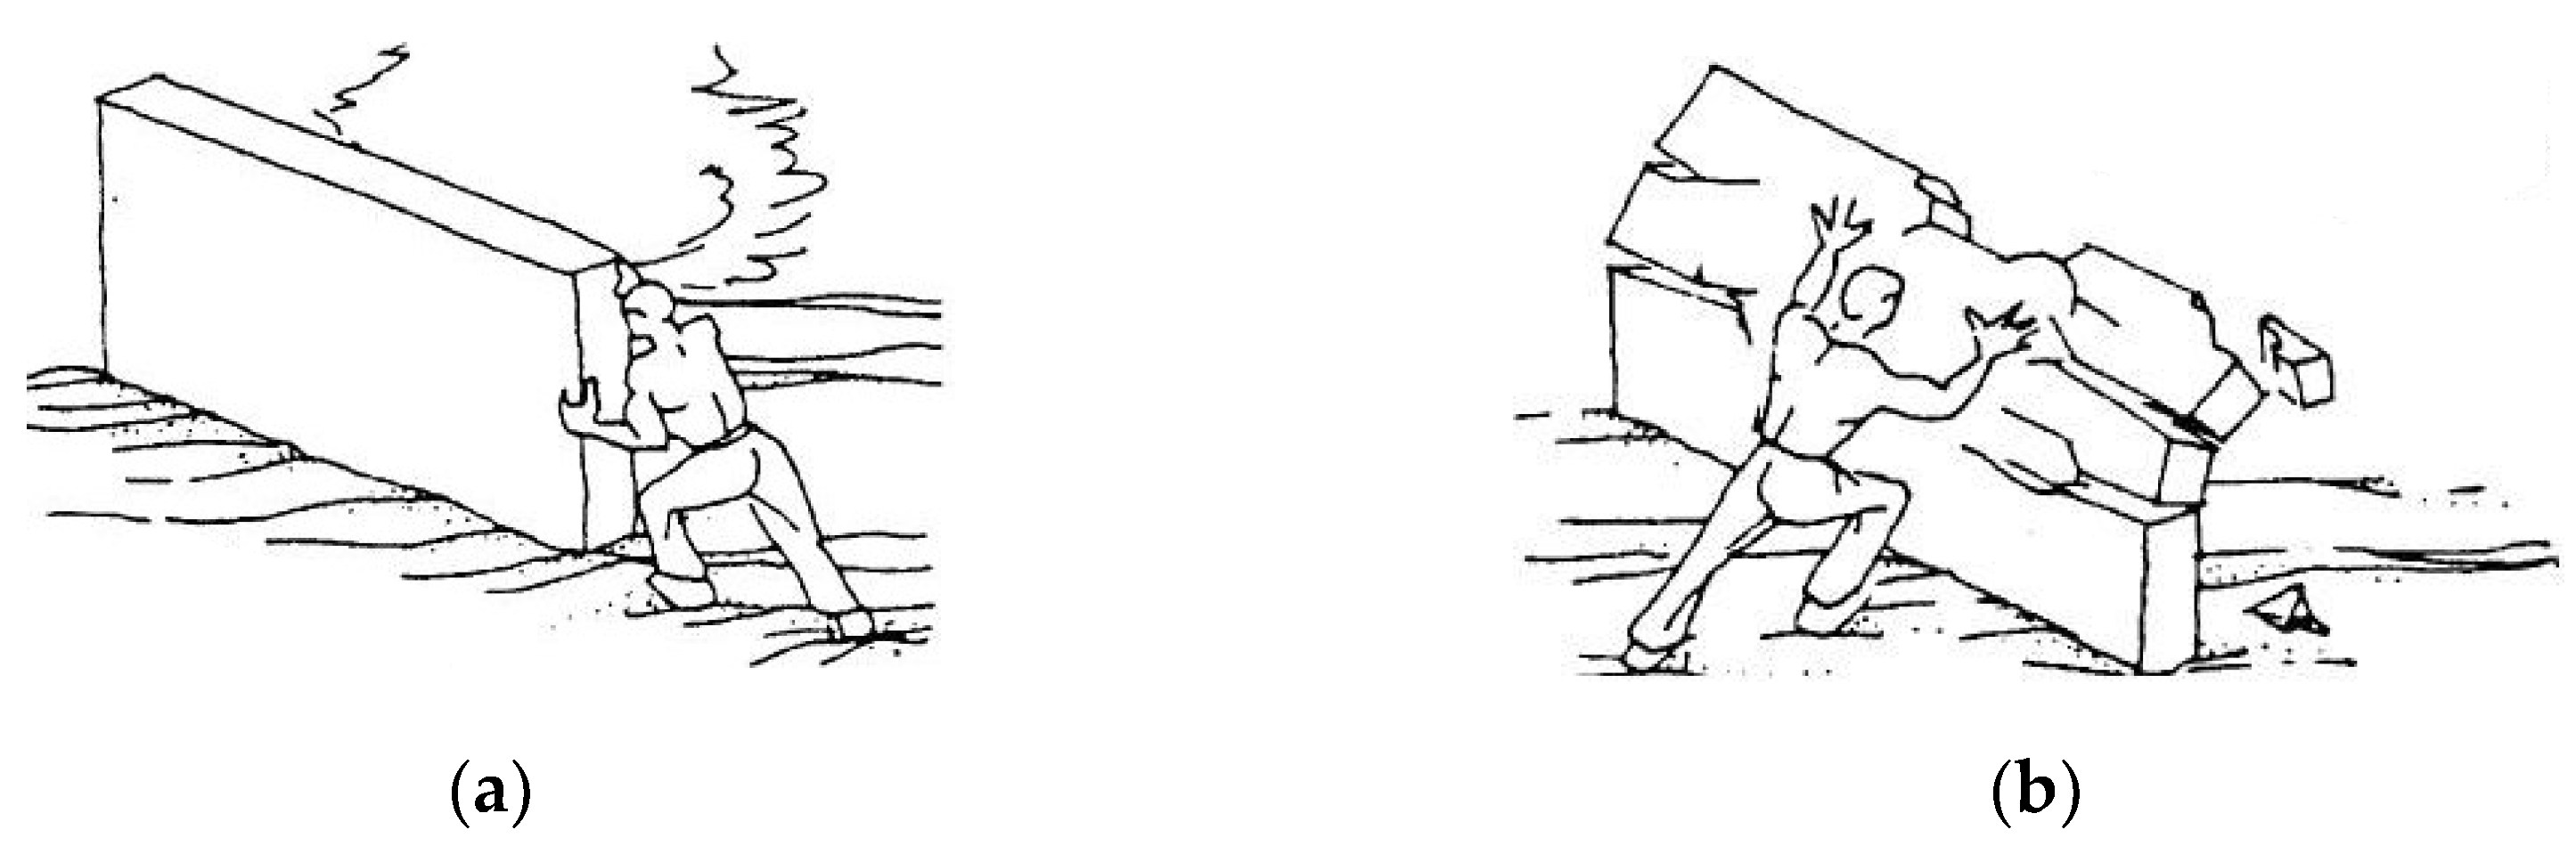
Figure 2.
Lability of the CAM® System with a rectangular arrangement: (a) In the wall plane; (b) In the wall thickness.
Figure 2.
Lability of the CAM® System with a rectangular arrangement: (a) In the wall plane; (b) In the wall thickness.
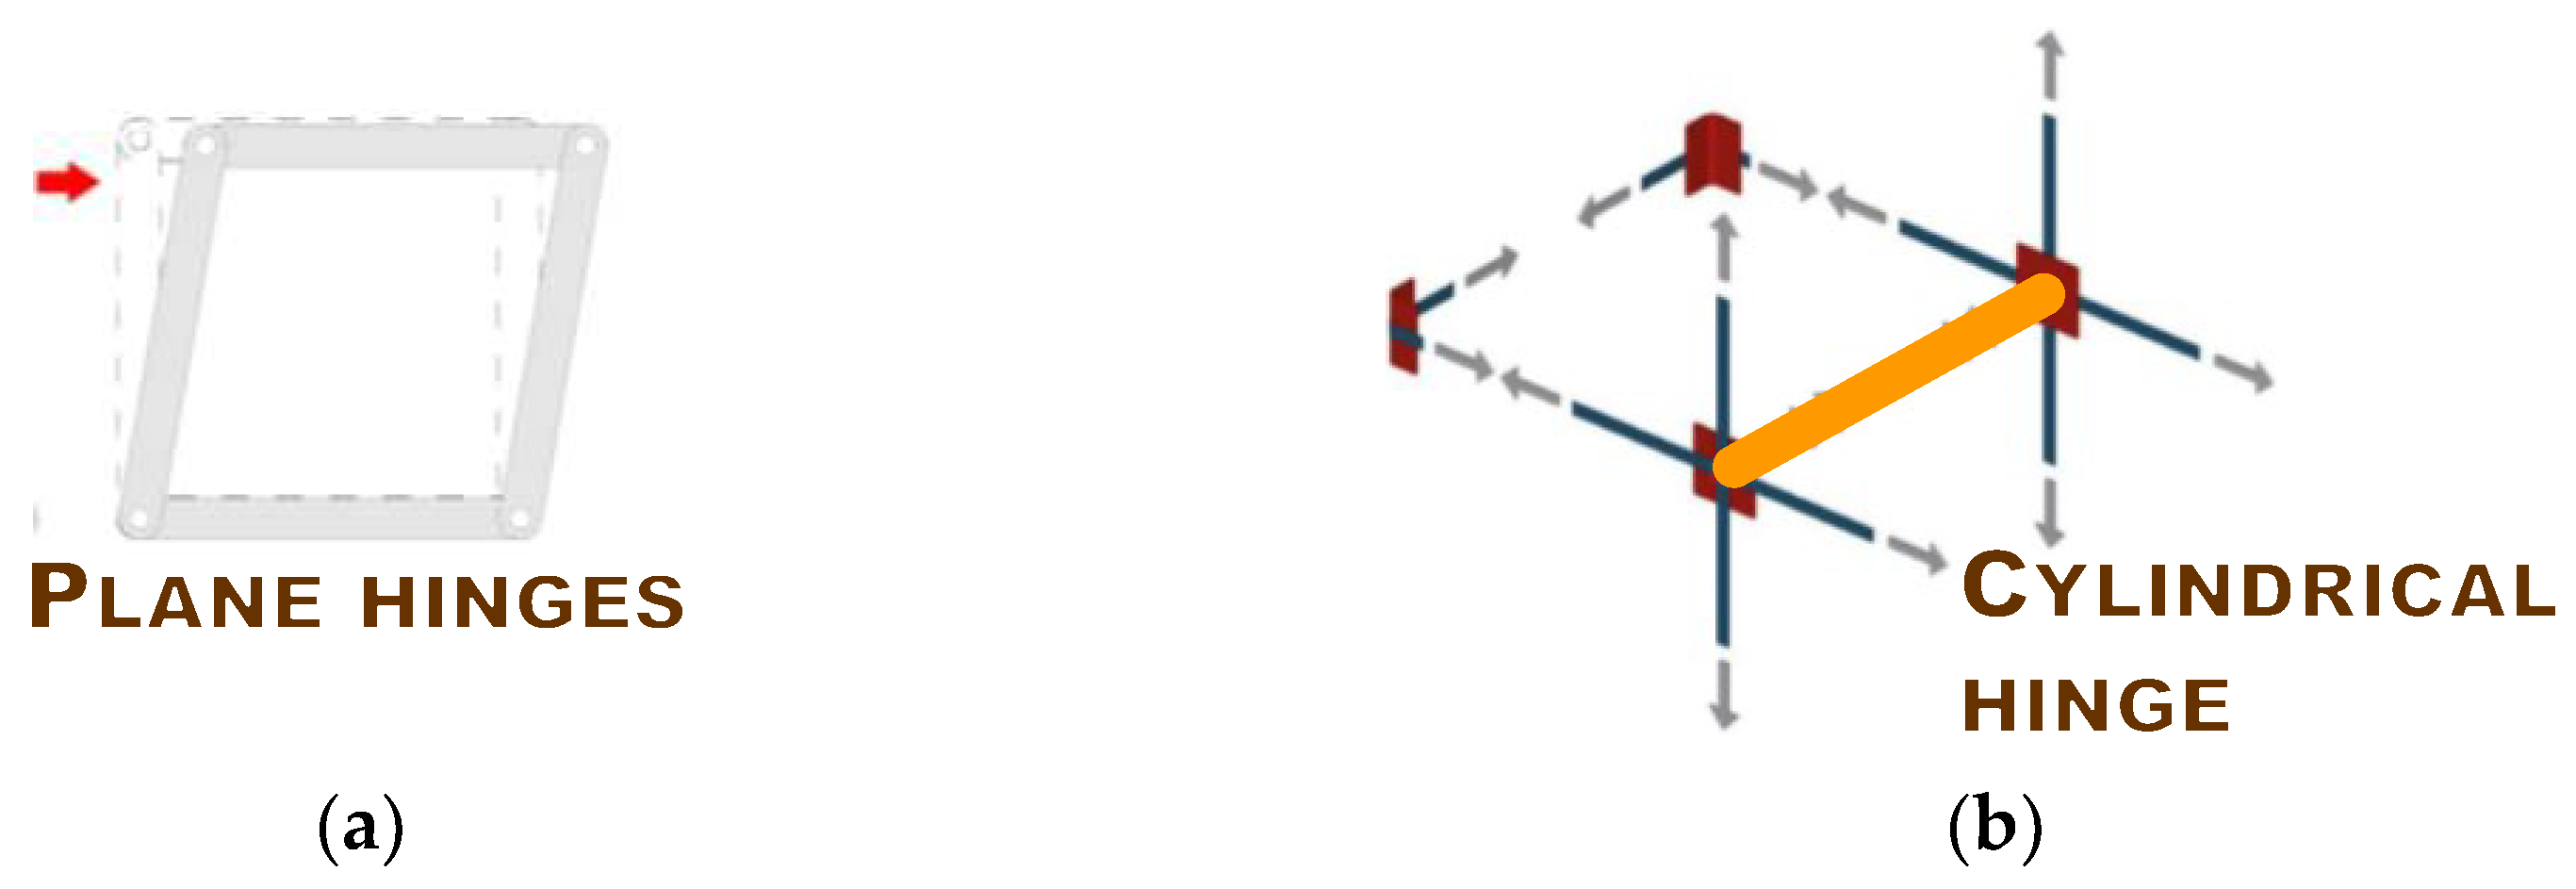
Figure 3.
Bracing of a rectangle made of hinged strips: (a) By adding a strip along a diagonal, which will prevent the rectangle from collapsing in one direction but not the other; (b) By adding strips along both diagonals, which will prevent the rectangle from collapsing in either direction.
Figure 3.
Bracing of a rectangle made of hinged strips: (a) By adding a strip along a diagonal, which will prevent the rectangle from collapsing in one direction but not the other; (b) By adding strips along both diagonals, which will prevent the rectangle from collapsing in either direction.
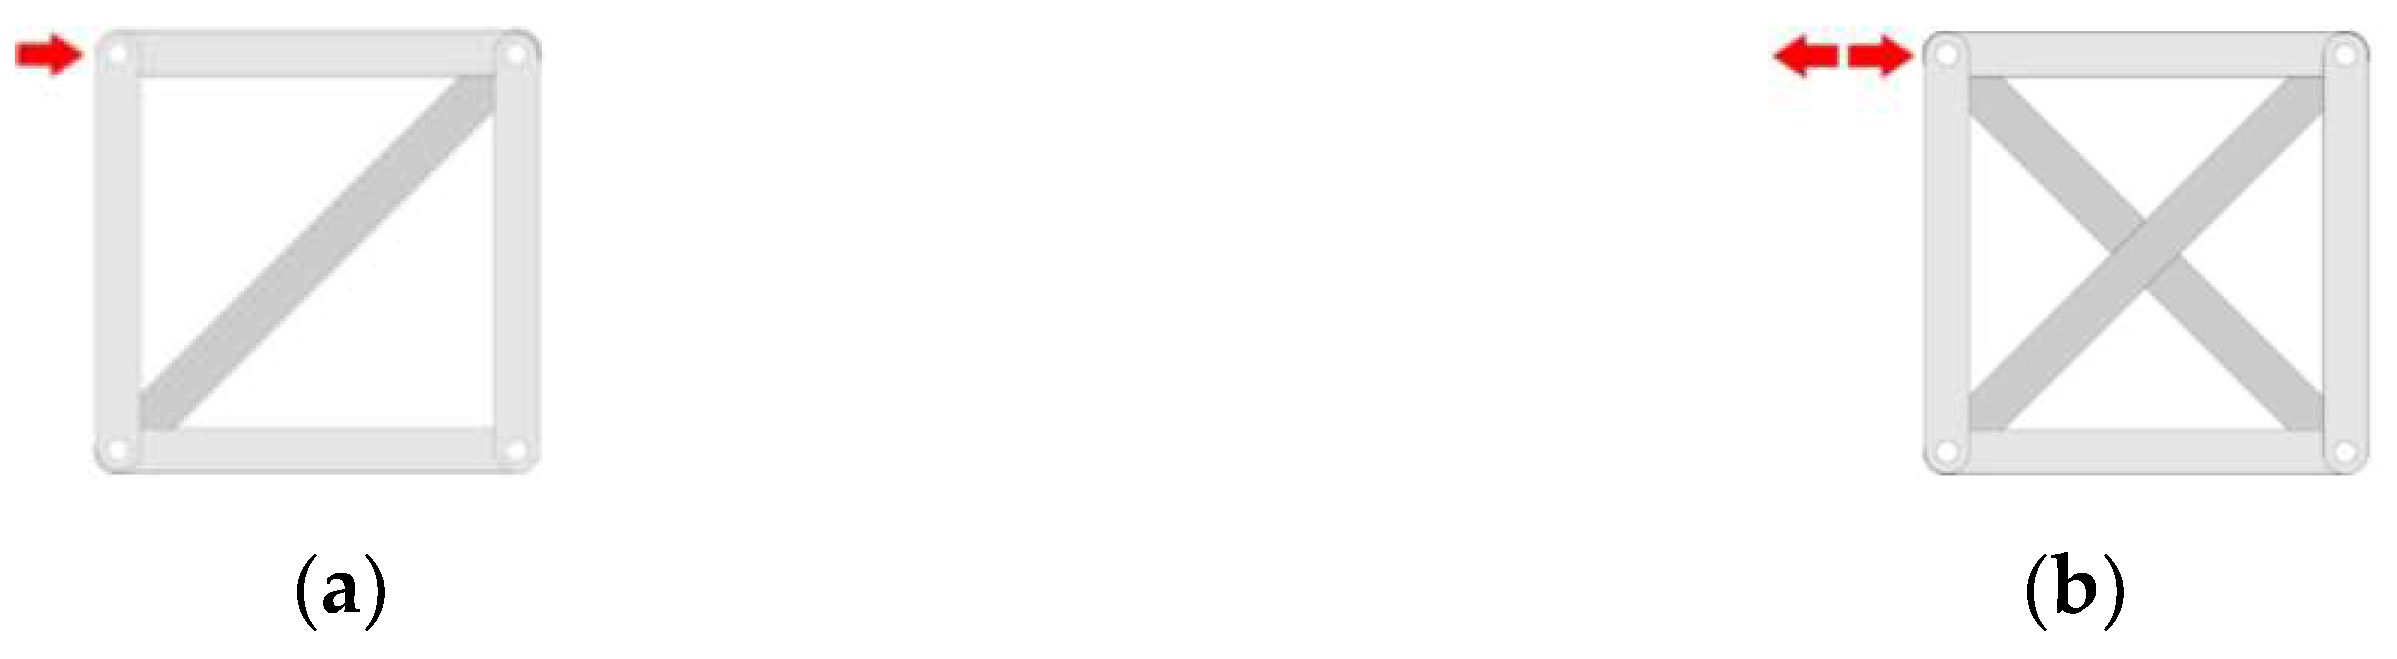
Figure 4.
Geometric characteristics of the single-headed masonry specimens (all dimensions in mm): (a) Side view; (b) Front view.
Figure 4.
Geometric characteristics of the single-headed masonry specimens (all dimensions in mm): (a) Side view; (b) Front view.
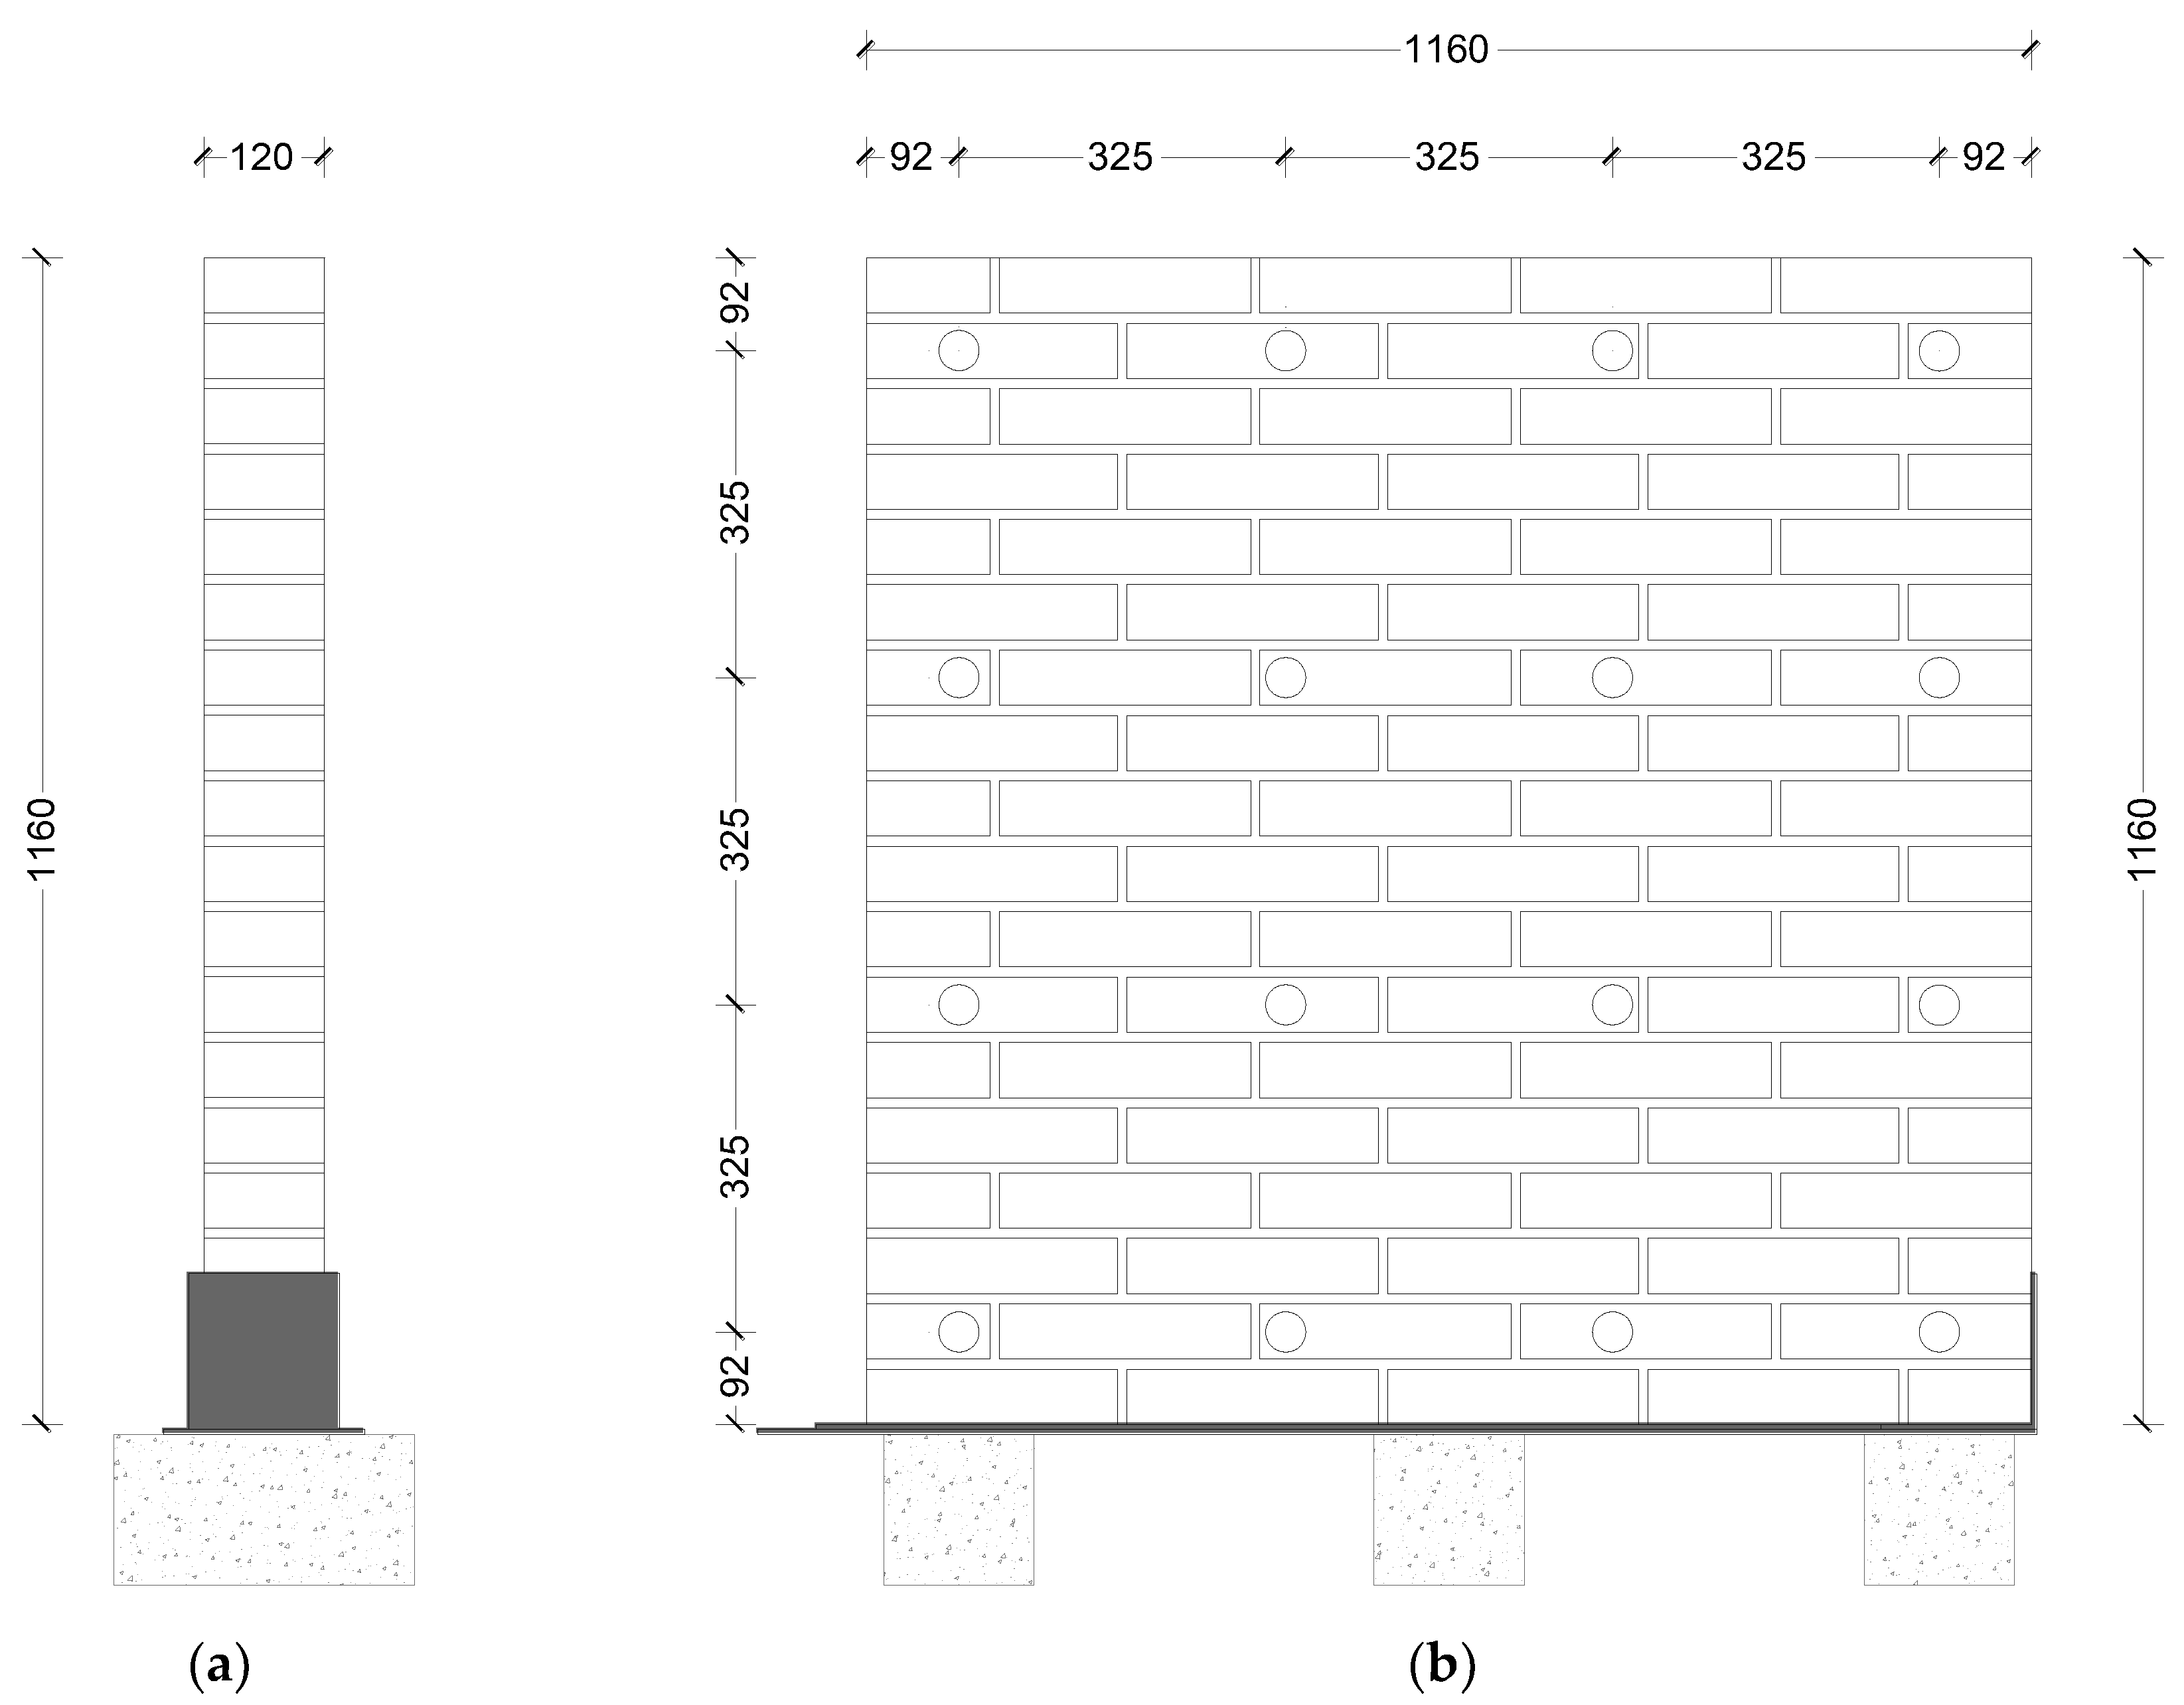
Figure 5.
The three specimens of the experimental program: (a) Specimen M1-90; (b) Specimen M1-45 and (c) Specimen M2-45.
Figure 5.
The three specimens of the experimental program: (a) Specimen M1-90; (b) Specimen M1-45 and (c) Specimen M2-45.
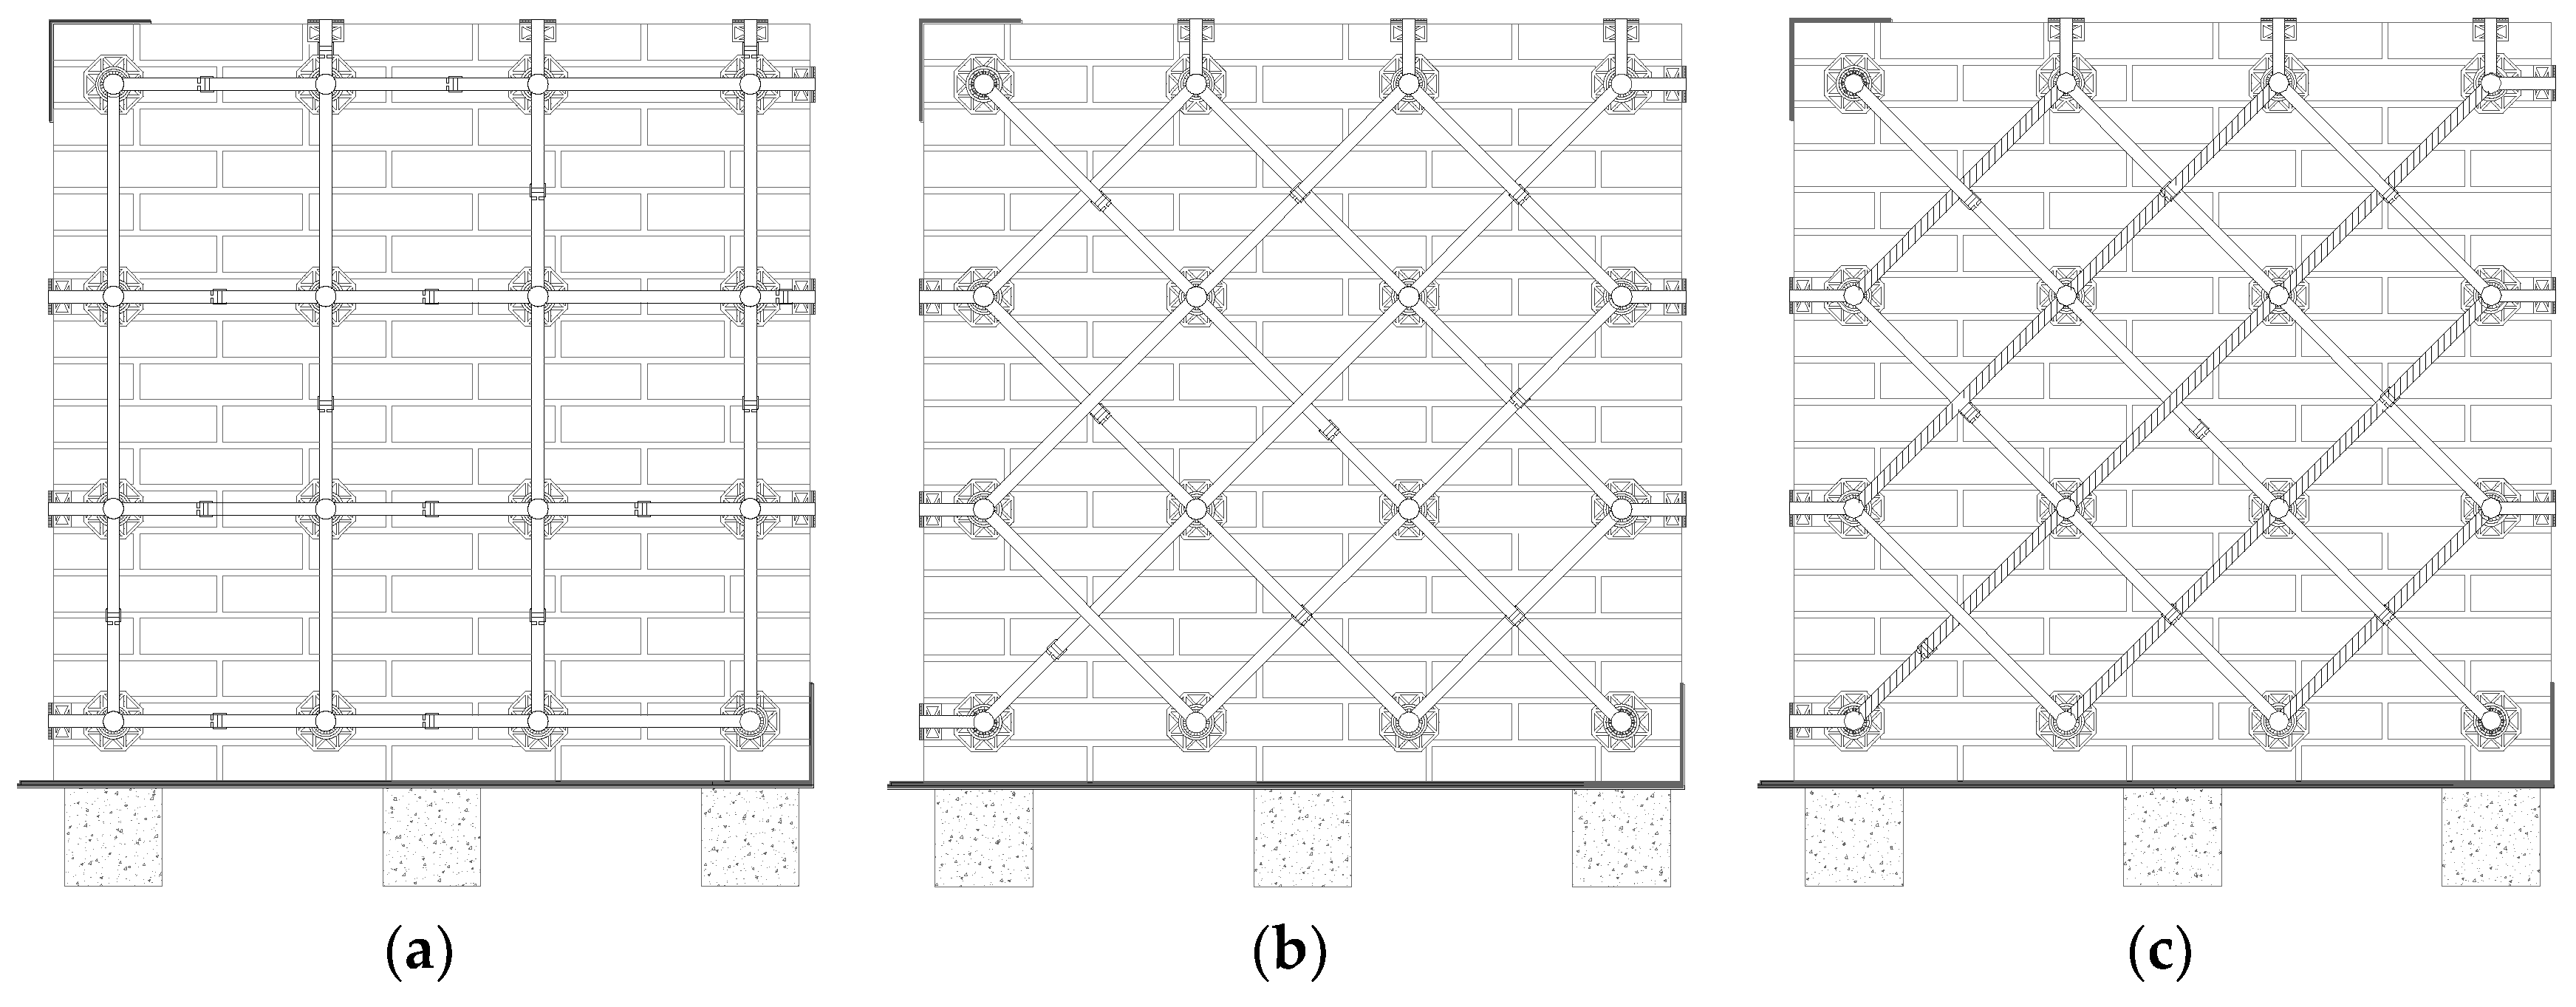
Figure 6.
Appearance of the specimen PC2: (a) Before the compression test and (b) After the compression test.
Figure 6.
Appearance of the specimen PC2: (a) Before the compression test and (b) After the compression test.
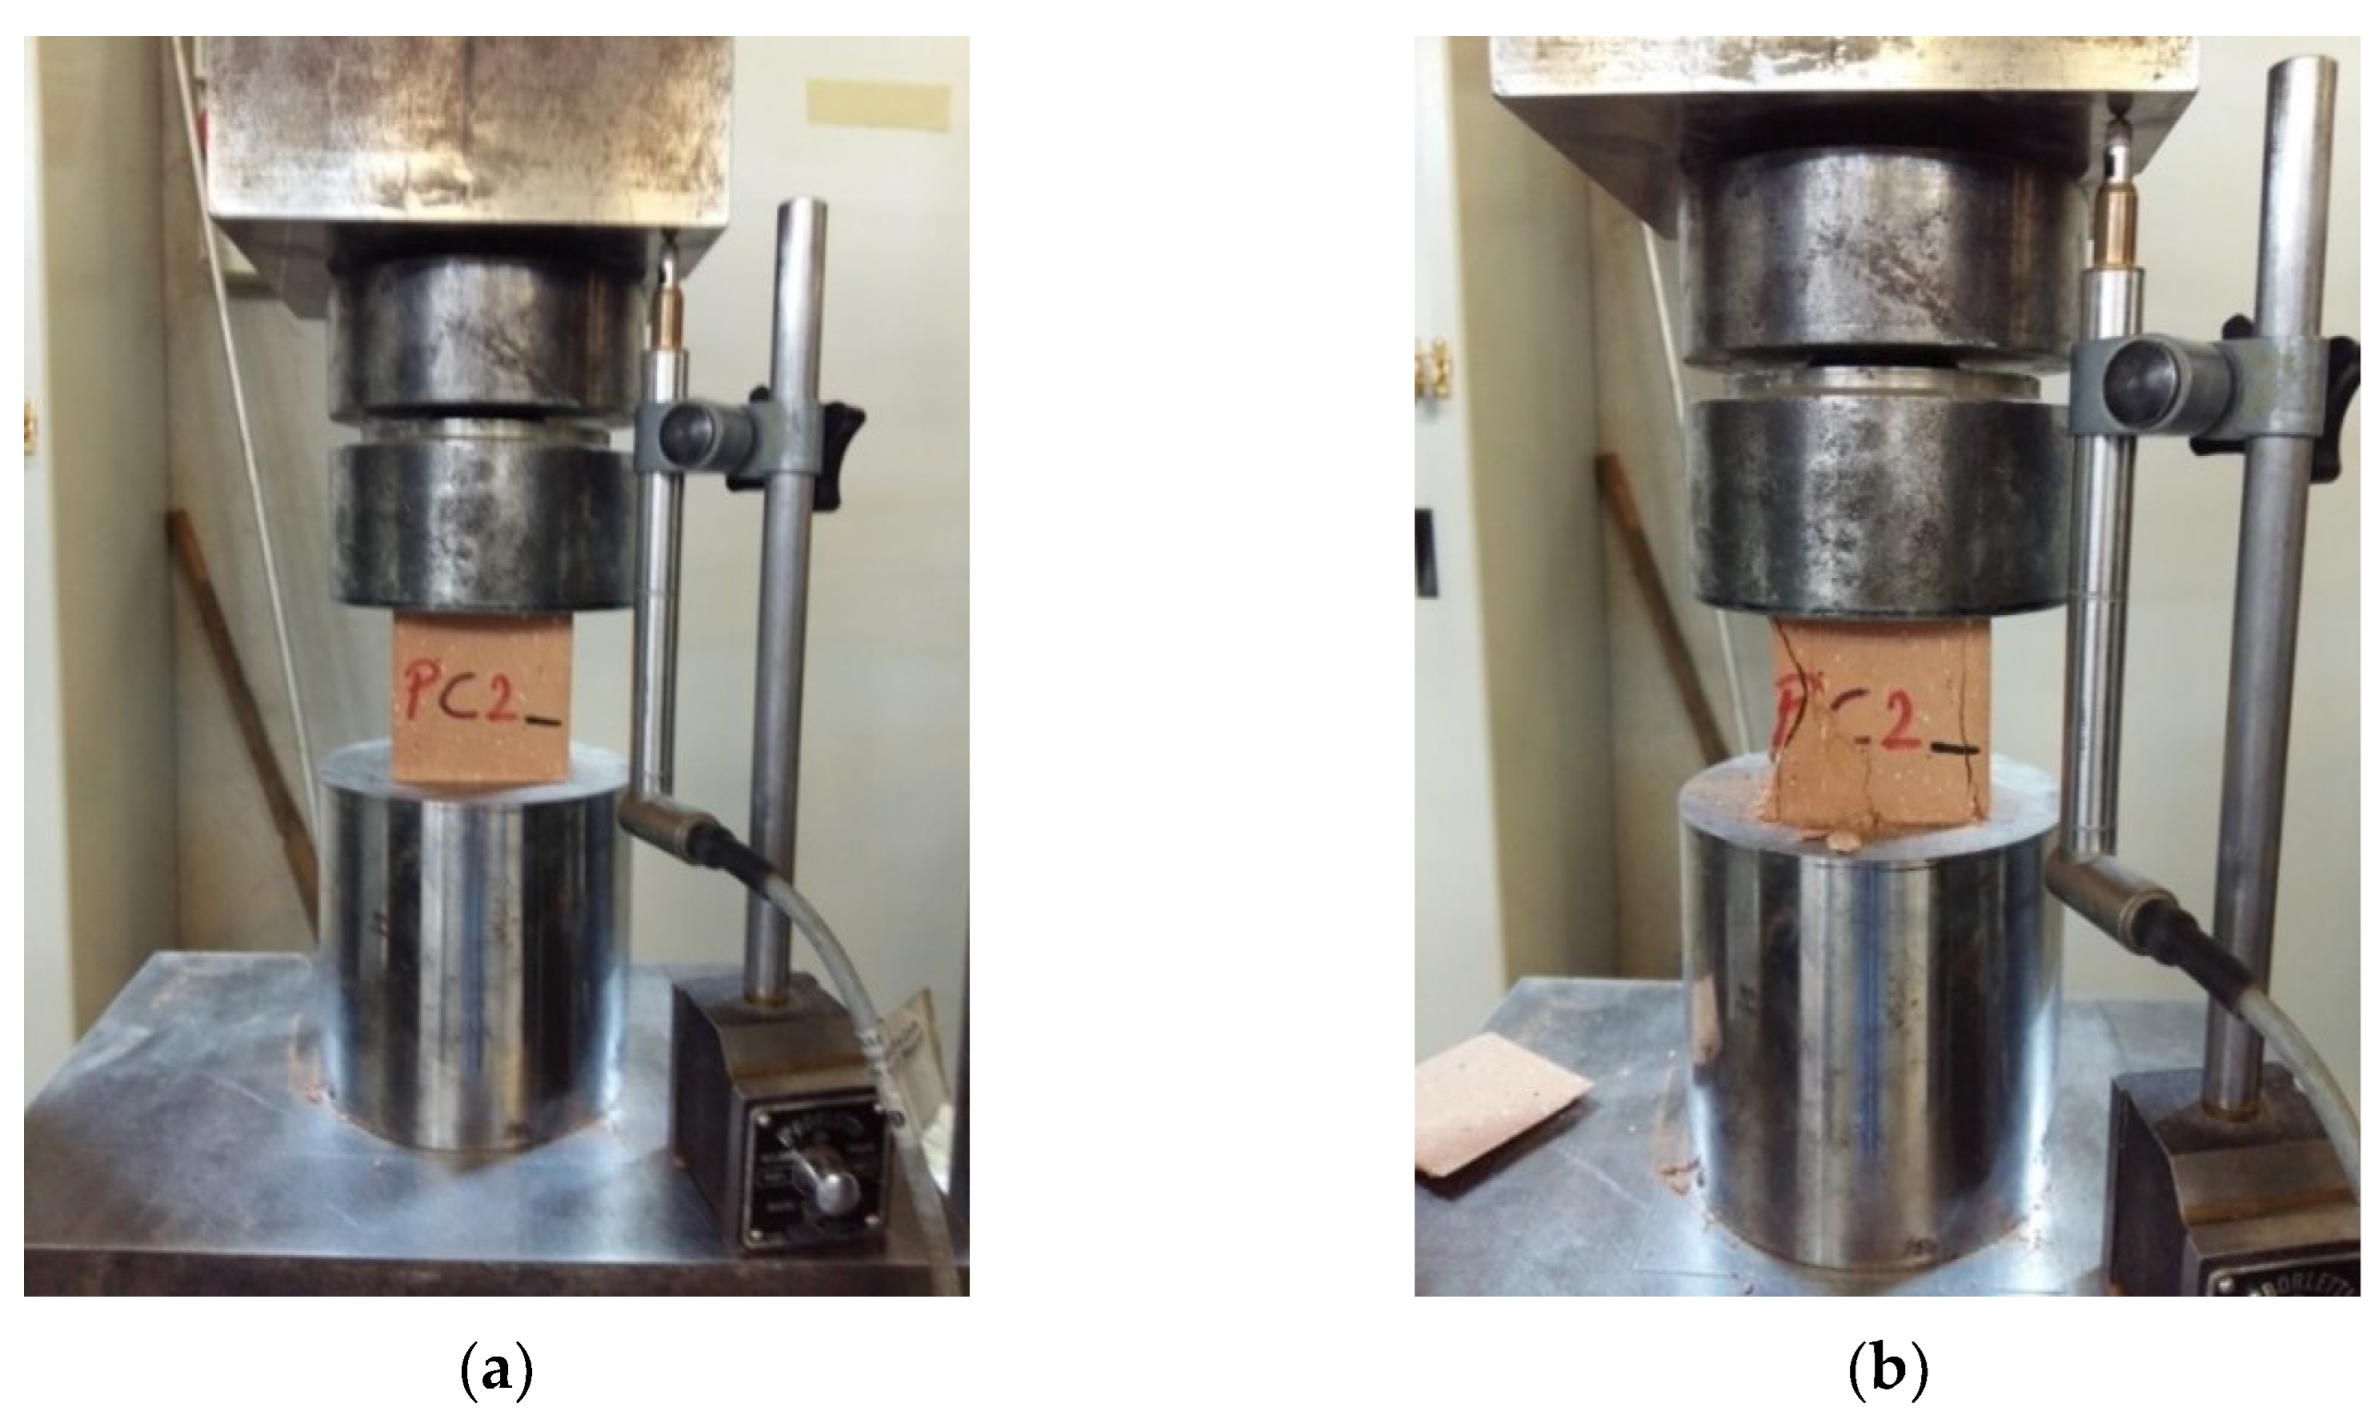
Figure 7.
Mechanical characterization of the mortar according to the UNI EN 1015-11:2019 standard: (a) Set-up of the three-point bending flexural test (dimensions in mm); (b) Uniaxial compression test on one of the two half-prisms originating from the flexural test.
Figure 7.
Mechanical characterization of the mortar according to the UNI EN 1015-11:2019 standard: (a) Set-up of the three-point bending flexural test (dimensions in mm); (b) Uniaxial compression test on one of the two half-prisms originating from the flexural test.
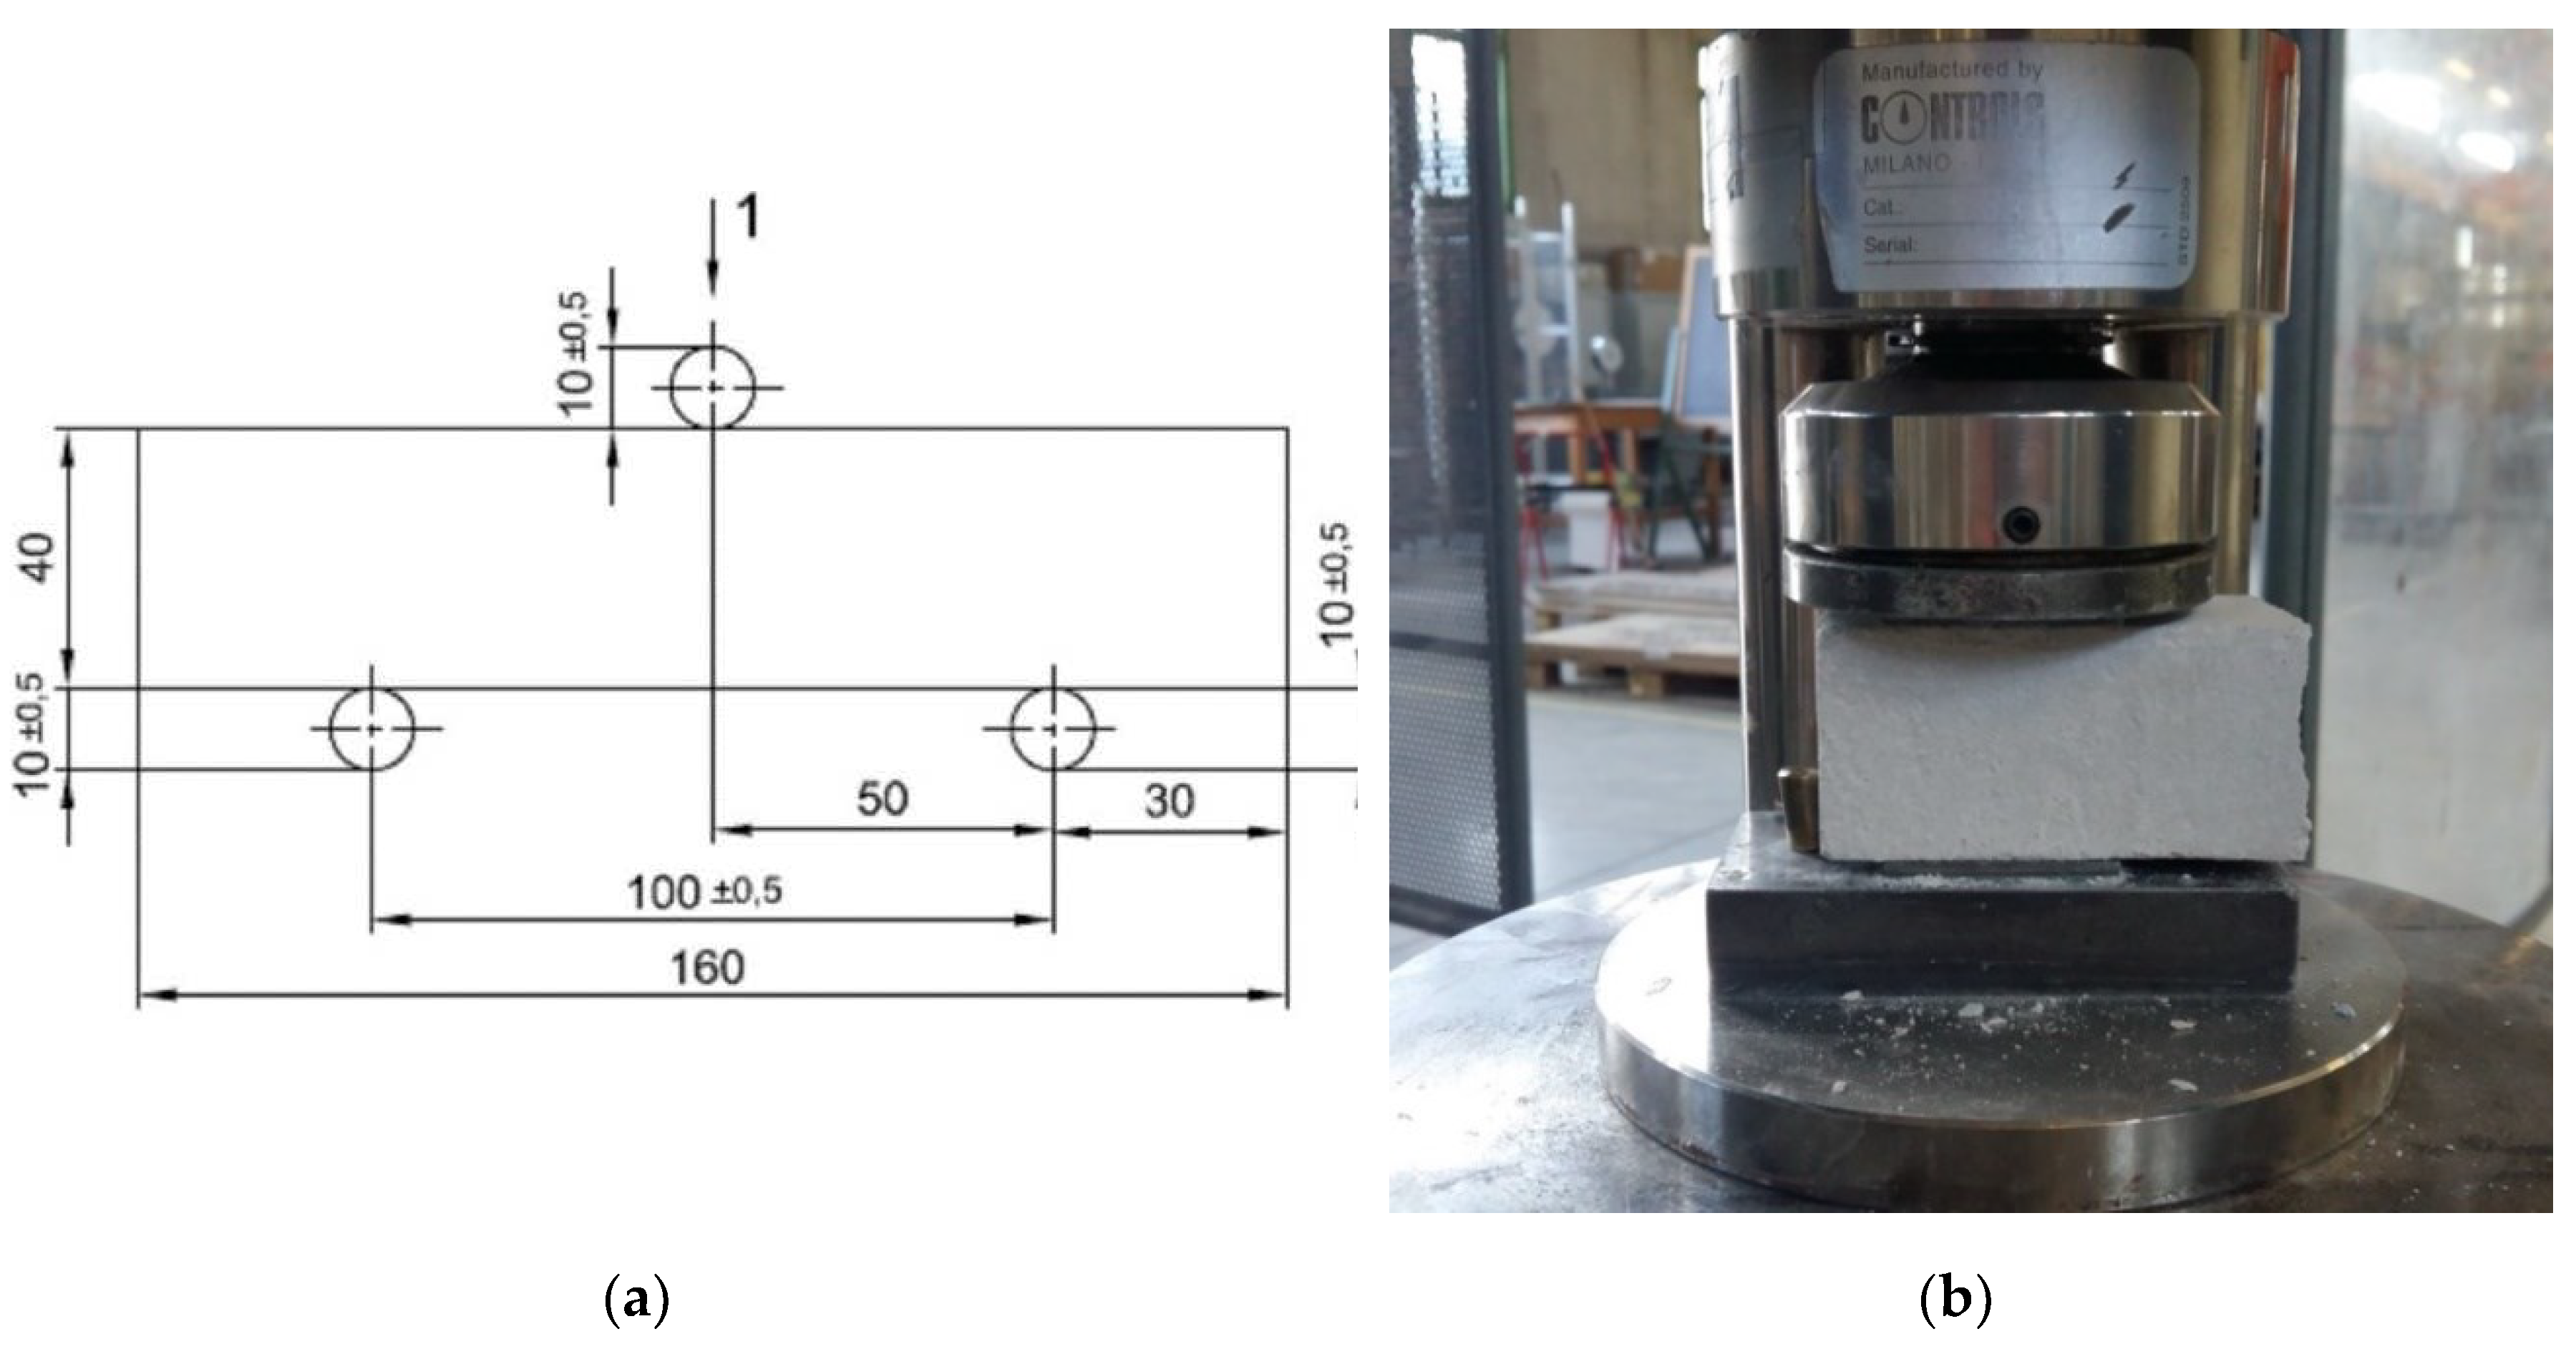
Figure 8.
The elements of the active strengthening system: (a) A stainless steel strap closed to form a ring (before tightening the seal); (b) A stainless steel seal used for the strap ring closure.
Figure 8.
The elements of the active strengthening system: (a) A stainless steel strap closed to form a ring (before tightening the seal); (b) A stainless steel seal used for the strap ring closure.
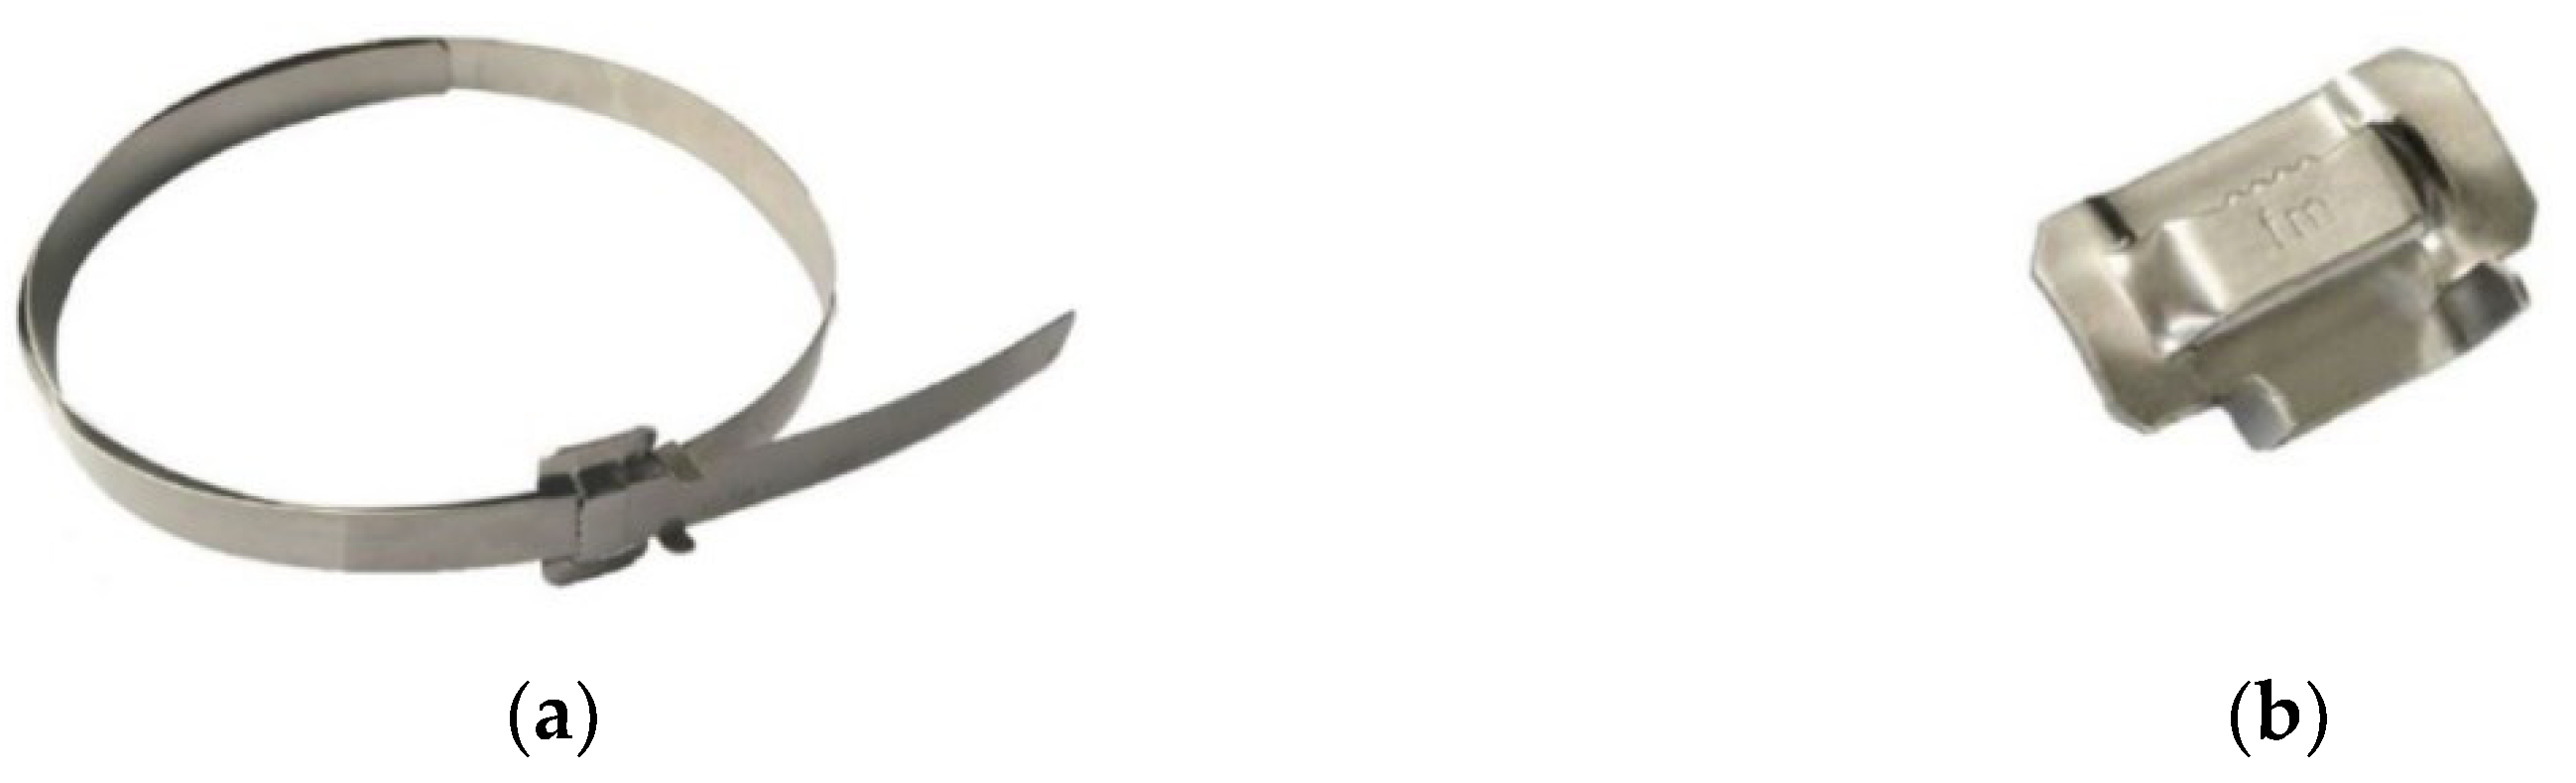
Figure 9.
Stress/strain diagrams of the four specimens for the mechanical characterization of the straps.
Figure 9.
Stress/strain diagrams of the four specimens for the mechanical characterization of the straps.
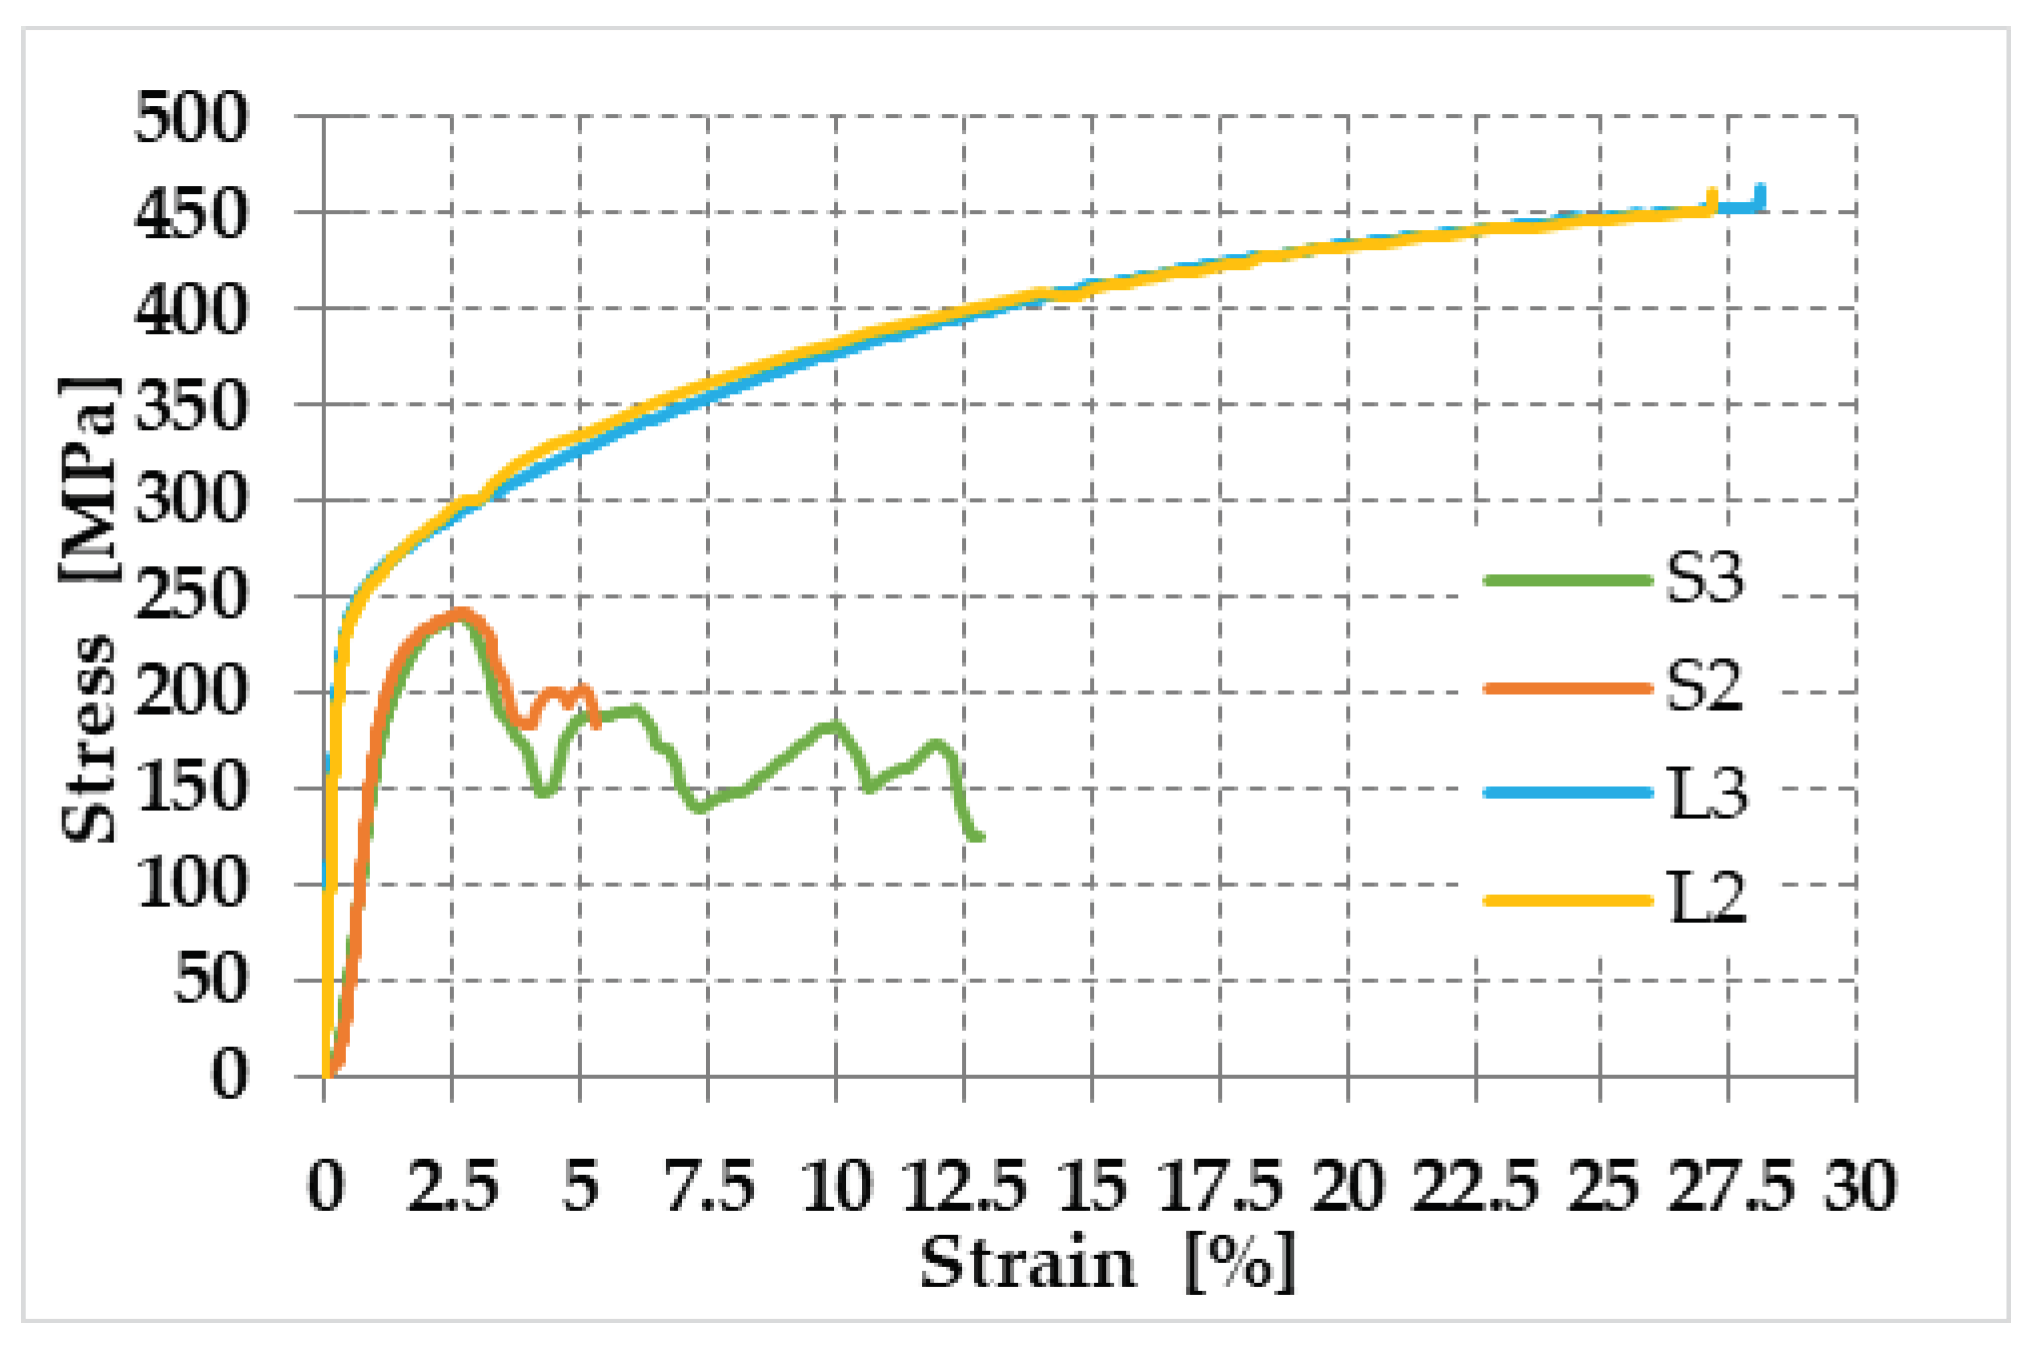
Figure 10.
3D printed elements for the protection of: (a) The edges of the walls (rounded angles) and (b) The new edges generated by the perforations for the passage of the straps (funnel plates).
Figure 10.
3D printed elements for the protection of: (a) The edges of the walls (rounded angles) and (b) The new edges generated by the perforations for the passage of the straps (funnel plates).
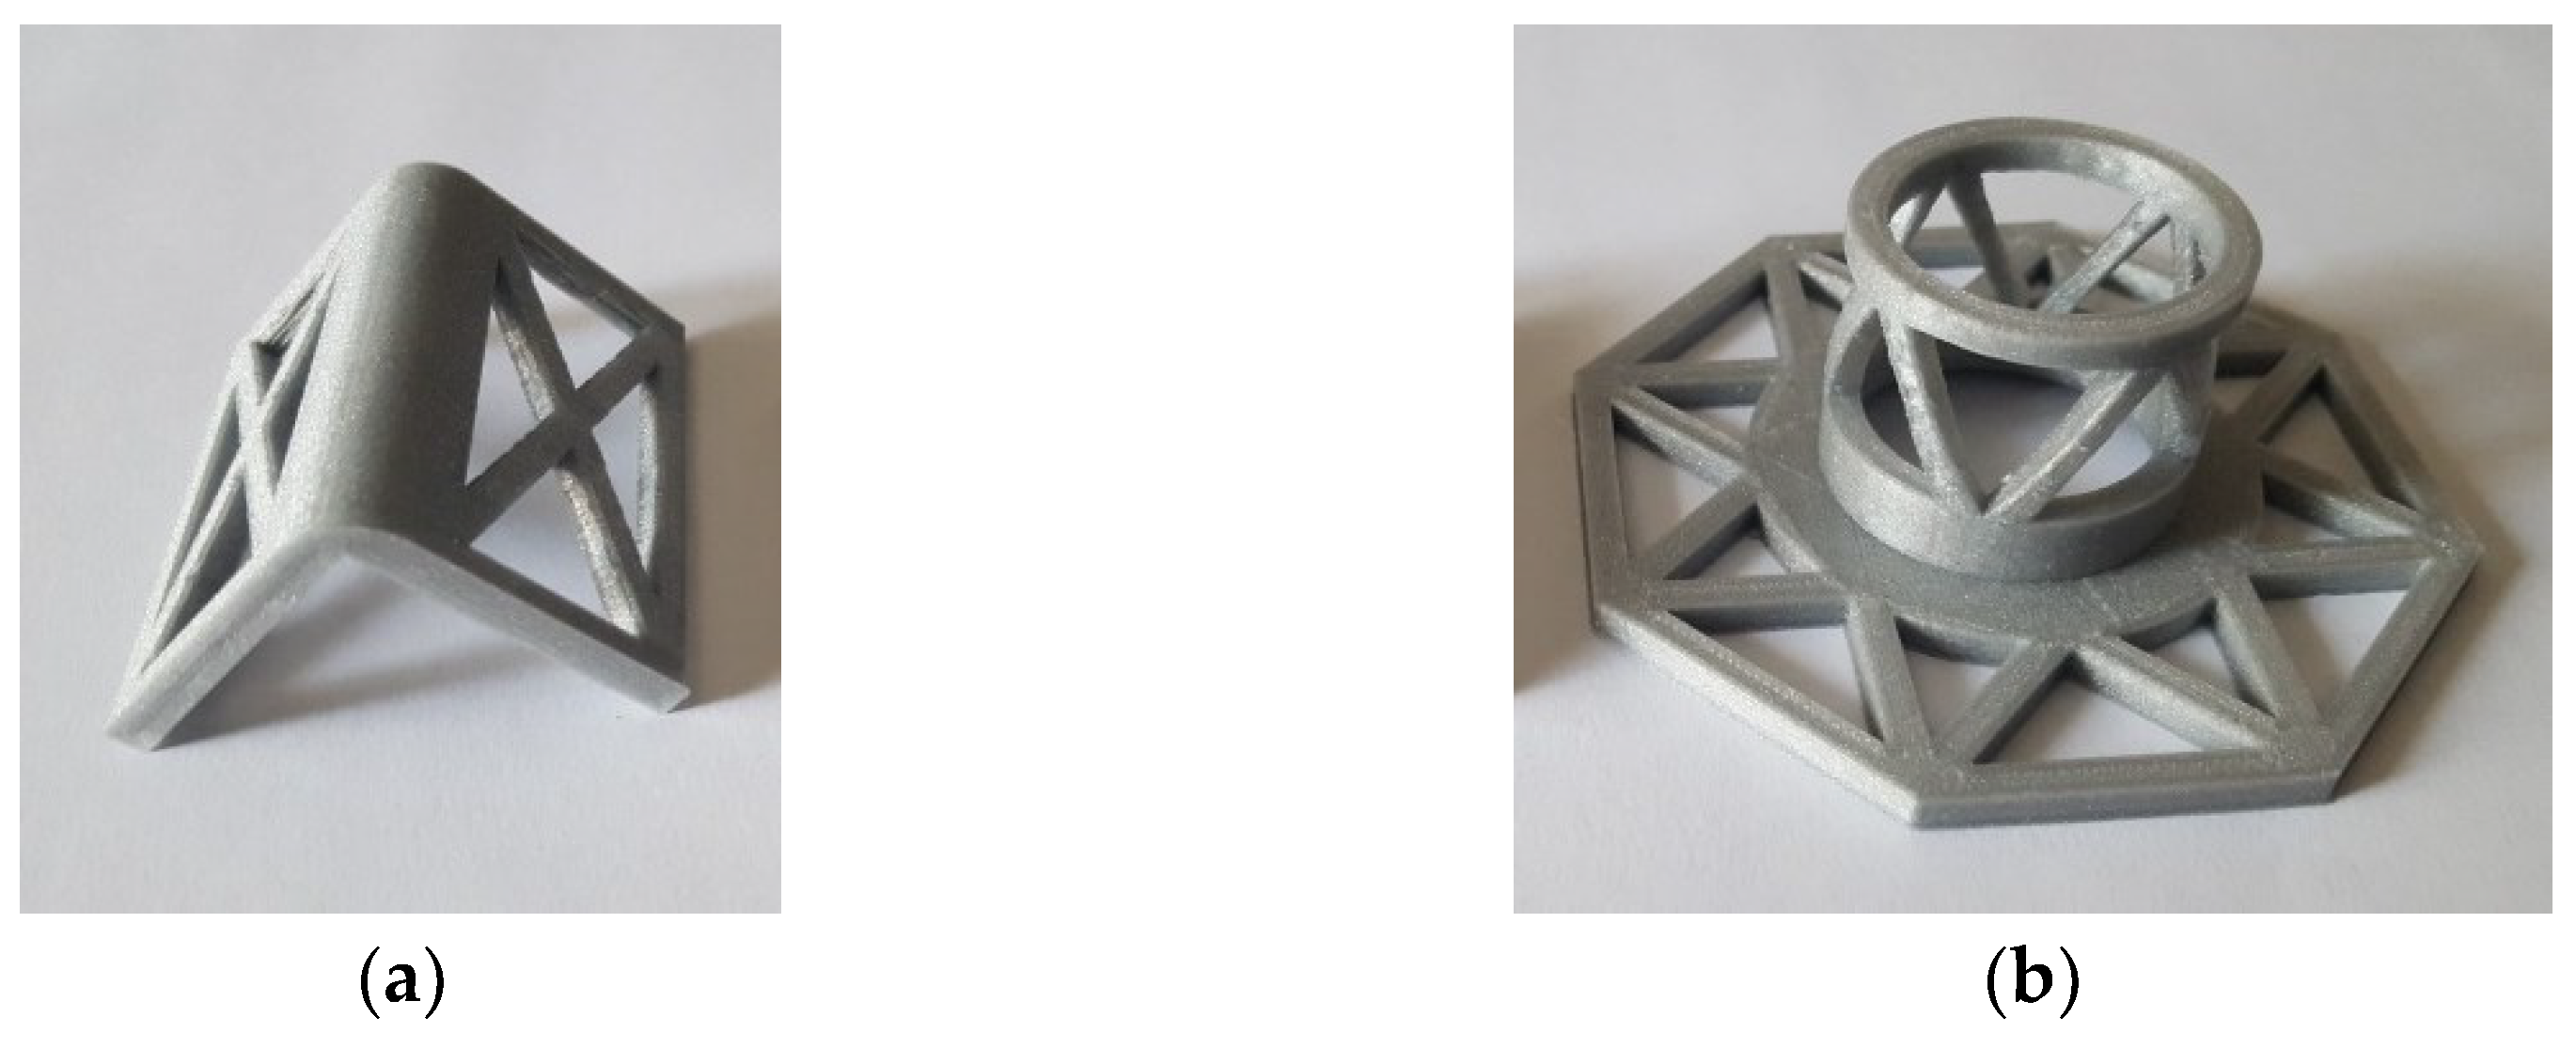
Figure 11.
The 3D printed elements applied with mortar on the specimens: (a) Rounded angles; (b) Funnel plates.
Figure 11.
The 3D printed elements applied with mortar on the specimens: (a) Rounded angles; (b) Funnel plates.
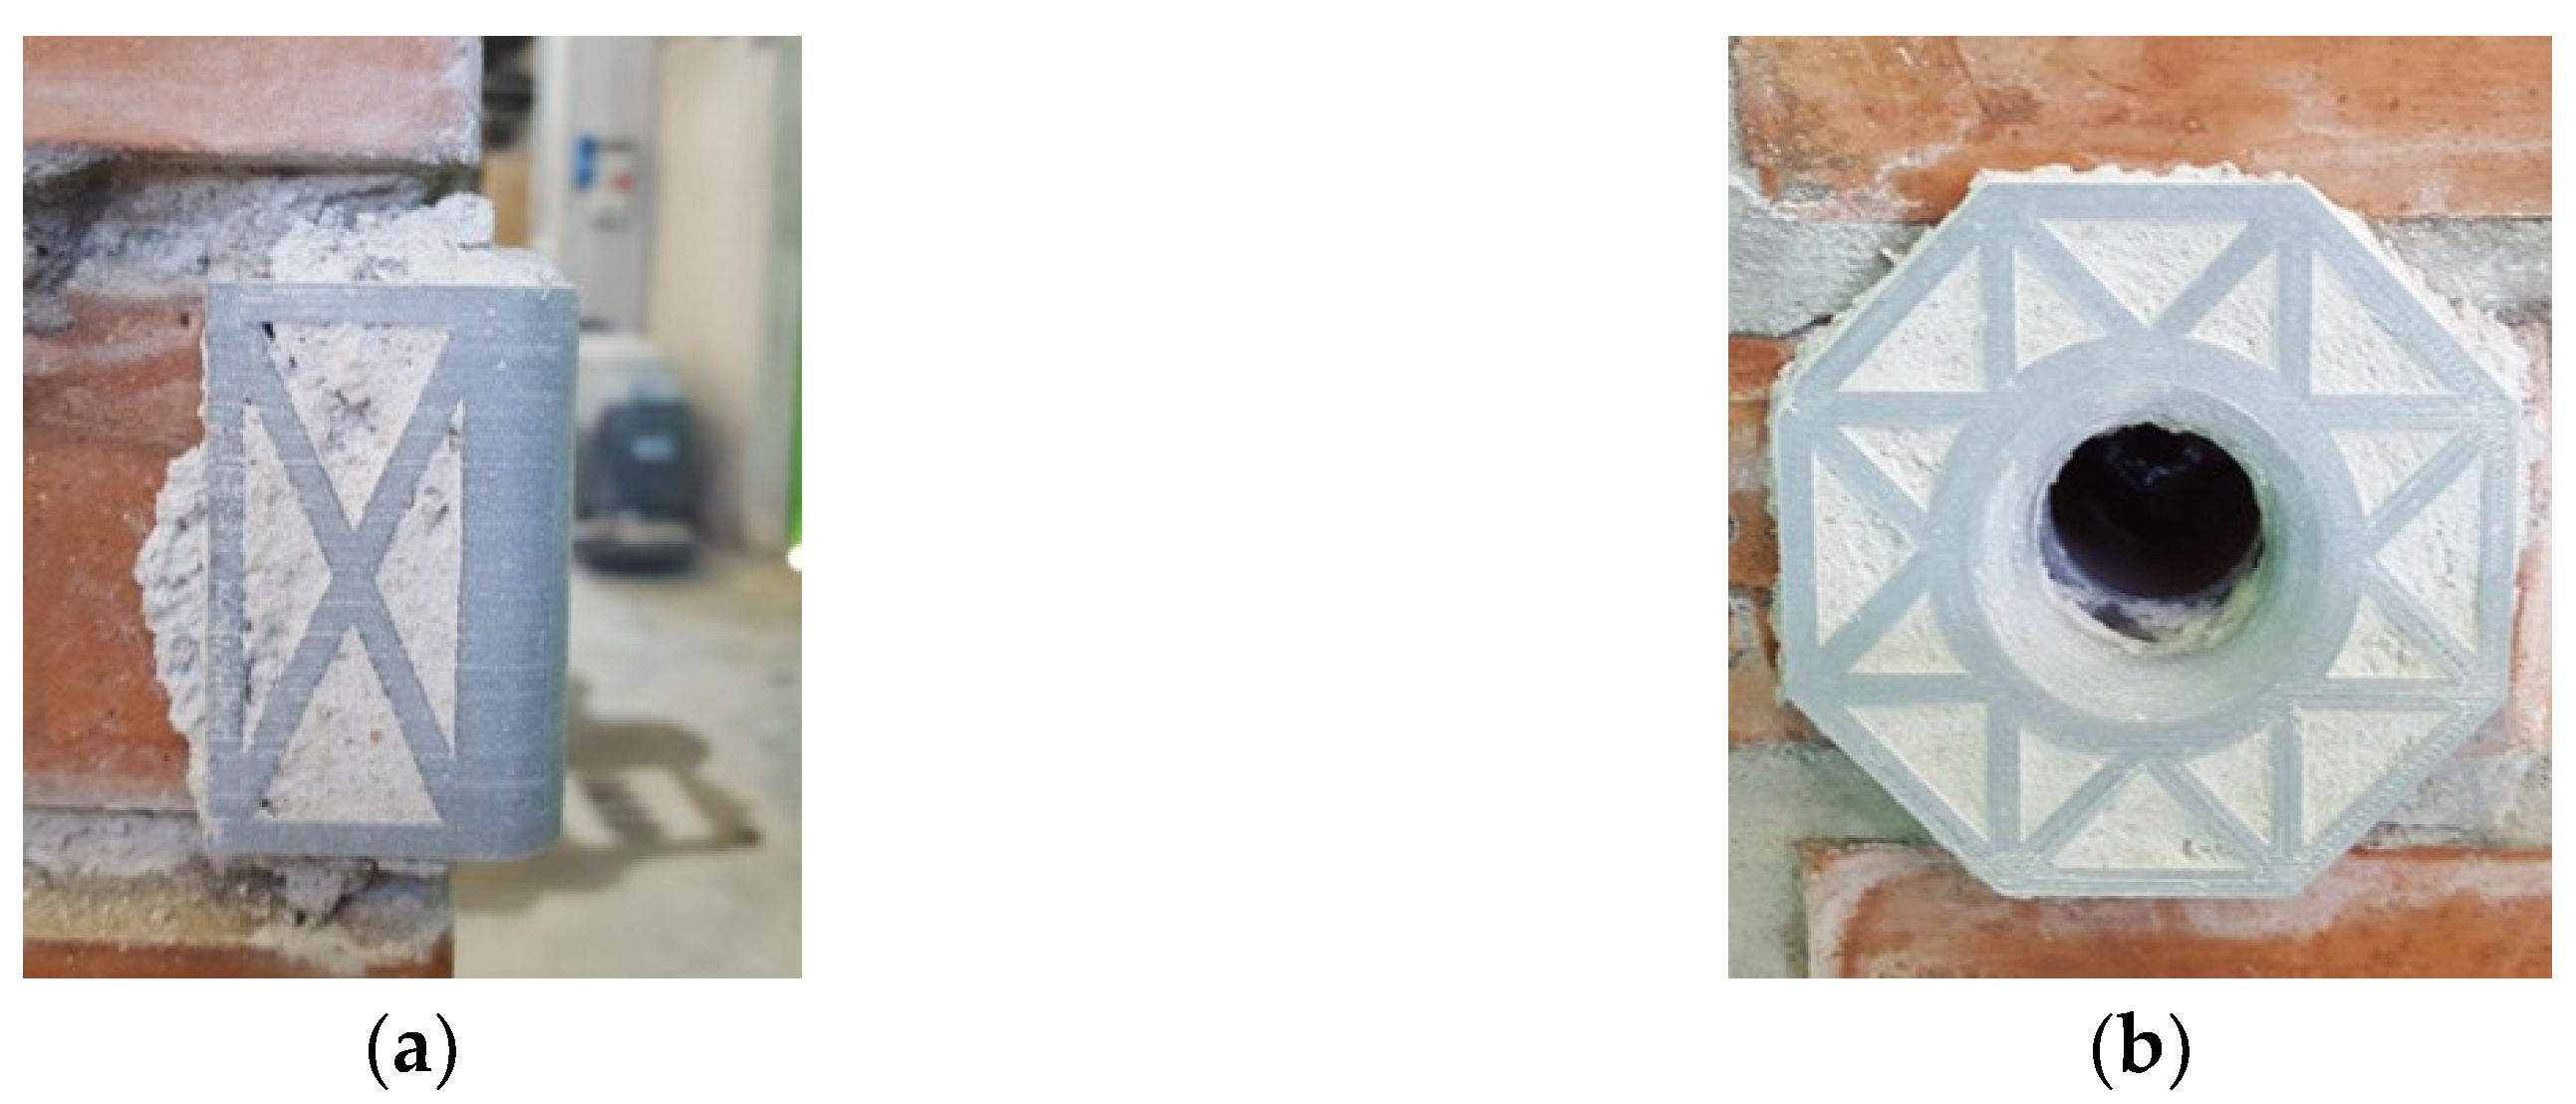
Figure 12.
Preparatory stages for laying bricks: (a) Core drilling of a brick; (b) Drying of bricks after core drilling.
Figure 12.
Preparatory stages for laying bricks: (a) Core drilling of a brick; (b) Drying of bricks after core drilling.
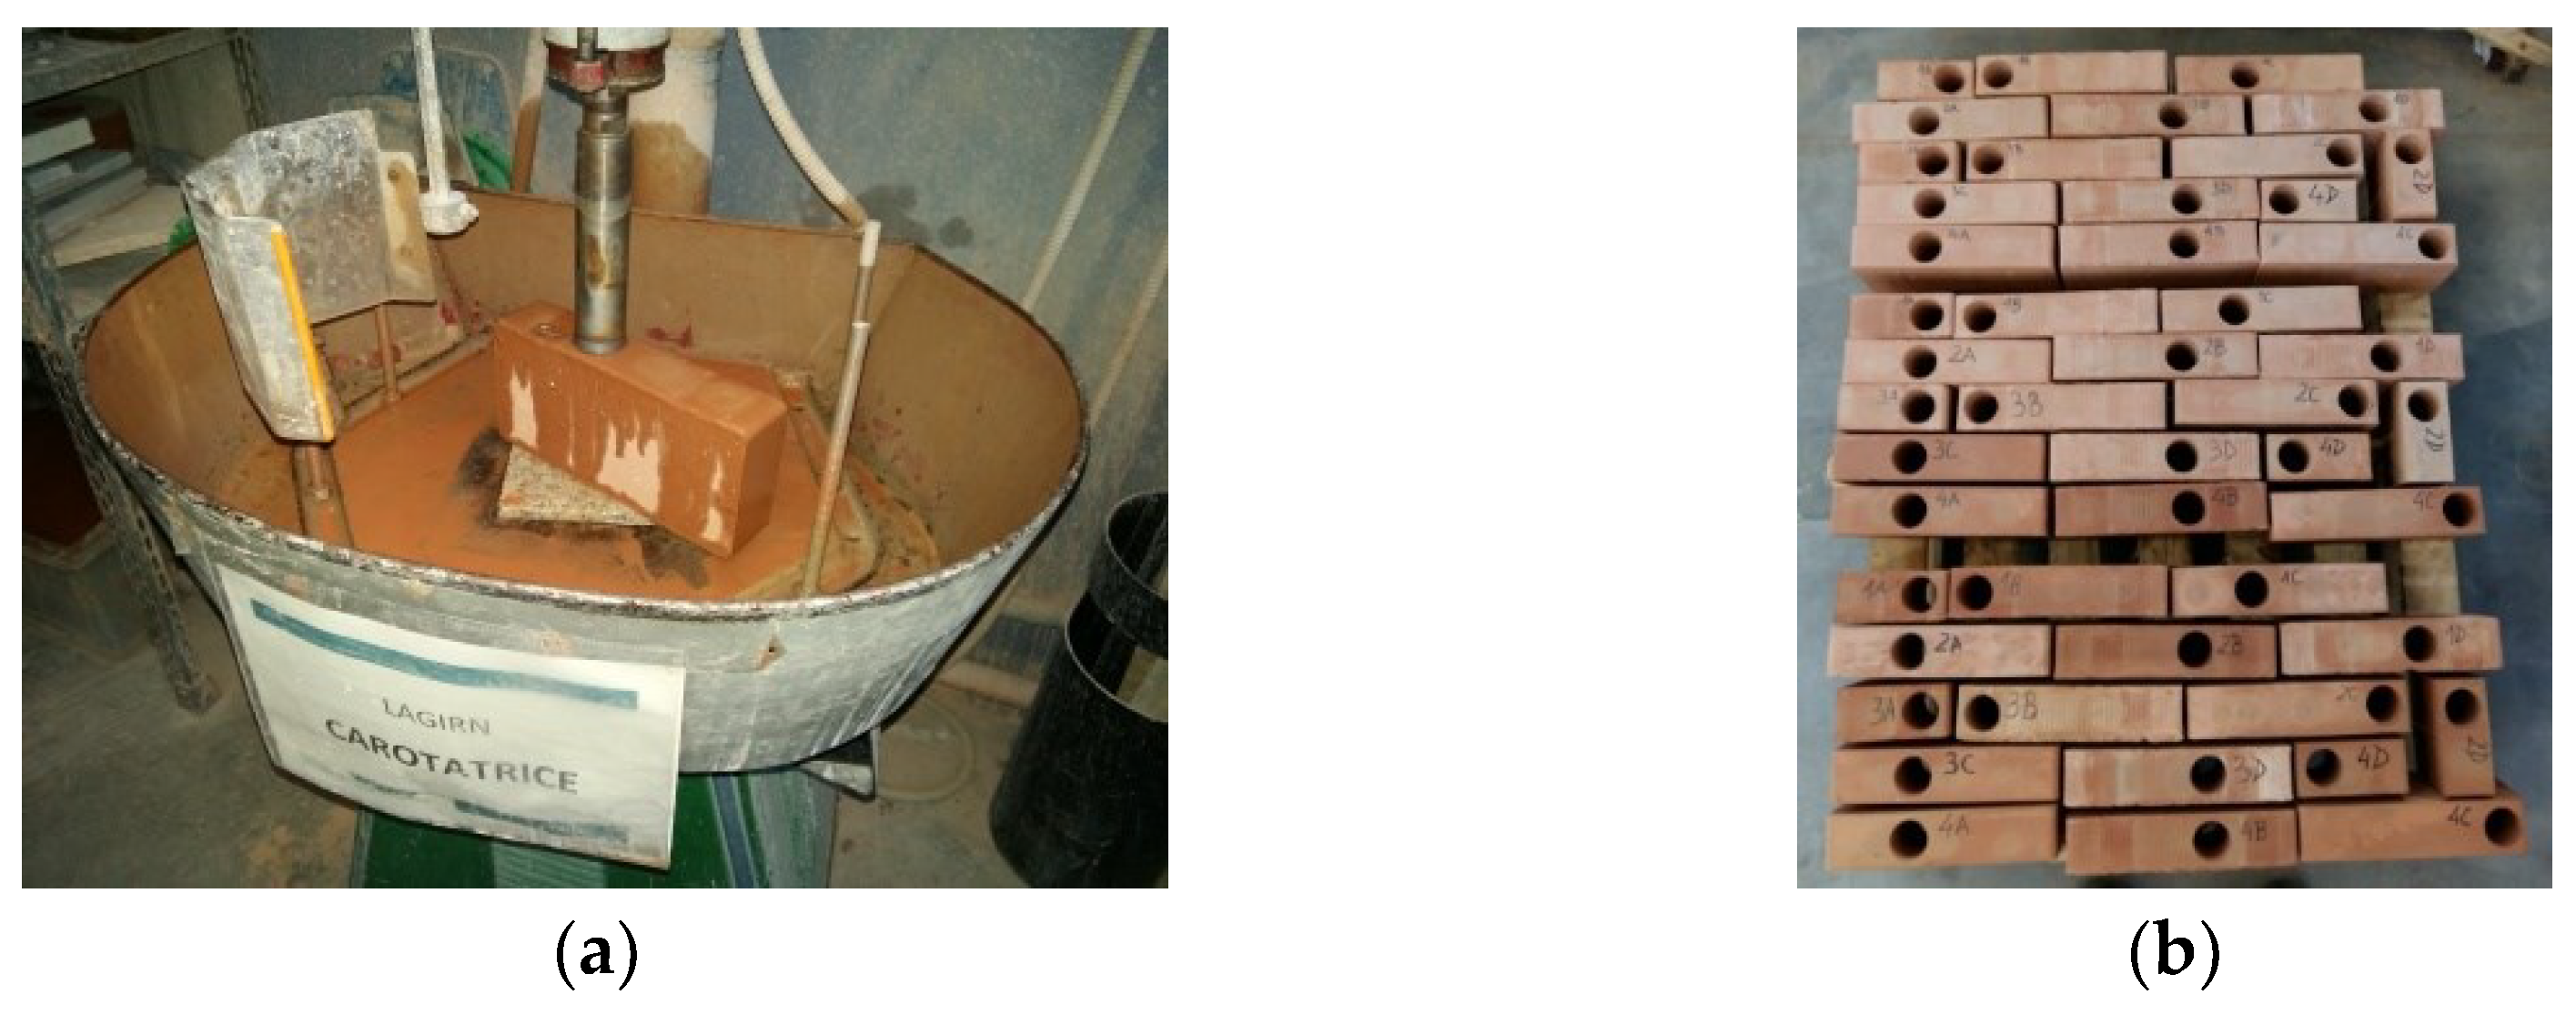
Figure 13.
Equipment used for the correct laying of bricks.
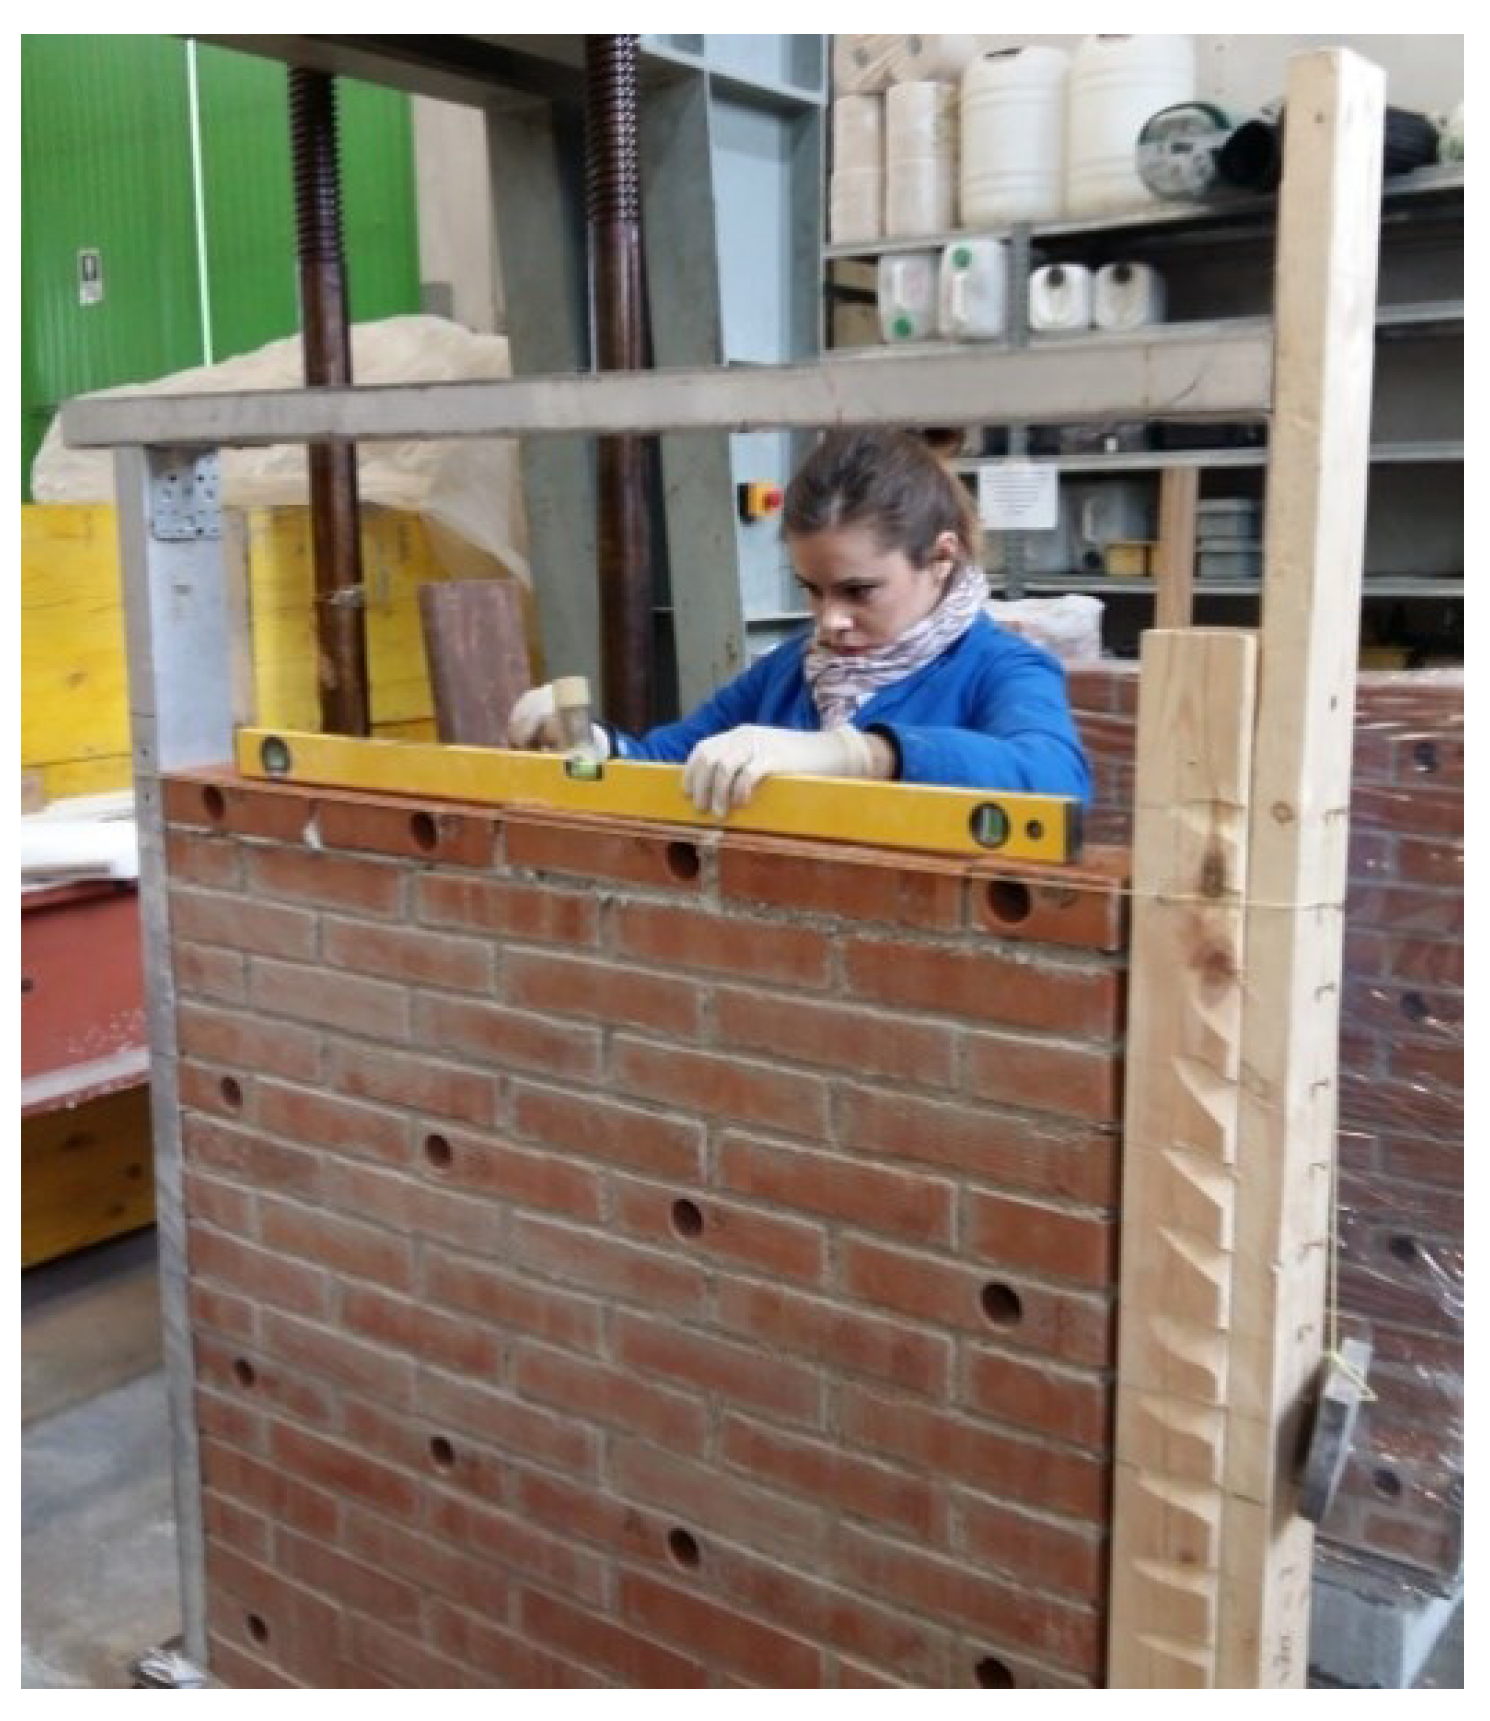
Figure 14.
Barbero Mauser strapping system for stainless steel strapping: Model B05.T000S262.
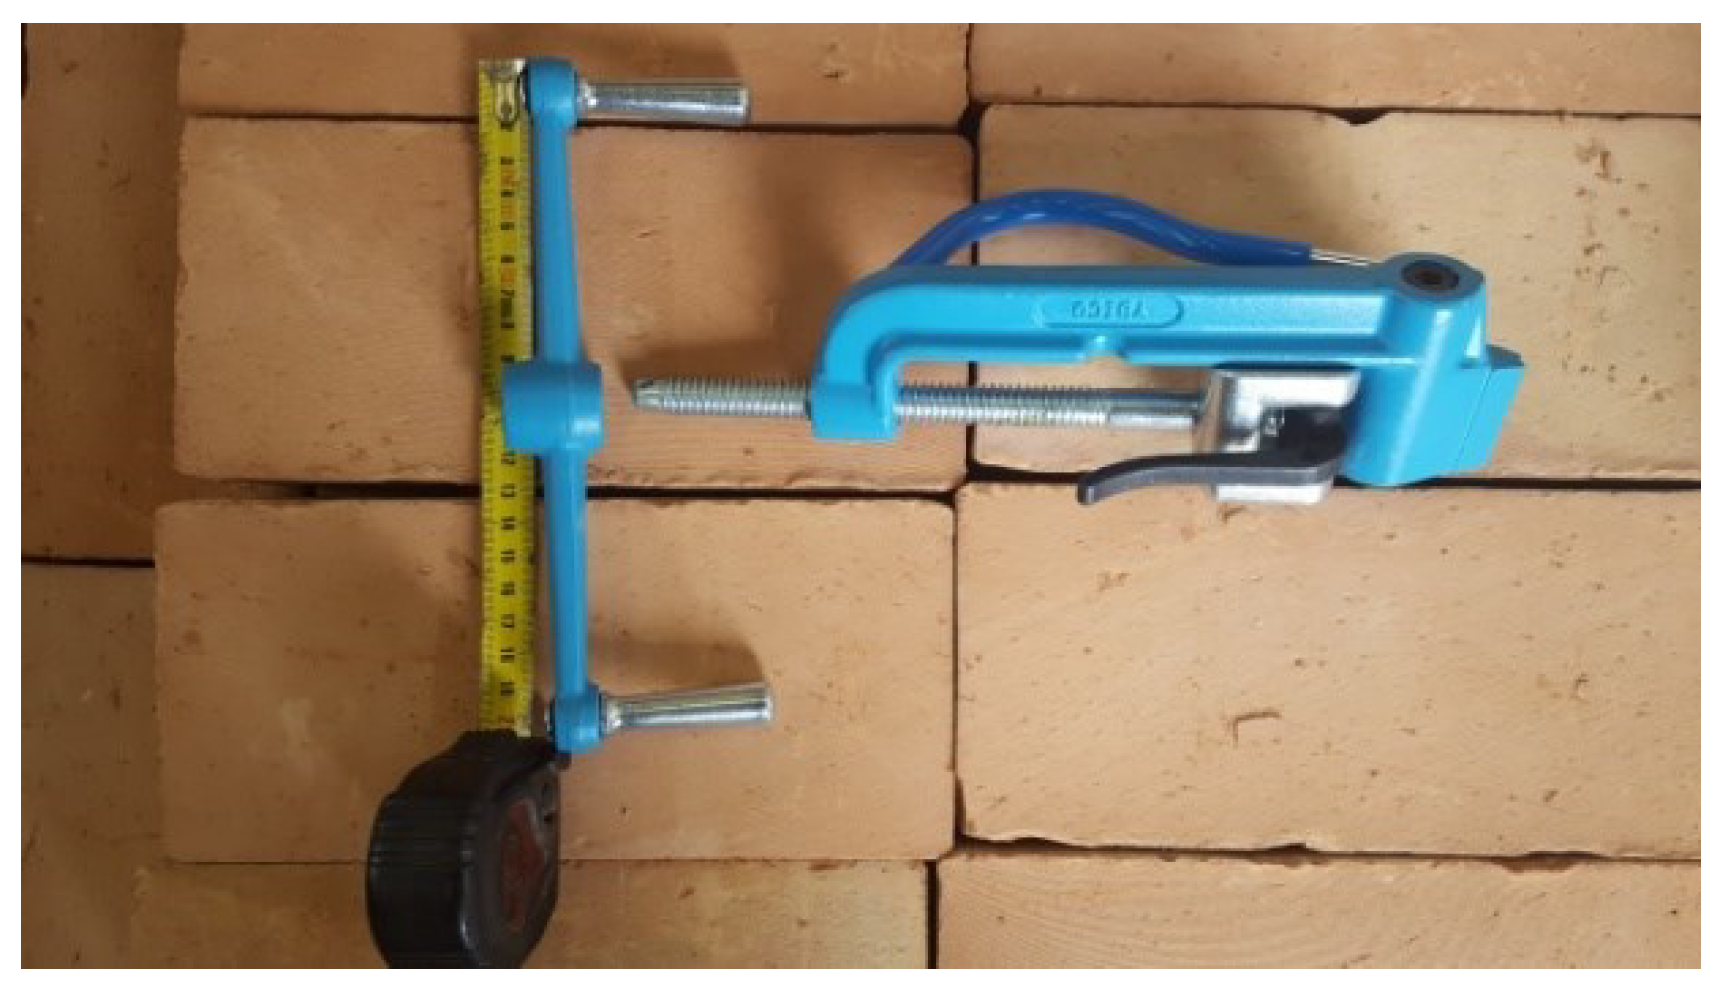
Figure 15.
Instrumentation of Specimen M1-45: (a) Front view; (b) Back view.
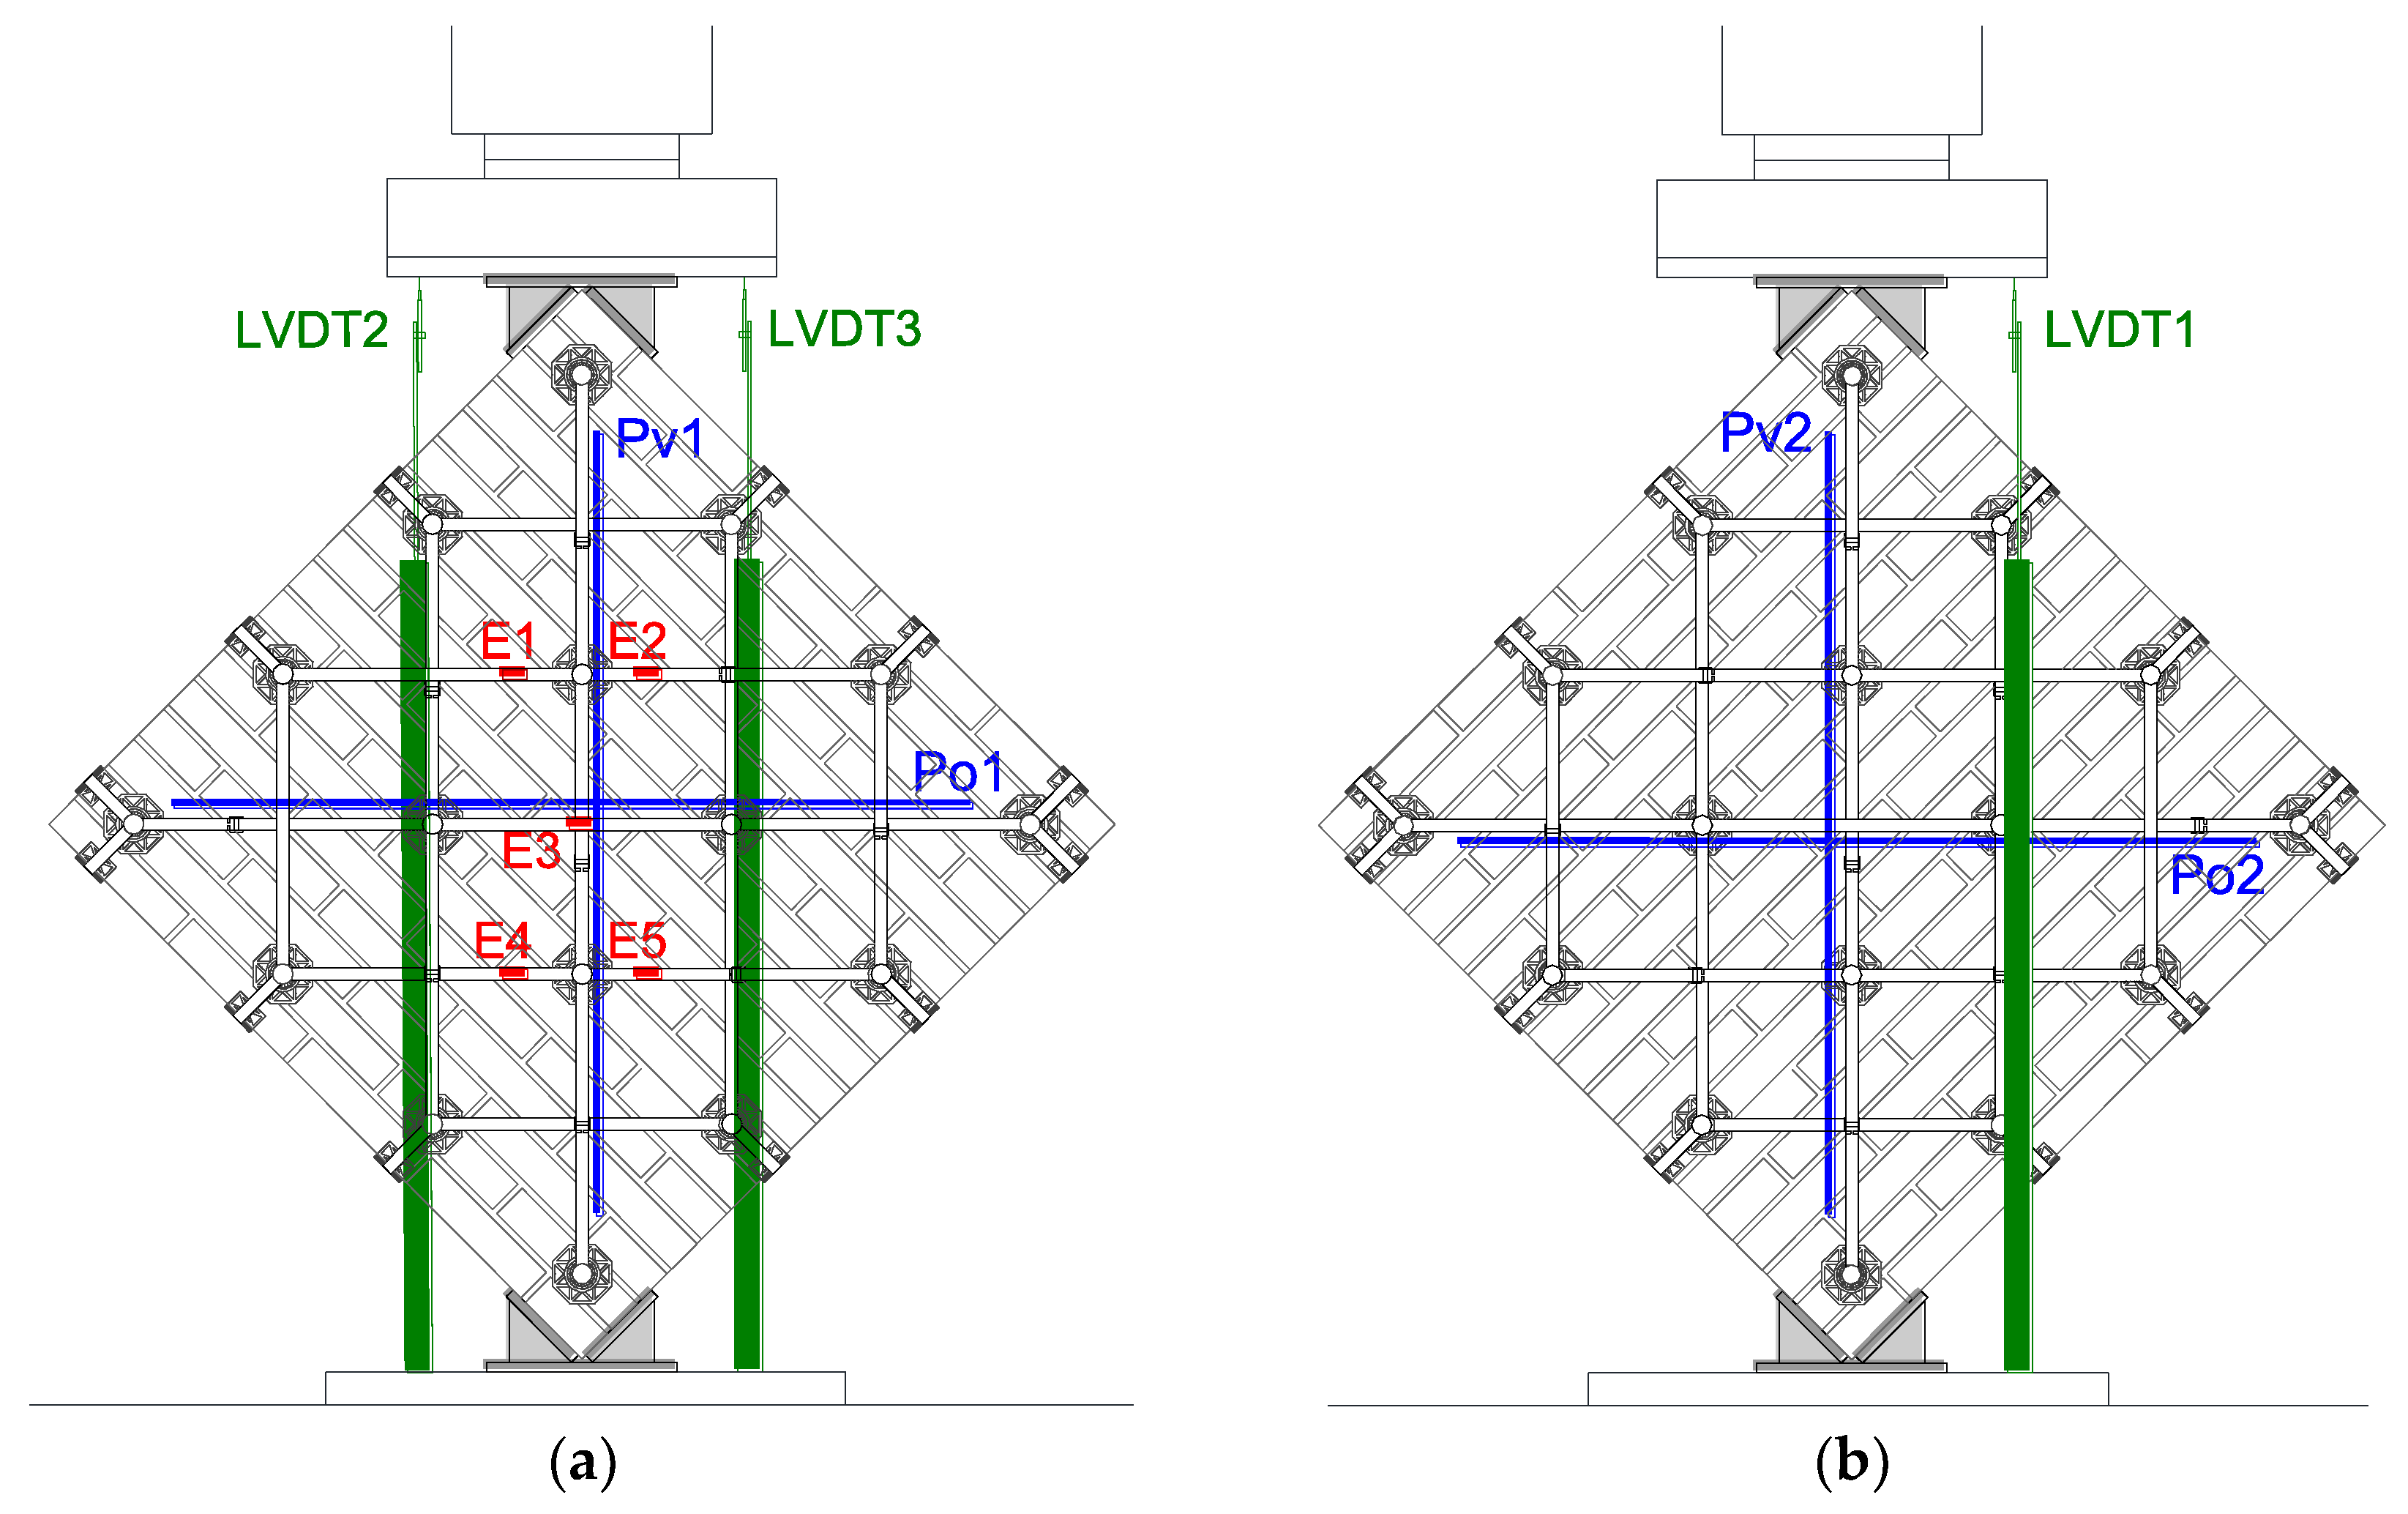
Figure 16.
Rotations undergone by Specimen M1-45: positive values indicate anti-clockwise rotations on the front face and on the vertical cross-section, seen from the left side.
Figure 16.
Rotations undergone by Specimen M1-45: positive values indicate anti-clockwise rotations on the front face and on the vertical cross-section, seen from the left side.
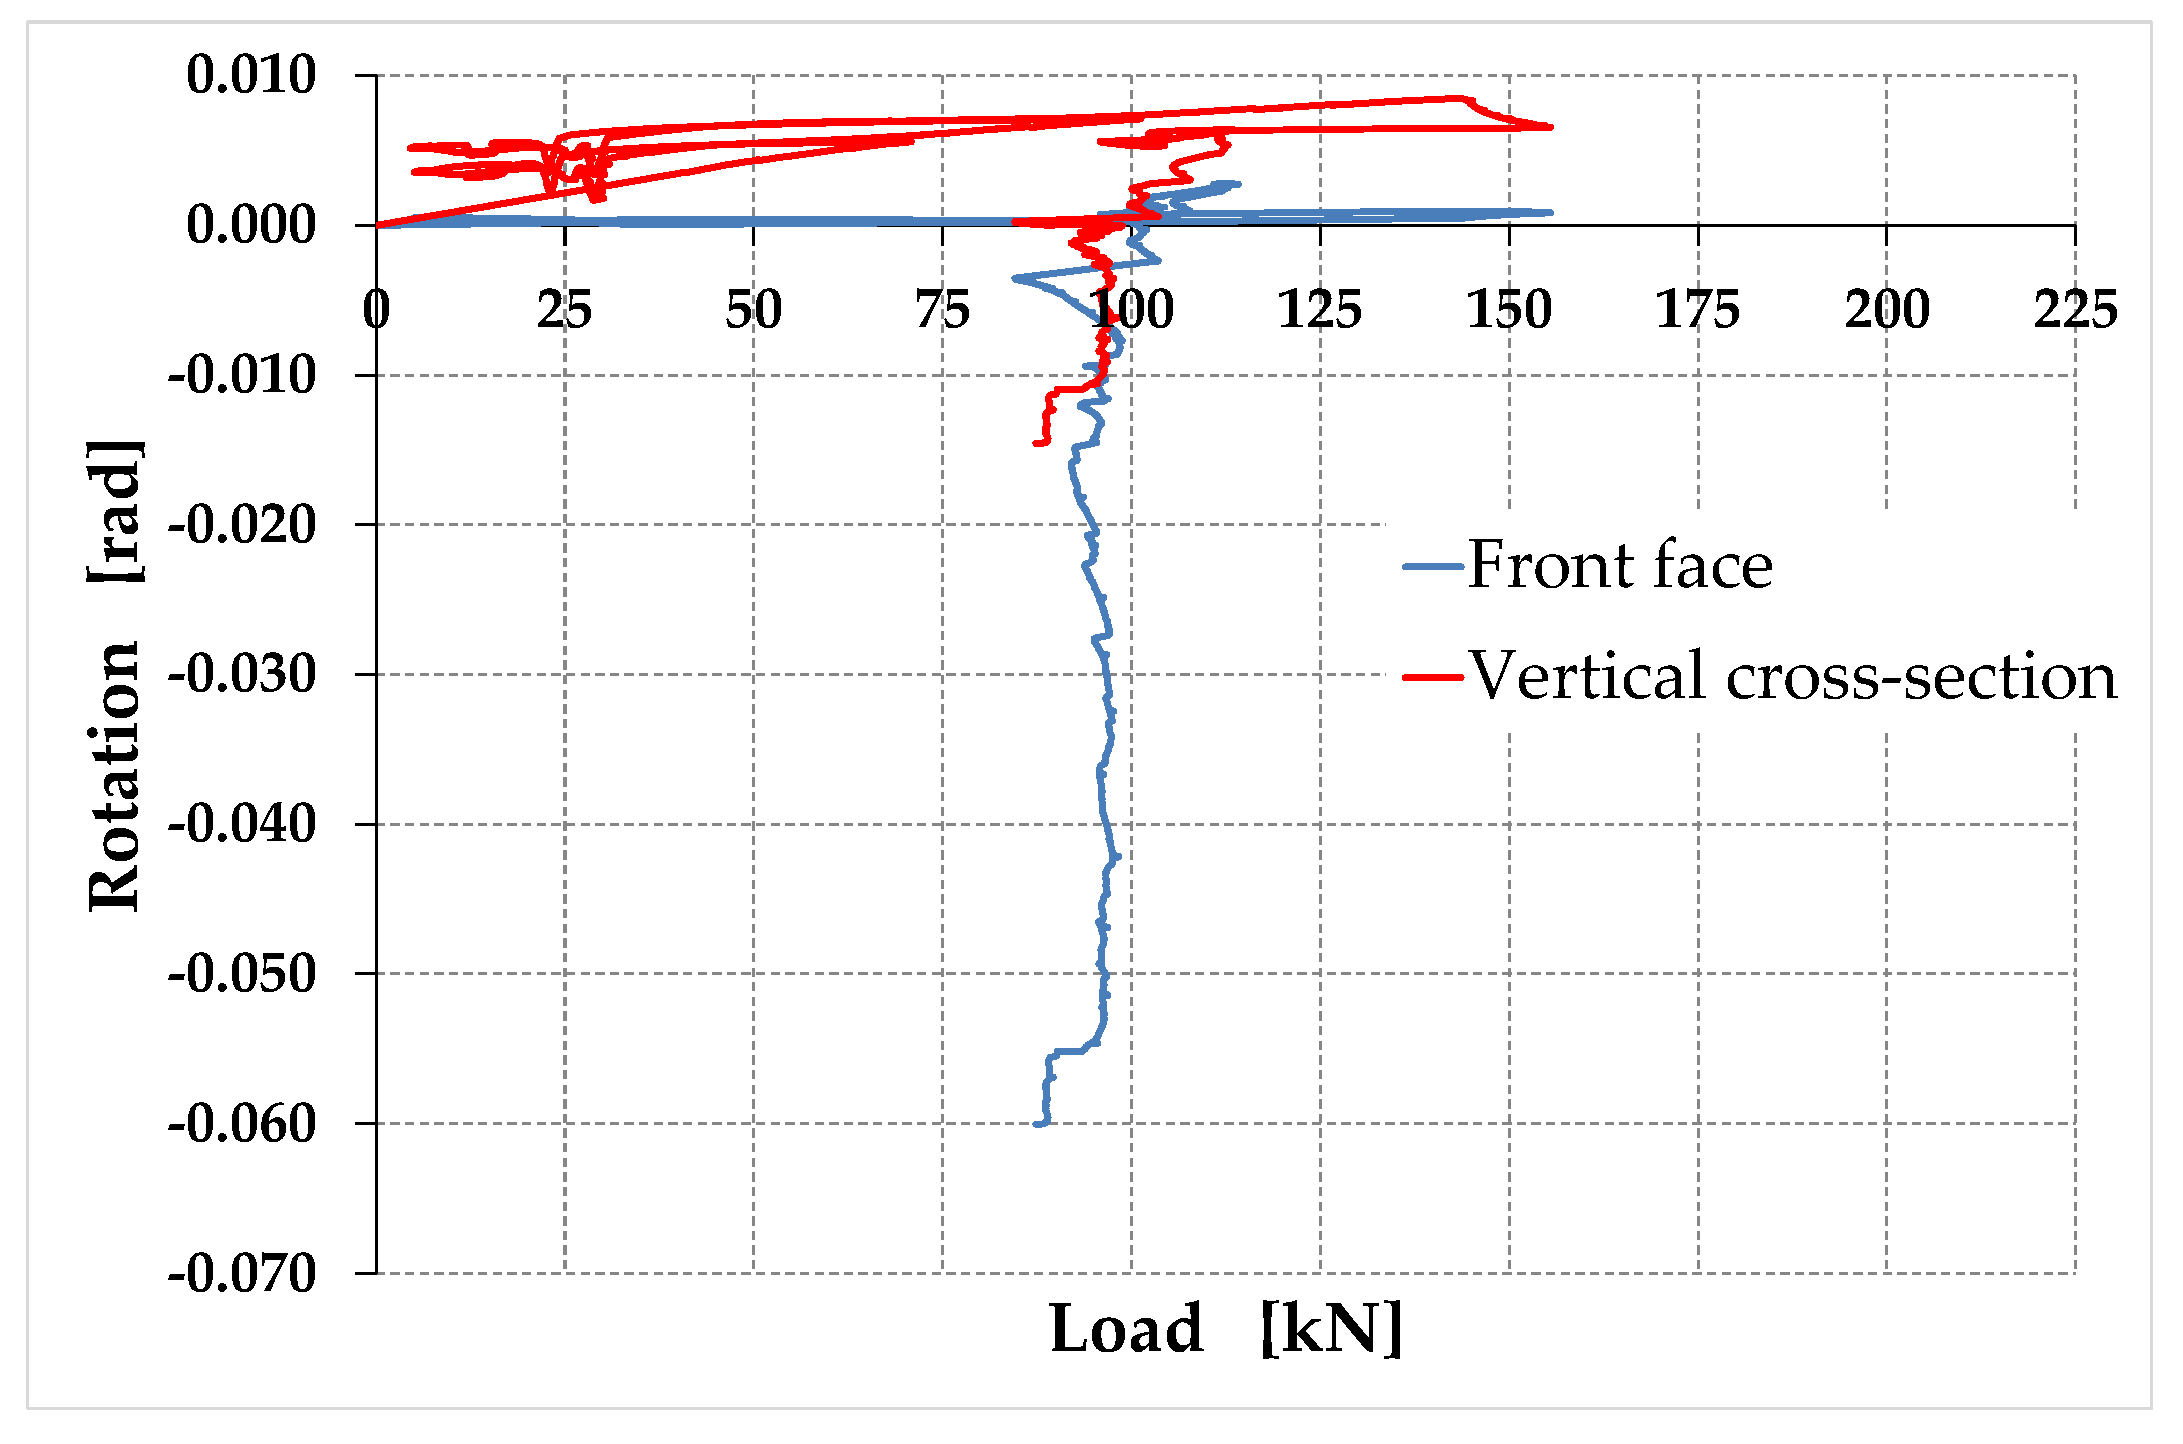
Figure 17.
Rotations undergone by Specimen M2-45: positive values indicate anti-clockwise rotations on the front face and on the vertical cross-section, seen from the left side.
Figure 17.
Rotations undergone by Specimen M2-45: positive values indicate anti-clockwise rotations on the front face and on the vertical cross-section, seen from the left side.
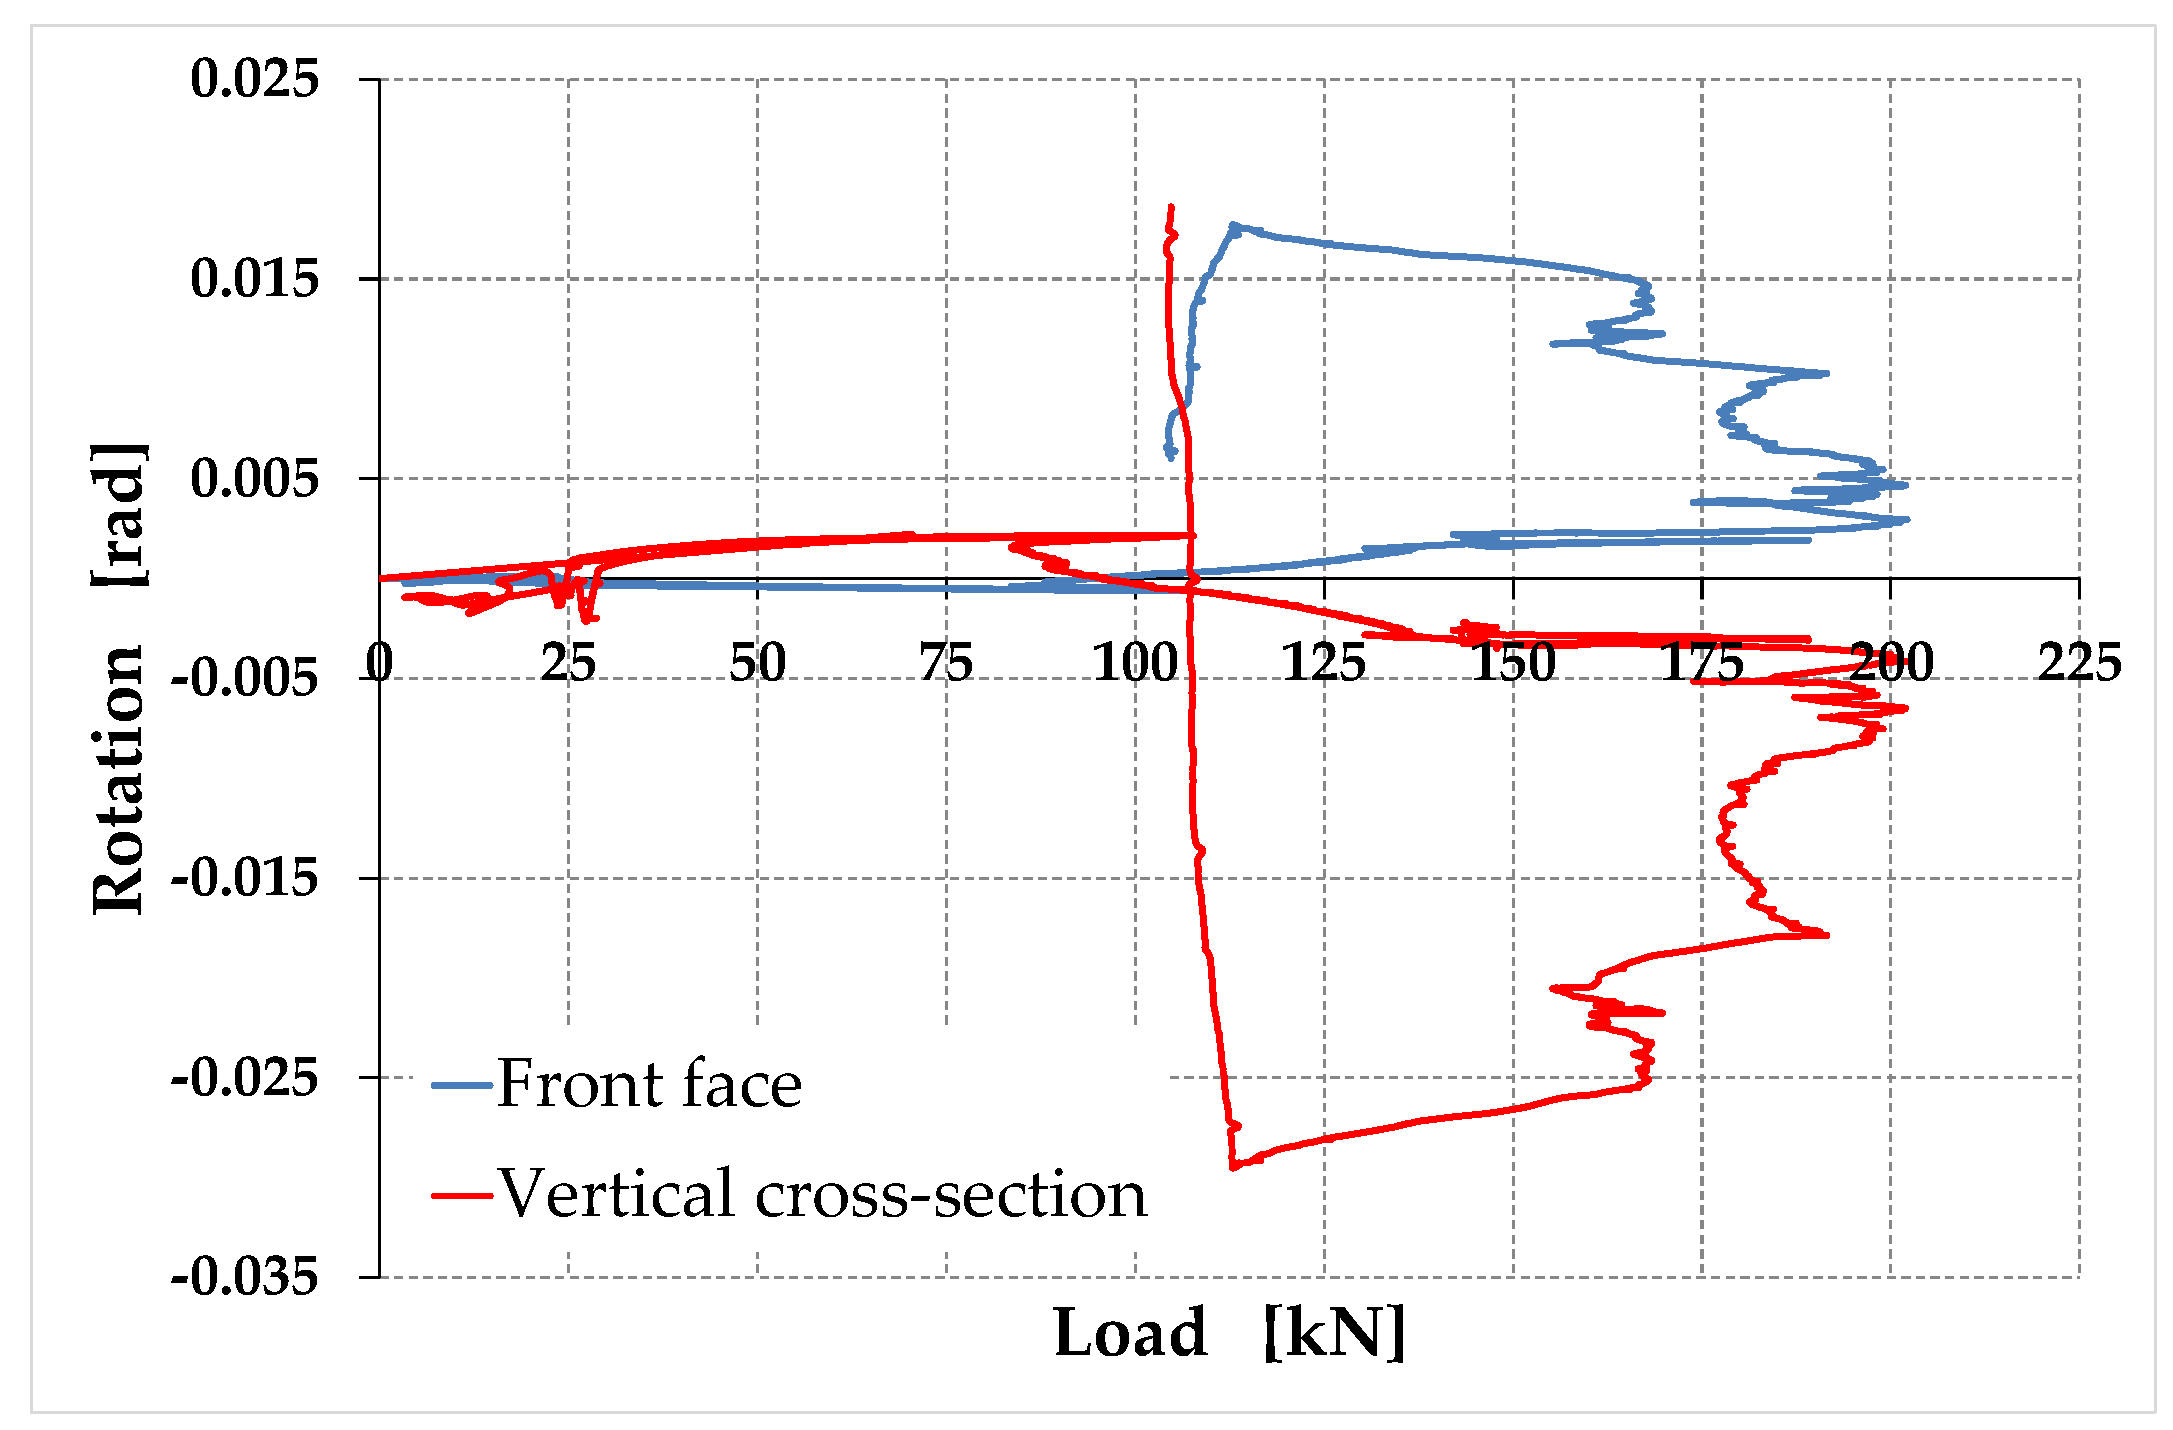
Figure 18.
Failure mode of Specimen M1-90.
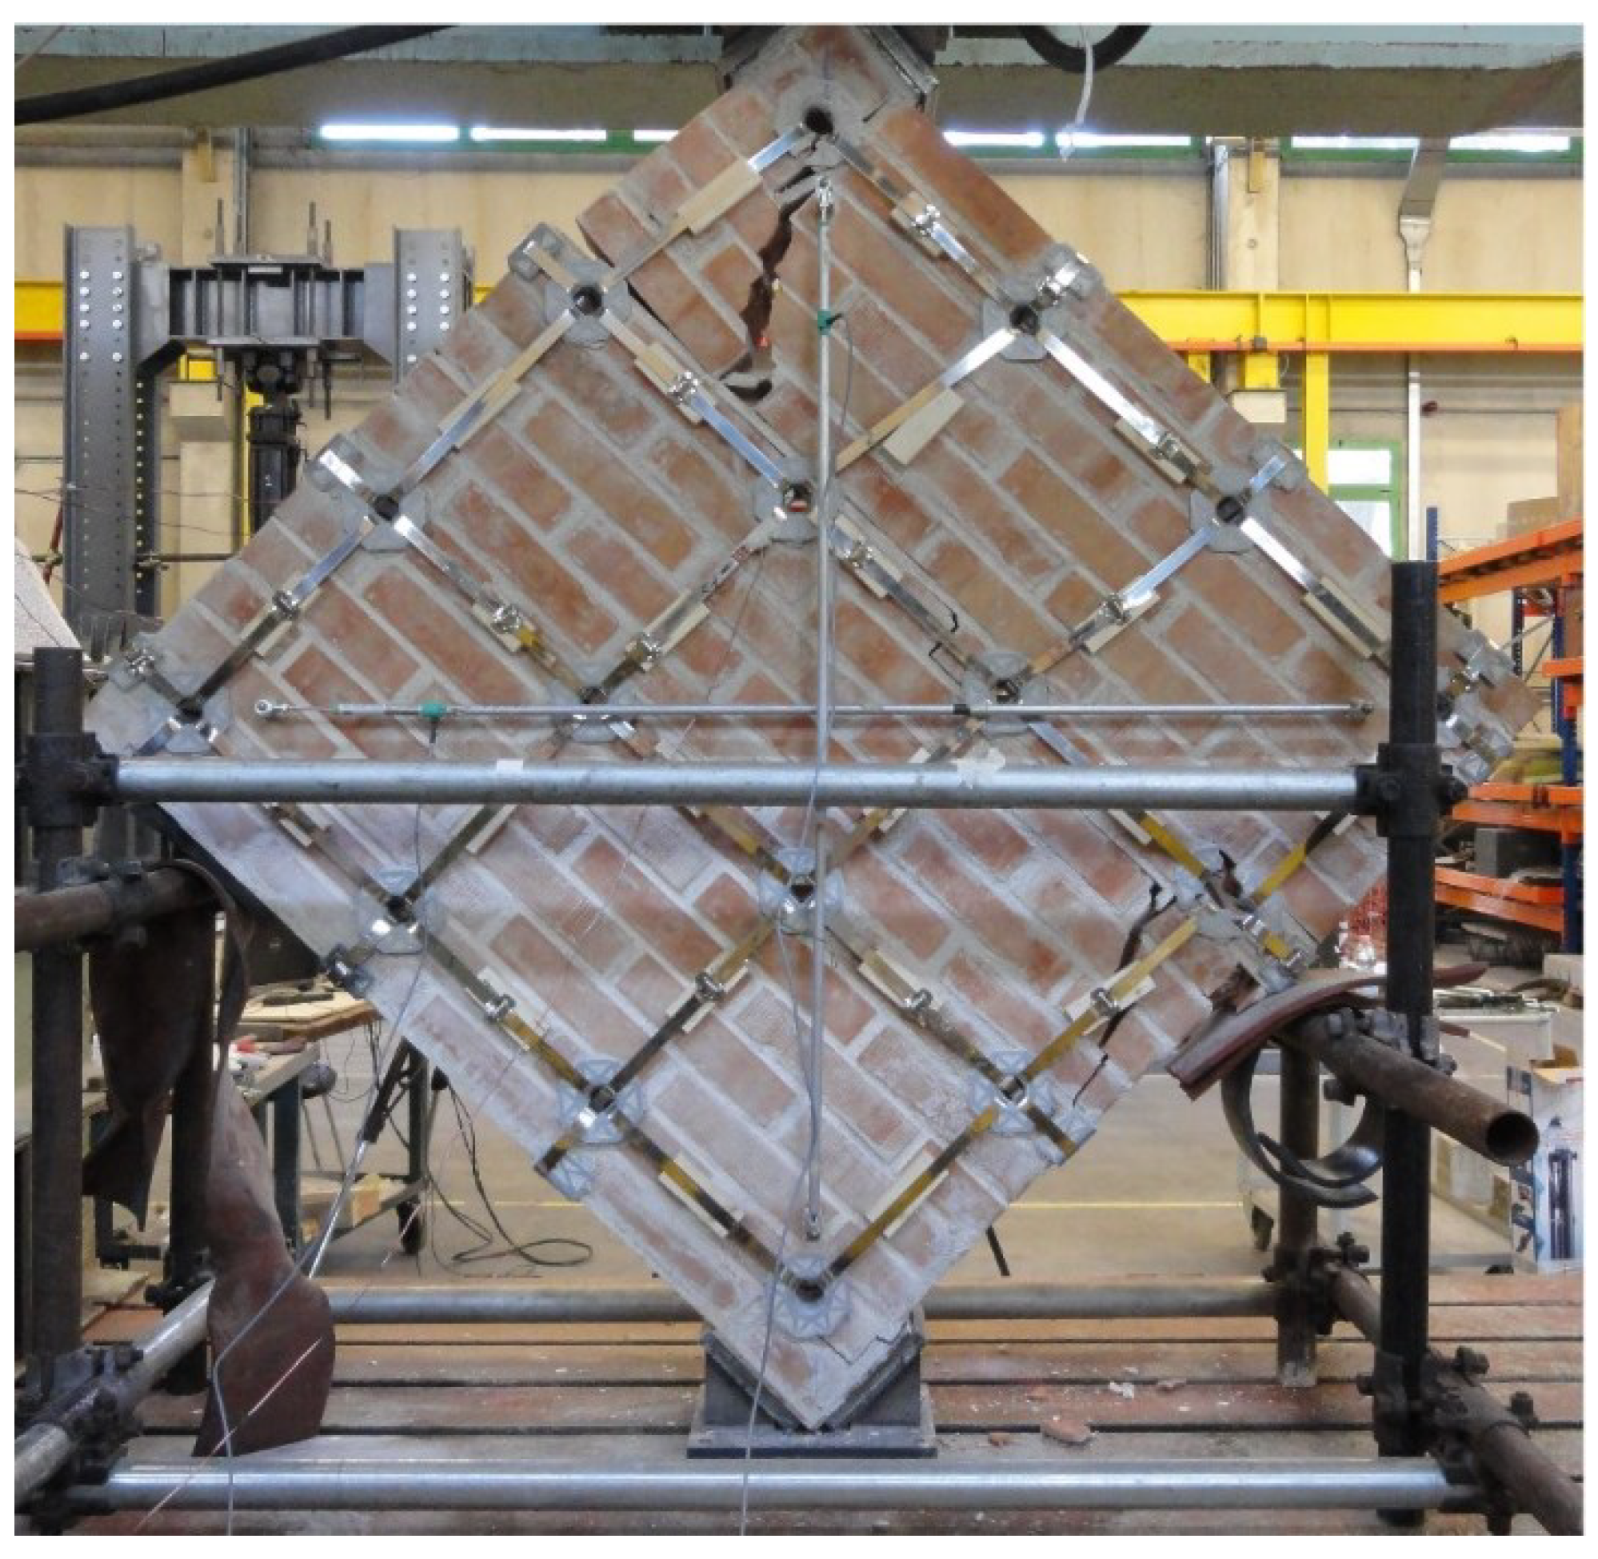
Figure 19.
Details of the broken funnel plates: (a) Funnel plate in the upper left corner of the mechanism; (b) Funnel plate in the lower right corner of the mechanism.
Figure 19.
Details of the broken funnel plates: (a) Funnel plate in the upper left corner of the mechanism; (b) Funnel plate in the lower right corner of the mechanism.
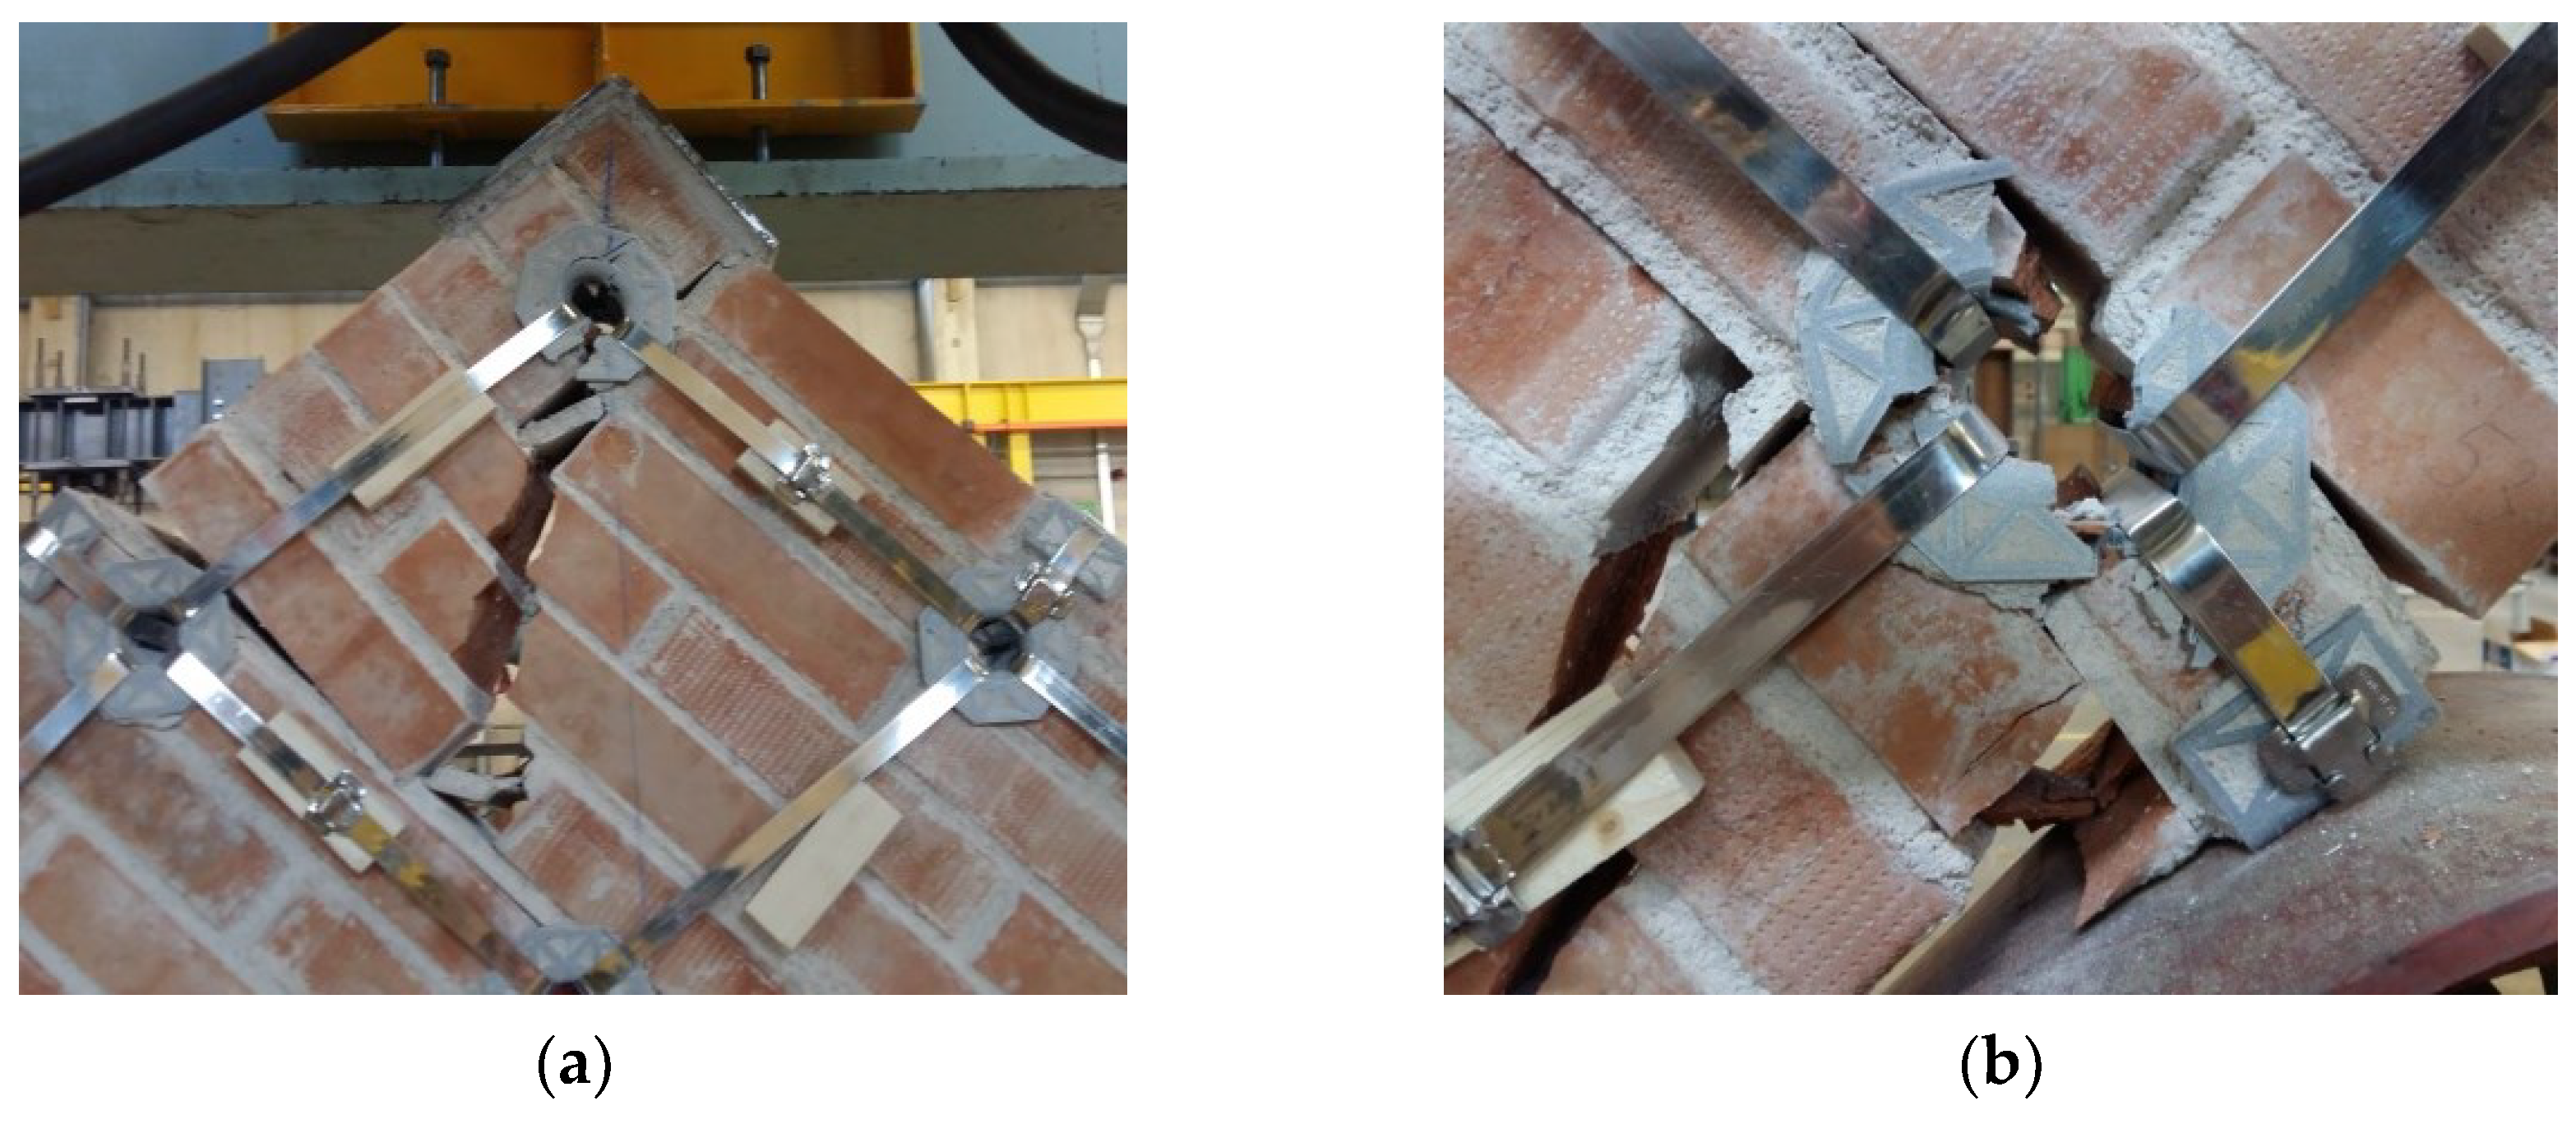
Figure 20.
Failure mode of Specimen M1-45: (a) Appearance of the specimen after its removal from the testing machine; (b) Detail of the crack along the compressed diagonal.
Figure 20.
Failure mode of Specimen M1-45: (a) Appearance of the specimen after its removal from the testing machine; (b) Detail of the crack along the compressed diagonal.
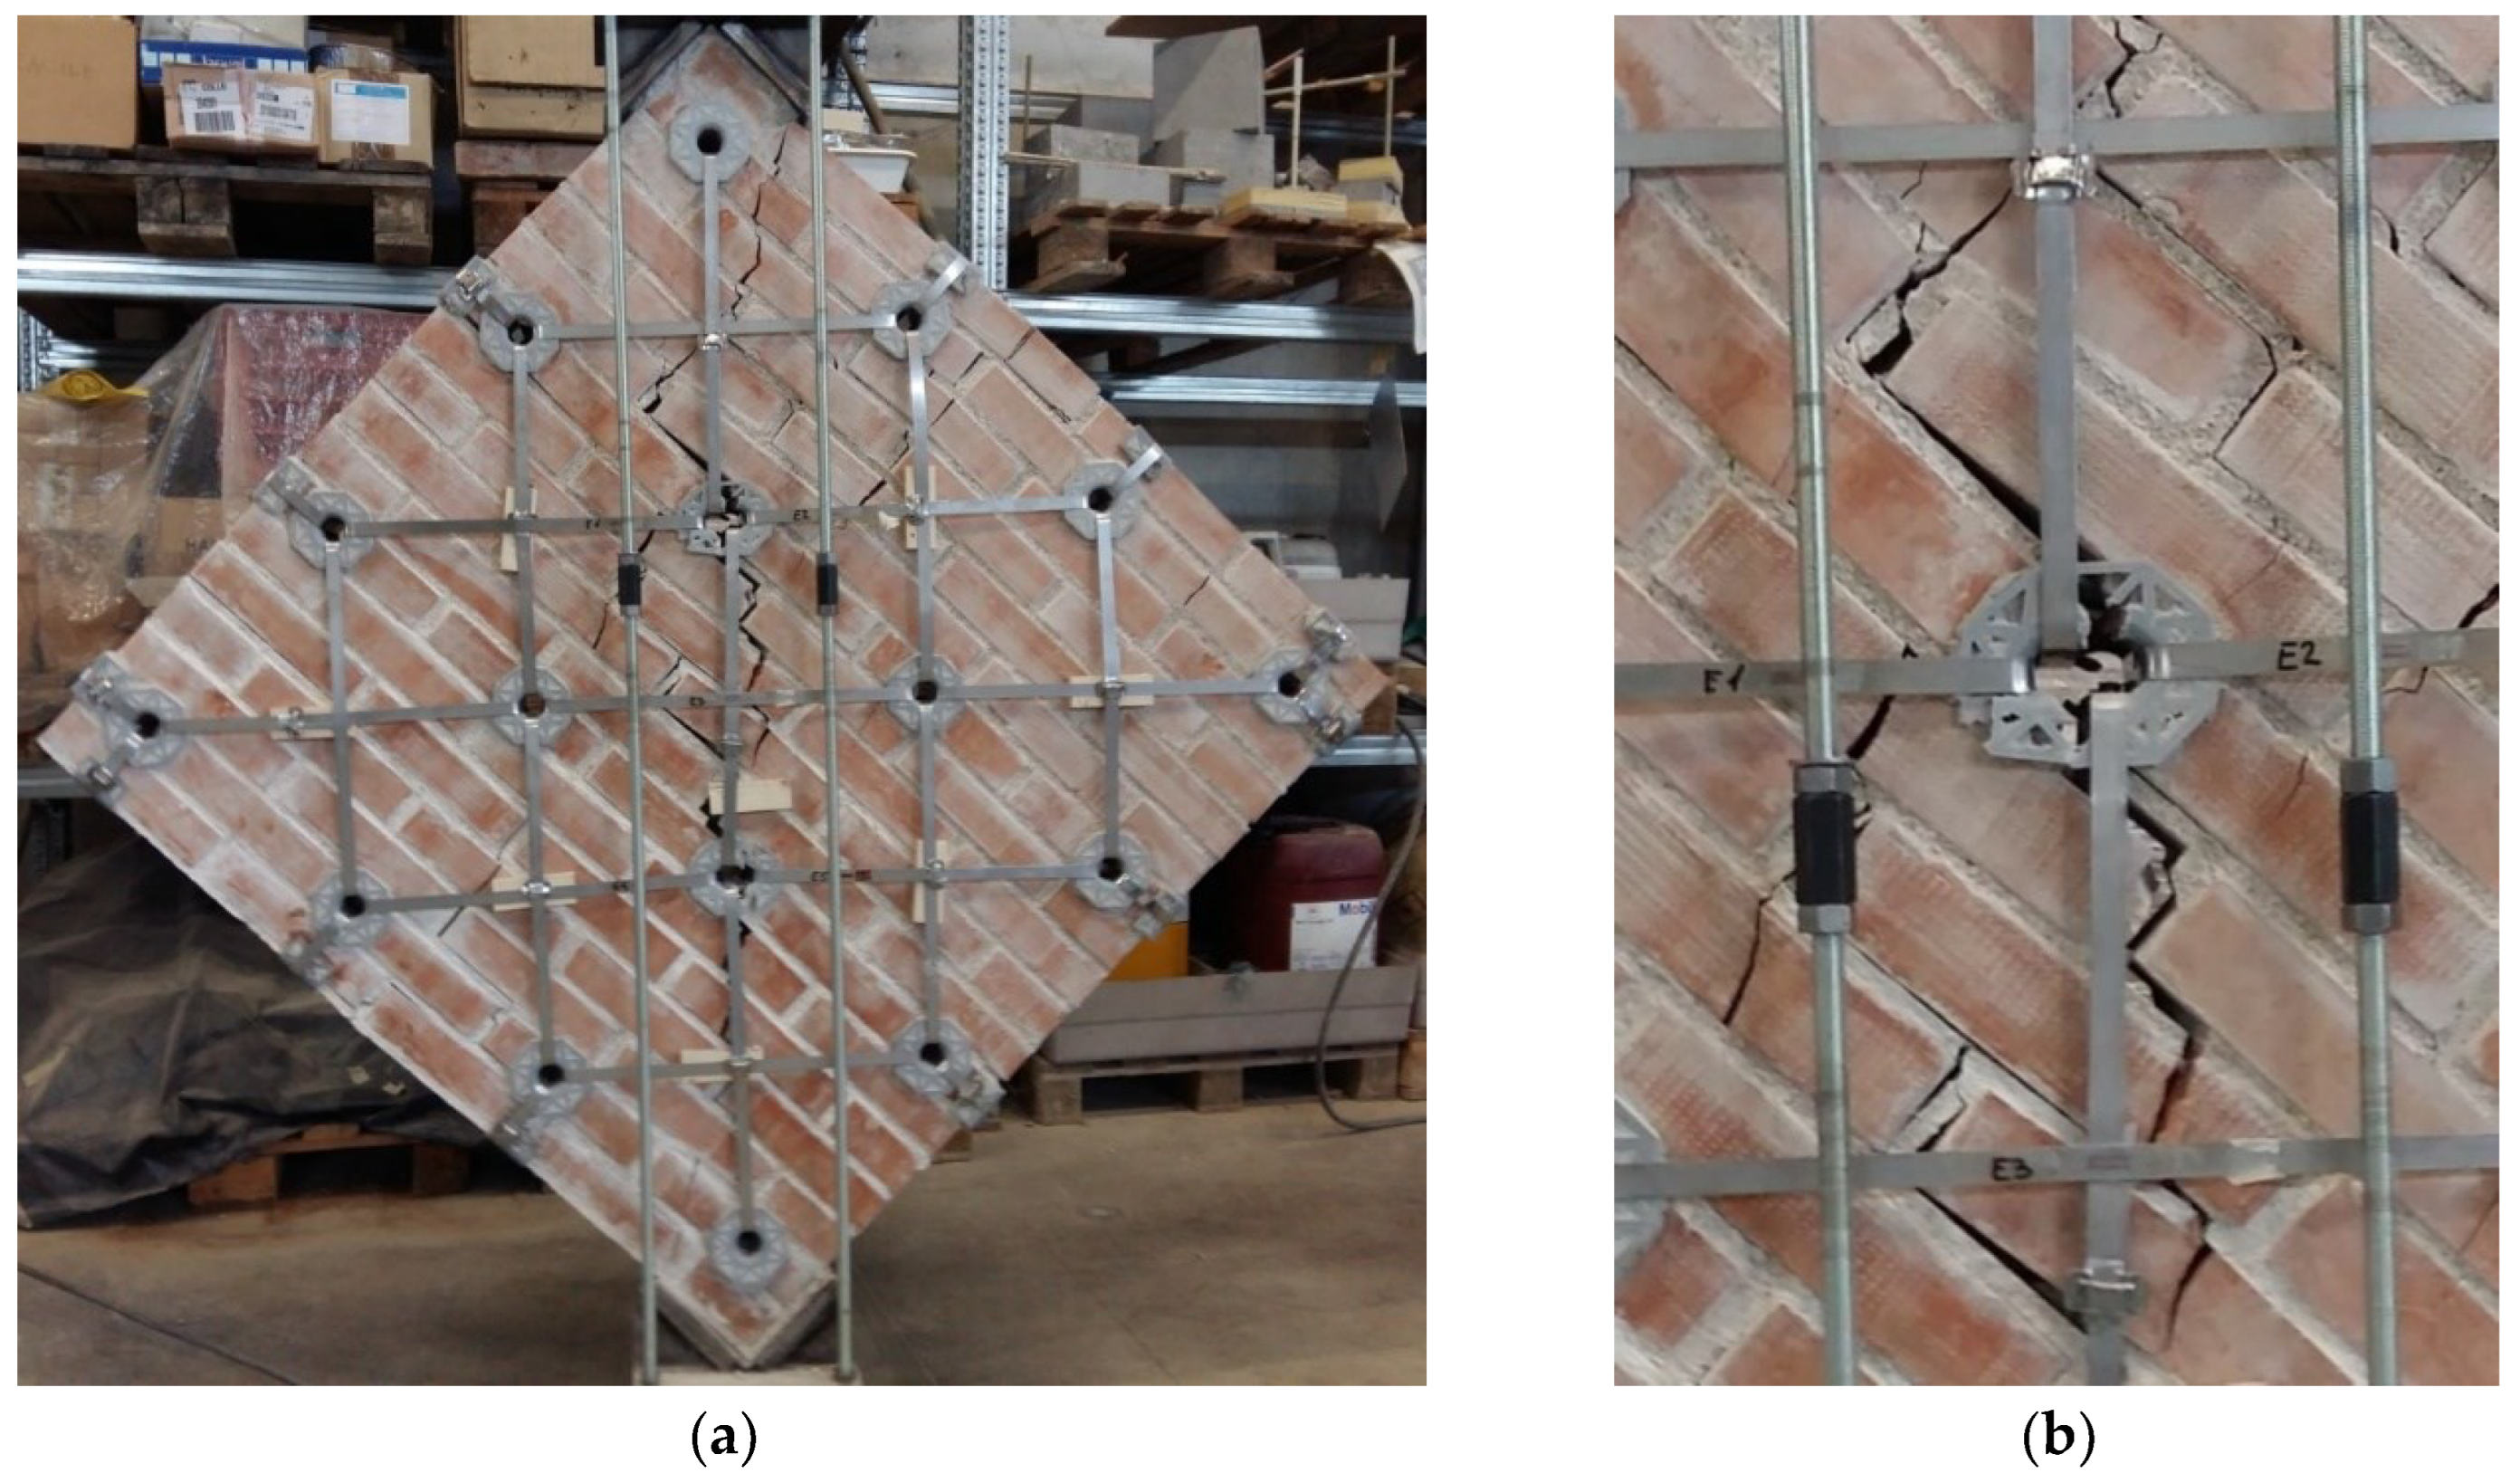
Figure 21.
Failure mode of Specimen M2-45.
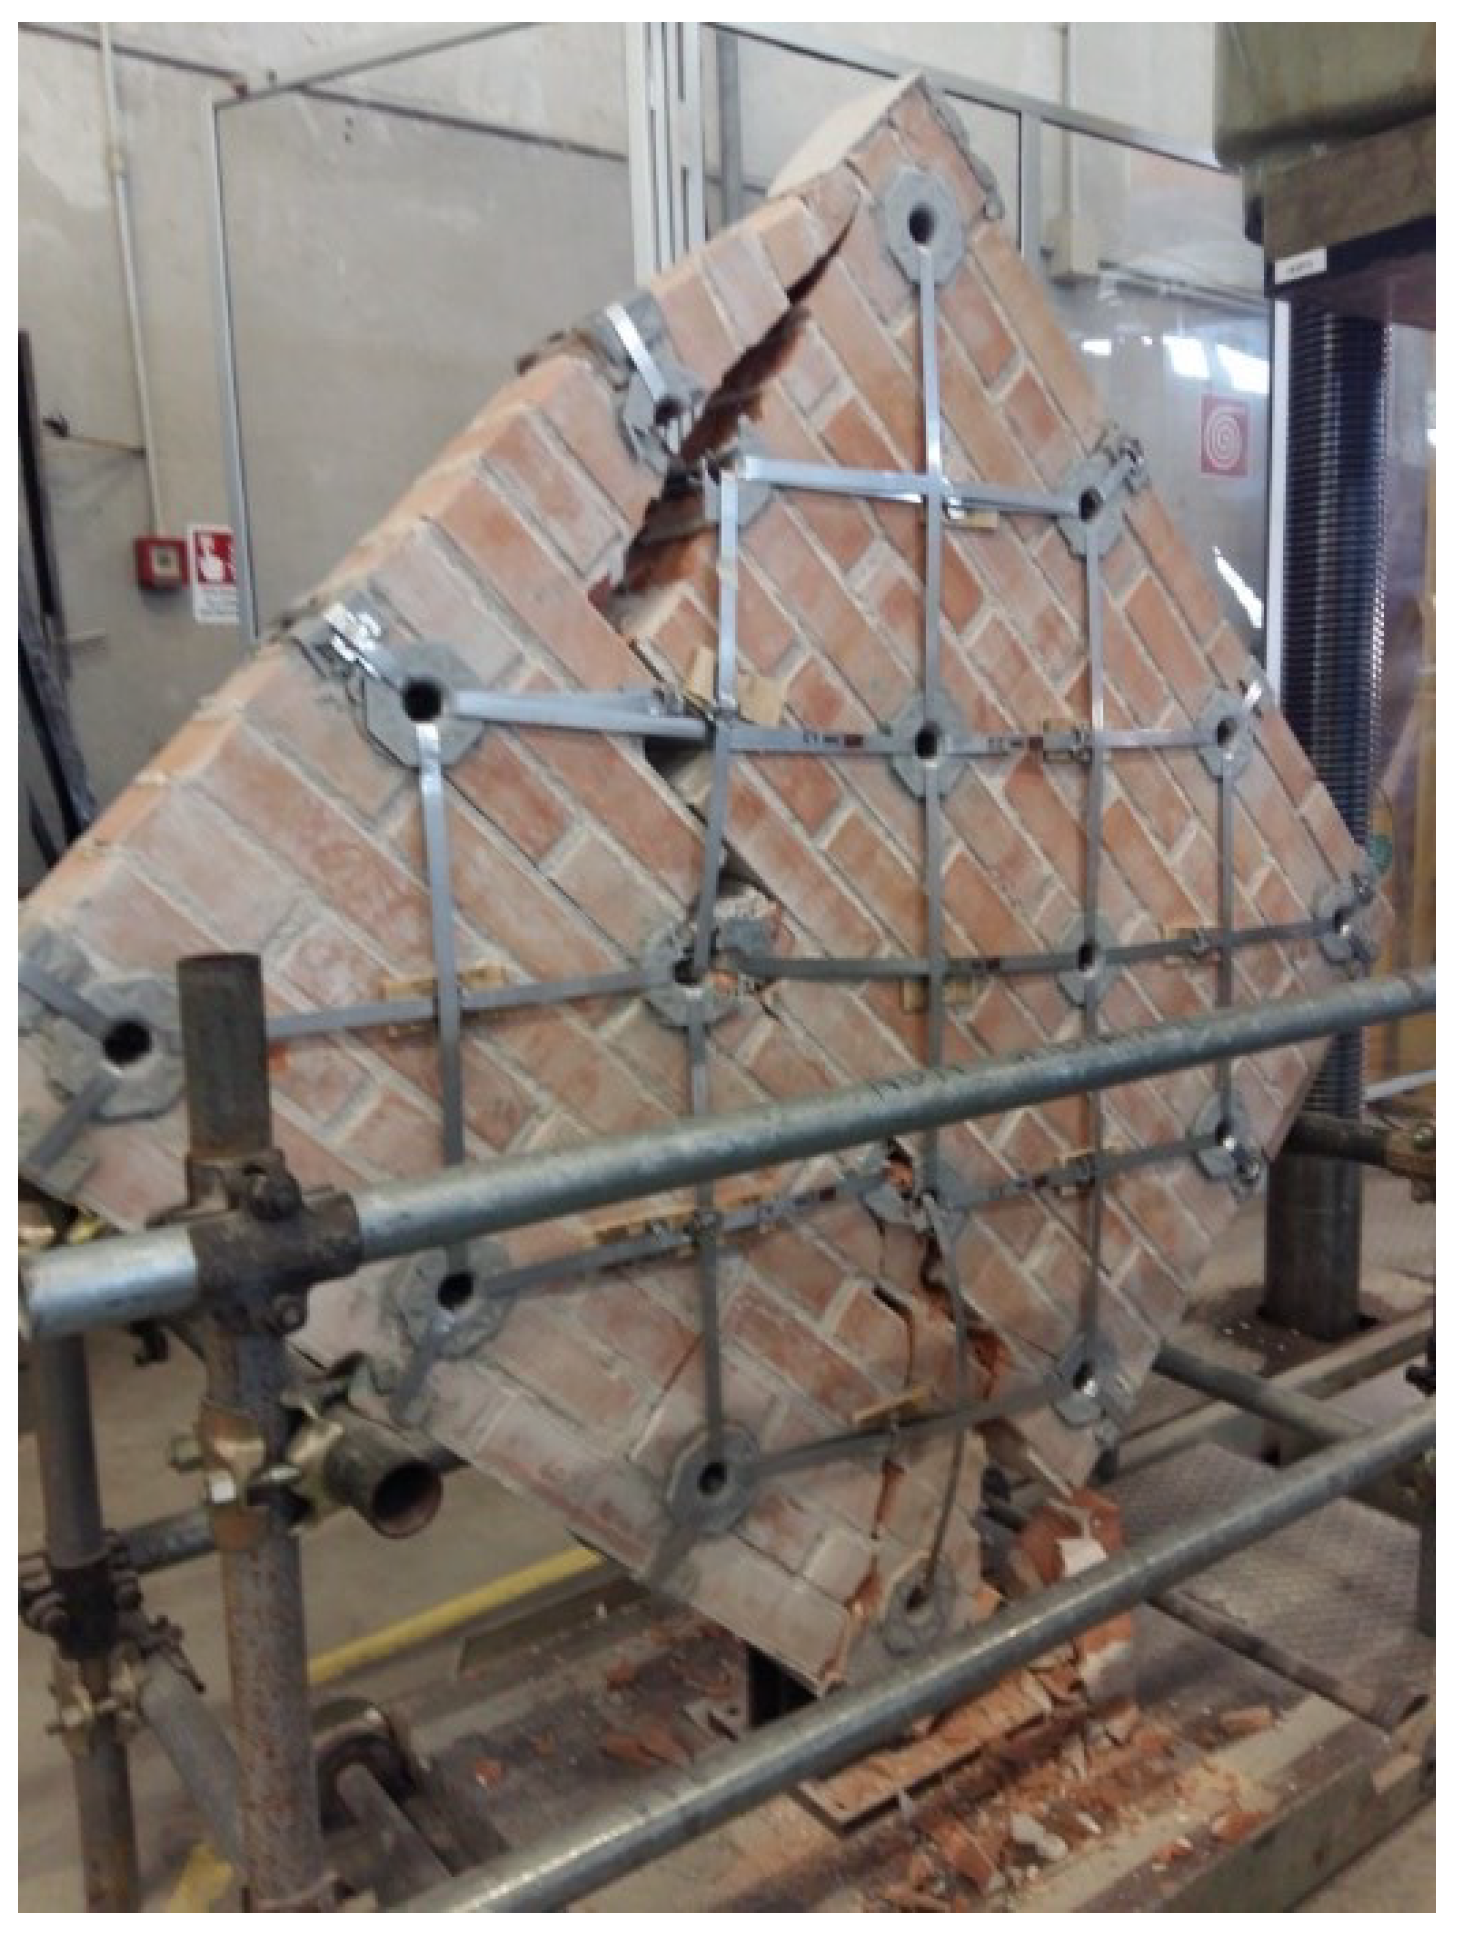
Figure 22.
Shear stress/shear strain curves for specimen M1-90, according to ASTM and RILEM interpretations of the diagonal compression test.
Figure 22.
Shear stress/shear strain curves for specimen M1-90, according to ASTM and RILEM interpretations of the diagonal compression test.
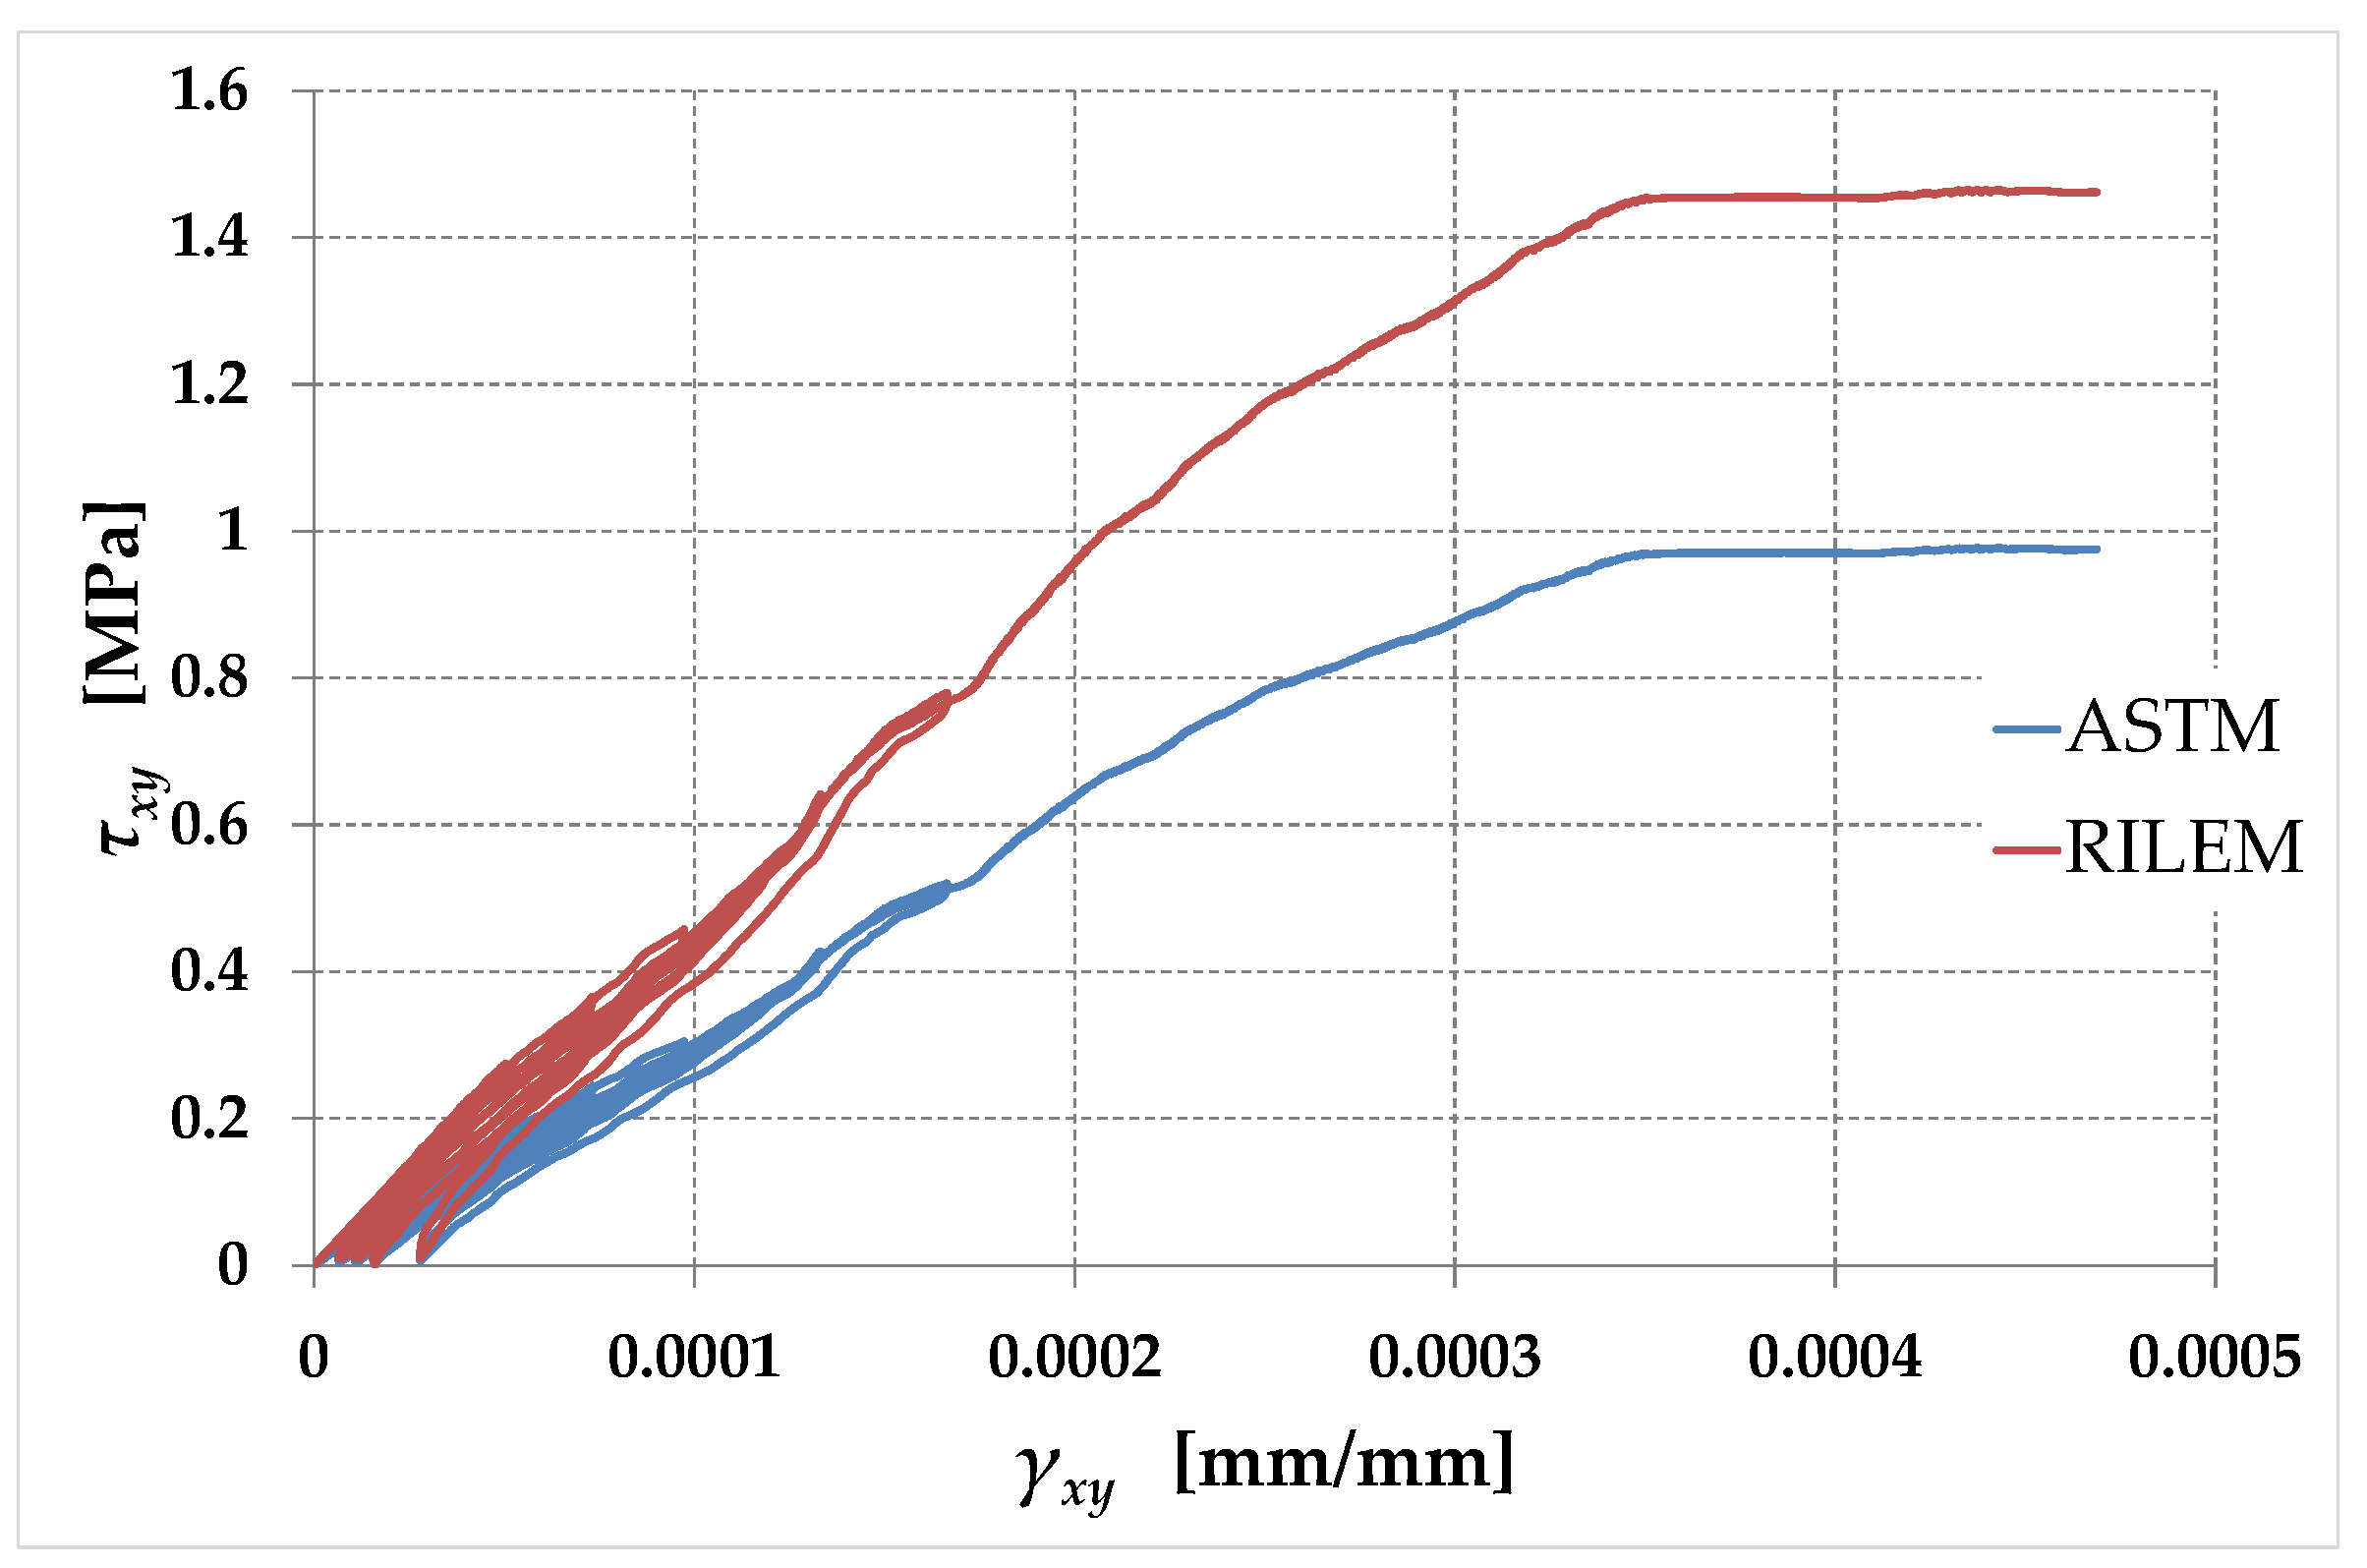
Figure 23.
Shear stress/shear strain curves for the tested specimens.
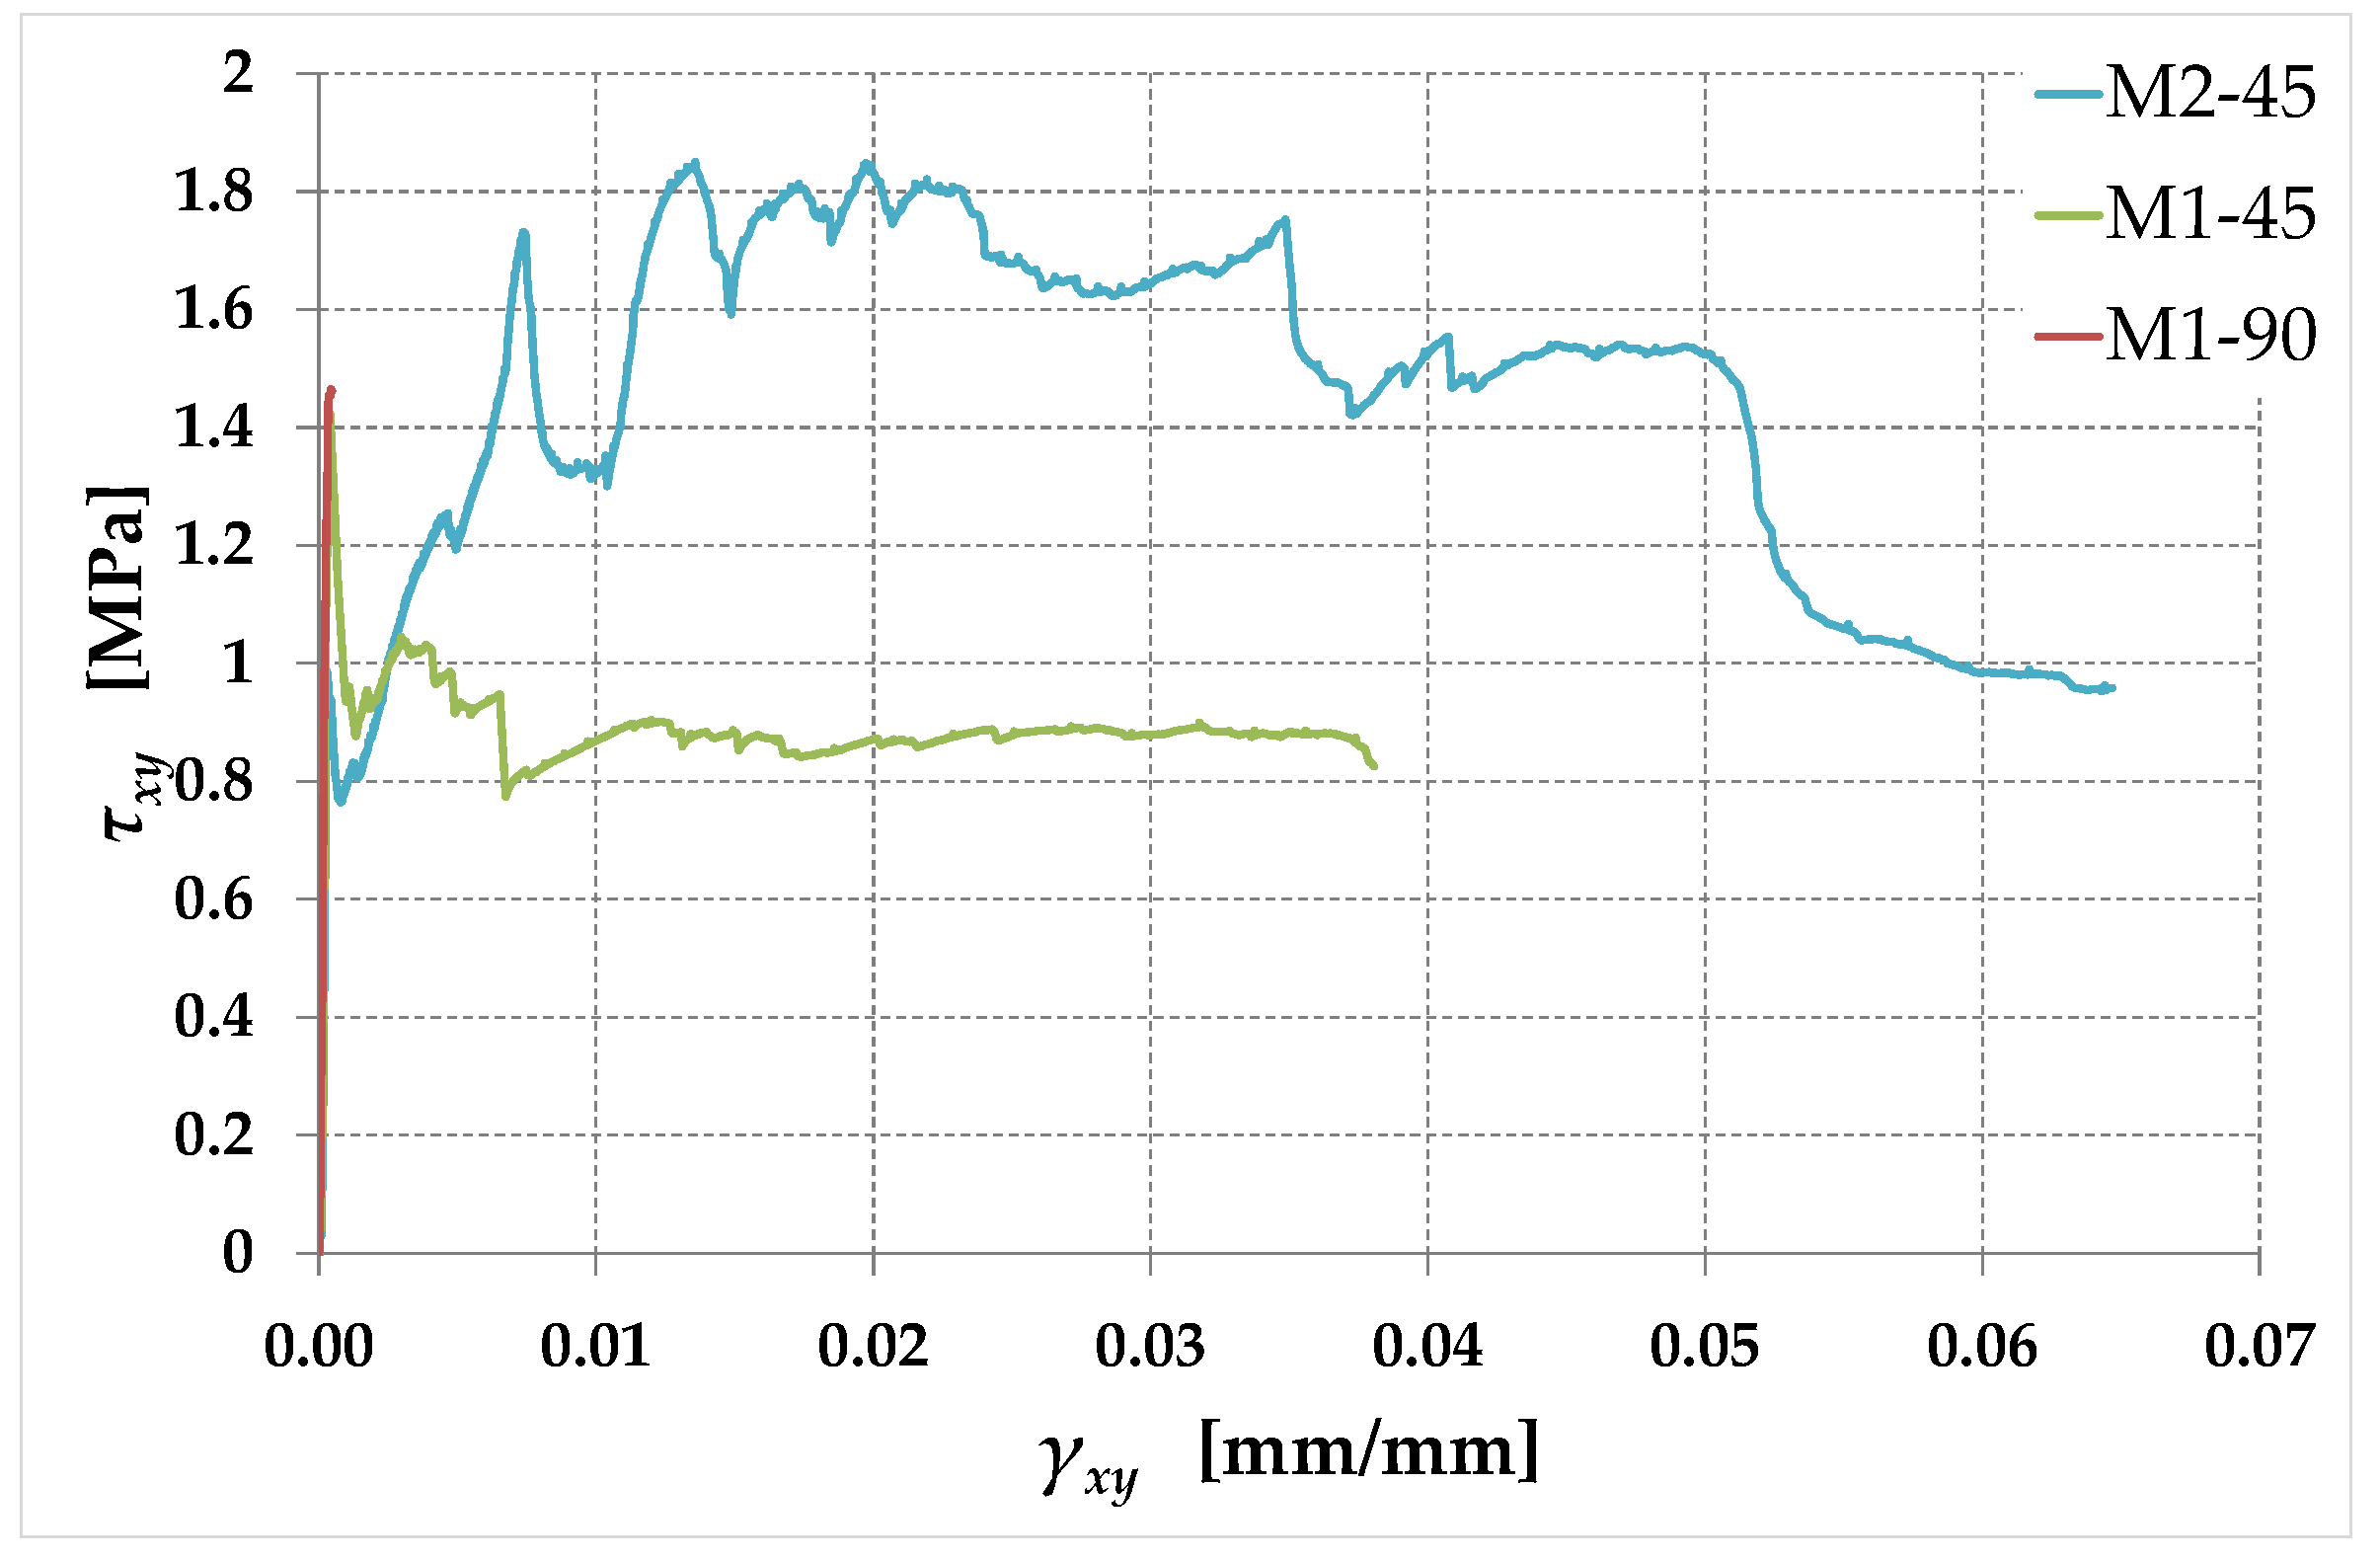
Figure 24.
Detail of Figure 23 for shear strain values between 0 and 0.001.
Figure 24.
Detail of Figure 23 for shear strain values between 0 and 0.001.
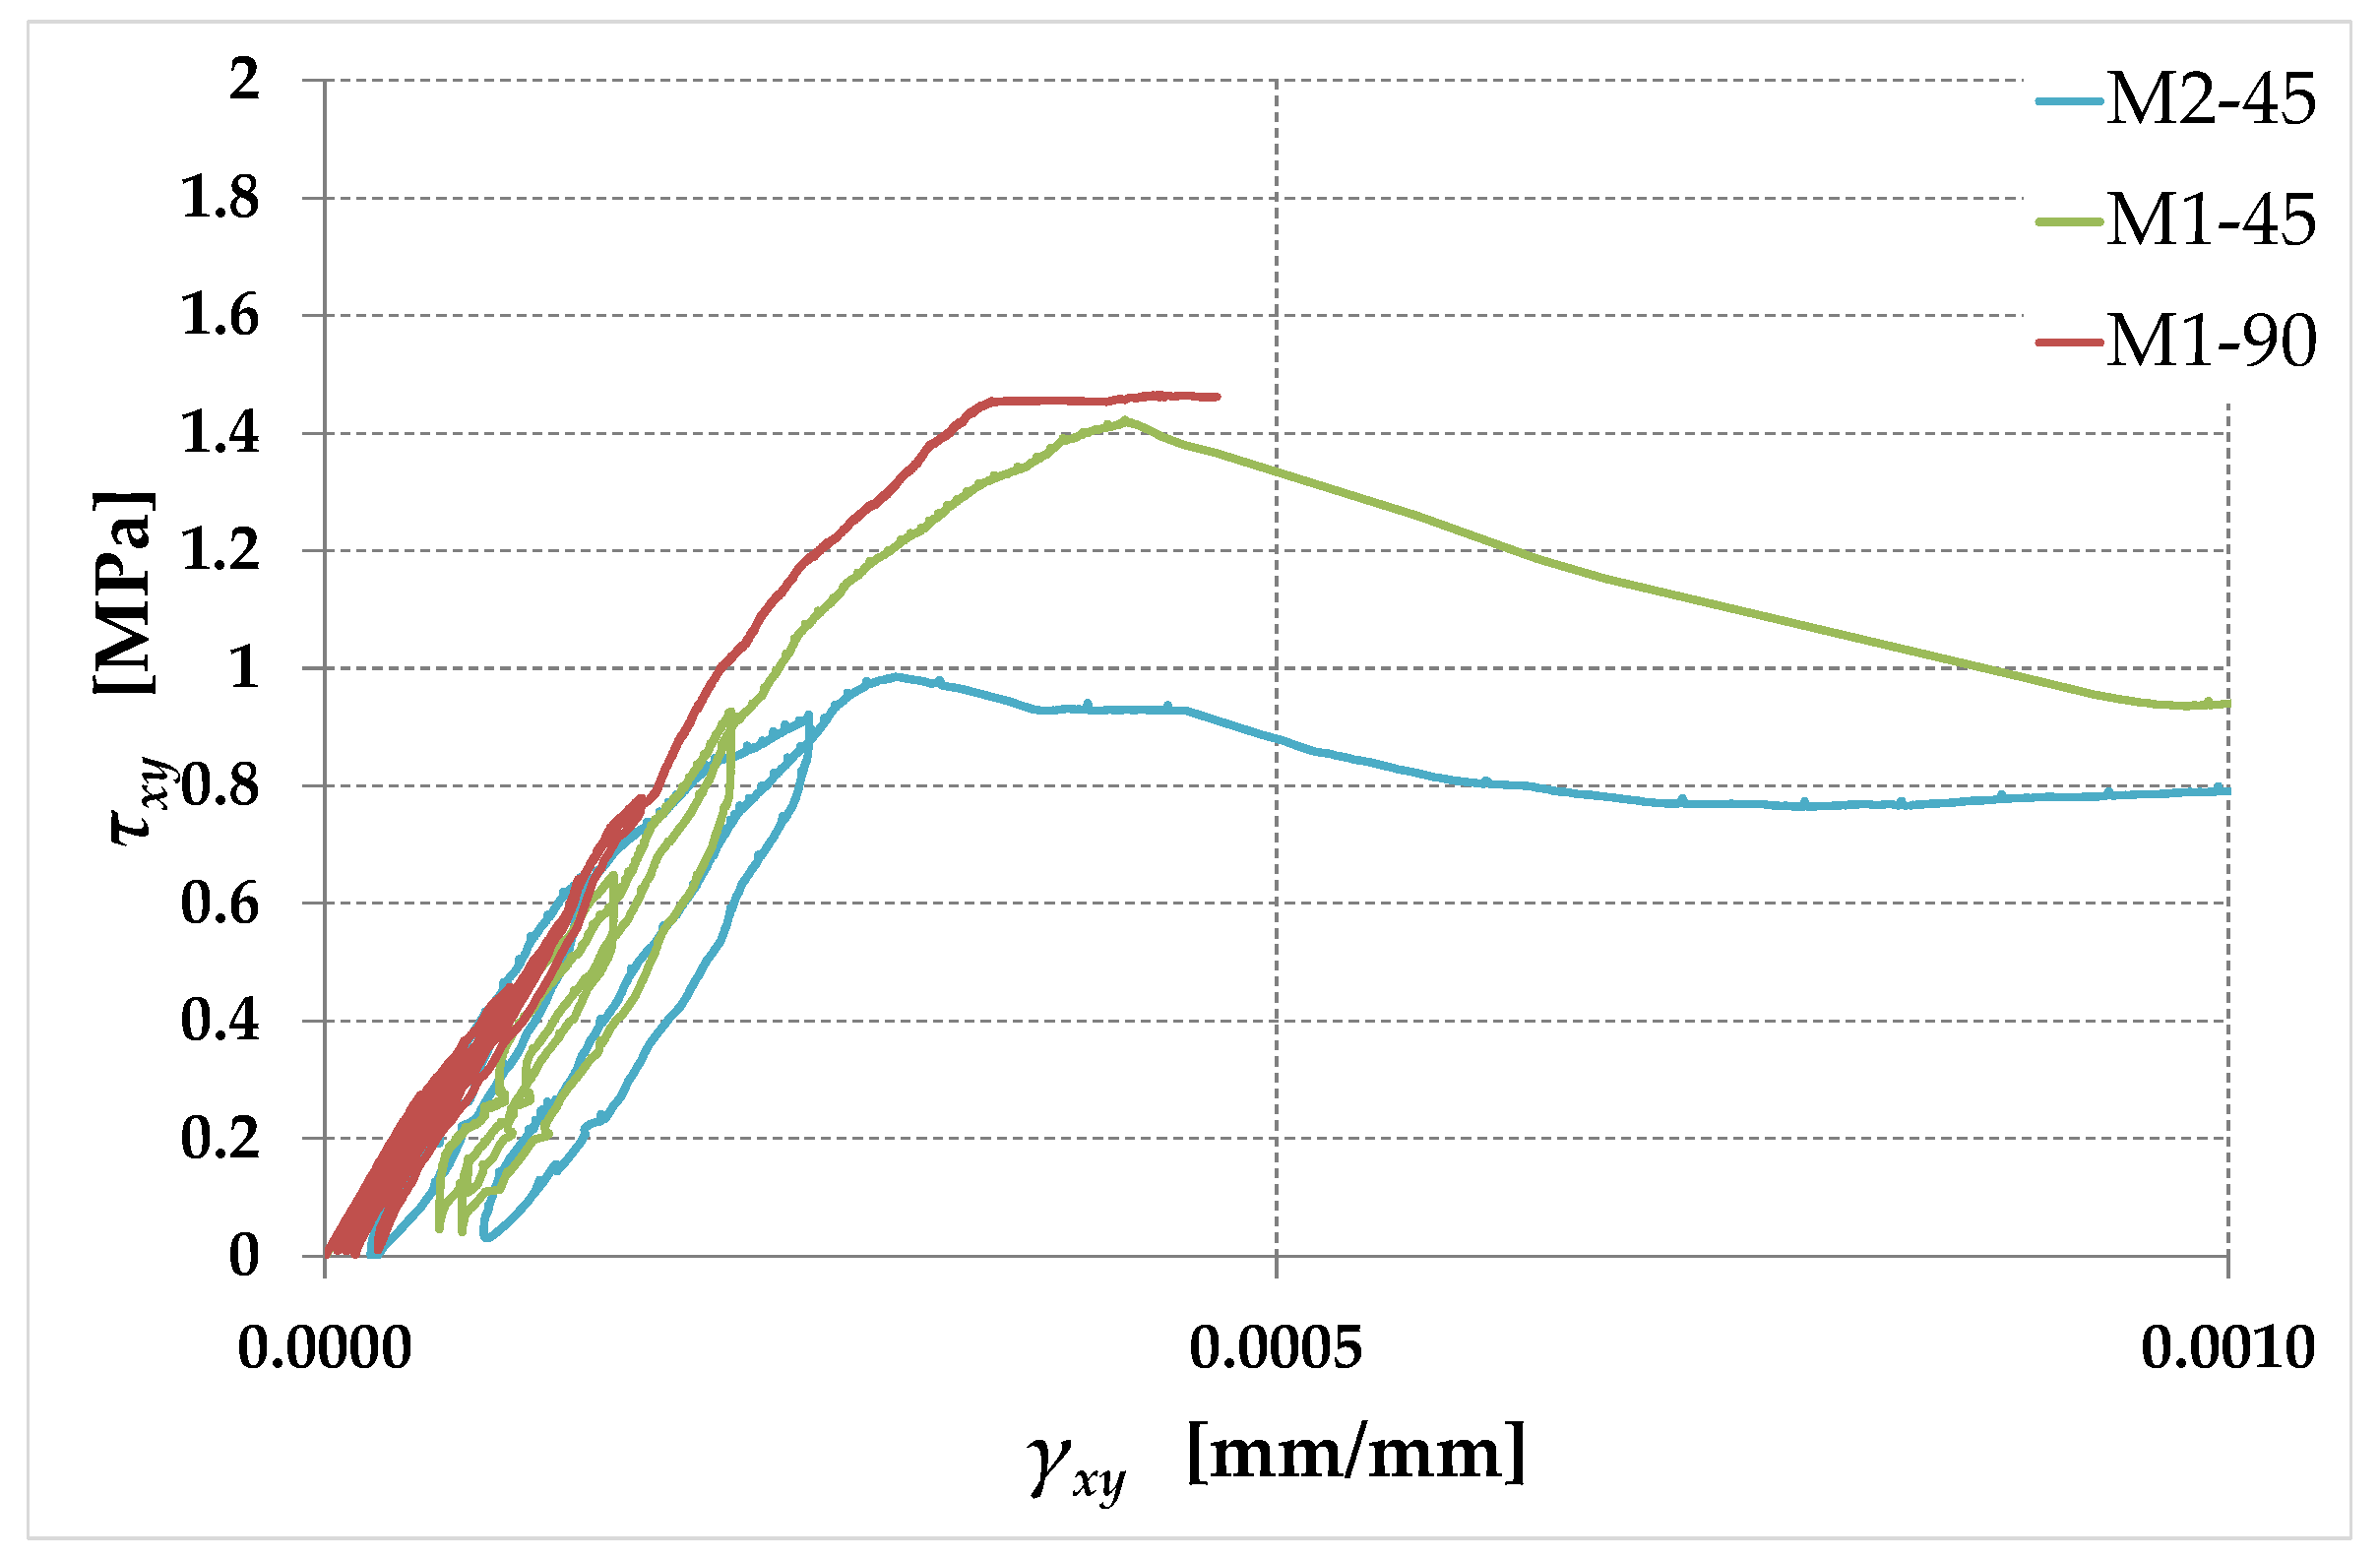
Figure 25.
Straps activated by a seismic load: (a) In the plane of the wall; (b) As explained by the stress analysis performed in the Mohr plane for the infinitesimal neighborhood of point .
Figure 25.
Straps activated by a seismic load: (a) In the plane of the wall; (b) As explained by the stress analysis performed in the Mohr plane for the infinitesimal neighborhood of point .
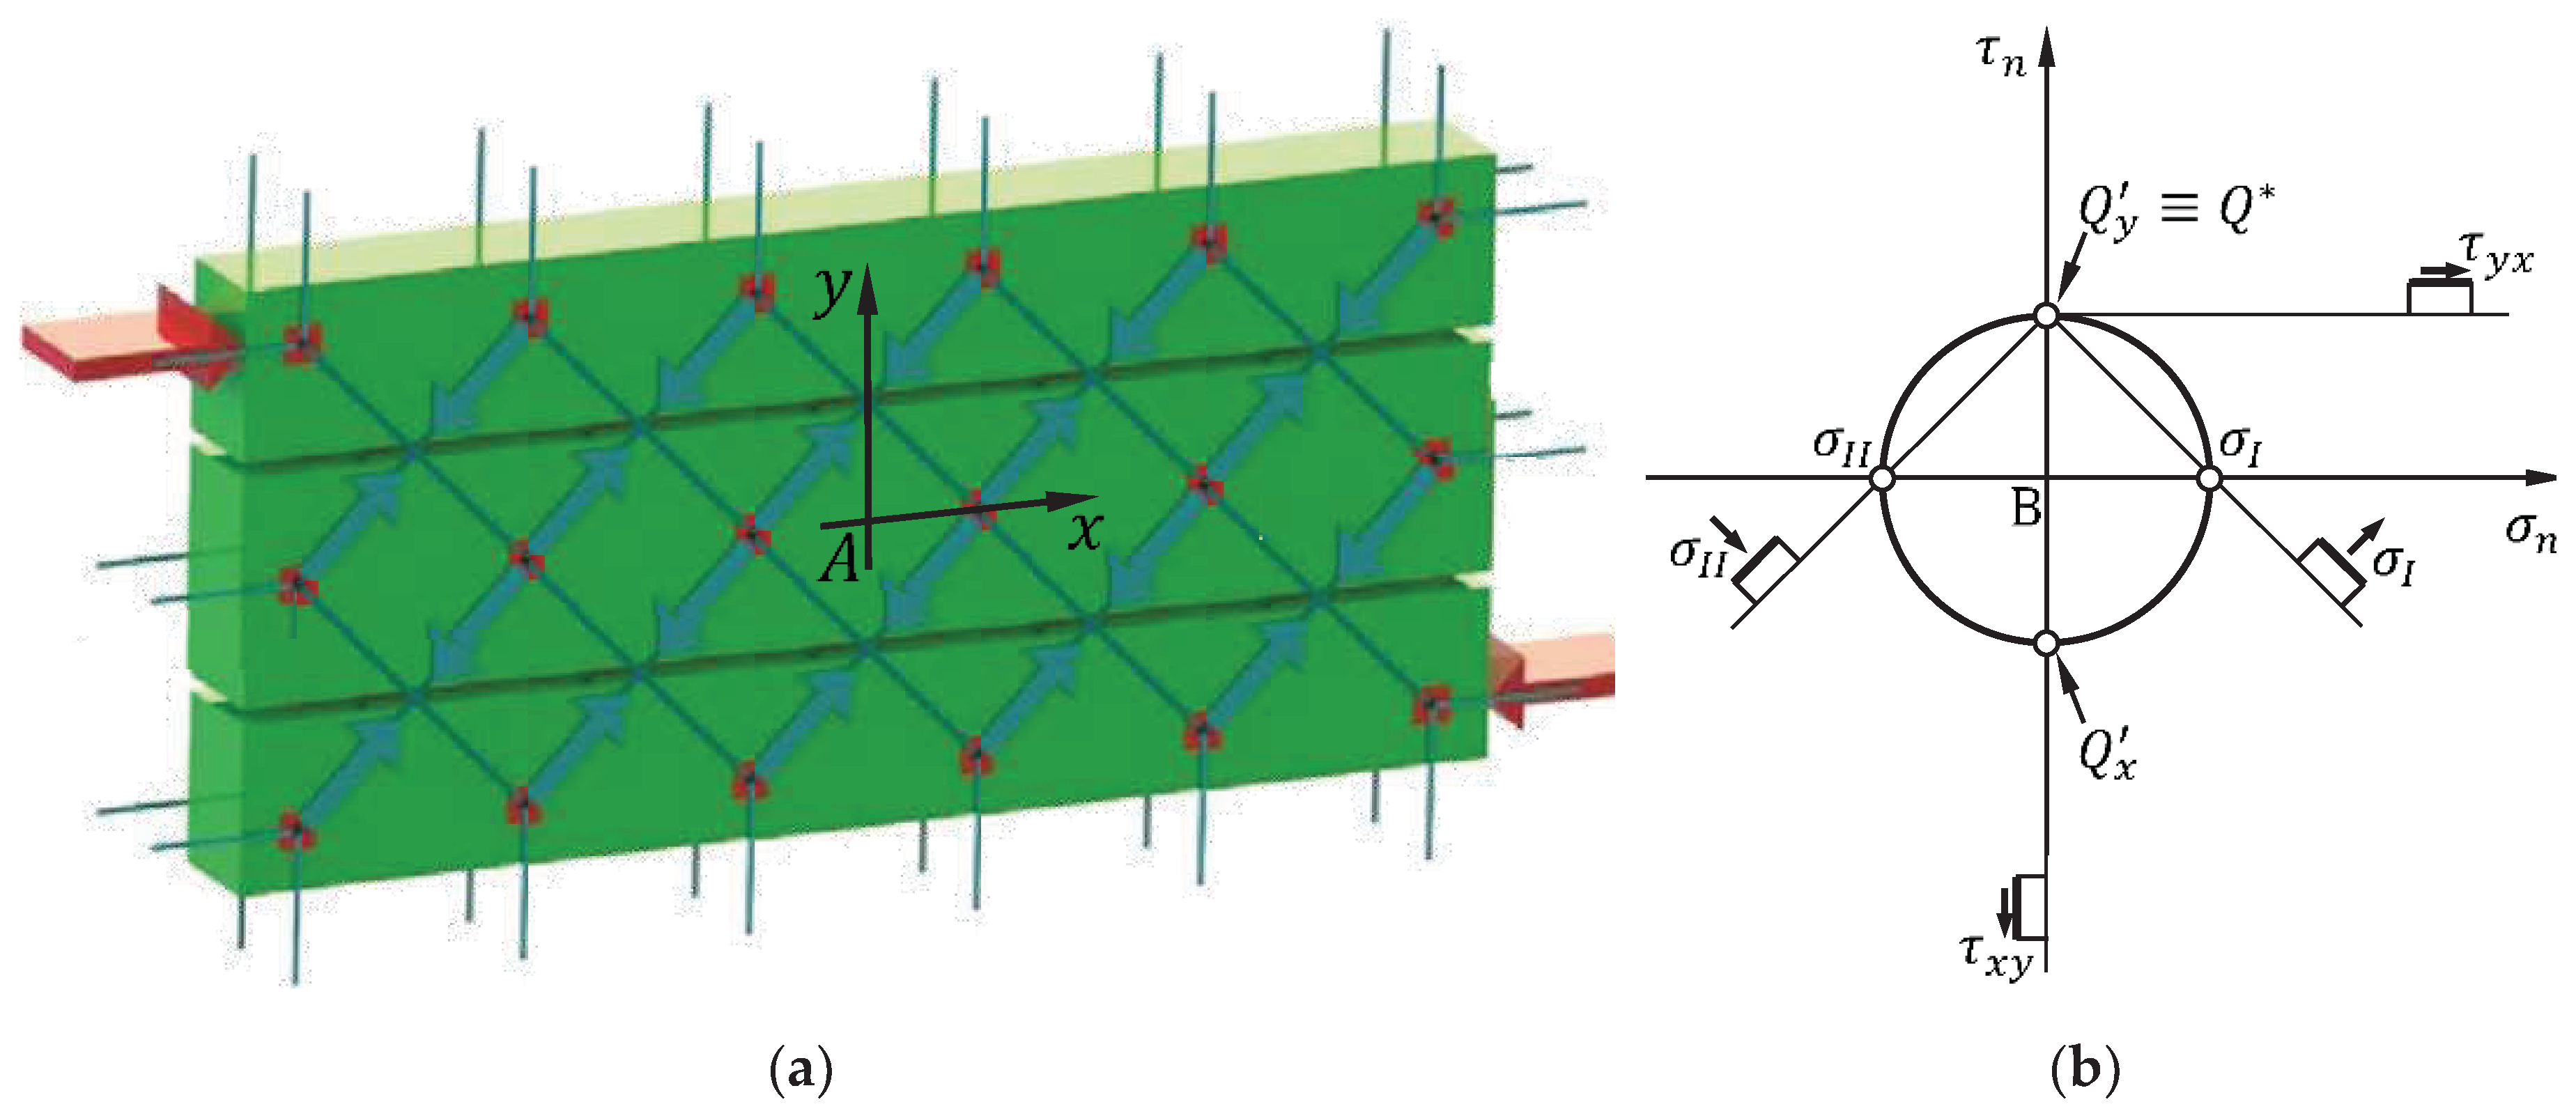
Figure 26.
Stress analysis performed in the Mohr plane for the infinitesimal neighborhood of point when the direction of the seismic load reverses.
Figure 26.
Stress analysis performed in the Mohr plane for the infinitesimal neighborhood of point when the direction of the seismic load reverses.
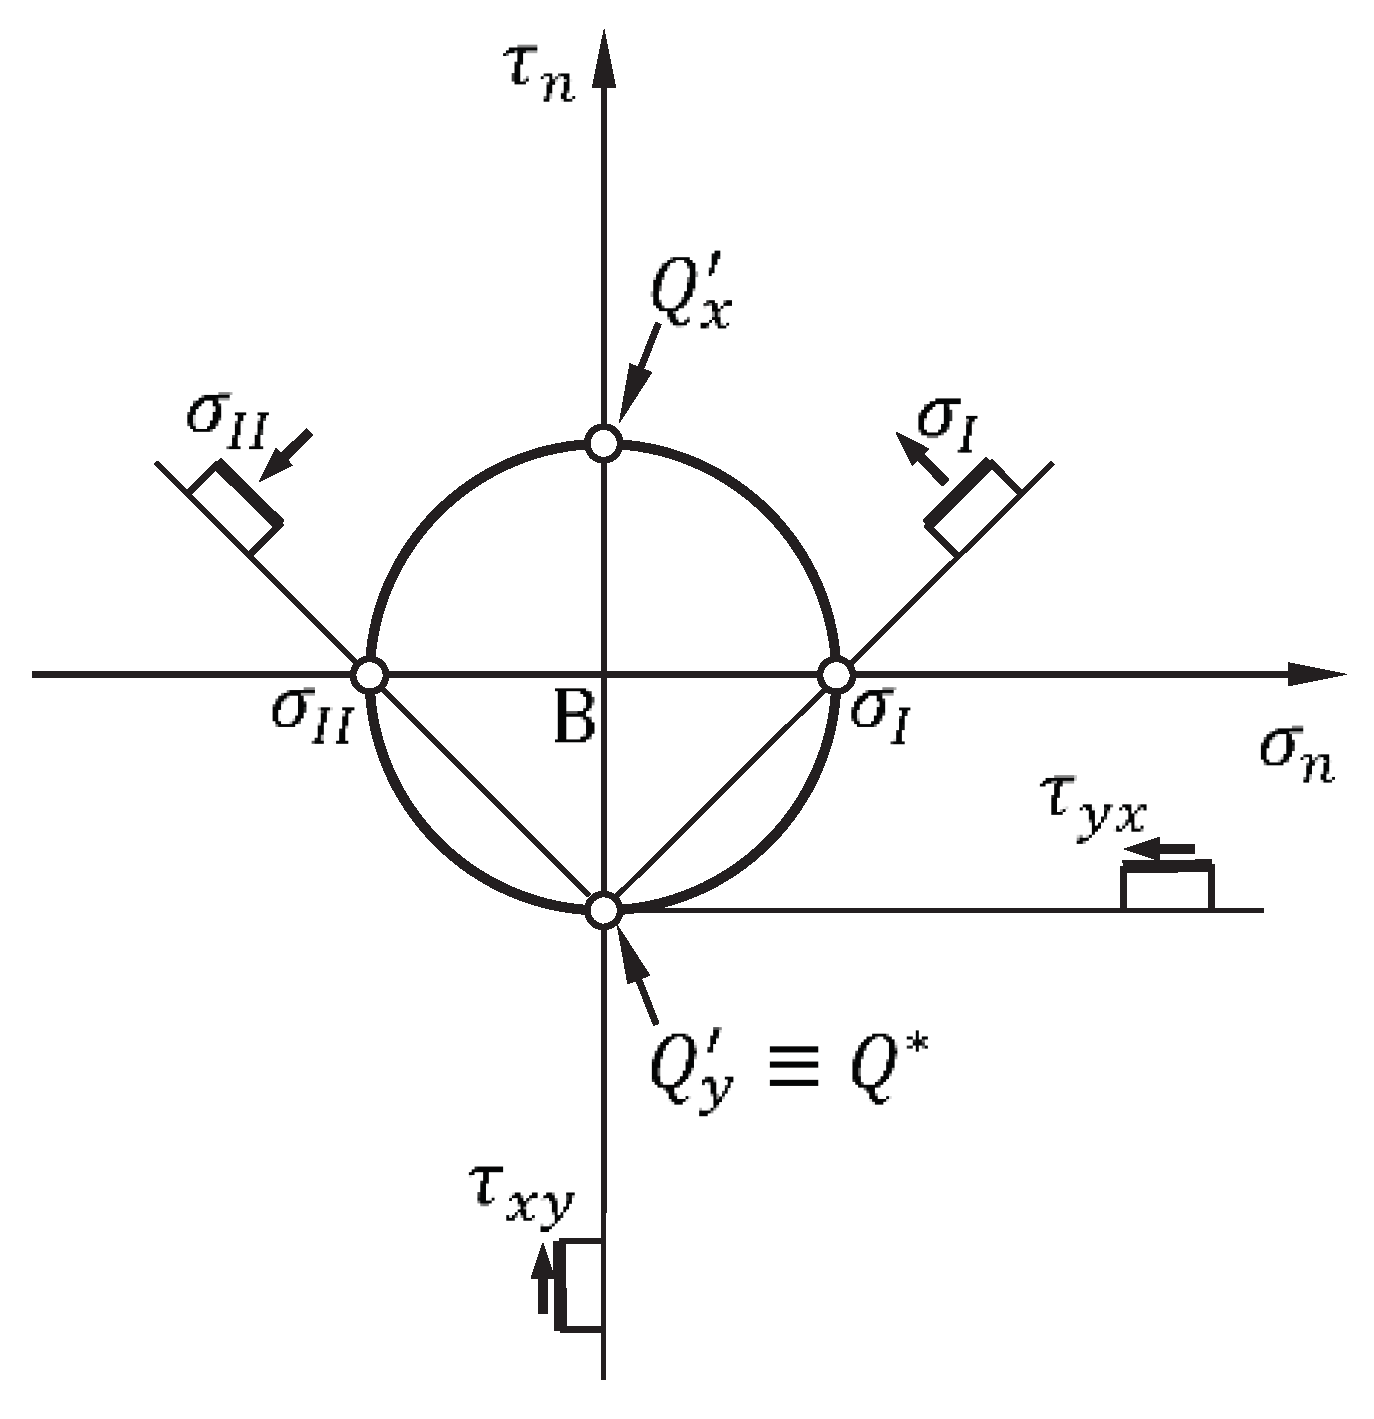
Figure 27.
Seismic retrofitting provided by different types of strengthening systems, which: Increase ductility but not strength (point a); Increase strength but not ductility (point b); Increase both strength and ductility (point c).
Figure 27.
Seismic retrofitting provided by different types of strengthening systems, which: Increase ductility but not strength (point a); Increase strength but not ductility (point b); Increase both strength and ductility (point c).
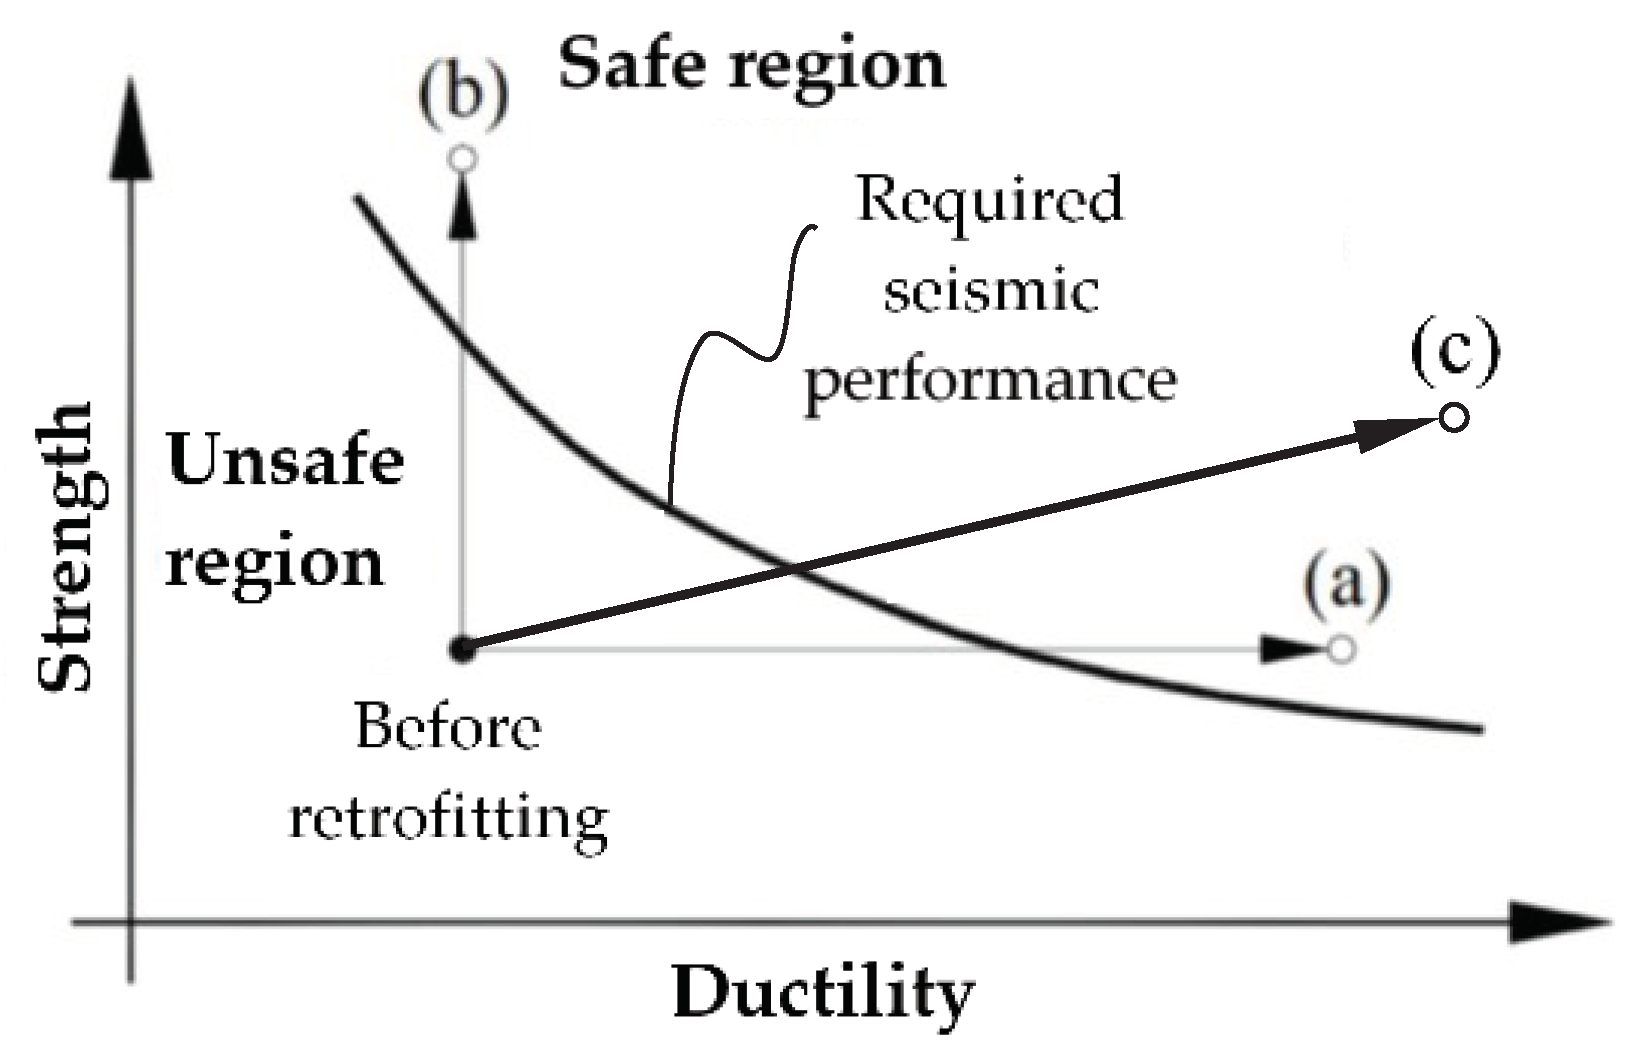
Figure 28.
Uniaxial stress/strain relationships obtained for Specimen M1-90.
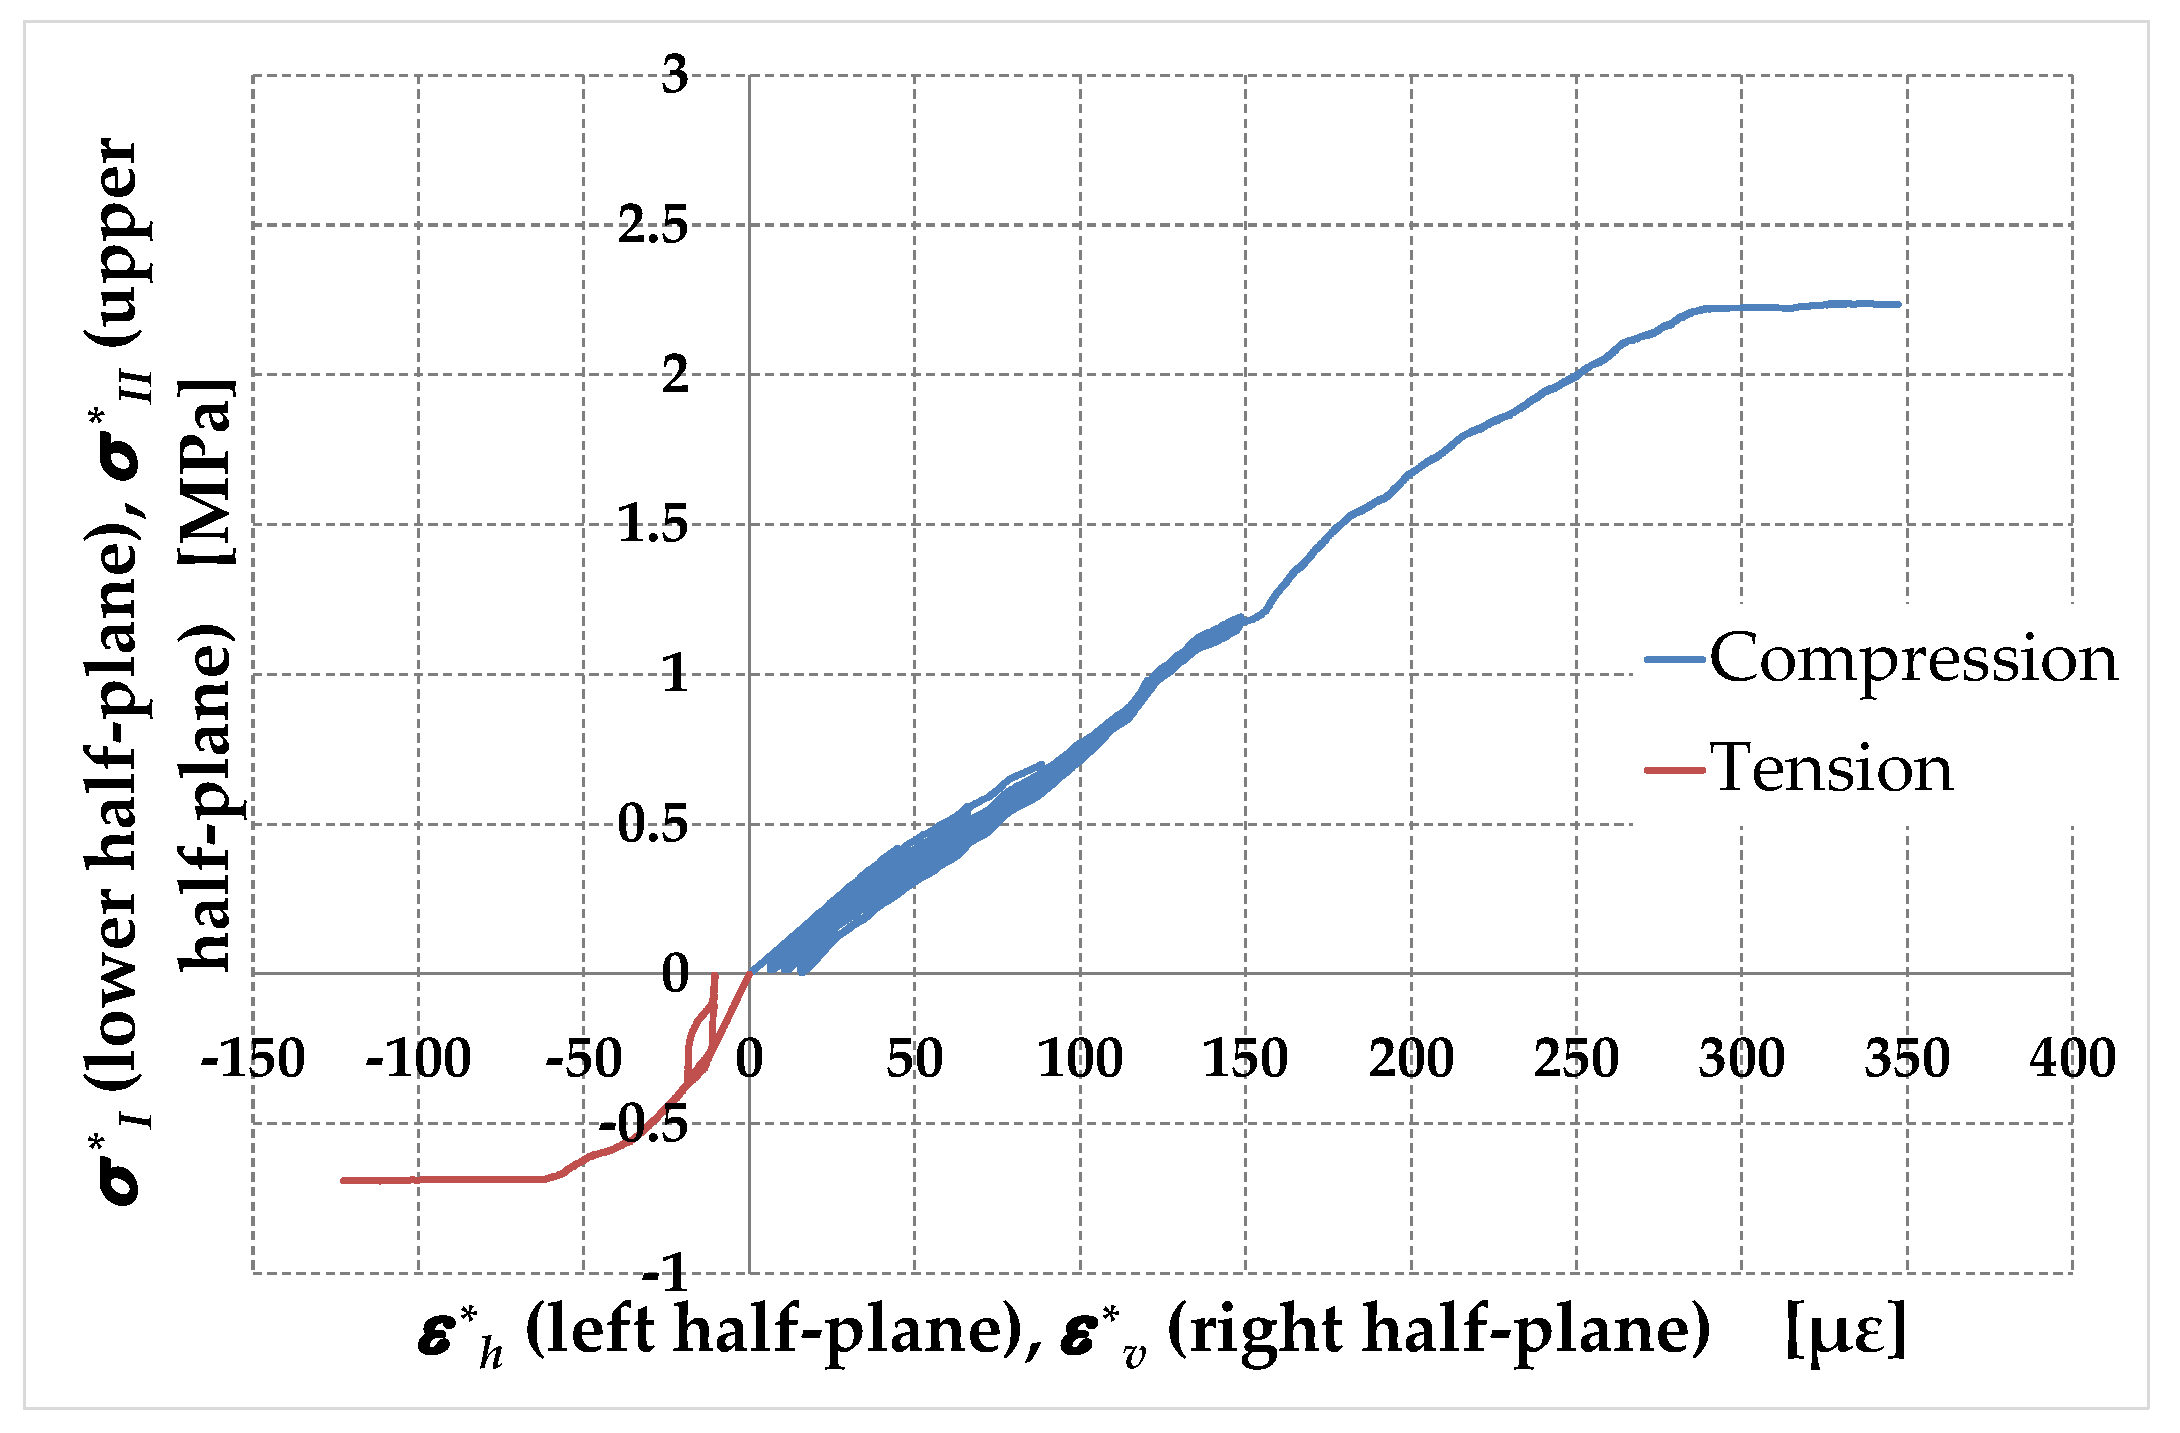
Figure 29.
Uniaxial stress/strain relationships of Specimen M1-45: (a) Until the end of the loading test; (b) Truncated, to highlight the difference in slope at the origin in the two quadrants.
Figure 29.
Uniaxial stress/strain relationships of Specimen M1-45: (a) Until the end of the loading test; (b) Truncated, to highlight the difference in slope at the origin in the two quadrants.
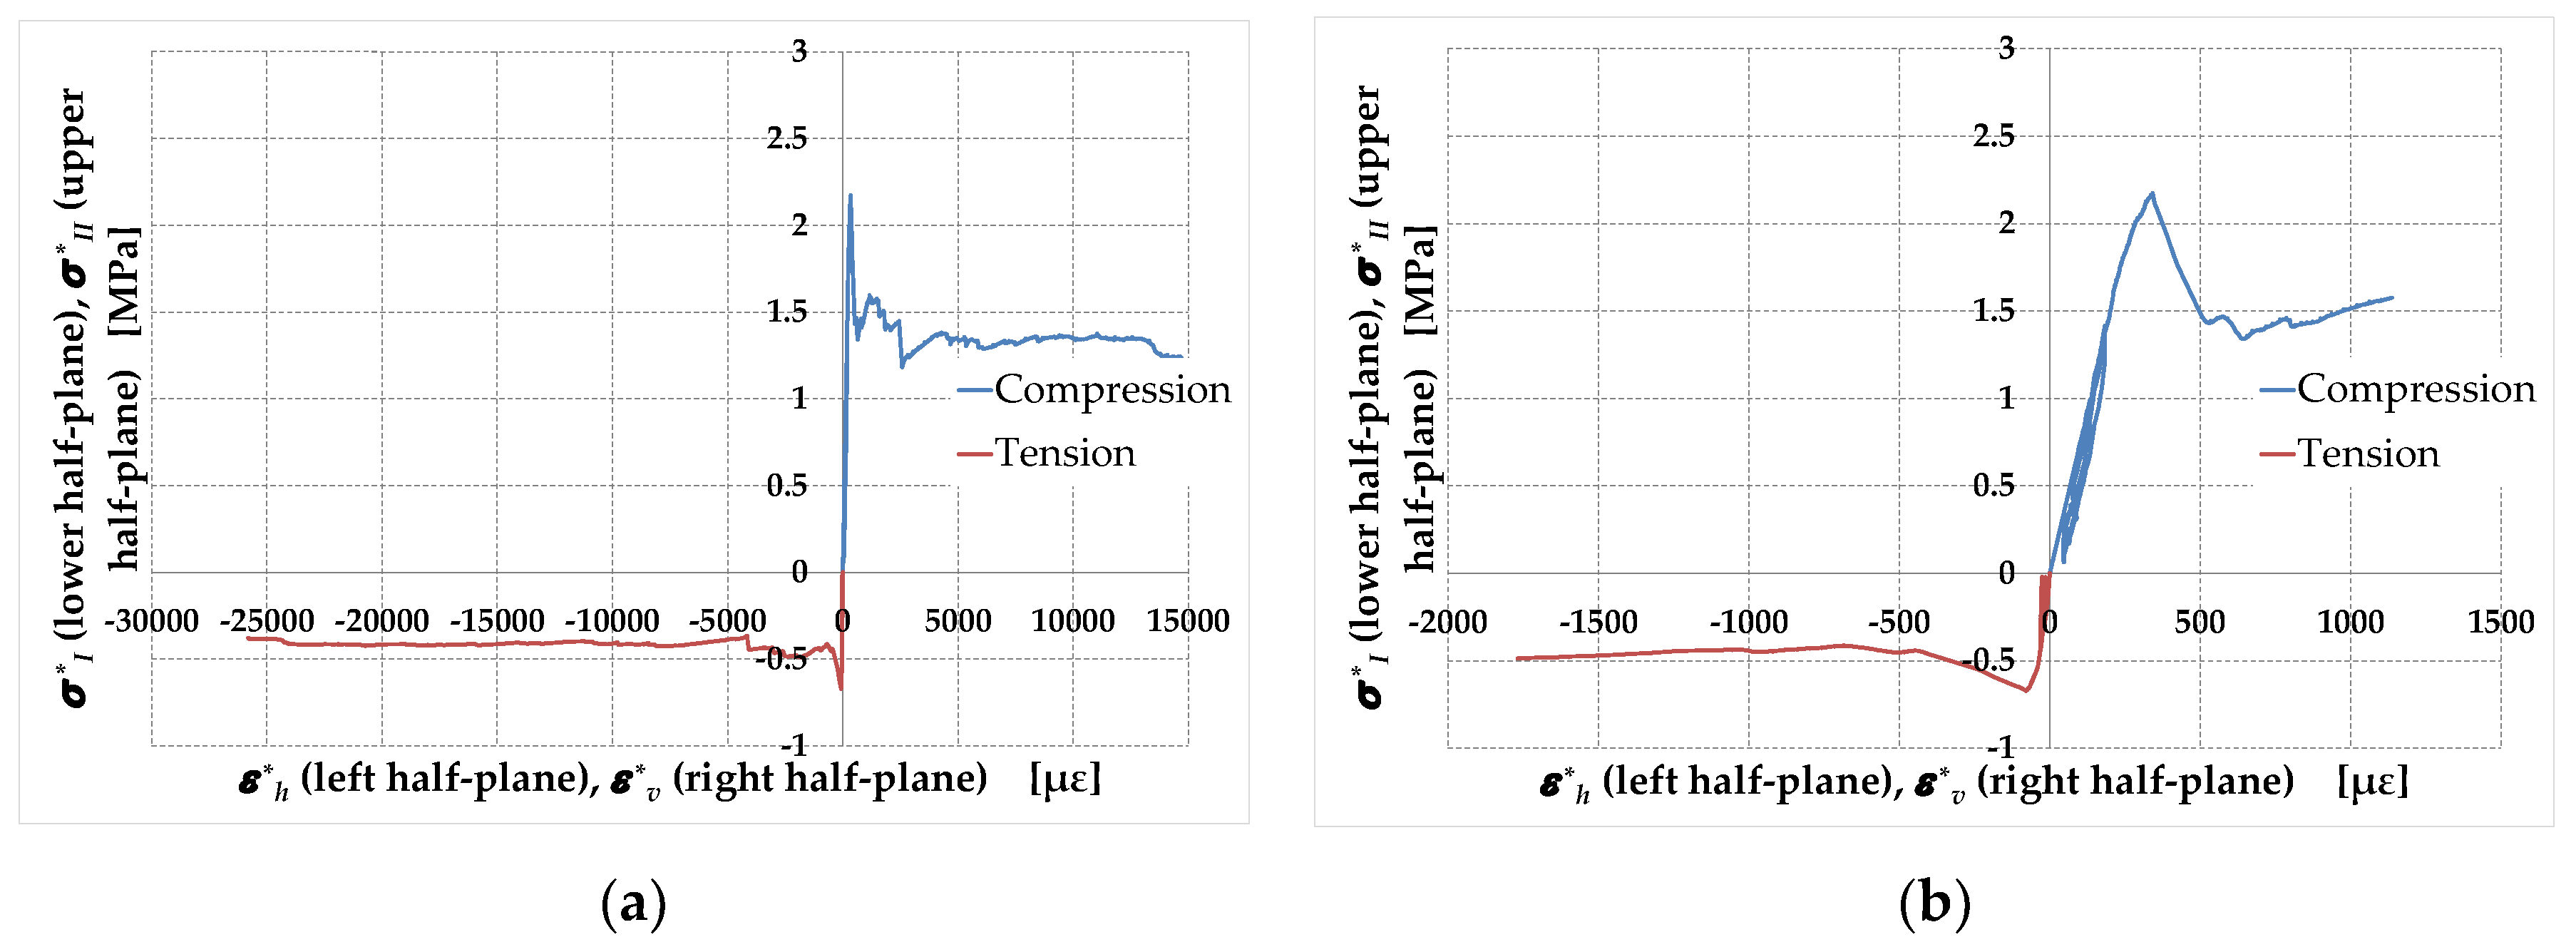
Figure 30.
Uniaxial stress/strain relationships of Specimen M2-45: (a) Until the end of the loading test; (b) Truncated, to highlight the difference in slope at the origin in the two quadrants.
Figure 30.
Uniaxial stress/strain relationships of Specimen M2-45: (a) Until the end of the loading test; (b) Truncated, to highlight the difference in slope at the origin in the two quadrants.
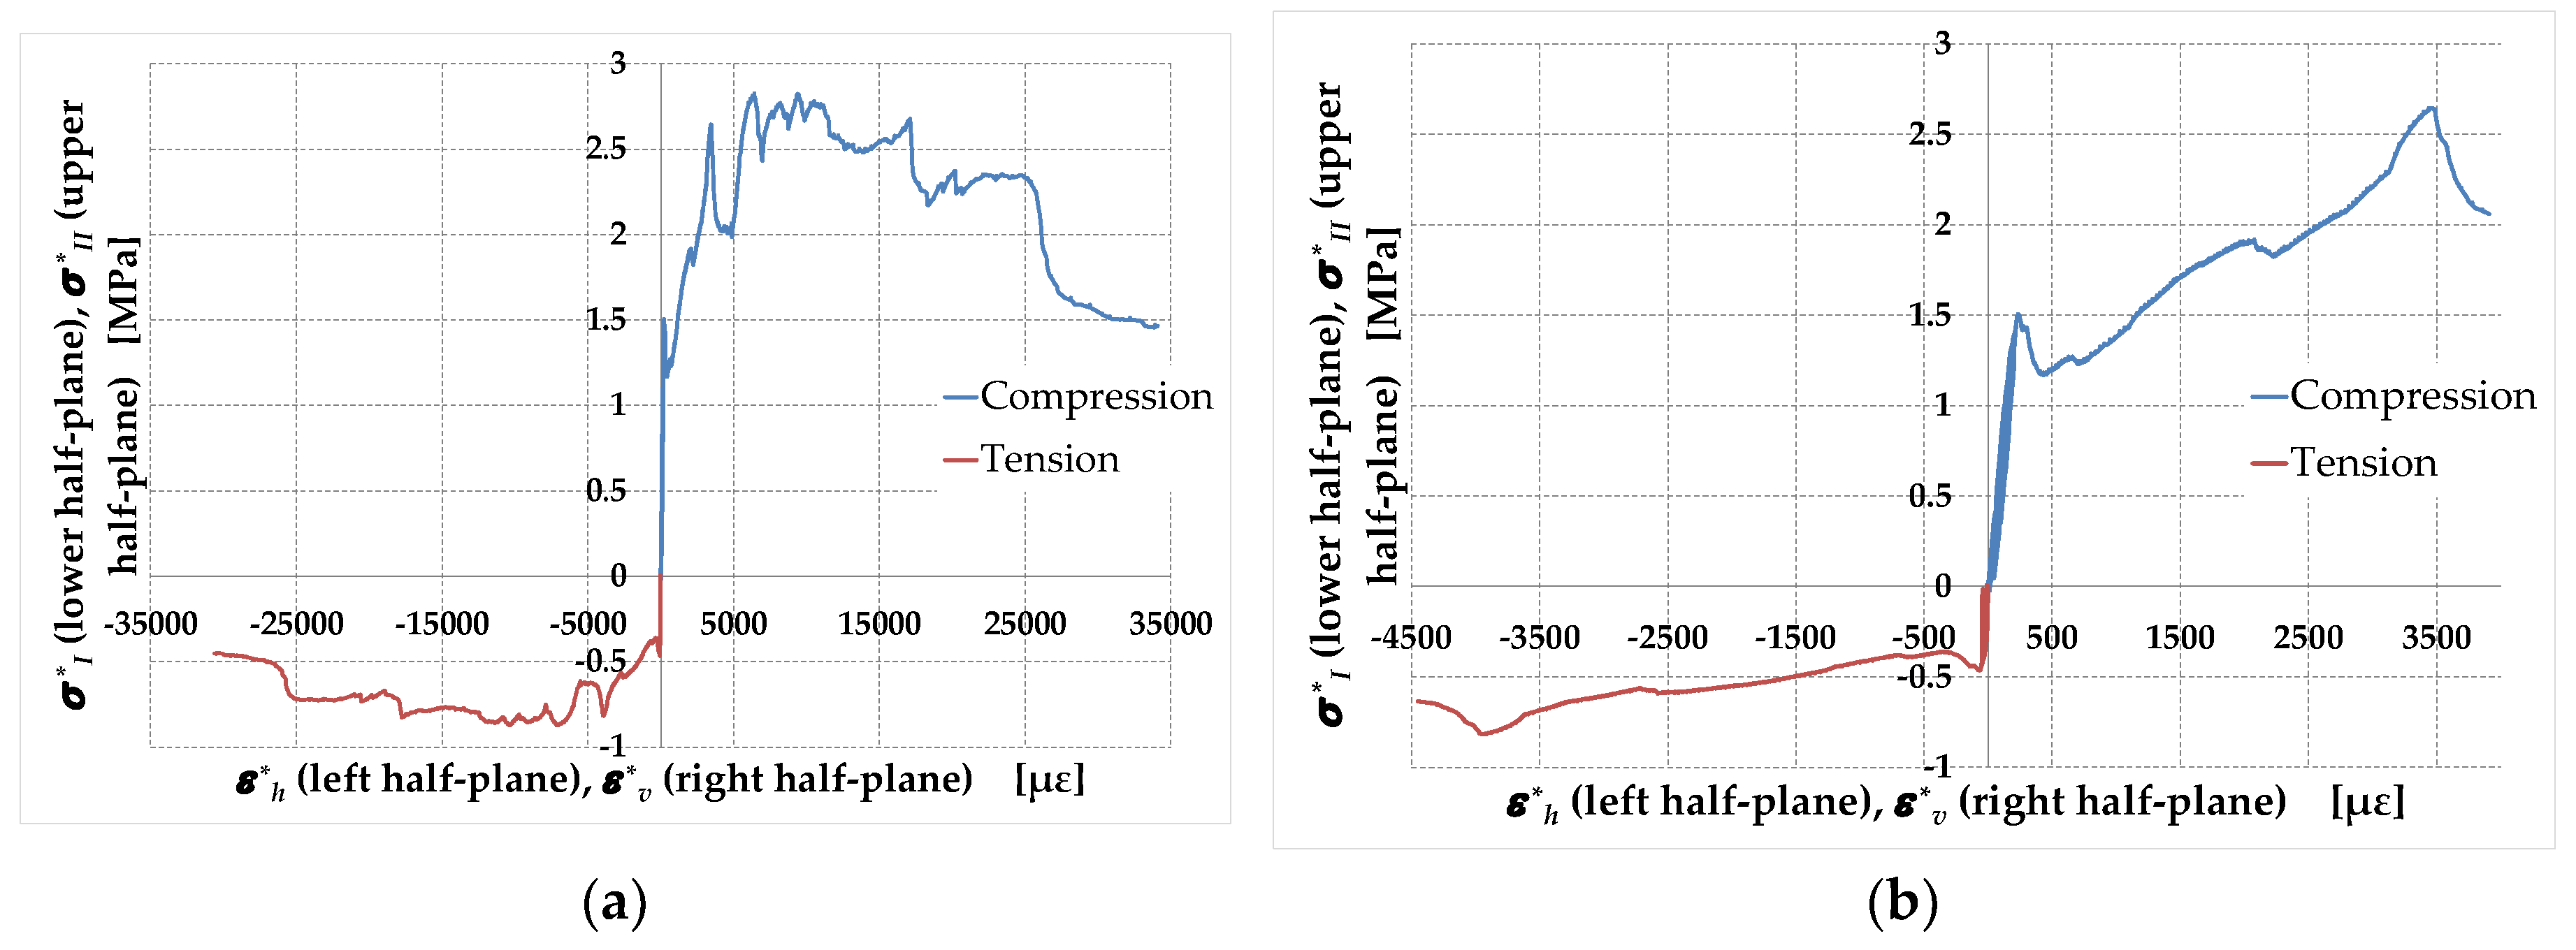
Figure 31.
The three modes of crack propagation in fracture mechanics [73].
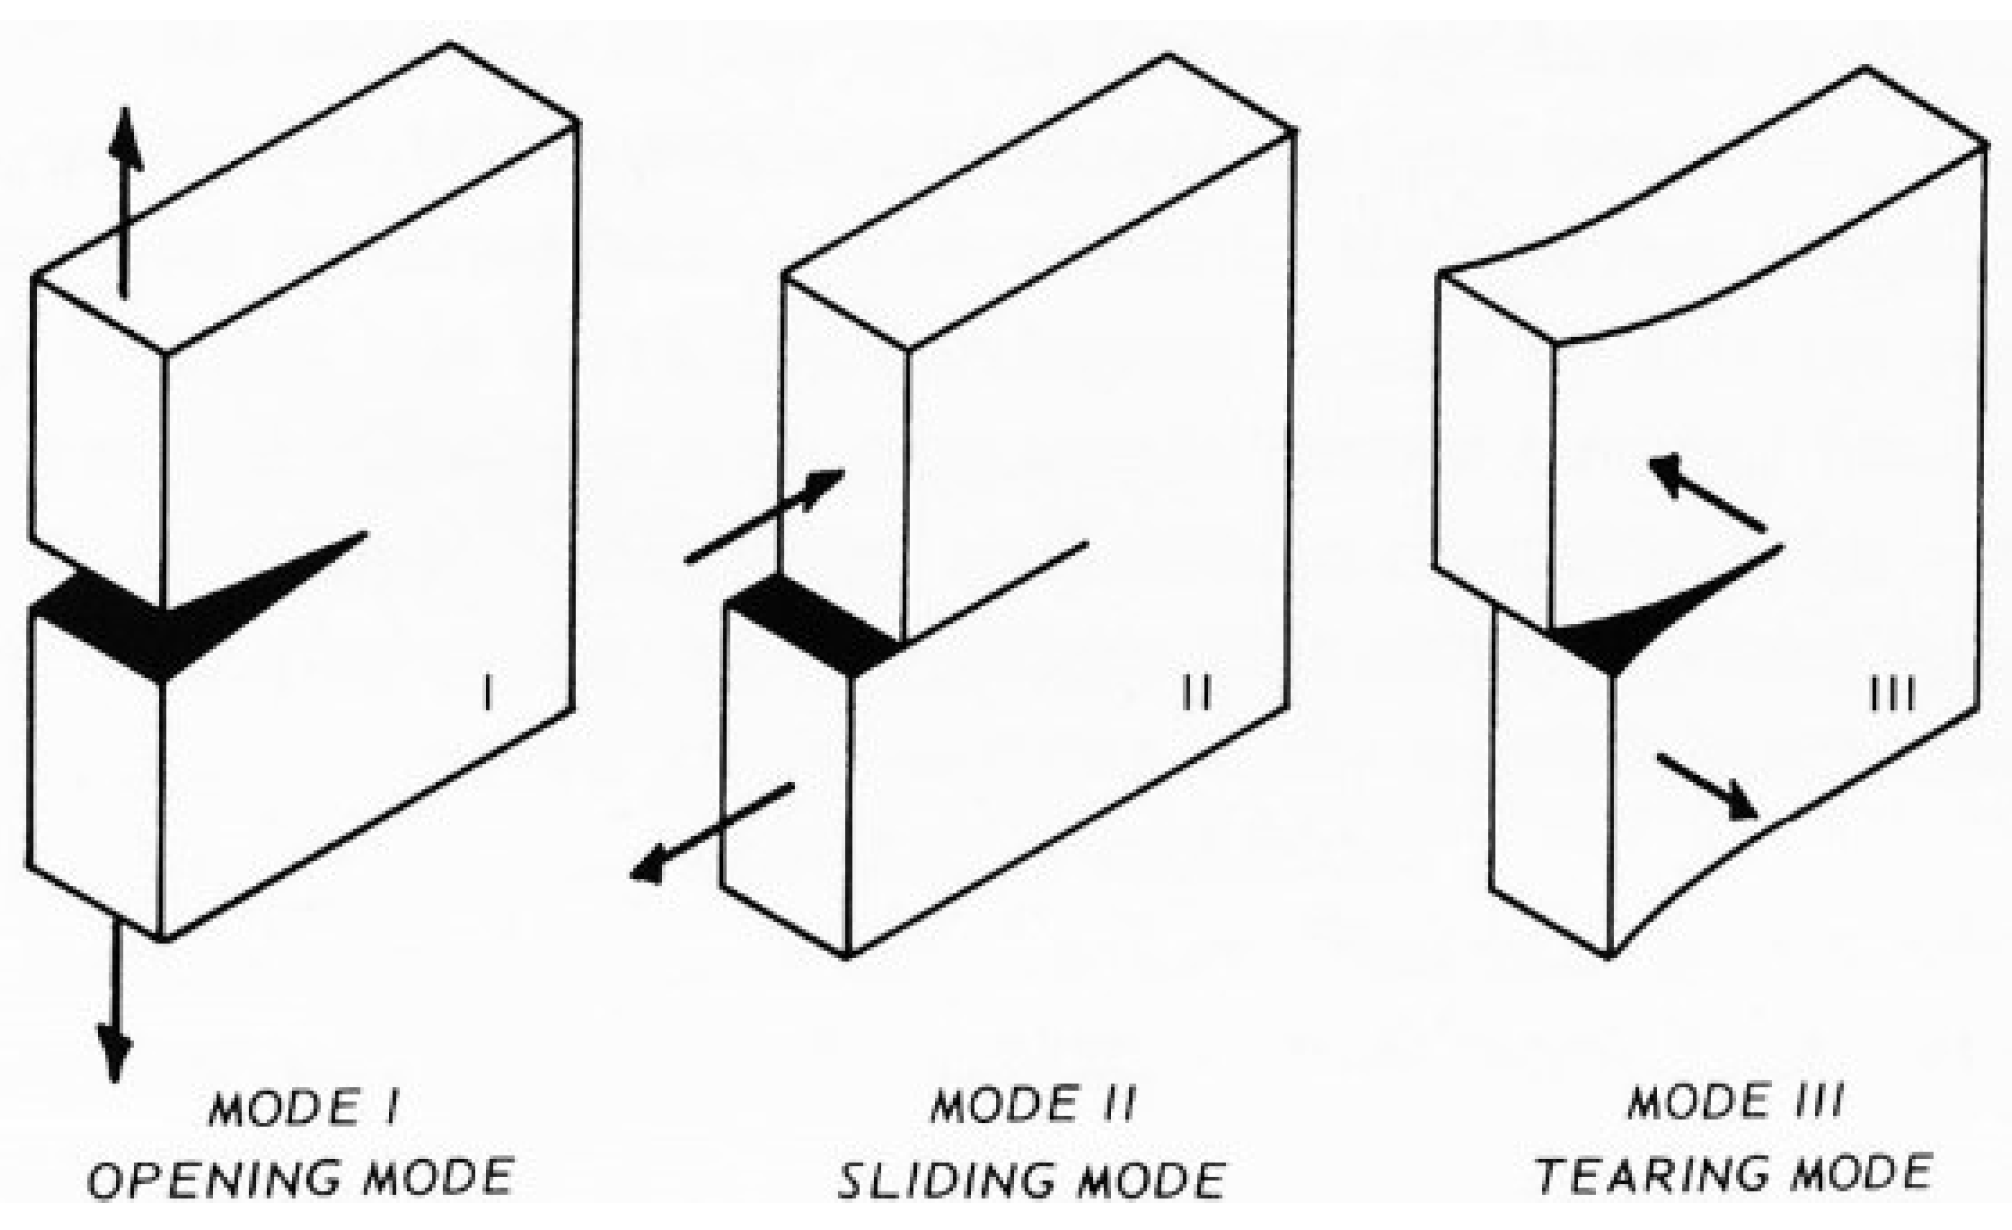
Figure 32.
Apparent Poisson’s ratio versus strain : specimen M1-90.
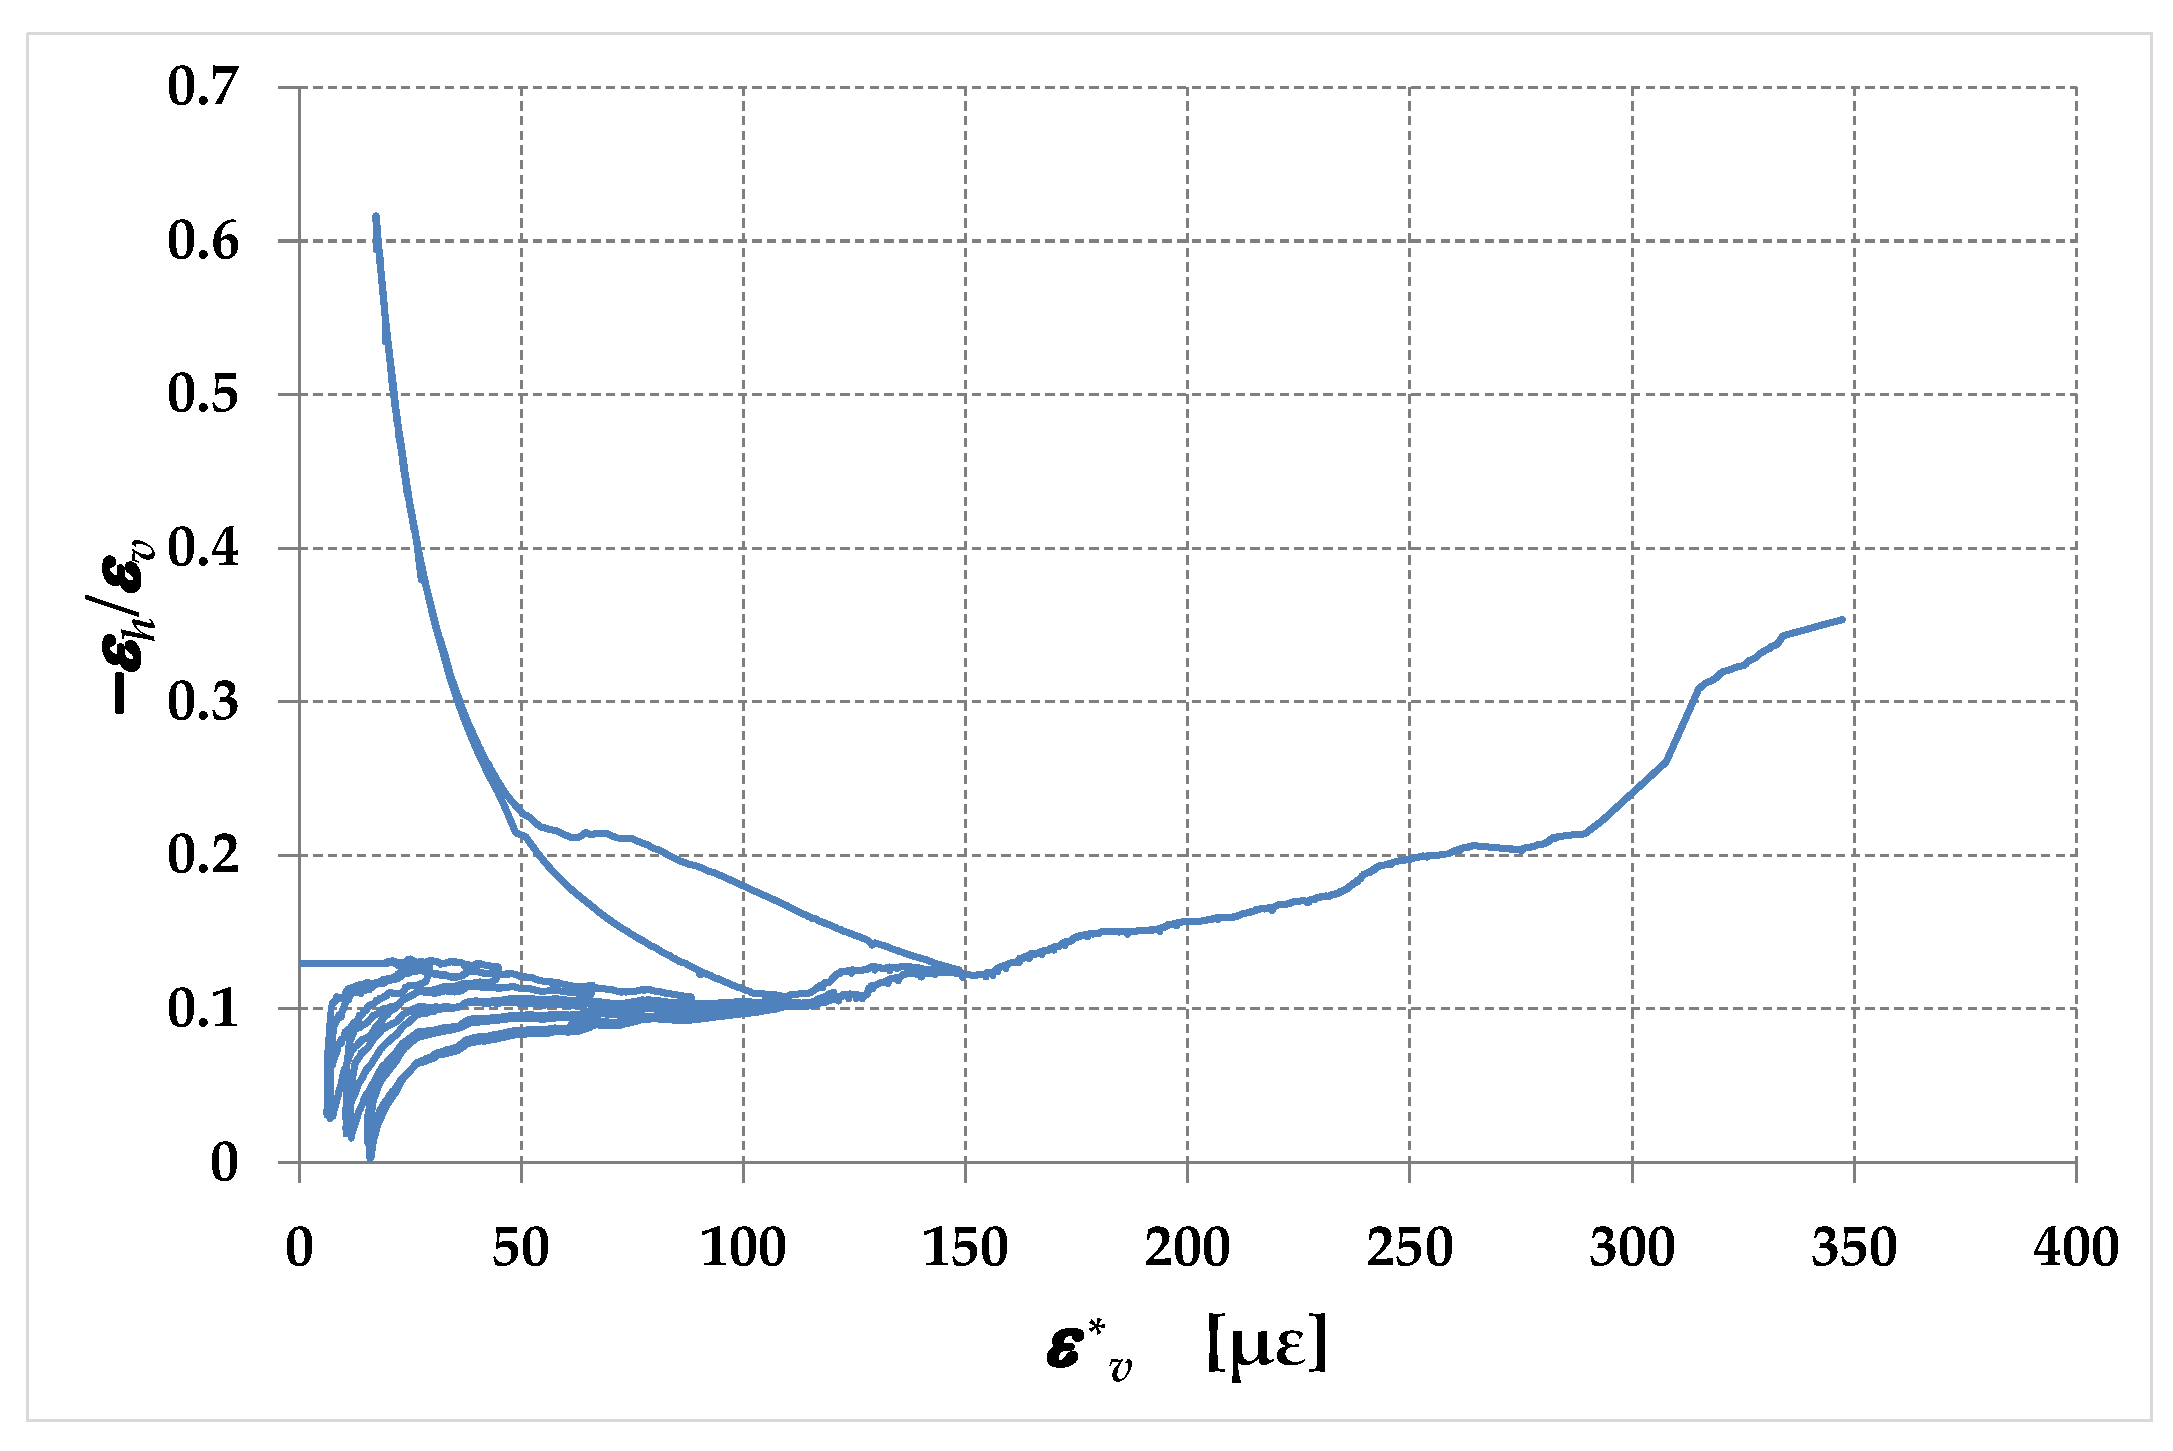
Figure 33.
Apparent Poisson’s ratio versus strain : specimen M1-45.
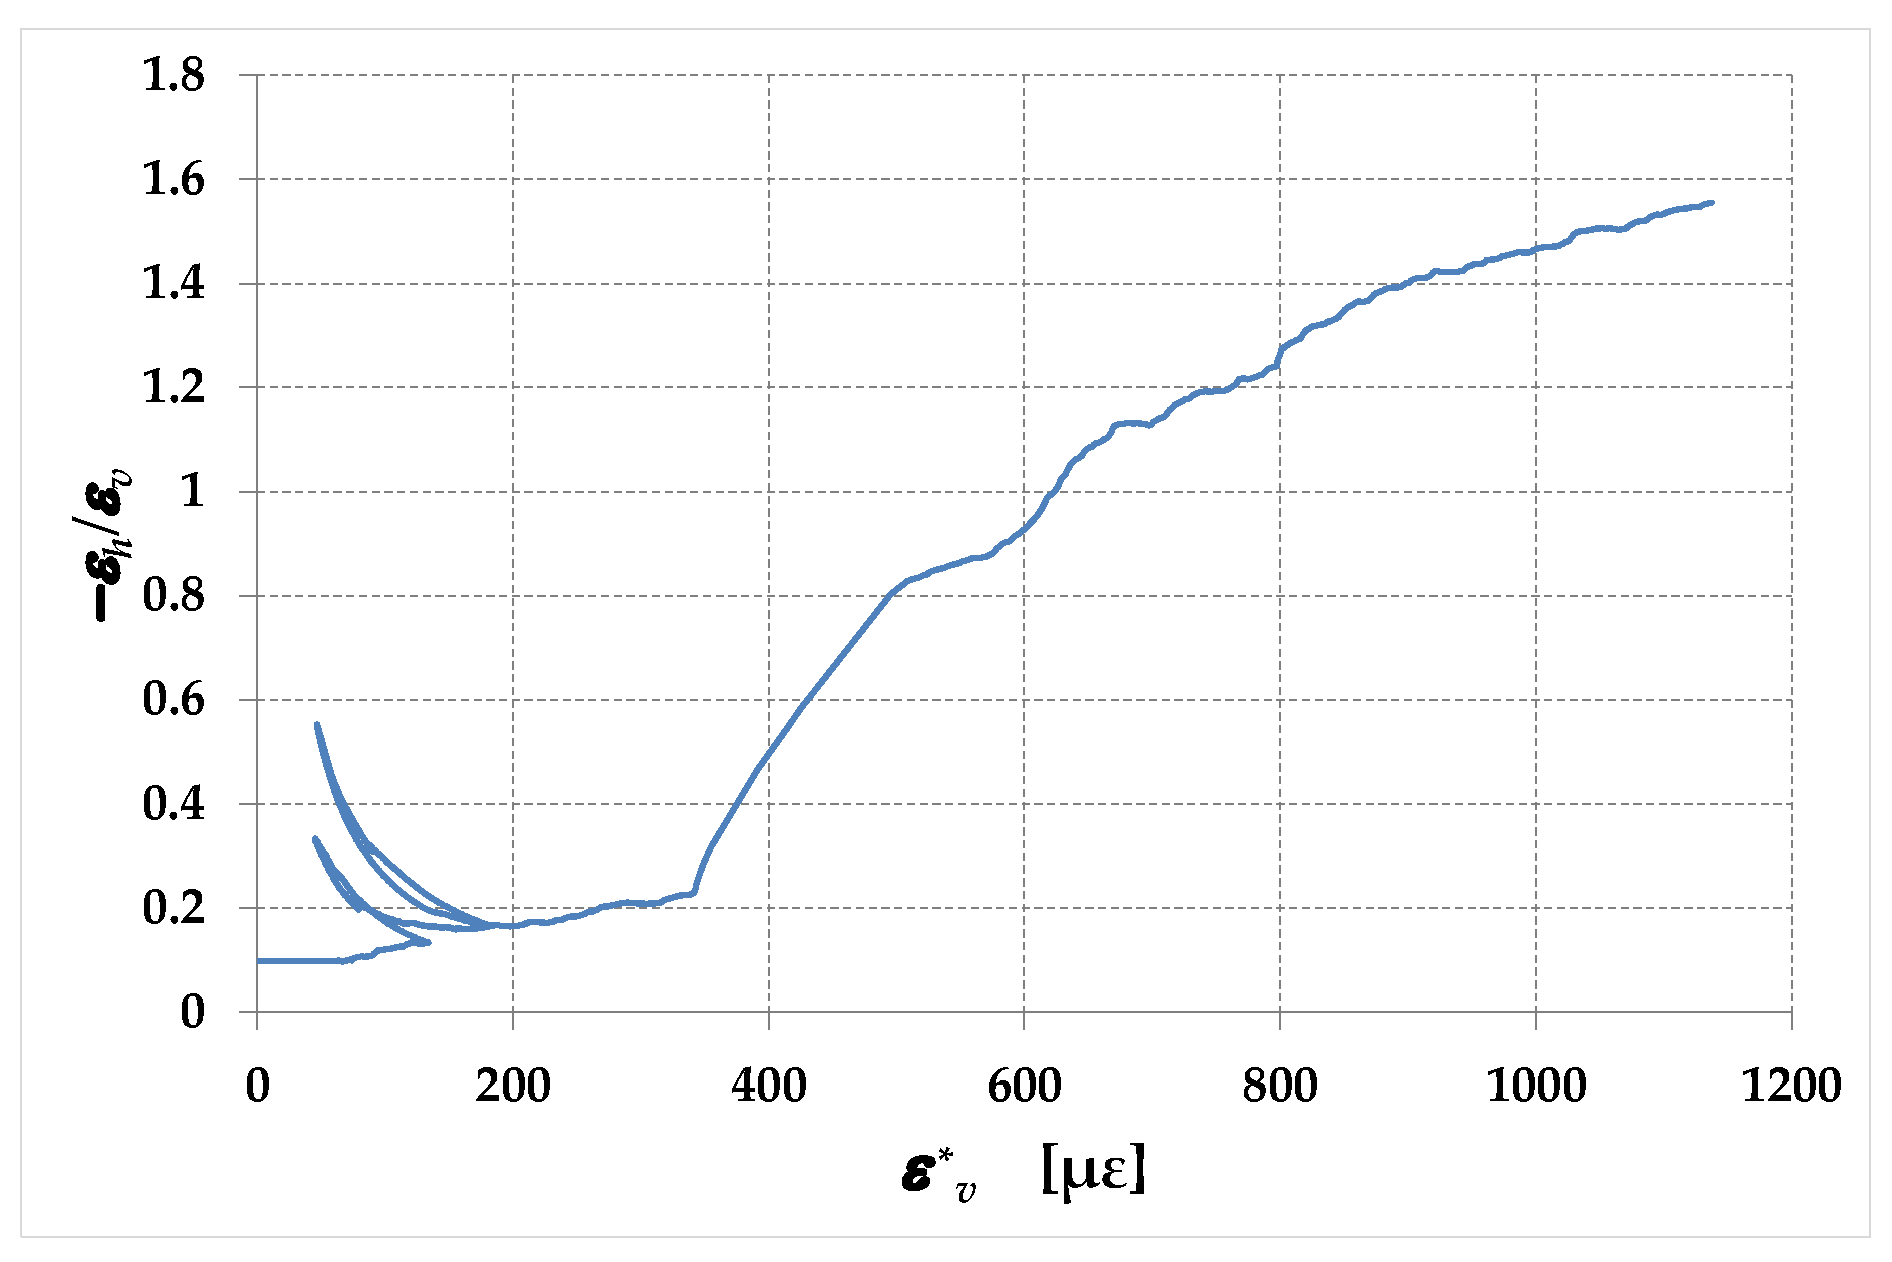
Figure 34.
Apparent Poisson’s ratio versus strain : specimen M2-45.
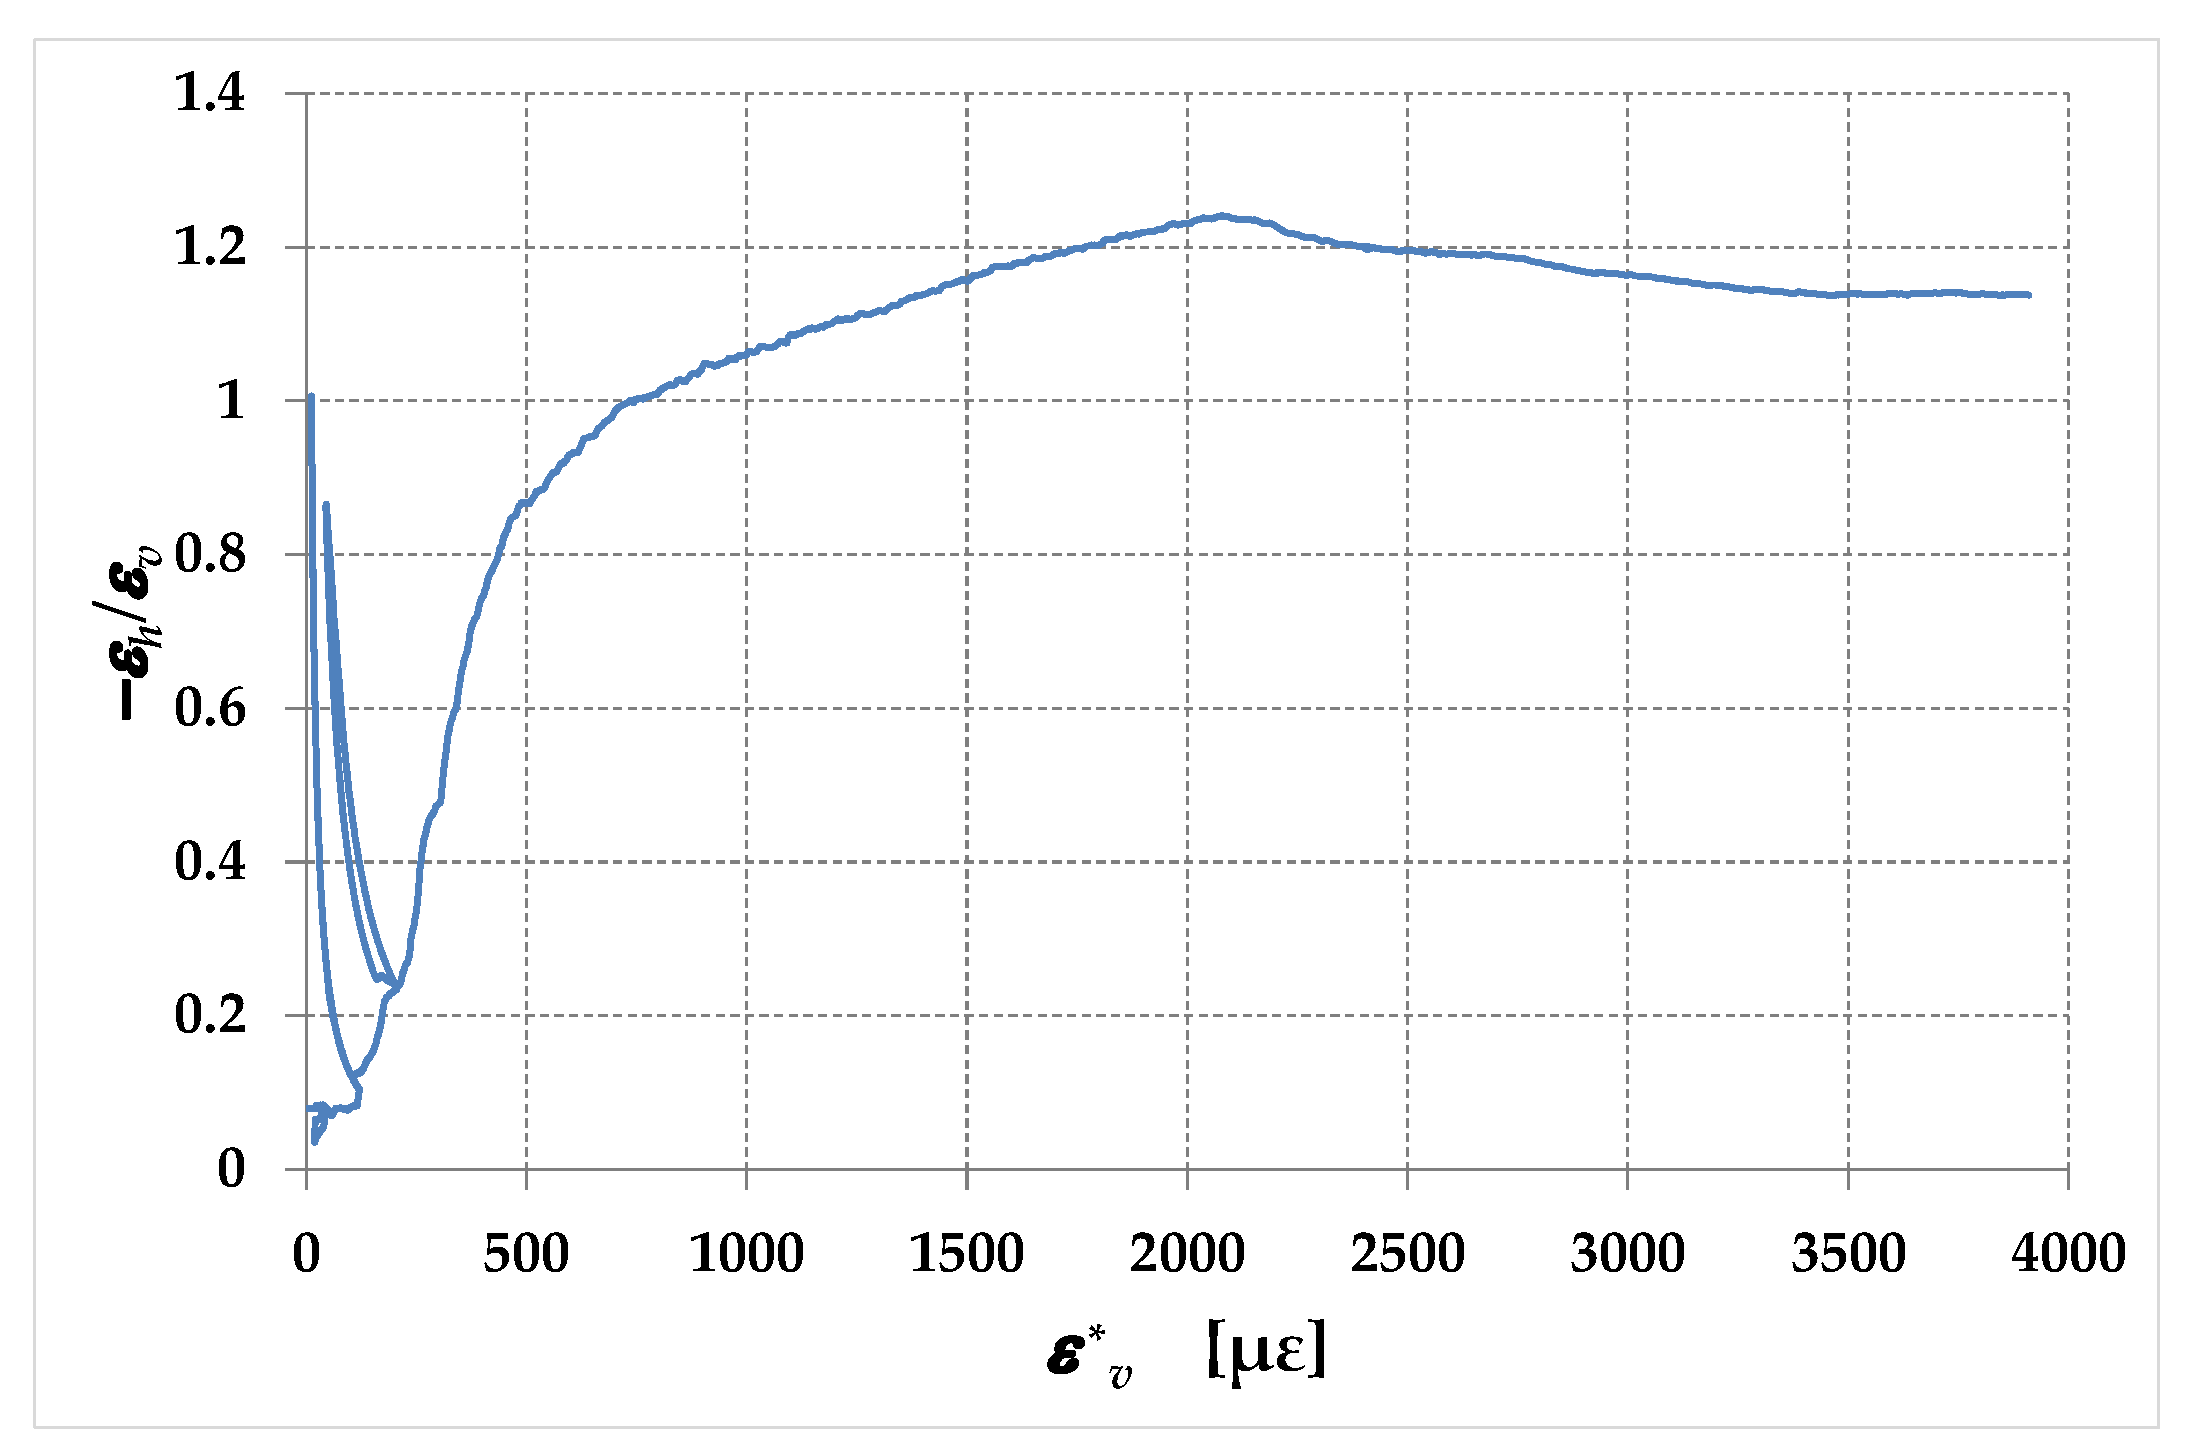
Figure 35.
Radar diagrams of: (a) specimen M1-90; (b) specimen M1-45 and (c) specimen M2-45.
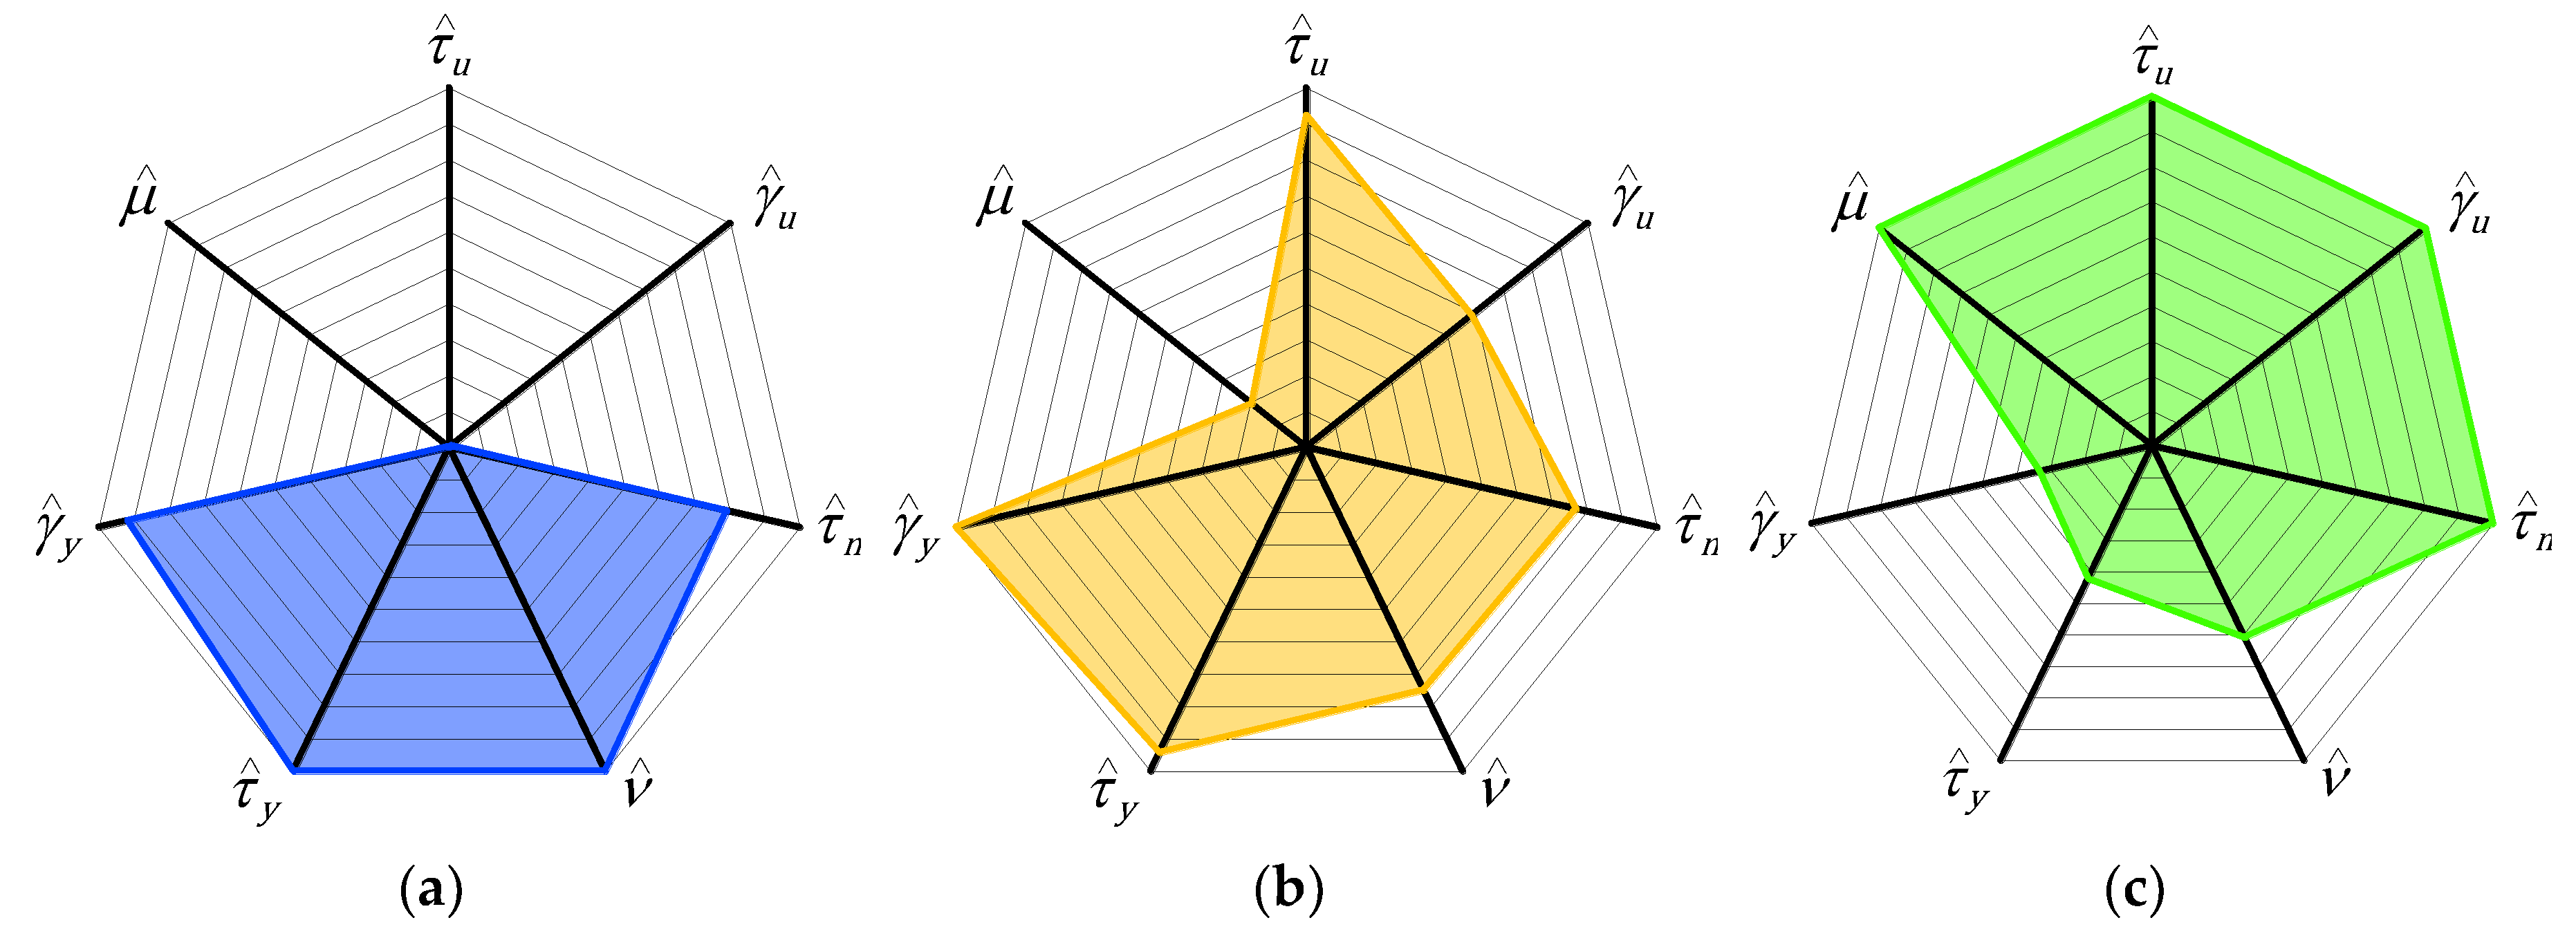

Table 1.
Results of the compression tests on bricks.
| Specimen | Compressive strength [MPa] |
Normalized compressive strength [MPa] |
|---|---|---|
| PA1 | 36,43 | 30,96 |
| PA2 | 36,18 | 30,75 |
| PB1 | 35,30 | 30,01 |
| PB2 | 33,27 | 28,28 |
| PC1 | 37,87 | 32,19 |
| PC2 | 38,31 | 32,57 |
Table 2.
Technical data sheet of weber MP910 (Saint-Gobain Italia S.p.A.).
| Technical characteristic | Value |
|---|---|
| Maximum grain size [44] | |
| Compressive strength - after 28 days [45] | |
| Flexural strength - after 28 days [45] | |
| Reaction to fire [46] | Euroclass A1: Non-combustible |
| Shrinkage rate | |
| Bulk of hardened product | |
| Water vapor permeability coefficient [47] | |
| Cement content by weight | |
| Lime content by weight | |
| Aggregate content by weight | |
| Thermal conductivity [48] | |
| Water absorption [49] | |
| Hazardousness [50] | Eye Dam. 1, H318: Causes serious eye damageSkin Irrit. 2, H315: Causes skin irritationSkin Sens. 1, H317: May cause an allergic skin reaction |
Table 2.
Results of bending and compression tests on the mortar.
| Specimen | Flexural strength [MPa] |
Broken half-specimen |
Compressive strength [MPa] |
|---|---|---|---|
| P1 | 2.74 | P1A | 9.28 |
| P1B | 9.93 | ||
| P2 | 2.85 | P2A | 9.56 |
| P2B | 9.50 | ||
| P3 | 3.22 | P3A | 9.72 |
| P3B | 9.59 | ||
| P4 | 2.10 | P4A | 7.06 |
| P4B | 6.83 | ||
| P5 | 2.29 | P5A | 6.72 |
| P5B | 6.96 | ||
| P6 | 2.29 | P6A | 7.58 |
| P6B | 7.03 |
Table 3.
Mechanical properties of stainless steel tape rolls, as declared by the manufacturer.
| Mechanical property | Value |
|---|---|
| Yield strength | |
| Breaking strength | |
| Elongation at break(also called fracture strain, or tensile elongation at break) |
Table 5.
Main values of shear stress and shear strain.
| Specimen | Shear stress at the end of the linear range [MPa] |
Shear stress of first peak [MPa] |
Maximum shear stress [MPa] |
Residual shear stress [MPa] |
Shear strain at the end of the test [mm/mm] |
|---|---|---|---|---|---|
| M1-90 | 1.118 | 1.465 | 1.465 | / | 0.00047 |
| M1-45 | 1.044 | 1.423 | 1.423 | 0.886 | 0.03806 |
| M2-45 | 0.545 | 0.985 | 1.850 | 0.959 | 0.06469 |
Table 6.
Estimated values of elastic moduli and their ratio.
| Specimen | [MPa] | [MPa] | |
|---|---|---|---|
| M1-90 | 9551 | 22676 | 2.37 |
| M1-45 | 7385 | 23375 | 3.17 |
| M2-45 | 8080 | 31496 | 3.90 |
Table 4.
Poisson’s ratio values identified from the acquired displacement data.
| Specimen | ν |
|---|---|
| M1-90 | 0.130 |
| M1-45 | 0.098 |
| M2-45 | 0.079 |
Table 5.
Pseudo-ductility factor and parameters necessary for its identification.
| Specimen | *[mm/mm] | [MPa] | [%] | [mm/mm] | ||
|---|---|---|---|---|---|---|
| M1-90 | 0.00047 | 0.214 | 1.453 | 99 | 0.00035 | 1.34 |
| M1-45 | 0.03806 | 0.210 | 1.369 | 96 | 0.00038 | 99.82 |
| M2-45 | 0.06469 | 0.084 | 0.613 | 33 | 0.00013 | 513.97 |
* The values of this column are the same values collected in the last column of Error! Reference source not found., transcribed here to facilitate the comparison between and .
Disclaimer/Publisher’s Note: The statements, opinions and data contained in all publications are solely those of the individual author(s) and contributor(s) and not of MDPI and/or the editor(s). MDPI and/or the editor(s) disclaim responsibility for any injury to people or property resulting from any ideas, methods, instructions or products referred to in the content. |
© 2023 by the authors. Licensee MDPI, Basel, Switzerland. This article is an open access article distributed under the terms and conditions of the Creative Commons Attribution (CC BY) license (http://creativecommons.org/licenses/by/4.0/).
Copyright: This open access article is published under a Creative Commons CC BY 4.0 license, which permit the free download, distribution, and reuse, provided that the author and preprint are cited in any reuse.


