Submitted:
21 October 2023
Posted:
24 October 2023
You are already at the latest version
Abstract
Modular high-rise buildings frequently adopt cast-in-place concrete to ensure building integrity. To reduce the material consumption and realize mold-free casting, a 30 mm thick light concrete mold shell wall panel ( MiC wall panel) is set as part of the shear wall. But the concrete casting process is prone to cracking and rising pattern. Its force performance and damage mechanism is not clear. To this end, this paper designs three groups of MiC wall panels with different material component types. The static load test is carried out in a graded partitioned loading mode. The effects of different material components on the mechanical properties of MiC wall panels are systematically investigated and parametrically analyzed by numerical simulation. The results show that the front cracks of the wall slab are mainly distributed under the truss tendons, and the back cracks are mainly distributed in the span position of the adjacent truss tendons. They are both along the span direction of the wall slab. Increasing the strength level of concrete and using steel fiber concrete can improve the mechanical properties of MiC wall panels to different degrees. Among them, increasing the concrete strength has a significant effect on improving the load-bearing capacity of wall panels, while incorporating steel fibers can significantly improve the deformation and crack resistance of wall panels. By building more finite element models, it was verified that the steel fiber admixture has limited effect on the mechanical properties of wall panels as the concrete grade increases. This study aims to summarize the types of wall panels with the best working properties. It provides a practical basis for optimizing the production and fabrication process of MiC wall panels.
Keywords:
modular buildings
; concrete shell panel
; mechanical properties
; concrete material
; finite element analysis
1. Introduction
Modular construction is different from traditional building construction methods. It manufactures modular units in a factory. They are then transported to the construction site and assembled into a complete building [1,2]. The unique construction method has many advantages. For instance, it can reduce the cost by 10% and reduce the waste of resources by 76% while improving the quality of construction. It is popularized for its advantages such as efficient construction, safe construction process, and promotion of environmental sustainability [3,4,5]. The connections between modular units play a crucial role in the integrity of modular buildings [6]. Wet connections between panels can effectively improve the integrity of modular buildings. Therefore, the importance of improving the crack resistance of molded shell wall panels is becoming increasingly important.
Modular building integrity has always been a major consideration in design. The connections between modular units play a central role in providing the integrity of a modular building [7]. Previous research has focused on the creation of new structural systems (e.g., modular sandwich panel systems [8], interlocking systems [7]). In addition, many researches have been devoted to changing the inter-module connections. The use of rotating spring connections in corner-supported steel modular buildings can effectively improve the resistance of MiC structures to progressive collapse [9]. Using new coupled modular steel structures and suitable inter-module connections [10] can avoid structural redundancy and reduce the difficulty of inter-module connection assembly. The combination of tongue-groove connection and beam-to-beam bolted connection design in corner-supported steel-concrete modular buildings can significantly improve the overall structural integrity of modular buildings [11].
However, these connections are only for multi-story modular buildings with limited enhancement for high-rise modular buildings. Research on high-rise modular buildings focuses on structural systems, connection technologies [12], such as precast concrete coupled shear wall systems [13], new concrete high-rise discrete diaphragm systems [14,15], new hybrid coupled wall systems [16], and new lateral force resistance systems using precast shear walls as part of high-rise building modules [17]. There were also studies to evaluate the performance of wall-to-wall connections (staggered ring-bar connections, equally spaced ring-bar connections, U-HOOK connections and channel connections) in terms of hysteresis behavior, ultimate load carrying capacity, energy dissipation capacity, stiffness degradation, ductility, viscous damping ratio and cracking patterns [18]. Or to develop grouted panel pocket (GPP) connections, post-tensioned corner (PTC) connections [19], corner connections [20], and modular infill links [21]. In addition, the use of epoxy-putty adhesives and interrupted glass fiber reinforced polymer (GFRP) spike anchors can significantly improve the horizontal load carrying capacity of GFRP composite connections [22]. Studies have shown that the effect of vertical inter-module connections on the overall lateral force resistance of concrete modular high-rise buildings cannot be ignored [23]. Their bond strength can determine the damage mode of prefabricated modular walls [24]. However, most of these studies are dedicated to resist the overall lateral load of the structure.
To date, only a few studies have considered the effect of wall panel performance on building integrity. Among them, corrugated steel plate shear walls are a hot topic of research. Studies have shown that increasing both the thickness or length of corrugated plates can effectively improve the lateral stiffness and load-bearing capacity of the specimen [25,26], improve the structural stiffness of the building, and enhance the structural lateral resistance [27]. In addition, Wang Z [23] et al. used the generalized modulus discount method to consider the effect of vertical grouting connections on the lateral behavior of slender precast concrete walls, showing that increasing the thickness of modular walls is beneficial without adversely affecting the structural response of the building.
Available high-rise modular buildings generally have cast-in-place concrete cores working with prefabricated modular walls in which the molded shell wall panels play an essential role [23]. Tie bolts are welded at the nodes of the MiC wall plate truss reinforcement. When used as an outer shear wall formwork, the bolts are passed through the outer timber formwork. When used as an inner shear wall form, the bolts are passed through the opposite wall plate. Once fixed, the concrete is ready to be poured (Figure 1). Yet, the concrete pouring is prone to MiC wall panels rising, cracking and leakage. It can be seen that the quality of the wall panels directly affects the concrete placement. At present, the influence on the crack resistance of precast modular panels is yet to be investigated. Therefore, we design four groups of commonly used MiC wall panels with different material component types and conducts static loading tests. In this paper, a refined numerical model is established based on the existing codes. Parametric analysis is carried out on important parameters such as concrete strength grade and fiber content of steel fiber concrete. The aim is to find the MiC wall panel with the best working performance. It provides theoretical reference for its application in practical engineering.
2. Materials and Methods
2.1. Materials
2.1.1. Concrete
There are three kinds of concrete used in the test: ordinary C40 concrete, ordinary C60 concrete, and C60 steel fiber concrete. C60 steel fiber concrete contains 1% of the volume of steel fibers, 0.5mm in diameter, and 15-30mm in length. Each grade of concrete has three standard specimen samples of 150mm x 150mm x 150mm. The compressive strength of concrete was measured after 28 days of curing (Figure 2). The results were multiplied by a conversion factor of 0.95, as shown in Table 1. The compressive strengths of C40 concrete, C60 concrete, and C60 steel fiber concrete are 41.42 MPa, 60.99 MPa, and 62.35 Mpa, respectively. These were the average values of three identical tests conducted on each material. The measured compressive strengths of these three types of concrete all meet the specification requirements.
2.1.2 Steel bars
The reinforcement grades used in the tests were HRB400, with diameters of 12 mm, 8 mm and 6 mm, respectively. The steel bars of different diameters are grouped into 3 samples for each group, all with length of 50 mm. Figure 3 demonstrates the testing process for yield strength and ultimate tensile strength of steel bars. As shown in Table 2, the measured mechanical properties of the reinforcement bars meet the specification requirements.
2.2. Specimen Design
Each specimen consists of a concrete base slab, base slab distribution reinforcement, and truss reinforcement. All parameters were the same except for the material components of the concrete base plate. Three MiC wall panels with different material components were designed for this test as follows:
(1) The first specimen is used as a benchmark, namely N60. Its concrete floor is made of C60 concrete.
(2) The second specimen with C40 concrete floor is marked as N40.
(3) The third specimen is marked as SF60. Its concrete floor is made of C60 steel fiber concrete.
Figure 4 shows the construction of MIC panels. The internal thread cylindrical pins are welded at the truss reinforcements as pulling parts. Their distribution density increased with the increase of the lateral pressure of the panel. Table 3 shows the specific parameters of the specimen. The concrete floor is designed as a two-way slab. The thickness of its protective layer is 10mm. The diameter of distribution reinforcements is 6 mm. The truss reinforcements were welded by upper chord steel bars, lower chord bars and web members with diameter of 12mm, 8mm and 6mm respectively.
2.3. Loading Device and Scheme
In this test, a new type of loading steel frame was designed to meet the special stressing mode of MiC wall panels, consisting of the main steel frame and the top channel steel combination beam. The specimen loading device is shown in Figure 5. The specimen was fixed to the loading device by rigid spacers suspended from the threaded rod. A hydraulic jack is used to apply the load to the distribution beam. The load is finally transferred to the four supports through the two-stage distribution beam to simulate the uniform load.
The test adopts a graded zoning loading method (Figure 6). The force surface of the specimen was divided into three regions. The load is first applied to the third region, and then incrementally to the second and first regions. The full-area loading was carried out until all three areas were stressed. Every time the design is loaded 10kN by region. The loading time is 2~3 min, held for 3~5 min after each level of loading is completed. The loading ends when the specimen is damaged or has the characteristics of damage precursors.
2.4. Measuring Point Arrangement
The test measurement mainly includes load, span deflection of adjacent joist tendons, crack width and concrete strain. For the convenience of description, the wall plate surface on the exposed side of the joist tendons is specified as the front side, and the opposite is called the back side. Figure 7 shows the location of the measurement points. The strain measurement points (Z1~Z4) are arranged below the four lifting points of the joist tendons in the span of the front side of the specimen. On the back side, strain measurement points (B1~B5) are arranged in the middle of the adjacent joist span. The displacement measurement points (W1~W3) are arranged in the middle of the adjacent tie members.
3. Test results and analysis
3.1. Test Phenomenon
All three wall panels undergo from the elastic stage, crack development stage to the plastic damage stage. The cracks were first produced in the third area, then gradually extended and widened to the edge of the wall panel along the vertical direction with increasing load. The cracks on the front side of the wall slab are mainly distributed under the joist tendons. The back cracks are mainly distributed in the middle of the span of the adjacent truss tendons. All of them are along the span direction of the wall slab. The damage of the four shear walls is basically characterized by the crushing of the surface concrete and the pulling out of the joist reinforcement, among which SF60 is characterized by reaching the deflection value and seam width specified in the code.
At the early stage of loading, the test phenomena of the three wall panels were basically the same. All of them were in the elastic stage. With increasing load, cracks were gradually generated, extended, widened, and the deflection gradually increased.
3.1.1. N60
Specimen N60 is a wall slab having C60 concrete. During the second stage of loading (20kN in the third area and 10kN in the second area), minor cracks (17.76kN) began to develop on the front and back of the third area. The crack width gradually increased and extended as the load increased. In the process of the third stage of loading (30kN in the third region, 20kN in the second region and 10kN in the first region), the crack in the middle of the front side was carried out vertically to 1/2 of the plate thickness, and two main cracks appeared on the back side. The specimen entered the plastic damage stage. During the fourth stage of loading (40kN in the third region, 30kN in the second region and 20kN in the first region), the crack width further increased and extended to the top of the slab. The wall slab showed obvious deformation. In the fifth stage of loading (50kN in the third area, 40kN in the second area and 30kN in the first area), the surface concrete was crushed and the truss bars were pulled out. Then the loading was terminated (115.49kN). At this time, the deformation of the wall panel was observed in the shape of "W". The maximum crack width of the front side was 2.51 mm and the maximum crack width of the back side was 0.76 mm. The damage pattern and crack distribution of the N60 specimen loaded are shown in Figure 8.
3.1.2. N40
Specimen N40 was a C40 concrete wall slab. During the second stage of loading, cracks (11.13kN) started to develop at the front and back of the third area. As the load increased, the crack width gradually increased and extended. In the third stage of loading, the cracks developed vertically up to 1/2 of the slab thickness on the front side and 2/3 of the slab thickness on the back side. The specimen entered the plastic damage stage. In the process of the fourth stage of loading, the surface concrete was crushed and the truss bars were pulled out. At the end of loading (74.45kN), maximum crack width at the front side was 3.2mm, and the back side was 1.1mm. N40 specimen loading damage pattern and crack distribution are shown in Figure 9.
3.1.3. SF60
Specimen SF60 is a C60 concrete wall panel with additional steel fibers. During the second stage of loading, cracks were produced and extended (26.12kN) on both the front and back sides. In the third stage of loading, the cracks continued to extend, with the original defective cracks running through the front side. Cracks further increased in width during the fourth stage of loading. The front crack was completely penetrated along the vertical direction, while the back crack was penetrated longitudinally. The obvious deformation of the wall panel indicated that the specimen had completely entered the plastic deformation stage. Apparent deformation of the wall plate appears during the fifth stage of loading. The loading was terminated (122.06kN) when the deflection value and seam width reached the limit of the code bearing capacity. It is noteworthy that the crack width at the back of SJ3 is small but the number of fine cracks is large. At this time, the maximum crack width of the front side of the wall panel was measured as 1.86mm, and the maximum crack width of the back side was 0.78mm. The damage pattern and crack distribution of the SF60 specimen loaded are shown in Figure 10.
3.2. Load-strain Curve
The load-strain curves of the front and back concrete measured by the test are shown in Figure 11 and Figure 12. The curves of each specimen have similar change patterns. At the beginning of loading, the concrete strain changes nearly linearly, indicating that the specimen is in the elastic stage. With the increasing load, the slope of the curve gradually decreases and the strain growth rate increases, illustrating that the specimen enters the plastic stage. The final strain reaches the peak concrete strain, which means the specimen enters the damage stage. Cracks were also formed and extended gradually.
Comparing the load-strain curves of each specimen, it can be seen that the order of concrete entering the plastic stage and damage stage of each specimen is roughly N40, N60, and SF60, indicating that the overall strength of MiC wall panels made of C40 grade concrete is lower. The peak and slope of the SF60 strain curve are higher than those of N60, indicating that the addition of steel fibers can effectively enhance the tensile capacity of the specimens. This enhances the overall strength of the specimens and delays the cracking and damage of the concrete.
3.3. Load-deflection Curve
Figure 13 shows the load-deflection curves of each specimen. It can be seen that the specimens underwent two stages of elastic deformation and plastic deformation. The slopes of each deflection curve are N40, N60, and SF60 in order from small to large. The slopes of N60 and FM60 are similar. It means that the stiffness of each specimen is SF60, N60, N40 in order from weak to strong.
The specimen breaking load and breaking deflection are shown in Table 4. The damage deflection of N40 and N60 are close, yet the damage load of N40 is reduced by 35.53% compared with N60. It indicates that increasing the concrete strength can improve the bearing capacity of the specimens, but not the resistance to deformation of the specimens. SF60 has a 16.58% reduction in the damage deflection compared with N60, and the damage load is slightly higher than that of N60, indicating that the incorporation of steel fibers can slightly improve the resistance to deformation of the specimens, but not to the load-bearing capacity of the specimens.
3.4. Bearing Capacity Analysis
The characteristic loads of each specimen measured by the test are shown in Table 5, with N60 as the standard specimen (Pcr=17.76kN, Pu=115.49kN). (1) The Pcr of N40 is 11.13kN and Pu is 74.45kN, which is 37.33% and 35.54% less than N60, respectively, indicating that increasing the concrete strength can significantly improve the crack resistance and load carrying capacity of MIC wall panels. (2) The Pcr of SF60 was 26.12kN and Pu was 122.06kN, which increased 47.07% and 5.69%, respectively, compared with N60. It means that the addition of steel fibers can significantly improve the crack resistance of MiC wall panel, but the increase of its ultimate load carrying capacity is not great.
4. Finite Element Analysis
To verify the reliability of the tests and to further explore the effects of different material components on MiC wall panels, four models were built. Their load deflection curves were also compared.
4.1. Constitutive Relationship of Materials
The concrete plastic damage model was used for both plain concrete material and steel fiber concrete material. The specific parameters are shown in Table 6. Among them, the modulus of elasticity of C40 ordinary concrete is 32500 MPa and Poisson's ratio is 0.2. C60 ordinary concrete has a modulus of elasticity of 36000 MPa and Poisson's ratio is 0.2. C60 steel fiber concrete has a modulus of elasticity of 36277 MPa and Poisson's ratio of 0.2. The elastic-strengthened bilinear model is used for the steel reinforcement material, with an elastic modulus of 2×10⁵MPa and Poisson's ratio of 0.3. The specific parameters of each material are shown in Table 7.
4.2. Model Establishment
The finite element software ABAQUS was used to model and analyze the above three specimens. The concrete slab of each specimen was modeled with C3D8R. The distributed reinforcement and the concrete internal truss reinforcement are all in two-node linear three-dimensional truss cell T3D2. Two-node spatial linear beam cell B31 is used for the concrete external truss reinforcement. To ensure the simulation accuracy, the model is structurally meshed. The grid sizes of concrete base plate and reinforcement are 15mm and 20mm, respectively.
Without considering the effect of slip between the reinforcement and concrete, the reinforcement and concrete are “embed” restrained. In the model, the location of the ties is set to “fully fixed”. The model uses the pressure control method for the loading process and is consistent with the test loading system (graded zonal loading). The established models are shown in Figure 14.
4.3. Analysis of Finite Element Results
4.3.1. Deflection Analysis
The comparative results of load-deflection curves by finite element analysis are shown in Figure 15. The finite element analysis results basically match with the test results. Combined with the displacement cloud diagram (Figure 16) and the maximum deflection values (Table 8) of each specimen under the maximum load, it can be seen that: (1) The maximum displacement in the simulation occurs in the third area of the slab surface, distributed on both sides of the middle truss reinforcement, which corresponds to the location of the W3 displacement measurement point in the test. (2) The maximum displacement values of each specimen in the simulation are N60, N40 and SF60 from the largest to the smallest, which are consistent with the test results.
Analyze the reasons for the errors between the finite element simulation results and the test results: (1) There are inevitable defects in the casting of the specimen, resulting in deviations between the actual properties and the values entered in the simulation. (2) The test could not achieve the complete fixation of the tie member, while the boundary condition of the tie member was set to "complete fixation" during the simulation, resulting in the error. (3) During the test loading process, the oil return of the jack and the slight shaking of the test piece caused errors in data collection.
4.3.2. Plastic Damage of Concrete
According to the damage clouds of the concrete front and back of each specimen at the peak load of the finite element analysis (Figure 17 and Figure 18), it is clear that three main cracks are produced on the concrete front, mainly distributed at the intersection of the truss tendons and the concrete. On the back side, two main cracks were produced, mainly at the middle of adjacent joist tendons. The cracks all run along the span direction of the slab, consistent with the cracks generated by the test.
5. Parametric analysis
The strength grade of concrete has a significant effect on the stiffness and strength of the members. Steel fibers, as an important admixture in concrete, have a significant enhancement effect on the tensile strength, toughness, and stiffness of steel fiber concrete. Based on the finite element analysis in the previous section, this section further investigates the effects of two factors, concrete strength grade and steel fiber volume fraction V, on the mechanical properties of MiC wall panels. The design model parameters are shown in Table 9.
Holding the concrete strength grade constant, the stresses of MiC wall panels with different fiber volume fractions were simulated under five levels of loading, respectively. The load-deflection curves are shown in Figure 19. Combined with Figure 20, the maximum deflection gradually decreases with the increase of steel fiber volume fraction under the same strength group, and the decrease gradually increases. It indicates that the stiffness of MiC wall panel increases with the amount of steel fiber admixture when the volume fraction of steel fiber is not more than 1.5%. As the strength grade of concrete matrix increases, the effect of increasing the volume fraction of steel fibers on the reduction of model maximum deflection decreases. This indicates that when the strength grade of concrete matrix is high, with the increase of steel fiber content, the shear strength of steel fiber reinforced concrete increases more slowly.
6. Conclusion
In this paper, the following conclusions are drawn from static loading tests on three MiC wall panels, combined with finite element analysis and parametric analysis:
- (1)
- All three specimens went through the elastic, elasto-plastic and damage phase. The crack and deflection continue to develop during the damage process. The crack development, distribution pattern and deformation of the four specimens are similar. They are all generated in the area where the first force is applied. With the increase of load, the cracks gradually develop and extend through the whole plate surface. The front cracks are mainly concentrated under each joist tendon, while the back cracks are symmetrically distributed at the center-line of the adjacent joist tendons.
- (2)
- Increasing the strength level of concrete and incorporating steel fibers both enhance the crack resistance, load carrying capacity and stiffness of the specimens. Among them, increasing the concrete strength significantly enhances the load bearing capacity of the specimens. Differently, the incorporation of steel fibers significantly improved the crack resistance and stiffness of the specimens, while the improvement of the load carrying capacity is limited.
- (3)
- The deformation trends of the three specimens are basically the same as the simulation results. The stress distribution pattern is similar. Combined with the parametric analysis, it is obtained that with the increase of the strength grade of the concrete matrix, the improvement of the crack resistance of the specimens is limited by increasing the amount of steel fiber admixture.
Author Contributions
Conceptualization, Q.W. and D.C.; methodology, Q.W. and D.C.; software, D.Y.; formal analysis, D.C., Q.W., and D.Y.; writing—original draft preparation, D.Y.; writing—review and editing, Q.W. and D.C. All authors have read and agreed to the published version of the manuscript.
Funding
This work was supported by Mechanical Properties Research of FRP Connectors in Fabricated Concrete Sandwich Insulation Wall Panels after Fire (KJ2021A0608), Natural Science Foundation of Anhui Province (19080885ME173), Research and Development project of China State Construction International Holdings Limited (CSCI-2020-Z-06-04), Science and Technology Project of Anhui Province Housing and Urban–Rural Construction(2020-YF47), and Science and Technology R&D Project of China Construction Corporation(CSCEC-2019-Z-4).
Institutional Review Board Statement
No ethical approval was required for this study.
Informed Consent Statement
The study did not involve humans.
Data Availability Statement
The data presented in this study are available on request from the corresponding author.
Acknowledgments
The authors gratefully acknowledge the financial support provided by Anhui Province Housing Urban and Rural Construction Science and Technology Project (2020─YF47).
Conflicts of Interest
The authors declare no conflict of interest.
References
- Murray-parkes, J.; Bai, Y.; Styles, A.; et al. Handbook for the design of modular structures, modular construction codes board; Monash University: Melbourne, 2017; pp. 1–216. [Google Scholar]
- Gunawardena, T.; Ngo, T.D.; Mendis, P.; et al. Innovative flexible structural system using prefabricated modules. Journal of Architectural Engineering 2016, 22, 05016003. [Google Scholar] [CrossRef]
- Olawumi, T.O.; Chan DW, M.; Ojo, S.; et al. Automating the modular construction process: A review of digital technologies and future directions with blockchain technology. Journal of Building Engineering 2022, 46, 103720. [Google Scholar] [CrossRef]
- Abdelmageed, S.; Zayed, T. A study of literature in modular integrated construction -Critical review and future directions. Journal of Cleaner Production 2020. [Google Scholar] [CrossRef]
- Wei, P.; Liu, Y.; Dai, J.G.; et al. Structural design for modular integrated construction with parameterized level set-based topology optimization method. Structures 2021, 31, 1265–1277. [Google Scholar] [CrossRef]
- Sharafi, P.; Mortazavi, M.; Samali, B.; Ronagh, H. Interlocking system for enhancing the integrity of multi-storey modular buildings. Automation in Construction 2018, 85, 263–272. [Google Scholar] [CrossRef]
- Sharafi, P.; Mortazavi, M.; Samali, B.; Ronagh, H. Interlocking system for enhancing the integrity of multi-storey modular buildings. Automation in Construction 2018, 85, 263–272. [Google Scholar] [CrossRef]
- Sharafi, P.; Nemati, S.; Samali, B.; Ghodrat, M. Development of an Innovative Modular Foam-Filled Panelized System for Rapidly Assembled Postdisaster Housing. Buildings 2018. [Google Scholar] [CrossRef]
- Chan, T.M.; Chung, K.F. Effect of inter-module connections on progressive collapse behaviour of MiC structures. Journal of Constructional Steel Research 2021, 185, 106823. [Google Scholar]
- Wang, H.; Zhao, X.; Ma, G. Novel coupled modular steel structure and seismic tests on high-performance interconnection. Journal of Constructional Steel Research 2022, 189. [Google Scholar] [CrossRef]
- Peng, J.; Hou, C.; Shen, L. Numerical analysis of corner-supported composite modular buildings under wind actions. Journal of Constructional Steel Research 2021, 187, 106942. [Google Scholar] [CrossRef]
- Thai, H.T.; Ngo, T.; Uy, B. A review on modular construction for high-rise buildings. Structures 2020, 28, 1265–1290. [Google Scholar] [CrossRef]
- Pan, W.; Wang, Z. Precast Concrete Coupled Shear Wall System of Modular High-rises Without In Situ Cores. Structural Engineering International 2023, 33, 128–140. [Google Scholar] [CrossRef]
- Pan, W.; Wang, Z.; Zhang, Y. Novel discrete diaphragm system of concrete high-rise modular buildings. Journal of Building Engineering 2022, 51, 104342. [Google Scholar] [CrossRef]
- Pan, W.; Wang, Z.; Zhang, Y. Novel discrete diaphragm system of concrete high-rise modular buildings. Journal of Building Engineering 2022, 51, 104342. [Google Scholar] [CrossRef]
- Wang, Z.; Pan, W. A hybrid coupled wall system with replaceable steel coupling beams for high-rise modular buildings. Journal of Building Engineering 2020, 31, 101355. [Google Scholar] [CrossRef]
- Wang, Z.; Pan, W.; Zhang, Z. High-rise modular buildings with innovative precast concrete shear walls as a lateral force resisting system. Structures 2020, 26, 39–53. [Google Scholar] [CrossRef]
- Hemamalini, S.; Vidjeapriya, R. Influence of connection detailing on the performance of wall-to-wall vertical connections under cyclic loading. Advances in concrete construction 2020, 9, 437–448. [Google Scholar]
- Menegon, S.J.; Wilson, J.L.; Lam, N.T.; Gad, E.F. Experimental testing of innovative panel-to-panel connections for precast concrete building cores. Engineering Structures 2020, 207, 110239. [Google Scholar] [CrossRef]
- Chua, Y.S.; Liew JY, R.; Pang, S.D. Modelling of connections and lateral behavior of high-rise modular steel buildings. Journal of Constructional Steel Research 2020, 166, 105901. [Google Scholar] [CrossRef]
- Park, H.K.; Ock, J.H. Unit modular in-fill construction method for high-rise buildings. KSCE Journal of Civil Engineering 2016, 20, 1201–1210. [Google Scholar] [CrossRef]
- Nye, T.K.; Pantelides, C.P.; Alkhradji, T. Bidirectional GFRP-Composite Connections between Precast Concrete Wall Panels under Simulated Seismic Load. Journal of Composites for Construction 2018, 22, 04018014. [Google Scholar] [CrossRef]
- Wang, Z.; Pan, W.; Zhang, Y. Parametric study on module wall-core system of concrete modular high-rises considering the influence of vertical inter-module connections. Engineering Structures 2021, 241, 112436. [Google Scholar] [CrossRef]
- Hou, H.; Ye, H.; Qu, B.; Ma, T.; Liu, X.; Chen, L.; Zhang, S. Precast segmental reinforced concrete walls under eccentric compressive loading: An experimental study. Engineering Structures 2016, 113. [Google Scholar] [CrossRef]
- Deng, E.F.; Zong, L.; Ding, Y. Numerical and analytical study on initial stiffness of corrugated steel plate shear walls in modular construction. Steel and Composite Structures 2019, 32, 347–359. [Google Scholar]
- Ding, Y.; Deng, E.F.; Zong, L.; Dai, X.M.; Lou, N.; Chen, Y. Experimental study on seismic performance of corrugated steel plate shear wall in modular container building. Journal of Building Structures 2018, 39, 110–118. [Google Scholar]
- Yu, Y.; Chen, Z. Rigidity of corrugated plate sidewalls and its effect on the modular structural design[J]. Engineering Structures 2018, 175, 191–200. [Google Scholar] [CrossRef]
Figure 1.
Pouring of concrete.
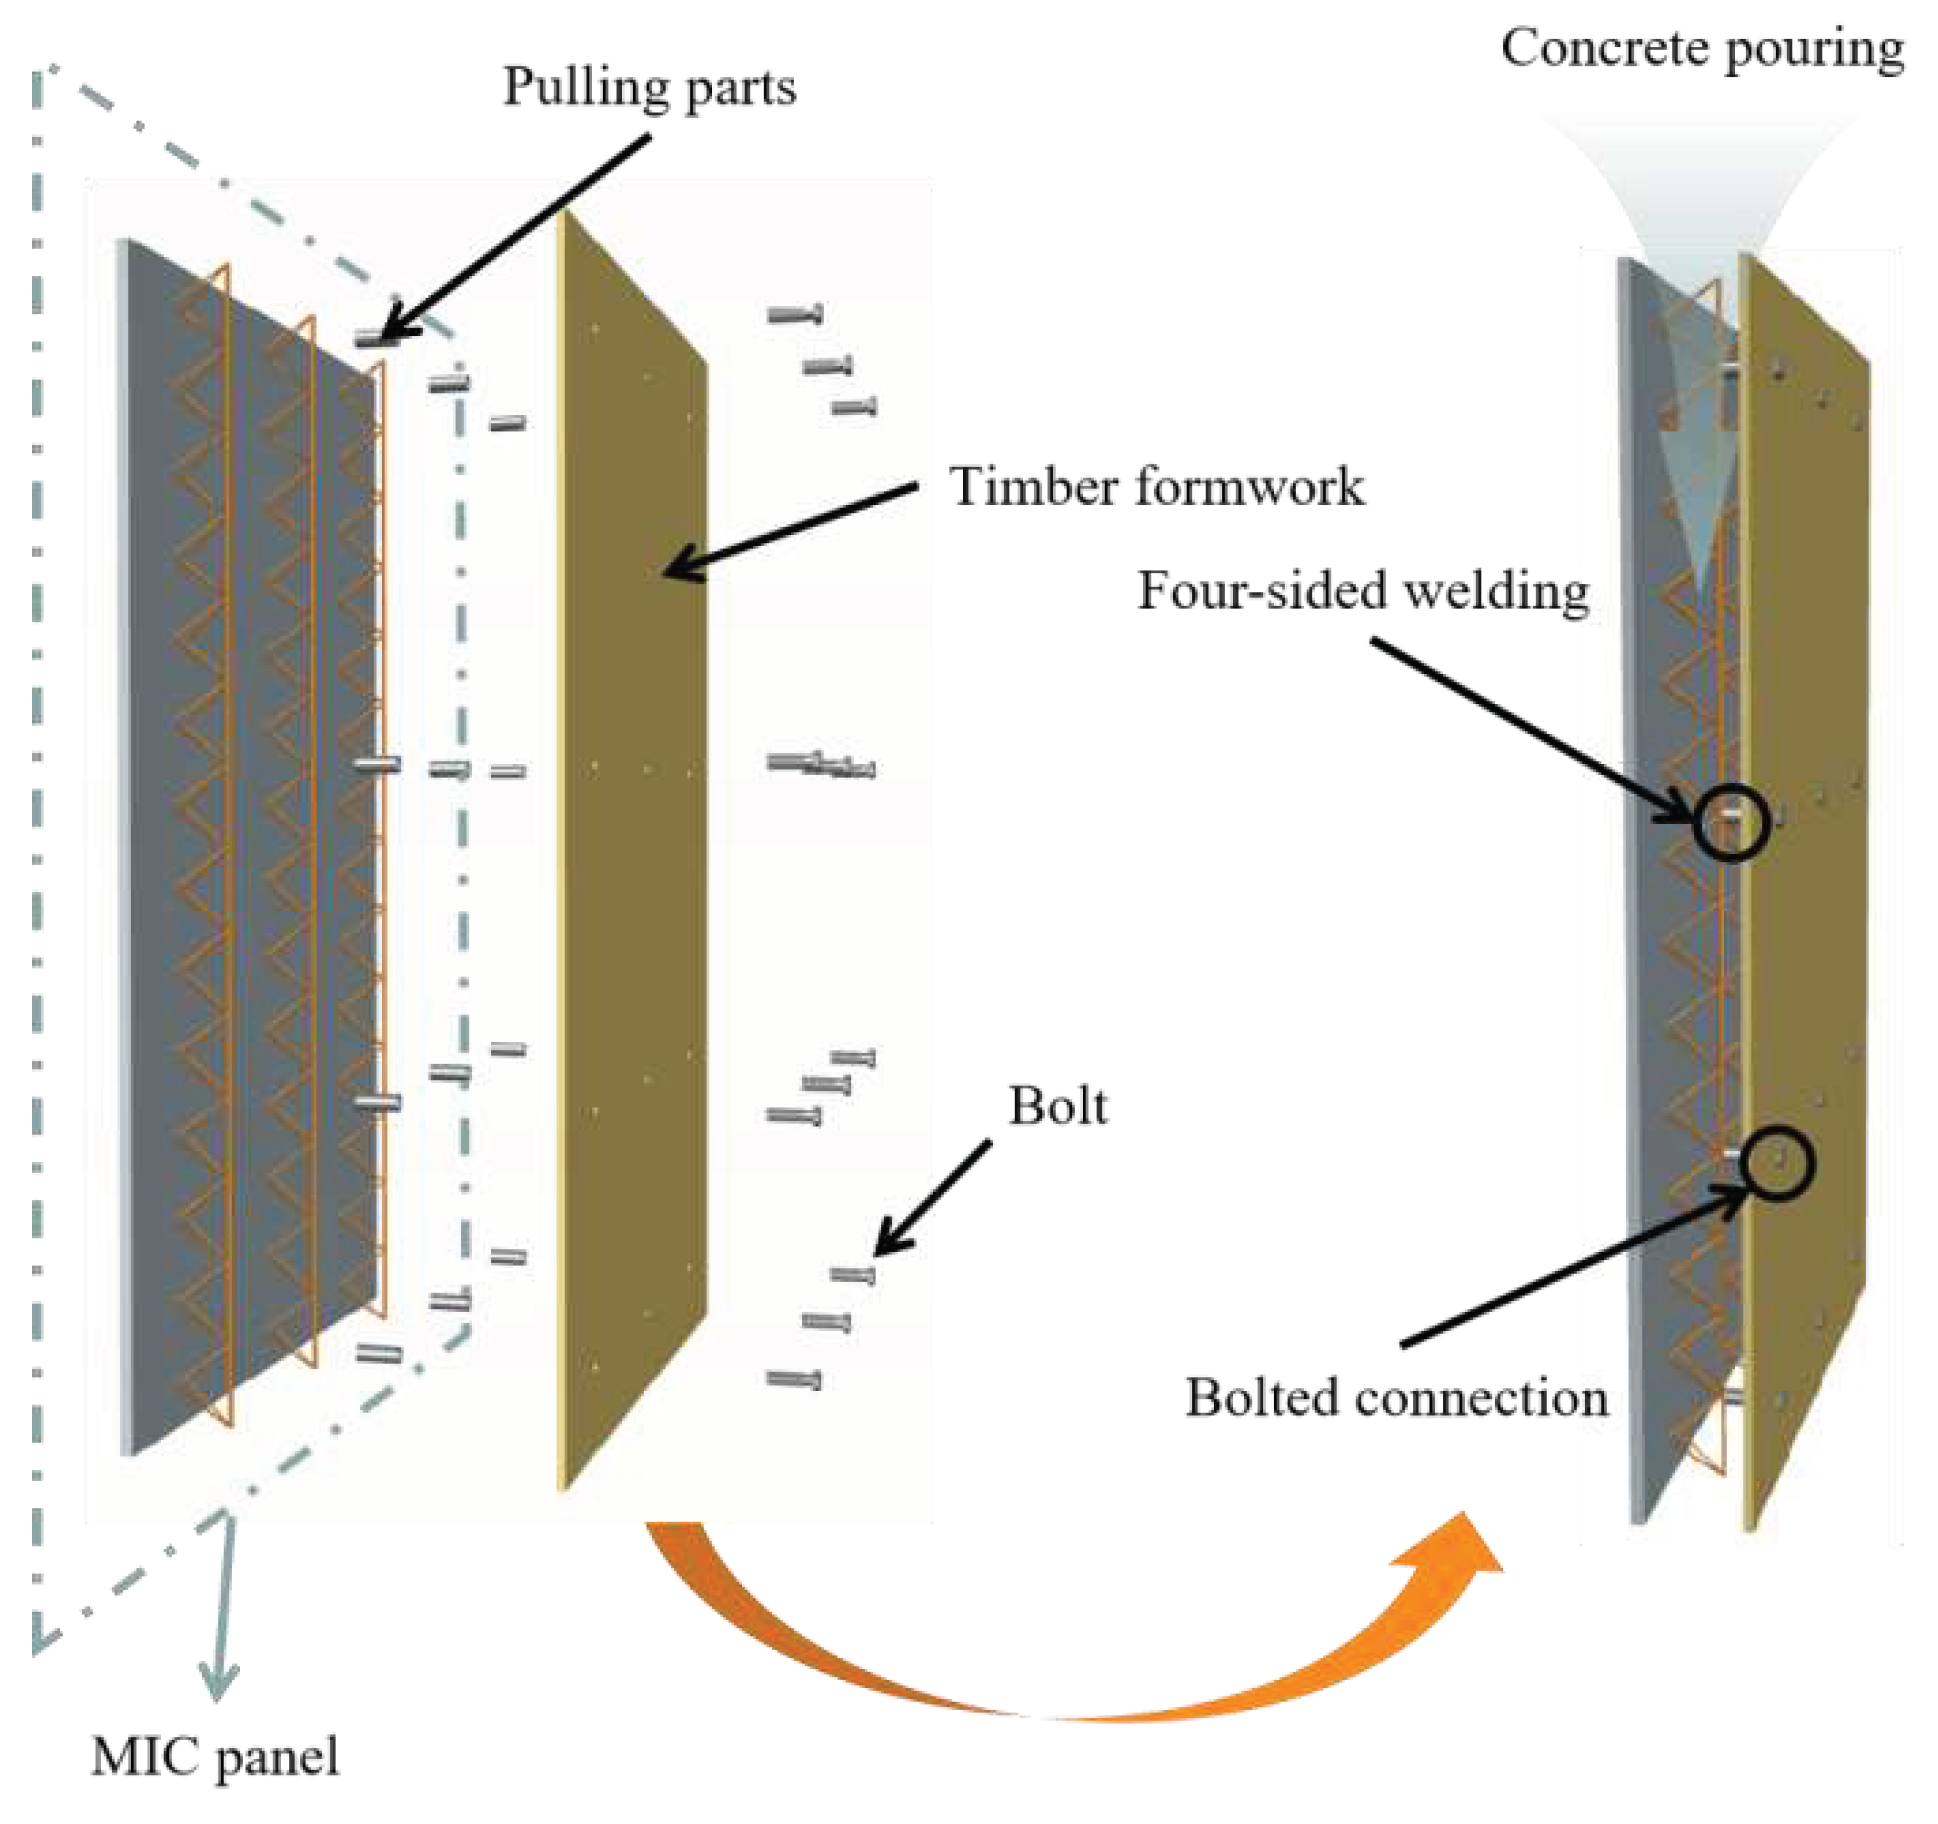
Figure 2.
Concrete material test.
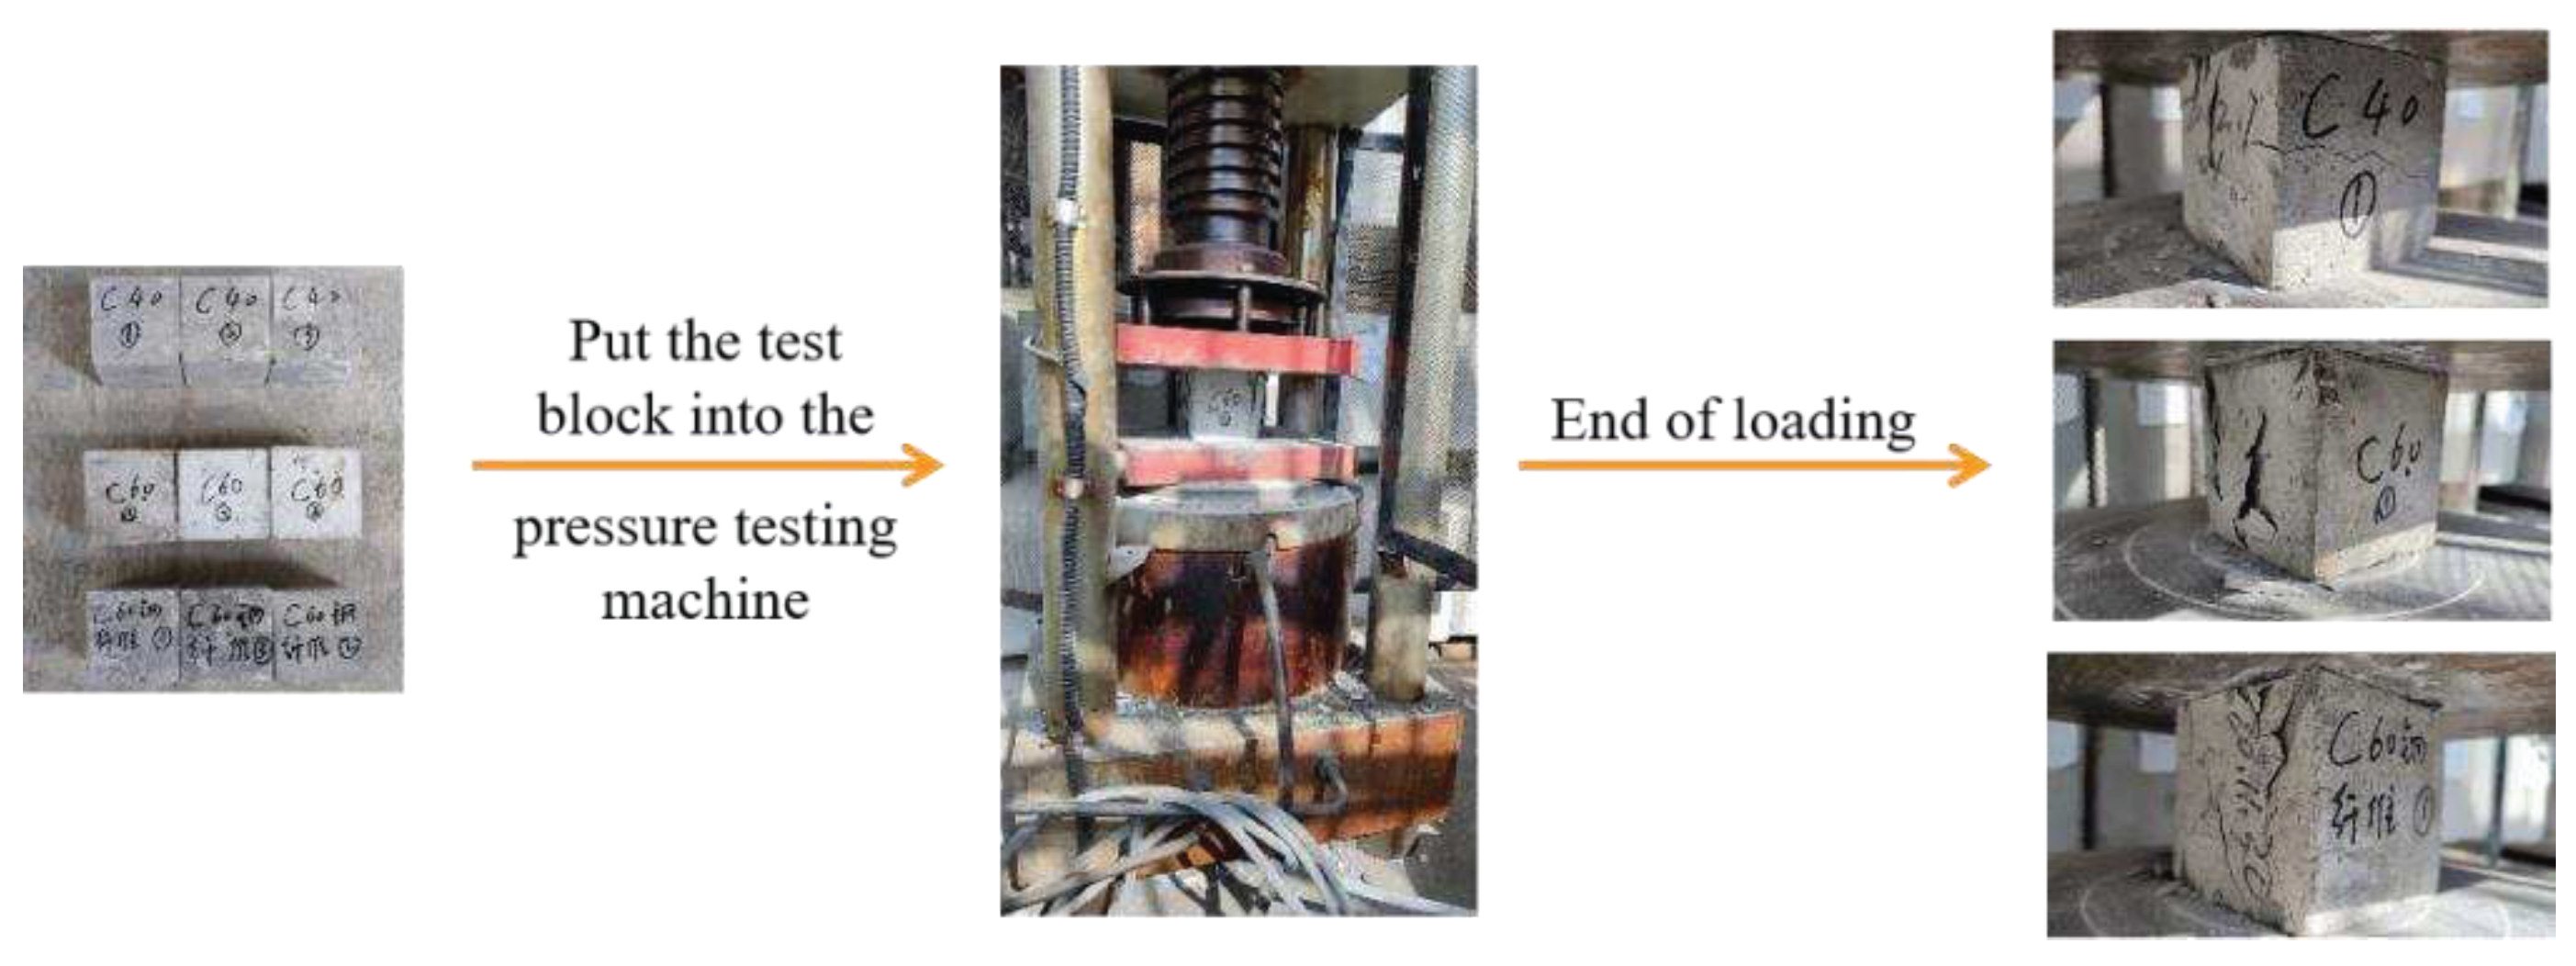
Figure 3.
Steel material test.
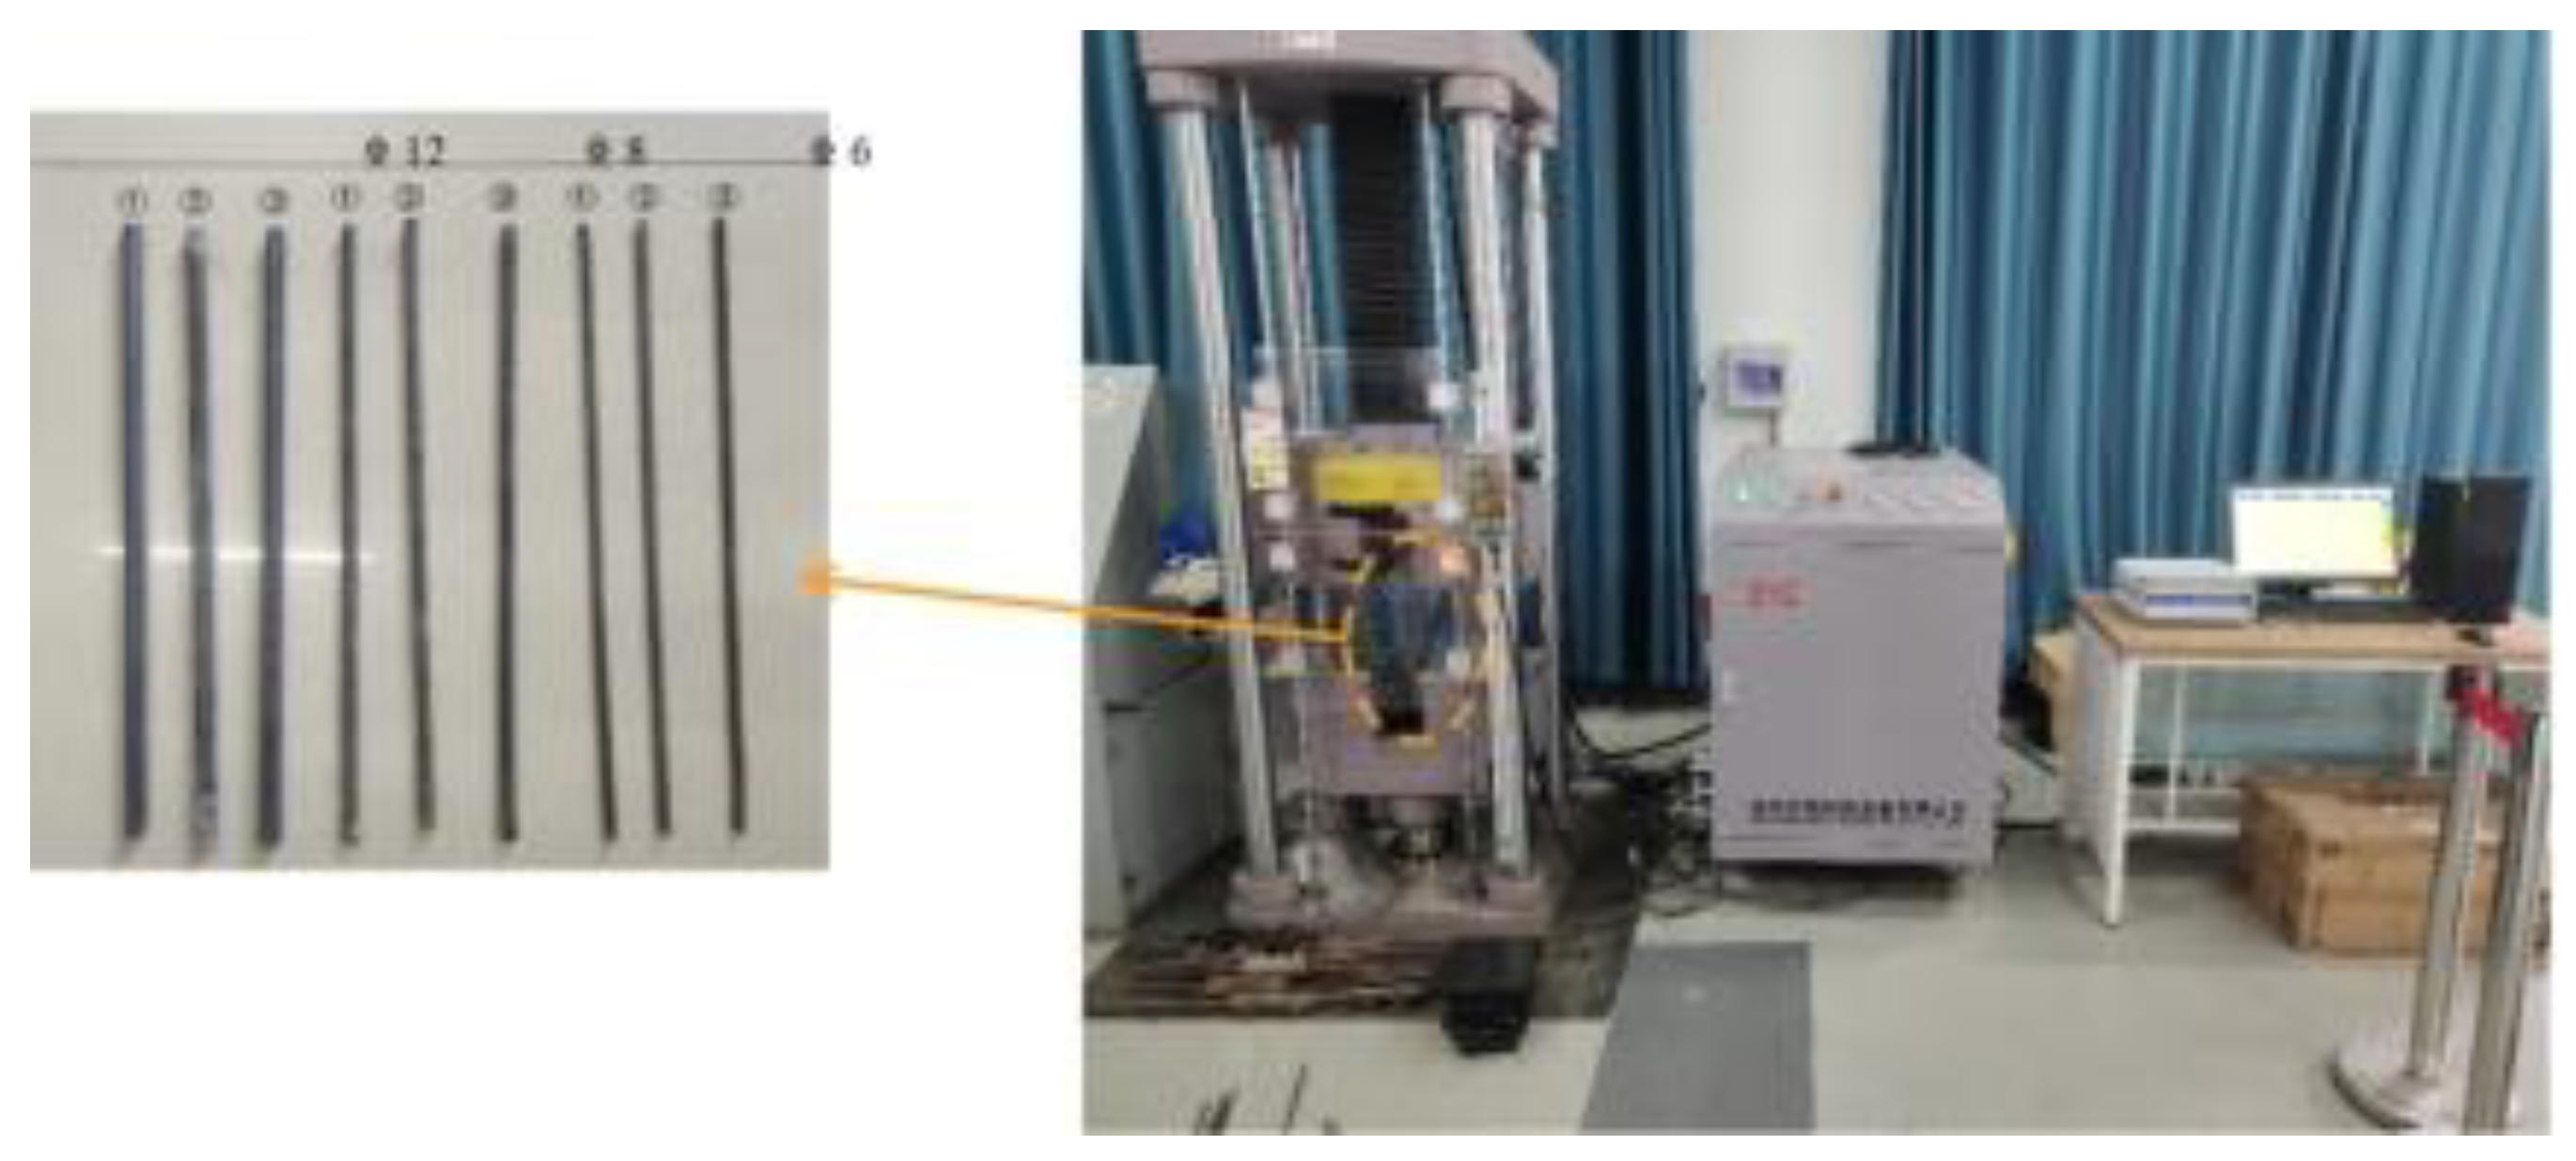
Figure 4.
Prefabricated MiC panel diagram. (a) Three-dimensional model; (b) Size and reinforcement drawing.
Figure 4.
Prefabricated MiC panel diagram. (a) Three-dimensional model; (b) Size and reinforcement drawing.
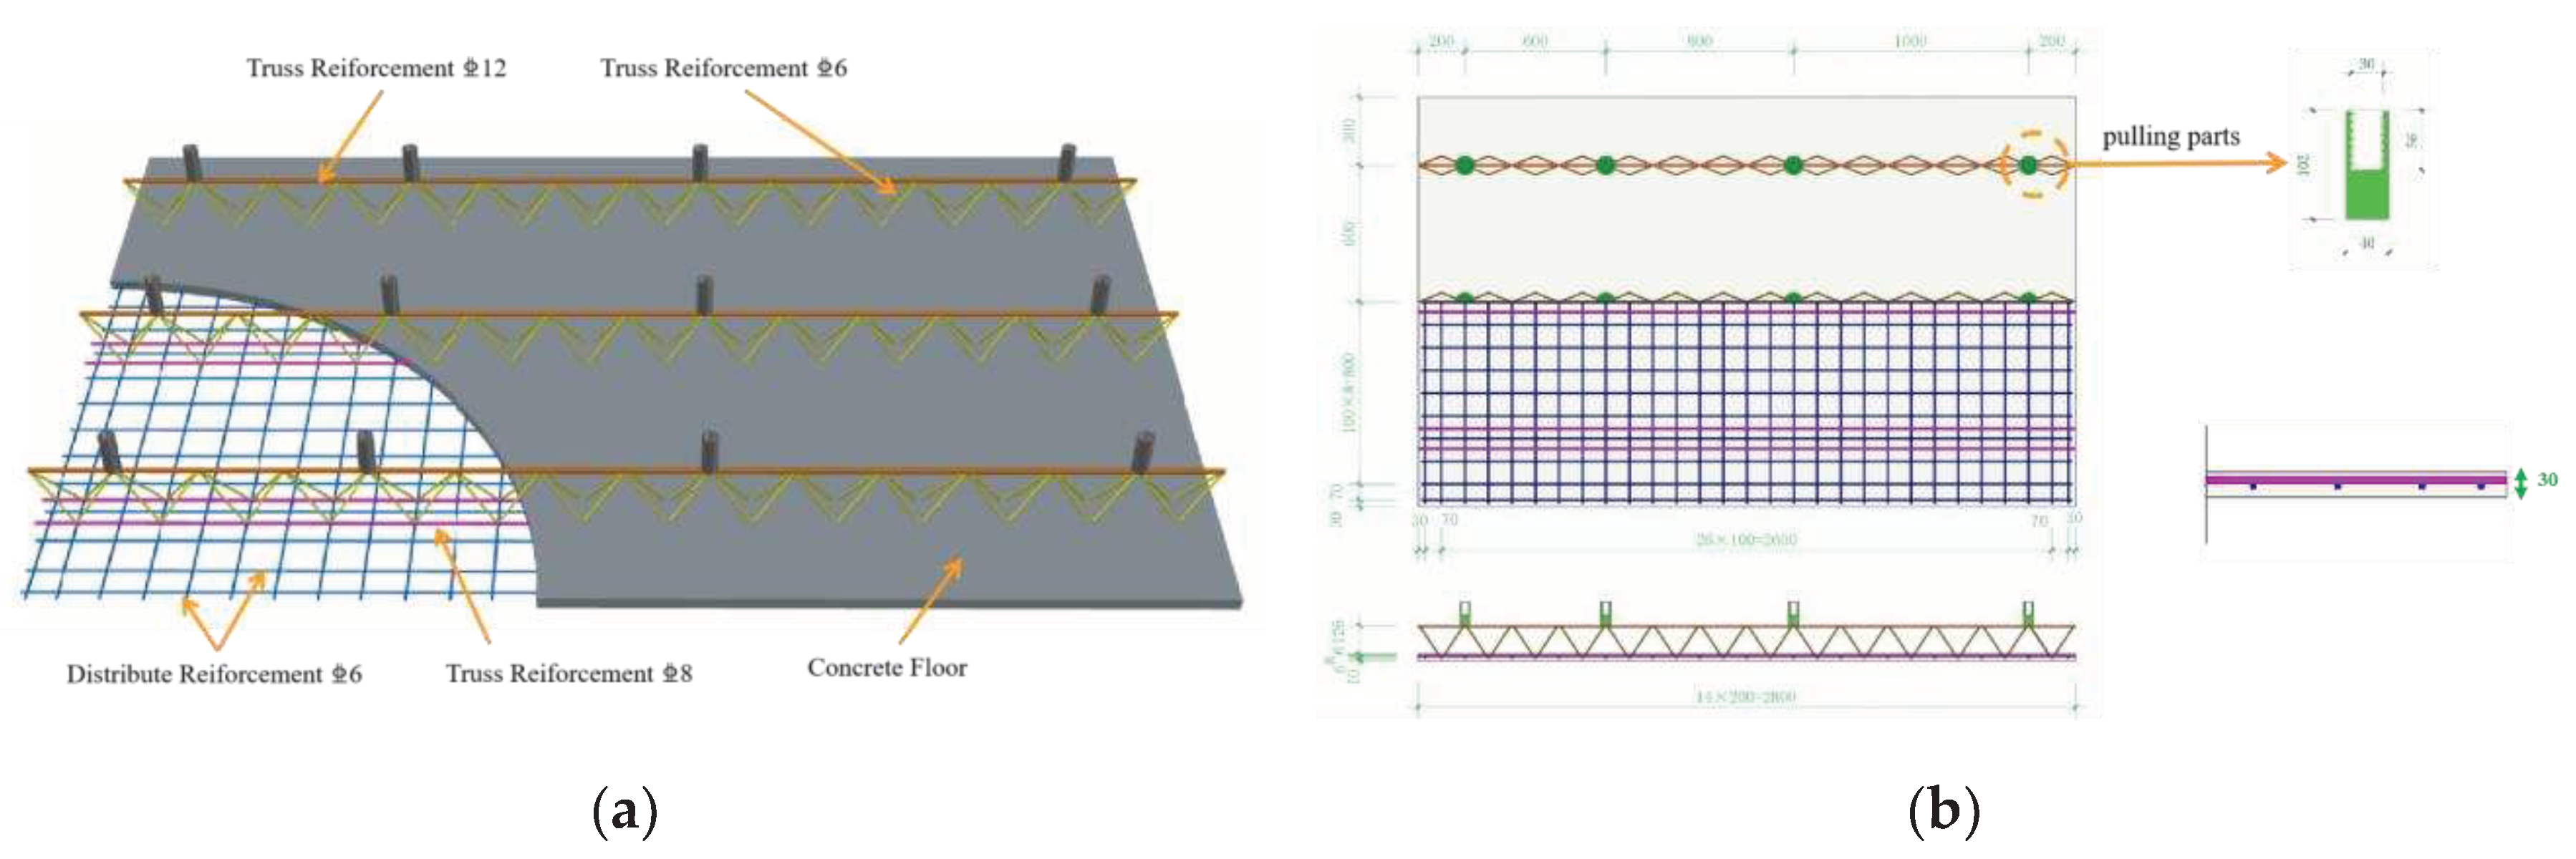
Figure 5.
Loading device.
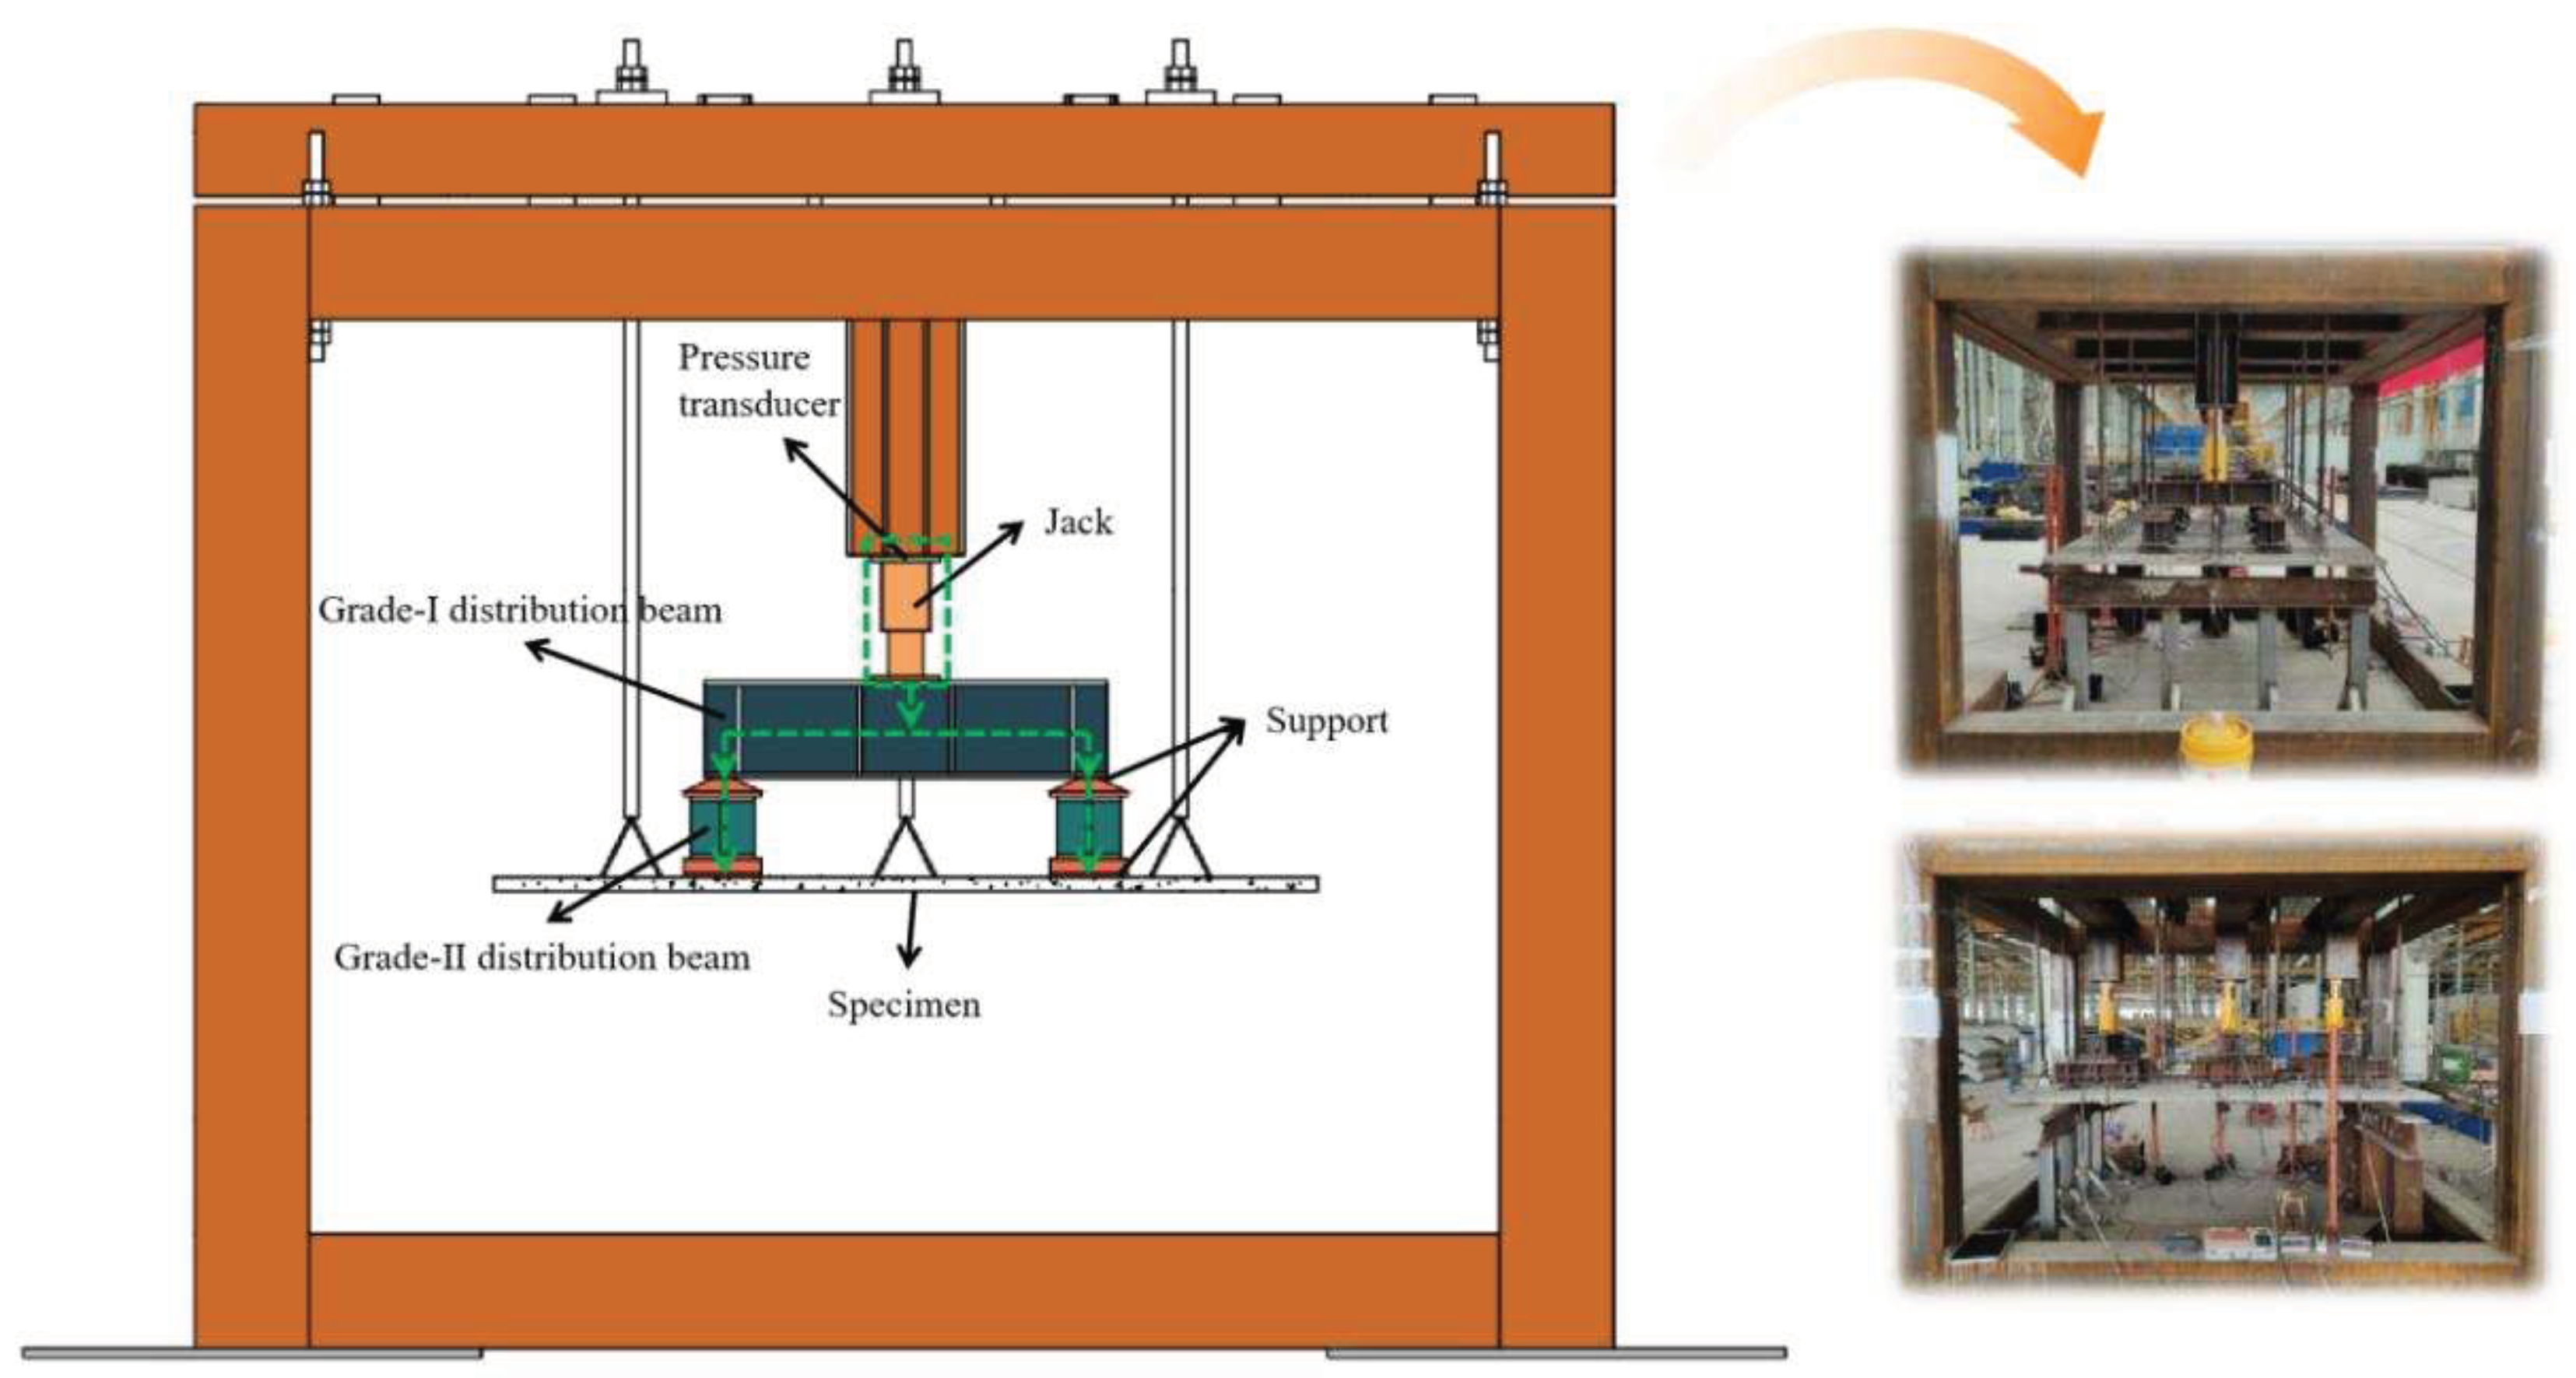
Figure 6.
A graded and partitioned loading method. (a) Partitioned loading; (b) Graded loading.
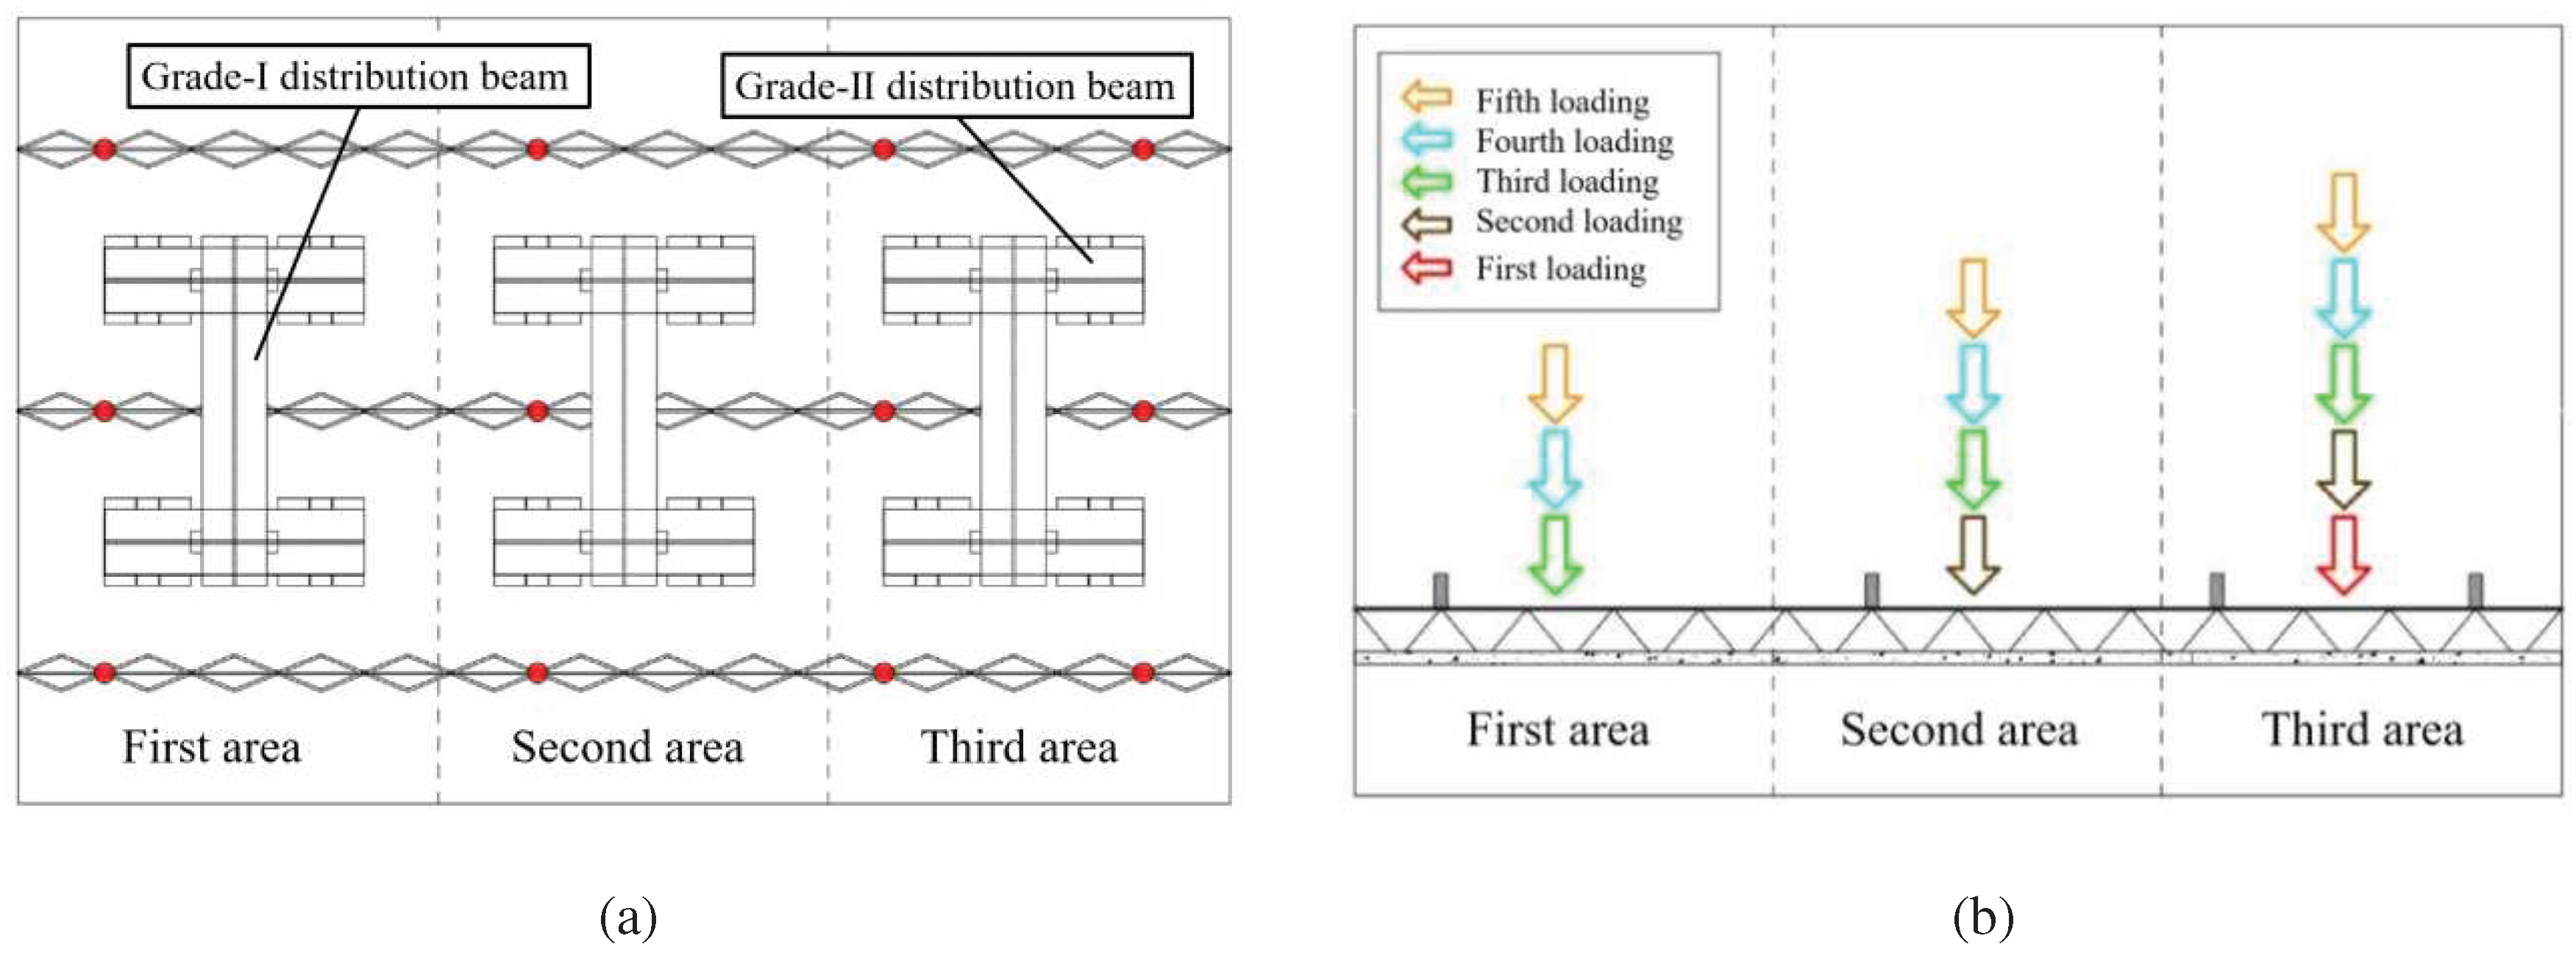
Figure 7.
Measuring point arrangement. (a) Z1~Z4; (b) B1~B5; (c) W1~W3.
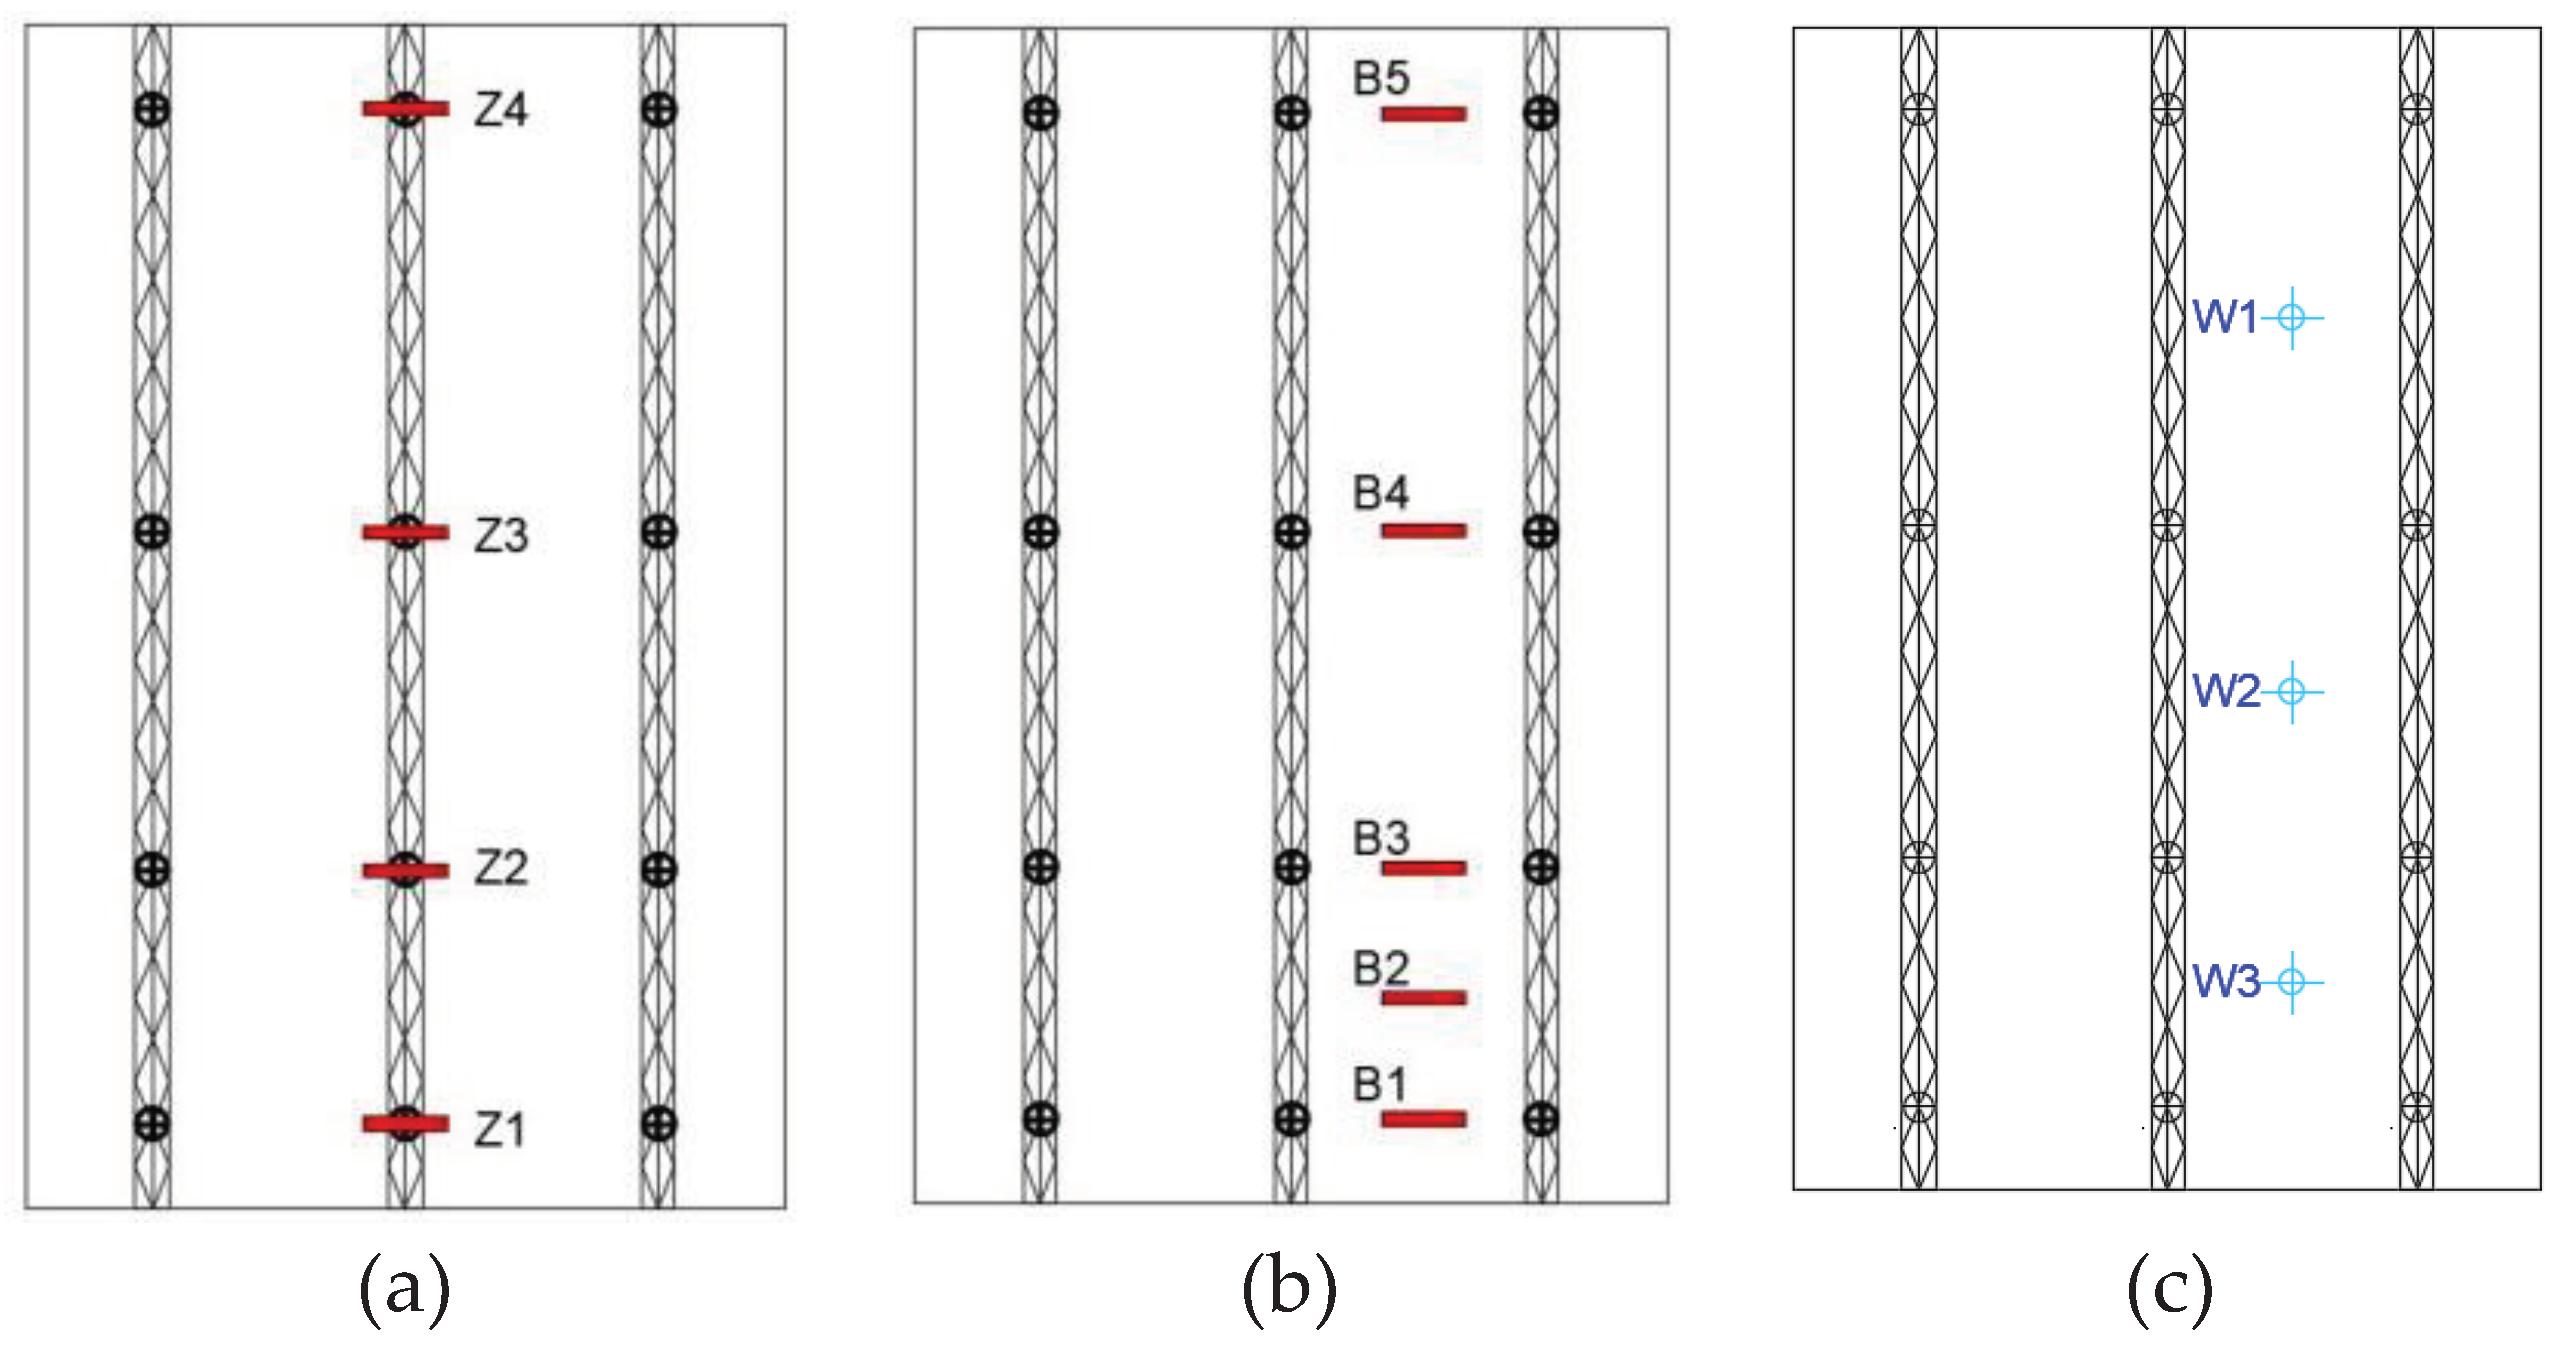
Figure 8.
Failure mode and crack distribution of N60. (a) Frontal cracks; (b) Back cracks.
Figure 9.
Failure mode and crack distribution of N40. (a) Frontal cracks; (b) Back cracks.
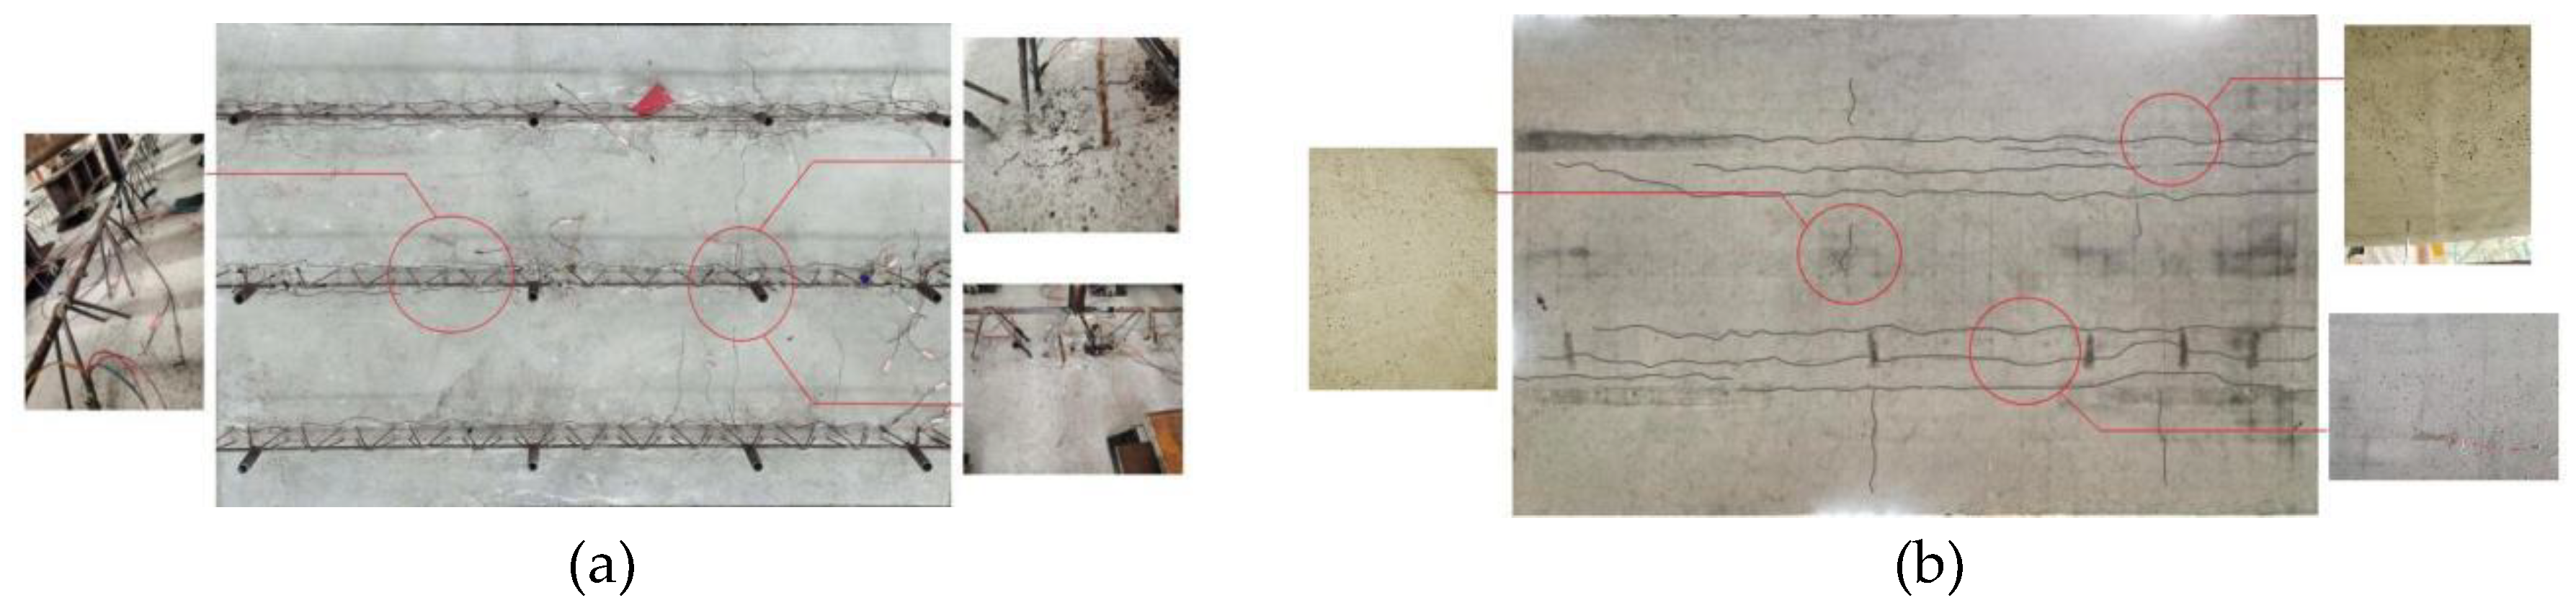
Figure 10.
Failure mode and crack distribution of SF60. (a) Frontal cracks; (b) Back cracks.

Figure 11.
Load-strain curves of concrete in front of specimens. (a) Z1; (b) Z2; (c) Z3; (d) Z4.
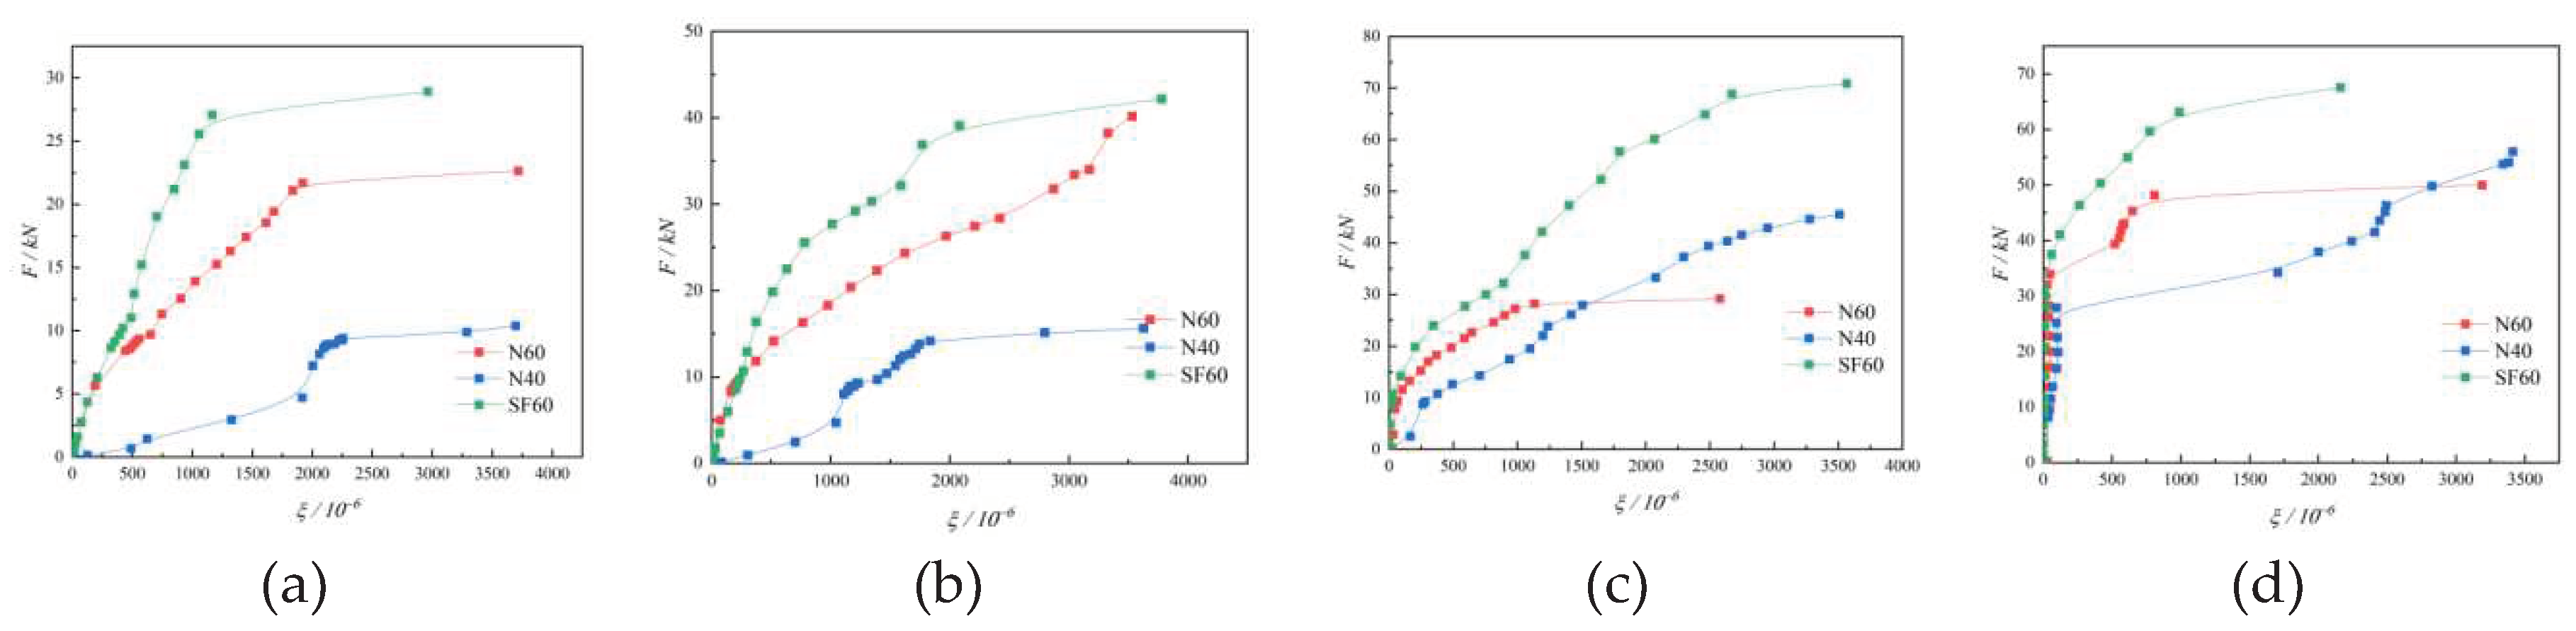
Figure 12.
Load-strain curves of concrete at back of specimens. (a) B1; (b) B2; (c) B3; (d) B4; (e) B5.
Figure 12.
Load-strain curves of concrete at back of specimens. (a) B1; (b) B2; (c) B3; (d) B4; (e) B5.

Figure 13.
Load-deflection curves of specimens. (a) W1; (b) W2; (c) W3.
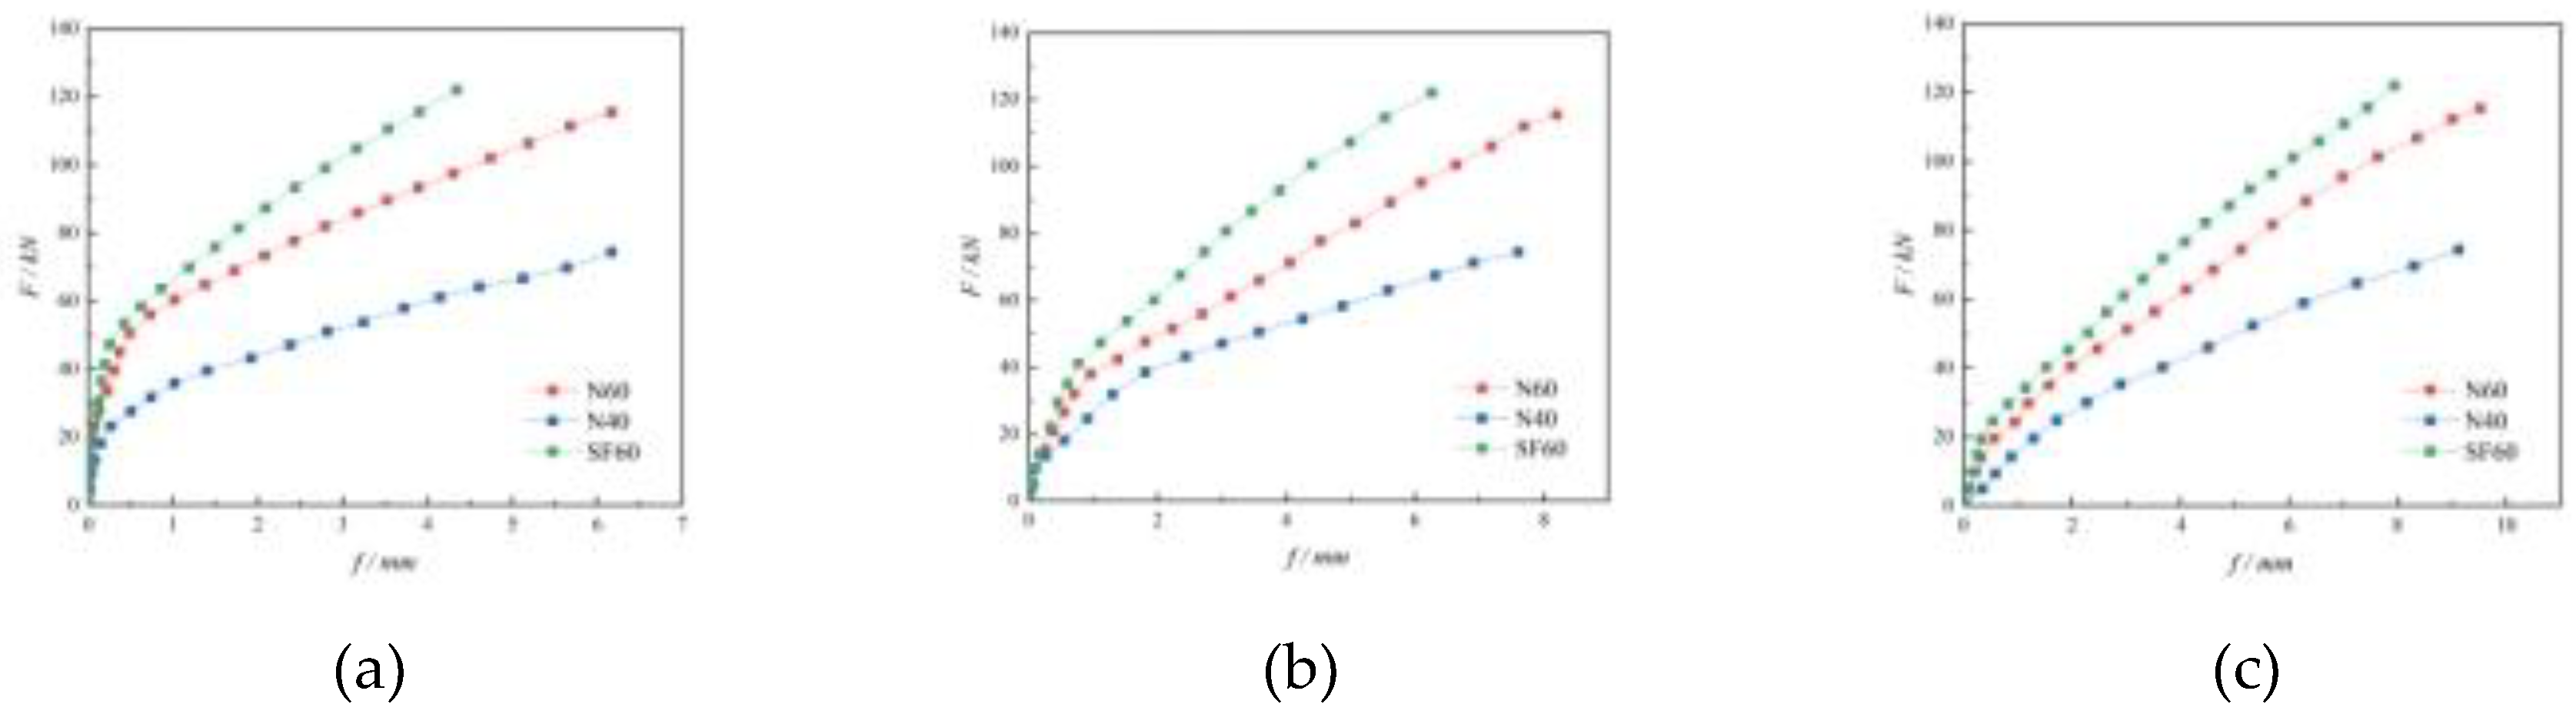
Figure 14.
Model of each specimen. (a) Specimen model; (b) Mesh subdivision.
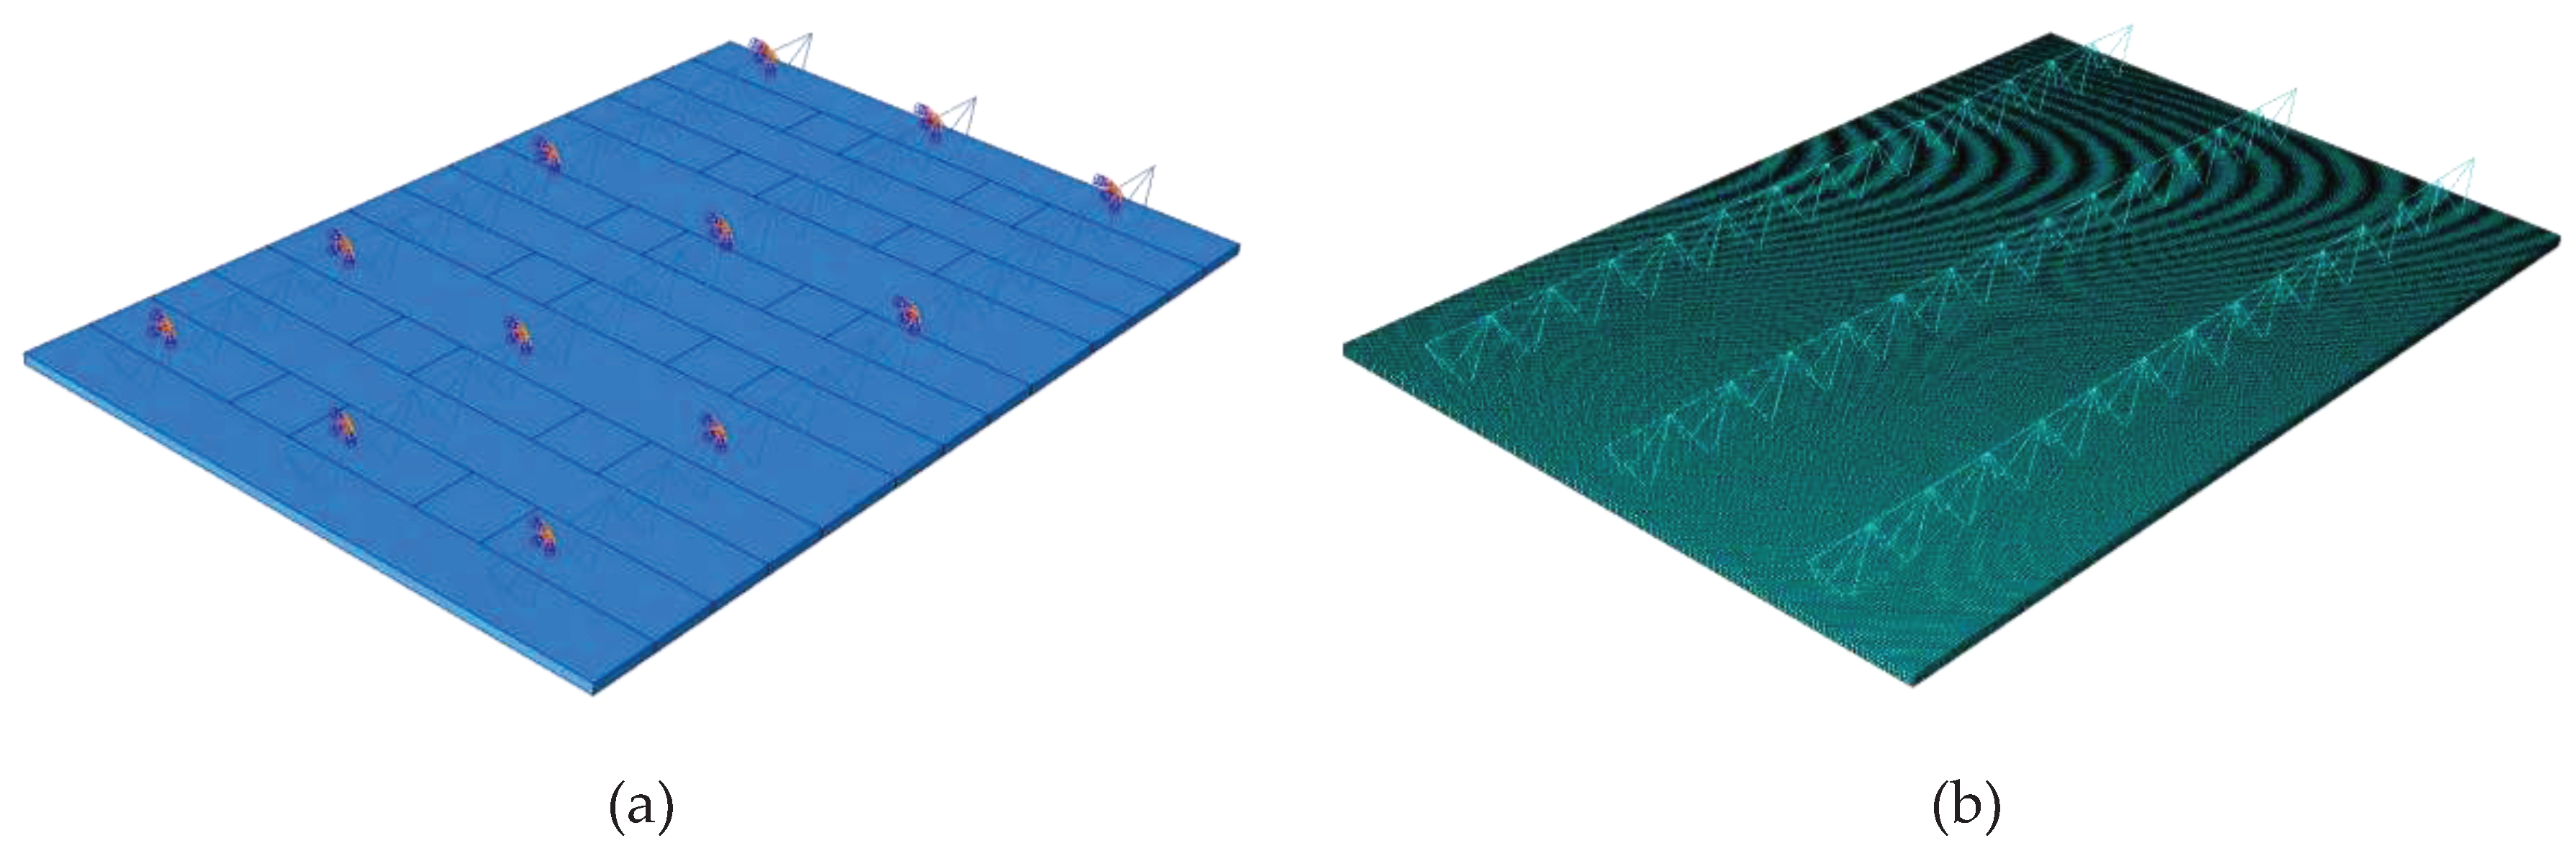
Figure 15.
Comparison of the load-deflection curves.
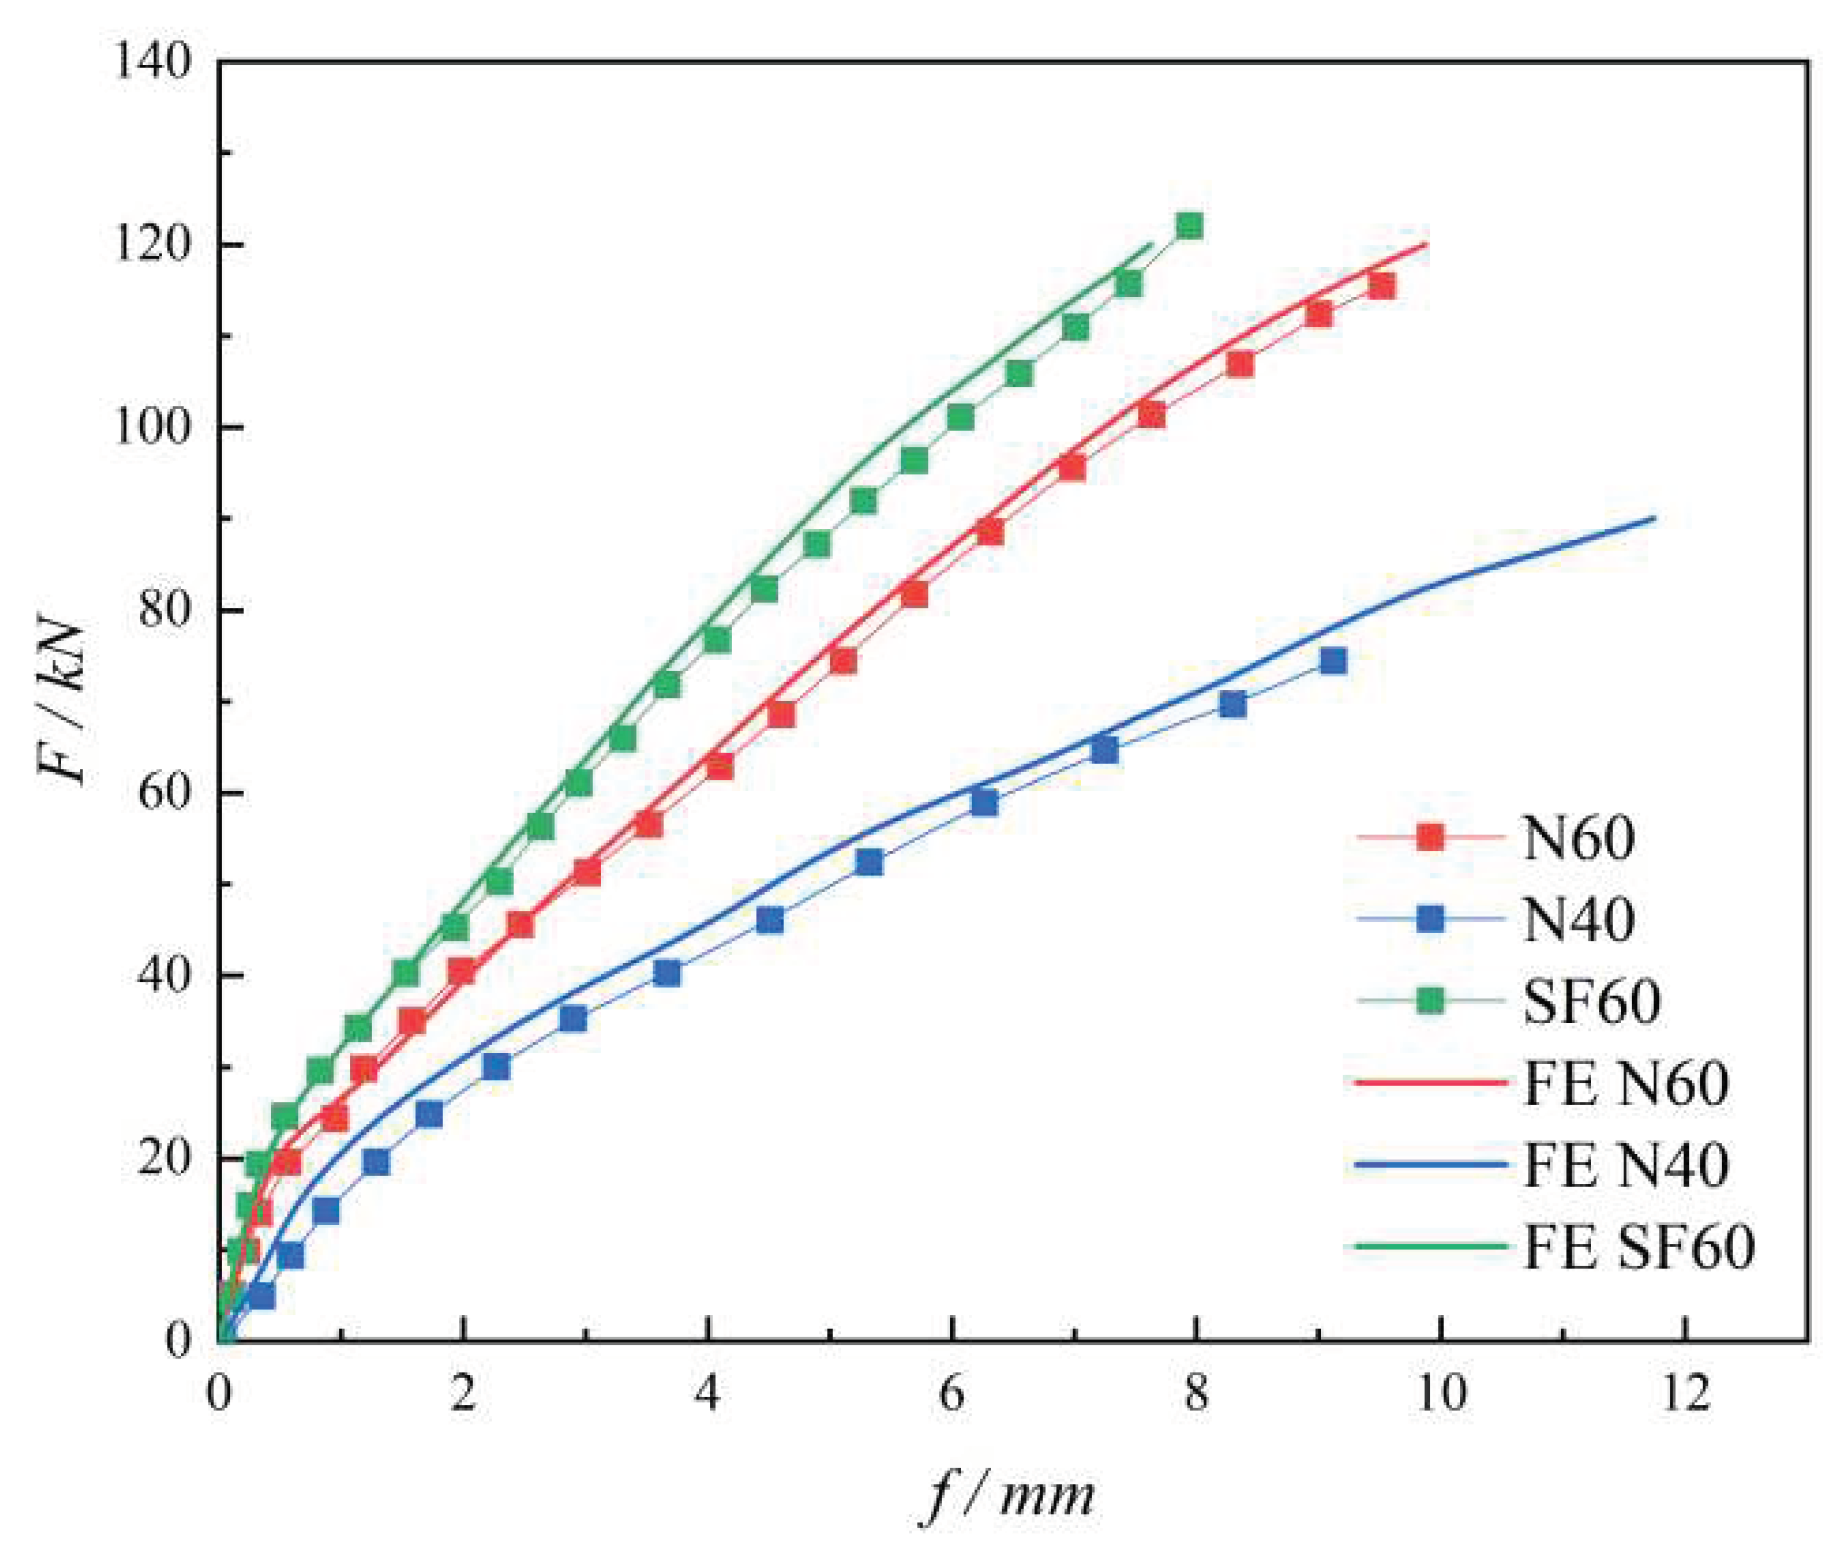
Figure 16.
Displacement cloud diagram of each specimen. (a) N60; (b) N40; (c) SF60.
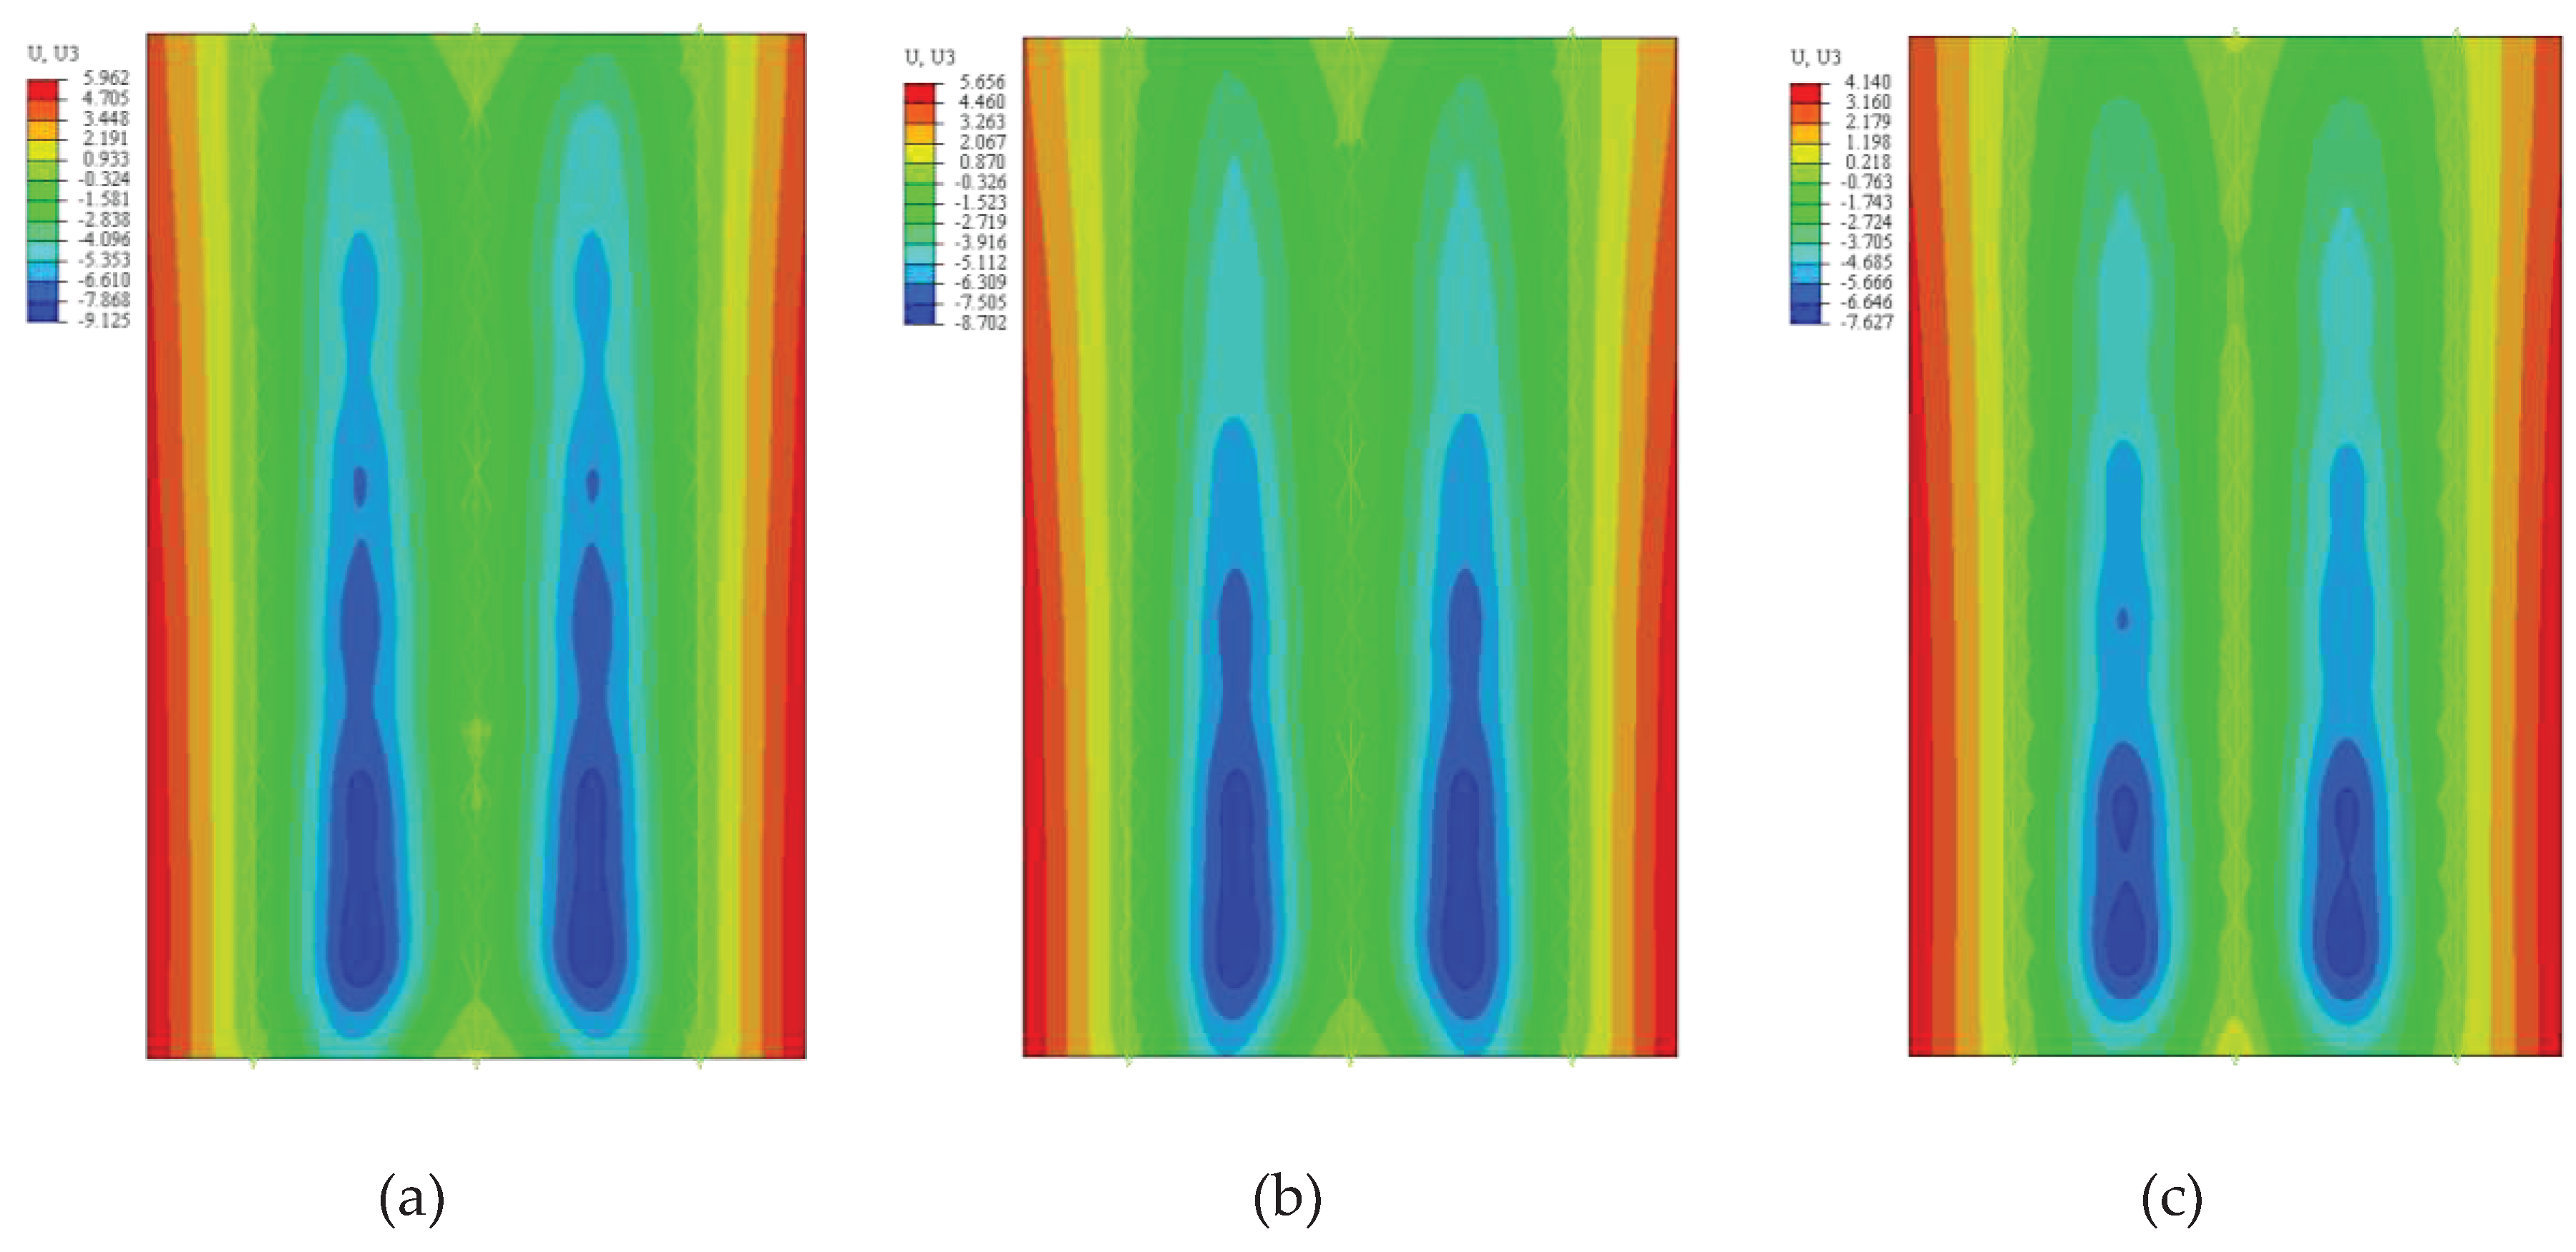
Figure 17.
Concrete front damage cloud. (a) N60; (b) N40; (c) SF60.
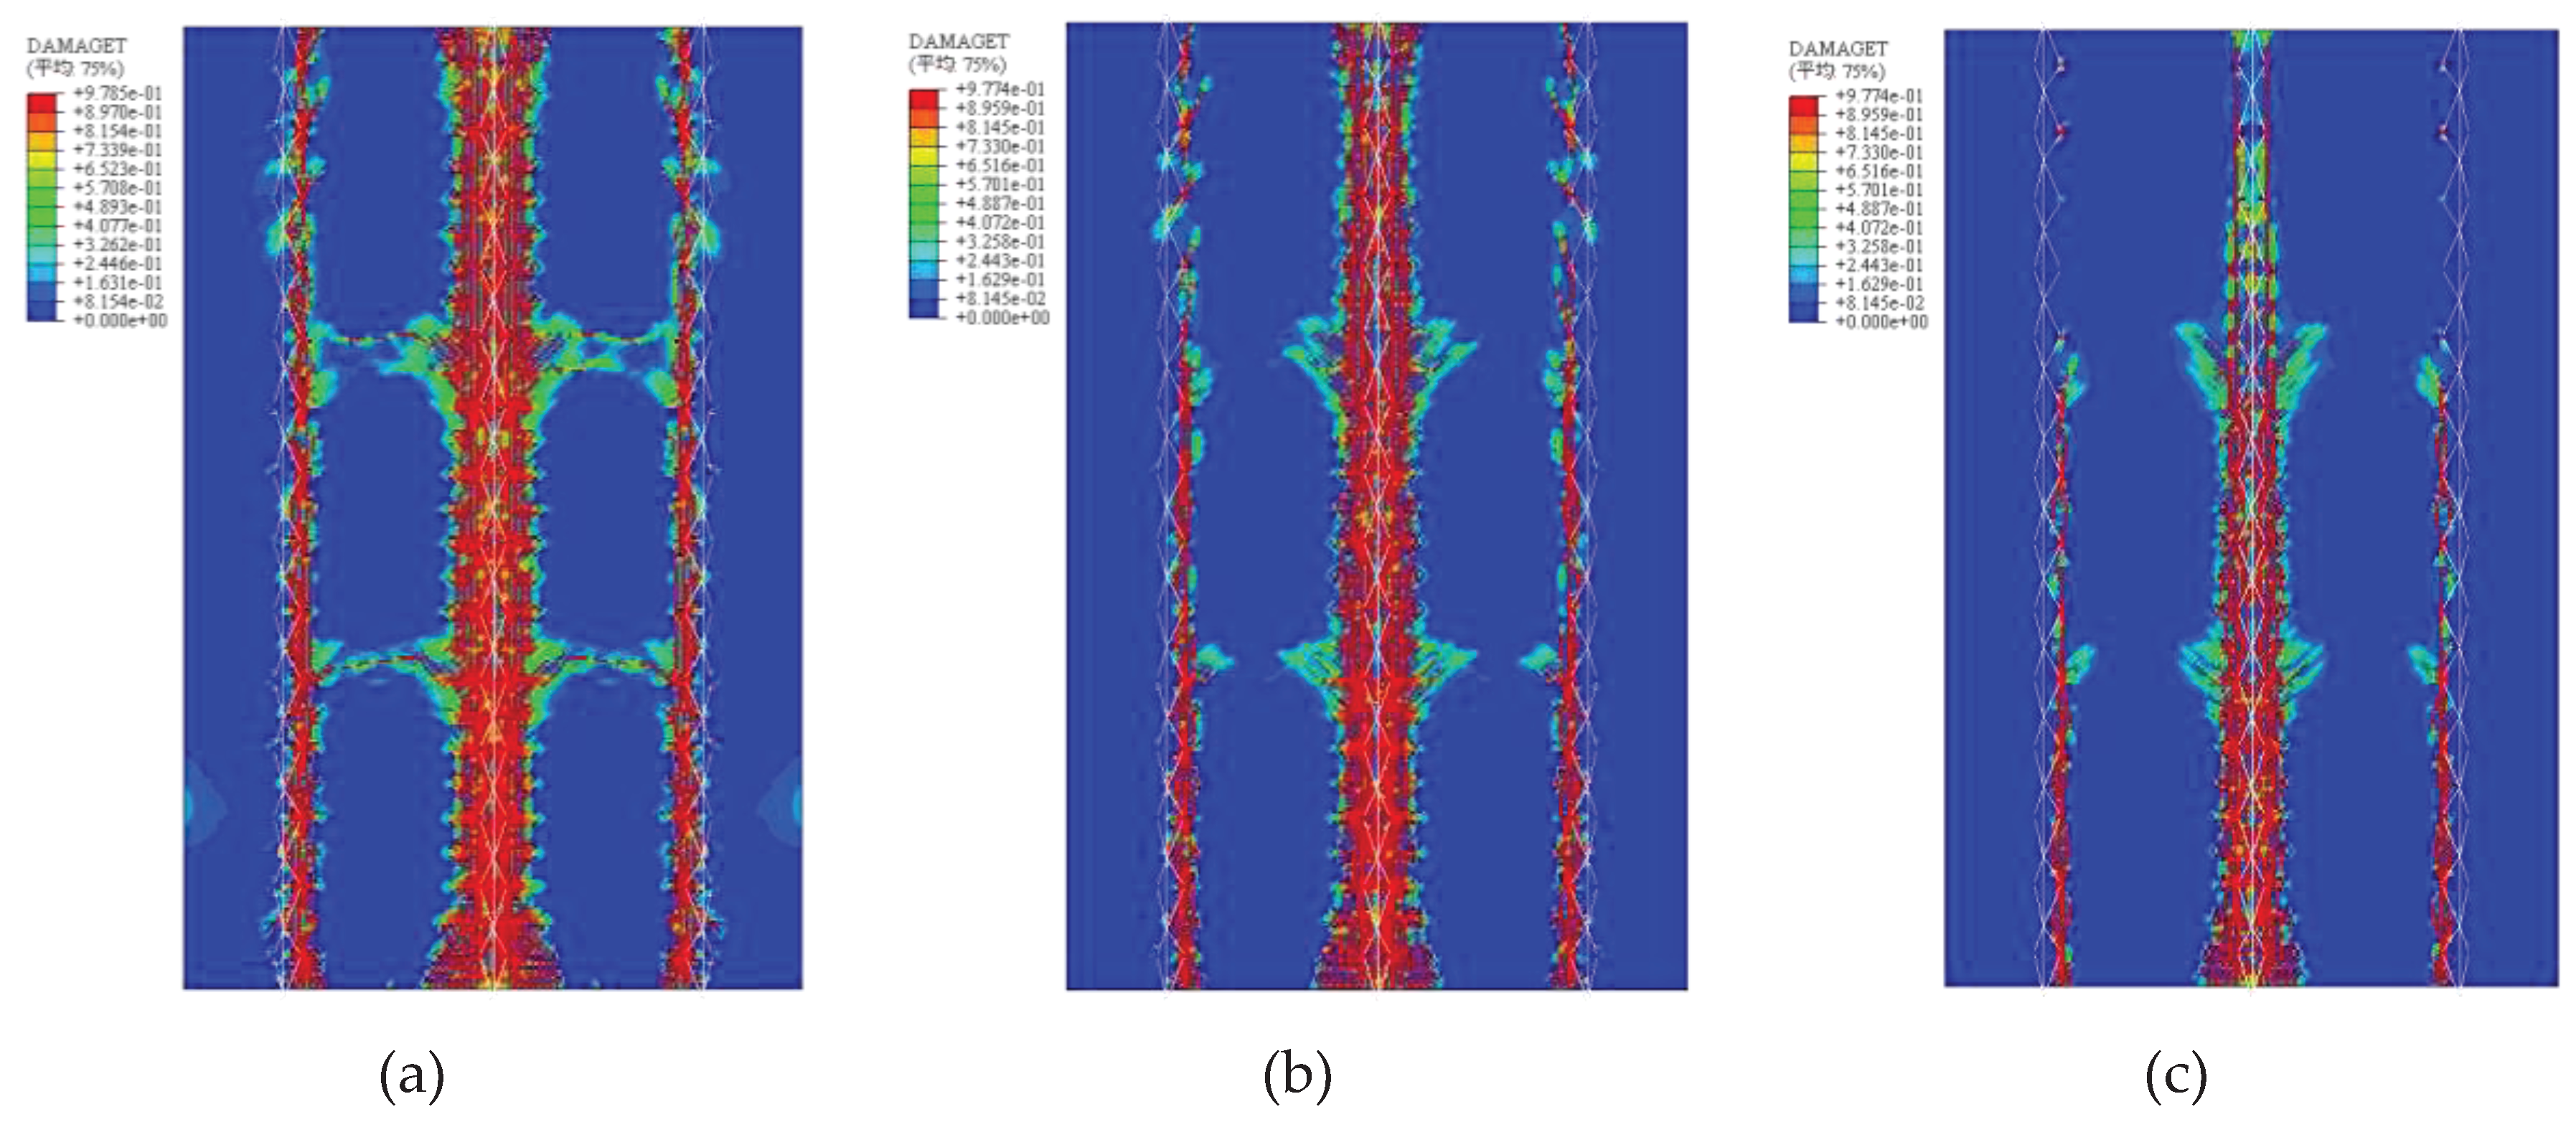
Figure 18.
Concrete front damage cloud. (a) N60; (b) N40; (c) SF60.
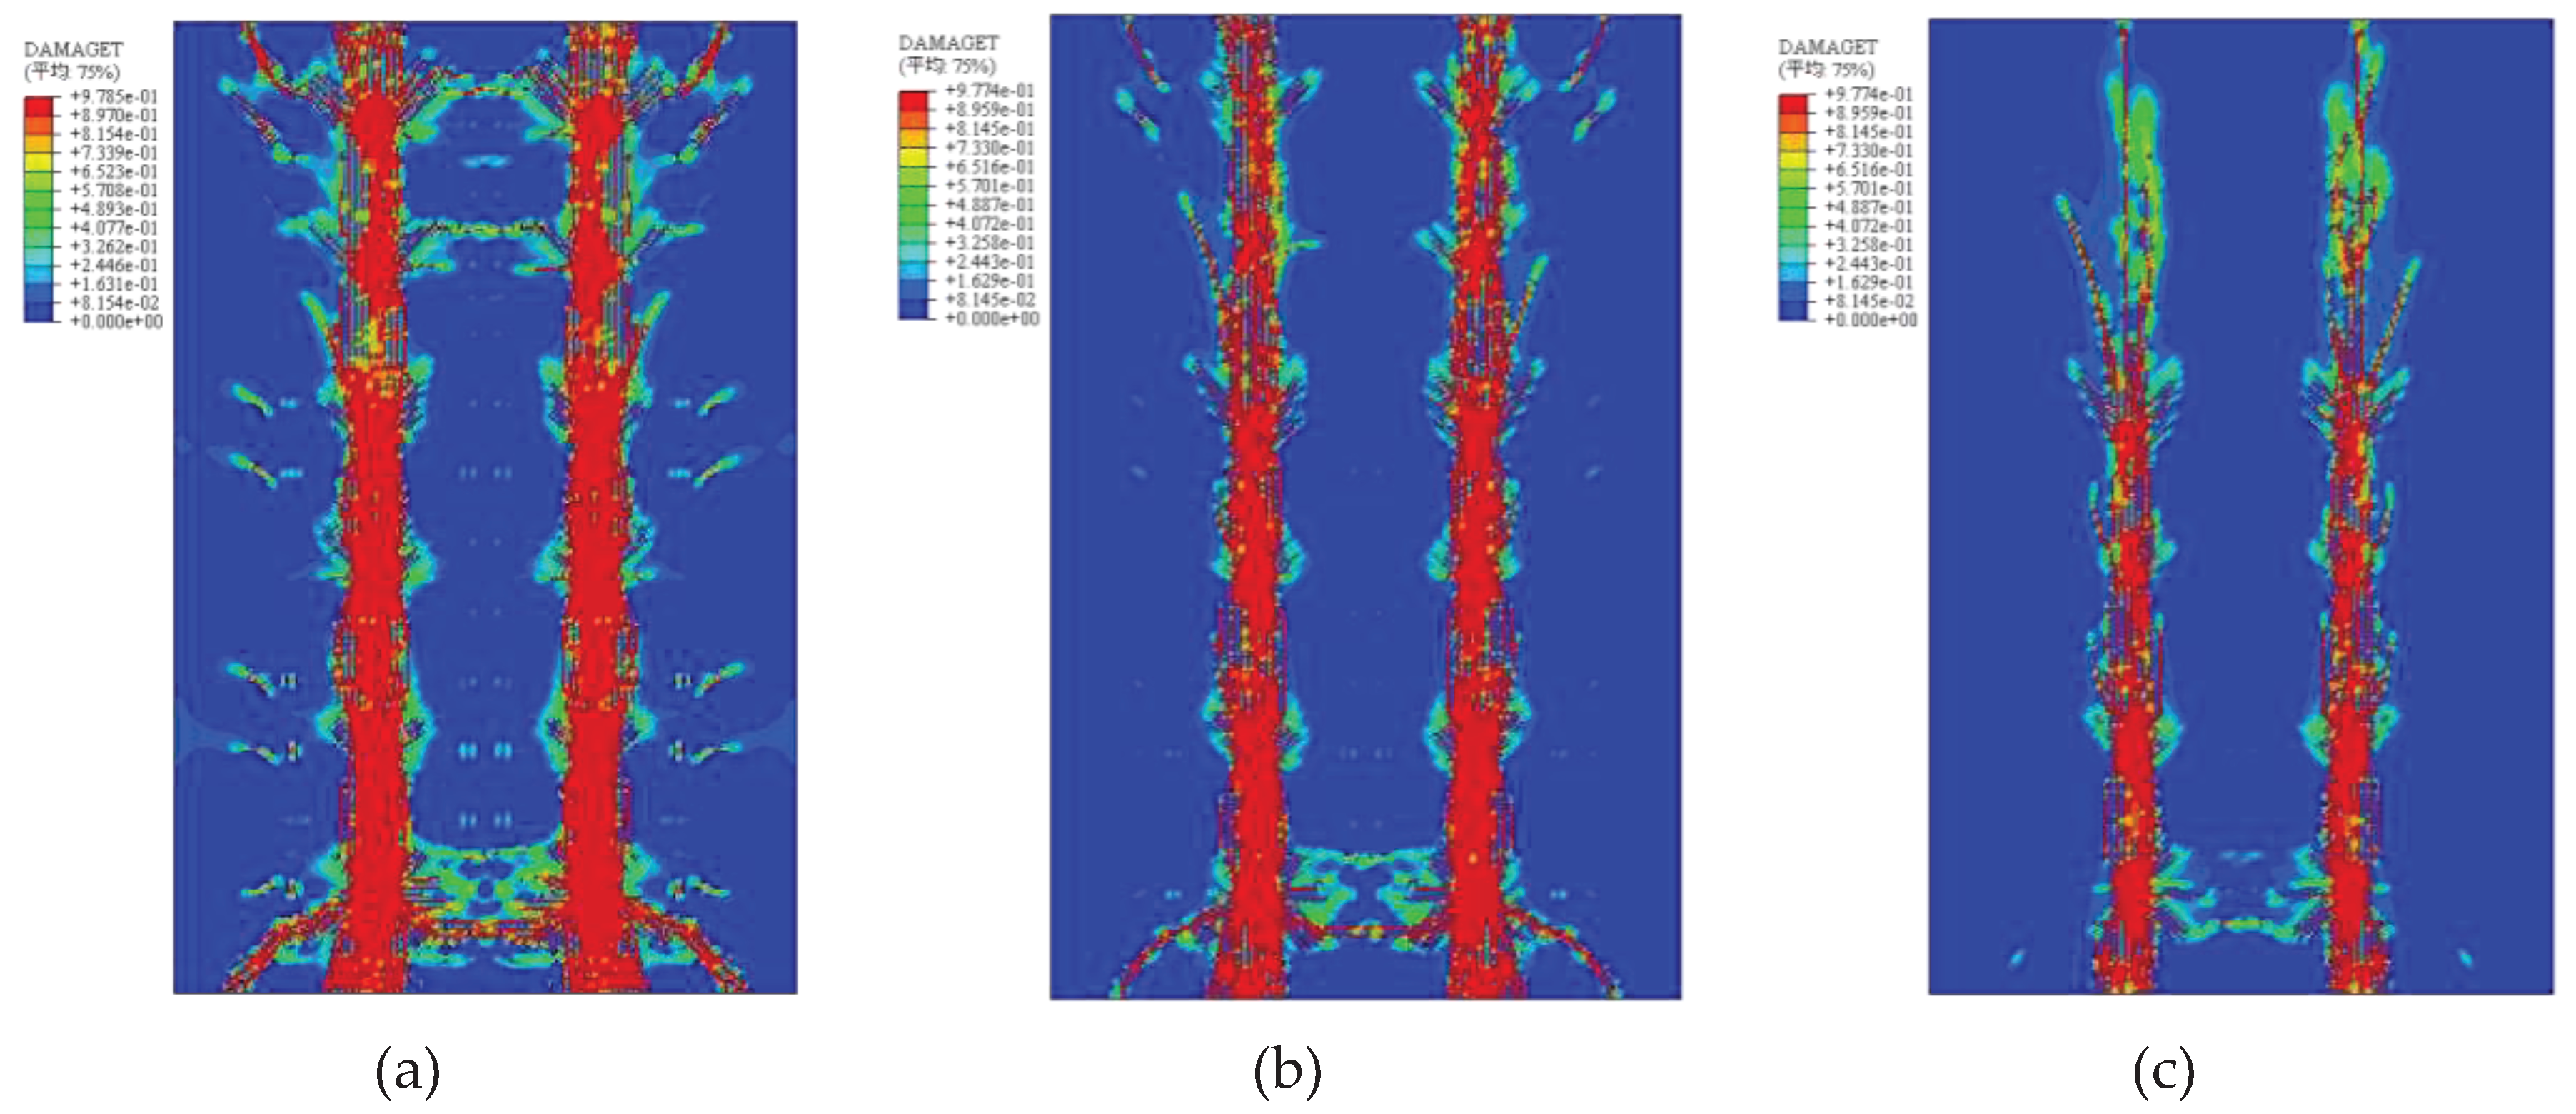
Figure 19.
Load-deflection curves of each model. (a) C40 strength group; (b) C60 strength group; (c) C80 strength group.
Figure 19.
Load-deflection curves of each model. (a) C40 strength group; (b) C60 strength group; (c) C80 strength group.
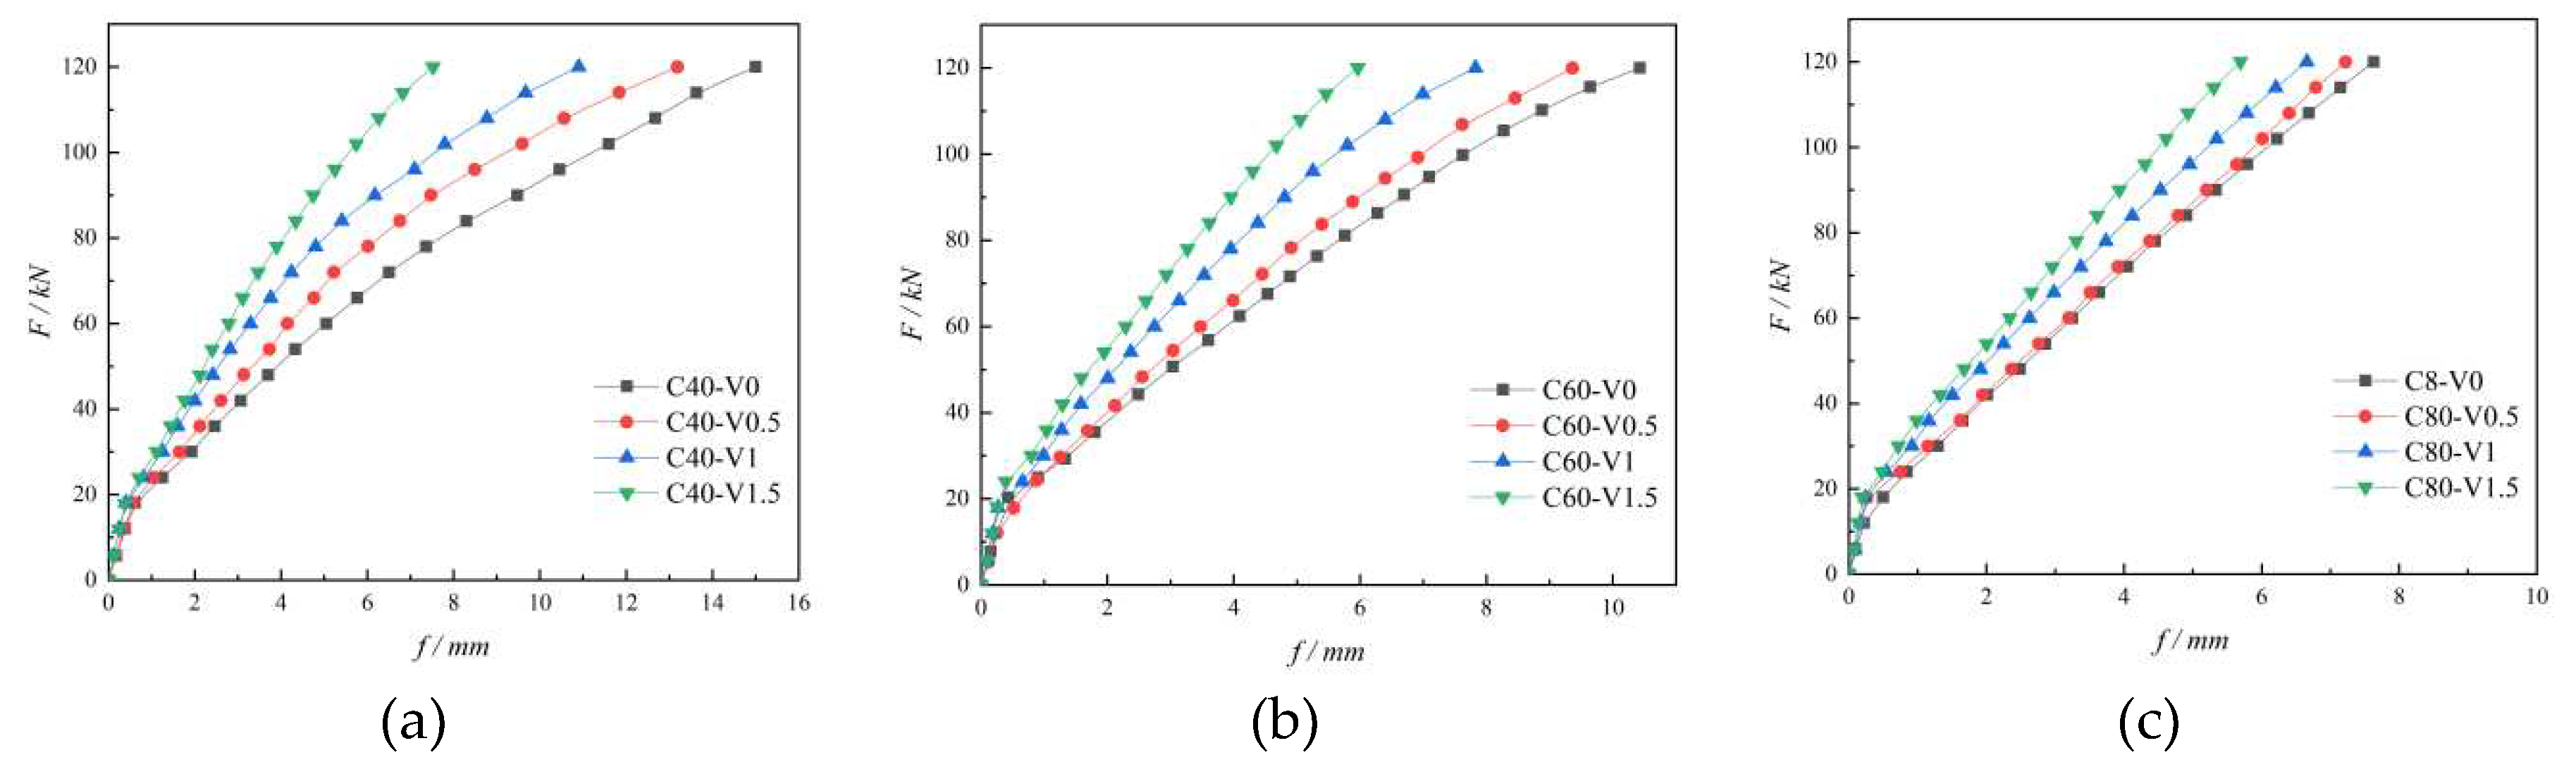
Figure 20.
Influence of fiber content on maximum deflection.
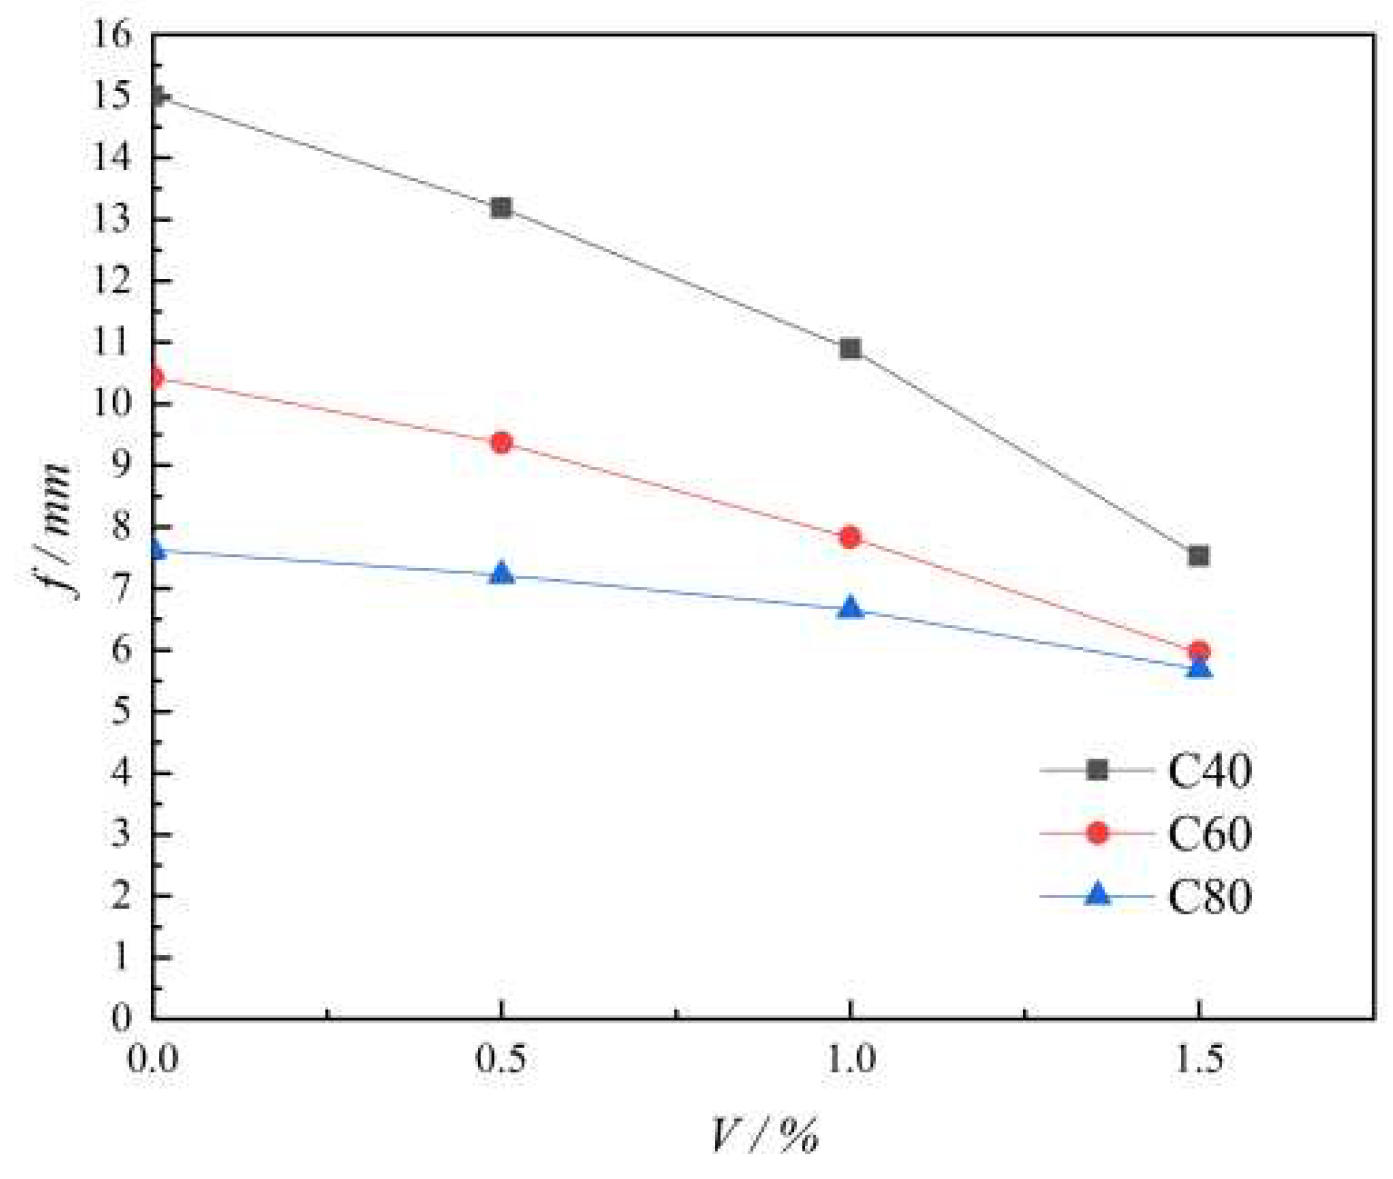

Table 1.
Test results of concrete material properties
| Concrete Materials | Numbering | Measured Compressive Strength (MPa) | Conversion Compressive Strength (MPa) | Average (MPa) |
|---|---|---|---|---|
| C40 concrete | C40-1 | 43.5 | 41.33 | 41.42 |
| C40-2 | 42.7 | 40.57 | ||
| C40-3 | 44.6 | 42.37 | ||
| C60 concrete | C60-1 | 64.4 | 61.18 | 60.99 |
| C60-2 | 63.5 | 60.33 | ||
| C60-3 | 64.7 | 61.46 | ||
| C60 steel fiber reinforced concrete | SFC60-1 | 64.9 | 61.65 | 62.35 |
| SFC60-2 | 66.7 | 63.36 | ||
| SFC60-3 | 65.3 | 62.03 |
Table 2.
Test results of steel bar properties.
| Reinforcement Diameter (mm) |
Numbering | Yield Strength (MPa) |
Average (MPa) | Ultimate Tensile Strength (MPa) |
Average (MPa) |
|---|---|---|---|---|---|
| 6 | D6-1 | 438.3 | 443.4 | 589.2 | 589.2 |
| D6-2 | 451.5 | 571.6 | |||
| D6-3 | 440.6 | 576.9 | |||
| 8 | D8-1 | 438.1 | 436.1 | 566.8 | 576.4 |
| D8-2 | 421.7 | 578.2 | |||
| D8-3 | 448.6 | 584.3 | |||
| 12 | D12-1 | 431.9 | 427.2 | 566.8 | 566.8 |
| D12-2 | 420.6 | 572.3 | |||
| D12-3 | 428.5 | 559.4 |
Table 3.
Specific parameters of the specimen.
| ID | Mesh size (L×B×H) | Grade of concrete | Additional material | Grade of steel bars | ID |
|---|---|---|---|---|---|
| N60 | 2.8m×1.8m×0.03m | C60 | - | HRB400 | N60 |
| N40 | 2.8m×1.8m×0.03m | C40 | - | HRB400 | N40 |
| SF60 | 2.8m×1.8m×0.03m | C60 | Steel fiber | HRB400 | SF60 |
Table 4.
Failure deflection and corresponding load of each specimen.
| ID | Failure deflection (mm) | Corresponding load (kN) | ||
|---|---|---|---|---|
| W1 | W2 | W3 | ||
| N60 | 6.702 | 8.004 | 9.521 | 115.49 |
| N40 | 4.326 | 7.444 | 9.124 | 74.45 |
| SF60 | 4.179 | 6.517 | 7.942 | 122.06 |
Table 5.
The characteristic load of each specimen.
| ID | Cracking Load (kN) | Increase in Cracking Load | Ultimate Load (kN) | Increase in Ultimate Load |
|---|---|---|---|---|
| N60 | 17.76 | - | 115.49 | - |
| N40 | 11.13 | -37.33% | 74.45 | -35.54% |
| SF60 | 26.12 | 47.07% | 122.06 | 5.69% |
Table 6.
Plastic damage model parameters of concrete materials.
| ID | Dilation Angle | Eccentricity | fb0/ fc0 | Ratio of Tension-compression Meridian | Viscosity Parameter |
|---|---|---|---|---|---|
| Ordinary concrete | 30 | 0.1 | 1.16 | 0.667 | 0.0005 |
| Steel fiber reinforced concrete | 18.64 | 0.1 | 1.4418 | 0.67629 | 0.0005 |
Table 7.
Material constitutive parameters.
| ID | Mass density (kg/m3) | E (MPa) | Poisson Ratio |
|---|---|---|---|
| C40 concrete | - | 32500 | 0.2 |
| C60 concrete | 2500 | 36000 | 0.2 |
| C60 Steel fiber reinforced concrete | - | 36277 | 0.2 |
| HRB400 steel bars | 7850 | 200000 | 0.3 |
Table 8.
Comparison of test and simulation maximum deflection of each specimen.
| ID | Maximum deflection (mm) | Simulation/ Test | |
|---|---|---|---|
| Test | Simulation | ||
| N60 | 9.521 | 9.125 | 0.958 |
| N40 | 9.124 | 8.702 | 0.954 |
| SF60 | 7.942 | 7.627 | 0.960 |
Table 9.
Parameters of the design model.
| V=0% | V=0.5% | V=1% | V=1.5% | |
|---|---|---|---|---|
| C40 | C40-V0 | C40-V0.5 | C40-V1 | C40-V1.5 |
| C60 | C60-V0 | C60-V0.5 | C60-V1 | C60-V1.5 |
| C80 | C80-V0 | C80-V0.5 | C80-V1 | C80-V1.5 |
Disclaimer/Publisher’s Note: The statements, opinions and data contained in all publications are solely those of the individual author(s) and contributor(s) and not of MDPI and/or the editor(s). MDPI and/or the editor(s) disclaim responsibility for any injury to people or property resulting from any ideas, methods, instructions or products referred to in the content. |
© 2023 by the authors. Licensee MDPI, Basel, Switzerland. This article is an open access article distributed under the terms and conditions of the Creative Commons Attribution (CC BY) license (http://creativecommons.org/licenses/by/4.0/).
Copyright: This open access article is published under a Creative Commons CC BY 4.0 license, which permit the free download, distribution, and reuse, provided that the author and preprint are cited in any reuse.


