
Submitted:
20 October 2023
Posted:
24 October 2023
You are already at the latest version
Abstract
Abstract: This article explores the intricate relationship between environmental degradation, specifically air pollution, and economic growth in the Sultanate of Oman spanning the period from 1990 to 2022. We employ cointegration and vector error correction models to uncover both short- and long-term dynamics in the association between air pollution and economic growth. Fur-thermore, Granger causality analysis is utilized to investigate the causal links between these crucial variables. This data encompasses factors related to environmental quality and various control variables. The empirical results unveil a sustained long-term cointegration connection between the variables. Additionally, our findings highlight a statistically significant positive impact of economic growth and energy consumption on CO2 emissions. Furthermore, the short-term analysis reveals an annual adjustment of approximately 14.1% in N2O emissions dis-equilibrium. The Granger causality study indicates unidirectional causal relationships involving N2O emissions, economic growth, and CO2 emissions. The implications of these findings for Oman's policy landscape are substantial. To effectively reduce greenhouse gas emissions, it is imperative for Oman to establish robust climate change policies. Additionally, the government can play a pivotal role in encouraging and endorsing the use of renewable energy sources, such as green hydrogen, as a promising alternative to traditional oil and gas resources.
Keywords:
Air Pollution
; Cointegration
; Oman
1. Introduction
The interplay between air pollution, climate change, and economic growth has garnered significant attention from scholars and policymakers in recent times. It is noteworthy that many sources of "conventional" air pollution are also primary contributors to CO2 and other greenhouse gases (GHGs), which play a pivotal role in global warming [2]. Climate change remains an ongoing global concern due to its profound and far-reaching impacts on human existence on Earth. The rapid expansion of economic activities, urbanization, and population growth has resulted in an unprecedented surge in the demand for energy consumption. These factors collectively contribute to the escalating levels of greenhouse gas emissions and environmental degradation. Consequently, one of the paramount developmental challenges facing the world today revolves around achieving sustainable economic growth rates while delicately balancing this expansion with environmental preservation. Numerous studies have examined CO2 emissions and air pollution in the Gulf Cooperation Council (GCC) nations. Research indicates positive correlations among urbanization, energy utilization, and CO2 emissions in GCC countries [3]. Furthermore, it has been observed that various climatic elements, including wind speed, wind direction, temperature, relative humidity, and rainfall, significantly influence the levels of CO2 and hydrocarbons in the atmosphere [4]. These studies collectively shed light on the intricate relationships among urbanization, energy consumption, GDP growth, foreign direct investment, financial development, and climatic factors in the GCC nations [5]. In the pursuit of evaluating and devising solutions to achieve a zero-carbon neutrality target by 2050, numerous Conferences of Parties (COPs) have been convened to address the pressing issue of climate change. Aligned with the objective of limiting global warming to 1.5 °C, as outlined in the Paris Agreement, Oman has made a commitment to attaining net-zero emissions by 2050. Oman's concerted efforts in this endeavor encompass a strong focus on transitioning to clean energy sources and bolstering resilience. Initiatives such as the National Strategy for Adaptation and Mitigation to Climate Change and the second nationally determined contribution (NDC) underscore the imperative need for energy infrastructure resilience against climate change impacts. Furthermore, Oman Vision 2040 and the National Energy Strategy set ambitious goals for expanding renewable energy and enhancing energy efficiency. This paper's primary objective is to explore the evolving relationship between air pollution and economic growth in Oman over the period spanning 1990 to 2022, thereby contributing new insights into this critical association. Furthermore, an analysis of the interplay among economic growth, air pollution, and other relevant control variables holds the potential to offer valuable perspectives on this issue. Notably, prior research has not directly scrutinized the interconnectedness of air pollution, climate change, and economic growth in the context of Oman, adding to the impetus for this study. Our secondary methodological contribution lies in the utilization of various econometric techniques, including cointegration tests to assess the long-term dynamics of the variables and dynamic ordinary least squares (DOLS). Additionally, we employ panel Granger causality to elucidate the direction of causality between these variables. The subsequent sections of this article are structured as follows: In Section 2, we provide a concise review of the existing literature. Section 3 outlines the methodology, including variable definitions and data sources. Section 4 presents the empirical findings. The concluding section is reserved for summarizing the outcomes and offering policy recommendations.
1.1. Greenhouse Gas Emissions in Oman
In Oman, greenhouse gas emissions are primarily caused by both natural and human factors. Although Oman's emissions are relatively low compared to some industrialized countries, they still contribute to global climate change. The primary causes of greenhouse gas emissions in Oman include:
- Energy Production: The energy sector is a significant contributor to greenhouse gas emissions in Oman. The country heavily relies on oil and natural gas to generate electricity and fuel its industry, which results in the combustion of fossil fuels in power plants and industrial processes, releasing significant amounts of carbon dioxide (CO2) into the atmosphere.
- Transportation: Oman's growing economy and population have led to an increase in the number of vehicles on the road, resulting in gasoline- and diesel-powered vehicles being the major sources of CO2 emissions. The lack of a well-developed public transportation system also contributes to the reliance on private vehicles.
- Industrial Processes: Industrial activities, such as petrochemical production, cement manufacturing, and metal smelting, release greenhouse gases as byproducts of their operation. These emissions include CO2 and other gases like methane (CH4) and nitrous oxide (N2O).
- Waste management plays a crucial role in reducing methane emissions. The improper disposal of solid waste in landfills can result in anaerobic decomposition of organic materials, leading to the generation of methane. Conversely, adopting appropriate waste management and recycling practices can help to minimize these emissions.
- Agriculture is a significant contributor to greenhouse gas emissions in Oman, particularly from methane emissions resulting from enteric fermentation in livestock and rice cultivation. Nitrous oxide emissions can also arise from the application of synthetic fertilizers in agriculture.
- Land use changes, such as deforestation and urbanization, can lead to a decline in carbon sinks and the release of stored carbon into vegetation and soils. This reduction in carbon sinks can have a significant impact on the environment and climate.
- Wastewater management systems can contribute to greenhouse gas emissions if not properly managed. Improved wastewater management systems can help to reduce methane emissions and improve overall environmental health.
- Natural factors, such as wildfires, dust storms, and geological emissions, can also release greenhouse gases into the atmosphere. However, these events are exacerbated by climate change
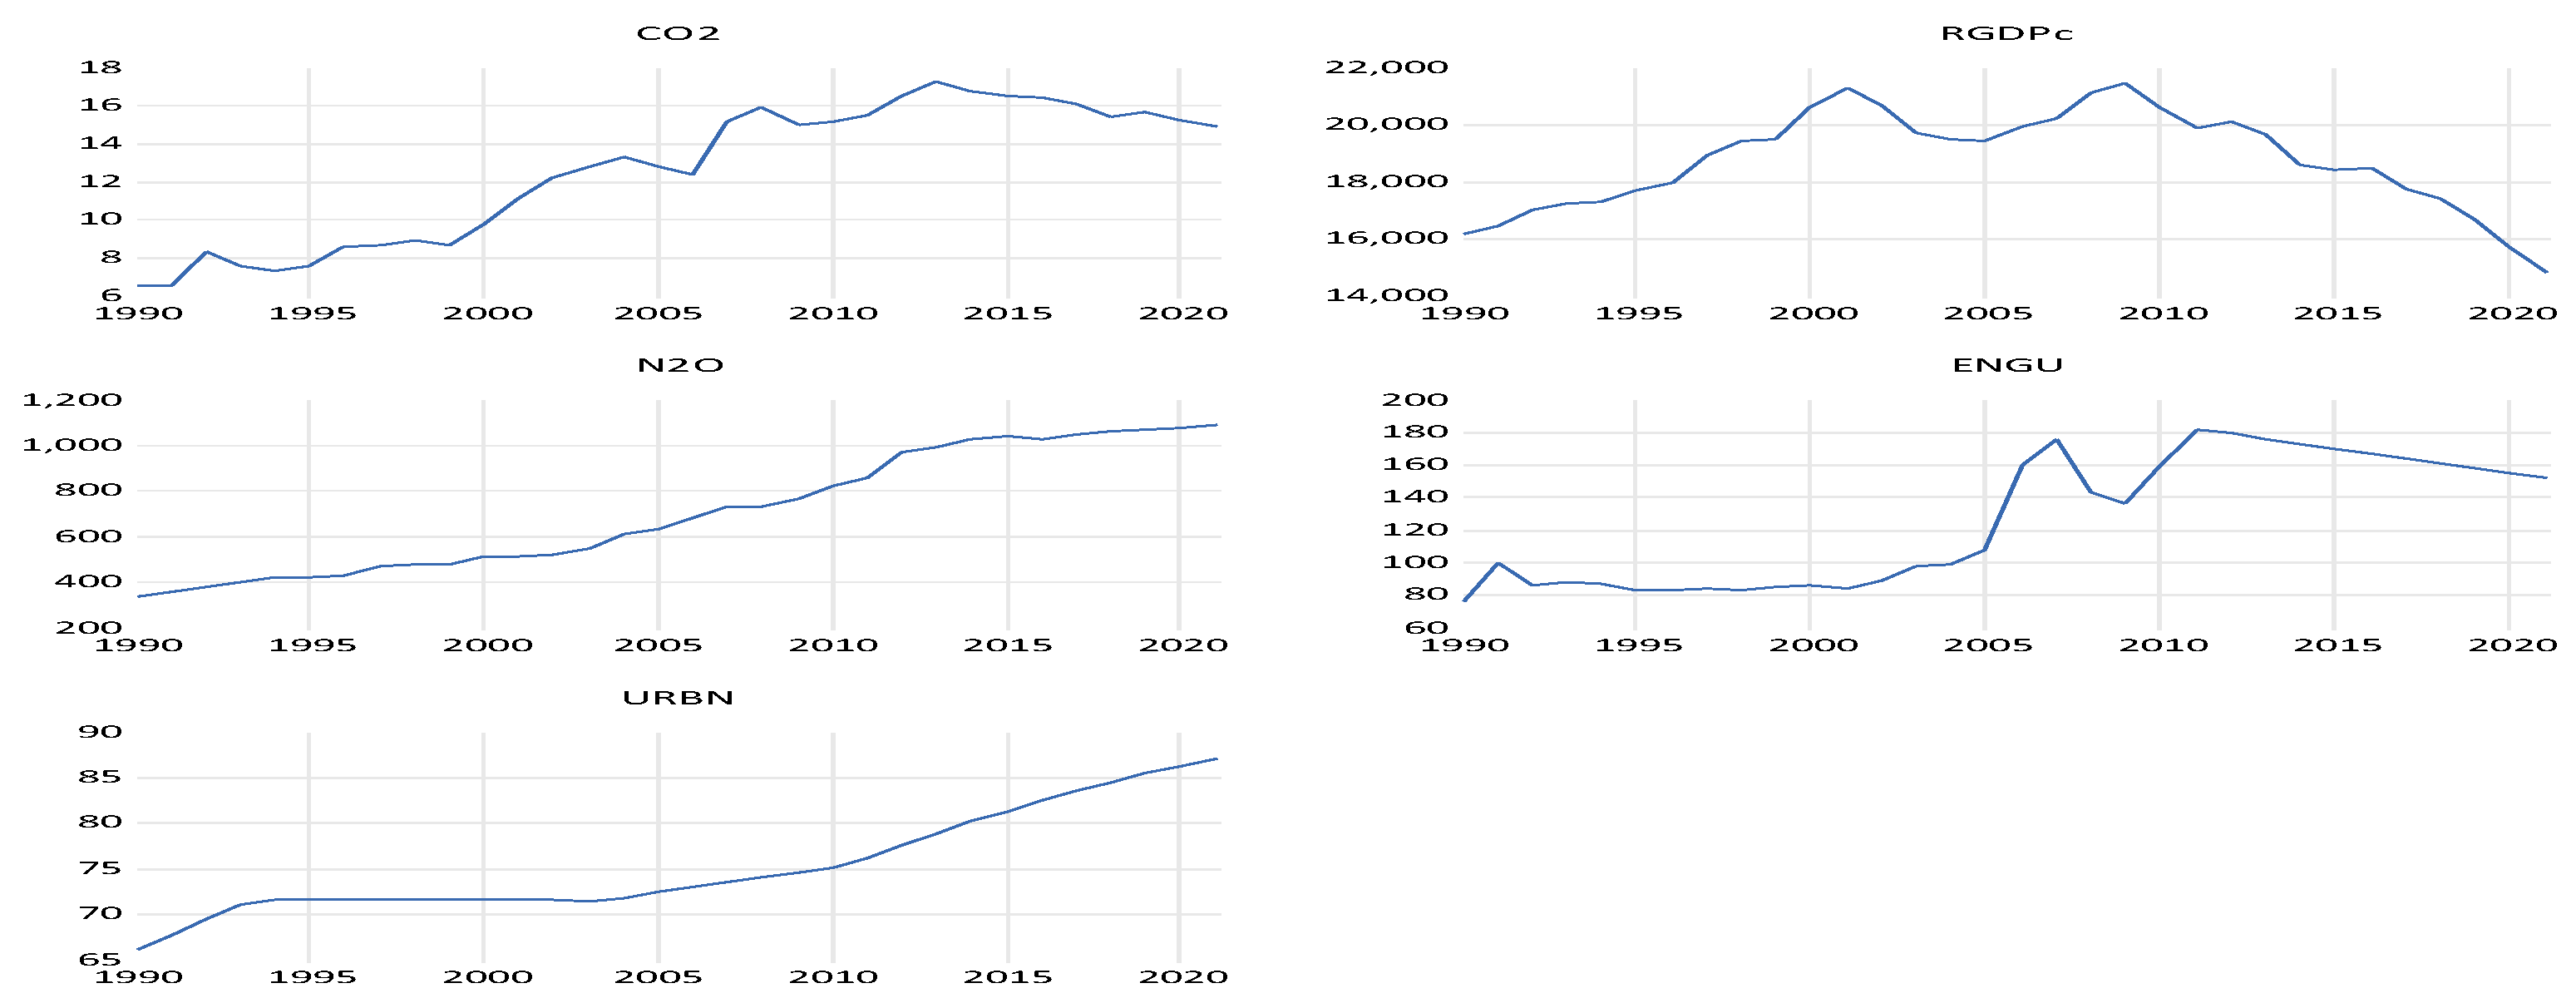
Figure 2.
Trend in CO2, N2O, Urbanization, Energy use and GDP per-capita growth.
1.2. Causes of Air Pollution in Oman
Air pollution in Oman can be attributed to a variety of factors , many of which are common to urban areas and industrialized regions around the world. Some of the primary causes of air pollution in Oman include:
- Industrial Emissions: Industrial activities, including oil and gas extraction, petrochemical manufacturing, and other heavy industries, release various pollutants into the air. These emissions can include sulfur dioxide (SO2), nitrogen oxides (NOx), particulate matter, and volatile organic compounds (VOCs).
- Vehicle Emissions: The increasing number of vehicles on the road contributes to air pollution. Diesel and gasoline vehicles emit pollutants such as carbon monoxide (CO2), NOx, VOCs, and particulate matter.
- Construction and Infrastructure Development: Rapid urbanization and construction projects can lead to dust and particulate matter in the air. These particles can cause respiratory problems and reduce air quality.
- Natural Sources: Dust storms, especially in the arid climate of Oman, can contribute significantly to air pollution. Dust and sand particles are lifted into the air and can affect air quality when they settle.
- Maritime Transport: Oman's strategic location near the Arabian Sea and the Gulf of Oman means it has a significant shipping industry. Ship emissions can include sulfur dioxide, NOx, and particulate matter, affecting coastal air quality.
- Waste Management: Inefficient waste disposal and open burning of trash can release pollutants into the air. This is especially a concern in some less-developed areas.
- Oil and Gas Operations: Oman is a major oil and gas producer, and the extraction and processing of these resources can release pollutants and greenhouse gases into the atmosphere.
- Refineries and Petrochemical Plants: The processing of oil and natural gas in refineries and petrochemical plants can release various pollutants into the air.
- Agricultural Activities: The use of fertilizers and pesticides in agriculture can release ammonia (NH3) and other chemicals into the atmosphere.
- Power Generation: The combustion of fossil fuels for electricity generation can release pollutants into the air. Oman is working to diversify its energy sources, including through renewable energy projects, to reduce this source of pollution.
2. Related Literature
2.1. Economic Growth and Air Pollution
Several previous studies have investigated the link between economic growth and air pollution, with a focus on examining the long-term dynamics using the Environmental Kuznets Curve (EKC) theory. The EKC theory is founded on the concept of an inverted U-shaped relationship between a country's income level and its carbon emissions. Initially proposed by [6], the EKC hypothesis aims to explore the interplay between per capita income and environmental attributes. Their empirical investigations, however, introduced complexities to the Environmental Kuznets Curve (EKC) theory due to yielding a wide array of outcomes. The connection between economic growth and CO2 emissions has also undergone extensive scrutiny in recent years, resulting in a mosaic of diverse and contradictory findings. For instance, studies conducted by [7,8,9,10,11,12,13] have identified a positive relationship between economic growth and carbon emissions. In contrast to the predictions of the EKC hypothesis, research by [14,15,16,17], has demonstrated that economic growth leads to a reduction in carbon emissions over the long term. Furthermore, [18] conducted an in-depth investigation into the interplay among N2O emissions, economic growth, agricultural land utilization, and exports in Germany. They employed time series data and the Autoregressive Distributed Lag (ARDL) technique, covering the period from 1970 to 2012. Their results unveiled a curvilinear long-term association between N2O emissions and economic growth, thereby substantiating the presence of an Environmental Kuznets Curve (EKC) pattern within the context of Germany. By addressing the issue, which is a complex one with conflicting results, we can talk about how GDP growth affects air pollution. According to certain research, air pollution may rise as a result of economic expansion, especially if these expectations are high [19]. Other research, however, suggests that government initiatives can significantly improve the decoupling between economic expansion and air pollution [20]. Studies have shown that air pollution has a considerable detrimental impact on China's economic growth, further demonstrating the impact of air pollution on economic growth [21]. Additionally, elements including a nation's level of economic development, energy use, and industrial production affect the association between economic growth and air pollution [22,23], provide a summary of the MENA region's air pollution. They divided air contaminants into categories related to health and those related to climate change. They discovered that GHS is the primary pollutant posing a threat to people's health in the MENA region. In term of GCC, several articles have examined the relationship between air pollution and economic growth in the Gulf Cooperation Council (GCC) nations. According to studies, air pollution and economic growth are positively correlated in the GCC countries. [24,25] found that economic growth has a positive effect on CO2 emissions and a negative effect on energy consumption. In return, energy consumption reduces CO2 emissions [26]. [27]. According to the studies, urbanization and the use of clean energy can help in the long run to minimize pollutant emissions and achieve sustainable development [28]. Overall, the research shows that economic development and energy use are significant causes of air pollution in the GCC nations. In Oman, the connection between air pollution and economic growth is contingent upon a multitude of variables. Recent research, such as the study by [29], has revealed intriguing insights. Positive shocks to foreign direct investment inflows, economic growth, and capital investments have been associated with an increase in carbon dioxide emissions, both in the short and long terms. Conversely, it has been observed that adverse shocks to economic development and foreign direct investment inflows can lead to emissions reduction, as supported by [29]. The roles of foreign direct investments, economic growth, and capital investments in decarbonizing the economy of Oman. [29]
[30], findings provide compelling evidence for the presence of an Environmental Kuznets Curve in Oman. This theoretical framework posits that environmental quality may initially decline before ultimately improving as a country progresses economically, as elucidated by researchers such as [27,31]. In light of these findings and with the aim of reducing global carbon dioxide emissions, it is strongly recommended that Oman embraces green economic growth strategies. This approach involves curbing investments that have detrimental environmental consequences while simultaneously rejuvenating the financial sector, as proposed by [32].
2.2. Urbanization and Air Pollution
Urbanization has been found to have a significant impact on air pollution. Studies have shown that as the global population shifts from rural to urban areas, the marginal damage of air pollution emissions in urban areas increases, [33]. The effects of urbanization on air pollution vary across different income levels and countries. Demographic urbanization has a positive effect on PM2.5 concentrations, while spatial urbanization has a negative effect in high-income countries and a positive effect in other countries. Social urbanization presents the opposite trend, [34]. Urban form also plays a role in air pollution, with factors such as population density, aggregation index, and fractal dimension influencing PM2.5 and N2O concentrations. The impact of these factors varies based on city size, elevation, and road network density [35]. Additionally, urban development can alter urban meteorological characteristics and decrease the diffusion capability of pollutants, leading to increased pollutant concentrations [36]. Overall, urbanization and its various components have complex and heterogeneous effects on air pollution, highlighting the need for targeted measures to control pollution and improve air quality [37]. Oman's growing urbanization has contributed to an increase in air pollution. [38]. Local emission sources from transportation, industry, and energy production activities are present in Oman's major industrialized and urban centers, including Sohar, Muscat, Sur, and Salalah. [34. Poor air quality results from situations of stagnation and recirculation in these places, [39]. In addition, [40] discovered greater pollution levels in the urban residential region of Kuwait when comparing the air quality in the two locations: an industrial suburb in Oman, and an urban residential area. This means that Oman's metropolitan regions may likewise be facing high air pollution levels as a result of urbanization. According to [34], creating sustainable urbanization practices is essential for resolving the problems posed by urbanization-related pollution. Last but not least, numerous studies that examined how urbanization affects air quality discovered that it had a favorable indirect effect. Urbanization will rise when individuals relocate from rural to urban regions more frequently. Because of the increased energy use and carbon emissions, the quality of the air will decline. [41,42,43,44,45,46,47,48,49,50,51,52], and others have all studied this advantageous link.
2.3. Energy consumption and Air Pollution
Air pollution is significantly impacted by energy consumption. Numerous studies have demonstrated that increased energy use, especially the use of fossil fuels, results in higher pollution levels and detrimental health effects [53,54]. However, it has been discovered that using renewable energy sources helps to reduce air pollution [55]. Additionally, increasing air quality and reducing harmful impacts on health have been successful with the application of tight laws and clean energy policies [56]. Energy consumption has a significant effect on air pollution in Oman. [57]. The influx of energy-intensive industries without proper planning has led to air pollution becoming a serious public health concern in many developing countries, including Oman,[58]. It is crucial to decrease energy consumption in order to improve air quality, [59]. The use of renewable energy sources has been found to contribute to the reduction of air pollution, [60]. Therefore, it is important for the government to consider the relationship between energy consumption, economic development, and environmental protection when formulating energy and economic policies. By improving energy efficiency and finding a balance between energy, economy, and environmental protection, Oman can work towards solving its air pollution problems.
3. Model Specification and Data
The following models are used to examine how air pollution affects Oman's economic growth:
Model 1:
RGDPcit = α0 + α1 CO2 + α2 N2O + α3 ENGUit + α4URPit +εit………....
After taking the log model1 becomes:
Ln RGDPcit = α0+ α1Ln CO2 + α2 Ln N2O + α3 Ln Ln ENGUit + α4 URPit +εit…………..
Where Economic growth denoted as RGDPc is a dependent variable. Independent variables include carbon dioxide emissions in metrics tons per capita (CO2), Nitrogen dioxide (N2O) “emitted from fossil consumption in kilotons”, Energy use (kg of oil equivalent per capita) denoted by (ENGUit), and Percentage of urban population (% of total population denoted by (URPNit). The term εit is the error term bounded with the classical statistical properties
Model 2:
N2Oit = α0 + α1 RGDPcit + α2 RGDPcit2 + α3 ENGUit + α4 URPit +εit ………………..
After taking the log for both sides model 2 becomes:
LnN2O=α0+α1LnRGDPcit+α2LnRGDPci2+α3LnENGUit+α4LnURPit+εit………....
Where Air Pollution (denoted by N2O) is a dependent variable. Independent variables include Economic growth denoted by RGDPcit, Energy use (kg of oil equivalent per capita) denoted by (ENGUit), and Percentage of urban population (% of total population denoted by (URPit). The term εit is the error term bounded with the classical statistical properties

Table 1.
Variables description and data sources.
| Variable | Definition | Codes of Variable | Source |
| Dependent Variable | Real GDP at constant 2011 national prices (in mil. 2011US$) | RGDPc | PWT 10.0* |
| Independent Variables | CO2 emissions (metric tons per capita) Nitrous oxide emissions (thousand metric tons of CO2 equivalent) | CO2N2O | WDI, 2022WDI, 2022 |
| Control Variables | Urban population (% of the total population) | URBN | WDI, 2022 |
| Energy use (kg of oil equivalent per capita | ENGU | WDI, 2022 |
*Source: The information was taken from Penn World Table, 10.0. The description can be found in the reference: Feenstra, Robert C., Robert Inklaar, and Marcel P. Timmer (2015), "The Next Generation of the Penn World Table" American Economic Review, 105(10), 3150-3182, which is accessible for download at www.ggdc.net/pwt.
4. Results and Discussion
4.1. Descriptive Statistics
Table 1 below lists the descriptive statistics, minimum, maximum, mean, standard deviation (Std. Dev.), and coefficient of variation (CV) for each of these variables. The average ratio of the URBN throughout the years 1990 to 2022 was roughly 75.3%, with a coefficient of variation (CV) of 7.56. According to the CV score, the N2O fluctuated the most
Table 2 presents the correlation matrix. The correlation demonstrates a strong connection between the RGDPC and all the other factors. RGDPC shows a strong negative correlation with URBN and N2O.
4.2. DOLS estimates
To examine the association between RGDPc and climate change variables as well as other control variables, Model (1) is evaluated using the OLS estimation method. The DOLS results show that CO2 and URBN have a positive and significant impact on RGDPc. The OLS results for N2O indicated a detrimental impact on growth. The unexpected finding comes from the energy variable, which indicates any appreciable impact on Oman's growth rate (Table 3)
Model (2)'s primary objective was to determine whether Oman had an EKC between 1990 and 2022. The EKC hypothesis is tested via the estimate framework using economic and environmental indicators. The finding in Table 4 supports the EKC hypothesis, which is supported by the presence of a positive sign linked with economic growth and a negative sign connected with its quadratic term.
4.3. Unit Root Test
The outcomes of the model's series stationarity test are presented in Table 5. All series were found to be non-stationary at level according to the unit root (ADF) test, with a p-value greater than 0.05. Specifically, the variables are non-stationary in their level forms if the t-statistics for the ADF test of CO2, N2O, RGDPc, ENGU, and URP are not greater than the critical values at the 1%, 5%, and 10% levels, respectively. All variables were found to be stationary for the first difference with a p-value of less than 0.05, except for URBN and RGDPc which were integrated into order 1, I(1), and order 2, I(2), respectively.
The lag order selection criterion is shown in Table 6. All other criteria—including AIC, HQ, final prediction error (FPE), and sequential likelihood ratio (LR)—required three lags, with the exception of SC. Therefore, in our approach, lag three is considered to be the ideal lag.
4.4. Cointegration test results
4.4.1. Results of Johansen Cointegration test
To determine if LnC02, LnN2O, Ln RGDPc, Ln URP, and Ln ENGU are cointegrated, we conducted the Johansen multivariate Cointegration test. We first selected the optimal lag length using the minimum AIC and SC from the estimate of the unconstrained VAR model for the first differences of the aforementioned variables. We then found that the lag length is one. The Johansen Cointegration test was carried out since all variables are integrated in the same order, I (1) and I (2), and the results are presented in Table 7. The outcome revealed that there are three cointegration equations at the 5% significance level, and the trace value surpasses the critical threshold, while the maximum eigenvalue suggests there are only two cointegration equations.
In all of the equations, ECT has both a negative and a positive sign, as seen in Table 8. The ECT in the N2O equation, however, displayed a coefficient of 0.149, indicating that adjustment towards the equilibrium occurs at a rate of 14.9% annually. The ECT, on the other hand, yields a non-significant result for URP and ENGU while yielding a significant result for RGDPc, CO2, and RGDPC2.
4.4.2. Results of Granger-Causality Tests
The causal relationship between the relevant factors used in this study is shown in Table 9. The results of the research demonstrate that most variables have unidirectional causal relationships. This illustrates how these factors are responsible for the significant variations in CO2 and N2O in Oman.
5. Conclusions and policy implications
In conclusion, our study examines the intricate relationship between environmental factors, particularly air pollution, and economic growth in the context of Oman. Through rigorous analysis employing cointegration and causality tests, we shed light on the multifaceted dynamics between these two critical aspects of sustainable development.
This study employed a variety of statistical methods, including OLS, cointegration tests, the Johansen Cointegration test, Granger causality analysis, and error correction modeling, to investigate the complex relationship between air pollution, CO2 emissions, and economic growth in Oman from 1990 to 2022.
Our findings reveal a strong long-term cointegration between the variables. The analysis also shows a statistically significant positive correlation between economic expansion and CO2 emissions, as well as an annual correction of approximately 14.1% in N2O emissions in the short-term. The Granger causality analysis indicates that CO2, N2O, and RGDC emissions have a unidirectional causal relationship.
Our cointegration analysis establishes the existence of a long-term equilibrium between air pollution and economic growth in Oman. This underscores the interconnectedness of the environment and the economy, highlighting the need for a balanced approach to development that considers both factors.
The causality analysis further enriches our understanding of this nexus, demonstrating a dynamic interplay where economic growth has a causal effect on air pollution, indicating that as economic activity increases, so does pollution. This implies that the pursuit of economic growth should be accompanied by a commensurate focus on environmental preservation and sustainable practices to mitigate the detrimental impact on air quality.
Conversely, we also find that air pollution can exert causal effects on economic growth, suggesting that the environmental damage inflicted by pollution can hinder the economic progress of Oman. Thus, it is imperative for the nation to prioritize environmental protection measures that reduce pollution levels, such as transitioning to cleaner energy sources and implementing stricter regulations.
Our study highlights the need for a comprehensive policy framework in Oman that reconciles environmental conservation with economic growth. This can entail investments in renewable energy, more stringent regulatory measures, and incentives for eco-friendly innovation. Moreover, our research stresses the significance of public awareness and participation in promoting a sustainable society that prioritizes environmental responsibility.
In summary, the interrelationship between air pollution and economic growth in Oman is a complex and dynamic one, with implications for the well-being and prosperity of the nation. Our research underscores the urgency of adopting a holistic and integrated approach that prioritizes environmental sustainability while fostering economic development. It is our hope that these findings will guide policymakers, researchers, and stakeholders in making informed decisions to ensure a cleaner, more prosperous, and sustainable future for Oman.
Acknowledgments
I would like to extend my sincere appreciation to all attendees of the Sultan Qaboos University- organized International Conference on Air Pollution and Climate Change (held on 16–19 January 2023), for their thoughtful feedback and engaging discussions on an earlier version of the paper. Additionally, I would like to extend my gratitude to the Sustainability Journal editorial board for their diligent efforts.
Conflicts of Interest
The author declares no conflicts of interest regarding the publication of this paper.
References
- World Bank. World development indicators. Washington DC, USA: The World Bank; 2022. Available from: http://data.worldbank.org/data-catalog/.
- Fiore, A.M.; Naik, V.; Leibensperger, E.M. Air Quality and Climate Connections. J. Air Waste Manag. Assoc. 2015, 65, 645–685. [CrossRef]
- Asif, M.,Sharma R.,B , Elneel, A., H., Adow, (2015), An Empirical Investigation of the Relationship between Economic Growth, Urbanization, Energy Consumption, and CO2 Emission in GCC Countries: A Panel Data Analysis, Asian Social Science; Vol. 11, No. 21; 2015.
- Odat, Sana’a Al Jedaih Ma’amoun (2011), Regression Analysis of Air Pollution in Marka Area – Jordan, ABHATH AL-YARMOUK: "Basic Sci. & Eng.", Vol. 20, No. 1, 2011, pp. 53- 65.
- Hussain Ali Bekhet, Ali Matar, Tahira Yasmin (2017), CO2 emissions, energy consumption, economic growth, and financial development in GCC countries: Dynamic simultaneous equation models Renewable and Sustainable Energy Reviews, Volume 70, Pages 117-132. [CrossRef]
- Grossman, G. M., & Krueger, A. B. (1995). Economic growth and the environment. The quarterly journal of economics, 110(2), 353-377.
- Wang X, Yan L, Zhao X (2022) Tackling the ecological footprint in China through energy consumption, economic growth, and CO2 emission: an ARDL approach. Qual Quant 56(2):511–531.
- Boukhelkhal A (2022) Energy use, economic growth and CO2 emissions in Africa: do the environmental Kuznets curve hypothesis exist? New evidence from the heterogeneous panel under cross-sectional dependence. Environ Dev Sustain 24(11):13083–13110. [CrossRef]
- Sufian Abdel-Gadir, (2020), Energy Consumption, CO2 Emissions and Economic Growth Nexus in Oman: Evidence from ARDL Approach to Cointegration and Causality Analysis, European Journal of Social Sciences, pp. 67-78.
- Wang P, Wu WS, Zhu BZ, Wei YM (2013) Examining the impact factors of energy-related CO2 emissions using the STIRPAT model in Guangdong Province. China Appl Energy 106:65–71.
- Elif A, Gul IT, Serap TA (2011) CO2 emissions of Turkish manufacturing industry: a decomposition analysis. Appl Energy 88:2273–2278.
- Acaravci, A., Ozturk, I.,(2010). On the relationship between energy consumption, CO2 emissions and economic growth in Europe. Energy 35 (12), 5412–5420. [CrossRef]
- Al-Mulla U, Lee JYM, Mohammed AH, Sheau-Thing L (2013) Examining the link between energy consumption, carbon dioxide emission and economic growth in Latin America and the Caribbean. Renew Sust Energ Rev 26:42–48.
- Adebanjo SA, Shakiru TH (2022) Dynamic relationship between air pollution and economic growth in Jordan: an empirical analysis. J Environ Sci Econ 1(2):30–43.
- Weimin Z, Sibt-e-Ali M, Tariq M, Dagar V, Khan MK (2022) Globalization toward environmental sustainability and electricity consumption to environmental degradation: does EKC inverted U-shaped hypothesis exist between squared economic growth and CO2 emissions in top globalized economies. Environ Sci Pollut Res 29(40):59974–59984.
- Heidari H, Katircioglu ST, Seidpour L (2015) Economic growth, CO2 emissions and energy consumption in the five ASEAN countries. Int J Electr Power Energy Syst 64:785–791.
- Jaunky VC (2010) The CO2 emissions–income nexus: evidence from rich countries. University of Mauritius, Faculty of Social Studies and Humanities. Department of Economics and Statistics.
- Manuel, A. Z.-M., & Mario, A. F. (2017). An Environmental Kuznets Curve for N2O emissions in Germany: An ARDL Approach. Article in Natural Resources Forum.
- Wang, L., Wang, H., Dong, Z. et al. (2021). The air pollution effect of government economic growth expectations: evidence from China’s cities based on green technology. Environ Sci Pollut Res 28, 27639–27654. [CrossRef]
- Li, J.; Hou, L.; Wang, L.; Tang, L., (2021) Decoupling Analysis between Economic Growth and Air Pollution in Key Regions of Air Pollution Control in China. Sustainability, 13, 6600. [CrossRef]
- Fotourehchi, Z., Ebrahimpour, H., (2019), Happiness, economic growth and air pollution: an empirical investigation, International Journal of Happiness and Development, 2019 Vol.5 No.1. [CrossRef]
- Dong, D.; Xu, B.; Shen, N.; He, Q. (2021). The Adverse Impact of Air Pollution on China’s Economic Growth. Sustainability 2021, 13, 9056. [CrossRef]
- Abbass, R.A.; Kumar, P.; El-Gendy, A (2018). An overview of monitoring and reduction strategies for health and climate change-related emissions in the Middle East and North Africa region. Atmos. Environ. 2018, 175, 33–43. [CrossRef].
- Rami Al-Rawashdeh, Aiman Q. Jaradat, Mohammad Al-Shboul, (2015), Air Pollution and Economic Growth in MENA Countries: Testing EKC Hypothesis, Environmental Research, Engineering and Management 4(70): 54–65, 2029-2139. [CrossRef]
- Yiew, TH., Lee, CY. & Lau, LS. Economic growth in selected G20 countries, (2021).: How do different pollution emissions matter? Environ Dev Sustain 23, 11451–1147. [CrossRef]
- Aljawareen, A, & Saddam,A., (2017). The Impact of GDP, FDI, and Import on Carbon Dioxide Emissions in of GCC Countries: A Panel Data Approach, European Scientific Journal, /SPECIAL/ edition ISSN: 1857 – 7881 (Print) e - ISSN 1857- 7431.
- Aristotelous, K., (2017). A Re-examination of the Empirical Relationship between Economic Growth and Air Pollution, International Journal of Ecology & Development, Volume 32, Issue Number 1.
- Matthew A. Cole, (2000). Trade Liberalization, Economic Growth and the Environment, ISBN: 978 1 84064 176 9, University of Birmingham, UK.
- Hamid I, Alam MS, Murshed M, Jena PK, Sha N, Alam MN. (2022) The roles of foreign direct investments, economic growth, and capital investments in decarbonizing the economy of Oman. Environ Sci Pollut Res Int.;29(15):22122-22138. Epub Nov 15. [CrossRef] [PubMed]
- Khoshnevis Yazdi, S., & Khanalizadeh, B. (2017). Air pollution, economic growth and health care expenditure. Economic research-Ekonomska istraživanja, 30(1), 1181-1190. [CrossRef]
- Fernando Carriazo (2016). Economics and Air Pollution, Chapter in Edited book Air Quality - Measurement and Modeling. InTech. [CrossRef]
- Zhanhong,Y., Hong,L., and Xiao.W., (2018) Study on the Relationship Between Air Pollution and Economic Development, Science Discovery. Volume 6, Issue 1, February, pp. 12-18. [CrossRef]
- H Deng, R Mendelsohn, (2021), The Effect of Urbanization on Air Pollution Damage, Journal of the Association of Environmental and Resource Economists.
- Shaojian Wang, Shaojian Wang, Shuang Gao, Shijie Li, Kuishuang Feng ( 2020), Strategizing the relation between urbanization and air pollution: Empirical evidence from global countries, -Journal of Cleaner Production, Volume 243, 10 January 2020, 118615. [CrossRef]
- Liang, Ze, Feili Wei, Yueyao Wang, Jiao Huang, Hong Jiang, Fuyue Sun, and Shuangcheng Li. (2020). "The Context-Dependent Effect of Urban Form on Air Pollution: A Panel Data Analysis" Remote Sensing 12, no. 11: 1793. [CrossRef]
- Liu, H., Ma, W., Qian, J. et al. Effect of urbanization on the urban meteorology and air pollution in Hangzhou. J Meteorol Res 29, 950–965 (2015). [CrossRef]
- Argun Y. A., Tırınk S., Bayram T. Effect of Urban Factors on Air Pollution of Igdir, (2019), Black Sea Journal of Engineering and Science.; 2(4): 123-130. [CrossRef]
- Deng, H., & Mendelsohn, R. (2021). The effect of urbanization on air pollution damage. Journal of the Association of Environmental and Resource Economists, 8(5), 955-973.
- Yassine Charabi, and Sultan Al-Yahyai, (2011), Integral assessment of air pollution dispersion regimes in the main industrialized and urban areas in Oman, Arabian Journal of Geosciences, (2011) 4:625–634. [CrossRef]
- Sabah A. Abdul-Wahab (2009). Two case studies of air pollution from Oman and Kuwait, International Journal of Environmental Studies, 66:2, 179-191. [CrossRef]
- Shi G, Lu X, Zhang H, Zheng H, Zhang Z, Chen S, ..., Wang S (2022) Air pollutant emissions induced by rural-to-urban migration during China’s urbanization (2005–2015). Environ Sci Ecotechnology 10:100166.
- Li S, Yu Y, Jahangir A, Usman M, Ning Y (2022a) The impact of green investment, technological innovation, and globalization on CO2 emissions: evidence from MINT countries. Front Environ Sci 156. [CrossRef]
- Li X, Lu Z, Hou Y, Zhao G, Zhang L (2022b) The coupling coordination degree between urbanization and air environment in the Beijing (Jing)-Tianjin (Jin)-Hebei (Ji) urban agglomeration. Ecol Ind 137:108787.
- Zhang X, Han L, Wei H, Tan X, Zhou W, Li W, Qian Y (2022) Linking urbanization and air quality together: A review and a perspective on the future sustainable urban development. J Clean Prod 346:130988.
- Zambrano-Monserrate MA, Carvahal-Lara C, Urgiles-Sanchezi R (2018) Is there an inverted u-shaped curve? Empirical analysis of environmental Kuznets curve in Singapore. Asia-Pac J Account Econ 1(2):145–168.
- Nasreen S, Anwar S, Ozturk I (2017) Financial stability, energy consumption and environmental quality: evidence from South Asian Economies. Renew Sustain Energy Rev 67:1105–1122. [CrossRef]
- Rahman MM (2017) Do population density, economic growth, energy use, and exports adversely affect environmental quality in Asian populous countries? Renew Sustain Energy Rev 77:506–514.
- Alam M, Murad W, Noman AH, Ozturk I (2016) Relationships among carbon emissions, economic growth, energy consumption, and population growth: testing environmental Kuznets curve hypothesis for Brazil, China, India, and Indonesia. Ecol Ind 70:476–479. [CrossRef]
- Karakaş A (2016) Yaklaşan Tehlikenin Farkına Varmak: İktisadi Buyume, Nufus ve Cevre Kirliliği İlişkisi. J Selcuk Unıv Soc Sci Vocat Sch 19(41):57–73.
- Bozkurt, S., Savrun, A., Okumus, M., Bilal, Ö., Baykan, H., & Kalender, A. M. (2015). Evaluation of patients applying to the emergency service with complaint of isolated hand injuries. Eurasian Journal of Emergency Medicine, 14(2), 54.
- Ohlan R (2015) The impact of population density, energy consumption, economic growth, and trade openness of CO2 emissions in India. Nat Hazards 79(2):1409–1428.
- Onofowora OA, Owoye O (2014) Bounds testing approach to the analysis of the environment Kuznet curve hypothesis. Energy Econ 44:47–62.
- Xie JY, Suh DH, Joo SK. A,. (2021). Dynamic Analysis of Air Pollution: Implications of Economic Growth and Renewable Energy Consumption. Int J Environ Res Public Health.;18(18):9906. [CrossRef] [PubMed]
- Ai, H., & Tan, X. (2021). A Literature Review of the Effects of Energy on Pollution and Health. Energy RESEARCH LETTERS, 2(4). 10.46557/001c.28135 4. He, P., Liang, J., Qiu, Y. et al. (2020). Increase in domestic electricity consumption from particulate air pollution. Nat Energy 5, 985–995. [CrossRef]
- Neng Shen, N., et al, (2020). Renewable Energy Green Innovation, Fossil Energy Consumption, and Air Pollution—Spatial Empirical Analysis Based on China, sustainability 2020, 12(16), 6397. [CrossRef]
- Li Li, Xuefei Hong, and Jun Wang, (2020), Evaluating the impact of clean energy consumption and factor allocation on China’s air pollution: A spatial econometric approach, Energy, Volume 195. [CrossRef]
- Q Wang, MP Kwan, K Zhou, J Fan, Y Wang, D Zhan, (2019). Impacts of residential energy consumption on the health burden of household air pollution Evidence from 135 countries, Energy policy, Volume 128, May 2019, Pages 284-295.
- Xie, J. Y., Suh, D. H., & Joo, S. K. (2021). A dynamic analysis of air pollution: Implications of economic growth and renewable energy consumption. International journal of environmental research and public health, 18(18), 9906. [CrossRef]
- Agustín Álvarez-Herranz, Daniel Balsalobre-Lorente, Muhammad Shahbaz, José María Cantos Cantos (2017). Energy innovation and renewable energy consumption in the correction of air pollution levels. -Energy Policy, Volume 105, June 2017, Pages 386-397. [CrossRef]
- Alvarez-Herranz, A., Balsalobre-Lorente, D., Shahbaz, M., & Cantos, J. M. (2017). Energy innovation and renewable energy consumption in the correction of air pollution levels. Energy policy, 105, 386-397. [CrossRef]
- P Amoatey, H Omidvarborna, MS Baawain, I Al-Harthy, A Al-Mamun, K Al-Jabri, (2022). Preliminary hazard assessment of air pollution levels in Nizwa, Rusayl and Sur in Oman, Journal of Environmental Engineering and Science 2022, Volume 17 Issue 1, pp. 21-29. [CrossRef]
Table 1.
Summary Statistics for the Model Variables.
| Variables | Mean | Median | Maximum | Minimum | Std. Dev. | CV* |
| Ln RGDPC | 18747.86 | 19189.55 | 21458.39 | 14792.32 | 1740.012 | 9.281123286 |
| Ln CO2 | 12.5148 | 13.0604 | 17.30974 | 6.566793 | 3.623088 | 28.95042669 |
| Ln N2O | 703.4375 | 655 | 1090 | 340 | 265.1671 | 37.69590049 |
| Ln URP | 75.26406 | 72.6835 | 87.044 | 66.102 | 5.698879 | 7.571846377 |
| Ln ENGU | 126.1235 | 122.4913 | 181.8656 | 76.75578 | 39.29334 | 31.15465397 |
Table 2.
Correlation Matrix for the Model Variables.
| Variables | RGDPC | CO2 | N2O | URBN | ENGU |
| Ln RGDPC | 1 | ||||
| Ln CO2 | 0.241857 | 1 | |||
| Ln N2O | -0.096951 | 0.915519 | 1 | ||
| Ln URP | -0.316633 | 0.762638 | 0.94191 | 1 | |
| Ln ENGU | 0.056571 | 0.893628 | 0.89911 | 0.747322 | 1 |
Table 3.
DOLS estimate model (1): Economic growth.
| Dependent Variable: RGDPC | ||||
| Sample: 1990 2021 | ||||
| Included observations: 32 | ||||
| Variable | Coefficient | Std. Error | t-Statistic | Prob. |
| Ln CO2 | 1164.263 | 145.1280 | 8.022319 | 0.0000 |
| Ln N2O | -21.55100 | 1.961402 | -10.98754 | 0.0000 |
| Ln URP | 236.2125 | 11.94890 | 19.76856 | 0.0000 |
| Ln ENGU | 12.30533 | 12.52318 | 0.982604 | 0.3342 |
| R-squared | 0.632001 | Mean dependent var | 18747.86 | |
| Adjusted R-squared | 0.592572 | S.D. dependent var | 1740.012 | |
| S.E. of regression | 1110.651 | Akaike info criterion | 16.97975 | |
| Sum squared resid | 34539276 | Schwarz criterion | 17.16297 | |
| Log likelihood | -267.6760 | Hannan-Quinn criter. | 17.04048 | |
| Durbin-Watson stat | 0.868178 | |||
Table 4.
DOLS estimate of model (2): Air Pollution.
| Dependent Variable: N2O | ||||
| Sample: 1990 2021 | ||||
| Included observations: 32 | ||||
| Variable | Coefficient | Std. Error | t-Statistic | Prob. |
| Ln RGDPC | 0.149294 | 0.020395 | 7.320290 | 0.0000 |
| Ln RGDPC2 | -3.81E-06 | 6.92E-07 | -5.511561 | 0.0000 |
| Ln CO2 | 27.15082 | 5.716932 | 4.749195 | 0.0001 |
| Ln URP | 21.56324 | 2.447204 | 8.811379 | 0.0000 |
| Ln ENGU | 1.490693 | 0.361947 | 4.118538 | 0.0003 |
| R-squared | 0.986968 | Mean dependent var | 703.4375 | |
| S.E. of regression | 32.43592 | Akaike info criterion | 9.939011 | |
| Sum squared resid | 28406.40 | Schwarz criterion | 10.16803 | |
| Log-likelihood | -154.0242 | Hannan-Quinn criter. | 10.01492 | |
| Durbin-Watson stat | 0.875121 | |||
Table 5.
Unit Root Test (ADF) for the Model Variables.
| Variables | LevelCritical Values | First DifferenceCritical Values | ||||||||
| 1% | 5% | 10% | t-values | p-values | 1% | 5% | 10% | t-values | p-values | |
| Ln CO2 | -3.662 | -2.96 | -2.612 | -2.6192 | 0.4791 | -3.670 | -2.964 | -2.621 | -4.88688 | 0.0004* |
| Ln N2O | -3.6617 | -2.960 | -2.6192 | 0.013780 | 0.9529 | -3.6702 | -2.9640 | -2.612 | -4.445660 | 0.0014* |
| Ln RGDPc | -3.6702 | -2.9640 | -2.621 | -0.902244 | 0.7735 | -3.6892 | -2.9719 | -2.6251 | -6.875273 | 0.0000** |
| Ln URP | -3.6892 | -2.9719 | -2.6251 | 2.556510 | 1.0000 | -3.6892 | -2.972 | -2.6251 | -3.048164 | 0.0421** |
| Ln ENRU | -3.6892 | -2.9719 | -2.6251 | -0.822161 | 0.7972 | -3.679 | -2.9678 | -2.6229 | -5.727279 | 0.0001* |
Table 6.
VAR Lag Order Selection Criteria.
| Lag | LogL | LR | FPE | AIC | SC | HQ |
| 0 | 23.02299 | NA | 6.60e-05 | -1.112388 | -0.980428 | -1.066331 |
| 1 | 124.4002 | 180.2262 | 3.91e-07 | -6.244458 | -5.716618* | -6.060227 |
| 2 | 128.8578 | 7.181681 | 5.09e-07 | -5.992102 | -5.068382 | -5.669699 |
| 3 | 145.3521 | 23.82506* | 3.46e-07* | -6.408450* | -5.088851 | -5.947875* |
Note: * indicates lag order selected by the criterion; LR: sequential modified LR test statistic (each test at 5% level); FPE: Final prediction error; AIC: Akaike information criterion; SC: Schwarz information criterion; HQ: Hannan-Quinn information criterion.
Table 7.
Johansen Cointegration Test: E-views 12 Output.
| Hypothesized | Trace | 0.05 | ||
| No. of CE(s) | Eigenvalue | Statistic | Critical Value | Prob.** |
| None * | 0.657911 | 84.88720 | 69.81889 | 0.0020 |
| At most 1 * | 0.512398 | 52.70670 | 47.85613 | 0.0163 |
| At most 2 * | 0.409125 | 31.15902 | 29.79707 | 0.0346 |
| At most 3 | 0.255103 | 15.37452 | 15.49471 | 0.0521 |
| At most 4 * | 0.195855 | 6.539257 | 3.841466 | 0.0105 |
| Trace test indicates 3 cointegrating eqn(s) at the 0.05 level | ||||
| * Denotes rejection of the hypothesis at the 0.05 level | ||||
| **MacKinnon-Haug-Michelis (1999) p-values | ||||
Table 8.
Error Correction Model.
| Error Correction: | D(N2O) | D(CO2) | D(RGDPC) | D(RGDPC2) | D(URP) | D(ENGU) |
| CointEq1 | -0.149294 | -0.008377 | -5.620052 | -215635.7 | 0.001124 | 0.096518 |
| (0.020395) | (0.00216) | (2.11362) | (82262.9) | (0.00092) | (0.06386) | |
| [-7.320290] | [-3.88557] | [-2.65897] | [-2.62130] | [ 1.21631] | [ 1.51144] |
Table 9.
Granger Causality Tests.
| Variables | F-Stat. | p-value | Causality |
| RGDPc → N2 O | 4.647 | 0.0192 | Yes |
| N2O → RGDPc | 3.099 | 0.0628 | No |
| ENGU → CO2 | 16.149 | 0.000 | Yes |
| CO2 → ENGU | 11.583 | 0.0003 | Yes |
| URP → RGDPc | 4.281 | 0.0252 | Yes |
| RGDPc → URP | 4.363 | 0.0237 | Yes |
| URP → CO2 | 0.82434 | 0.4501 | No |
| CO2 → URP | 5.92209 | 0.0078 | Yes |
Disclaimer/Publisher’s Note: The statements, opinions and data contained in all publications are solely those of the individual author(s) and contributor(s) and not of MDPI and/or the editor(s). MDPI and/or the editor(s) disclaim responsibility for any injury to people or property resulting from any ideas, methods, instructions or products referred to in the content. |
© 2023 by the authors. Licensee MDPI, Basel, Switzerland. This article is an open access article distributed under the terms and conditions of the Creative Commons Attribution (CC BY) license (http://creativecommons.org/licenses/by/4.0/).
Copyright: This open access article is published under a Creative Commons CC BY 4.0 license, which permit the free download, distribution, and reuse, provided that the author and preprint are cited in any reuse.


