
Submitted:
22 October 2023
Posted:
23 October 2023
You are already at the latest version
Abstract
The prefabricated ECC/RC combined shear wall structure is an innovative prefabricated composite structure with better seismic performance by using ECC materials with better ductility in the main force and energy consumption regions of the prefabricated reinforced concrete (RC) shear wall structure. The key factors controlling the seismic energy dissipation capacity of this kind of structure are the use regions of ECC in composite coupling beams, use regions of ECC in shear walls, strength of ECC, stirrup ratio of coupling beams, strength of longitudinal reinforcement and so on. The parameters affecting seismic energy consumption are quantified by the finite element analysis method. By comparing and analyzing the load-displacement curves, hysteresis curves, energy dissipation capacity and stiffness degradation of the prefabricated ECC/RC combined shear wall structure specimen under these parameters, it is proposed that the best use regions of ECC is the cast-in-situ zone of the coupling beams with the scope of no more than400 mm at the shear walls’ bottom. The strength grade, the strength grade of longitudinal reinforcement, and the stirrup ratio of coupling beams are suggested design as E40, HRB400 and 0.5%, respectively.
Keywords:
prefabricated ECC/RC combined shear wall
; parameters affecting seismic energy dissipation
; best use regions of ECC
; optimization design
; seismic energy dissipation
1. Introduction
The development of intelligent science and technology has become a major strategy for all countries in the world. With the continuous development of the economy and society, relying on resource consumption, environmental pollution and labor-intensive industries are facing the pressure of transformation and upgrading. For the construction industry, the disadvantages of traditional on-site pouring construction methods include huge energy consumption, low construction efficiency, waste of resources, difficulty in ensuring quality, and environmental pollution. In order to improve these shortcomings of the traditional construction industry, the construction method of prefabricated building industrialization has received more and more attention and has been continuously promoted and applied. The prefabricated construction method is one of the modern ways for the construction industry to achieve design standardization, production factory, construction assembly, and the management mode is informatized and intelligent [1].
The prefabricated structural system are widely used in the area of concrete structure, steel structure and timber structure. The prefabricated concrete structure, which is widely used in residential, school and office buildings, is the main structural system. Prefabricated shear wall structure is mostly widely used prefabricated concrete structure in high-rise buildings due to its lower energy consumption and environmental protection characteristics.
Recently, much research work has been carried out on the mechanical properties, ductility and durability of prefabricated concrete shear wall structures [2,3,4,5]. Their studies have shown that the prefabricated concrete shear wall structure has high lateral stiffness with good energy dissipation capacity, which can be applied in seismic areas. However, the connection between prefabricated components, especially the horizontal connection, plays a particularly important role in seismic performance, which still needs to be focused on.
There are several ways of horizontal connection in precast shear wall, such as grouting sleeve connection, constrained slurry anchor steel bar connection and metal bellows slurry anchor steel bar connection. In China 's specifications, grouting sleeve connection is recommended as the most mature and effective reinforcement connection technology. Whereas, the grouting sleeves used in prefabricated shear wall structure connection would result in some shortcomings in seismic resistance compared with the cast-in-situ shear wall structure. Peng et al. [6] carried out a low-cycle repeated load test study on the grouting sleeves connected prefabricated shear wall specimens. It was found that the stiffness and energy dissipation capacity exhibited worse performance than those of cast-in-situ shear wall specimens. The results show that the stiffness and energy dissipation capacity of prefabricated shear wall specimens are less than those of cast-in-situ shear wall specimens. Brunesi et al. [7,8] conducted an experimental research on the seismic performance of a full-scale two-story lightly reinforced precast concrete wall panel wall structure connected by steel connectors and mortar. The results show that the joints show friction/slip phenomenon, which are the weakest parts in the structures. The research of Qian and Wu et al. [9,10]shows that although similar to cast-in-place structures in terms of mechanical properties, its structural integrity and robustness are weaker because of the lower ductility of the joints. Qian et al. [11]studied the full-scale model of three-story assembled shear wall concrete structure through pseudo-dynamic test, which is connected by mortar sleeves. It is found that the coupling beams of the structure have been seriously damaged. Whereas, the storey drift conforms to the current high-rise building structure design code in China [12]. For the grouted sleeves connected prefabricated shear wall structure, typical earthquake damage is the loss of function of the coupling beams, the destruction of concrete at the foot of the compression side wall, and the yield of the reinforcement on the tension side or sliding out of the concrete in some cases [13,14,15,16].
At present, prefabricated components used in the prefabricated concrete shear wall structure are mainly components that bear vertical loads and enclosure system components, while most of the construction of shear wall members that mainly resist lateral force still adopt the form of cast-in-place. This construction method leads to low prefabrication rate and assembly rate, and the construction is complicated. If the prefabricated concrete shear wall structure wants to be further widely popularized and applied, the key is that its seismic performance needs to be effectively strengthened and guaranteed.
When the structure is designed for seismic resistance, the seismic demand of the structure could be lowered down on the basis of the level of ductility allowed by the structural system. At the same time, special attention should be paid to ensure that crucial parts of the structure can bear the required nonlinear deformation without obvious strength loss [17]. Therefore, the use of high ductility or high damping materials in the key stress and energy dissipation regions can promote the seismic energy dissipation capacity of the structure.
ECC is a high ductility material with similar compressive strength to concrete, but it has excellent tensile strain hardening ability [18]. Moreover, it has greater damping and stronger energy dissipation capacity [19], which can effectively consume the energy input into the structure. Its tensile strain is about 3 ~ 7 % [20,21,22], and dense cracks with a spacing of only 3 ~ 6 mm are formed after cracking [23,24,25]. In addition, the resistance in shear bearing and shear deformation of ECC are significantly better than concrete [26]. ECC exhibits good crack width control, deformation ability, self-healing ability and high damping characteristics in beams, plates, columns and other components [27,28,29,30], making it an ideal choice for seismic materials.
Zhang et al. [31] studied the shear strength and seismic resistance of ECC coupling beams, and found that ECC coupling beams exhibited excellent shear and seismic resistance. Suryanto et al. [32] investigated the earthquake resistance of external ECC beam-column joints, and found that the earthquake resistance of joints using ECC was better than that of joints without ECC. The earthquake resistance of RC frames and assembled monolithic ECC/RC composite frames were investigated by Cai et al. [33] by combining test and simulation calculations. Compared with the RC frame, the ductility, stiffness and energy dissipation capacity of the ECC/RC composite frame are significantly improved. Through the shaking table test of ECC/RC composite frames, Khan et al. [34,35] found that ECC beam-column joints without shear reinforcement still have better shear resistance than the code-specified value. Ye et al. [36] conducted a low cyclic loading experiment on RECC-coupled shear walls. Compared with RC coupled shear wall, RECC coupled shear wall has better seismic performance.
Our research group studied the seismic resistance of the prefabricated shear wall structure using ECC in the cast-in-situ areas of the composite coupling beams through low cyclic loading test [37]. Compared with the prefabricated shear wall specimen without ECC materials, the seismic energy dissipation capacity of the specimen using ECC materials in the cast-in-situ connection areas is improved. Then, on the basis of experimental research, the principle for stress and energy dissipation under low cyclic loading was studied by finite element analysis [38]. This study exhibited the failure mechanism and internal force distribution of the prefabricated ECC/RC shear walls. However, up to now, no experts or scholars have quantitatively analyzed the factors affecting the seismic energy consumption of the prefabricated ECC/RC shear wall structures.
It is essential to quantitatively analyze the elements affecting the seismic energy dissipation of the prefabricated ECC/RC composite shear wall structure for the wider application. Based on our previous research on the stress and energy dissipation mechanism, this research quantitatively studies the influence of various factors on seismic energy dissipation under low cyclic loading by finite element analysis method, and puts forward optimization design suggestions accordingly.
2. Methods of Analysis
The prefabricated ECC/RC combined shear wall structure is an innovative prefabricated composite structure with better seismic performance by using ECC materials with better ductility in the main force and energy consumption parts of the prefabricated reinforced concrete (RC) shear wall structure. In the research we did earlier, the stress evolution and failure mechanism of the prefabricated ECC/RC combined shear wall under low cyclic loading were numerically investigated [38].And the theoretical analysis method is verified by the experimental results. According to our previous research on the stress evolution and energy dissipation, the key parameters affecting the seismic energy dissipation capacity of this kind of structure are the use regions of ECC in composite coupling beams, use regions of ECC in shear walls, strength of ECC, stirrup ratio of coupling beams, strength of longitudinal reinforcement and so on.
In order to quantitatively analyze the influence of these factors on the seismic energy dissipation indexes such as load-displacement curves, hysteresis curves, energy dissipation capacity and stiffness reduction of the structure, we select a standard example and change different parameters on this basis. The effects of the parameters on the seismic energy dissipation are analyzed in detail.
The size of the standard example is consistent with the 1/2-scale two-story spatial structure specimen of the prefabricated ECC/RC combined shear wall studied in the previous study [38]. In the standard example, the type of longitudinal reinforcement is HRB400, the type of horizontal reinforcement is HRB335, the type of coupling beam and constrained edge member reinforcement is HRB335, the type of concrete is C40, the type of ECC is E40 (the standard compressive strength of cube is 40MPa). The axial compression ratio, the diameter of coupling beam stirrup, and the spacing of coupling beam stirrup are set as 0.24, 6mm and 50mm, respectively. In order to compare conveniently, the strength representative values of steel bars, concrete and ECC materials in this paper use the standard values uniformly, and the constitutive relationship of concrete and ECC is consistent with that of literature 38.
3. Quantitative Analysis of Influence Factors
3.1. Use Regions of ECC in Composite Coupling Beams
3.1.1. Selection of Parameters
Compared to concrete, ECC is more complex and costly, and the use of full ECC coupling beams will lead to higher costs. If ECC is only used in cast-in-place areas in coupling beams, how resistant to seismic energy consumption is? It is necessary to compare and analyze its seismic energy dissipation capacity with full ECC and concrete coupling beams. Therefore, we select concrete coupling beams, ECC/RC coupling beams and ECC coupling beams for comparative analysis. The specific parameters are presented in Table 1 with other parameters unchanged.

Table 1.
The variation parameters of the use regions of ECC in the coupling beams.
| Classification of specimens | Application regions of ECC in coupling beams | Stirrup ratio of coupling beams | Type of longitudinal reinforcement | Type of ECC | Type of concrete |
|---|---|---|---|---|---|
| Structure1-1 | None (Concrete coupling beam ) | 1.13% | HRB400 | E40 | C40 |
| Structure1-2 | Cast-in-place areas (ECC/RC coupling beams) | ||||
| Structure1-3 | Full ECC(ECC coupling beams) |
3.1.2. Load-displacement Curves under Unidirectional Pushover
Figure 1 exhibits the load-displacement curves of the prefabricated ECC/RC composite coupled shear wall specimen under unidirectional pushover when ECC is applied in different parts. Both the yield and peak loads of structures 1-2 and 1-3 are significantly higher than those of structures 1-1, indicating that the use of ECC coupling beams or ECC/RC coupling beams could increase the bearing capacity. The load-displacement curve of structure 1-2 is very close to that of structure 1-3, indicating that the use of ECC materials only within the cast-in-situ layer of the coupling beams can play a good role in the mechanical properties.
3.1.3. Load-displacement Hysteresis Curves under Low Cyclic Loading
Figure 2 shows the load-displacement hysteresis curves of the structural specimen under low cyclic loading when ECC is applied in different regions of composite coupling beams. Figure 2a–c reveal that the load-displacement hysteresis curve of the structure is a composite shape of inverse S and arch. The pinching effect of structure1-1 is the most obvious, and the pinching effect of structure1-2 and structure1-3 is smaller.
3.1.4. Energy Dissipation Capacity
The energy dissipation capacity of a structure under low cyclic loading can be measured by the area surrounded by the hysteresis loop, represented by the energy dissipation value E. The approximate integral method is utilized to calculate the single-cycle energy consumption value of the specimen within a hysteresis loop. On this basis, the energy dissipation capacity of the specimen is preliminarily evaluated by summing up the energy dissipation value sequentially. The calculation of the energy dissipation value starts after the specimen yields, because the energy dissipation before the specimen yields is very small and can be ignored. Table 2 presented the single cycle and cumulative energy dissipation values of the specimen with ECC applied in different regions of the composite coupling beams. with Δ indicating the yield displacement.
Table 1.
Single cycle/cumulative energy dissipation of structural specimens (J).
| Displacement Loading Level | Number of Cycles | Structure1-1 | Structure1-2 | Structure1-3 | |||
|---|---|---|---|---|---|---|---|
| Single Cycle | Cumulative | Single Cycle | Cumulative | Single Cycle | Cumulative | ||
| 1Δ | 1 | 918.5 | 918.5 | 1186.2 | 1186.2 | 1287.7 | 1287.7 |
| 2 | 555.6 | 1474.1 | 608.7 | 1794.9 | 658.6 | 1946.3 | |
| 3 | 263.7 | 1737.8 | 220.6 | 2015.5 | 237.5 | 2183.8 | |
| 2Δ | 1 | 6521.6 | 8259.4 | 7417.9 | 9433.4 | 8062.9 | 10246.7 |
| 2 | 4307.9 | 12567.3 | 5292.6 | 14726 | 5752.8 | 15999.5 | |
| 3 | 4067.5 | 16634.8 | 5050.2 | 19776.2 | 5489.4 | 21488.9 | |
| 3Δ | 1 | 12299.2 | 28934 | 17250.3 | 37026.5 | 18750.3 | 40239.2 |
| 2 | 12178.7 | 41021.9 | 14711.9 | 51738.4 | 15991.2 | 56230.4 | |
| 3 | 12087.9 | 53200.6 | 12974.0 | 64712.4 | 14102.2 | 70332.6 | |
| 4Δ | 1 | 21063.8 | 74264.4 | 21897.7 | 86610.1 | 23801.8 | 94134.4 |
| 2 | 18255.7 | 92520.1 | 19782.7 | 106392.8 | 21502.9 | 115155.6 | |
| 3 | 16788.5 | 109308.6 | 19339.5 | 125732.3 | 21021.2 | 136658.5 | |
| 5Δ | 1 | 25502.7 | 134811.3 | 28540.1 | 154272.4 | 31021.9 | 167680.4 |
| 2 | 22941.6 | 157752.9 | 27119.2 | 181391.6 | 29477.4 | 197157.8 | |
| 3 | 21861.5 | 179614.4 | 26669.4 | 208061 | 28988.5 | 226146.3 | |
| 6Δ | 1 | 30998.5 | 210612.9 | 37044.6 | 244032.7 | 40265.9 | 266412.2 |
| 2 | 29796.7 | 240409.6 | 35971.7 | 281077.3 | 39099.7 | 305511.9 | |
| 3 | 28689.7 | 269099.3 | 35280.9 | 316358.2 | 38348.8 | 343860.7 | |
In Table 1, both the single cycle and the cumulative energy consumption value, Structure1-3 > structure1-2 > structure1-1, indicating that with the increase of ECC usage in the coupling beams, the energy consumption capacity increases. However, the rate of increase of structure1-2 compared with structure1-1 is much larger than that of structure1-3 compared with structure1-2. For example, in the first cycle of 1Δ, the single cycle energy consumption of structure1-1, structure1-2 and structure1-3 are 918.5 J, 1186.2 J and 1287.7 J, respectively. Structure1-2 is 29.1 % higher than structure1-1, while structure1-3 is only 8.6 % higher than structure1-2. After the 6Δ loading, the cumulative energy consumption of structure1-1, structure1-2 and structure1-3 are 269099.3J, 316358.2J and 343860.7J, respectively. Structure1-2 is 17.6 % higher thanstructure1-1, but structure1-3 is only 8.7 % higher than structure1-2.
From the above data comparison, it can be concluded that even if ECC materials are only used in the cast-in-situ layer of coupling beams, it could improve the seismic energy dissipation performance.
For further evaluating the energy dissipation performance, the energy degradation coefficient [39] Vi is introduced for comparison. The energy degradation coefficient Vi represents the cumulative damage degree and the damage development rate of the structure during low cyclic loading. It is calculated by the following formula:
In the formula, Vi—Energy degradation coefficient of the i-cycle loading; Ei—Single-cycle hysteresis energy dissipation of structural specimen under the ith loading cycle; E1—Single-cycle hysteretic energy dissipation of structural specimen under the first loading cycle.
Figure 3 is the one-cycle energy degradation coefficient curve of three structural specimens. The energy degradation coefficient of the three structural specimens in the early stage of yield are small and increase with the increasing loading displacement, indicating that the energy degradation of the three specimens in the early stage of yield are more serious and decreased with higher loading displacement. The energy degradation coefficient of Structure 1-1 fluctuates greatly after peak loading, and Structure 1-2 and Structure 1-3 are similar and stable, indicating that the application of ECC in the coupling beams can make the energy dissipation performance of the structural specimen more stable. The energy dissipation capacity of ECC/RC composite coupling beams and full ECC coupling beams is similar. Moreover, in the case of the same loading displacement, the energy degradation coefficient when loading cycle 3 is less than the energy degradation coefficient at cycle 2. It shows that as the number of cycles increases, the energy degradation becomes more and more serious.
As the loading continues, the destruction of the structural specimen accumulates when the input energy is continuely consumed by the structural specimens. In addition to the above-mentioned single-cycle energy degradation coefficient, Chinese seismic code [40] also recommends using the energy dissipation coefficient e to measure the energy dissipation performance of the structure.The formula for calculating e is as follows:
In the above calculation formula, —Sum of the area enclosed by the hysteresis curve; —Sum of the areas of the triangle AOB and COD, where Figure 4 schematically describes this kind of calculation.
Taking the displacement and load values of each structural specimen at the yield point and peak point under low cyclic loading, the energy dissipation coefficient is calculated, as shown in Table 2. It can be seen from the table that the energy dissipation coefficient at the peak point is greater than the energy dissipation coefficient at the yield point, indicating that the energy dissipation capacity of the structural specimen is enhanced after yielding.Comparing the energy dissipation coefficients of the three structural specimens, it can be seen that Structure1-3 > Structure1-2 > Structure1-1, indicating that the energy consumption of the structural specimen increases with the increase of ECC content in the coupling beams. However, the energy dissipation coefficients of Structure1-3 and Structure1-2 are similar, indicating that the application of ECC materials only in the laminated layers can achieve similar energy dissipation effect as the application of ECC in the full coupling beams.
3.1.5. Rigidity Degeneration
Figure 5 is the stiffness-displacement curves of three structural specimens when ECC is applied to various regions of the coupling beams. From Figure 5, we can see that the stiffness of the structural specimen gradually decreases with displacement increasing. The stiffness of Structure1-2 and Structure1-3 is larger than that of Structure1-1 before the loading displacement is 3Δ. At this stage, the load on the structural specimen has not yet peaked. It shows that the ECC applied to the coupling beams play a good role in delaying the stiffness failure at this stage. After reaching 3Δ in displacement, the coupling beams have been seriously damaged, and the structural stiffness degradation rate is accelerated. In the final stage, the remaining effective stiffness of the three structural specimens is already small with the stiffness degradation coefficient similar to each other.
3.2. Use Regions of ECC in Shear Walls
3.2.1. Selection of Parameters
The bottom areas of the shear walls tend to be the most damaged when subjected to seismic action to form plastic hinges. Therefore, the design considers the different use ranges of ECC at the bottom of the shear walls in order to find the best ranges, where Table 3 represents these parameters.
3.2.2. Load-displacement Curves under Unidirectional Pushover
The load-displacement curves of the five structural specimens under unidirectional pushover with ECC used in different regions of the shear walls are shown in Figure 6.With the increase of ECC usage in the shear walls, the yield displacements of the five structural specimens are 6.1mm, 6.4mm, 6.6mm, 6.9mm and 7.0mm, respectively, and the corresponding yield loads are 666 kN, 682 kN, 685 kN, 686 kN and 687 kN respectively. It can be seen that the greater the amount of ECC at the bottom of the shear wall, the greater the yield load and yield displacement of the structural specimen. After the structural specimen reaches the plastic stage, the stiffness degradation of the structural specimen slows down with the increasing use of ECC.The main reason for this phenomenon is the good ductility and shear deformation resistance of ECC, which delays the degradation of the stiffness of the structural specimen.The peak loads of the five structural specimens Structure2-1~ Structure2-5 are 964 kN, 983 kN, 988 kN, 997 kN and 1010 kN, and the corresponding peak displacements are 21 mm, 24 mm, 26 mm, 28 mm and 30 mm respectively. With the increase of ECC dosage, the bearing capacity and corresponding peak displacement of the structural specimen increase.The reason is that the tensile strength,shear strength, shear deformation resistance and tensile deformation resistance of ECC are larger than those of concrete. Furthermore, the descending section of the curve becomes more and more gentle as the amount of ECC in the shear wall increases due to the high damping and ductility of ECC.
3.2.3. Load-displacement Hysteresis Curves under Low Cyclic Loading
Figure 7 shows the load-displacement hysteresis curves of the five structural specimens under low cyclic loading with ECC used in various regions of the shear walls. Figure 7a–e is the curves of structure 2-1 ~ structure 2-5, respectively, the corresponding ECC height at the bottom is 0mm~800mm. It can be seen from the figures that with the increase of ECC height, the load-displacement hysteresis curve of the specimen tends to be fuller.
3.2.4. Energy Dissipation Capacity
The single cycle/cumulative energy dissipation of the five structural specimens are shown in Table 4. In the first cycle of loading, the magnitude of the single-cycle energy consumption values in structure 2-1 are higher than those in structure 2-2, which can be seen from Table 4. At this stage, the structural specimen has just yielded, and the yield delay effect is not fully reflected due to the small amounts of ECC. The main role in energy dissipation is still the stiffness of the structural specimen. The stiffness of the concrete is greater than that of ECC, resulting in greater energy dissipation capacity in structural specimen 1 than specimen 2. With the application of more ECC (400 mm), there is an obvious rise in the yield, of which the contribution is greater than that of concrete stiffness, so structure 2-2 < structure 2-3. When the use of ECC continues to increase up to 600~800 mm at the shear wall’s bottom, the increase of yield displacement of the structural specimen contributes less than stiffness reduction to energy consumption. Therefore, the magnitude relationship of the energy consumption value becomes Structure2-3 > Structure2-4 > Structure2-5. However, with the continuous displacement loading, that is, after loading to 2 times the yield displacement, the magnitude relationship between the single-cycle energy consumption value and the cumulative energy consumption value is structure 2-5> structure 2-4> structure 2-3> structure 2-2 > structure 2-1. It shows that with the increase of ECC usage in shear walls (0~800mm), the energy consumption capacity increases accordingly.
Table 4 shows that the cumulative energy consumption values of Structure 2-1~Structure 2-5 are 339460.5 J, 377573.7 J, 412205.4 J, 424149.1 J and 429266.4 J, respectively when the structural specimen undergoes the third cycle of the 6Δ loading displacement. Compared with Structure2-1, the cumulative energy consumption of structure2-2 ~structure2-5 increased by 11.2 %, 21.4 %, 24.9 % and 26.5 %, respectively. When ECC material is used at the bottom 400 mm of the shear wall,, the cumulative energy consumption value increases by more than 20% compared to the structural specimen without ECC. With the continuous increase of ECC usage at the bottom of the shear wall, the cumulative energy consumption continues to increase, but the increase rate is decreasing. For example, the energy consumption of structure 2-3 is 9.2% higher than that of structure 2-2, while structure 2-2 is only 2.9% higher than structure 2-1.
Figure 8 is the single-cycle energy degradation coefficient curves of the five structural specimens. In the initial stage of structural specimen yield, the single-cycle energy degradation coefficients V1 and V2 of the five structural specimens are small, which can be seen from the figure, indicating that the energy degradation is serious at this time. As the displacement loading continues, the single-cycle energy degradation coefficients V1 and V2 increase correspondingly and tend to be stable. Before reaching the peak load (displacement reaching 3Δ), the single-cycle energy degradation coefficient of the five structural specimens is as follows: structure 2-1 is the smallest, followed by structure 2-2 and structure 2-3, structure 2-4 and structure 2-5 are the largest. It is shown that with the increase of ECC usage in the shear wall, the energy degradation of the structural specimen slowed down.
However, after the load exceeds the peak, the energy degradation coefficient tends to be consistent for each structural specimen. The reason is that the damage to ECC and concrete is more serious in the later stage of loading, and the energy consumption is mainly completed by steel bars. In addition, the energy degradation coefficient V2 at the third cycle loading is smaller than the energy degradation coefficient V1 during the second cycle loading under either bit shift loading, indicating that the energy degradation is correspondingly more severe as the number of cycles increases.
Table 5 lists the energy dissipation coefficients e at the yield and peak points of the five structural specimens. For comparison, the e at the peak point is greater than that at the yield point, revealing the improvement in energy dissipation capacity after yield. The largest e of both the yield point and peak point are structure 2-3. The e-magnitude relationship of the five structural specimens at the peak point is structure 2-3> structure 2-5> structure 2-4> structure 2-2 > structure 2-1.
When the ECC is used at 400 mm height at the bottom of the shear wall, the energy dissipation performance of the structural specimen is optimal. Since ECC has high ductility, damping and strong resistance to tensile, compressive and shear deformation with lower stiffness than concrete, the energy dissipation performance is controlled by the deformation capacity, stiffness and bearing capacity.
3.2.5. Rigidity Degeneration
Figure 9 is the stiffness-displacement curves of the five structural specimens. From Figure 9, it can be seen that the initial stiffness is structure2-1 > structure2-2 > structure2-3 >structure2-4 > structure2-5.The main reason is that the damage degree of the structural specimen is not serious at this stage, and the stiffness of ECC is smaller than that of concrete. As the displacement loading continues, the stiffness of the structural specimen decreases accordingly. Before the displacement loading reaches 3Δ(before reaching the peak load), the decrease rate of stiffness is structure2-1 > structure2-2 > structure2-3 > structure2-4 > structure2-5, indicating that the more ECC would result in slower the stiffness degradation of the structural specimen. After reaching 3Δ in displacement, the concrete and ECC damage is serious, and the stiffness of the structural specimens is mainly borne by the steel bars, so the stiffness degradation of the five structural specimens is similar.
3.3. Strength of ECC
3.3.1. Selection of Parameters
From the previous parameter analysis, it can be seen that when ECCs are used in the cast-in-situ areas of the composite coupling beams and 400mm height within the shear wall bottom, the best seismic performance can be achieved. In the analysis of other parameters, the use regions of ECC adopts the above range. The variation parameters of the ECC strength are shown in Table 6. In the table, E40, E60 and E80 represent the standard values of compressive strength of ECC are 40 MPa, 60 MPa and 80 MPa, respectively. Other unspecified parameters are the same.
3.3.2. Load-displacement Curves under Unidirectional Pushover
The load-displacement curves of the three structural specimens with different ECC strengths under unidirectional pushover are shown in Figure 10. The yield load of structure3-1 is 685 kN, the yield displacement is 6.6mm, the peak load is 988 kN, and the peak displacement is 26 mm. The yield load of structure3-2 is 696 kN, the yield displacement is 6.5 mm, the peak load is 1061 kN, and the peak displacement is 27 mm.The yield load of structure3-3 is 712 kN, the yield displacement is 6.5 mm, the peak load is 1086 kN, and the peak displacement is 27 mm. The yield displacement of structure3-1 is the largest, and the yield displacement of structure3-2 and structure3-3 is smaller and equal. As the strength of ECC increases, its ductility decreases, and the coordinated deformation ability with steel bars decreases, so the steel bars yield in advance. The structural specimens with the largest yield and peak loads are Structure3-3, followed by structure3-2, and structure3-1 is the smallest. With higher ECC strength, the yield load and peak load of the specimen increase. However, the increase rate is smaller. For example, the peak load of structure3-2 is 7.4 % larger than that of structure3-1, but the peak load of structure3-3 is only 2.4 % larger than that of structure3-2.
3.3.3. Load-displacement Hysteresis Curves under Low Cyclic Loading
Figure 11 presents the load-displacement hysteresis curves of the three structural specimens with different ECC strengths under low cyclic loading. The hysteresis curves of the three structural specimens are similar, and the change of ECC strength has little effect on the curves.
3.3.4. Energy Dissipation Capacity
Under low cyclic loading, the one-cycle/cumulative energy dissipation values of the three structural specimens with different ECC strengths are presented in Table 7.
According to Table 7, when the displacement loading level is 1 times the yield displacement, the one-cycle/cumulative energy dissipation values are structure3-3 > structure3-2 > structure3-1. The main reason is that the elastic modulus of ECC increases with the increase of ECC strength, resulting in greater stiffness of the entire structural specimen, so the corresponding energy consumption value is larger. However, as the displacement loading continues, the one-cycle/cumulative energy dissipation values of structure3-1 are the largest, and structure3-2 and structure3-3 are small and similar. It is proved that increasing the strength of ECC is not conducive to the energy consumption of the specimen.
Figure 12 is the single-cycle energy degradation coefficient curves of 3 specimens. The energy degradation coefficients of the three specimens are small in the early stage, and would rise with higher displacement loading level, indicating that the energy degradation of the three specimens is more serious in the initial stage of structural specimen yield, and decreases with the increase of the displacement loading level. The single-cycle energy degradation coefficient of the three specimens structure3-1 > structure3-2 > structure3-3, indicating that the energy degradation of Structure3-1 is the slowest, followed by Structure3-2, and Structure3-3 is the fastest, which once again proves that improving the strength of ECC is not conducive to the energy consumption of the specimens.
Table 8 shows the energy dissipation coefficients at the yield and peak points of the three structural specimens are shown in. The energy dissipation coefficient of the same structural specimen at the peak point exhibited larger value than that at the yield point, meaning that the energy dissipation capacity of the structural specimen is significantly improved after yielding. The structural specimens with the largest energy dissipation coefficients at the yield point and peak point is sructure3-1, indicating that the low-strength ECC has better ductility and is more conducive to energy consumption. The energy dissipation coefficient at the yield point is structure3-3 > structure3-2. The main reason is that the stiffness of structure3-3 is larger than that of structure3-2, while the increase of yield load is relatively small, and the contribution of stiffness to energy dissipation is greater. However, the energy dissipation coefficients of the two are equal at the peak load, indicating that the contribution of post-yield stiffness to energy dissipation is reduced.
3.3.5. Rigidity Degeneration
The stiffness-displacement curves of the three structural specimens are displayed in Figure 13. The stiffness of the structural specimen decreases with the rise in displacement. The speed of stiffness degradation of Structure3-1 is significantly slower than that of structure3-2 and structure3-3, indicating that improving the strength of ECC is not conducive to earthquake resistance.
3.4. Stirrup Ratio of Coupling Beams
3.4.1. Selection of Parameters
In this section, the stirrup ratio of the coupling beam is 0.50 %, 1.13 % and 2.01 % respectively (corresponding to the diameters of 4mm, 6mm and 8mm respectively ), and the parameters are calculated and compared. The parameter configuration of the structural specimens is shown in Table 9.
3.4.2. Load-displacement Curve under Unidirectional Pushover
Figure 14 shows the load-displacement curves of the three structural specimens with different stirrup ratios of coupling beams under unidirectional pushover.The load-displacement curves of the three structural specimens basically coincide. The stirrup ratio of the coupling beam affects slightly in the load-displacement curve of the specimen in the range of 0.50 % ~ 2.01 %.
3.4.3. Load-displacement Hysteresis Curves under Low Cyclic Loading
Figure 15 shows the load-displacement hysteresis curves of the three structural specimens with different stirrup ratios of coupling beams under low cyclic loading. Within the parameter range studied in this paper, the load-displacement hysteresis curves of the three structural specimens are basically the same.
3.4.4. Energy Dissipation Capacity
Table 10 shows the energy dissipation values of the three structural specimens with different stirrup ratios of coupling beams. As can be seen from Table 10, both the single-cycle energy consumption values and cumulative energy consumption values of the three structural specimens are similar. For example, the one-cycle energy consumption values of structure4-1, structure4-2 and structure4-3 in the first cycle of 6Δ are 45081.8J, 45537.2J and 46220.3J, respectively. Structure4-2 is 1.0 % higher than structure4-1, and structure4-3 is 1.5 % higher than structure4-2. After the 6Δ loading, the cumulative energy consumption values of structure4-1, structure4-2 and structure4-3 are 410289 J, 414415.9 J and 420625.3 J, respectively.Structure4-2 is 1.0 % higher than structure4-1, and structure4-3 is 1.5 % higher than structure4-2. Therefore, the coupling beam stirrup ratio of 0.50 % is the best configuration, in the case of only considering energy consumption.
Figure 16 is the single-cycle energy degradation coefficient curves of the three structural specimens. The energy degradation coefficient of the three structural specimens is basically the same, and the corresponding energy consumption capacity is basically the same. It is further confirmed that the coupling beam stirrup ratio of 0.50 % is the best configuration because of the lowest cost.
The energy dissipation coefficient is calculated by taking the displacement and load values of each structural specimen at the yield point and peak point under low cyclic load, as shown in Table 11. According to the table, the energy dissipation coefficients of the three structural specimens at both the yield point and peak point are the same or similar, indicating the similar energy dissipation capacity of the three structural specimens. It is once again proved that the stirrup ratio of the coupling beams has little effect on the energy consumption of the specimen. Within the parameter range of this paper, 0.50 % is the best stirrup ratio of the coupling beams.
3.4.5. Rigidity Degeneration
Figure 17 is the stiffness-displacement curves of the three structural specimens. As the loading displacement increases, the stiffness of the structural specimen is constantly reduced. The stiffness degradation of the three structural specimens is basically the same, which once again shows that the influence of stirrup ratio of the coupling beams on the stiffness of the structural specimen is minimal.
3.5. Strength of Longitudinal Reinforcement
3.5.1. Selection of Parameters
The use range of ECC is consistent with that of the 3.4 section. The types of longitudinal reinforcement are HRB335, HRB400 and HRB500. The parameter configuration of the structural specimens is shown in Table 12.
3.5.2. Load-displacement Curves under Unidirectional Pushover
Figure 18 shows the load-displacement curves of the structural specimens with different longitudinal reinforcement strengths under unidirectional pushover. As the loading continue rising, the load-displacement curves of the structural specimens show obvious elastoplastic changes.The yield load of structure5-1 is 591 kN, the yield displacement is 6.3 mm, the peak load is 867 kN, and the peak displacement corresponding to the peak load is 22.5 mm. The yield load of structure5-2 is 685 kN, the yield displacement is 6.6 mm, the peak load is 1003 kN, and the peak displacement is 23.8 mm.The yield load of structure5-3 is 692 kN, the yield displacement is 6.8 mm, the peak load is 1160 kN, and the peak displacement is 20.0 mm.With the increase of longitudinal steel strength, the yield load, yield displacement and peak load of the corresponding structural specimens all increased, but the increase amplitude decreases.The peak displacement of HRB500 high strength steel bar is the smallest, and the plastic stage from yield to peak is the shortest.
3.5.3. Load-displacement Hysteresis Curves under Low Cyclic Loading
Figure 19 shows the load-displacement hysteresis curves of the three structural specimens with different longitudinal reinforcement strengths under low cyclic loading. As the strength of the longitudinal reinforcement increases, both the yield load and peak load of the structural specimens increase, and the hysteresis loop becomes more and more full.
3.5.4. Energy Dissipation Capacity
The energy dissipation values of the structural specimens with different longitudinal reinforcement strengths are shown in Table 13. Both the single-cycle energy consumption value and cumulative energy consumption value, structure5-3 > structure5-2 > structure5-1, indicating that the energy dissipation capacity of the specimen increases with the increase of the longitudinal reinforcement strength. For example, the one-cycle energy consumption values of structure5-1, structure5-2 and structure5-3 in the first cycle of 6Δ are 41156.9J, 47613.3J and 55227.4J, respectively. Structure5-2 is 15.6 % higher than structure5-1, and structure5-3 is 15.9 % higher than structure5-2. After the 6Δ loading, the cumulative energy consumption values of structure5-1, structure5-2 and structure5-3 are 358262.1J, 414415.9J and 480647.9J, respectively.Structure5-2 is 15.7 % higher than structure5-1, and structure5-3 is 16.0 % higher than structure5-2.
Figure 20 is the single-cycle energy degradation coefficient curves of three structural specimens. When the structural specimen yield at the initial stage, the energy degradation coefficients of the three structural specimens are small, which continued to increase with the increase of loading displacement, and tend to stabilize when the loading displacement reached 3Δ. This trend also shows that the energy degradation of the three structural specimens in the initial stage of yield is severe, and it decreases with the increase of loading displacement. After exceeding the peak load, the three structural specimens still have good energy consumption capacity. In addition, the energy degradation coefficient V2 at the third cycle loading is smaller than the energy degradation coefficient V1 at the second cycle loading at the same loading level, indicating that the energy degradation becomes more and more serious with the increase of the number of cycles. Comparing the energy degradation coefficients of the three structural specimens, it is found that structure5-3 has the smallest energy degradation coefficient, indicating that the energy degradation of high-strength steel bars is the fastest under cyclic loading.
The energy dissipation coefficients of the three structural specimens with different longitudinal reinforcement strengths are shown in Table 14. The energy dissipation coefficient at the peak point is higher than the yield point for the same structural specimen, revealing the significantly improvement after yielding. The structural specimen with the largest energy dissipation coefficient at the yield point is structure5-3, indicating that the energy dissipation capacity increases with the increase of longitudinal reinforcement strength before the structural specimen yields.The energy dissipation coefficient at the peak point is Structure5-1 > Structure5-2 > Structure5-3, which indicates that the energy dissipation capacity decreases with the increase of the longitudinal reinforcement strength after the structural specimen yields.
3.5.5. Rigidity Degeneration
Figure 21 is the stiffness-displacement curves of three structural specimens. The stiffness of the structural specimen continues to decrease as displacement increases. The stiffness of the structural specimen is 5-1< 5-2< 5-3 at the initial stage when the stiffness is mainly determined by the elastic modulus of the structural specimen. The greater the strength of the steel bars in the structural specimen, the greater the stiffness of the structural specimen under the same conditions.The degradation rate of stiffness is structure5-1 < structure5-2 < structure5-3, indicating that the higher the strength of longitudinal reinforcement, the faster the structural stiffness degradation. At the last displacement loading, the stiffness of the three specimens is about 20kN/mm, and the size tends to be the same, indicating that the three specimens have been seriously damaged.
4. Suggestions for Optimization Design
The key parameters affecting the seismic energy dissipation capacity of the prefabricated ECC/RC combined shear wall structure are the use regions of ECC in composite coupling beams, use regions of ECC in shear walls, strength of ECC, stirrup ratio of coupling beams, strength of longitudinal reinforcement and so on. For quantitatively analyzing the effects of these factors on seismic energy dissipation indicators such as structural load-displacement curve, hysteresis curve, energy dissipation capacity and stiffness degradation, a standard example is selected and different parameters are modified on this basis. The effects of these parameters on the seismic energy dissipation performance of structural specimens is analyzed in detail. Through comparative analysis, we get the following results.
Compared with the structural specimens using concrete coupling beams, the yield load, the corresponding yield displacement, the peak load and the corresponding peak displacement for ECC/RC combined coupling beams and ECC coupling beam specimens are larger with fuller hysteresis loop. Both single-cycle and cumulative energy consumption are larger, the energy dissipation coefficient is also larger, while the stiffness degradation rate is slower. In a word, all seismic performance indexes are improved. The seismic indexes of the specimens with ECC/RC composite coupling beams and the specimens with ECC coupling beams are similar. Considering the cost and seismic energy dissipation factors, ECC/RC composite coupling beam is more cost-effective.
The increase of ECC usage in the bottom shear wall would improve the bearing capacity and peak displacement of the structural specimen accordingly. The curve descent of the structural specimen becomes more and more gentle, the ductility increases, and the speed of energy and stiffness degradation slows down. Correspondingly, the load-displacement hysteresis curves of the structural specimen is fuller, but the rate of increase of fullness gradually decreases, and similarly, the cumulative energy consumption value still increases, but the acceleration rate decreases. When ECC materials are used in the height of 400 mm at the bottom, the energy dissipation coefficient of the structural specimen reaches the maximum. Considering the various seismic performance indexes and economy, the best ECC material use area for the prefabricated shear walls is the height of 400mm at the bottom.
With the increase of ECC strength, the yield load and peak load of the structural specimen continue to increase, but the increase rate decreases. The energy dissipation value and energy dissipation coefficient reduced, and the stiffness degradation is accelerated. In general, the seismic performance of the structural specimen is weakened.
In the range of 0.5 % ~ 2.01 % for the stirrup ratio of the coupling beam, the load-displacement curve, hysteresis curve, energy dissipation capacity and stiffness degradation for each specimen are basically the same. Within the parameter range studied in this paper, reducing the stirrup ratio of coupling beam stirrups does not affect the seismic performance of the structural specimen.
The contribution of high-strength steel bars to the structural specimens before yield is greater, while the one-cycle energy degradation coefficient and energy dissipation coefficient of the three structural specimens after yield are similar. The higher the strength of the longitudinal reinforcement, the faster the stiffness of the structural specimen degrades. Therefore, it is not necessary to use high-strength steels.
Based on the analysis above, the recommended parameter values as shown in Table 15.
5. Conclusions
The prefabricated ECC/RC combined shear wall structure is a new prefabricated composite structure with better seismic performance by using ECC materials with better ductility in the main force and energy consumption parts of the prefabricated reinforced concrete (RC) shear wall structure. The key parameters affecting the seismic energy dissipation capacity are the use regions of ECC in composite coupling beams, use regions of ECC in shear walls, strength of ECC, stirrup ratio of coupling beams, strength of longitudinal reinforcement and so on. The parameters affecting seismic energy consumption are quantified by the finite element analysis method. By comparing and analyzing the load-displacement curves, hysteresis curves, energy dissipation capacity and stiffness degradation under these parameters, it is proposed that the best use regions of ECC is the cast-in-situ zone of the coupling beams with a height of 400 mm at the bottom. It is suggested that the strength grade of ECC, the strength grade of longitudinal reinforcement, and the stirrup ratio of coupling beams are E40, HRB400 and 0.5 %, seperately.
The research in this paper is based on a standard example of a 1/2-scale two-story spatial structure. Therefore, the optimization design suggestions proposed in this paper are mainly applicable to the standard example. The optimization design proposal has some reference significance for practical engineering, but further research is still needed. In the future research, we will further study the optimal design of practical engineering under earthquake action.
Funding
The research was funded by the “National Nature Science Foundation of China” (Grant No.52308271),“Shenzhen High-level Talents Research Start-up Fund (Grants No. RC2022-004)”and the “2022 Doctoral Research Startup Project of Shenzhen Institute of Information Technology” (Grant No. SZIIT2022KJ014), supported by “The Eighth Batch of Education and Teaching Reform Research Projects of Shenzhen Institute of Information Technology” (Grant No. 2021dbpjgyb25) and by “Guangdong Province Ordinary University Features Innovative Projects” (Grant No. 2020 ktscx300).
References
- Elliott K.S. Precast Concrete structures., CrcPress , 2016 .
- Soares, D., De Brito, J., Ferreira, J., & Pacheco, J. Use of coarsere cycled aggregates from precast concre tereject s: mechanical and durability performance. Construct. Build. Mater. 2014, 71, 263-272.
- Kurama Y.C., Sritharan S., Fleischman R.B., Restrepo J.I., Henry R.S., Cleland N.M., Ghosh S.K., Bonelli P. Seismic-resistant precast concrete structures: state of the art. J. Struct. Eng. 2018,144(4). 03118001. [CrossRef]
- Shen S.D., Cui Y., Pan P., Ren J.Y. Development of prefabricated composite energydissipating slotted shear wall. Eng. Struct. 2019,199. 109577.
- Nazari M., Sritharan S., Aaleti S. Single precast concrete rocking walls as earthquake force-resisting elements. Earthq. Eng. Struct. Dynam. 2016,46(5):753–69. [CrossRef]
- Peng Y.Y., Qian J.R., Wang Y.H. Cyclic performance of precast concrete shear walls with a mortar–sleeve connection for longitudinal steel bars. Mater. Struct. 2016,49 (6):2455–69.
- Brunesi E., Peloso S., Pinho R., Nascimbene R. Cyclic testing of a full-scale two-storey reinforced precast concrete wall-slab-wall structure. Bull. Earthq. Eng. 2018,16(11): 5309–39. [CrossRef]
- Brunesi E., Peloso S., Pinho R., Nascimbene R. Shake-table testing of a full-scale twostorey precast wall-slab-wall structure. Earthq. Spectra. 2019,35(4):1583–609.
- Qian, K., Li, B., & Liu, Y. Integrity of precast concre test ructues to resist progressive collapse.Geotech. Stru. Eng. Congre.. 2016. 1976 –1986 .
- Wu, B., Peng, C.W., & Zhao, X.Y.Cyclic loading tests of semi-precast circular steel tubular columns in corporating preast segments containing demolished concrete lumps , Eng. Struct. 2020,211.
- Qian J.R., Han W.L., Zhao Z.Z., Qin H., Zhang Y., Yu J., Ma T., Tian D. Pseudo-dynamic substructure test on a 3-storey full-scale model of prefabricated concrete shear wall structure with rebars splicing by grout sleeves. J.Build.Struct. 2017,38(3):26–38 [in Chinese].
- SJG98-2021,Technical specification for concrete structures of tall building[S],Beijing,China: China Architecture & Building Press,2021.
- Xiao, S., Wang, Z., Li, X., Harries, K. A., Xu, Q., & Gao, R. Study of effects of sleeve grouting defects on the seismic performance of precast concrete shear walls. Eng. Struct. 2021,236, 111833. [CrossRef]
- Zhi, Q., Kang, L., Jia, L., Xiong, J., & Guo, Z. Seismic performance of precast shear walls prestressed via post-tensioned high strength bars placed inside grouted corrugated pipes. Eng. Struct.2021, 237, 112153. [CrossRef]
- Tan, W., Xianqian, M., Ruinian, J., Lijun, D., Jun, L., Yinlong, H., .& Haibin, M. Seismic performance of repaired prefabricated shear walls. Case. Stud. Constr. Mat. 2023,18, e01896.
- Yang, J., Guo, T., Wang, W., & Zhu, R. Experimental investigation on seismic behaviors of precast concrete shear walls with sleeve grouting defects. Adv. Struct. Eng. 2023 ,26(2), 258-271. [CrossRef]
- Qin, C., Bai, G., Liu, B., Wu, T., & Wang, B. Study on the global bidirectional seismic behavior of monolithic prefabricate concrete shear wall structure. Soil Dyn Earthq Eng. 2020,136, 106194. [CrossRef]
- Sheng, F. Study on damping characteristics and dynamic response of ECC/RC prefabricated shear wall structure.Southeast University,2022.[in Chinese].
- Li, V.C. Engineered cementitious composites (ECC) material, structural, and durability performance. In Concrete Construction Engineering Handbook; Nawy, E., Ed.; Chapter 24; CRC Press: Boca Raton, FL, USA, 2008, 1-78.
- Yu, J.; Yao, J.; Lin, X.; Li, H.; Lam, J.Y.; Leung, C.K.; Shih, K. Tensile performance of sustainable Strain-Hardening Cementitious Composites with hybrid PVA and recycled PET fibers. Cem. Concr. Res. 2018, 107, 110–123. [CrossRef]
- Yu, K.Q.; Yu, J.T.; Dai, J.G.; Lu, Z.D.; Shah, S.P. Development of ultra-high performance engineered cementitious composites using polyethylene (PE) fibers. Constr. Build. Mater. 2018, 158, 217–227. [CrossRef]
- Abd Elmoaty, A.E.M.; Morsy, A.M.; Harraz, A.B. Effect of Fiber Type and Volume Fraction on Fiber Reinforced Concrete and Engineered Cementitious Composite Mechanical Properties. Buildings 2022, 12, 2108. [CrossRef]
- Abouhussien, A.A.; Hassan, A.A.; Ismail, M.K.; AbdelAleem, B.H. Evaluating the cracking behavior of ECC beam-column connections under cyclic loading by acoustic emission analysis. Constr. Build. Mater. 2019, 215, 958–968. [CrossRef]
- Hao,Z.; Lu,C.; Li,Z. Highly accurate and automatic semantic segmentation of multiple cracks in engineered cementitious composites (ECC) under dual pre-modification deep-learning strategy. Cem. Concr. Res. 2023, 165, 107066. [CrossRef]
- Huang, B.T.; Wu, J.Q.; Yu, J.; Dai, J.G.; Leung, C.K.; Li, V.C. Seawater sea-sand engineered/strain-hardening cementitious composites (ECC/SHCC): Assessment and modeling of crack characteristics. Cem. Concr. Res. 2021, 140, 106292. [CrossRef]
- Gu, D.; Pan, J.; Mustafa, S.; Huang, Y.; Luković, M. Shear transfer mechanism in reinforced engineered cementitious composite (ECC) beams: Quantification of Vs and Vc. Eng. Struct. 2022, 261, 114282.
- Meng, D.; Lee, C.K.; Zhang, Y.X. Structural behavior of reinforced polyvinyl alcohol engineered cementitious composite (PVA-ECC) beams under static and fatigue loadings. In Advances in Engineered Cementitious Composites; Woodhead Publishing: Sawston, UK, 2022,161–208.
- Abbas, A.A.; Arna’Ot, F.H., Abid, S.R.; Özakça, M. Flexural behavior of ECC hollow beams incorporating different synthetic fibers. Front. Struct. Civ. Eng. 2021, 15, 399-411. [CrossRef]
- Amiri, M.; Esfahani, M.R. Effect of using Engineered Cementitious Composites (ECC) on failure behavior of flat slab-column connections. Structures 2023, 47, 2397–2407. [CrossRef]
- Zhang, Z.; Qian, S.; Ma, H. Investigating mechanical properties and self-healing behavior of micro-cracked ECC with different volume of fly ash. Constr. Build. Mater. 2014, 52, 17–23. [CrossRef]
- Zhang, Z.Y.; Ding, R.; Fan, J.S.; Nie, X.; Zhang, J. Seismic performance and shear strength of coupling beams using engineered cementitious composites with different reinforcement layouts. Eng. Struct. 2020, 219, 110895. [CrossRef]
- Suryanto, B.; Tambusay, A.; Suprobo, P.; Bregoli, G.; Aitken, M.W. Seismic performance of exterior beam-column joints constructed with engineered cementitious composite: Comparison with ordinary and steel fibre reinforced concrete. Eng. Struct. 2022, 250, 113377. [CrossRef]
- Cai, J.; Pan, J.; Xu, L.; Li, G.; Ma, T. Mechanical behavior of RC and ECC/RC composite frames under reversed cyclic loading. J. Build. Eng. 2021, 35, 102036. [CrossRef]
- Khan, F.A.; Khan, S.W.; Khan, W. Seismic performance of RC-ECC composite frame by eliminating shear reinforcement in beam-column joint: Shake table tests. Adv. Struct. Eng. 2022, 25, 2966–2980. [CrossRef]
- Khan, F.A.; Rashid, M.; Khan, S.W.; Rizwan, M.; Badrashi, Y.I.; Fahim, M.; Gul, A. Comparative seismic performance assessment of RC and RC/ECC hybrid frame structures: A shake table study. Innov. Infrastruct. Solut. 2022, 7, 1–17. [CrossRef]
- Ye, B.; Wang, H.; Ma, Y.; Pan, P. Seismic performance of flexure-dominated reinforced-engineered cementitious composites coupled shear wall. Eng. Struct. 2022, 272, 114992. [CrossRef]
- Yang, J.; Liang, S.; Zhu, X.; Sun, C.; Guo, Z. Seismic behavior of precast concrete coupled shear walls with engineered cementitious composite (ECC) in the critical cast-in-place regions. Sci. China Technol. Sci. 2017, 60, 1244–1254. [CrossRef]
- Yang, J.; Jiang, L.; Guo, H.; Yao, G. Stress Mechanism and Energy Dissipation Performance Optimization of Prefabricated ECC/RC Combined Shear Walls under Low Cyclic Loading. Buildings 2023, 13, 772. [CrossRef]
- Chen G.Zhuang H. Developed nonlinear dynamic constitutive relations of soils based on davidenkov skeleton curve. Chinese Journal of Geotechnical Engineering.2005, 27, 860–864.
- JGJ/T 101-2015; Specification for Seismic Test of Buildings. China Architecture & Building Press: Beijing, China, 2015.
Figure 1.
Load-displacement curves under unidirectional pushover.
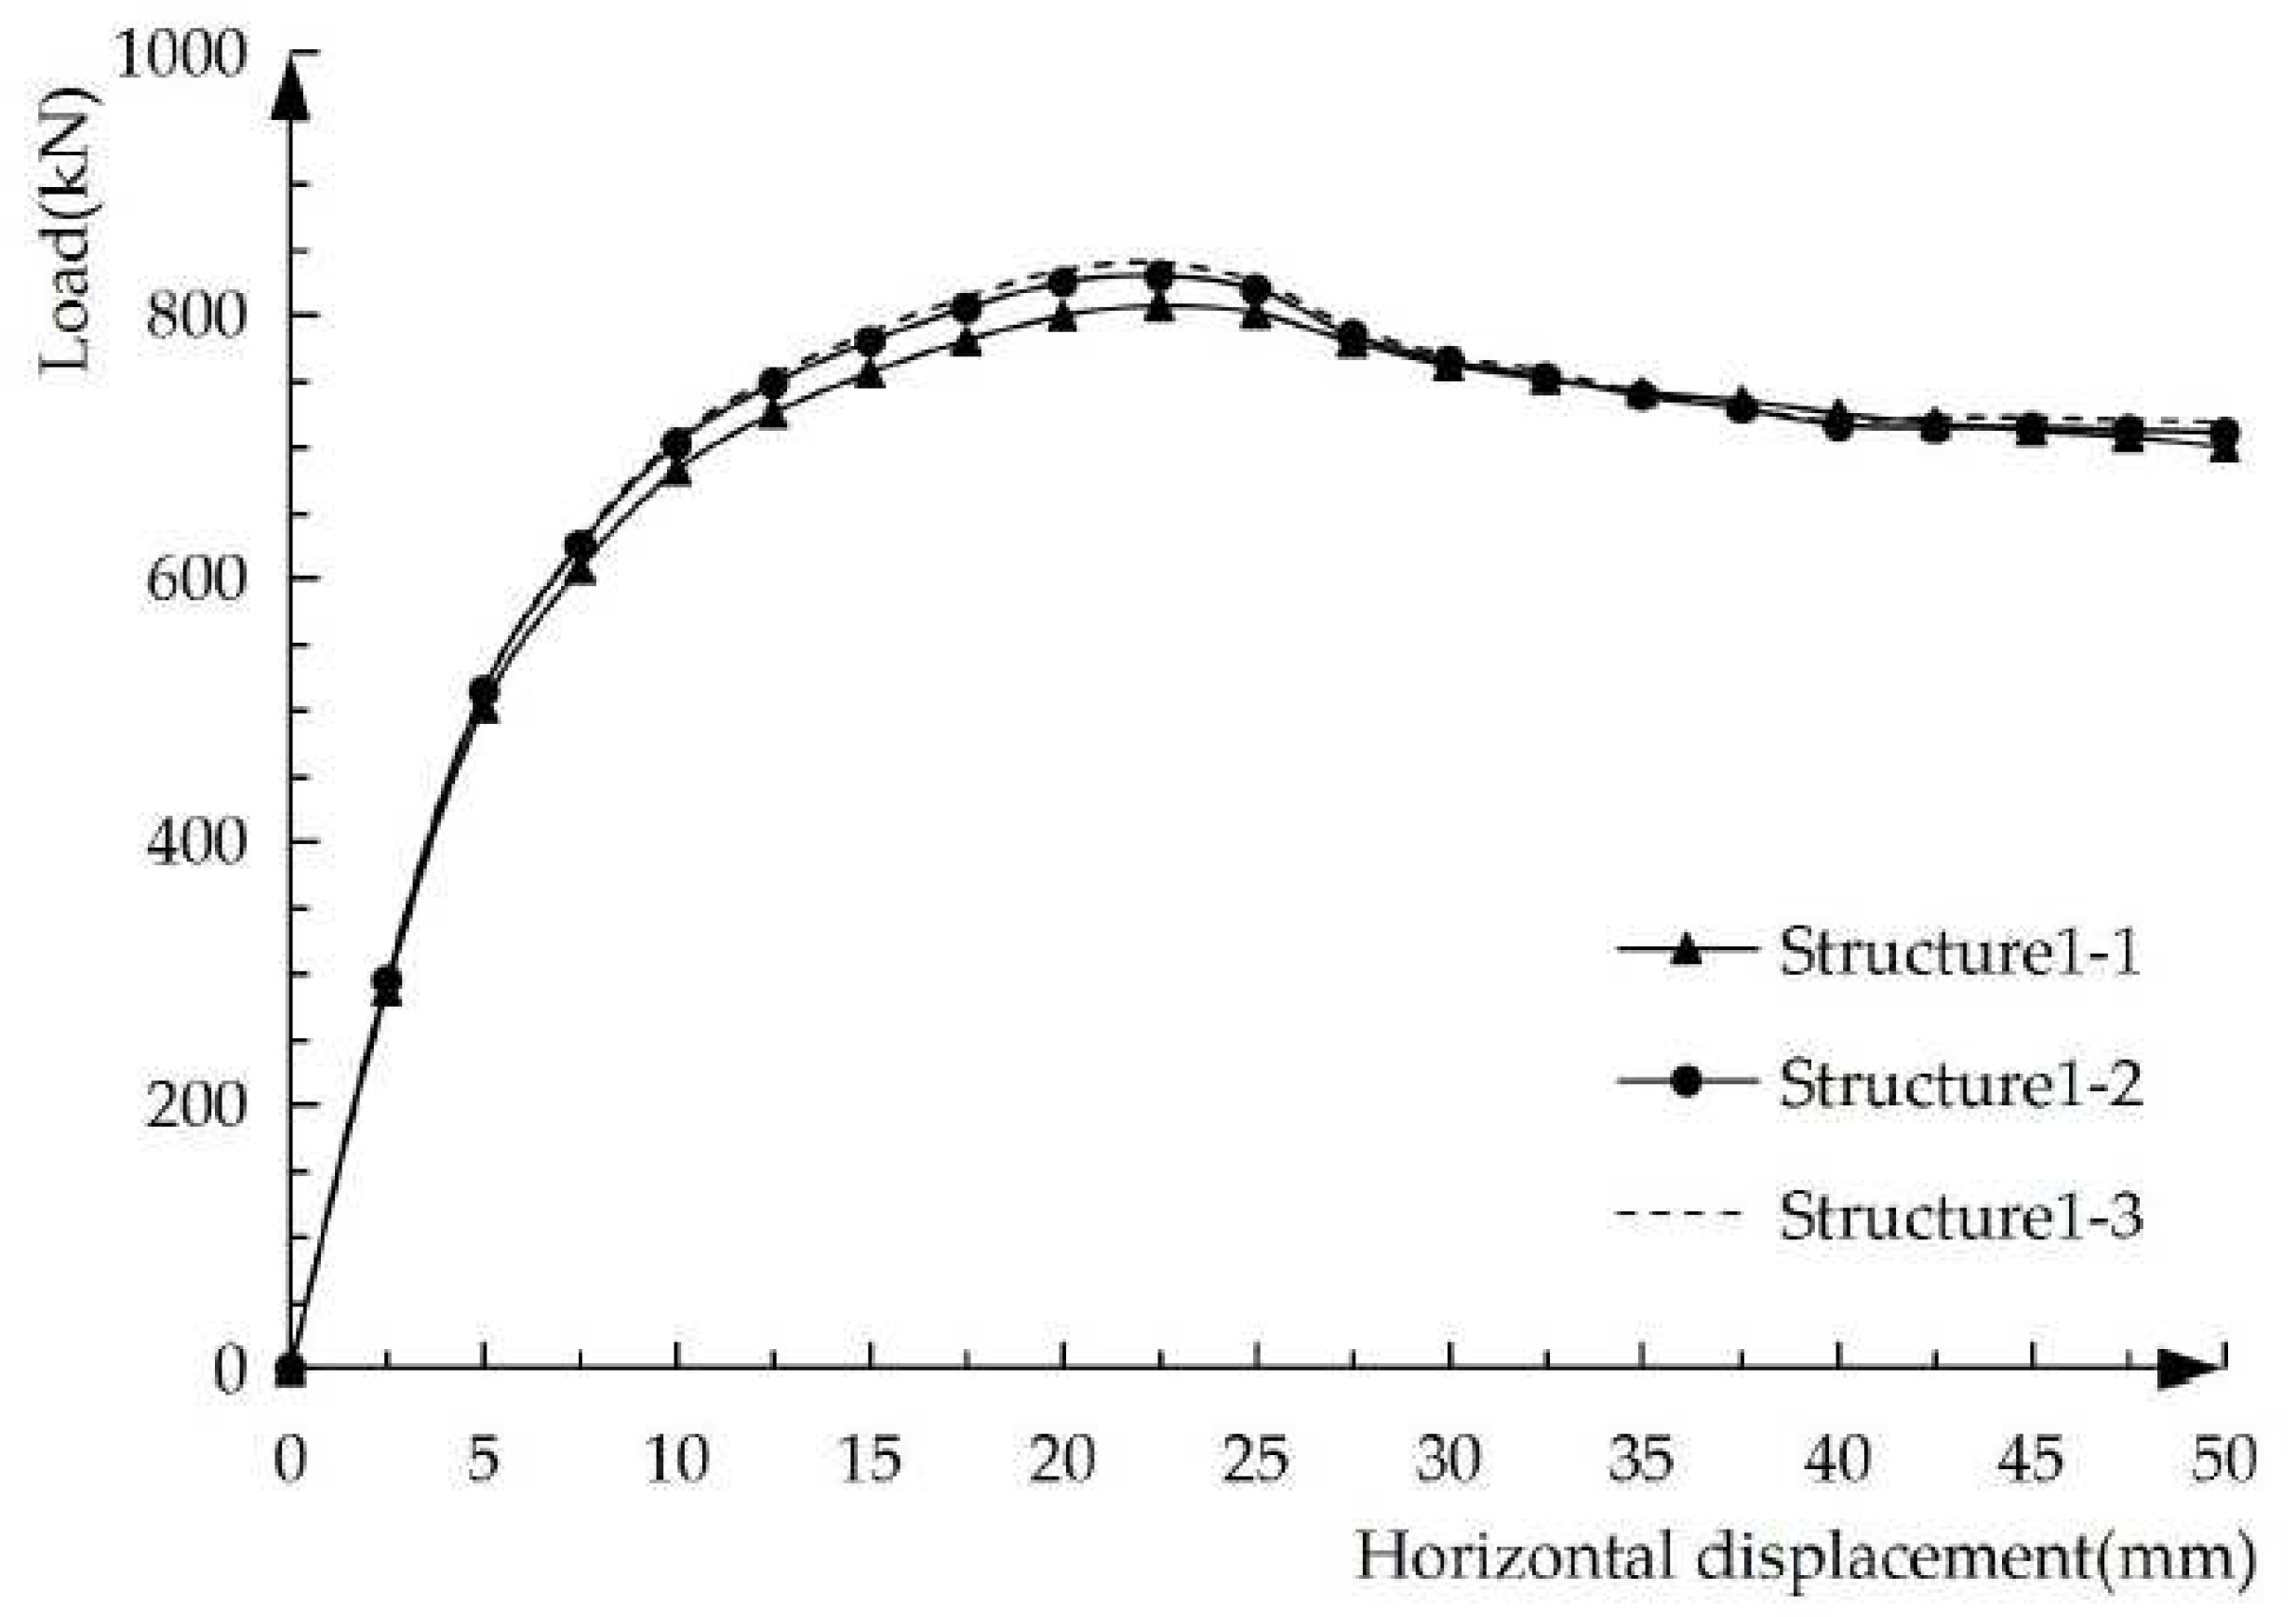
Figure 2.
Load-displacement hysteresis curves under low cyclic loading.
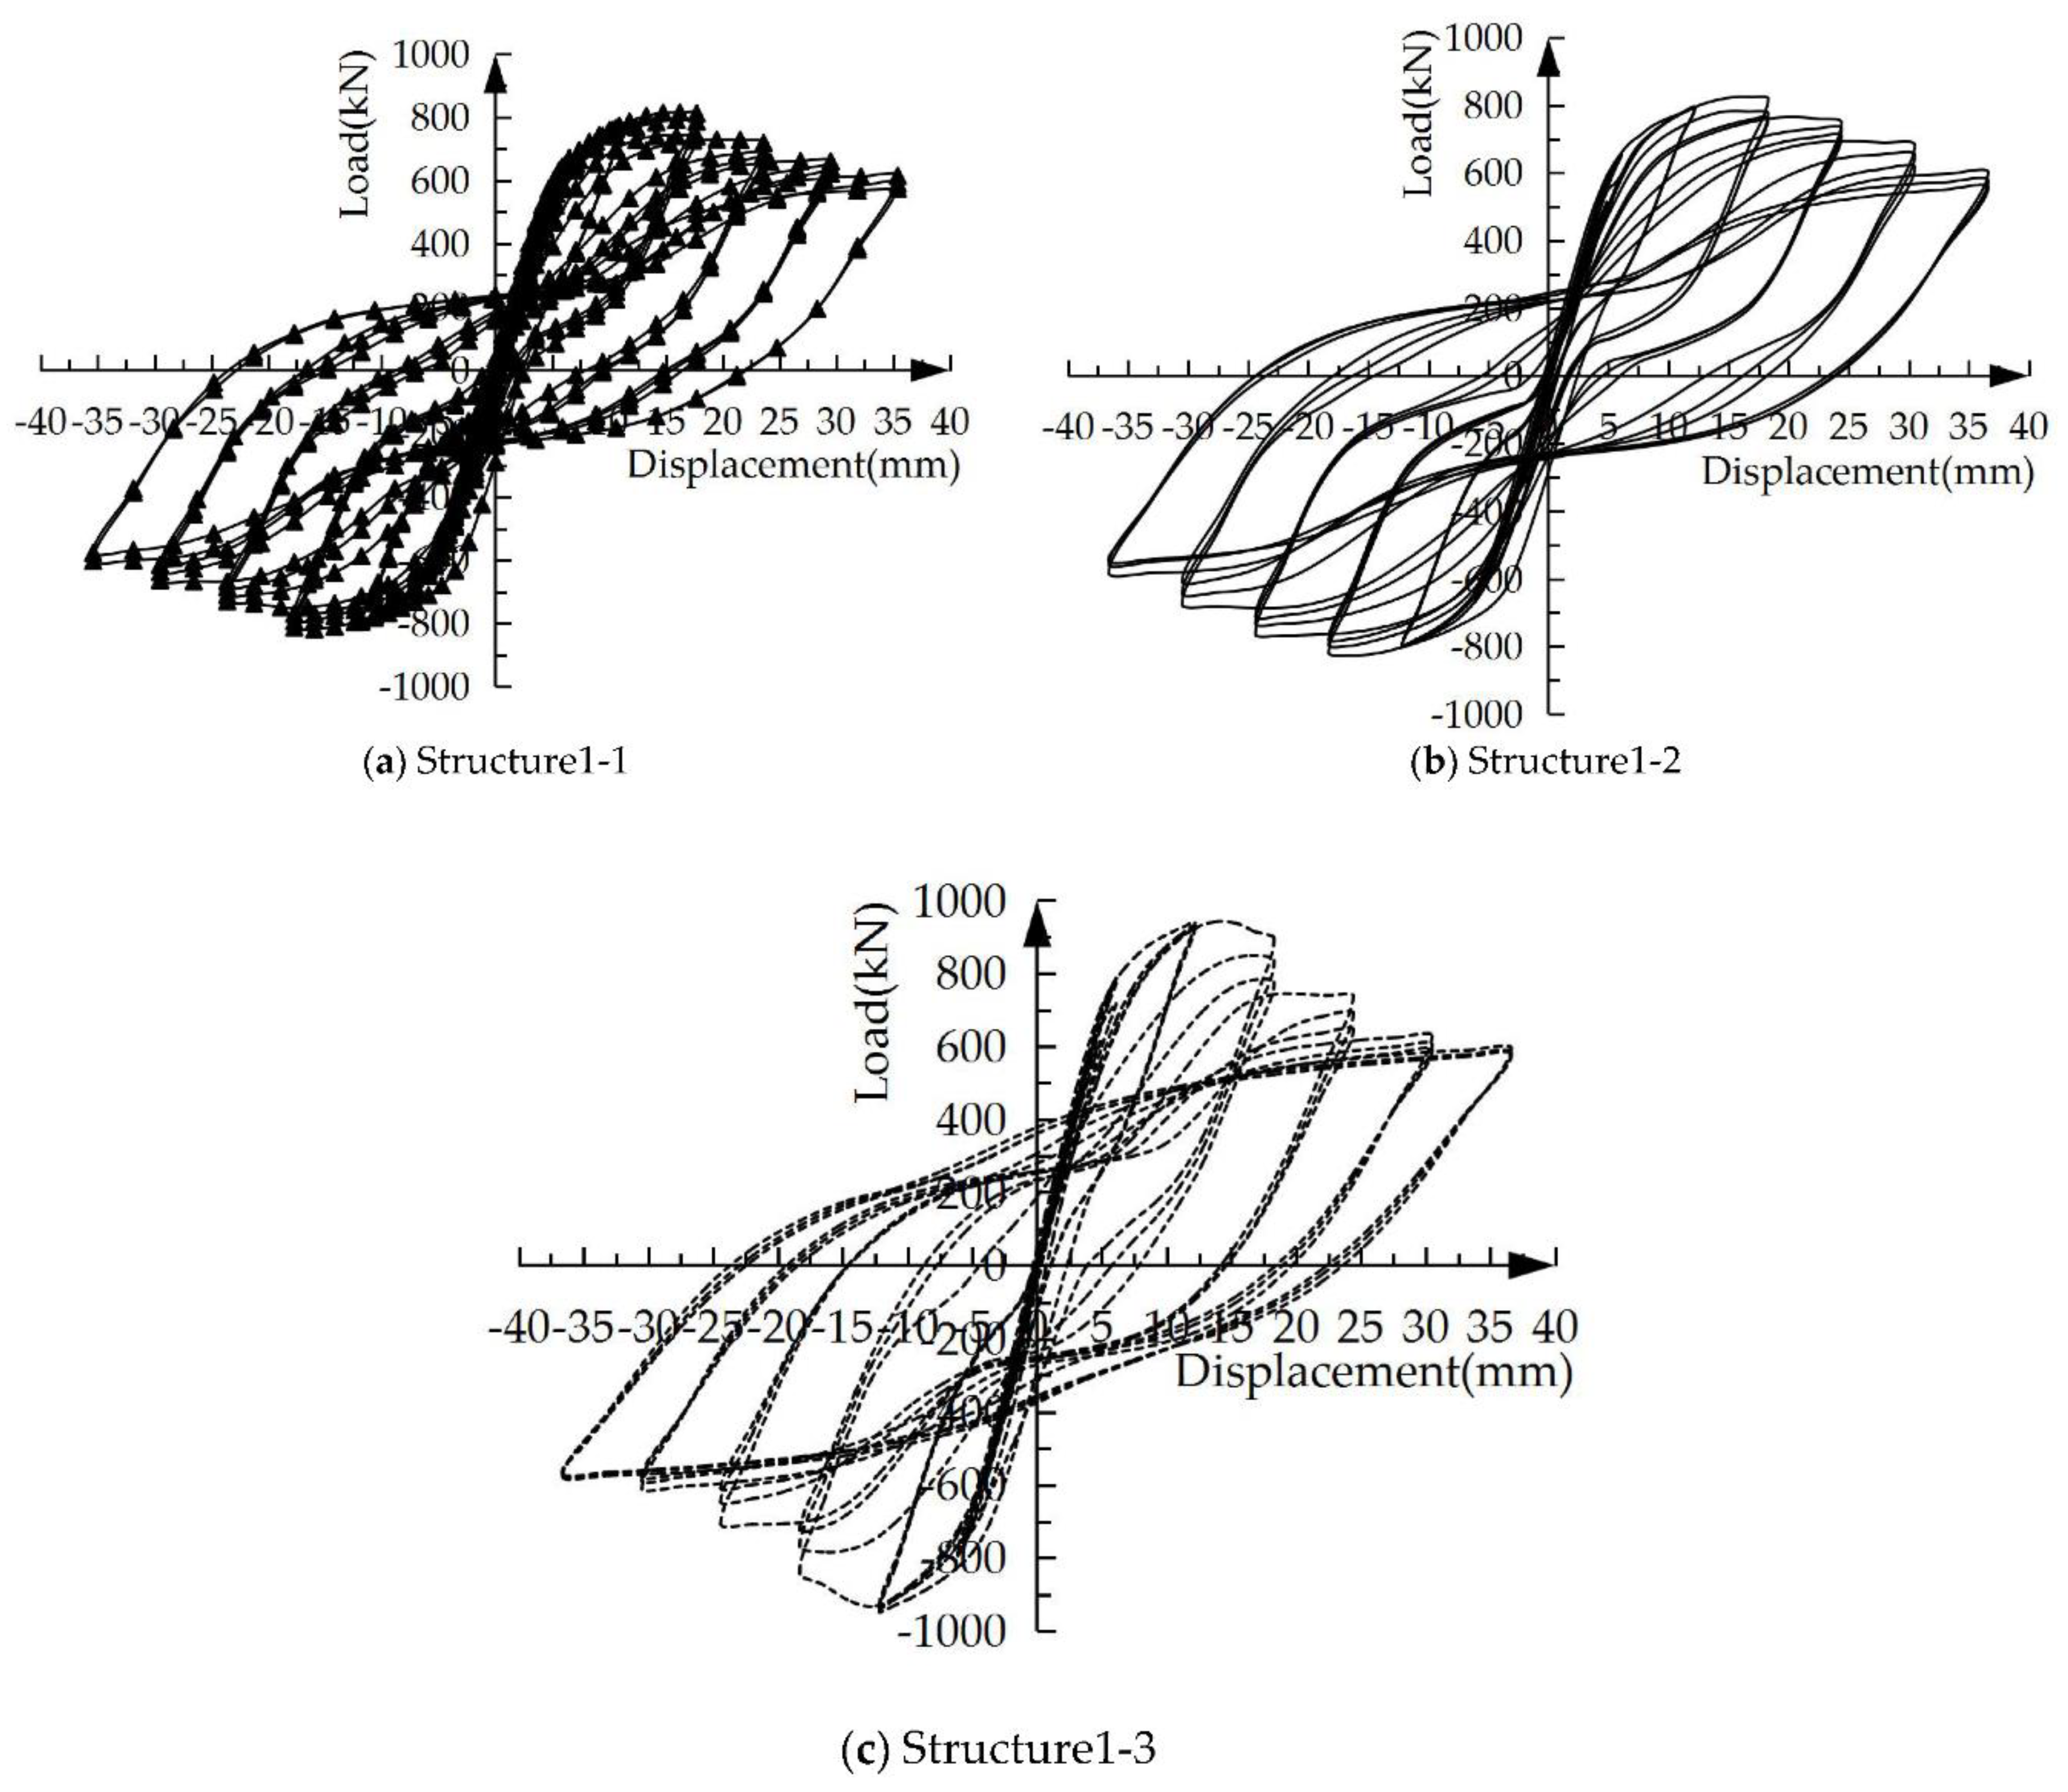
Figure 3.
One-cycle energy degradation coefficient curves of specimens with ECC applied in different regions of the composite coupling beams.
Figure 3.
One-cycle energy degradation coefficient curves of specimens with ECC applied in different regions of the composite coupling beams.
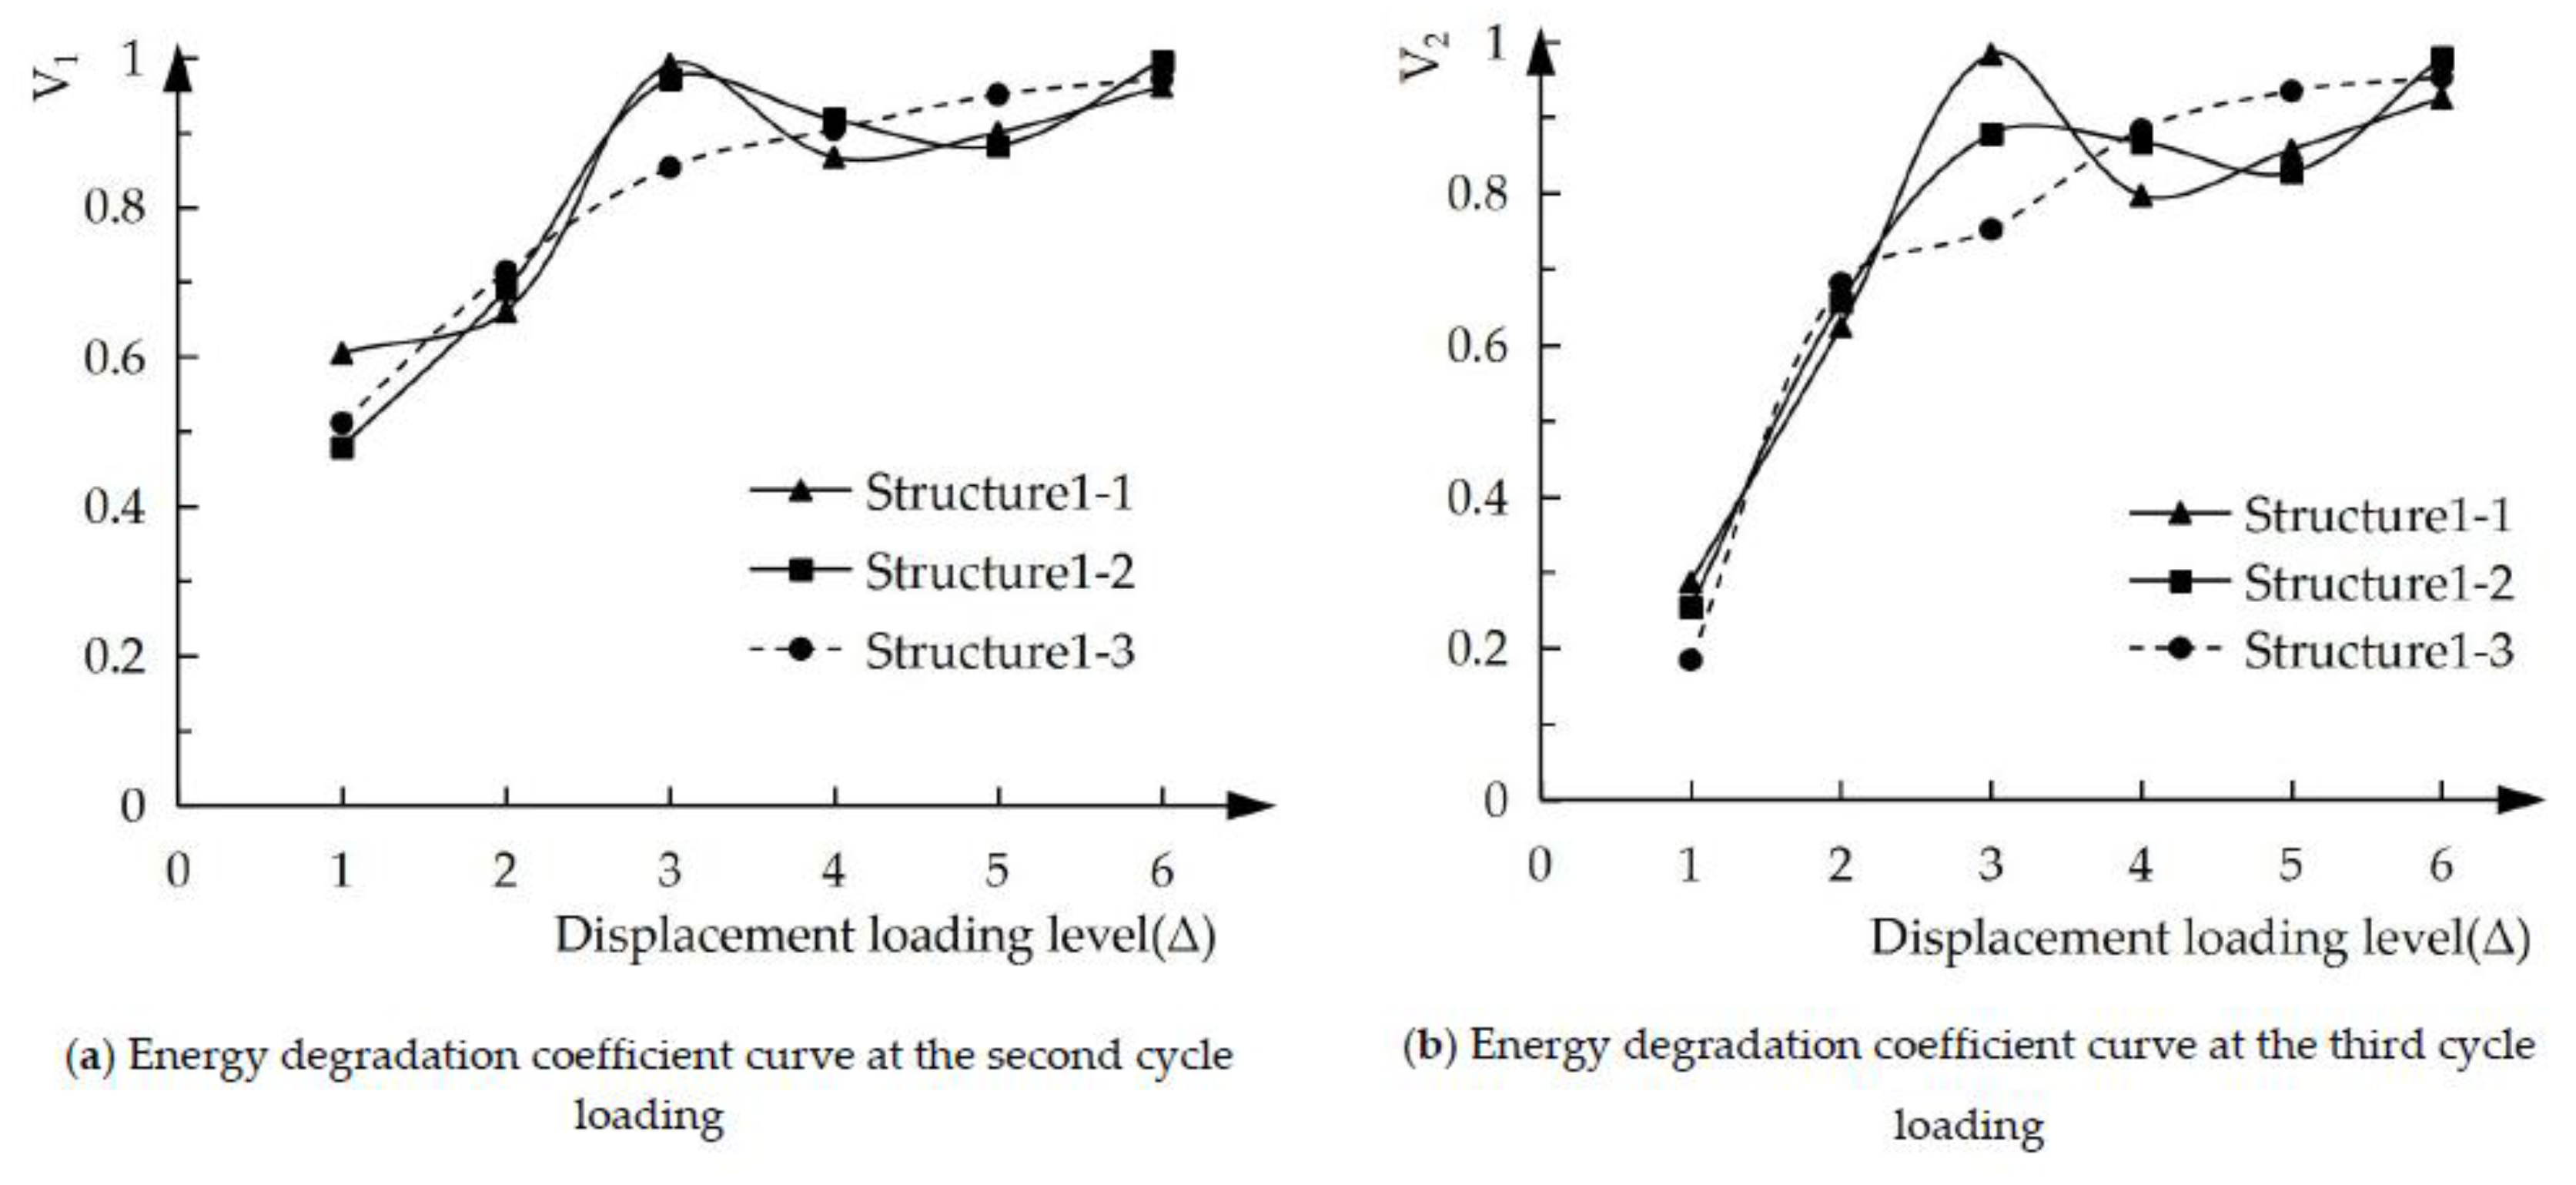
Figure 4.
Schematic diagram of the calculation of the energy dissipation coefficient.
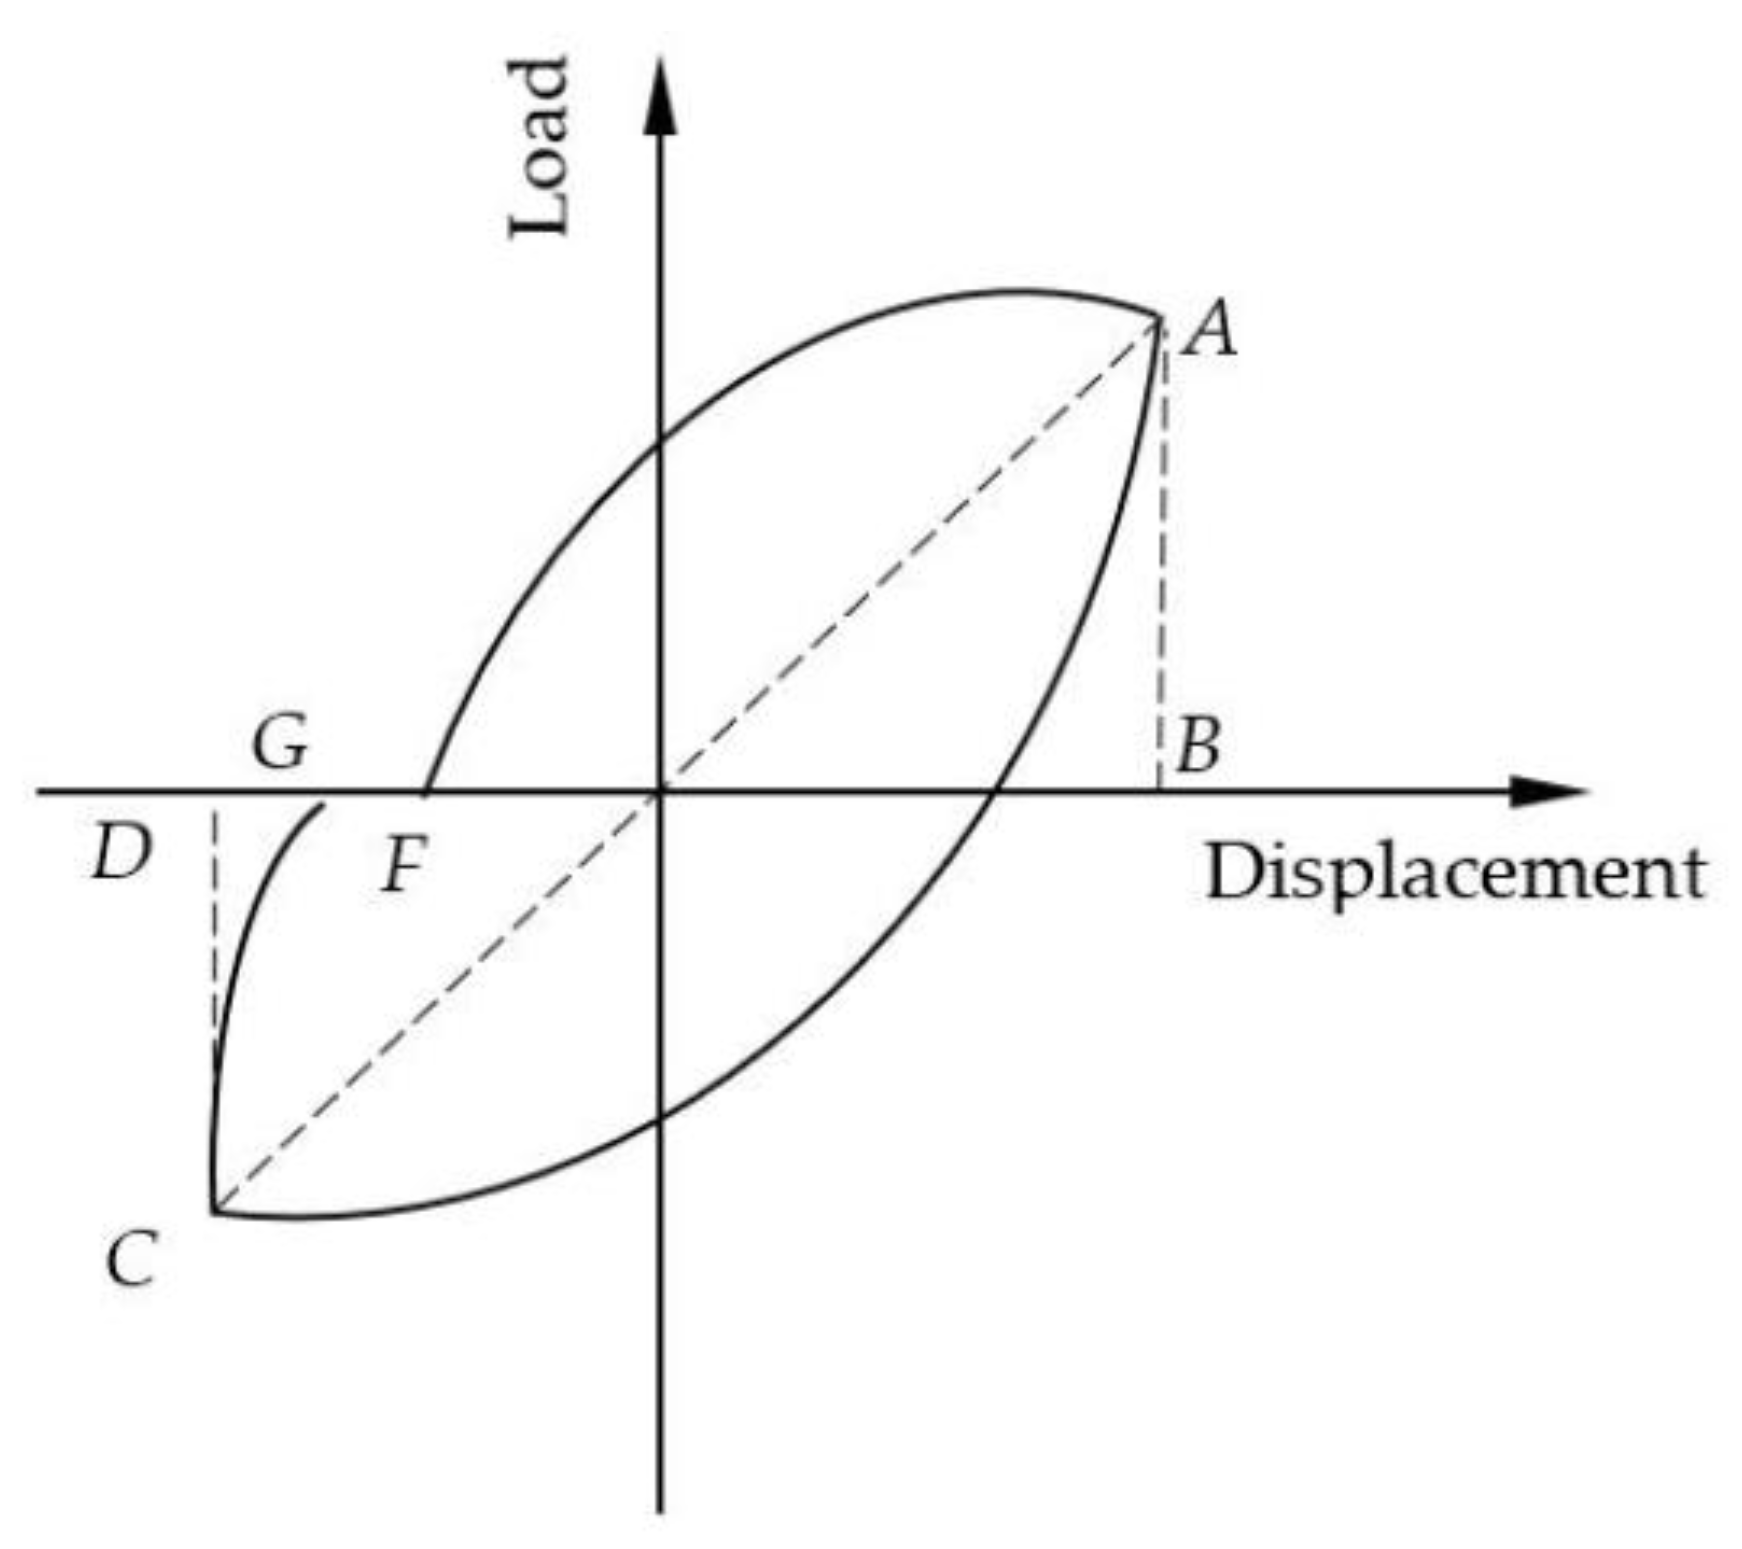
Figure 5.
The stiffness-displacement curves curves of the specimens.
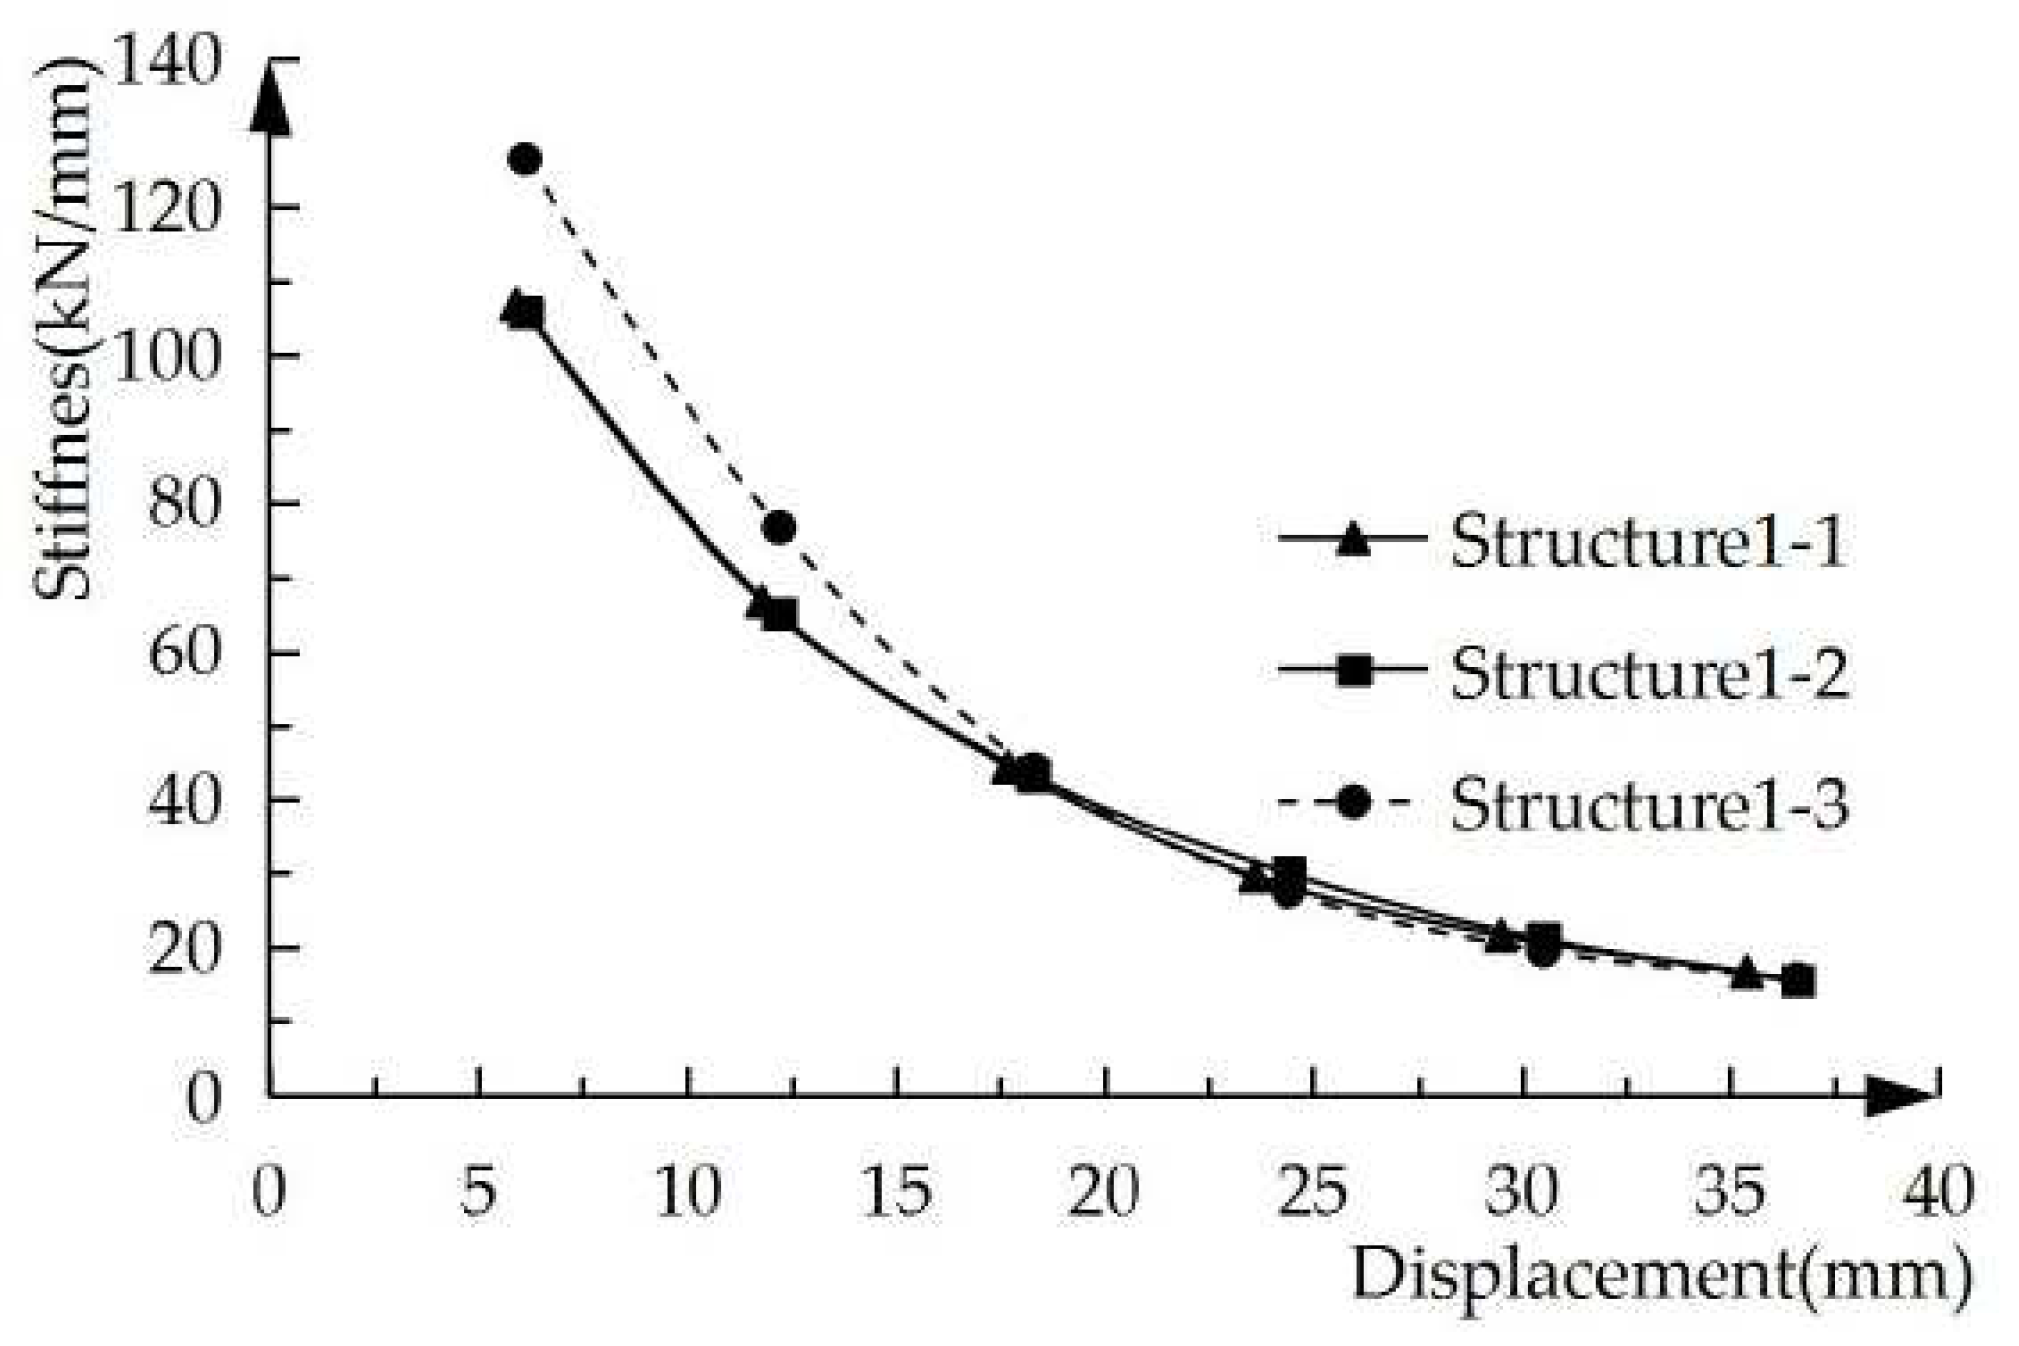
Figure 6.
Load-displacement curves under unidirectional pushover.
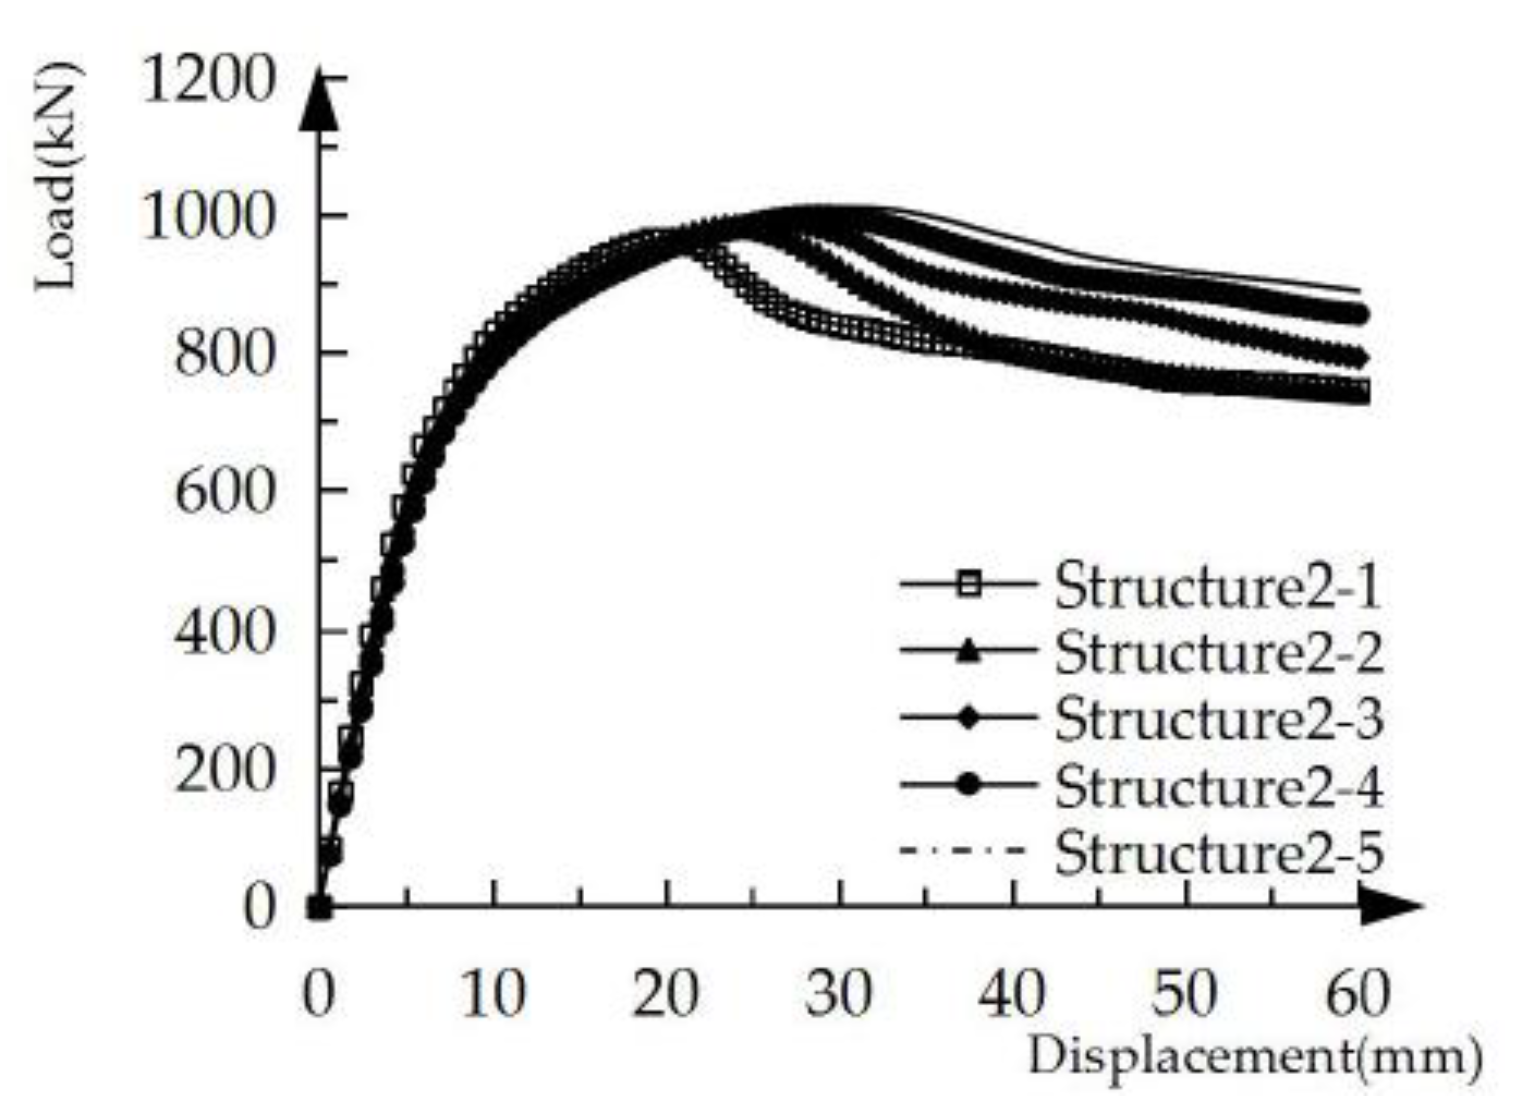
Figure 7.
Load-displacement hysteresis curves of the five structural specimens under low cyclic loading.
Figure 7.
Load-displacement hysteresis curves of the five structural specimens under low cyclic loading.
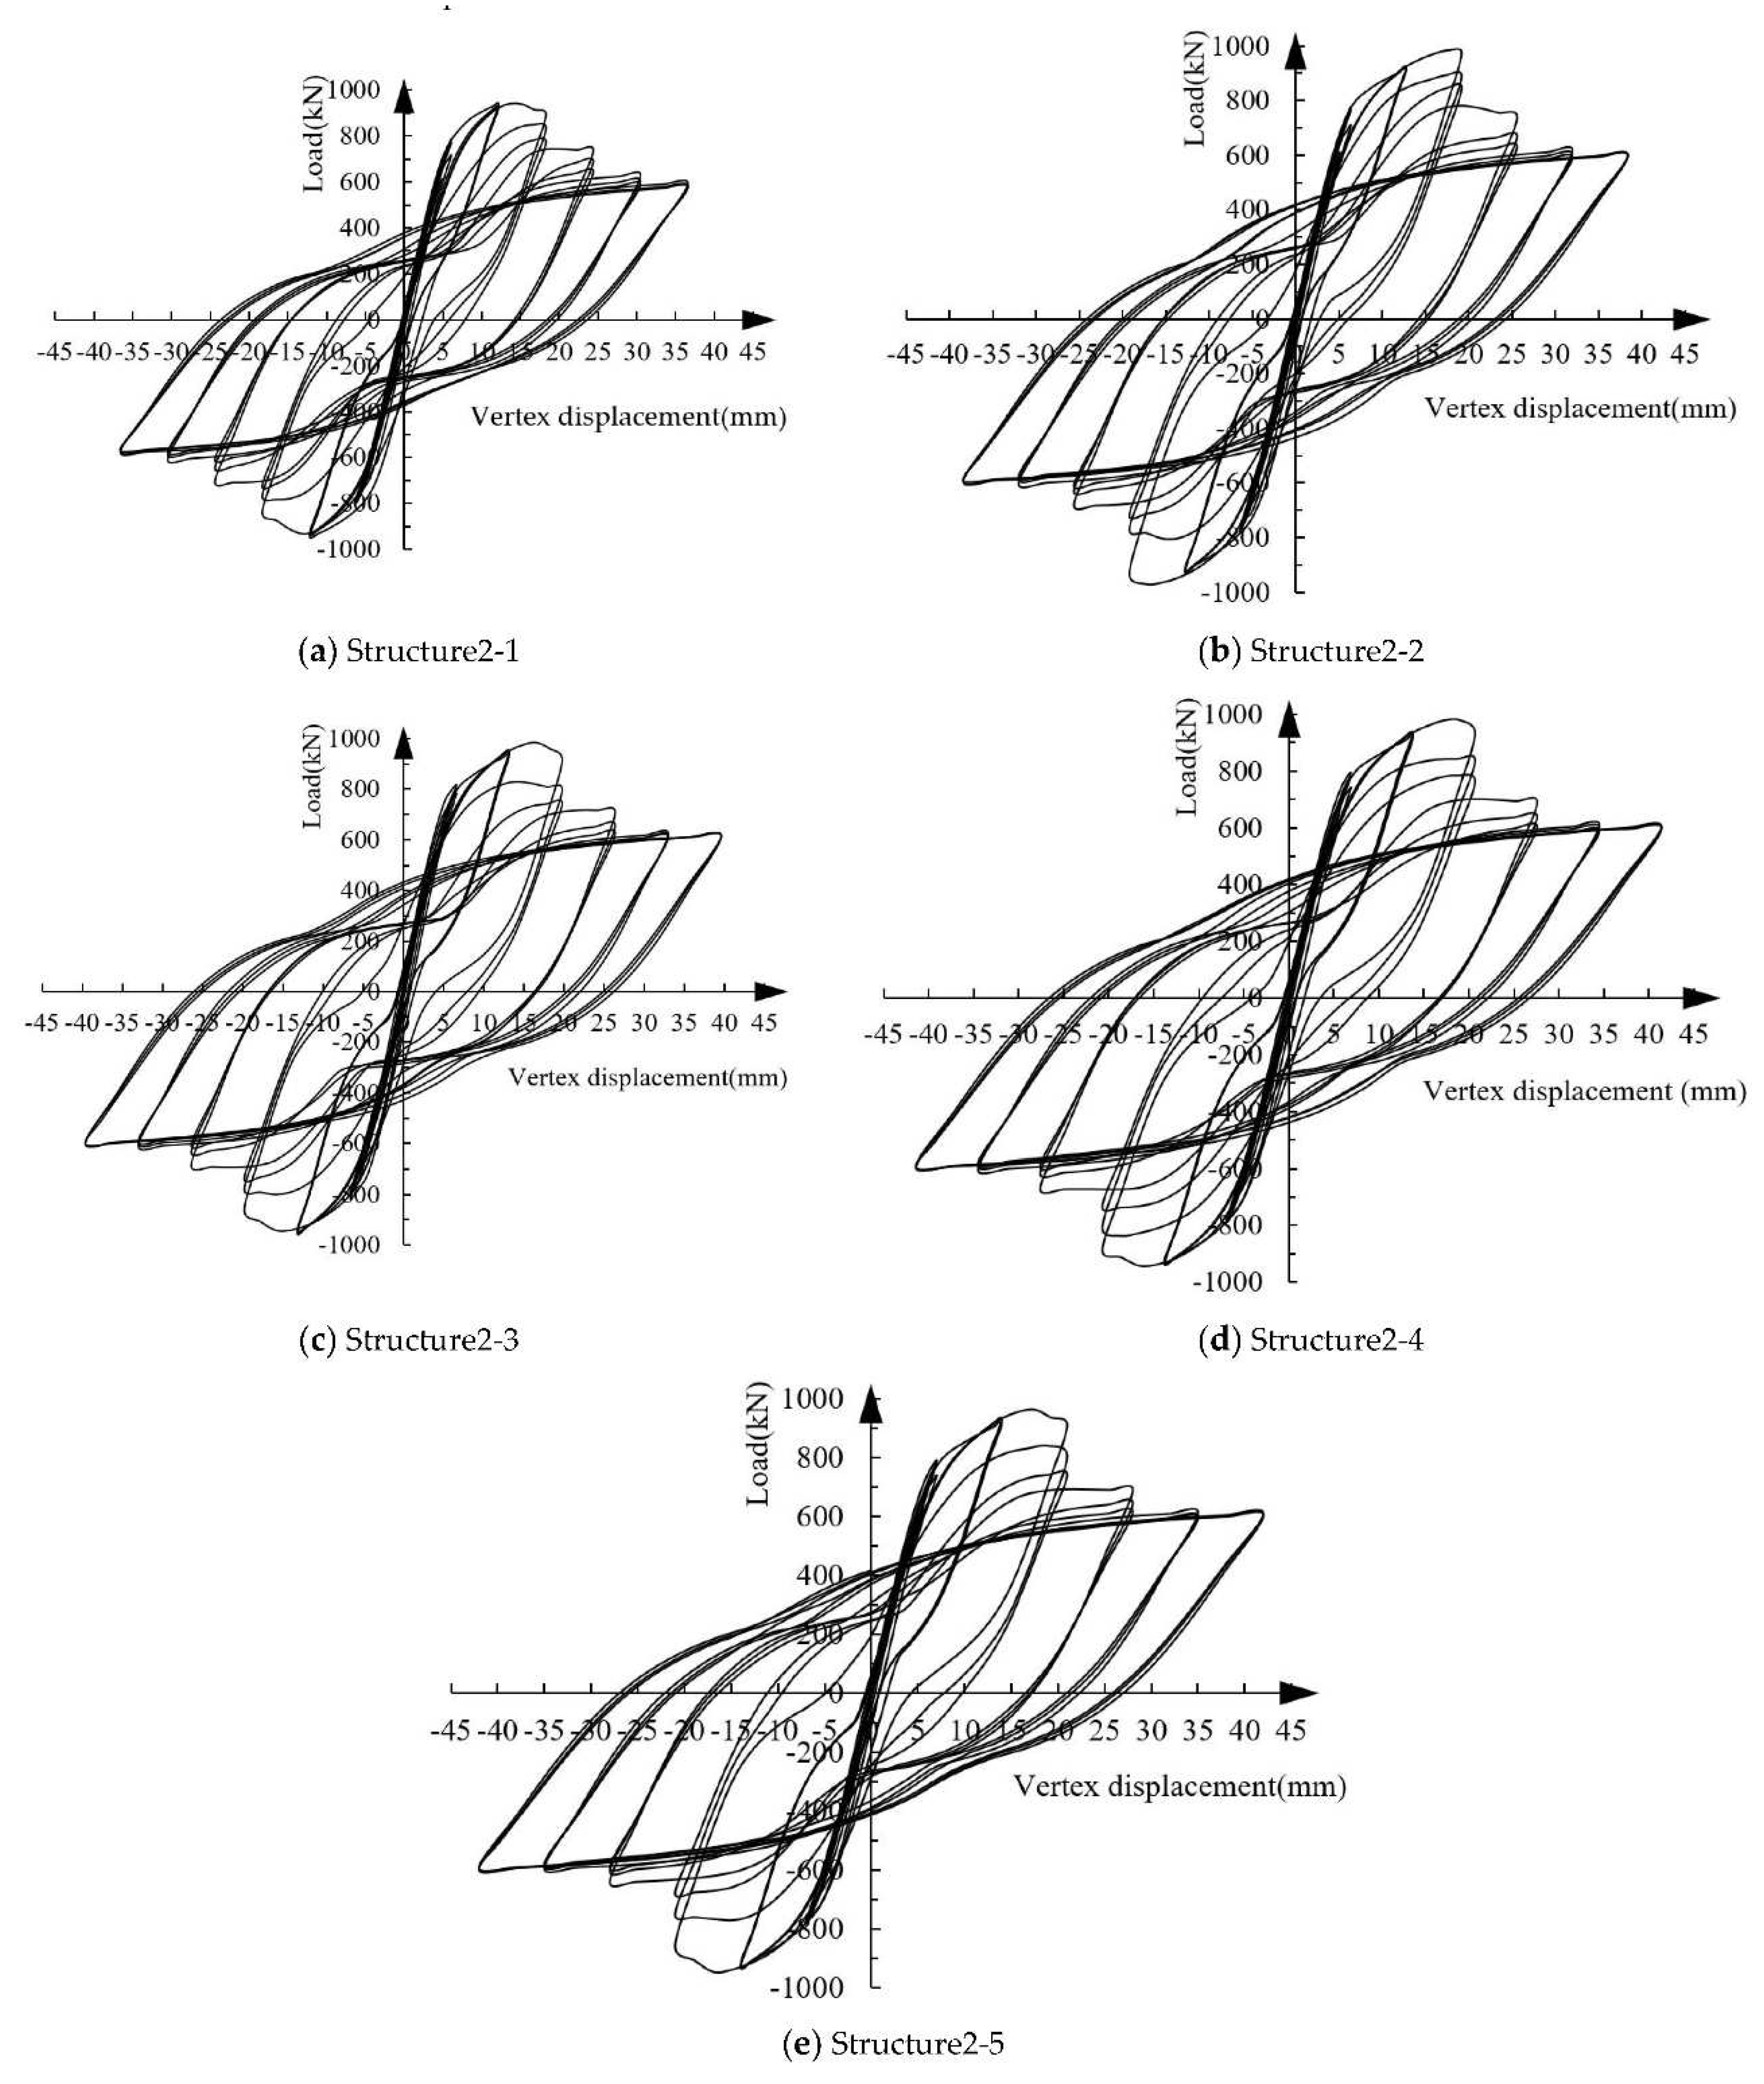
Figure 8.
One-cycle energy degradation coefficient curves of specimens with different use regions of ECC in shear walls.
Figure 8.
One-cycle energy degradation coefficient curves of specimens with different use regions of ECC in shear walls.
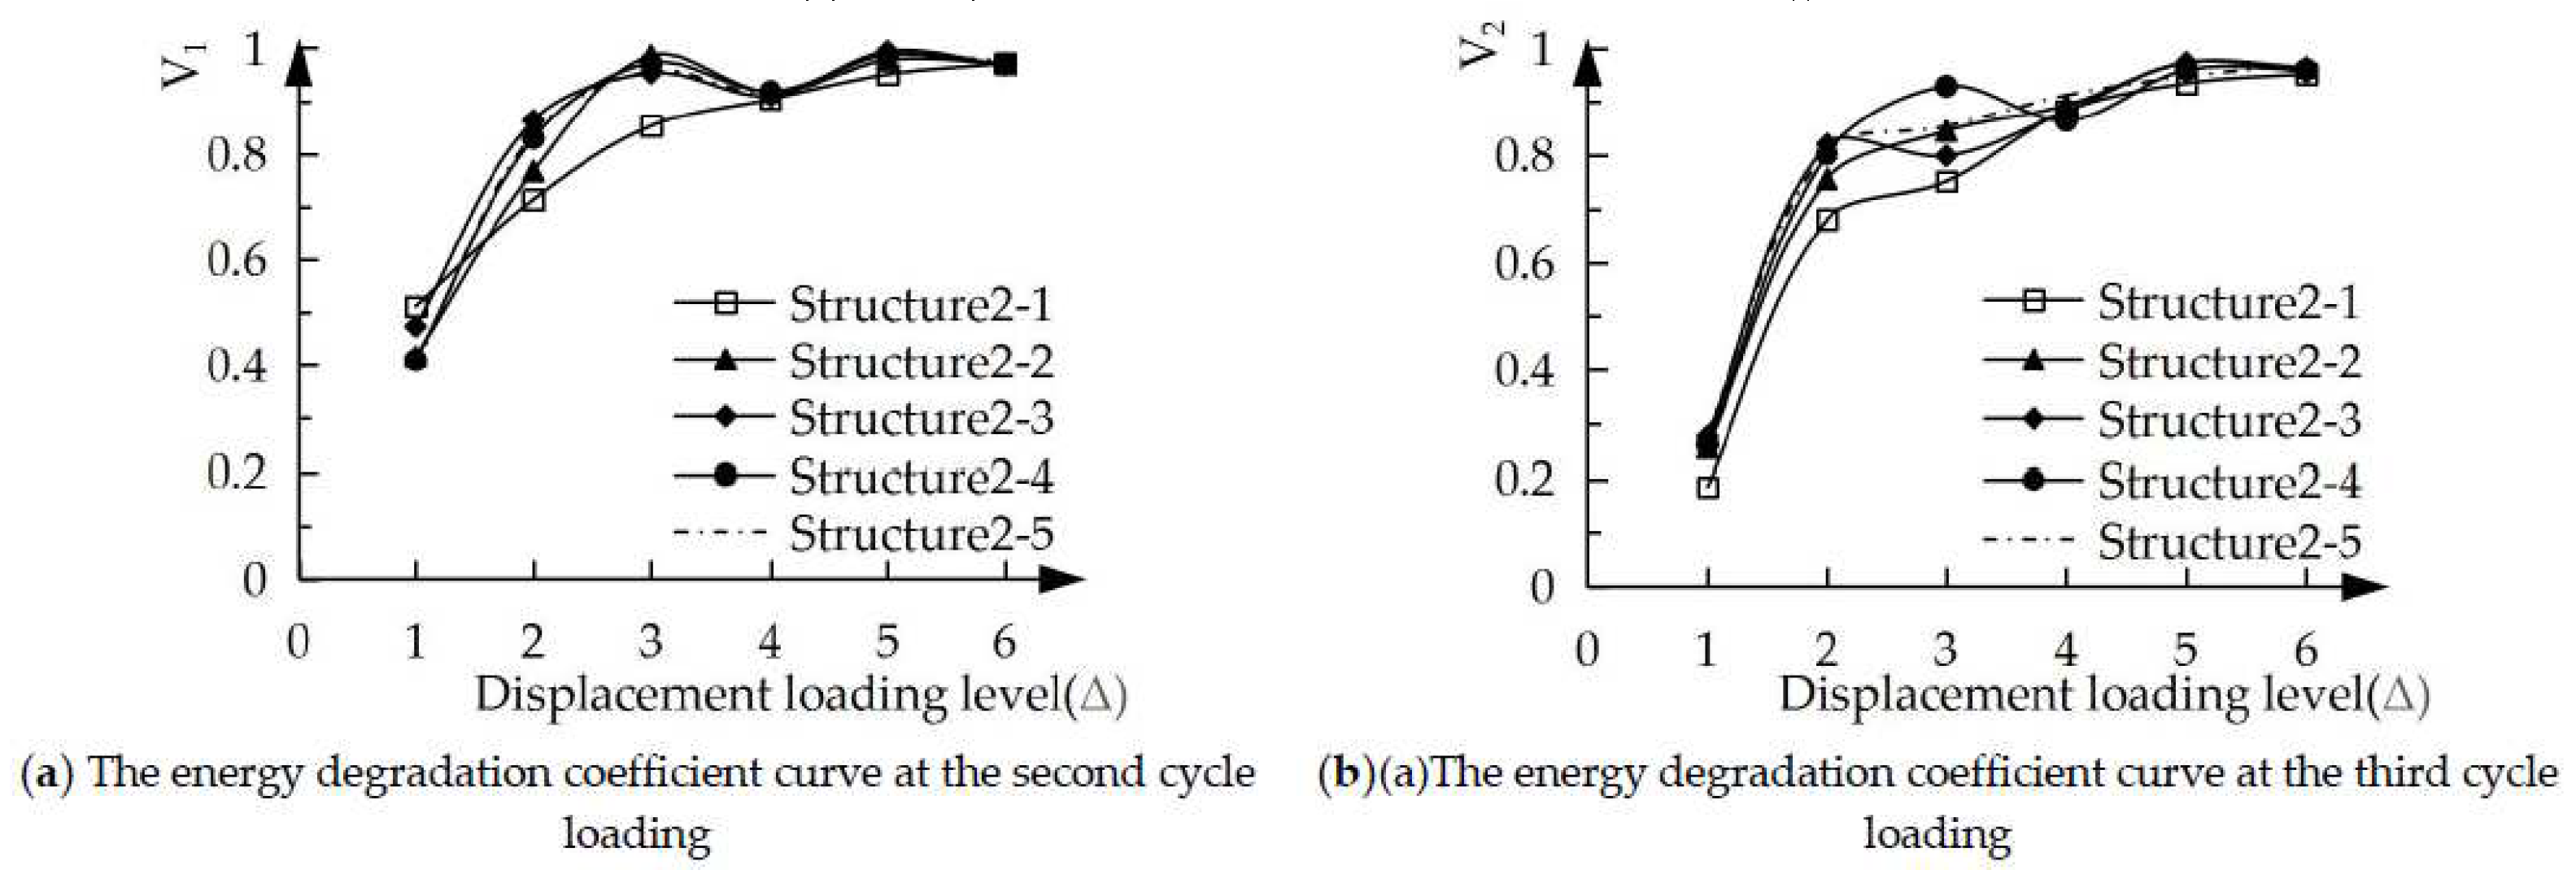
Figure 9.
The stiffness-displacement curves curves of the five structural specimens.
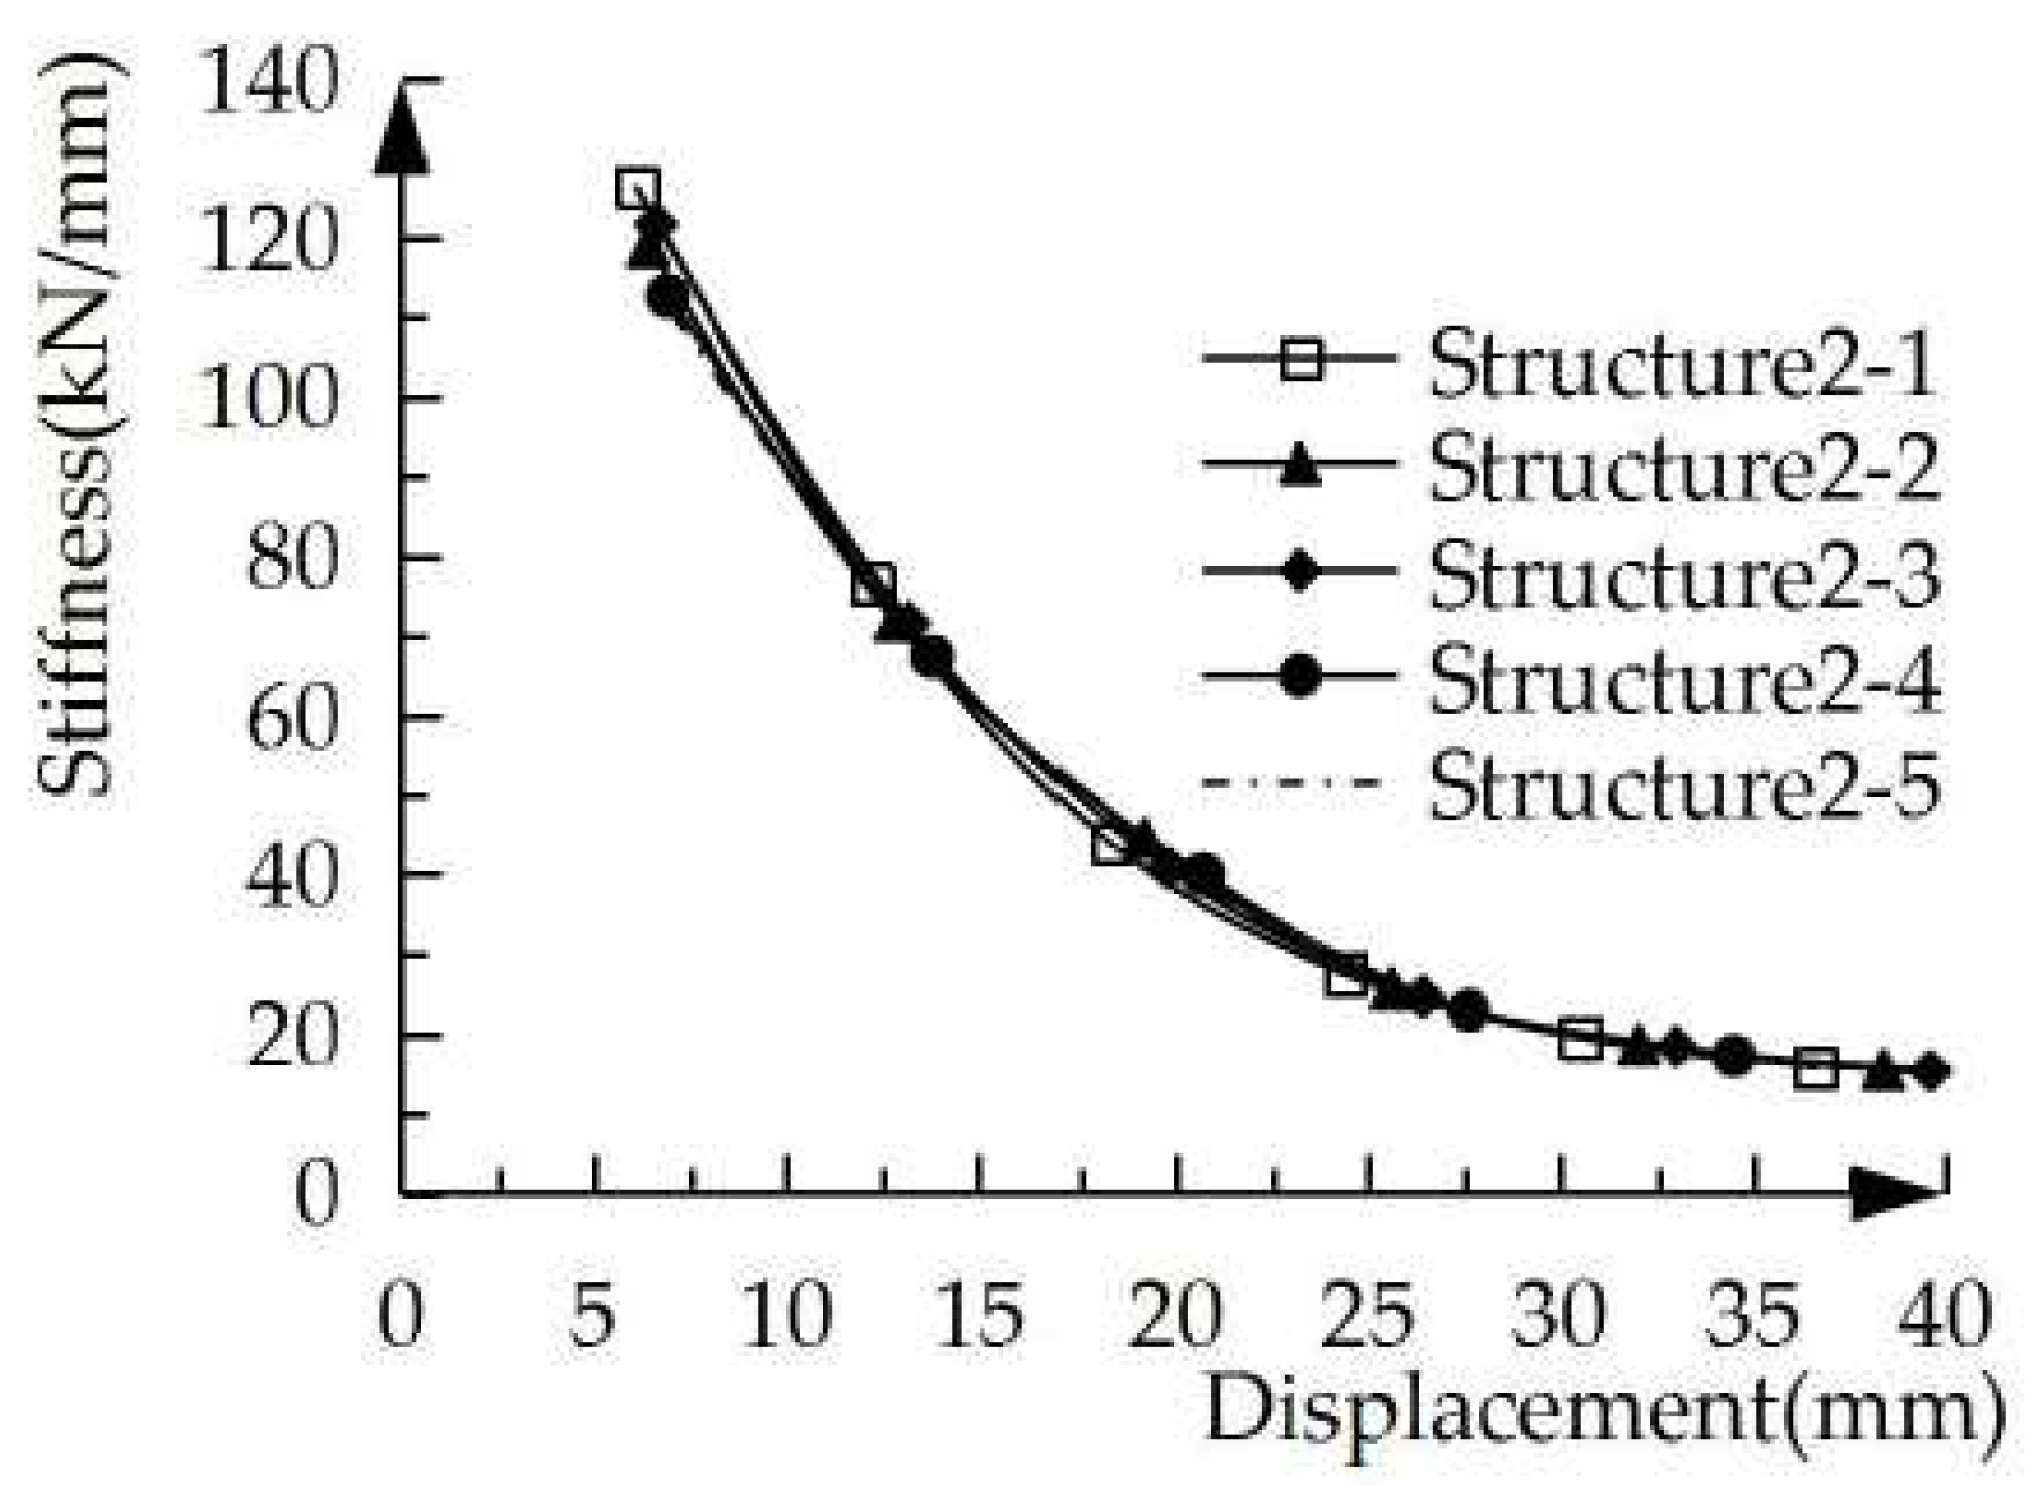
Figure 10.
Load-displacement curves of the specimens with different ECC strengths under unidirectional pushover.
Figure 10.
Load-displacement curves of the specimens with different ECC strengths under unidirectional pushover.
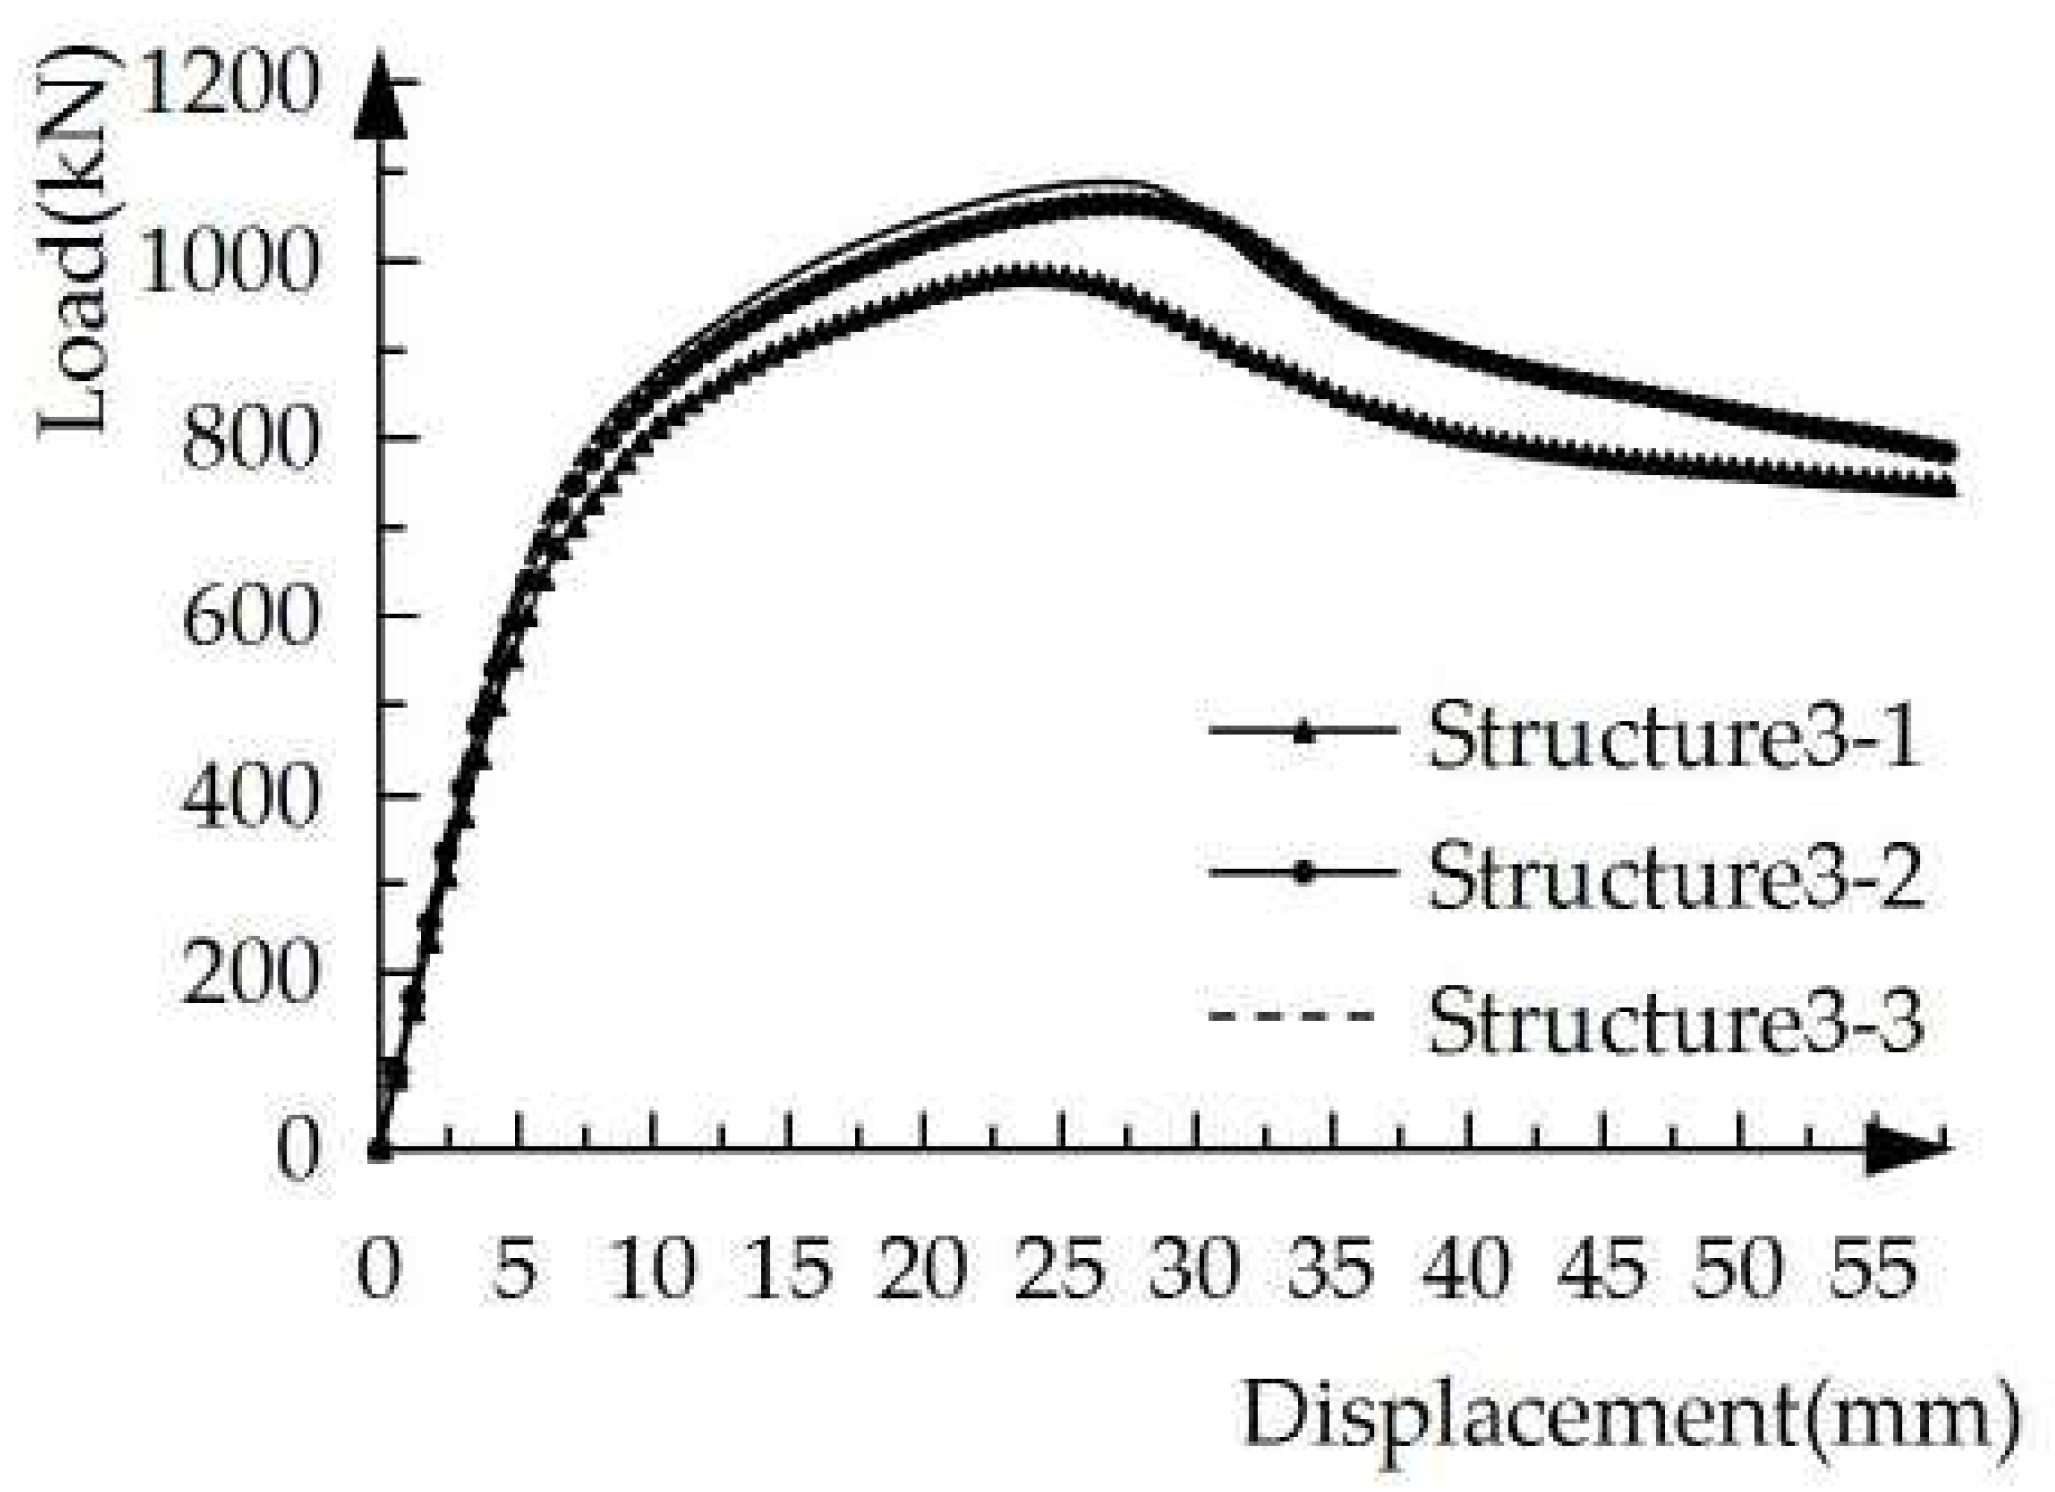
Figure 11.
Load-displacement hysteresis curves of the specimens with different ECC strengths under low cyclic loading.
Figure 11.
Load-displacement hysteresis curves of the specimens with different ECC strengths under low cyclic loading.
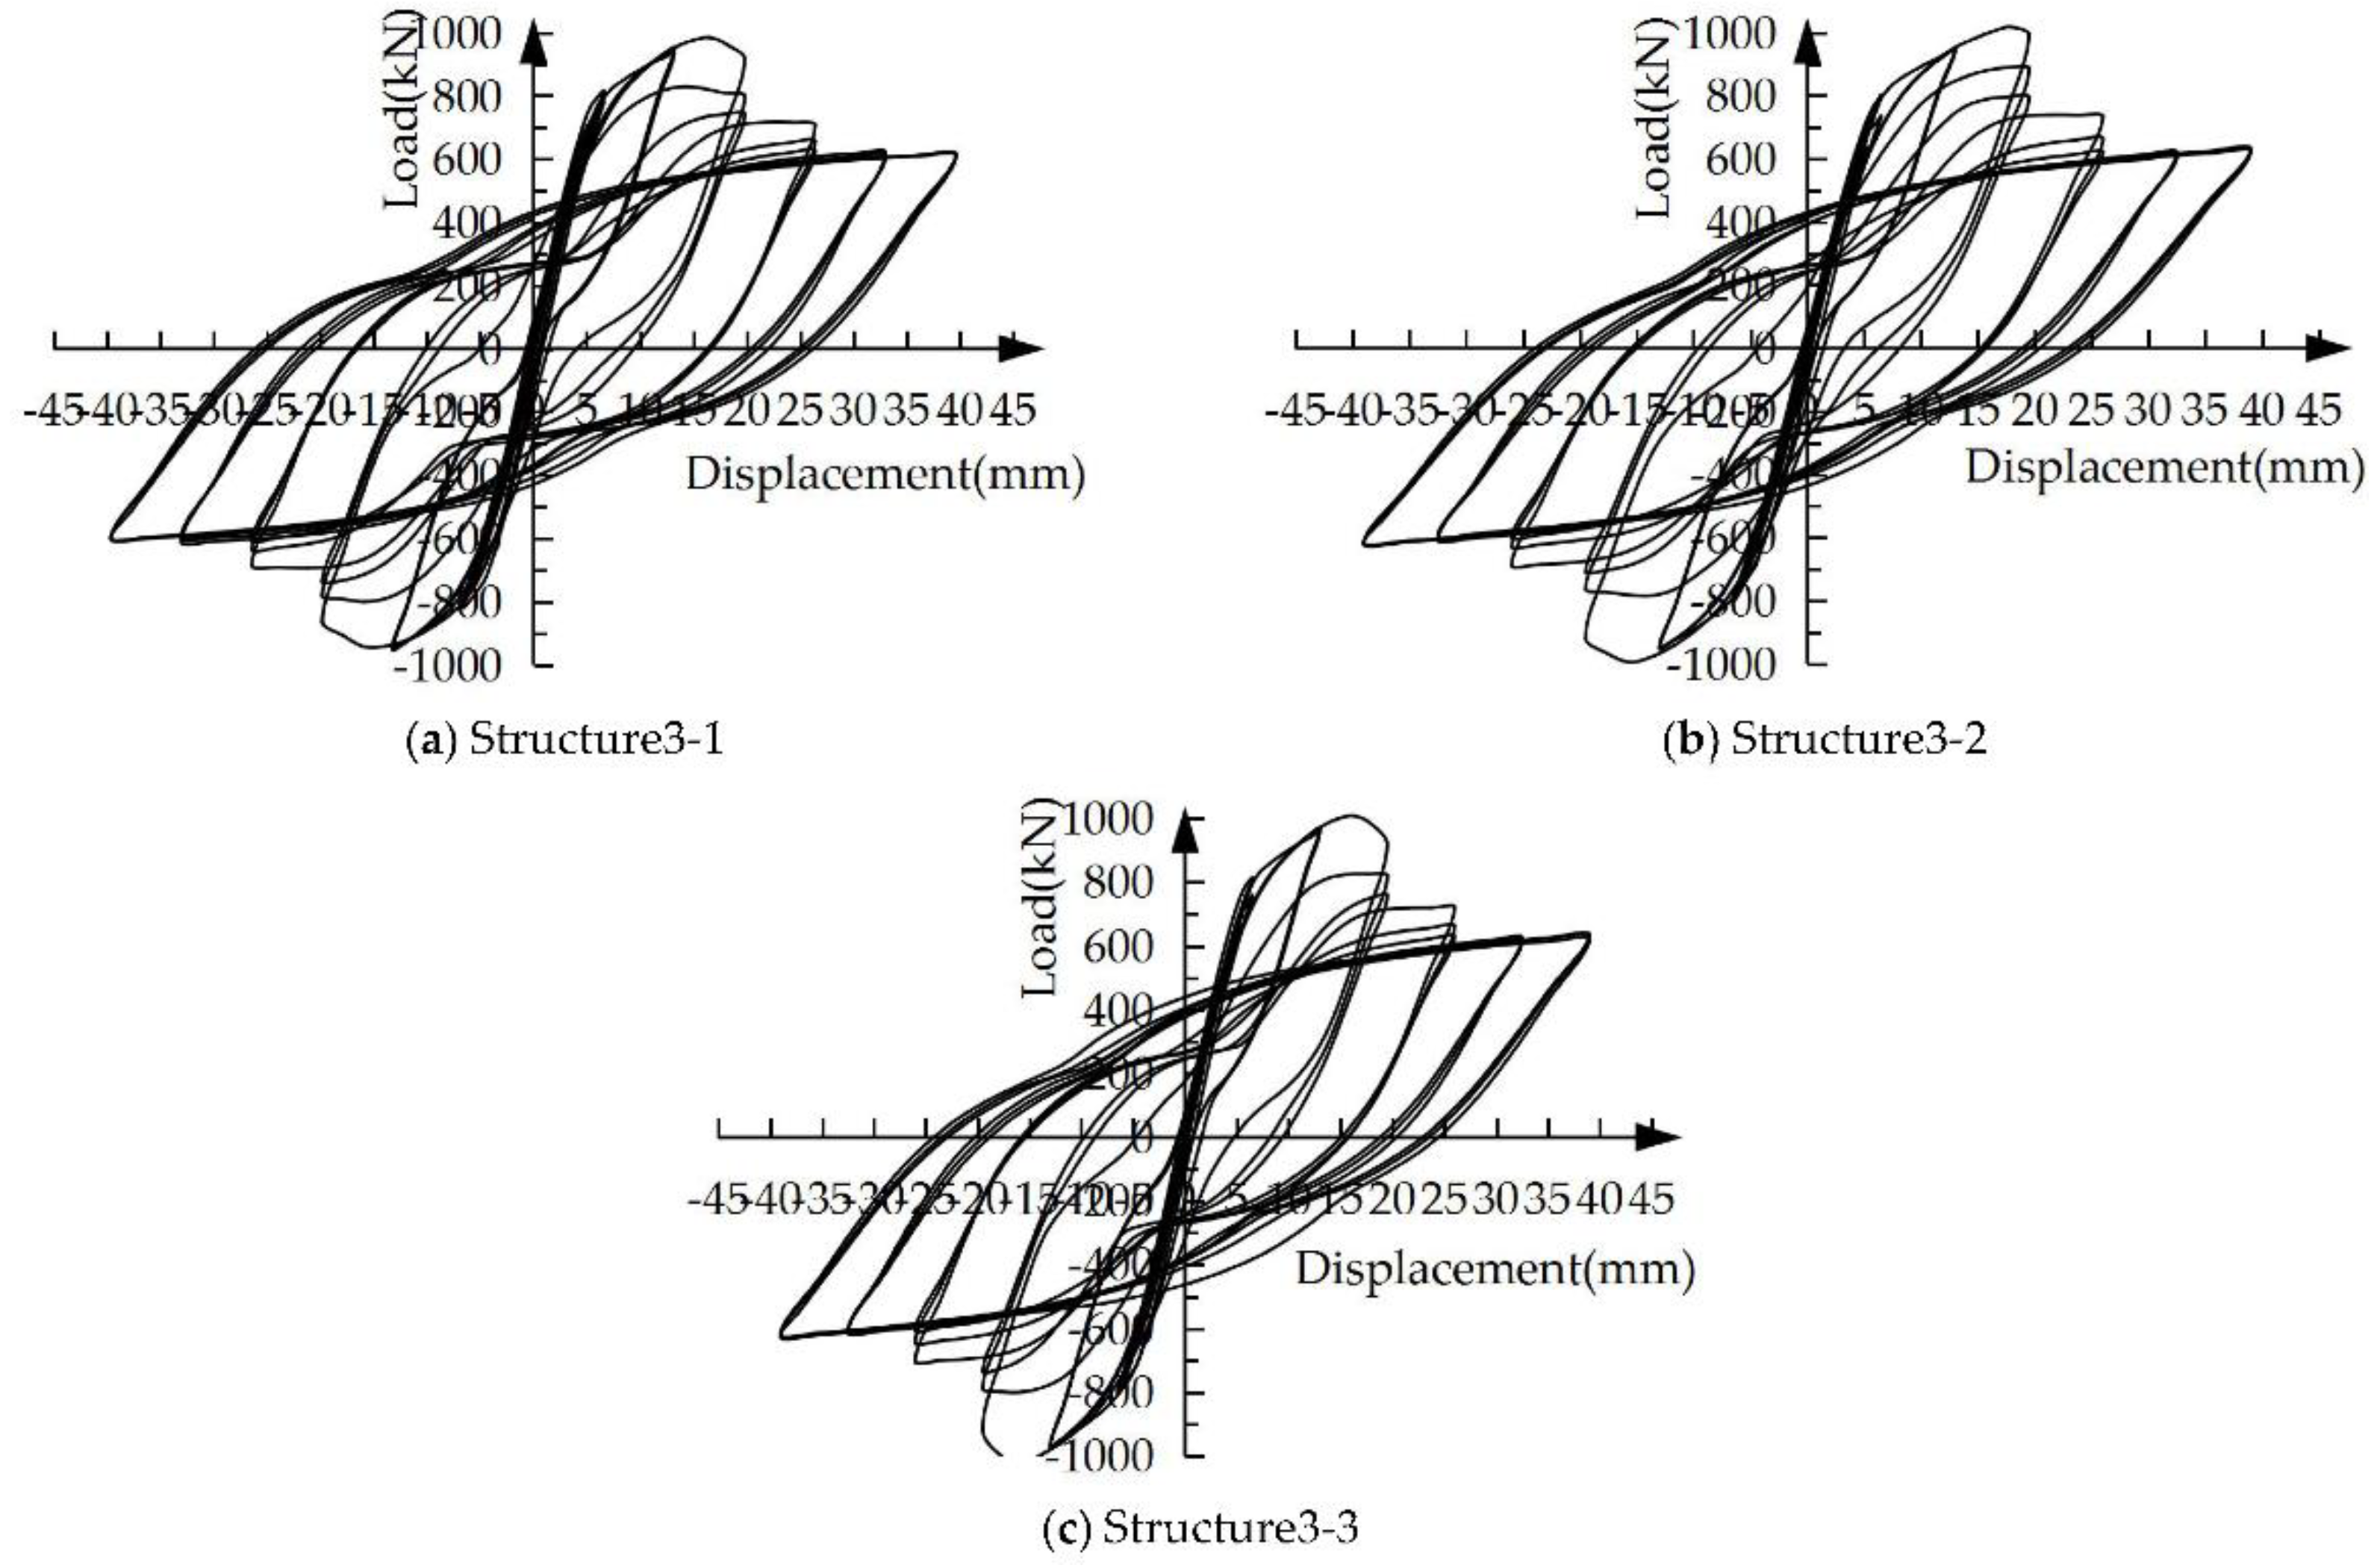
Figure 12.
One-cycle energy degradation coefficient curves of specimens with different ECC strength.
Figure 12.
One-cycle energy degradation coefficient curves of specimens with different ECC strength.
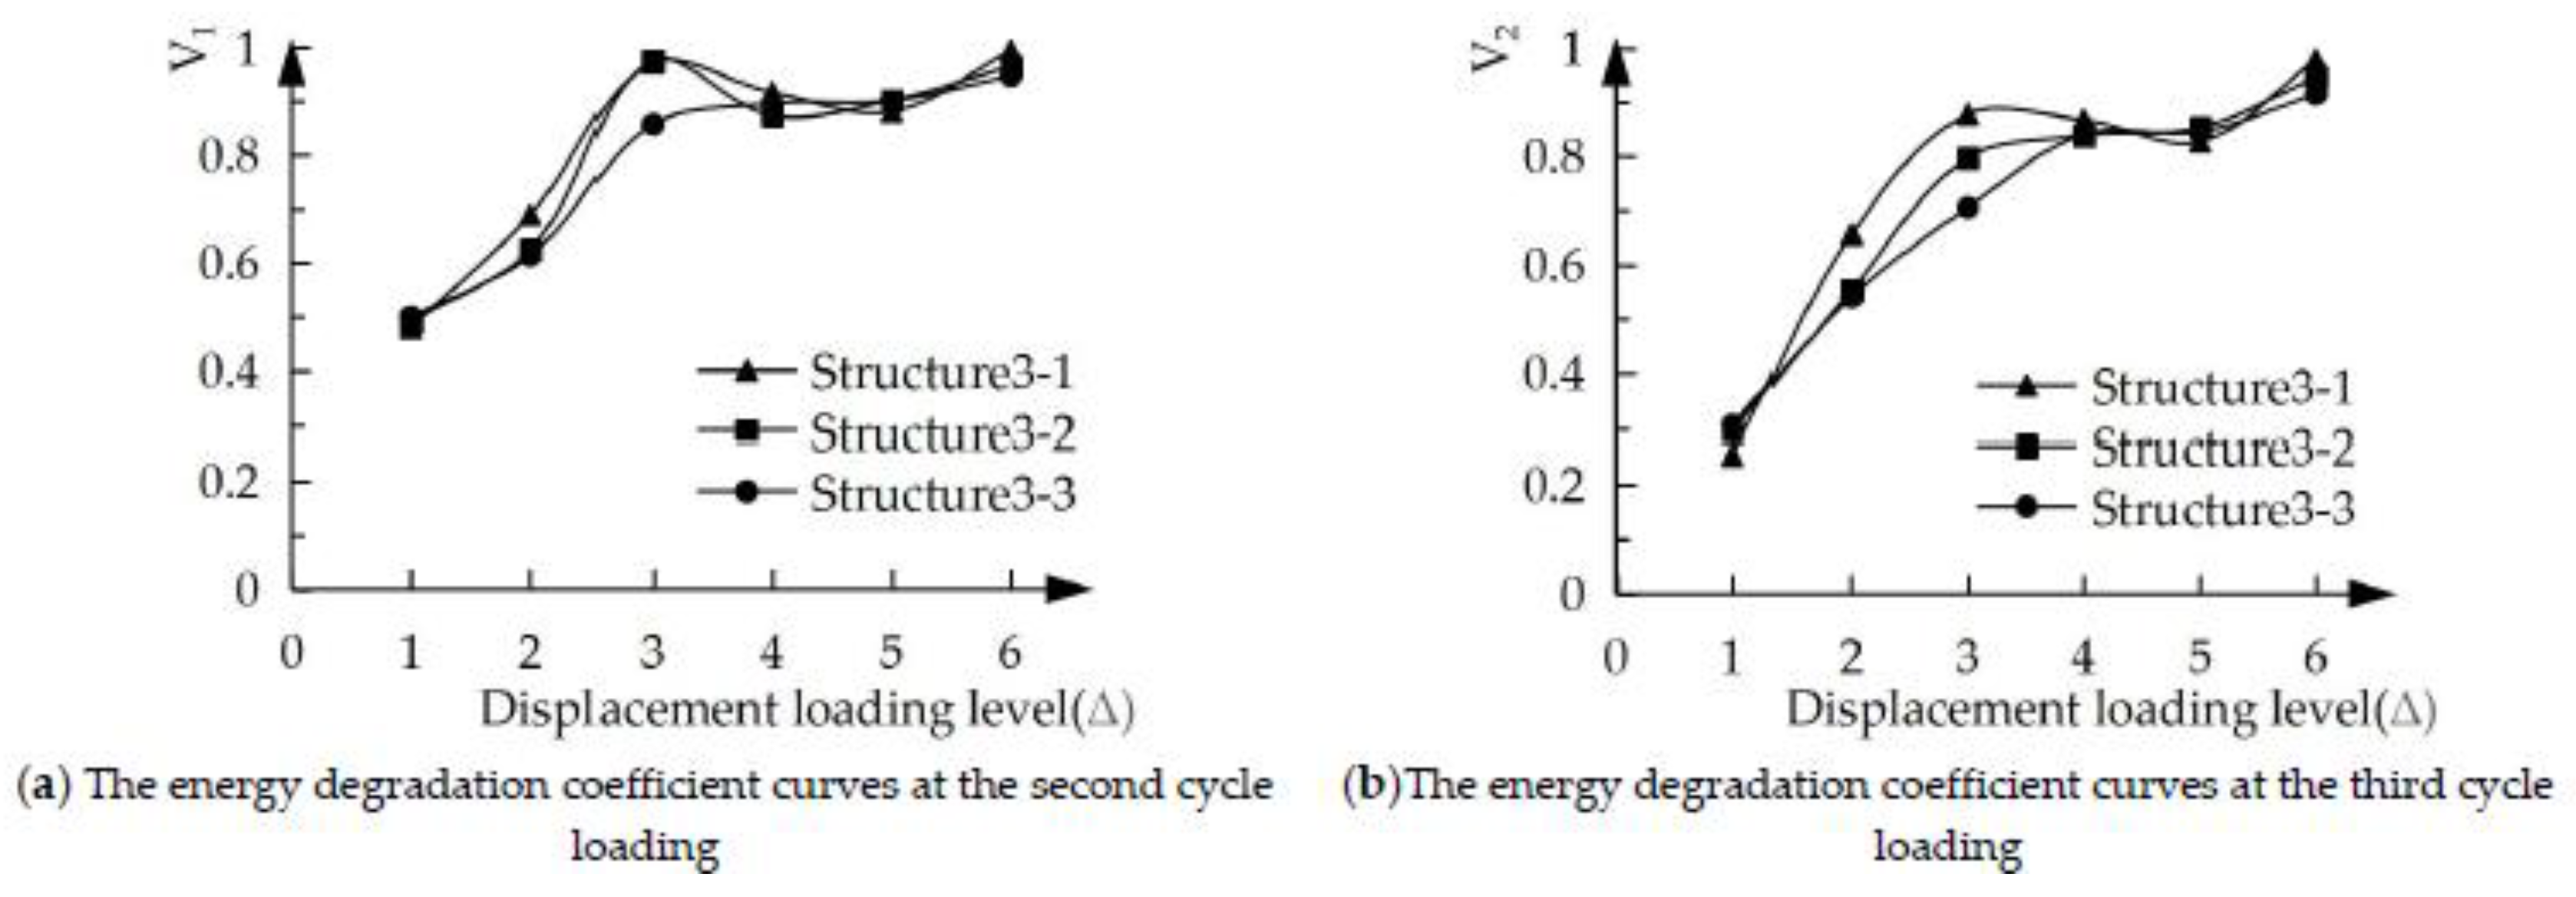
Figure 13.
Stiffness-displacement curves of the five spatial structure specimens.
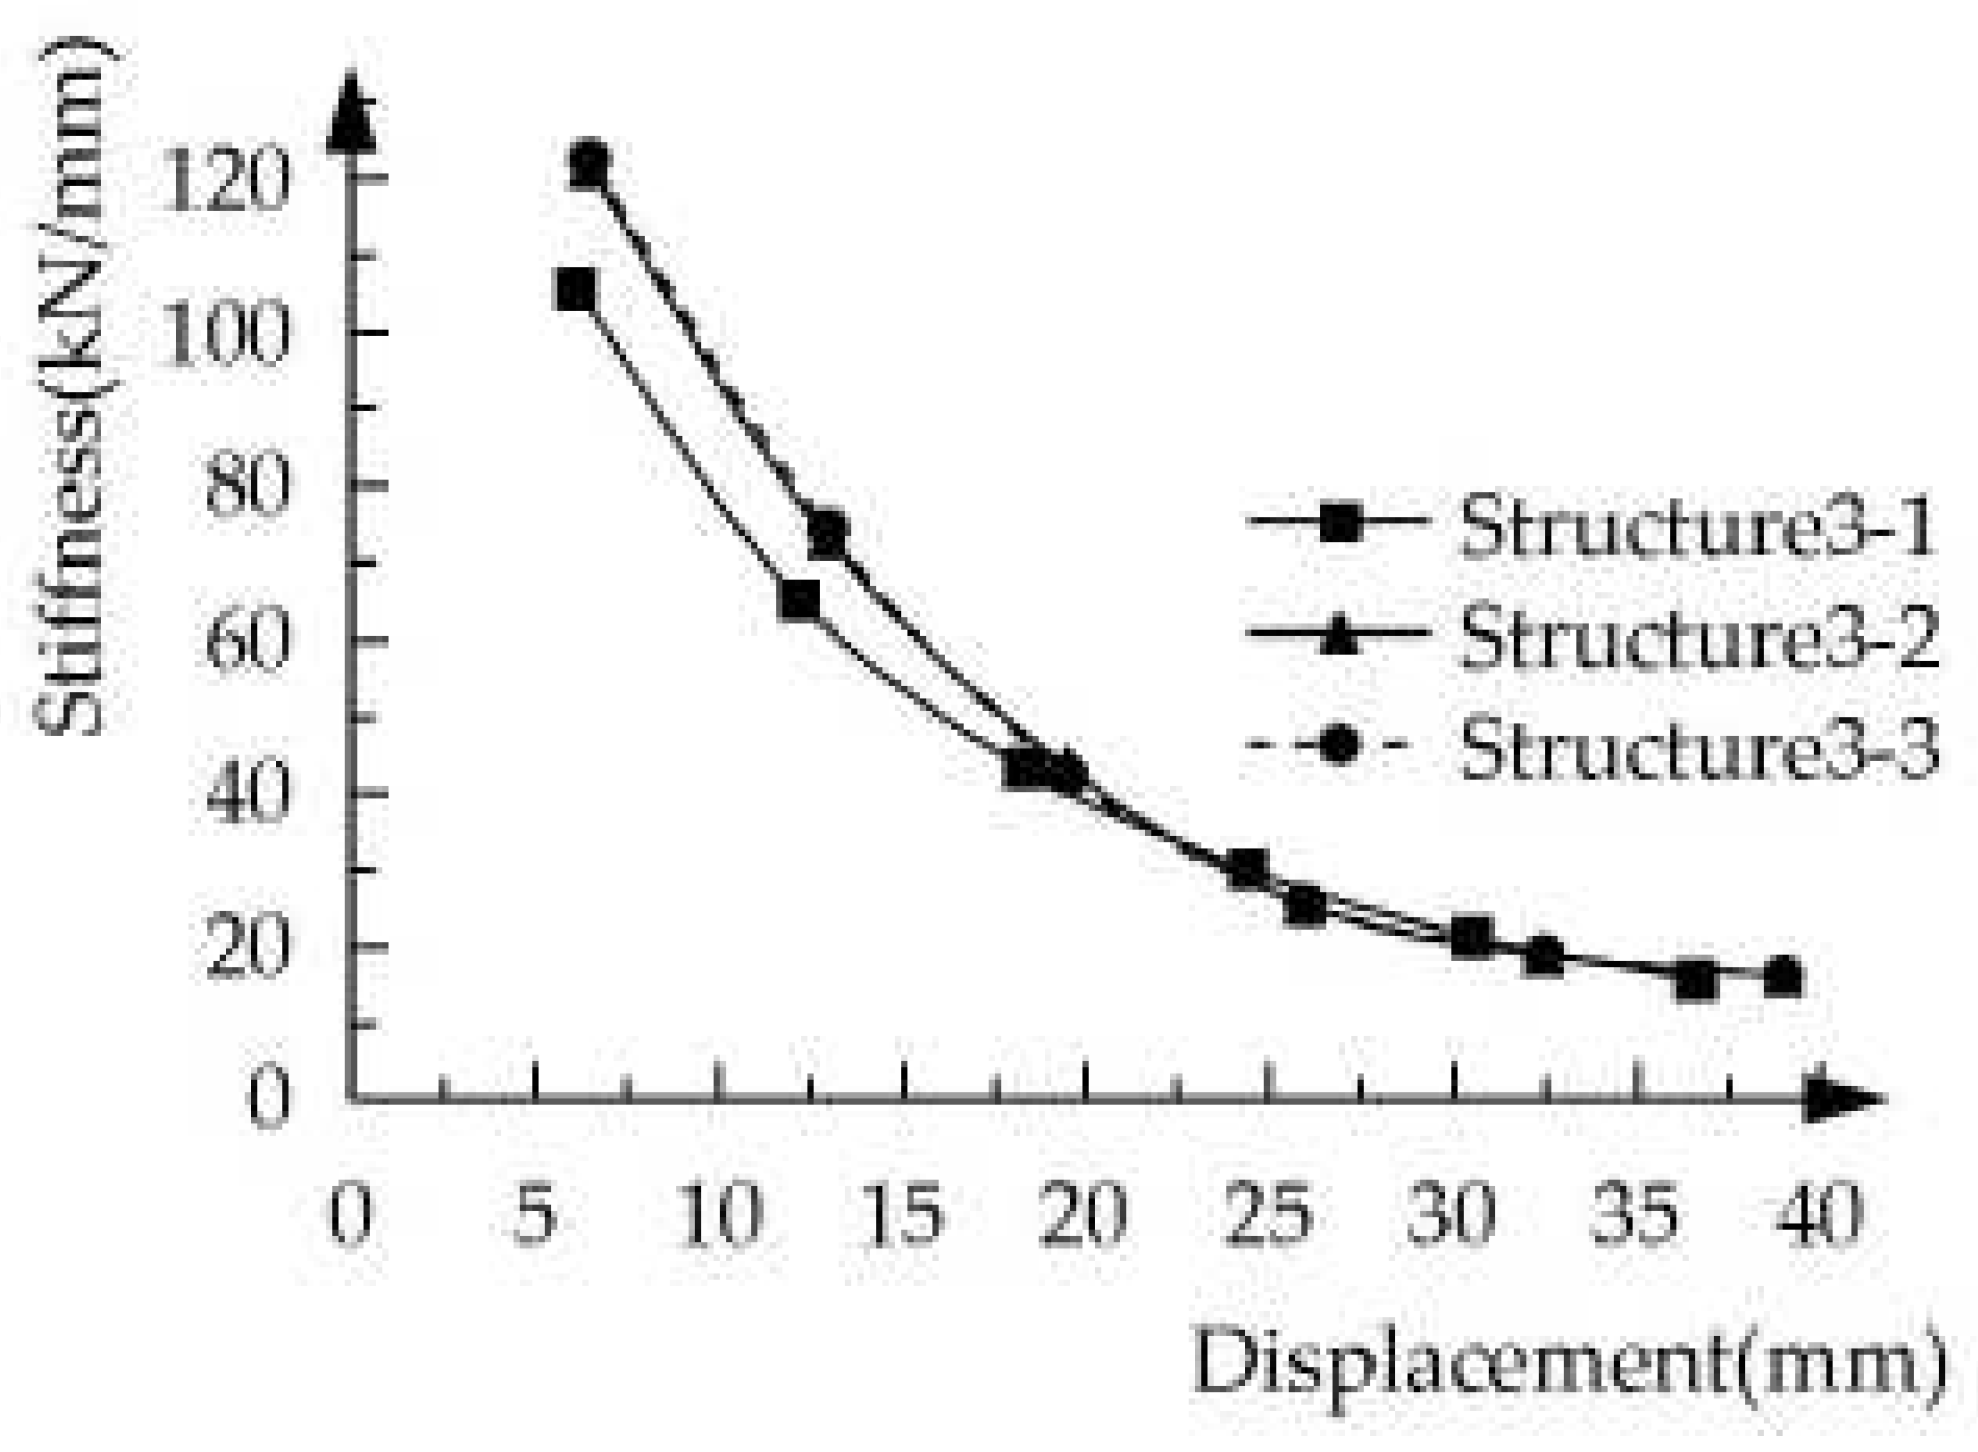
Figure 14.
Load-displacement curves of structural specimens with different stirrup ratio of coupling beams under unidirectional pushover.
Figure 14.
Load-displacement curves of structural specimens with different stirrup ratio of coupling beams under unidirectional pushover.
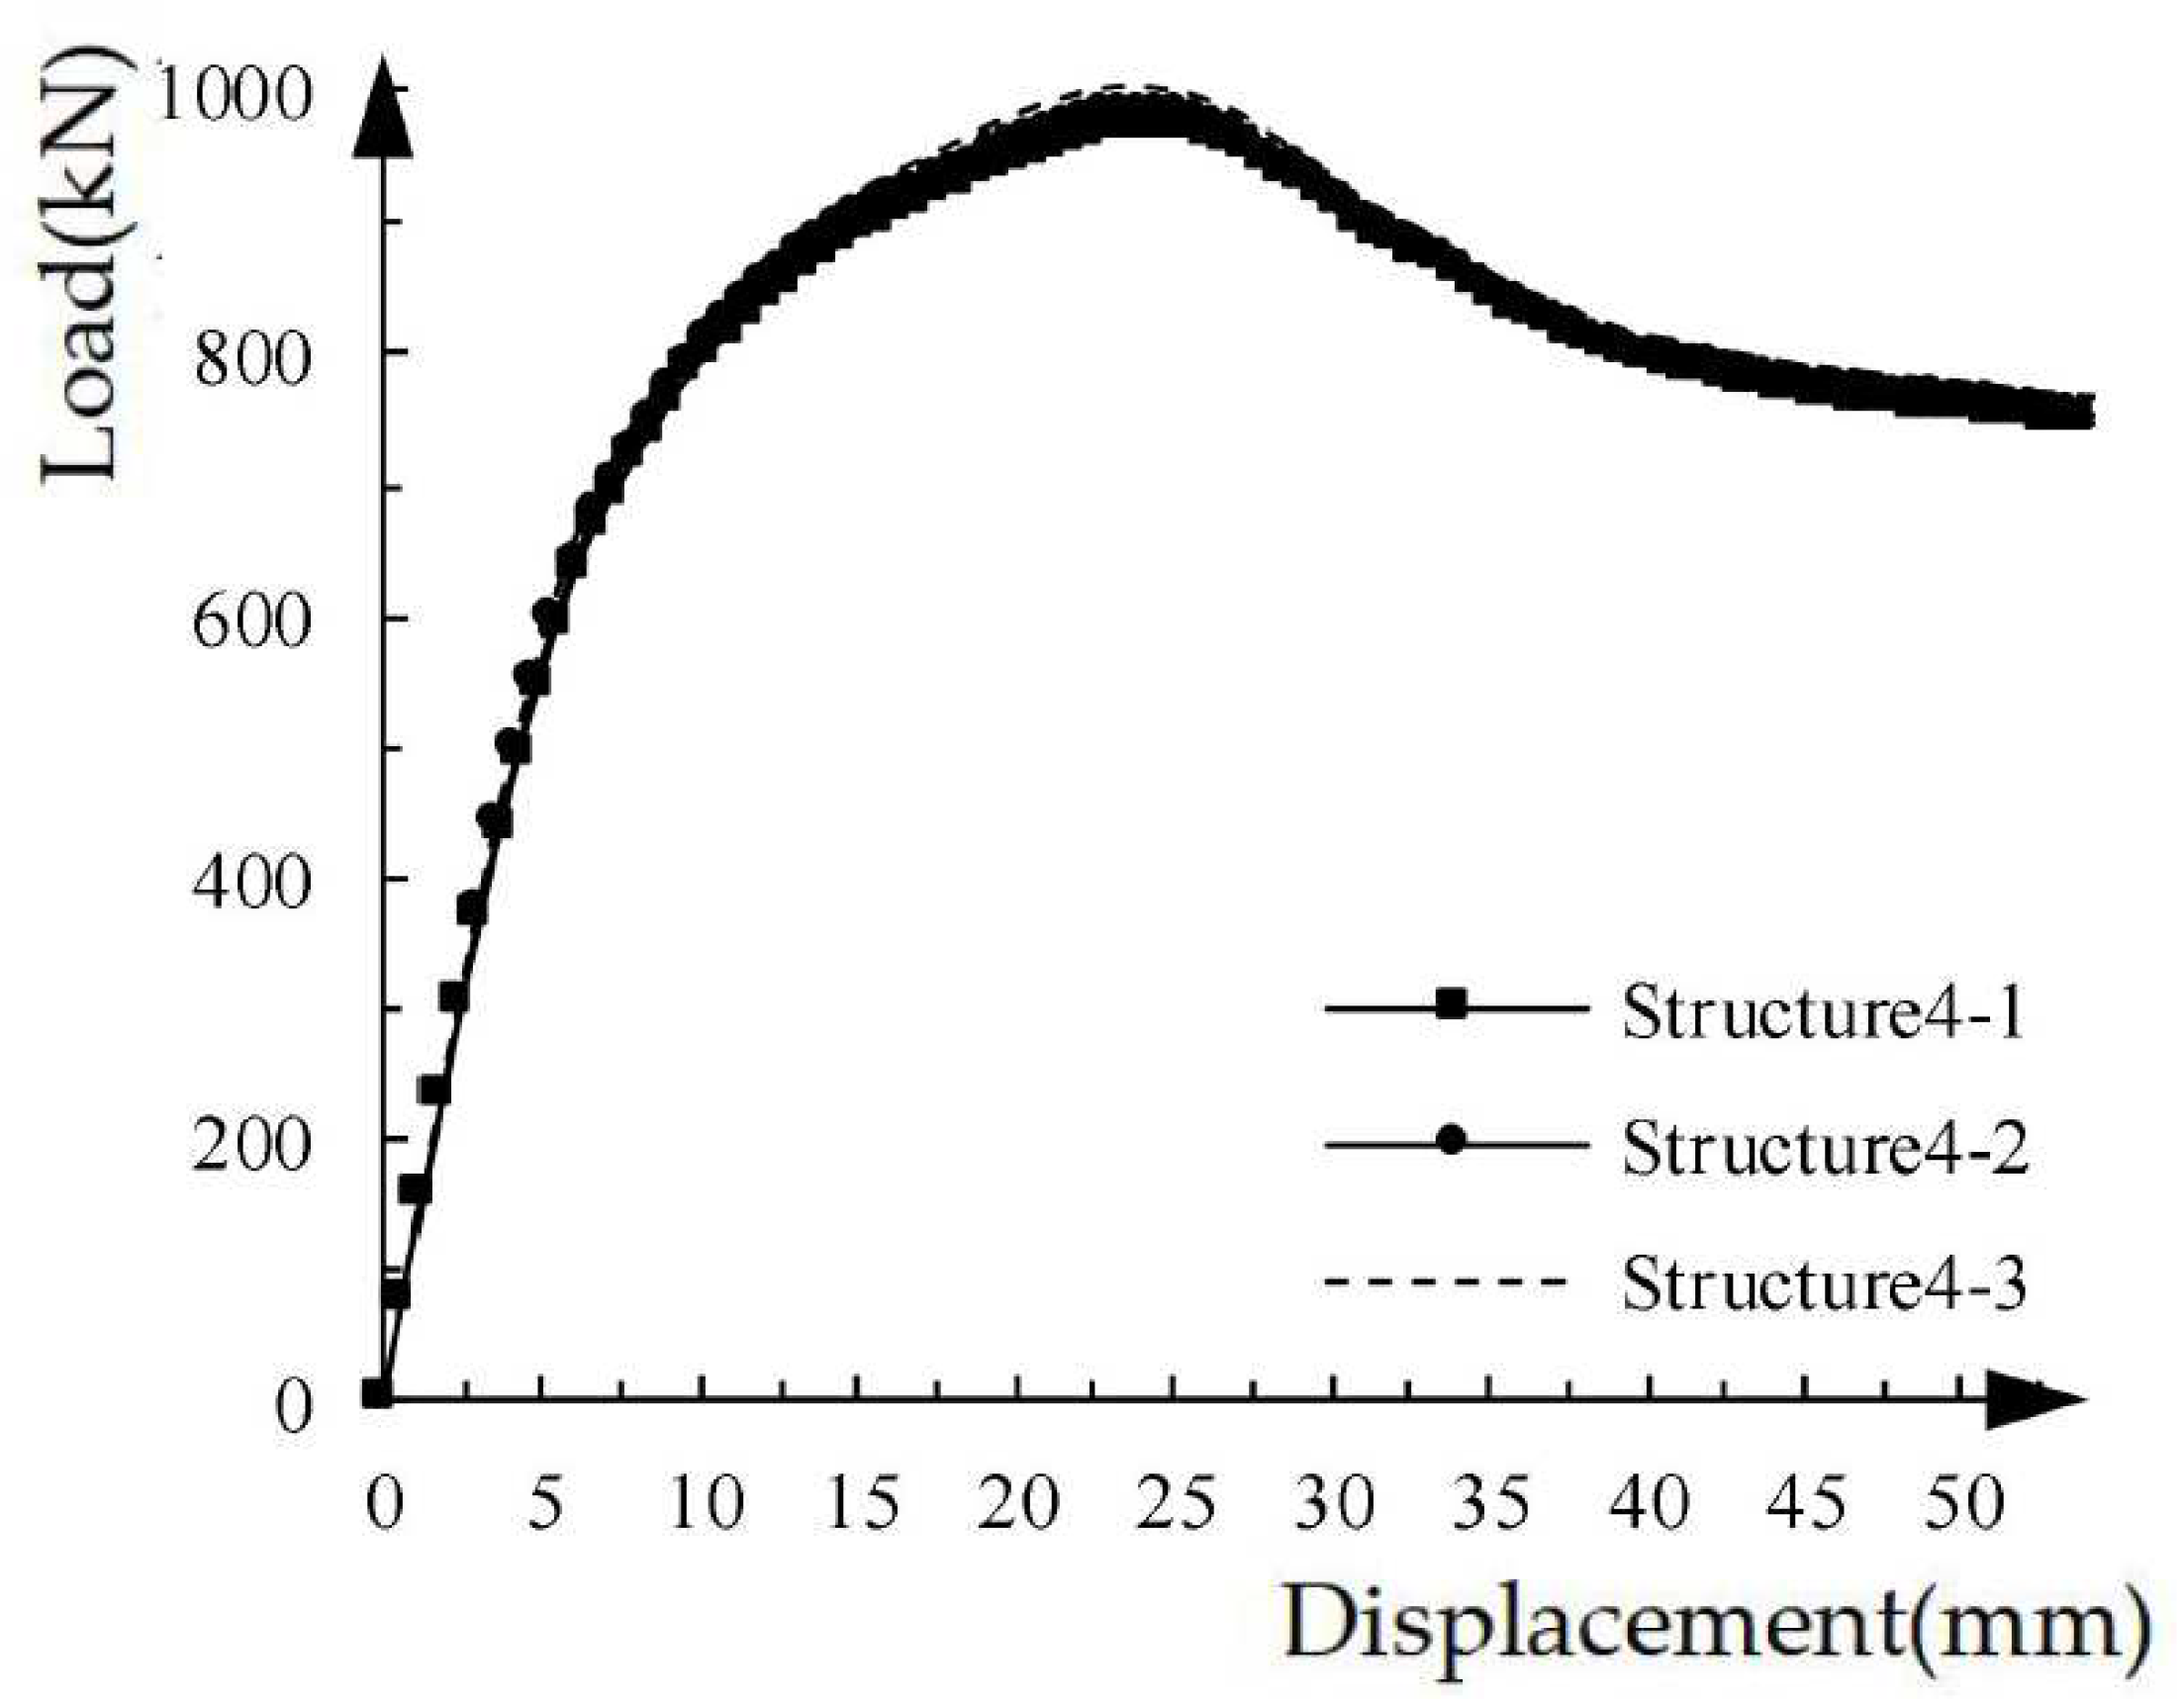
Figure 15.
Load-displacement hysteresis curves of the structural specimens with different stirrup ratios of coupling beams under low cyclic loading.
Figure 15.
Load-displacement hysteresis curves of the structural specimens with different stirrup ratios of coupling beams under low cyclic loading.
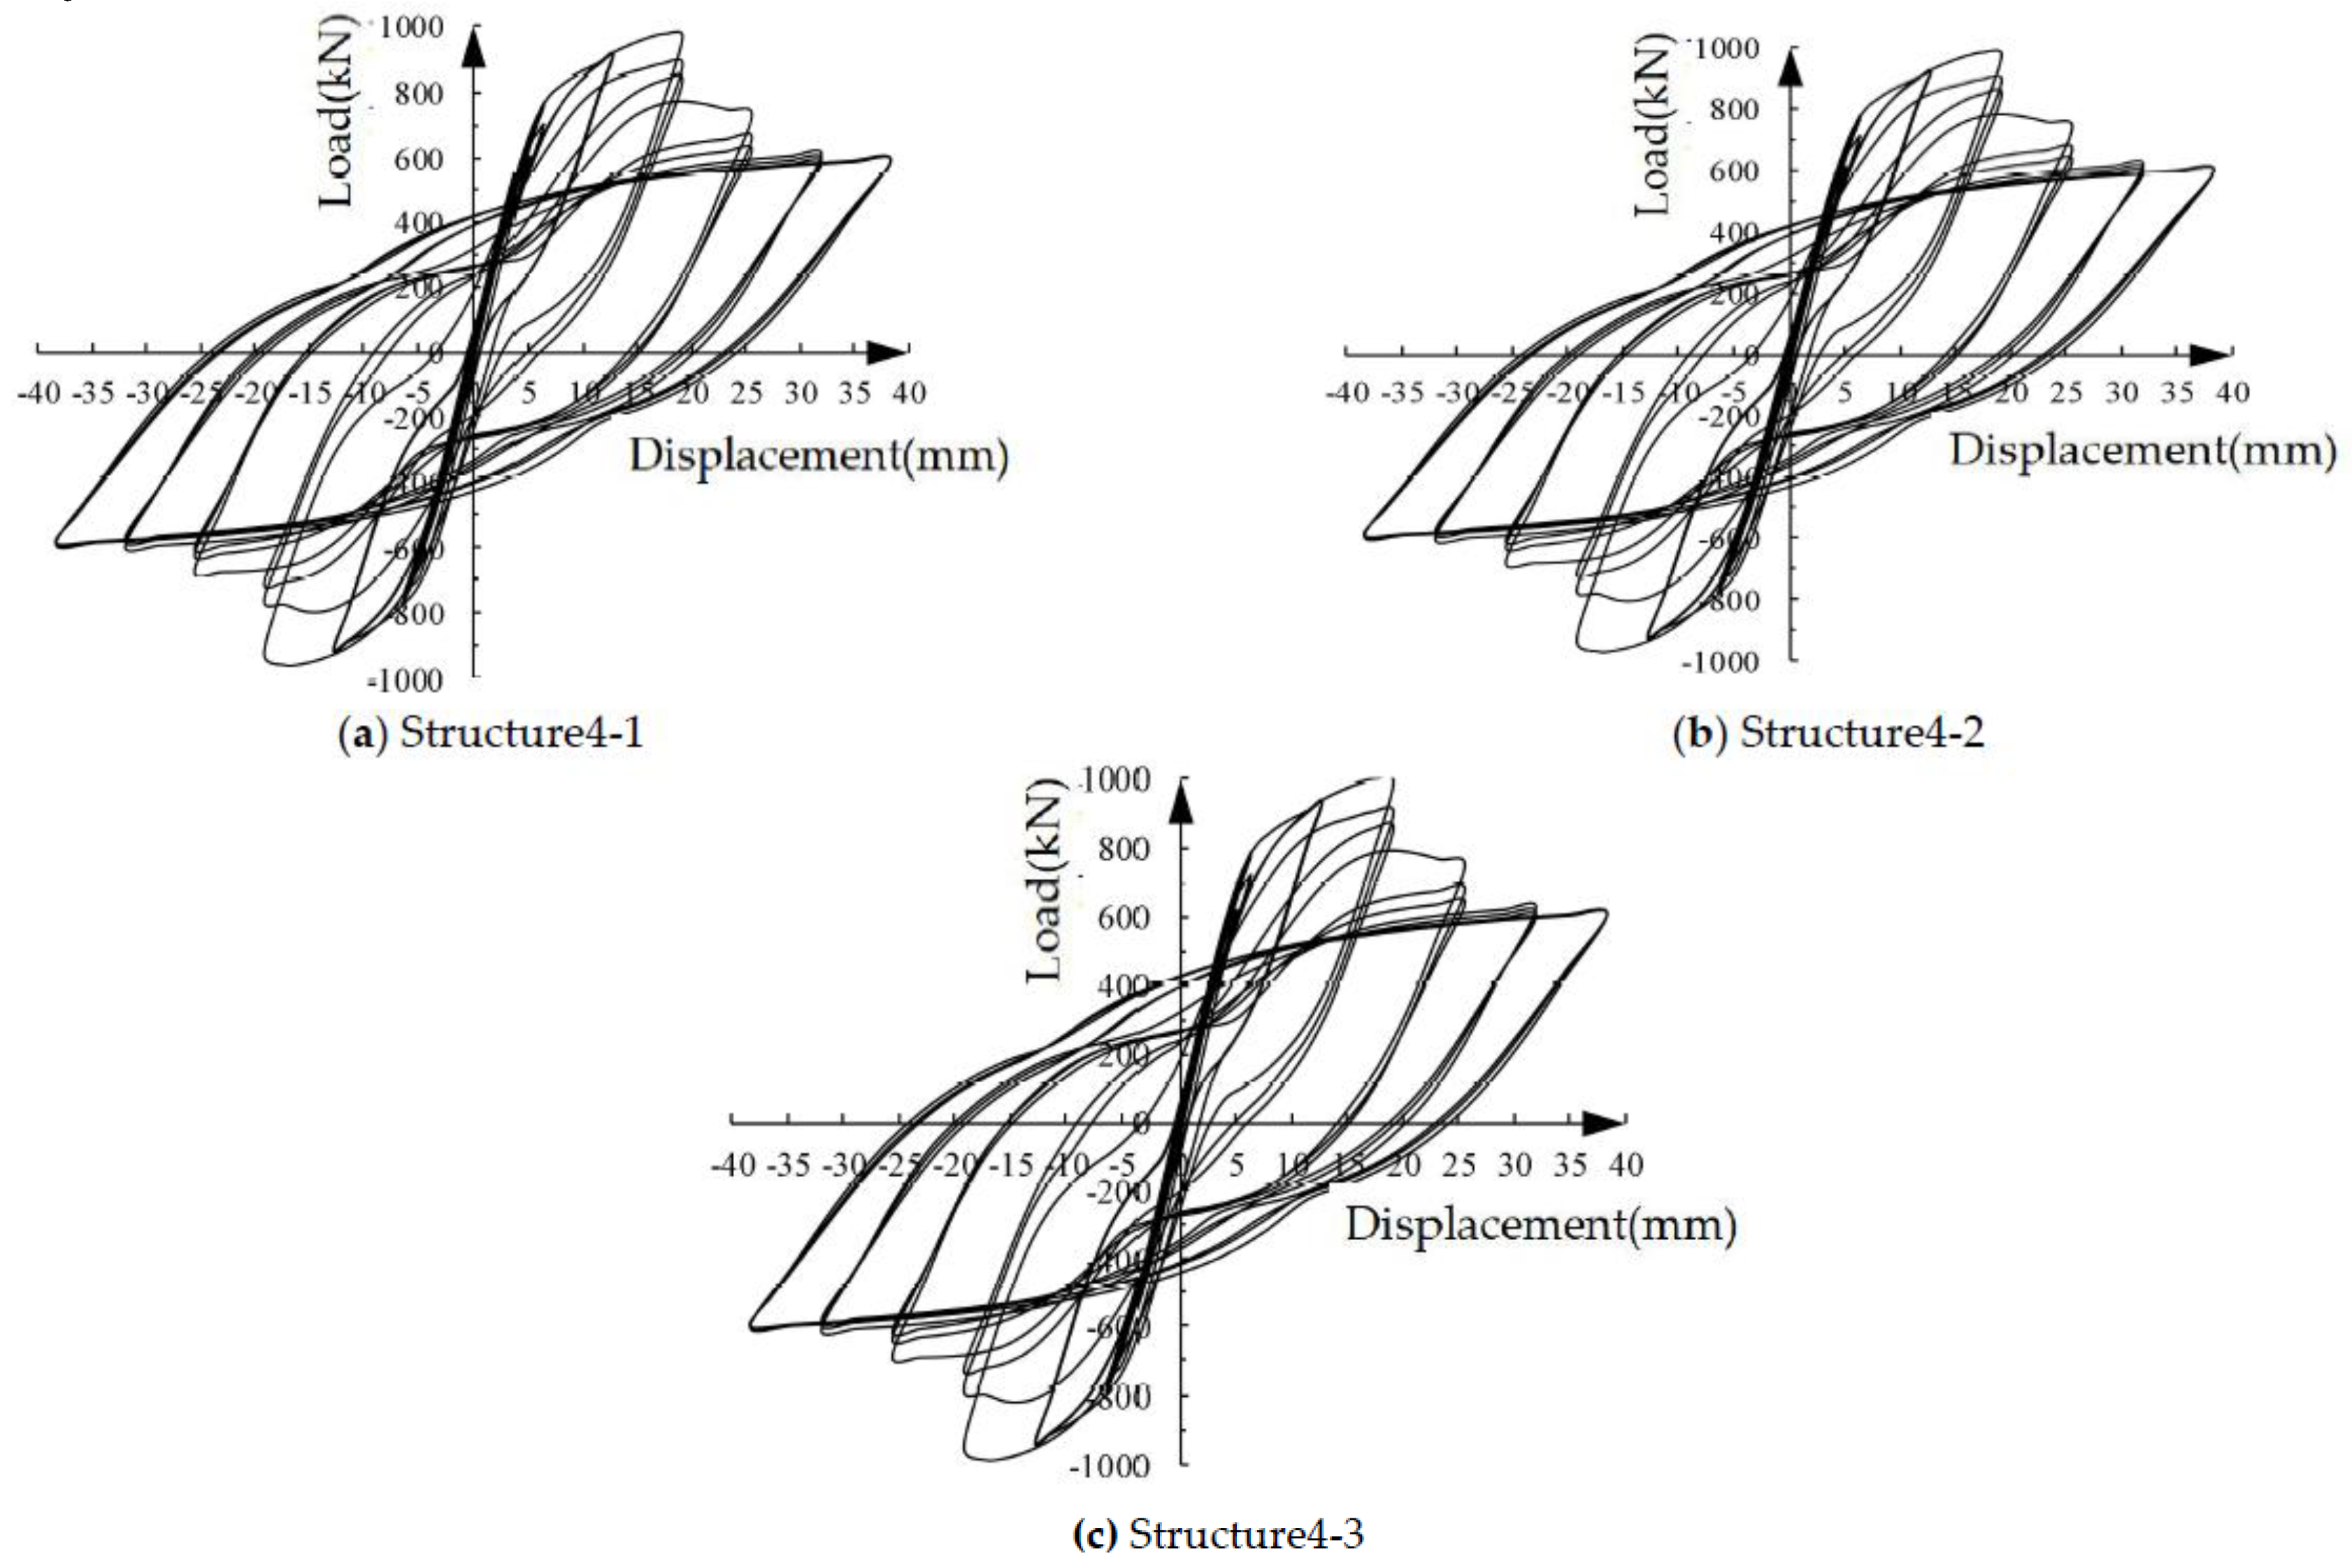
Figure 16.
One-cycle energy degradation coefficient curves of specimens with different stirrup ratios of coupling beams.
Figure 16.
One-cycle energy degradation coefficient curves of specimens with different stirrup ratios of coupling beams.
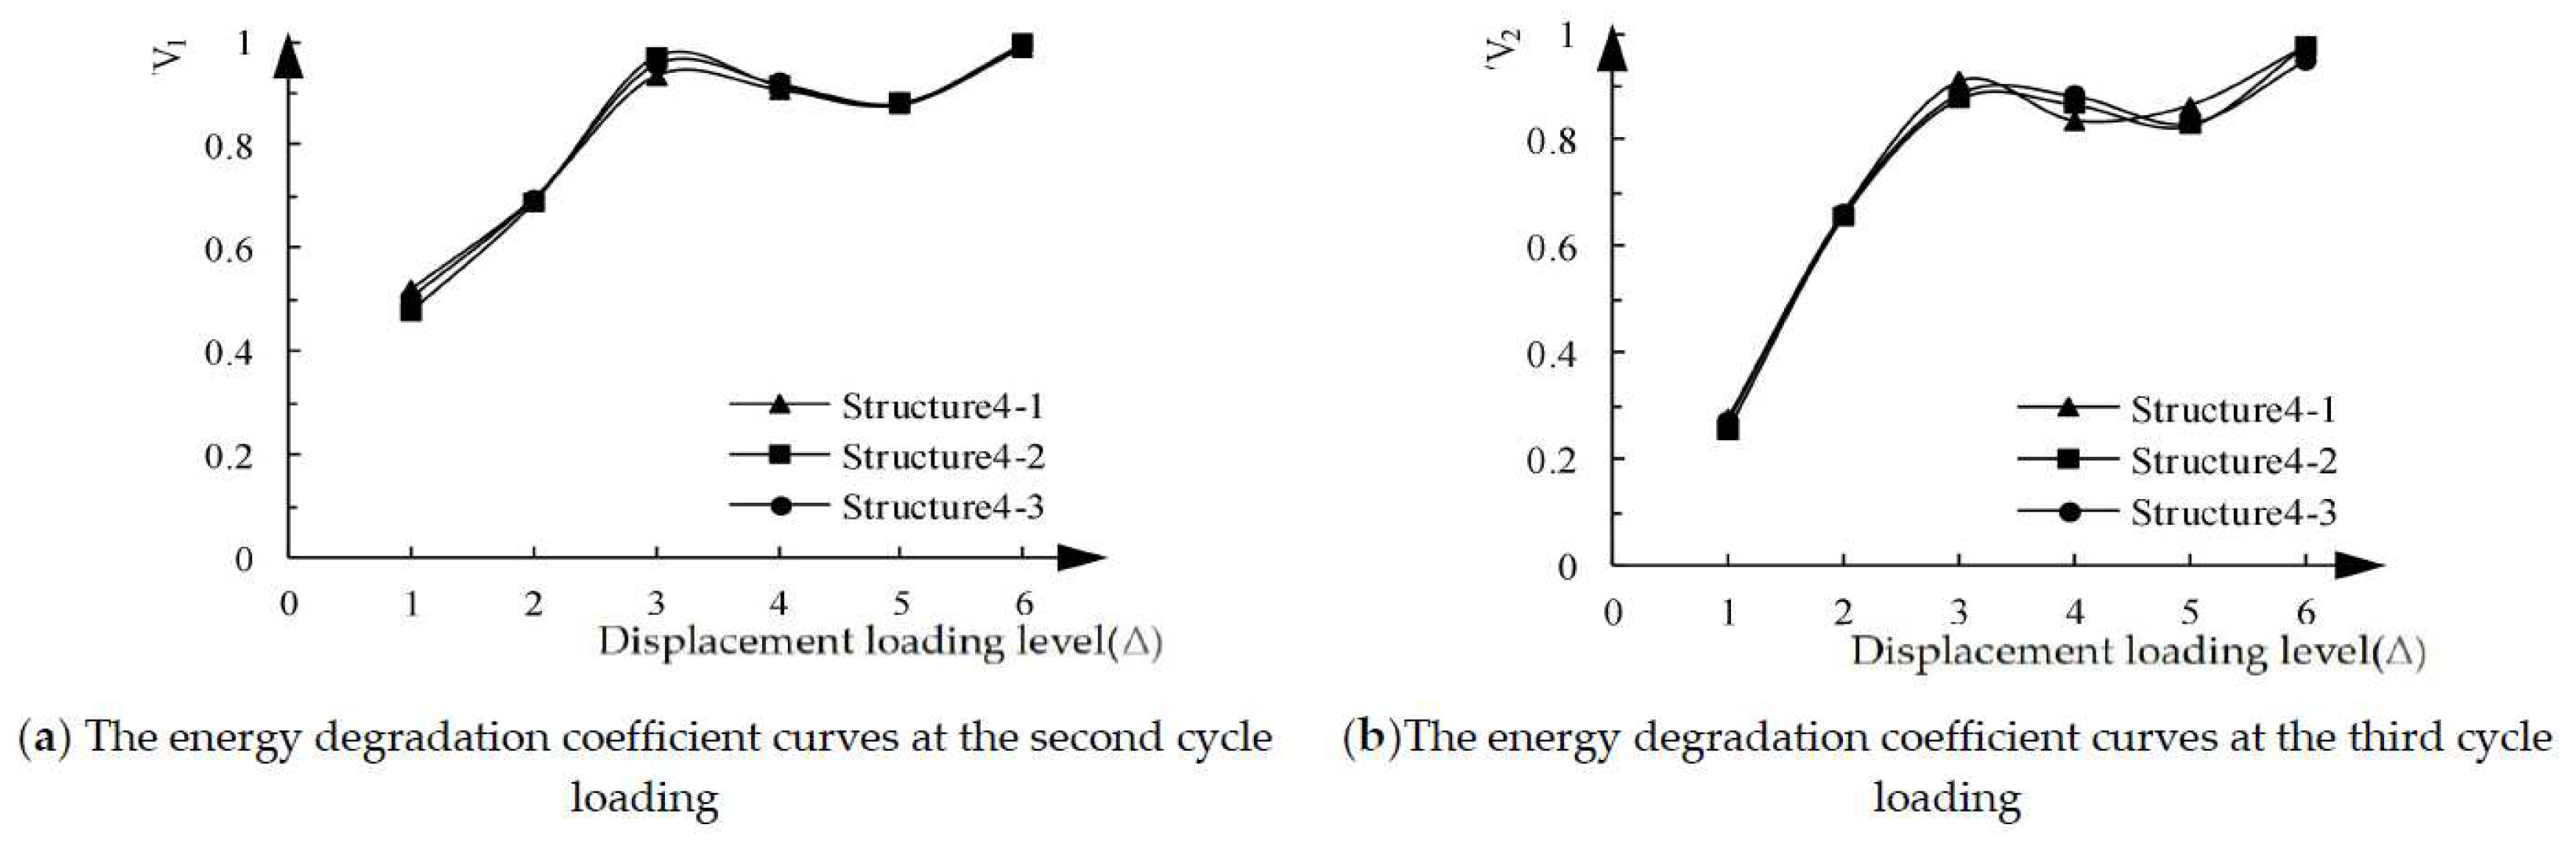
Figure 17.
Stiffness-displacement curves of spatial structure specimens with different coupling beam stirrup ratios.
Figure 17.
Stiffness-displacement curves of spatial structure specimens with different coupling beam stirrup ratios.
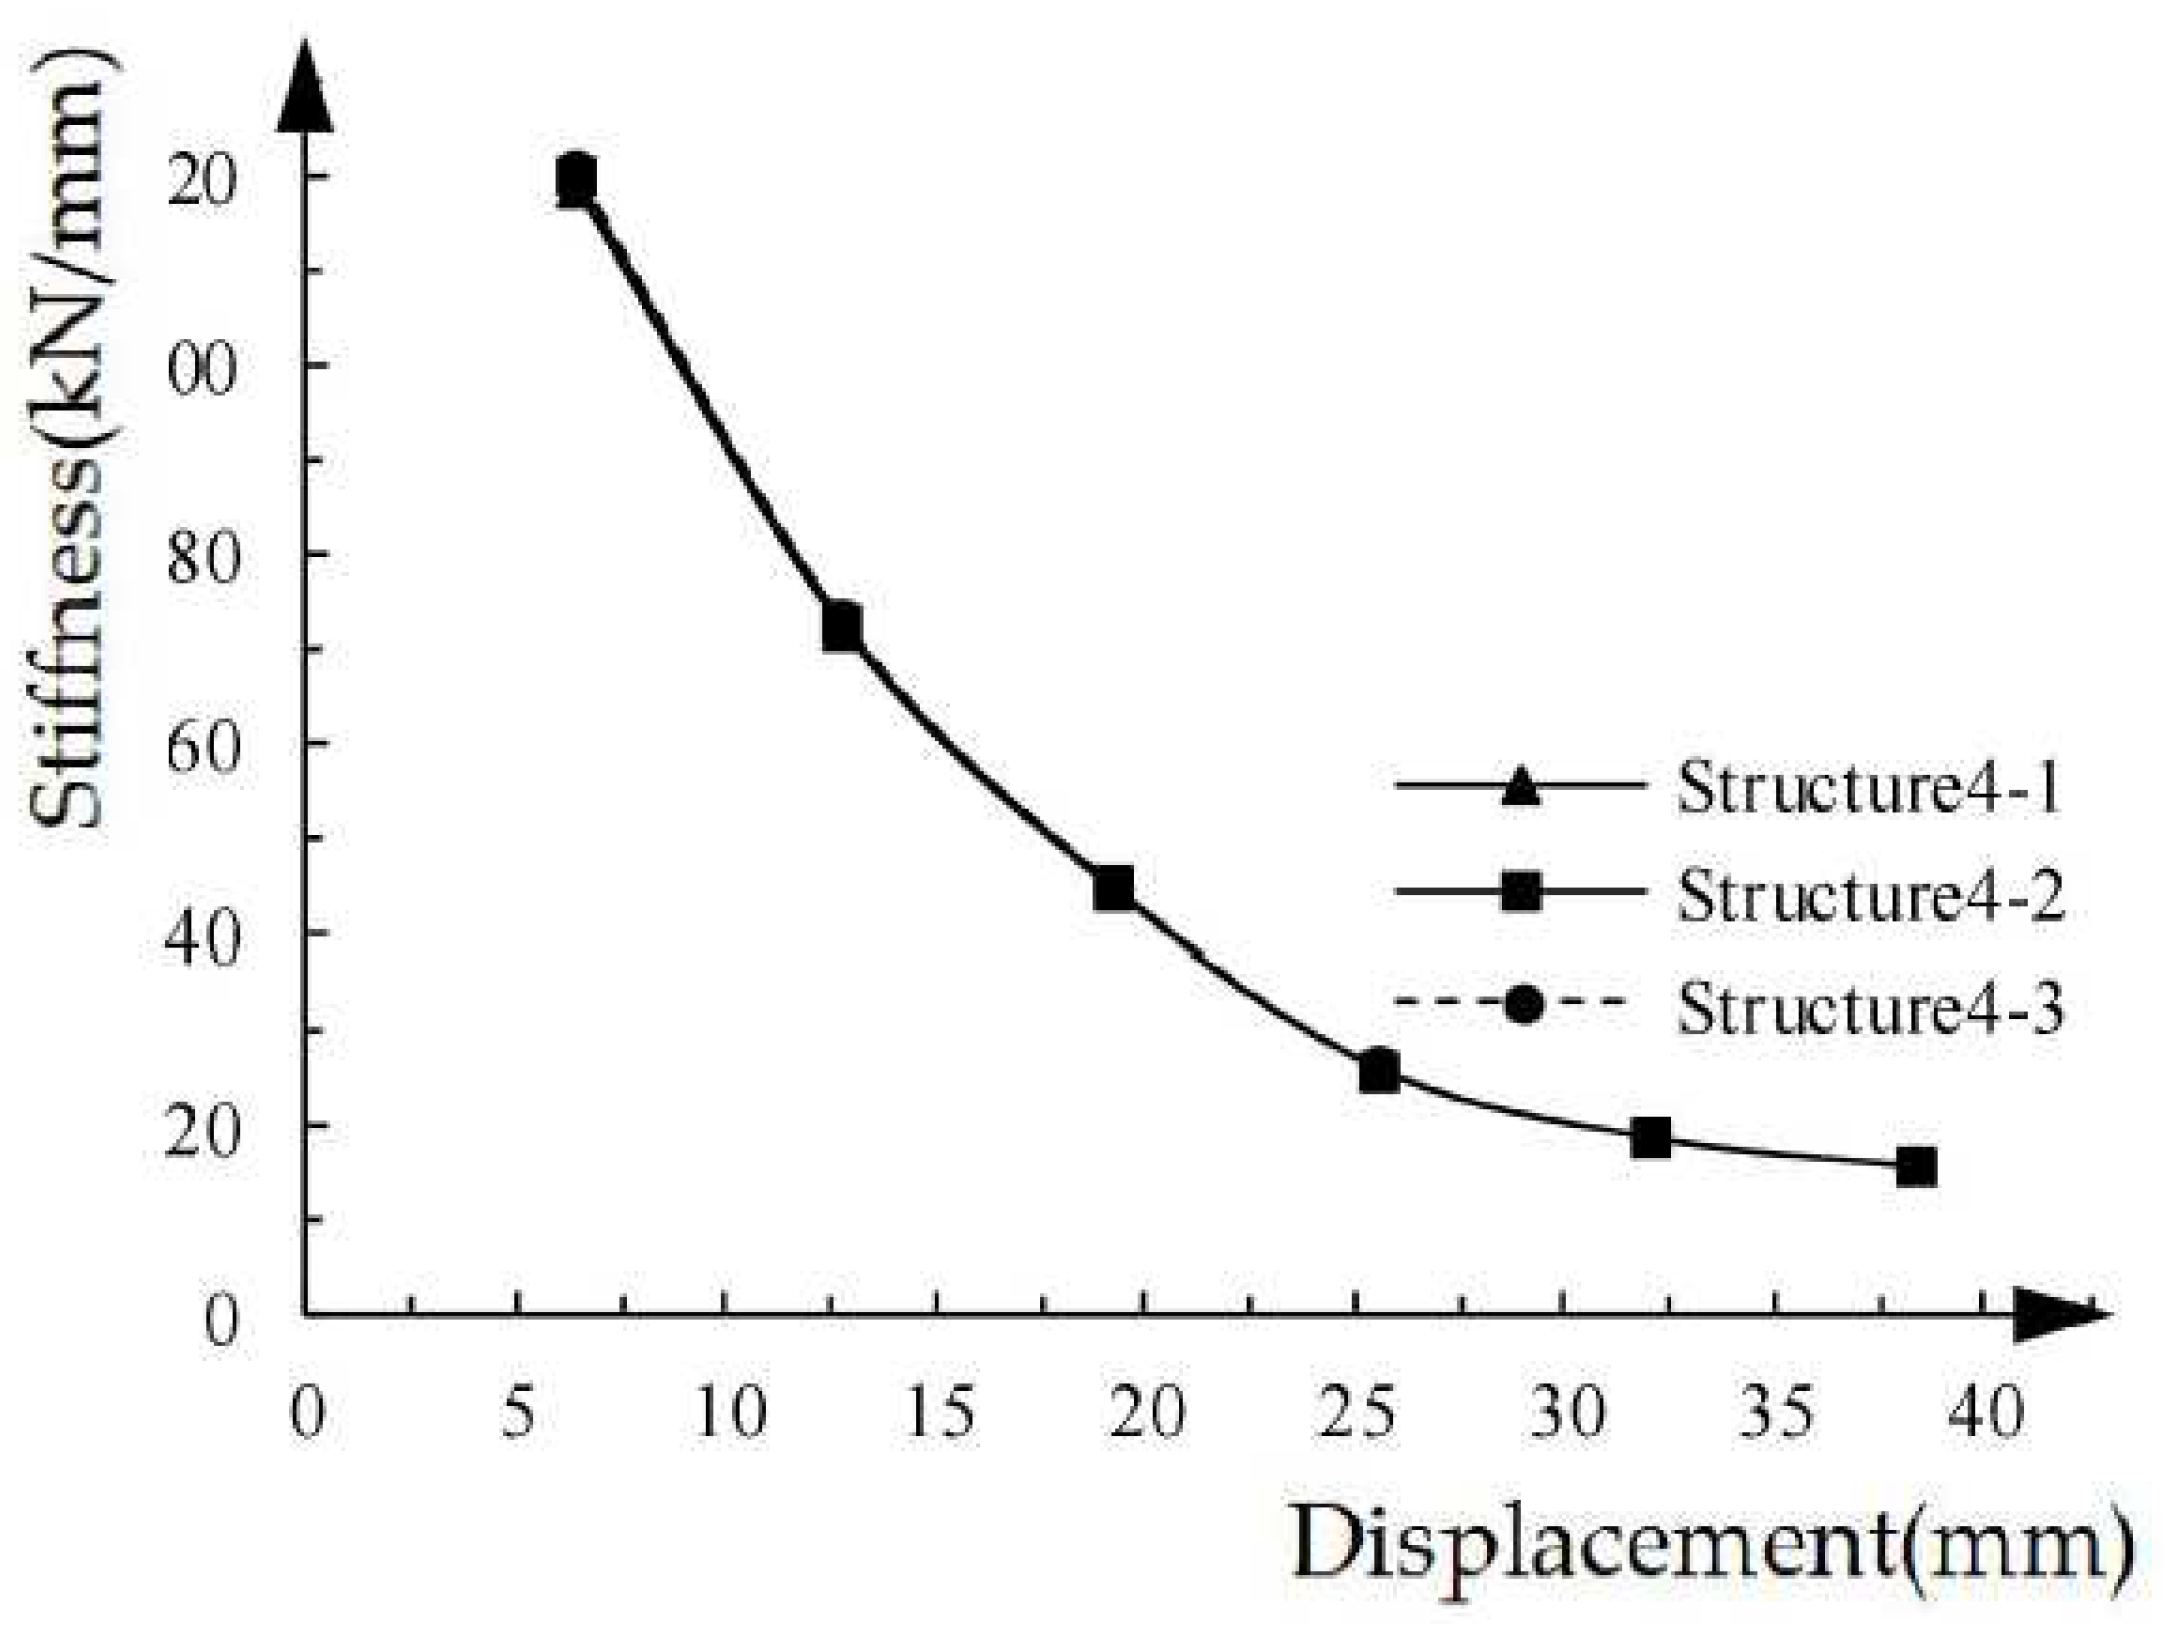
Figure 18.
Load-displacement curves of structural specimens with differentlongitudinal reinforcement strengths under unidirectional pushover.
Figure 18.
Load-displacement curves of structural specimens with differentlongitudinal reinforcement strengths under unidirectional pushover.
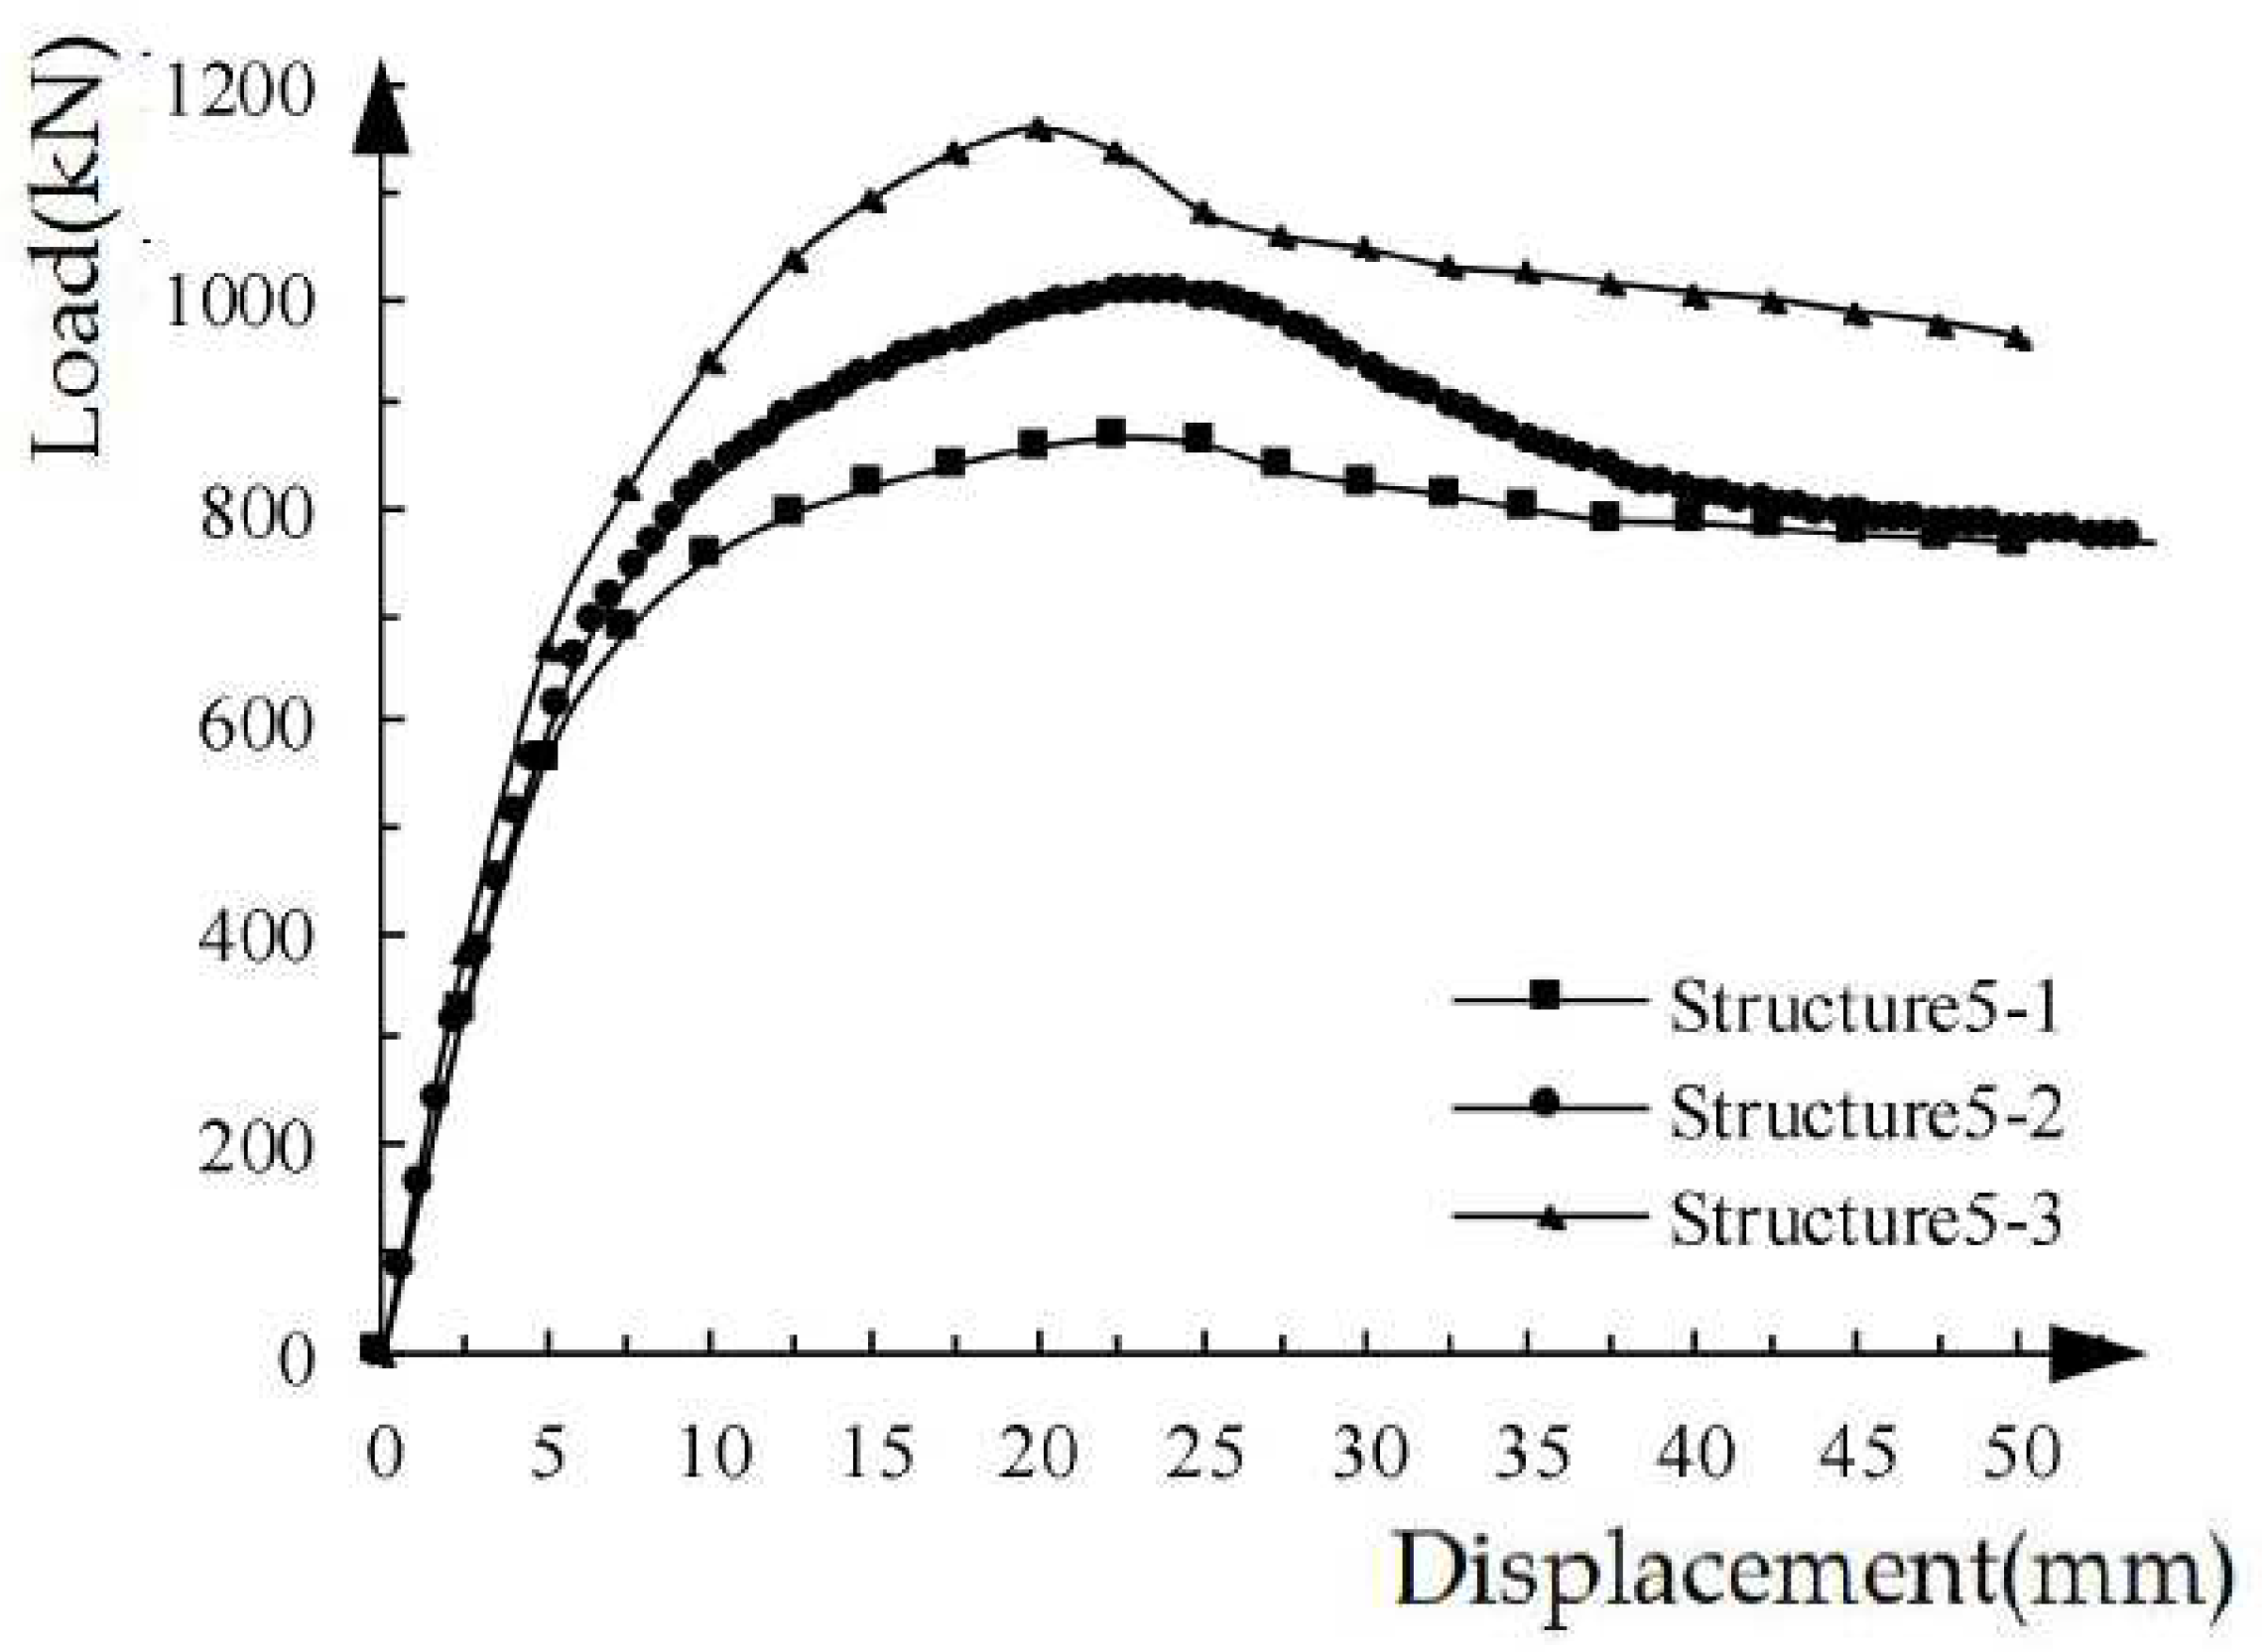
Figure 19.
Load-displacement hysteresis curves of the specimens with different longitudinal reinforcement strengths under low cyclic loading.
Figure 19.
Load-displacement hysteresis curves of the specimens with different longitudinal reinforcement strengths under low cyclic loading.
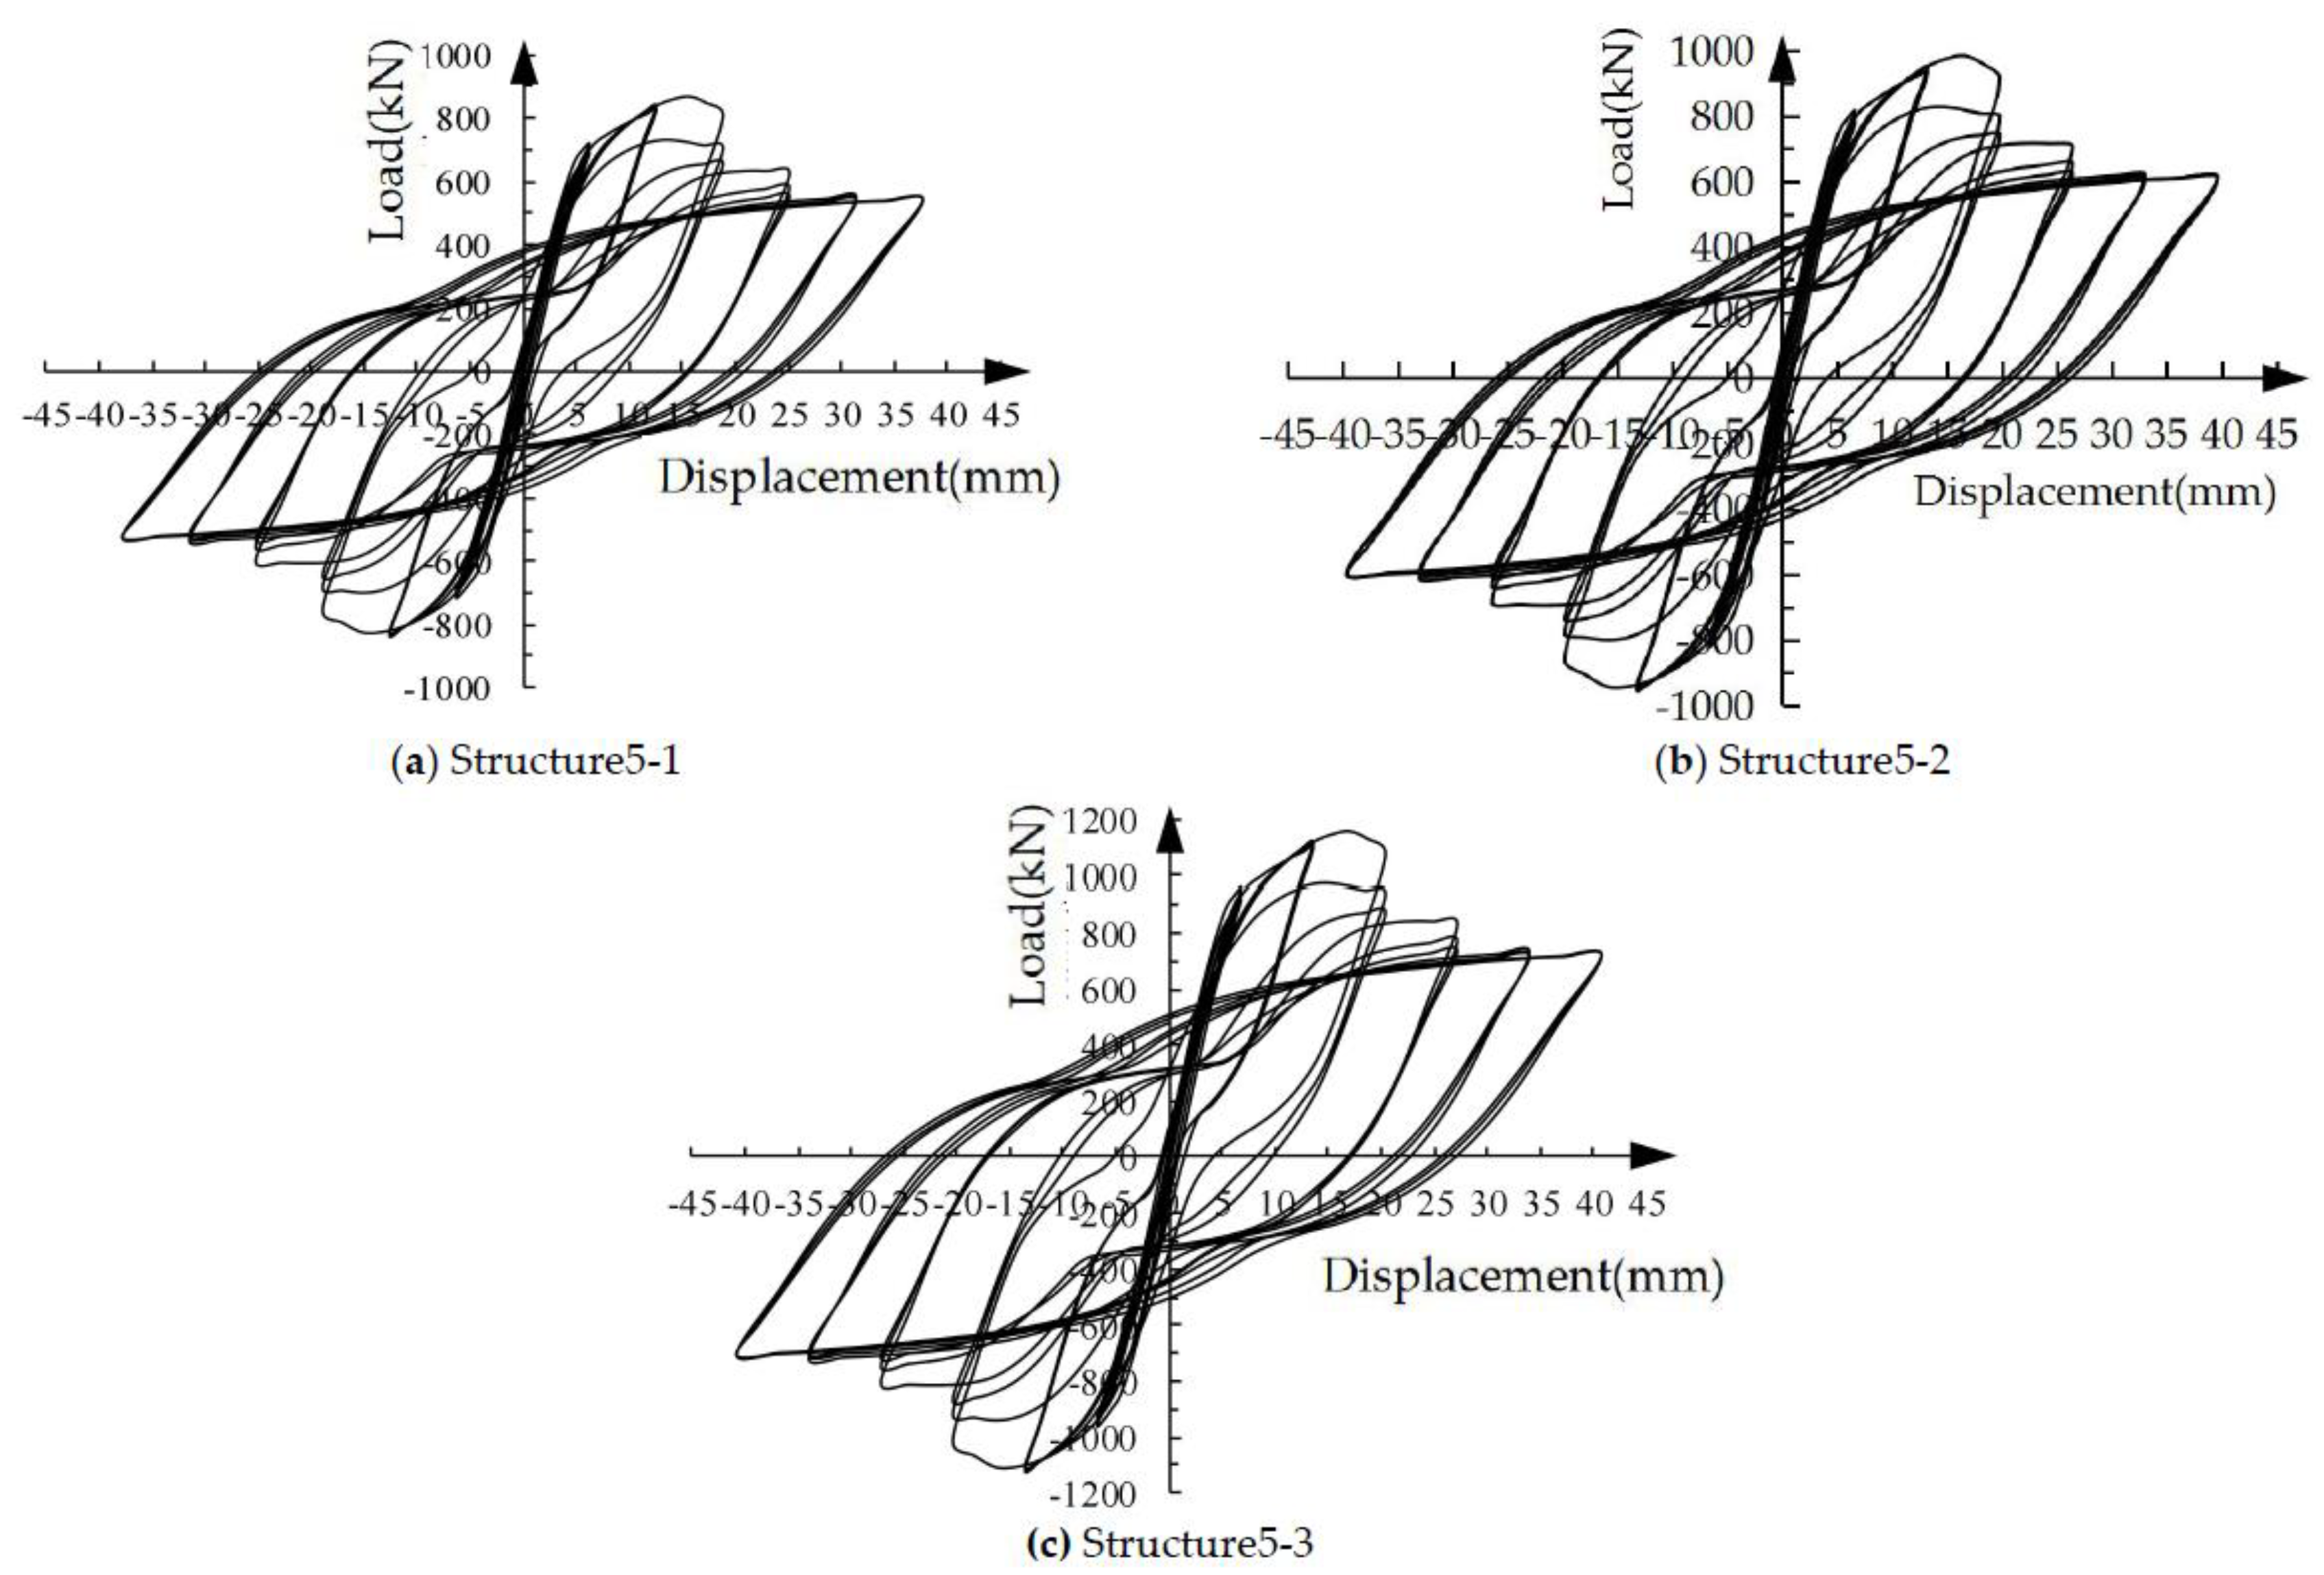
Figure 20.
One-cycle energy degradation coefficient curves of specimens with different longitudinal reinforcement strengths.
Figure 20.
One-cycle energy degradation coefficient curves of specimens with different longitudinal reinforcement strengths.
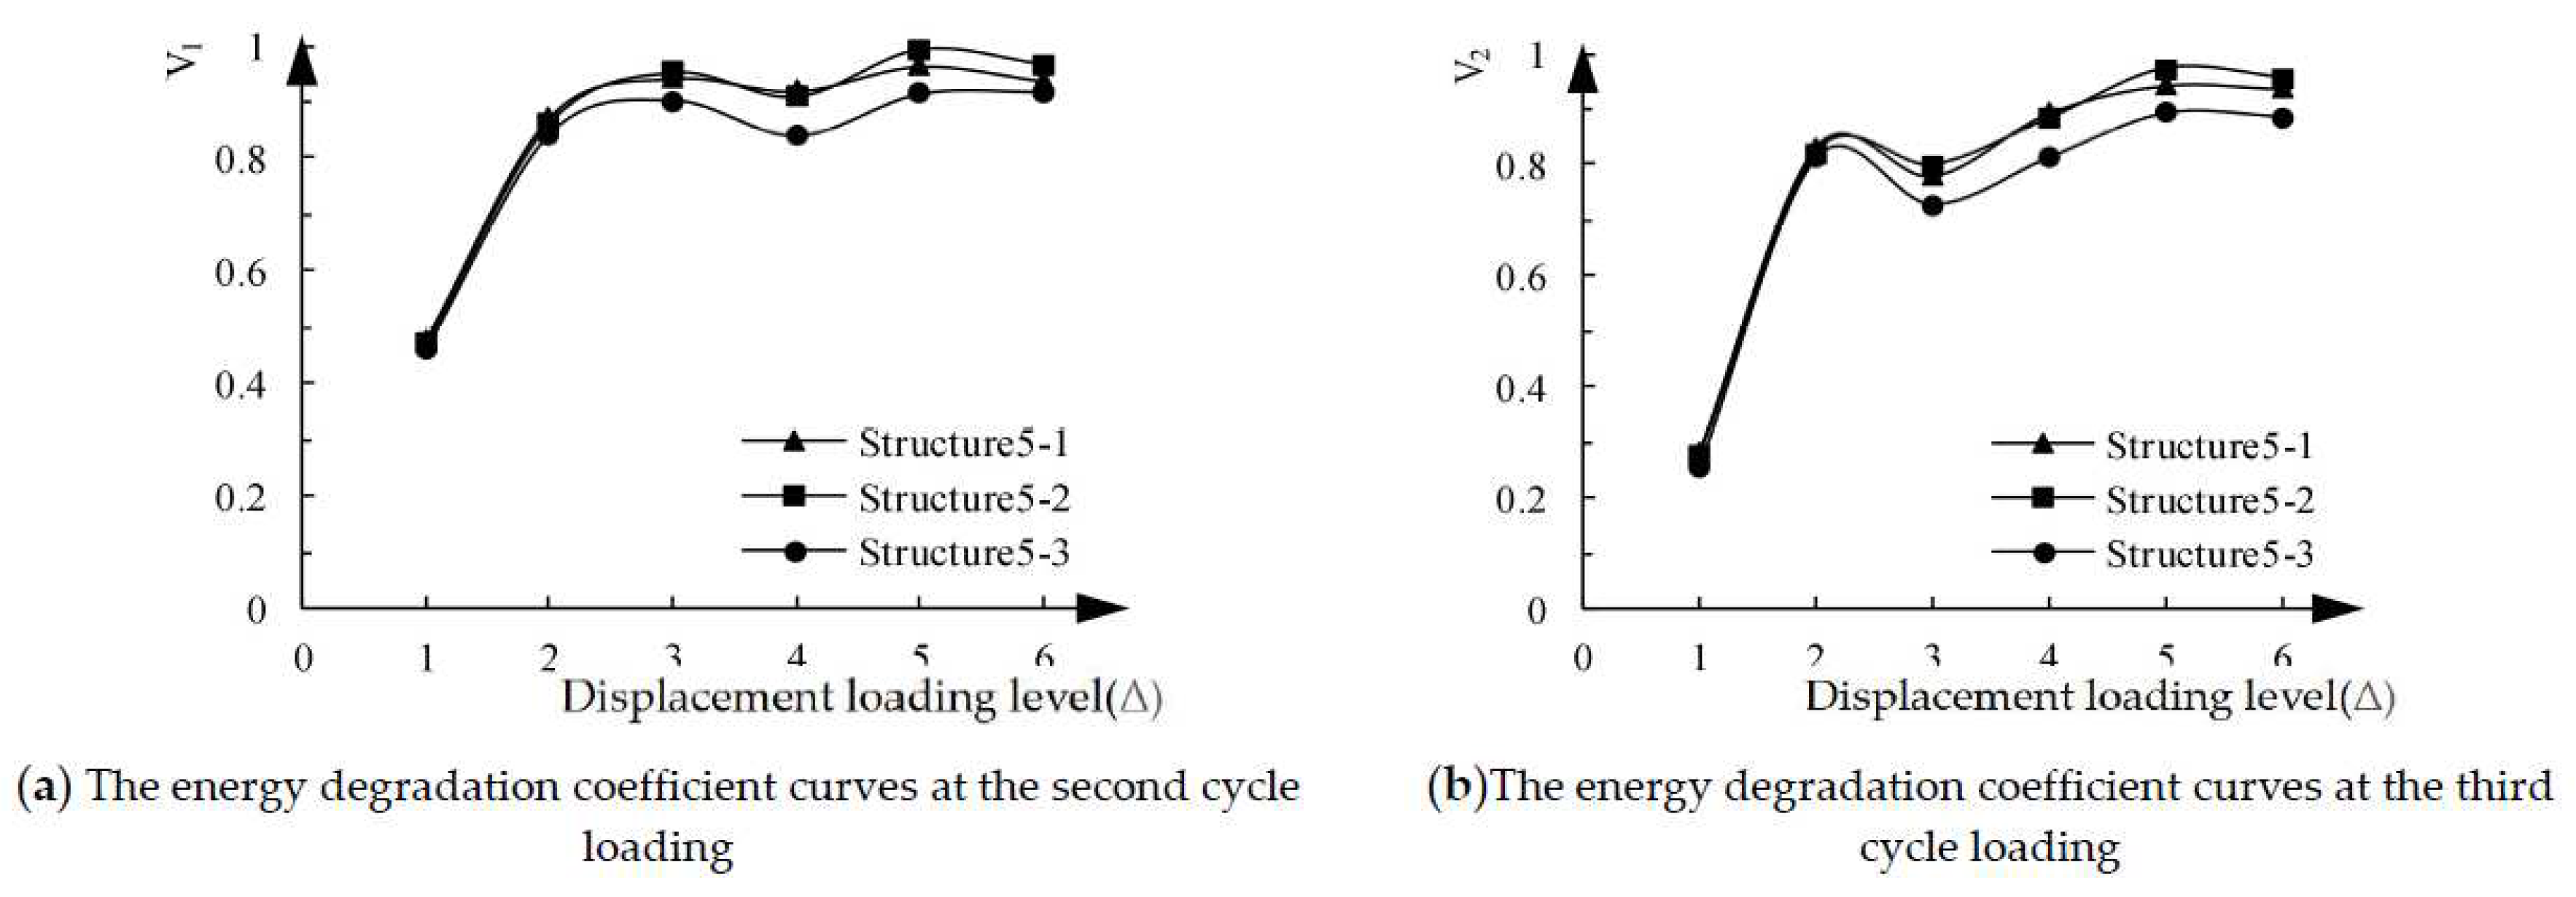
Figure 21.
Stiffness-displacement curves of structural specimens with different longitudinal reinforcement strengths.
Figure 21.
Stiffness-displacement curves of structural specimens with different longitudinal reinforcement strengths.

Table 2.
Energy dissipation coefficient of the structural specimens.
| Specimen | Yield point | Peak point | ||||
|---|---|---|---|---|---|---|
| Displacement(mm) | Load(kN) | e | Displacement(mm) | Load(kN) | e | |
| Structure1-1 | 5.9 | 540 | 0.29 | 17.7 | 807 | 0.86 |
| Structure1-2 | 6.1 | 652 | 0.31 | 18.1 | 936 | 1.02 |
| Structure1-3 | 6.1 | 666 | 0.32 | 17.9 | 964 | 1.03 |
Table 3.
The variation parameters of the use regions of ECC in shear walls.
| Classification of specimens | Application height of ECC in the bottom of shear walls | Stirrup ratio of coupling beams | Type of longitudinal reinforcement | Type of ECC | Type of concrete |
|---|---|---|---|---|---|
| Structure2-1 | 0 | 1.13% | HRB400 | E40 | C40 |
| Structure2-2 Structure2-3 Structure2-4 Structure2-5 |
200mm 400mm 600mm 800mm |
Table 4.
Single cycle/cumulative energy dissipation of the five structural specimens (J).
| Displacement loading level | Number of cycles | Structure2-1 | Structure2-2 | Structure2-3 | Structure2-4 | Structure2-5 | |||||
|---|---|---|---|---|---|---|---|---|---|---|---|
| Single cycle | Cumulative | Single cycle | Cumulative | Single cycle | Cumulative | Single cycle | Cumulative | Single cycle | Cumulative | ||
| 1Δ | 1 | 1193.5 | 1193.5 | 1169.7 | 1169.7 | 1715.6 | 1715.6 | 1491.8 | 1491.8 | 1453.9 | 1453.9 |
| 2 | 647.7 | 1841.2 | 502.3 | 1672 | 768.3 | 2483.9 | 545.5 | 2037.3 | 515 | 1968.9 | |
| 3 | 216.2 | 2057.4 | 297.6 | 1969.6 | 412.3 | 2896.2 | 308.6 | 2345.9 | 332 | 2300.9 | |
| 2Δ | 1 | 7975.3 | 10032.7 | 7652.6 | 9622.2 | 8556.3 | 11452.5 | 8651.8 | 10997.7 | 8666.9 | 10967.8 |
| 2 | 5674.6 | 15707.3 | 5863.1 | 15485.3 | 7367.4 | 18819.9 | 7160.8 | 18158.5 | 7238.6 | 18206.4 | |
| 3 | 5397.3 | 21104.6 | 5771.2 | 21256.5 | 7005.4 | 25825.3 | 6922.4 | 25080.9 | 7012.2 | 25218.6 | |
| 3Δ | 1 | 18649.2 | 39753.8 | 18344.2 | 39600.7 | 22023.7 | 47849 | 21322.3 | 46403.2 | 22419 | 47637.6 |
| 2 | 15112.3 | 54866.1 | 17998.3 | 57599 | 20969.8 | 68818.8 | 20720 | 67123.2 | 21431.9 | 69069.5 | |
| 3 | 14073.5 | 68939.6 | 15419.6 | 73018.6 | 17581.2 | 86400 | 19805 | 86928.2 | 19138.9 | 88208.4 | |
| 4Δ | 1 | 23429.7 | 92369.3 | 26425.3 | 99443.9 | 27936.5 | 114336.5 | 29570.9 | 116499.1 | 29906.4 | 118114.8 |
| 2 | 21113.2 | 113482.5 | 24323.6 | 123767.5 | 25400.1 | 139736.6 | 27143.4 | 143642.5 | 27295.6 | 145410.4 | |
| 3 | 20786.3 | 134268.8 | 23710.5 | 147478 | 24652.7 | 164389.3 | 25575.5 | 169218 | 27270.4 | 172680.8 | |
| 5Δ | 1 | 30786.5 | 165055.3 | 33976.2 | 181454.2 | 36745 | 201134.3 | 37849.2 | 207067.2 | 38685.8 | 211366.6 |
| 2 | 29011.6 | 194066.9 | 33178.8 | 214633 | 36516.6 | 237650.9 | 37338.2 | 244405.4 | 37798.4 | 249165 | |
| 3 | 28653.2 | 222720.1 | 33074.3 | 247707.3 | 35751 | 273401.9 | 36303 | 280708.4 | 36649.8 | 285814.8 | |
| 6Δ | 1 | 39862.9 | 262583 | 44226.3 | 291933.6 | 47475.5 | 320877.4 | 48948.2 | 329656.6 | 48656.9 | 334471.7 |
| 2 | 38865.2 | 301448.2 | 42983.9 | 334917.5 | 45928.6 | 366806 | 47494.3 | 377150.9 | 47598.2 | 382069.9 | |
| 3 | 38012.3 | 339460.5 | 42656.2 | 377573.7 | 45399.4 | 412205.4 | 46998.2 | 424149.1 | 47196.5 | 429266.4 | |
Table 5.
Energy dissipation coefficients of the five structural specimens.
| Specimen | Yield point | Peak point | ||||
|---|---|---|---|---|---|---|
| Displacement(mm) | Load(kN) | e | Displacement(mm) | Load(kN) | e | |
| Structure2-1 | 6.1 | 665 | 0.31 | 18.0 | 961 | 1.04 |
| Structure2-2 | 6.4 | 681 | 0.30 | 18.4 | 889 | 1.12 |
| Structure2-3 | 6.6 | 683 | 0.39 | 18.6 | 981 | 1.23 |
| Structure2-4 | 6.9 | 684 | 0.32 | 19.1 | 976 | 1.17 |
| Structure2-5 | 7.0 | 685 | 0.31 | 19.6 | 965 | 1.18 |
Table 6.
The variation parameters of the ECC strength.
| Classification of specimens | Application areas of ECC | Stirrup ratio of coupling beams | Type of longitudinal reinforcement | Type of ECC | Type of concrete |
|---|---|---|---|---|---|
| Structure3-1 | The cast-in-place areas of the composite coupling beams and 400mm height within the shear wall bottom | 1.13% | HRB400 | E40 | C40 |
| Structure3-2 | E60 | ||||
| Structure3-3 | E80 |
Table 7.
Single cycle/cumulative energy dissipation of structural specimens with different ECC strengths (J).
Table 7.
Single cycle/cumulative energy dissipation of structural specimens with different ECC strengths (J).
| Displacement loading level | Number of cycles | Structure2-1 | Structure2-2 | Structure2-3 | |||
|---|---|---|---|---|---|---|---|
| Single cycle | Cumulative | Single cycle | Cumulative | Single cycle | Cumulative | ||
| 1Δ | 1 | 1797.9 | 1797.9 | 1827.7 | 1827.7 | 1844.8 | 1844.8 |
| 2 | 851.8 | 2649.7 | 897.2 | 2724.9 | 921.5 | 2766.3 | |
| 3 | 496.2 | 3145.9 | 539.8 | 3264.7 | 566.3 | 3332.6 | |
| 2Δ | 1 | 8679.7 | 11825.6 | 7850.5 | 11115.2 | 8251.1 | 11583.7 |
| 2 | 7490.8 | 19316.4 | 4902.7 | 16017.9 | 5061.7 | 16645.4 | |
| 3 | 7128.8 | 26445.2 | 4347.2 | 20365.1 | 4465.5 | 21110.9 | |
| 3Δ | 1 | 22147.1 | 48592.3 | 20359.9 | 40725 | 20648.2 | 41759.1 |
| 2 | 21093.2 | 69685.5 | 19888 | 60613 | 19996.1 | 61755.2 | |
| 3 | 17704.6 | 87390.1 | 16238.3 | 76851.3 | 16635 | 78390.2 | |
| 4Δ | 1 | 28071 | 115461.1 | 26369 | 103220.3 | 26744.5 | 105134.7 |
| 2 | 25534.6 | 140995.7 | 23050.5 | 126270.8 | 23979.7 | 129114.4 | |
| 3 | 24787.2 | 165782.9 | 22108.2 | 148379 | 22482.1 | 151596.5 | |
| 5Δ | 1 | 36879.5 | 202662.4 | 35549.4 | 183928.4 | 35664.1 | 187260.6 |
| 2 | 36651.1 | 239313.5 | 32085.4 | 216013.8 | 32158.9 | 219419.5 | |
| 3 | 35885.5 | 275199 | 30333.9 | 246347.7 | 30159.7 | 249579.2 | |
| 6Δ | 1 | 47613.3 | 322812.3 | 45413.8 | 291761.5 | 46495.3 | 296074.5 |
| 2 | 46066.4 | 368878.7 | 43862.2 | 335623.7 | 44070.5 | 340145 | |
| 3 | 45537.2 | 414415.9 | 42948.7 | 378572.4 | 42525.1 | 382670.1 | |
Table 8.
Energy dissipation coefficient of specimens with different ECC strength.
| Specimen | Yield point | Peak point | ||||
|---|---|---|---|---|---|---|
| Displacement(mm) | Load(kN) | e | Displacement(mm) | Load(kN) | e | |
| Structure3-1 | 6.6 | 685 | 0.39 | 18.5 | 984 | 1.22 |
| Structure3-2 | 6.5 | 696 | 0.32 | 17.6 | 1017 | 1.14 |
| Structure3-3 | 6.5 | 712 | 0.34 | 17.3 | 1038 | 1.14 |
Table 9.
Parameter configuration of the structural specimens.
| Classification of specimens | Application areas of ECC | Stirrup ratio of coupling beams | Type of longitudinal reinforcement | Type of ECC | Type of concrete |
|---|---|---|---|---|---|
| Structure4-1 | The cast-in-place areas of the composite coupling beams and 400mm height within the shear wall bottom | 0.50% | HRB400 | E40 | C40 |
| Structure4-2 | 1.13% | ||||
| Structure4-3 | 2.01% |
Table 10.
Single cycle/cumulative energy dissipation of the structural specimens with different stirrup ratios of coupling beams (J).
Table 10.
Single cycle/cumulative energy dissipation of the structural specimens with different stirrup ratios of coupling beams (J).
| Displacement loading level | Number of cycles | Structure4-1 | Structure4-2 | Structure4-3 | |||
|---|---|---|---|---|---|---|---|
| Single cycle | Cumulative | Single cycle | Cumulative | Single cycle | Cumulative | ||
| 1Δ | 1 | 1791.2 | 1791.2 | 1797.9 | 1797.9 | 1822.1 | 1822.1 |
| 2 | 846.3 | 2637.5 | 851.8 | 2649.7 | 861.6 | 2683.7 | |
| 3 | 494.2 | 3131.7 | 496.2 | 3145.9 | 502.4 | 3186.1 | |
| 2Δ | 1 | 8592.9 | 11724.6 | 8679.7 | 11825.6 | 8809.9 | 11996 |
| 2 | 7415.9 | 19140.5 | 7490.8 | 19316.4 | 7603.2 | 19599.2 | |
| 3 | 7057.5 | 26198 | 7128.8 | 26445.2 | 7235.7 | 26834.9 | |
| 3Δ | 1 | 21925.6 | 48123.6 | 22147.1 | 48592.3 | 22479.3 | 49314.2 |
| 2 | 20882.3 | 69005.9 | 21093.2 | 69685.5 | 21409.6 | 70723.8 | |
| 3 | 17527.6 | 86533.5 | 17704.6 | 87390.1 | 17970.2 | 88694 | |
| 4Δ | 1 | 27790.3 | 114323.8 | 28071 | 115461.1 | 28492.1 | 117186.1 |
| 2 | 25279.3 | 139603.1 | 25534.6 | 140995.7 | 25917.6 | 143103.7 | |
| 3 | 24539.3 | 164142.4 | 24787.2 | 165782.9 | 25159.0 | 168262.7 | |
| 5Δ | 1 | 36510.7 | 200653.1 | 36879.5 | 202662.4 | 37432.7 | 205695.4 |
| 2 | 36284.6 | 236937.7 | 36651.1 | 239313.5 | 37200.9 | 242896.3 | |
| 3 | 35526.6 | 272464.3 | 35885.5 | 275199 | 36423.8 | 279320.1 | |
| 6Δ | 1 | 47137.2 | 319601.5 | 47613.3 | 322812.3 | 48327.5 | 327647.6 |
| 2 | 45605.7 | 365207.2 | 46066.4 | 368878.7 | 46757.4 | 374405 | |
| 3 | 45081.8 | 410289 | 45537.2 | 414415.9 | 46220.3 | 420625.3 | |
Table 11.
Energy dissipation coefficient of specimens with different stirrup ratios of coupling beams.
Table 11.
Energy dissipation coefficient of specimens with different stirrup ratios of coupling beams.
| Specimen | Yield point | Peak point | ||||
|---|---|---|---|---|---|---|
| Displacement(mm) | Load(kN) | e | Displacement(mm) | Load(kN) | e | |
| Structure4-1 | 6.6 | 685 | 0.40 | 19.8 | 984 | 1.13 |
| Structure4-2 | 6.6 | 685 | 0.40 | 19.8 | 984 | 1.14 |
| Structure4-3 | 6.6 | 685 | 0.40 | 19.8 | 984 | 1.15 |
Table 12.
Parameter configuration of the structural specimens.
| Classification of specimens | Application areas of ECC | Stirrup ratio of coupling beams | Type of longitudinal reinforcement | Yield strength / MP | Ultimate strength / MPa | Type of concrete | Type of ECC |
|---|---|---|---|---|---|---|---|
| Structure5-1 | The cast-in-place areas of the composite coupling beams and 400mm height within the shear wall bottom | 1.13% | HRB335 | 335 | 455 | C40 | E40 |
| Structure5-2 | HRB400 | 400 | 540 | ||||
| Structure5-3 | HRB500 | 500 | 630 |
Table 13.
Single cycle/cumulative energy dissipation of specimens with different longitudinal reinforcement strengths(J).
Table 13.
Single cycle/cumulative energy dissipation of specimens with different longitudinal reinforcement strengths(J).
| Displacement loading level | Number of cycles | Structure5-1 | Structure5-2 | Structure5-3 | |||
|---|---|---|---|---|---|---|---|
| Single cycle | Cumulative | Single cycle | Cumulative | Single cycle | Cumulative | ||
| 1Δ | 1 | 1551.2 | 1551.2 | 1797.9 | 1797.9 | 2079.2 | 2079.2 |
| 2 | 738.9 | 2290.1 | 851.8 | 2649.7 | 980.2 | 3059.4 | |
| 3 | 435.2 | 2725.3 | 496.2 | 3145.9 | 569.3 | 3628.7 | |
| 2Δ | 1 | 7502.7 | 10228 | 8679.7 | 11825.6 | 10056.5 | 13685.2 |
| 2 | 6475.0 | 16703 | 7490.8 | 19316.4 | 8682.3 | 22367.5 | |
| 3 | 6162.1 | 22865.1 | 7128.8 | 26445.2 | 8269.4 | 30636.9 | |
| 3Δ | 1 | 19152.0 | 42017.1 | 22147.1 | 48592.3 | 25690.6 | 56327.5 |
| 2 | 18233.0 | 60250.1 | 21093.2 | 69685.5 | 24468.1 | 80795.6 | |
| 3 | 15311.9 | 75562 | 17704.6 | 87390.1 | 20531.3 | 101326.9 | |
| 4Δ | 1 | 24264.6 | 99826.6 | 28071 | 115461.1 | 32562.4 | 133889.3 |
| 2 | 22072.1 | 121898.7 | 25534.6 | 140995.7 | 29612.1 | 163501.4 | |
| 3 | 21431.1 | 143329.8 | 24787.2 | 165782.9 | 28753.2 | 192254.6 | |
| 5Δ | 1 | 31878.6 | 175208.4 | 36879.5 | 202662.4 | 42780.2 | 235034.8 |
| 2 | 31681.2 | 206889.6 | 36651.1 | 239313.5 | 42510.3 | 277545.1 | |
| 3 | 31019.4 | 237909 | 35885.5 | 275199 | 41627.2 | 319172.3 | |
| 6Δ | 1 | 41156.9 | 279065.9 | 47613.3 | 322812.3 | 55227.4 | 374399.7 |
| 2 | 39819.8 | 318885.7 | 46066.4 | 368878.7 | 53429.0 | 427828.7 | |
| 3 | 39376.4 | 358262.1 | 45537.2 | 414415.9 | 52819.2 | 480647.9 | |
Table 14.
Energy dissipation coefficients of structural specimens with different longitudinal reinforcement strengths.
Table 14.
Energy dissipation coefficients of structural specimens with different longitudinal reinforcement strengths.
| Specimen | Yield point | Peak point | ||||
|---|---|---|---|---|---|---|
| Displacement(mm) | Load(kN) | e | Displacement(mm) | Load(kN) | e | |
| Structure5-1 | 6.3 | 602 | 0.41 | 18.9 | 864 | 1.17 |
| Structure5-2 | 6.6 | 685 | 0.40 | 19.8 | 984 | 1.14 |
| Structure5-3 | 6.8 | 694 | 0.44 | 20.4 | 1156 | 1.09 |
Table 15.
Recommended values of parameters of the prefabricated ECC/RC composite shear wall structural specimen.
Table 15.
Recommended values of parameters of the prefabricated ECC/RC composite shear wall structural specimen.
| Use regions of ECC in composite coupling beams | Use regions of ECC in shear walls | Stirrup ratio of coupling beams | Strength of longitudinal reinforcement | Strength of ECC |
|---|---|---|---|---|
| Cast-in-place regions of all coupling beams | 400mm height within the shear wall bottom | 0.5% | HRB400 | E40 |
Disclaimer/Publisher’s Note: The statements, opinions and data contained in all publications are solely those of the individual author(s) and contributor(s) and not of MDPI and/or the editor(s). MDPI and/or the editor(s) disclaim responsibility for any injury to people or property resulting from any ideas, methods, instructions or products referred to in the content. |
© 2023 by the authors. Licensee MDPI, Basel, Switzerland. This article is an open access article distributed under the terms and conditions of the Creative Commons Attribution (CC BY) license (http://creativecommons.org/licenses/by/4.0/).
Copyright: This open access article is published under a Creative Commons CC BY 4.0 license, which permit the free download, distribution, and reuse, provided that the author and preprint are cited in any reuse.


