
Submitted:
19 October 2023
Posted:
19 October 2023
You are already at the latest version
Abstract
Digitization of tissues allows examination of tissue morphologies in new ways enabling patient stratification for effective treatments. Current slide-scanning techniques capture the visible details of the tissue as whole-slide images and digitally record them in the form of spatial and color relationships. Specialized experimental techniques like Dielectric spectroscopy can also be used to investigate a tissue’s response to an applied electric field. This study used the dielectric spectroscopy method to collect the complex permittivity of healthy and abnormal biopsy tissues excised during gastroenterology procedures. A single pole Cole-Cole model is fitted to the measurements dataset to extract the parameters which are used as features in machine learning binary classification models. The models achieved high accuracy, demonstrating the feasibility of using microwave-based spectroscopy measurements to create a digital dielectric fingerprint for tissues under investigation.
Keywords:
dielectric fingerprint
; dielectric spectroscopy
; microwaves
; gastrointestinal
; microwave imaging
1. Introduction
A diagnosis must be accurate and timely to make clinical decisions tailored to each patient’s health problem for the best health outcome. Widespread utilization of various diagnostic methods like Computed Tomography, Magnetic Resonance Imaging, and Ultrasound Imaging, along with other clinical diagnostic tests, have increased diagnostic accuracy and helped physicians make the best clinical decisions. However, physicians, surgeons, and radiologists rely on pathological reports for assistance in diagnosing various diseases and guiding the treatment. Pathology can identify abnormalities in normal tissues and is considered a gold standard diagnostic test for multiple conditions.
The three main subdivisions in pathology include anatomical, molecular, and clinical pathology. Anatomical pathology includes surgical pathology, histopathology, and cytopathology, whereas clinical pathology comprises chemical pathology, immunopathology, and hematology. Molecular pathology detects defects at the level of DNA with the help of techniques like polymerase chain reaction (PCR), DNA microarrays, karyotype images, and fluorescence labeling [1]. Macroscopic tissue selection and tissue processing into microscopic sections for a pathological diagnosis needs skilled laboratory and medical professionals [2]. Since treatment approaches are more personalized nowadays, especially for cancers, diagnostic pathology is most crucial and comprehensive.
Tissue processing plays a key role in accurate histopathological evaluation. Tissue or sample must undergo processing before it is examined under the microscope. This includes fixation, trimming, embedding, sectioning, staining, and storage [3]. These processes are intended for the morphological assessment of tissue and should ensure that morphology is not compromised during tissue processing. Bass et al. published a review with a compilation of potential pitfalls that affect tissue morphology, including proteins, RNA, and DNA, thus suggesting that better methods and recommendations are needed for tissue processing to improve diagnostic outcomes [4].
Tissue processing is critical, especially in surgical pathology, for accurate diagnosis. Surgical pathology involves surgical and biopsy specimens from living patients that can be tested for a better understanding of the disease and treatment. Surgical pathology specimens can be used to identify the inflammatory, benign, or malignant tissues, help visualize the tumor border, and simple staging in malignancies. These specimens can be carried as paraffin or frozen sections and are currently considered the most rapid method [5].
The frozen section biopsy is currently considered a guiding tool for deciding the extent of surgery. Having said that, they are prone to artifacts, including wrinkles, staining condensations, and cellular distortion. According to an article published in ALPF medical research on the interpretation of frozen sections, the average deferral rate of frozen sections in general surgical pathology is approximately 4%-5% [6]. Additionally, paraffin-embedded preparation does not involve a standardized procedure, and formalin can denature specific proteins, limiting its use in pathology [7]. Therefore, processing samples with predictable success rates within a determined turnaround time (TAT) is challenging in diagnostic pathology.
TAT is a metric that indicates the quality of surgical pathology. According to the College of American Pathologists (CAP), the TAT should be two days or less for 90% of the pathology reports [8]. On the other hand, the recommended TAT for a single block frozen section by CAP surgical committee is 20 minutes. Moreover, Joseph M Laakman et al. suggested that frozen section turnaround time has minimal utility concerning quality assurance. Therefore, dividing it into interpretative and quality time can be more beneficial [9]. Consequently, pathology generates massive data consuming up to a gigabyte range and thus has the highest technical demand [10]. For the reasons mentioned above, technologies used in pathology should be replaced or improved with advancements in digital microscopy and computational science.
Developments in the computer-based algorithm in the field of digital pathology have been much slower [11]. According to the Digital Pathology Association, Digital pathology (DP) is defined as "a dynamic image-based environment that enables the acquisition, management, and interpretation of pathology information obtained from a glass slide." DP, also referred to as "Telepathology" and "Whole Slide Imaging" (WSI), has revolutionized pathology over the decades, benefiting translational and clinical research along with routine pathology services [12]. Thus far, FDA-approved WSI scanners can capture multiple digital images of the tissue sample under investigation and stitch them together. A remotely located pathologist can quickly access the WSI and review. In addition to the speed and efficiency, DP has also improved the precision and reproducibility of the read-outs. During the recent COVID-19-related disruptions, DP has been a crucial technology for continuing academic and clinical research and offering pathology services with remotely located pathologists [13]. In addition, numerous laboratories are striving to progress in digital pathology using the data from the existing techniques to develop complete virtual biopsies. Some examples include optical coherence tomography (OCT) and confocal microscopic analysis using endoscopy.
In addition to pathology, dielectric spectroscopy can identify biophysical changes in the tissues. This non-destructive material interrogation technique can explain the interaction of tissues with electromagnetic radiation. The tissue under investigation is exposed to an alternating electric field resulting in an electric current flow through the tissue. This measured current change is a function of the electric field frequency. Interpreting the current flow across the frequency spectrum provides characteristic information about the structure and behavior of the tissue under investigation. A comprehensive review by Fahmy. HM, et al. suggested that dielectric spectroscopy can be effectively used in early cancer detection as it provides the biophysical status of cancerous tissue by differentiating it from normal tissue [14].
With applications in practically every field, including healthcare, artificial intelligence (AI), deep learning, and other machine learning techniques have made significant strides in recent years. AI is an essential component of the diagnostic workflow, improving treatment outcomes for the patient and increasing diagnostic potency while maintaining reproducibility and accuracy of the results. Despite initial findings that are encouraging, the implementation of AI in diagnostic pathology necessitates the creation of datasets to train complex neural networks, which can be challenging due to the vast array of pathologies present along with data augmentation [15]. With AI, pathologists can extend the amount of information gathered from each slide. One of the primary applications of AI in pathology is to recognize patterns in images that can indicate the presence or the progress of the disease markers. According to Niazi et al., digital pathology and AI can be used in Pathology for education, clinical diagnosis, image analysis, and integration with other clinical data [16].
This paper introduces a novel non-destructive method, combining Microwaves (MW) and Artificial intelligence (AI) to classify biopsy tissues, that complements the new pathology technologies. The study’s objective is to showcase the use of dielectric spectroscopy to create a novel biomarker, Dielectric Fingerprint, which can be processed with AI algorithms to classify tissue types. The advantage of such a workflow is the dramatic reduction in time (hours to minutes) to identify tissue abnormalities while achieving high diagnostic accuracy. This study relies on biopsy tissues collected from patients undergoing Gastroenterology (GI) procedures (Endoscopy or Colonoscopy) at Mayo Clinic, Rochester, MN, USA. The biopsy tissues are characterized using dielectric spectroscopy and then sent to the laboratory for histopathology analysis. Dielectric measurements collected earlier are used to fit a classic parametric model to extract the parameters. A few Machine Learning (ML) models were built with extracted parameters as features and pathology read-outs (normal and abnormal) as labels. The ML models’ performance is determined using typical ML metrics, and the results indicate the effectiveness and potential of this novel pathology workflow.
2. Materials and Methods
The excised tissue samples (N=71 from 58 patients) were measured for complex dielectric permittivity over a frequency range of 0.5 to 20 GHz using an open-ended coaxial probe test method. Complex permittivity measurements were recorded using a USB Vector Network Analyzer (VNA). Lastly, tissue samples were identified as normal or abnormal using histology, defining the ground truth for the samples collected from the patient cohort. Supervised binary classification models were created using the scikit-learn machine learning library in Python 3.7.6 language.
2.1. Tissue Handling
Patients undergoing endoscopy or colonoscopy procedures between 22nd July 2021 and 4th November 2021 at Mayo Clinic, Rochester, MN, were identified for this study with IRB approval. Tissues of interest, such as polyps on the intestinal or colon walls, were excised from 58 patients. Freshly removed tissue samples were placed in a closed container and brought into the Microwave Engineering and Imaging Laboratory (MEIL) for dielectric spectroscopy measurements. The tissue samples were not treated with chemicals before the measurements to preserve the tissue characteristics. The dielectric measurements, described in the later section, were collected within 5 to 8 mins from the time of excision. After collecting the dielectric measurements, each tissue sample was immediately sent to the Pathology laboratory for histological examination to detect abnormalities or malignancies. Results of the Pathology analysis were used to label each of the collected tissues as “Normal” or “Abnormal”.
2.2. Measurement Method
An open-ended coaxial probe test method was selected to measure the complex permittivity of the tissue because of its non-destructive nature, relative ease of sample preparation, ability to calibrate, and portability. Figure 1 shows the dielectric spectroscopy equipment setup used for the measurements. The equipment items listed in Table 1 include an open-ended coaxial probe, Vector Network Analyzer (VNA), Model P9374A, Keysight Technologies, a computer, a phase-stable test port return cable, and fixtures to hold the probe and support the tissue sample.
The “Slim form probe” (N1501A Dielectric Probe Kit, Keysight Technologies) was an ideal choice because of its small form factor and its compatibility with semi-solids like tissues. Measurements are read directly on the computer, with Keysight’s VNA software (Version 18) connected to the VNA device. The probe is connected directly to the VNA with a flexible cable. The VNA software controls the measurement system and records the complex reflection coefficient measurements.
2.3. Tissue Preparation
The size of the excised tissues varied between 1 and 5 mm in width and 1 to 3 mm in thickness. About 4 to 8 biopsies are obtained per anatomical location, as shown in Figure 2, and sent to the MEIL lab. Excised samples from each location were placed in a plastic vial achieving a target tissue depth of 5 to 10 mm, which is ideal for the measurements.
Before collecting the measurements, the probe must be calibrated to compensate for any mismatch in the measurement system. Of the many ways to calibrate an open-ended coaxial sensor, a single reference-liquid method was selected because it is accurate and convenient. This calibration method uses three reference standards of known complex reflection coefficients. These three reference standards for the sensor-end are short-circuit, open-circuit, and immersed in a dielectric liquid like methanol or deionized water. After calibration, the probe and the connecting cable were left undisturbed for the measurement duration.
Next, the plastic vial with the samples was placed on a platform that can be raised or lowered vertically. The calibrated probe was oriented vertically over the tissue samples in the plastic vial and secured in a clamp fixture. The platform with the sample container was raised or lowered to ensure uniform contact between the sample and the sensing end of the probe. The tissue contact surface on the slim form probe is circular and has a relatively small diameter of 2.2 mm, which allowed us to re-position the probe on different areas of each sample and repeat the measurement, if possible. This approach allowed us to reduce the possibility of measurement errors and data loss due to the setup and maximize the information that can be collected from each sample. All measurements were collected at room temperature of 22°C (approximate). After the measurements were collected, the tissue samples were sent to the Pathology laboratory for analysis. The probe was cleaned with isopropyl alcohol after each sample measurement to avoid contamination across the samples. Each tissue sample was labelled as Normal or Abnormal based on the pathology analysis. Table 2 shows the total count of the samples and measurements grouped by tissue type.
2.4. Data
The measurement collected with the equipment, known as complex reflection coefficient (S11), is later converted, and recorded as complex dielectric permittivity ε(ω) as shown in equation 1. The real part ε′r of this complex term is the dielectric constant, which measures the amount of energy stored in the material due to an external electric field. The im-aginary part ε’’r, the loss factor, measures the energy loss when the material under test is exposed to an electric field. These two terms are frequency-dependent characteristic material properties describing the tissue behavior under an alternating electric field.
ε(ω) = ε′r − j ε″r
Both dielectric constant and loss factor are determined simultaneously at a range of frequencies. For this study, measurements were gathered across a frequency range of 0.5 to 20 GHz in increments of 39 MHz for each measurement. As a result of the frequency increment selected, each measurement output has 501 complex permittivity values (a total of 1002 values of dielectric constant and loss factor per measurement). With a total of 71 samples, as listed in Table 2, the finished measurement dataset has 288 unique meas-urements. Figure 3. shows the mean and standard deviation in measurements grouped by tissue type.
2.5. Model and Analysis
Each measurement produces a 501x2 array of values which means 288 unique measurements result in an array size of 501x576. Using this measurement data in its raw format makes it difficult to analyze and draw meaningful conclusions. To reduce the dimensionality of the dataset without losing the characteristic details, both Debye and its modified form, Cole-Cole [19], models were considered for fitting the measured data. Dielectric measurements from biological samples exhibit broad relaxation behavior making Cole-Cole model a better choice over the Debye model. According to Lazebnik et al. [20], a single pole Cole-Cole model, shown in equation (2), is sufficient to fit the dielectric measurements collected from biological samples. A two-pole model increases the complexity of data representation without any significant improvement in the quality of fit. Using the model, the 1002 data points from each measurement are transformed into five Cole-Cole parameters, i.e., dielectric constant at infinite frequency, dielectric constant at a static frequency, generalized relaxation time, exponent constant, and conductivity.
where,
ε is the complex permittivity.
ω is the angular frequency.
is the dielectric constant at infinite frequency.
is the dielectric constant at a static frequency.
τ is the generalized relaxation time.
α is the exponent constant.
is the conductivity.
is the permittivity of free space.
2.6. Model Fitting
A Python [21] script was created to fit the single-pole Cole-Cole model to each meas-urement and extract the Cole-Cole parameters. The script uses LMFIT [22] function with the classic Levenberg-Marquardt algorithm to solve the non-linear least squares problem for each measurement. This function combines the steepest descent and the in-verse-Hessian methods to solve the non-linear problem. The function iterates until three consecutive chi-square measurements are not significantly different or the maximum number of iterations is reached. Figure 4. shows an example of the fit achieved for dielectric constant and loss factor, from a measurement, with this method.
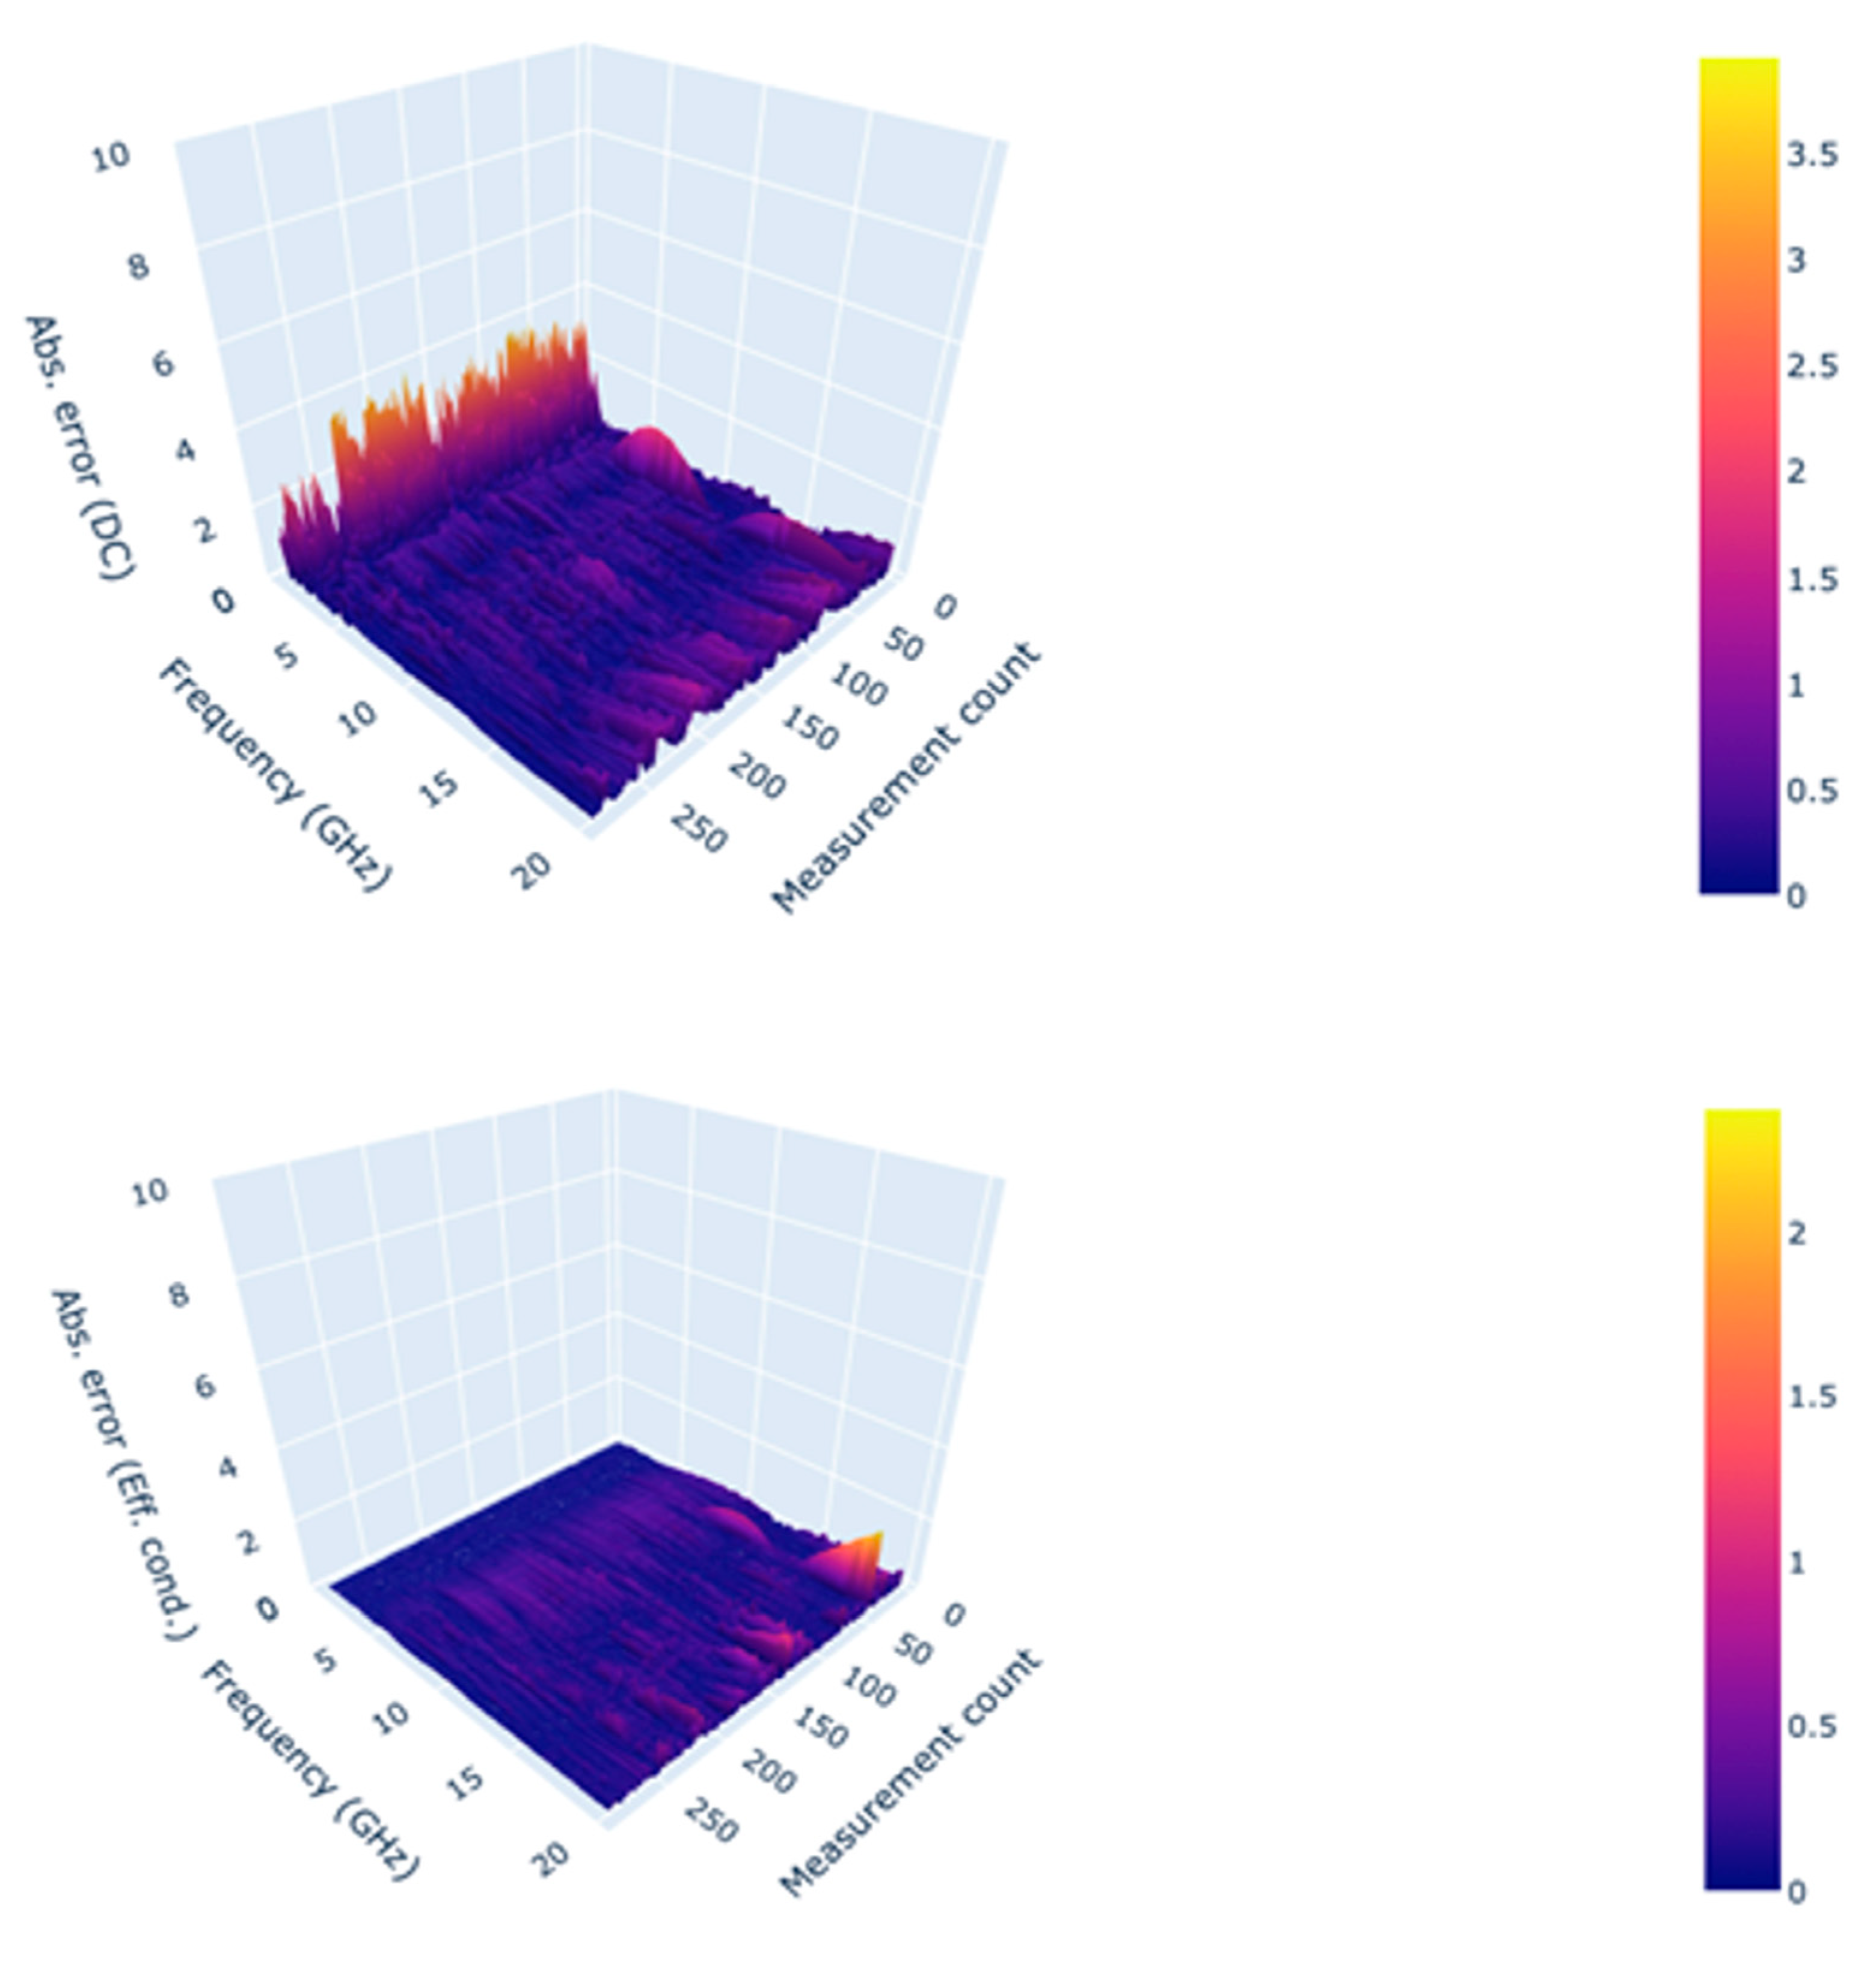
The absolute difference between the measured and re-constructed values was calculated to assess the overall quality of the fit. As shown in Figure 5, the maximum error due to the fittings across all measurements and frequencies is approximately 3.96 units and 2.37 S/m for dielectric constant and effective conductivity, respectively. As reported by Lazebnik et al. [20], the error in dielectric constant increases at lower frequencies because of the processing method at low frequencies. This accuracy level is acceptable for using a single-pole Cole-Cole model as it is comparable to the results achieved by Gabriel et al. [23]. The fit error, described in [20,23] for a variety of animal and human tissues, ranged from 1-10 units and 1-10 S/m for both dielectric constant and effective conductivity. The goodness of fit was also determined based on the chi-squared values for real and imaginary parts separately using equations 3 and 4.
where,
N is the number of measurements points per sweep (N= 501)
is the estimated real part of permittivity.
is the measured real part of permittivity.
is the estimated imaginary part of permittivity.
is the measured imaginary part of permittivity.
Figure 5.
Absolute error in modelled Dielectric constant (top) and effective conductivity(bottom) observed across the frequency range and measurements.
Figure 5.
Absolute error in modelled Dielectric constant (top) and effective conductivity(bottom) observed across the frequency range and measurements.
3. Results
The fit of the Cole-Cole model was investigated using a graphical method comparing the actual measurements and the model-calculated values. Upon visual inspection of the trends, one measurement was observed with a poor quality of fit. A one-sided Grubb’s test was applied to identify the outliers in chi-squared values with a significance level of 0.05. The measurement that was detected earlier using a graphical method was confirmed as an outlier with a chi-squared value of 17.59. This measurement was removed from the further analysis, reducing the unique measurement count to 287. With this measurement exclusion, the maximum chi-squared value across the measurement dataset was deter-mined to be 7.87, which is far less than the goodness of fit test statistic of 553.13 for 500 degrees of freedom (not significant for p < 0.05). The five Cole-Cole parameters and chi-squared values are grouped by tissue type and shown in Figure 6. As observed in the graphs, the parameter values and the chi-squared value distributions overlap for the normal and abnormal tissue groups. It is challenging to define a specific range for each parameter to differentiate the abnormal from the normal tissues.
ML models have the potential to classify this measurement dataset. For the ML modelling, the raw measurement dataset was replaced by the 5 Cole-Cole parameters, i.e., five features per measurement, and split into training and test data (70/30). Per Table 2, the dataset is imbalanced as most of the tissues were labelled as Normal (Normal = 218, Abnormal = 69) per the pathology reports. Developing an ML model with this dataset without addressing the imbalance may create a bias towards normal measurements due to the abundance of normal measurements. To overcome this data imbalance, the Abnormal class of the training data set was augmented using Synthetic Minority Oversampling Technique (SMOTE) to produce a balanced dataset.
The five Cole-Cole parameters are expressed in different units and have significantly different scales, so the Normalization technique is needed to convert the dataset to the same scale. Scikit-learn’s [24] MinMaxScalar was used to normalize the data set. Normalization was selected over standardization because histograms of the parameters did not indicate a Gaussian distribution. Additionally, the normalization technique does not require any knowledge of the underlying distribution.
For this binary classification problem, we considered 13 different classification models shown in Table 3. The averaged model metrics from cross-validation runs, also shown in Table 3, indicate that most ML models are reasonably accurate (close to 1), with the Extra Trees (ET) classifier [25] model performing the best.
ET classifier was selected for final testing with the hold-out dataset. The ET classifier was applied to the test dataset, which produced the results shown in Table 4. The Receiver Operating Characteristic (ROC) curve for the ET classifier shown in Figure 7 is the probability curve at various thresholds separating the signal from the noise. The Area Under the Curve (AUC) has a near-perfect value of 0.99, indicating that the model performs well in distinguishing the Normal and Abnormal tissues. Another important and commonly used performance metric is the confusion matrix shown in Figure 8. Again, the model shows good performance in predicting both normal and abnormal tissue classes. Lastly, the feature importance was calculated to determine the significant features that resulted in the model’s success. See Figure 9.
4. Discussion
There is enough preliminary evidence as studies have been conducted on both animal and human tissues to characterize their dielectric properties and notice any change in them as they deviate from their normal state [26,27,28]. The study detailed in this paper shows a feasible tissue investigation workflow that leverages Microwaves (MW) and Artificial Intelligence/Machine Learning (AI/ML) to describe a "Dielectric Signature" for every tissue, adding another technique to Digital Pathology (DP). MW-based measurements can be incorporated into pathology lab practices to quickly capture tissue di-electric properties before processing them. The dielectric permittivity measurements, when combined with an AI algorithm, can help to predict the tissue state promptly.
The results from this study imply that the dielectric properties of each tissue are distinct, and measurements based on dielectric spectroscopy offer immediate and distinctive insights into tissue biopsy and excision without causing any damage to the tissue architecture. This work demonstrates that the dielectric spectroscopy readings can be integrated with a machine learning model to quickly identify abnormal tissues before they are processed in pathology labs. This quick processing can help triage the patients and start empirical therapies, if needed. Once dielectric properties of a significant number of normal and abnormal tissues are mapped, it can also open new avenues of research for it to be used as a critical intraoperative decision-making tool for assessment of tumor-free margins and deciding the further extent of tissue dissection. This is currently done using frozen sections and is time intensive as well as prone to errors.
Significant strides are being made in the field of DP to use various AI techniques for the interpretation and extraction of data from images received from pathology glass slides, but the pace has been slow. It is also plagued by various problems, including data storage issues, cost-effectiveness (due to maintenance of both conventional glass slide and digital infrastructure), non-availability of tissue blocks for additional stains/molecular analysis if needed later, occupational hazard risk due to increased strain on eyes with increasing screen time, etc. [29,30]. Most of these issues can be addressed using dielectric spectroscopy by directly analyzing the tissue sample without any processing or disturbing the natural tissue architecture. The equipment used is relatively inexpensive and easy to operate, thus making the technique more economically feasible. The analyzed tissue can also be further utilized to undergo molecular, cytological, or histopathological analysis.
This technique can be further utilized in clinical pathology. Liu et al., in their study done in 2021, showed that the dielectric properties of normal red blood cells differed significantly from those of sickle cell disease after subjecting them both to hypoxia [31]. This study has provided insight and further potential for dielectric spectroscopy to be used in the field of hematology, as cell properties fluctuate with changes in their biochemical and genetic makeup. Hence, it can bring a paradigm shift in how we approach diseases such as leukemia, lymphoma, hemoglobinopathies, and other blood dyscrasias. In 2019, Hussein et al. characterized the peculiar dielectric signature of breast cancer tissue as compared to normal healthy breast tissue. They also discovered that the dielectric characteristics of two separate malignancies, breast, and colon, were distinct and exhibited no relation to one another [32]. We envision that these findings can lead to the development of non-invasive microwave-based dielectric spectroscopic instruments for the detection of cancers and other alterations in potentially every organ system of the body.
However, even with the immense potential to evolve into a prominent diagnostic tool, using dielectric spectroscopy needs extensive research as not many studies are available to properly evaluate the dielectric properties of all the body tissues, clinical translation of these measurements, and its potential limitations. One of the major challenges of incorporating AI in DP is the continually increasing information and its com-prehensive assessment by the pathologist. This majorly influences the quality of the data and, thus, the reliability of the AI model. Moreover, the implication of AI-based techniques face challenges such as potential randomized trials, which focus on analyzing the advantages for pathologists and patients simultaneously as it demands precise clinical data. Having said that, this study also has certain shortcomings. The sample size consists of only 71 patients with restricted pathologies. More studies with larger sample sizes and a diverse array of pathologies being investigated are needed to lend credence to the use of this technique and identify the dielectric signatures of all tissues for diagnostic or therapeutic purposes. Also, tissues were classified binarily as abnormal or normal based on histopathological analysis, and then their dielectric properties were compared, but as a fact, a lot of diseases, such as cancer, progress and develop sequentially from normal tissue to adenoma to carcinoma in-situ and eventually into a penetrating carcinoma. These stages may have varying dielectric properties and will not fit into the binary classification, thus eliciting a need to evaluate such pathological processes for having a signature di-electric progression spectrum. The coaxial probe technique employed in this study to assess the dielectric properties of tissues addresses many of the drawbacks of existing methods. This makes it necessary to train the AI model in an efficient manner by vali-dating DP into dielectric spectroscopy. However, it presumes the sample to be homogeneous and in good contact with the probe; thus, air bubbles and uneven sample surfaces can result in erroneous results. The boundaries of what can be measured are determined by several parameters, including probe design and materials (and hence impedance), precision of the probe fabrication procedure, calibration procedure (standards utilized), and measurement equipment capabilities (i.e., the VNA) [33].
Lastly, the model’s feature importance result gives a good insight into the primary features that make the model successful. As shown in Figure 9, the tissue conductivity has the highest importance, while the alpha parameter has the lowest importance. Typically, abnormal tissues have lower conductivity than normal tissues (see Figure 6e). Because of the importance of conductivity, we assume that it is important to maintain the tissue moisture level prior to collecting the MW measurements.
As discussed so far, dielectric spectroscopy measurements can be a valuable technique to quickly investigate or identify tissue class. However, this approach has several benefits and limitations that must be considered. The advantages include non-destructive and non-invasive nature, little or no effort needed for sample preparation, investigating the response for a broad frequency range, ability to measure solids, semi-solids, and polar liquids, flexibility to adjust the technique, and can potentially be combined with other variables such as temperature, pressure, and humidity. It is equally important to consider the limitations of the method. The calibration procedure is prone to issues needing additional personnel expertise for diagnosis and corrections. The method cannot be tuned to target a specific material constituent. It has the potential to be swamped by uninteresting material components or unaffected by a material component of interest.
5. Conclusions
Dielectric spectroscopy is a great diagnostic tool with immense potential when combined with Digital Pathology. This work demonstrated the potential of dielectric properties on as a novel digital marker in classifying normal and abnormal human tissues within the gastrointestinal tract. Further research and studies are needed to explore broader ap-plications within pathology and other tissues to demonstrate the capability of this method leveraging artificial intelligence.
Author Contributions
S.G. P.S. and S.P.A. defined the review scope, context, and purpose of the study. P.S performed all experiments and data collection. S.G performed data analysis and generated all the figures. S.G., P.S., K.G., M.S. and P.A. conducted literature review and drafted the manuscript. S.S. provided clinical perspectives and expertise for the study. S.D., S.R., D.M and S.P.A., provided overall con-sultation and expertise for the dielectric spectroscopy study. All authors read and performed a critical review of the manuscript. S.G. and S.P.A. performed the cleaning and organization of the manuscript. S.P.A. provided conceptualization, supervision, and project administration. All au-thors have read and agreed to the published version of the manuscript.
Funding
This research was supported by the 2021 Gastroenterology & Hepatology Research Innovation award, received by S.P.A. from GIH Division, Department of Medicine, Mayo Clinic, Rochester, MN, US.
Institutional Review Board Statement
This study was performed after IRB approval from Mayo Clinic IRB committee under the Mayo IRB # is 21-000393.
Informed Consent Statement
Informed consent was obtained from the patients prior to study participation.
Data Availability Statement
The data from this study is protected according to Protected health Information (PHI) policies and not available for public use.
Acknowledgments
This work was supported by the GIH Division for the GIH Artificial Intelligence Laboratory (GAIL) and Microwave Engineering and Imaging Laboratory (MEIL), Department of Medicine, Mayo Clinic, Rochester, MN USA.
Conflicts of Interest
The authors declare no conflict of interest.
References
- Biologydictionary.net Editors. "Pathology." Biology Dictionary, Biologydictionary.net, 27 Apr. 2017, https://biologydictionary.net/pathology/.
- Grobholz, R. Digitale Pathologie. Pathologe 39, 228–235 (2018). [CrossRef]
- Slaoui, M., Bauchet, AL., Fiette, L. (2017). Tissue Sampling and Processing for Histopathology Evaluation. In: Gautier, JC. (eds) Drug Safety Evaluation. Methods in Molecular Biology, vol 1641. Humana Press, New York, NY. [CrossRef]
- Raouf, E. Nakhleh, Jan A. Nowak; Mining Formalin-Fixed, Paraffin-Embedded Tissues: A Wealth of Knowledge or Fool’s Gold?. Arch Pathol Lab Med 1 November 2014; 138 (11): 1426–1427. [CrossRef]
- Labpedia.net. 2022. Surgical Pathology - Part 1- Histopathology, Biopsies - Labpedia.net. [online] Available at: https://labpedia.net/surgical-pathology-part-1-histopathology-biopsies/ [Accessed 30 August 2022].
- ALPF Medical Research. 2022. Interpretation of Frozen Sections - Orbital Tumors. [online] Available at: https://www.alpfmedical.info/orbital-tumors/interpretation-of-frozen-sections.html [Accessed 30 August 2022].
- Sim, J. and Sim, J., 2022. The Pros and Cons of FFPE vs Frozen Tissue Samples. [online] Biorepository. Available at: https://www.geneticistinc.com/blog/the-pros-and-cons-of-ffpe-vs-frozen-tissue-samples [Accessed 30 August 2022].
- Alshieban S, Al-Surimi K. Reducing turnaround time of surgical pathology reports in pathology and laboratory medicine departments. BMJ Qual Improv Rep. 2015 Nov 24;4(1):u209223.w3773. [CrossRef] [PubMed] [PubMed Central]
- M Laakman, MD, Stephanie J Chen, MD, Kim S Lake, John L Blau, MD, D Anand Rajan, KD, MBBS, Megan I Samuelson, MD, Robert A Robinson, MD, PhD, Frozen Section Quality Assurance: Using Separate Frozen Section Slide Preparation Times and Interpretative Time Measurements to Improve Process, American Journal of Clinical Pathology, Volume 156, Issue 3, September 2021, Pages 461–470. [CrossRef]
- Pallua, J. D. , et al. "The future of pathology is digital." Pathology-Research and Practice 216.9 (2020): 153040.
- Ramamurthy B, Coffman FD, Cohen S. A perspective on digital and computational pathology. J Pathol Inform. 2015 Jun 3;6:29. [CrossRef] [PubMed] [PubMed Central]
- Betmouni S. Diagnostic digital pathology implementation: Learning from the digital health experience. Digit Health. 2021.
- Baxi, V. , Edwards, R., Montalto, M. et al. Digital pathology and artificial intelligence in translational medicine and clinical practice. Mod Pathol.
- Fahmy, H. M. , Hamad, A. M., Sayed, F. A., Abdelaziz, Y. S., Abu Serea, E. S., Mustafa, A. B. E., Mohammed, M. A., & Saadeldin, A. M. (2020). Dielectric spectroscopy signature for cancer diagnosis: A review. Microwave and Optical Technology Letters, 62(12), 3739–3753. [CrossRef]
- Cheng JY, Abel JT, Balis UGJ, McClintock DS, Pantanowitz L. Challenges in the Development, Deployment, and Regulation of Artificial Intelligence in Anatomic Pathology. Am J Pathol. 2021 Oct;191(10):1684-1692. Epub 2020 Nov 24. [CrossRef] [PubMed]
- Niazi, M. , Parwani, A., & Gurcan, M. (2019). Digital pathology and artificial intelligence. The Lancet Oncology, 20(5).
- https://www.keysight.com/us/en/home.html.
- https://www.muhealth.org/conditions-treatments/surgical/bariatric-surgery/getting-started/anatomy-and-function-of-the-gi-tract.
- Cole K S and Cole R H 1941 Dispersion and absorption in dielectrics I. Alternating current characteristics J. Chem. Phys.
- M. Lazebnik, M. C. Converse, J. H. Booske and S. C. Hagness, “Ultra-wideband temperature-dependent dielectric properties of animal liver tissue in the microwave frequency range,” Phys. Med. Biol.
- Van Rossum G, Drake FL. Python 3 Reference Manual. Scotts Valley, CA: CreateSpace; 2009.
- Newville, Matthew & Stensitzki, Till & Allen, Daniel & Ingargiola, Antonino. (2014). LMFIT: Non-Linear Least-Square Minimization and Curve-Fitting for Python.
- Gabriel S, Lau R W and Gabriel C 1996b The dielectric properties of biological tissues: III. Parametric models for the dielectric spectrum of tissues Phys. Med. Biol.
- Pedregosa F, Varoquaux, Ga"el, Gramfort A, Michel V, Thirion B, Grisel O, et al. Scikit-learn: Machine learning in Python. Journal of machine learning research.
- Geurts, P. , Ernst, D. & Wehenkel, L. Extremely randomized trees. Mach Learn 63, 3–42 (2006).
- Gabriel, C. , & Peyman, A. (2018). Dielectric Properties of Biological Tissues; Variation With Age. Conn’s Handbook of Models for Human Aging, 939–952. [CrossRef]
- Amin, B. , Elahi, M. A., Shahzad, A., Porter, E., McDermott, B., & O’Halloran, M. (2018). Dielectric properties of bones for the monitoring of osteoporosis. Medical & Biological Engineering & Computing. [CrossRef]
- Hussein M, Awwad F, Jithin D, El Hasasna H, Athamneh K, Iratni R. Breast cancer cells exhibits specific dielectric signature in vitro using the open-ended coaxial probe technique from 200 MHz to 13.6 GHz. Sci Rep. 2019 Mar 18;9(1):4681. [CrossRef] [PubMed] [PubMed Central]
- Rossignol AM, Morse EP, Summers VM, Pagnotto LD. Video display terminal use and reported health symptoms among Massachusetts clerical workers. J Occup Med. 1987 Feb;29(2):112-8. PMID: 3819890.
- Jahn SW, Plass M, Moinfar F. Digital Pathology: Advantages, Limitations and Emerging Perspectives. J Clin Med. 2020 Nov 18;9(11):3697. [CrossRef] [PubMed] [PubMed Central]
- Liu J, Qiang Y, Du E. Dielectric spectroscopy of red blood cells in sickle cell disease. Electrophoresis. 2021 Mar;42(5):667-675. Epub 2021 Feb 3. [CrossRef] [PubMed]
- Hussein, M. , Awwad, F., Jithin, D. et al. Breast cancer cells exhibits specific dielectric signature in vitro using the open-ended coaxial probe technique from 200 MHz to 13.6 GHz. Sci Rep 9, 4681 (2019). [CrossRef]
- Agilent. Basics of Measuring the Dielectric Properties of Materials; Agilent Technologies: Santa Clara, CA, USA, 2005. [Google Scholar]
Figure 1.
Open-ended coaxial dielectric spectroscopy test equipment [17]. Labels: (1) Stand with probe clamp (2) Flexible cable (3) Slim form probe (4) Plastic vial (5) Tissue (6) Platform/Laboratory jack (7) USB VNA (8) VNA Software.
Figure 1.
Open-ended coaxial dielectric spectroscopy test equipment [17]. Labels: (1) Stand with probe clamp (2) Flexible cable (3) Slim form probe (4) Plastic vial (5) Tissue (6) Platform/Laboratory jack (7) USB VNA (8) VNA Software.
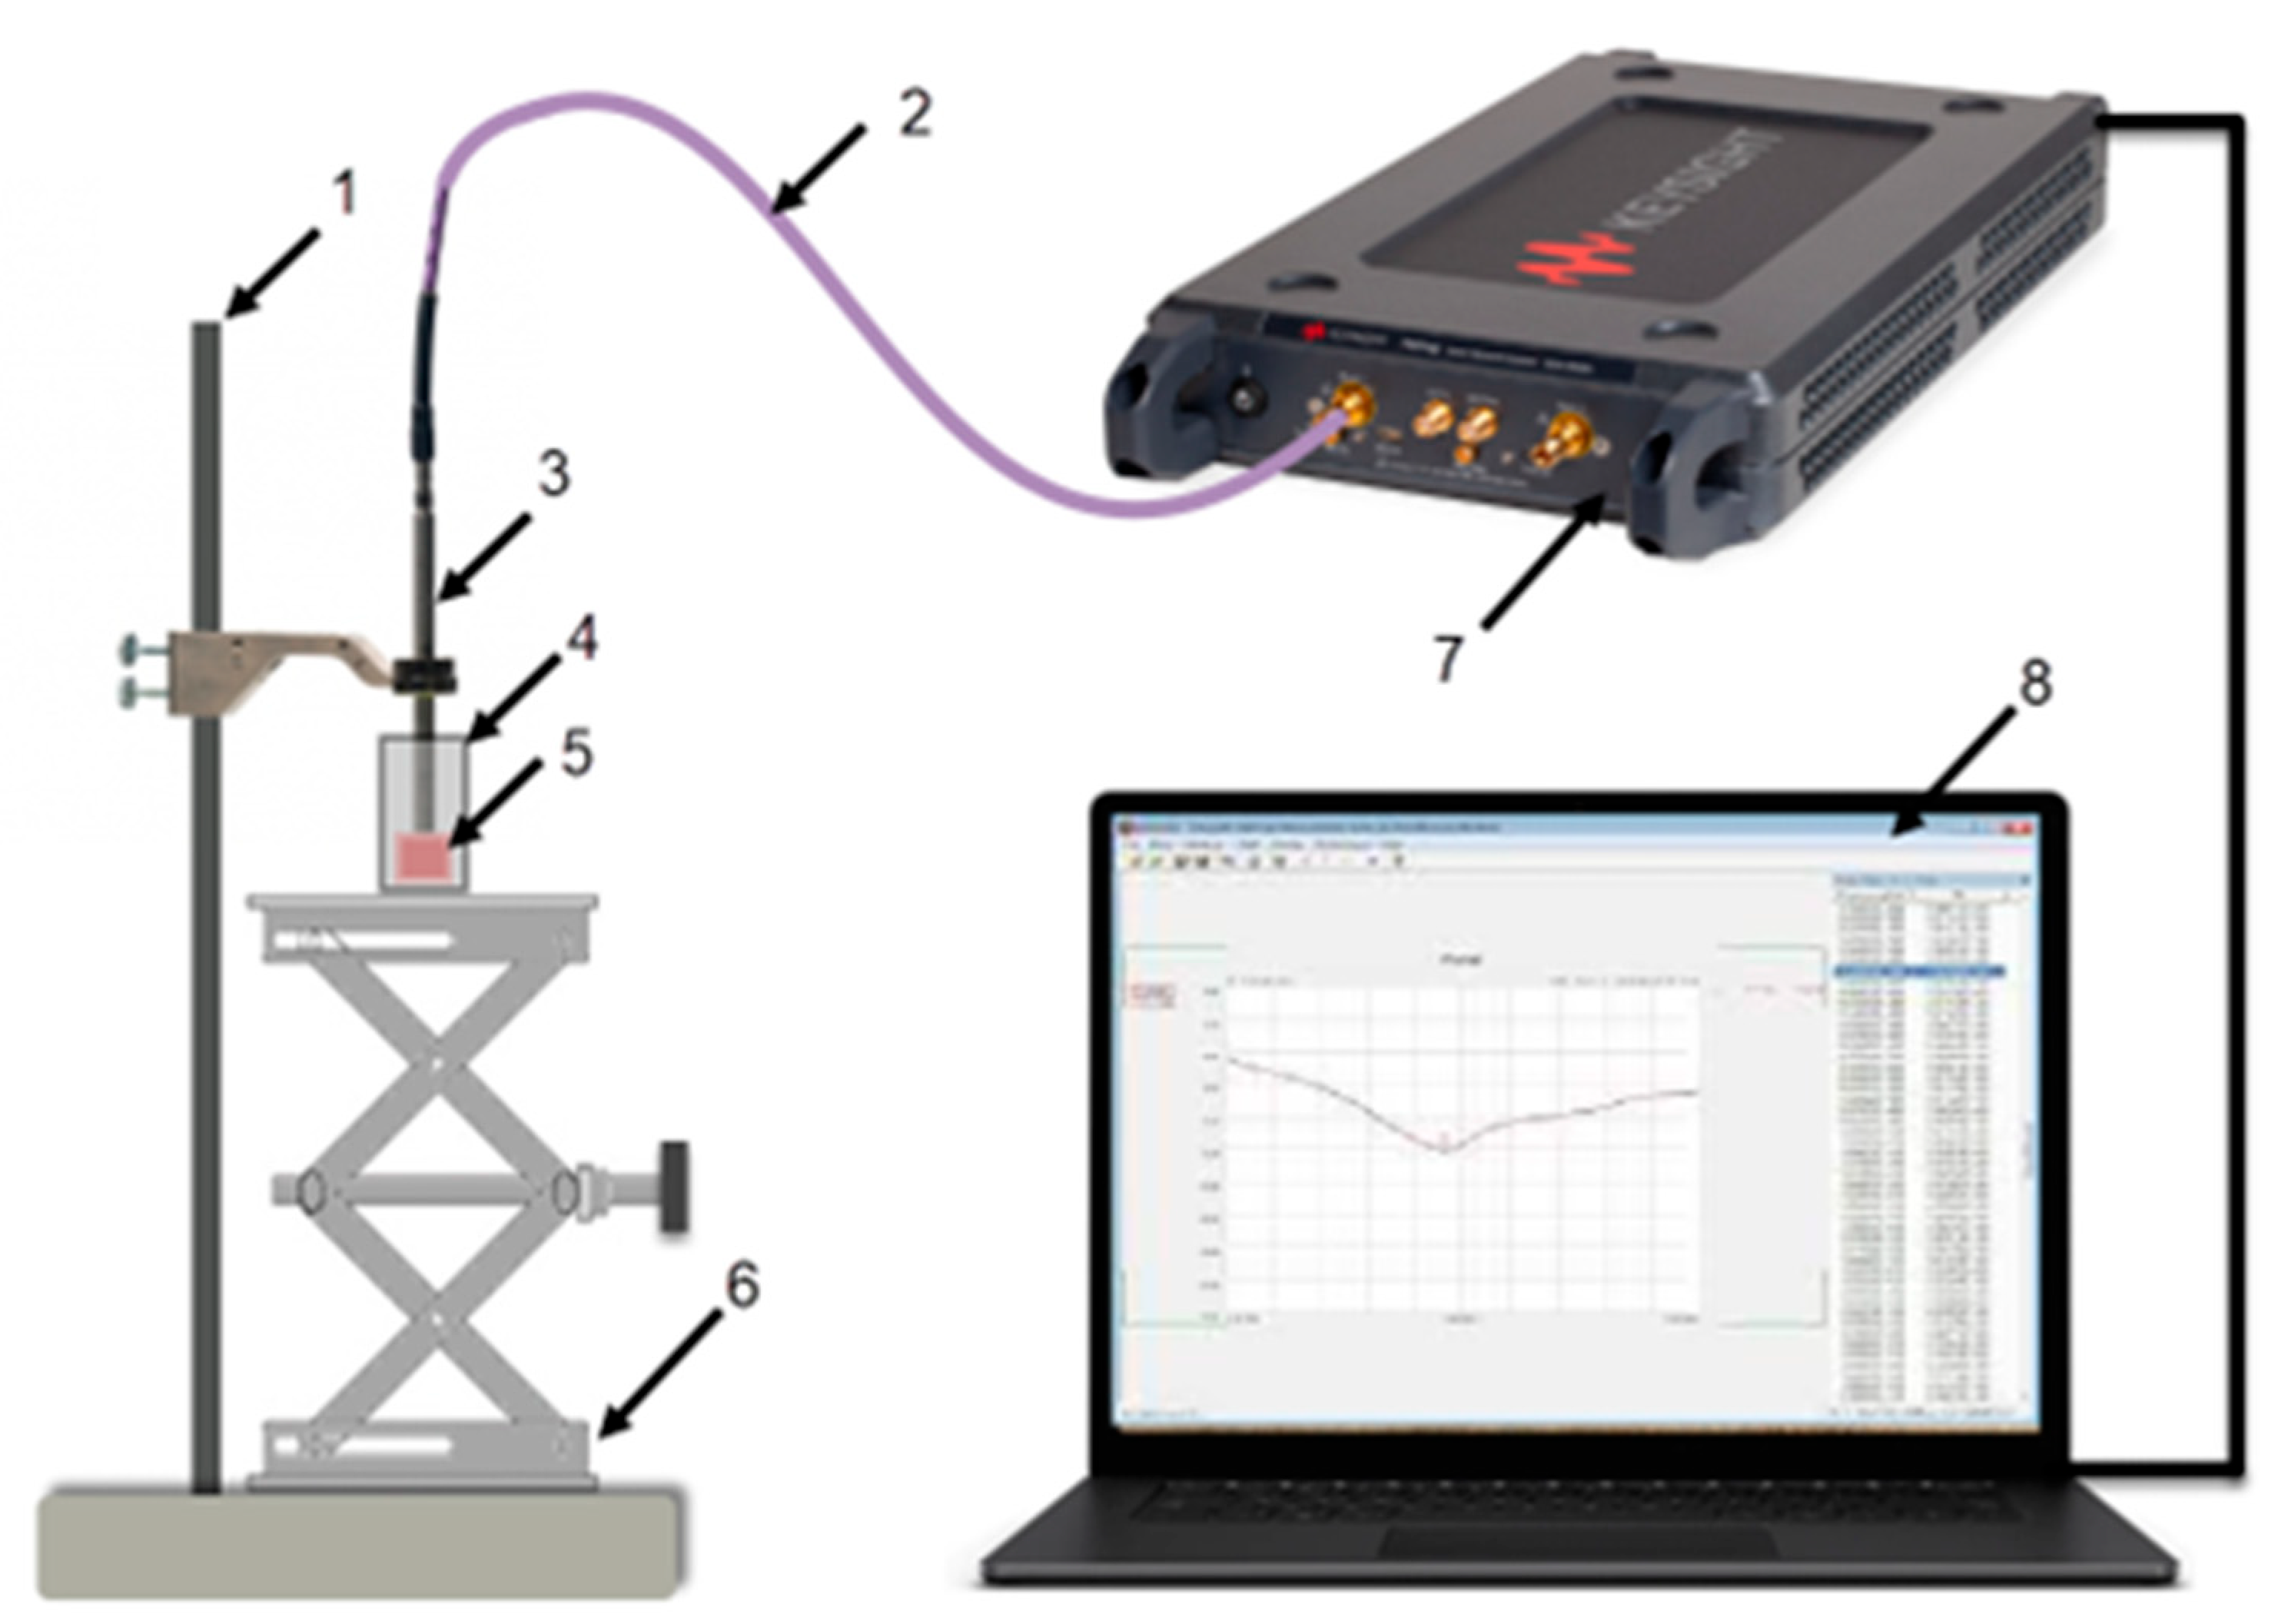
Figure 2.
Excised tissue samples (left) from the gastrointestinal tract. Tissues were excised from approximated locations (right), shown by red dots. [18].
Figure 2.
Excised tissue samples (left) from the gastrointestinal tract. Tissues were excised from approximated locations (right), shown by red dots. [18].
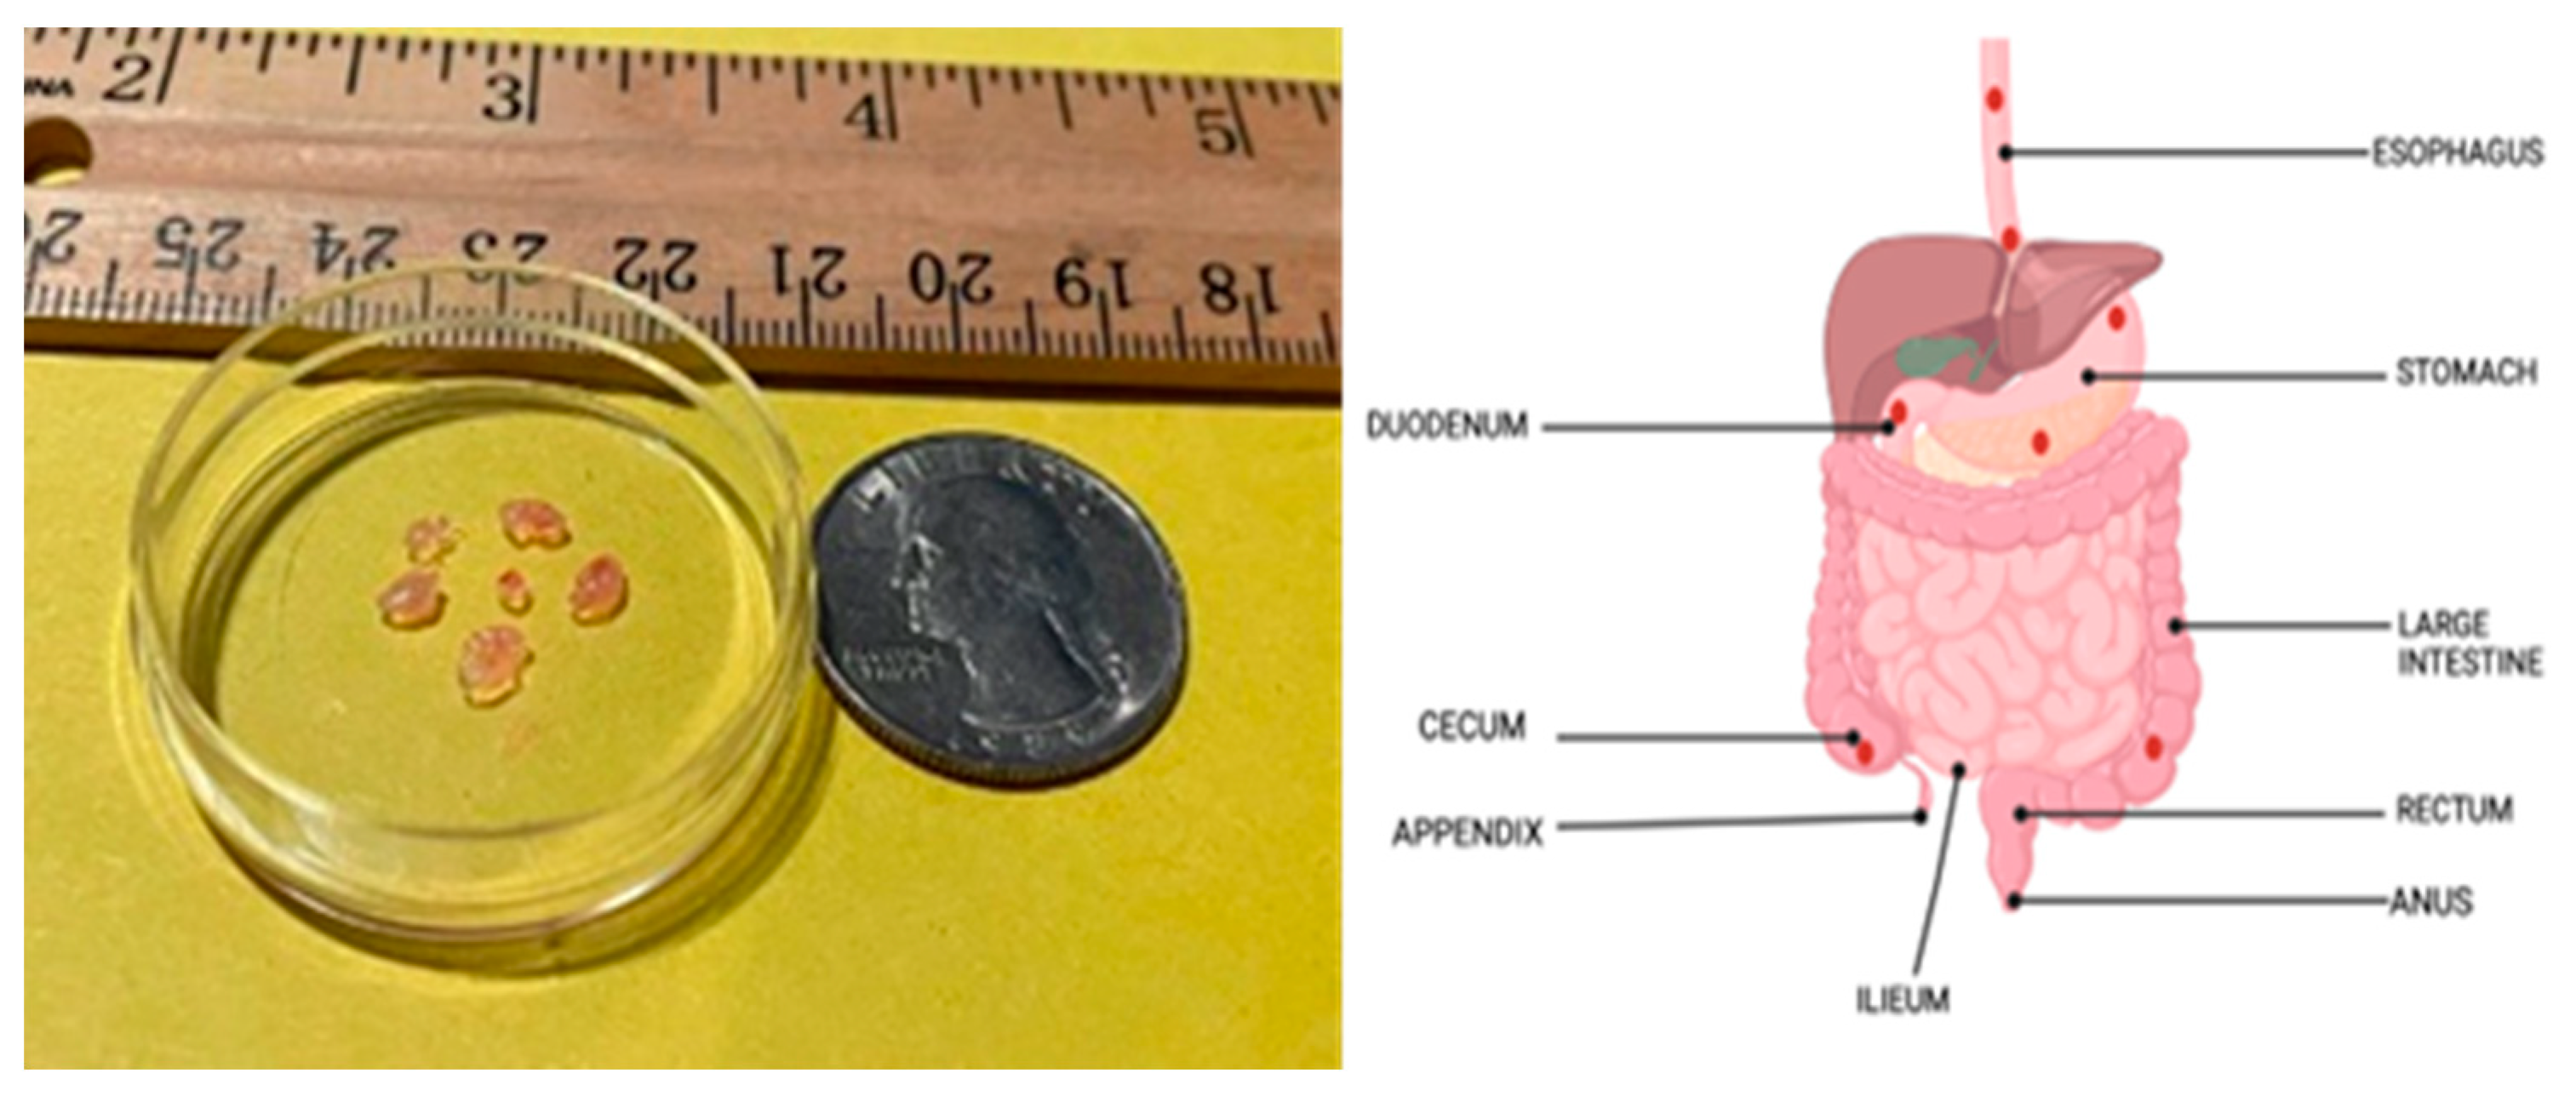
Figure 3.
Summary statistics of dielectric properties of the tissues. (A) Permittivity of normal tissue, (B) Effective conductivity of normal tissue, (A) Permittivity of abnormal tissue, (B) Effective conductivity of abnormal tissue.
Figure 3.
Summary statistics of dielectric properties of the tissues. (A) Permittivity of normal tissue, (B) Effective conductivity of normal tissue, (A) Permittivity of abnormal tissue, (B) Effective conductivity of abnormal tissue.
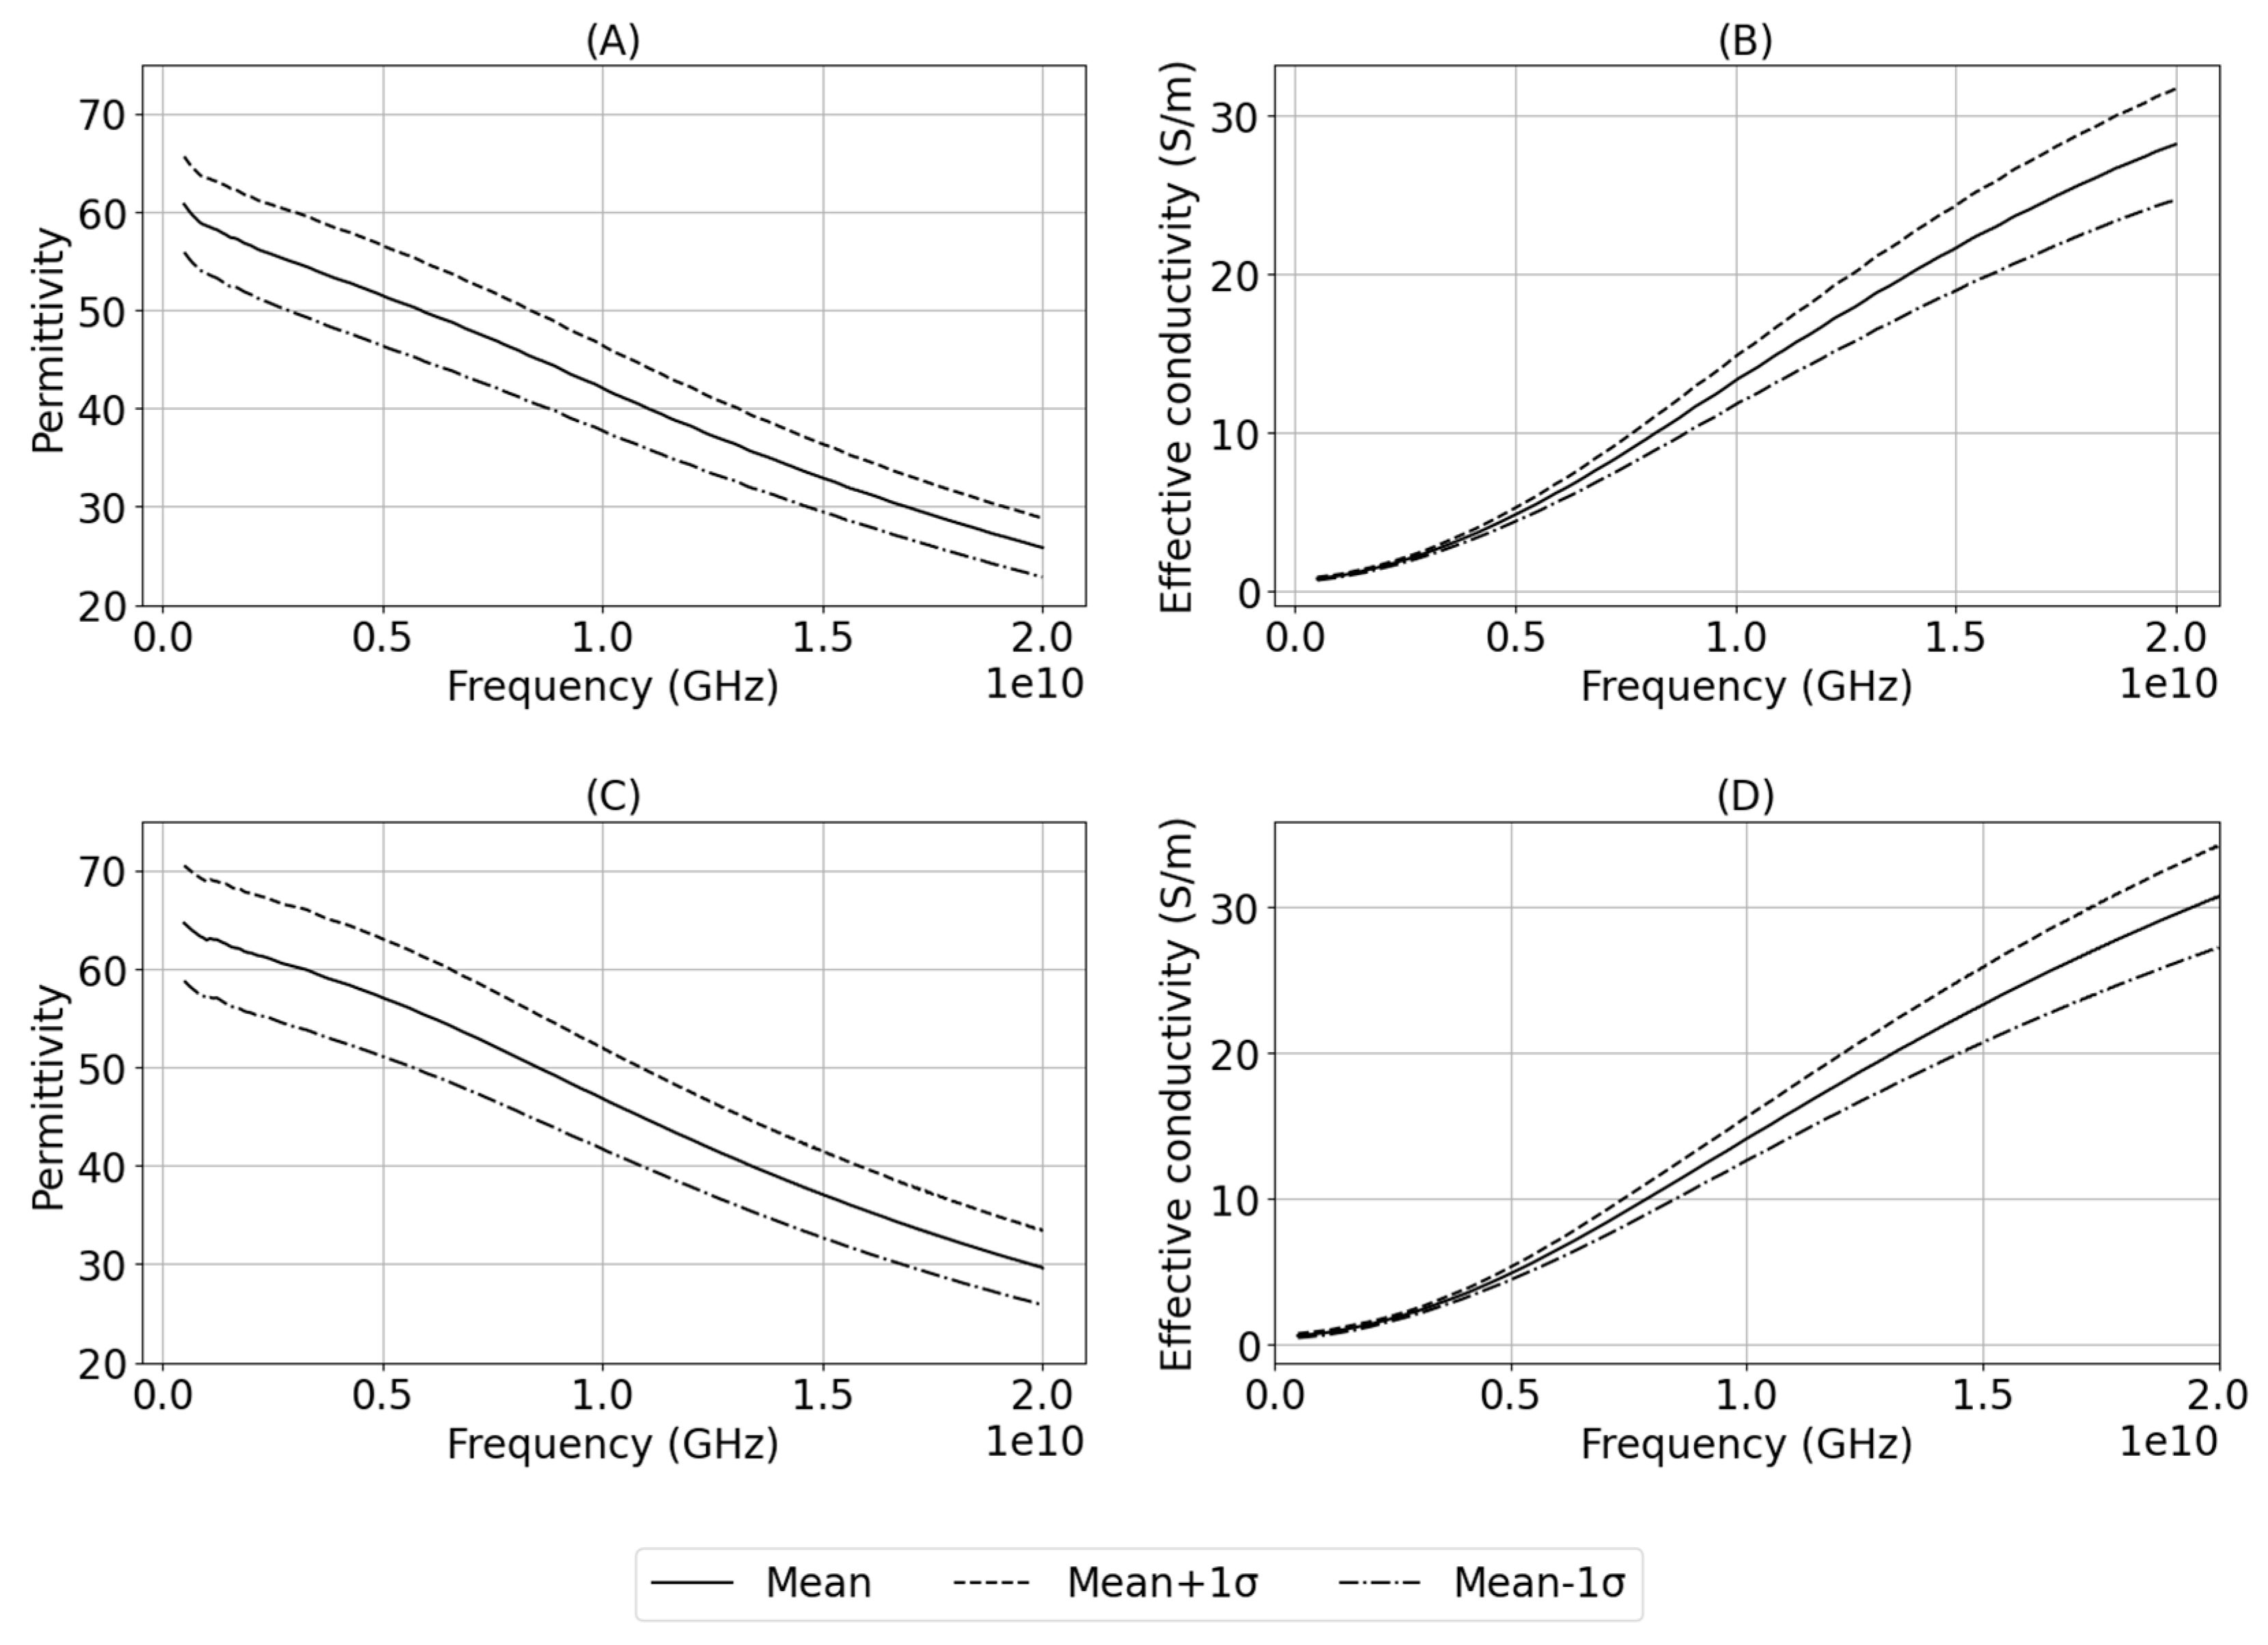
Figure 4.
Typical measurement and Cole-Cole model fit of dielectric constant (left) and loss factor (right) over a frequency range of 0.5 to 20 GHz.
Figure 4.
Typical measurement and Cole-Cole model fit of dielectric constant (left) and loss factor (right) over a frequency range of 0.5 to 20 GHz.
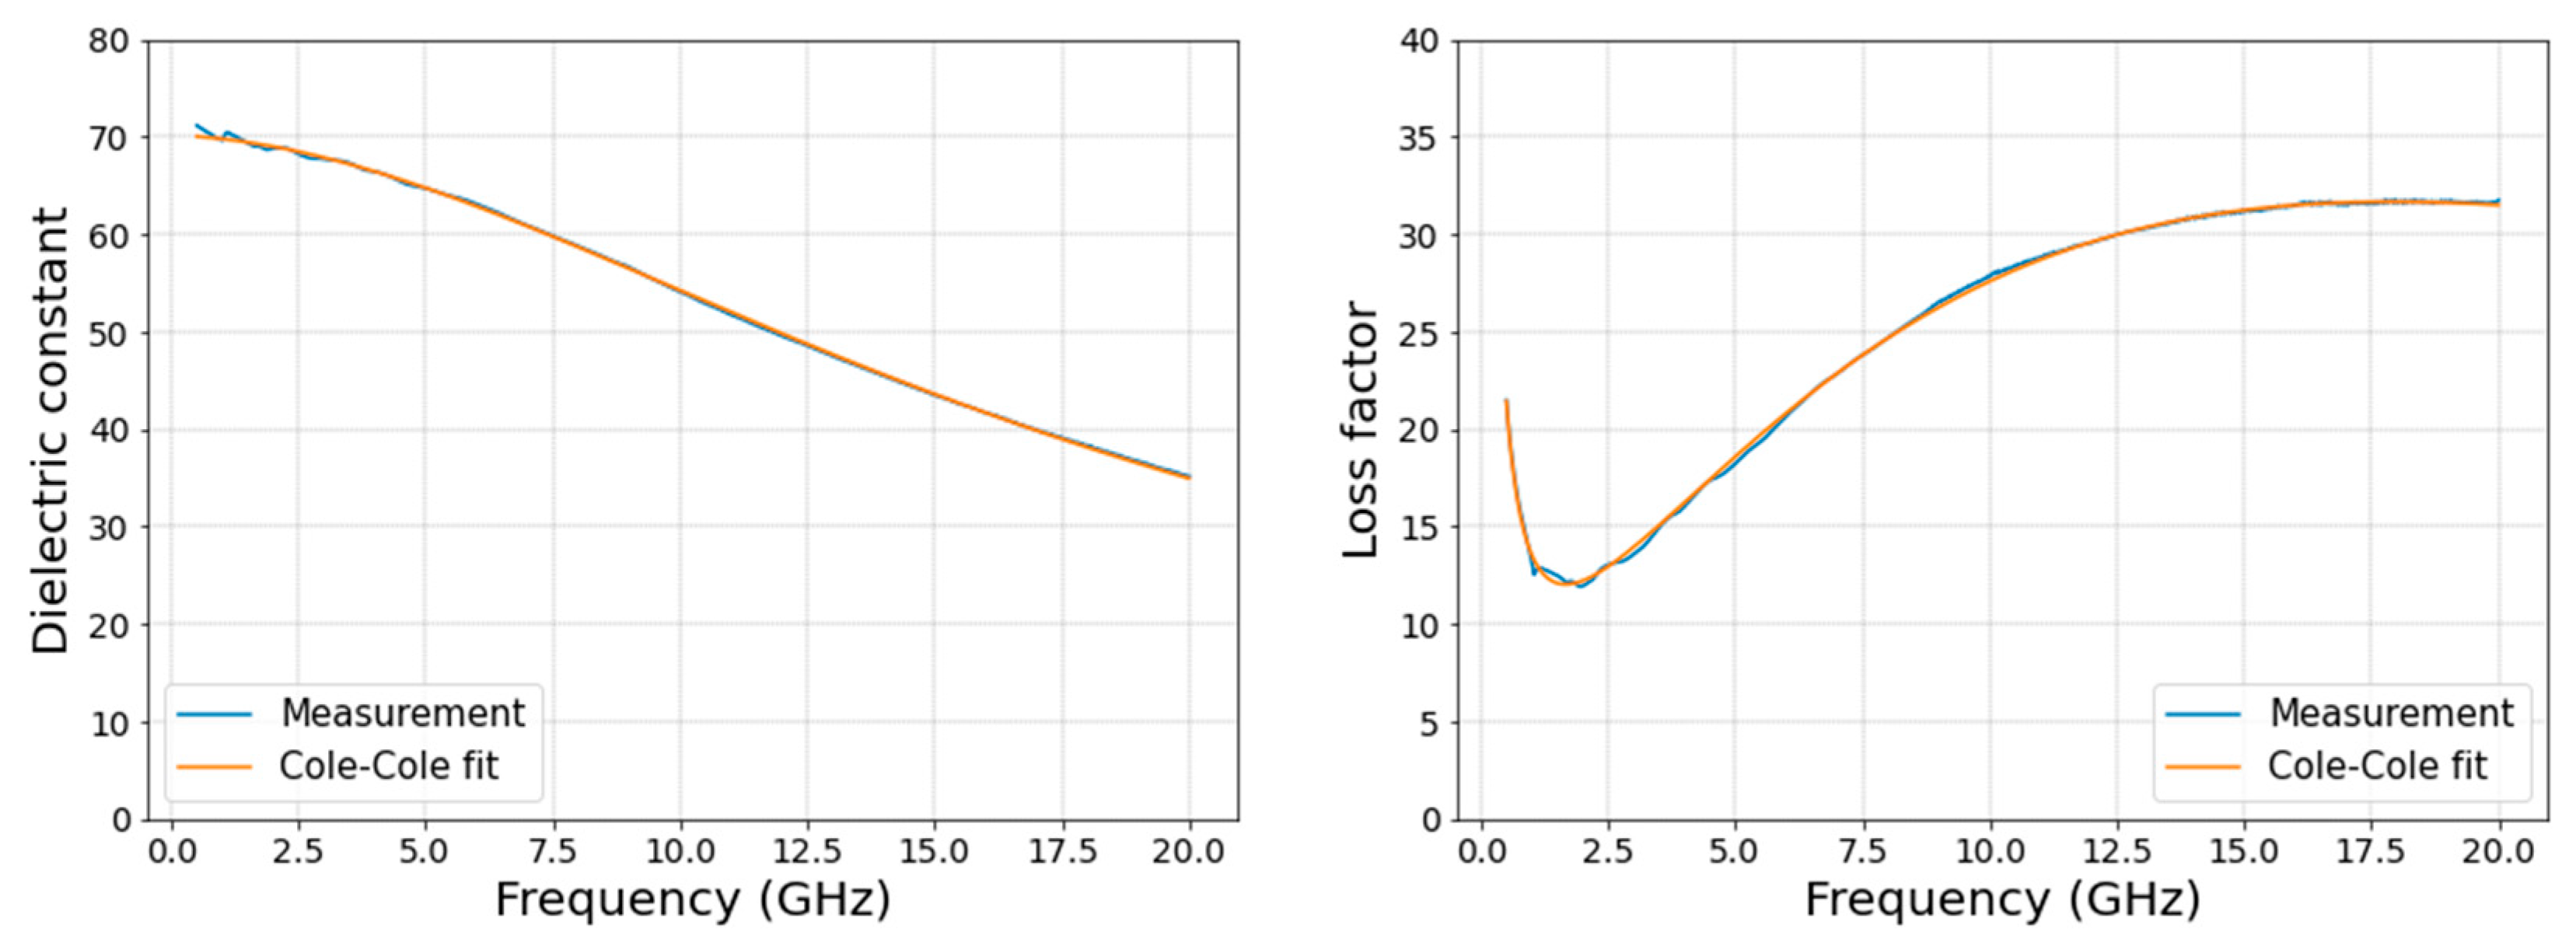
Figure 6.
Comparison of the Cole-Cole parameters between abnormal and normal tissues. (A) Dielectric constant at infinite frequency (B) Dielectric constant at static frequency (C) Generalized relaxation time (D) Exponent constant (E) Conductivity (F) Chi-square value.
Figure 6.
Comparison of the Cole-Cole parameters between abnormal and normal tissues. (A) Dielectric constant at infinite frequency (B) Dielectric constant at static frequency (C) Generalized relaxation time (D) Exponent constant (E) Conductivity (F) Chi-square value.
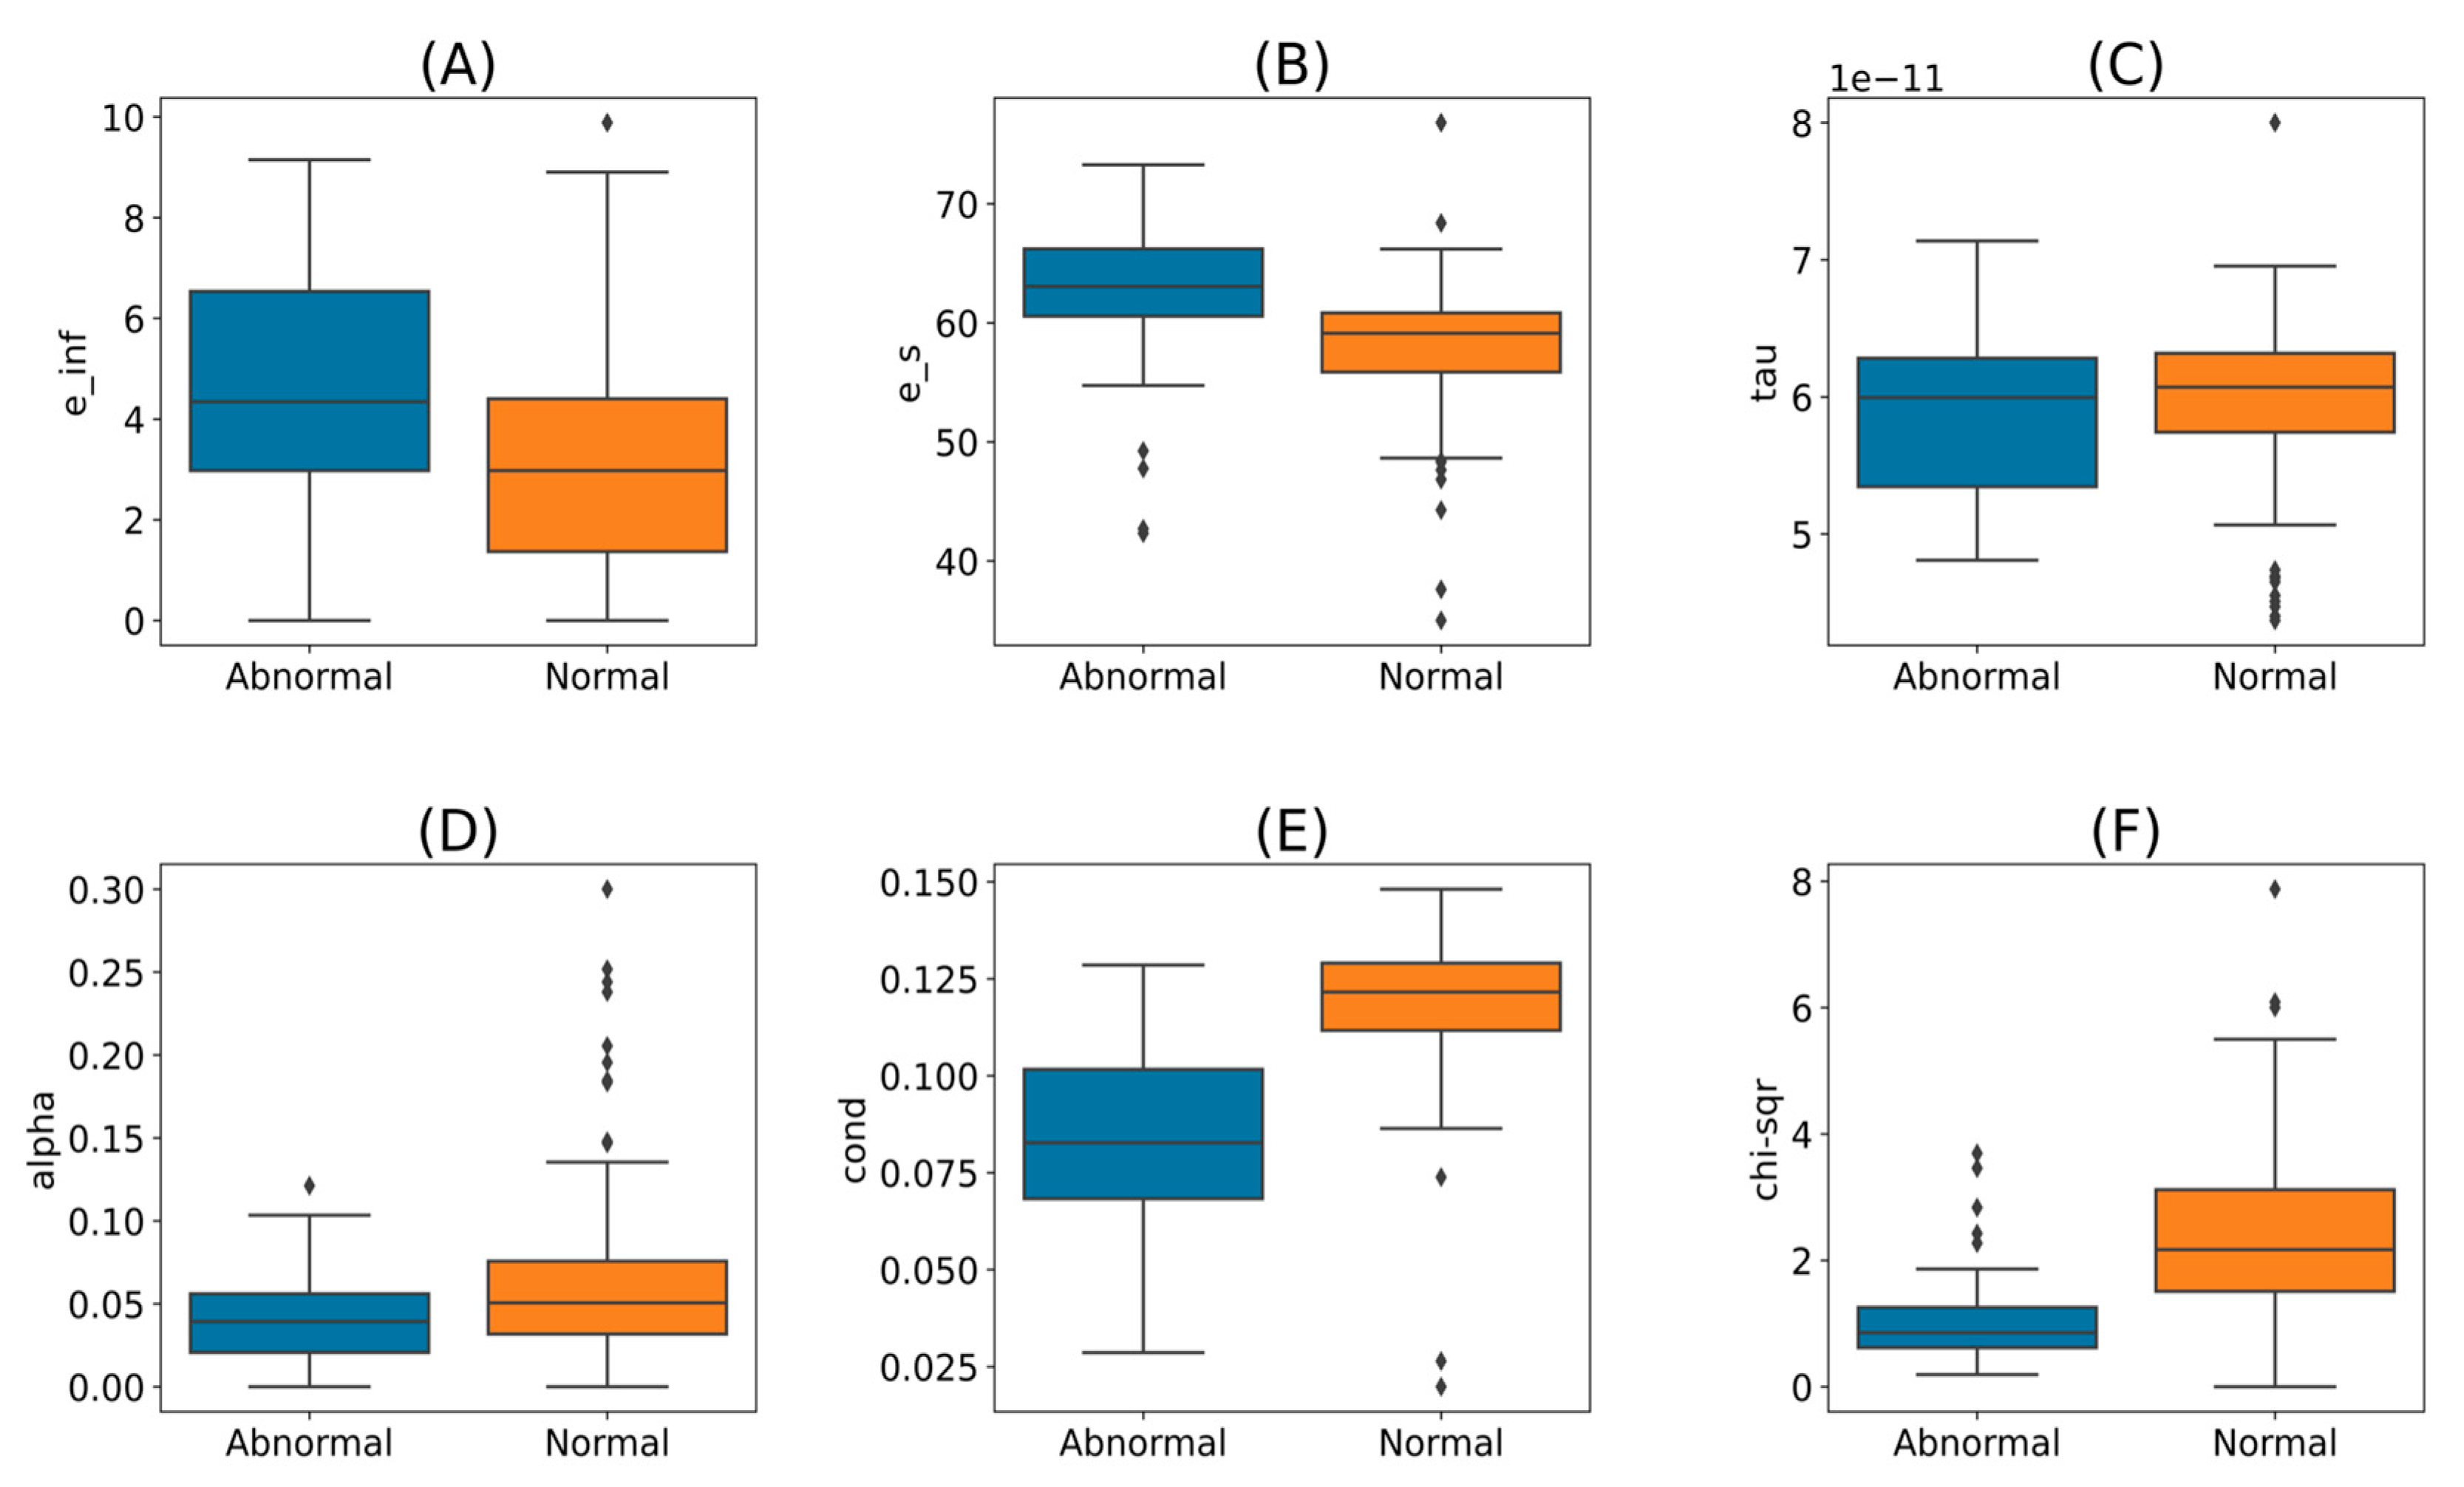
Figure 7.
ROC Curve for Extra trees classifier model.
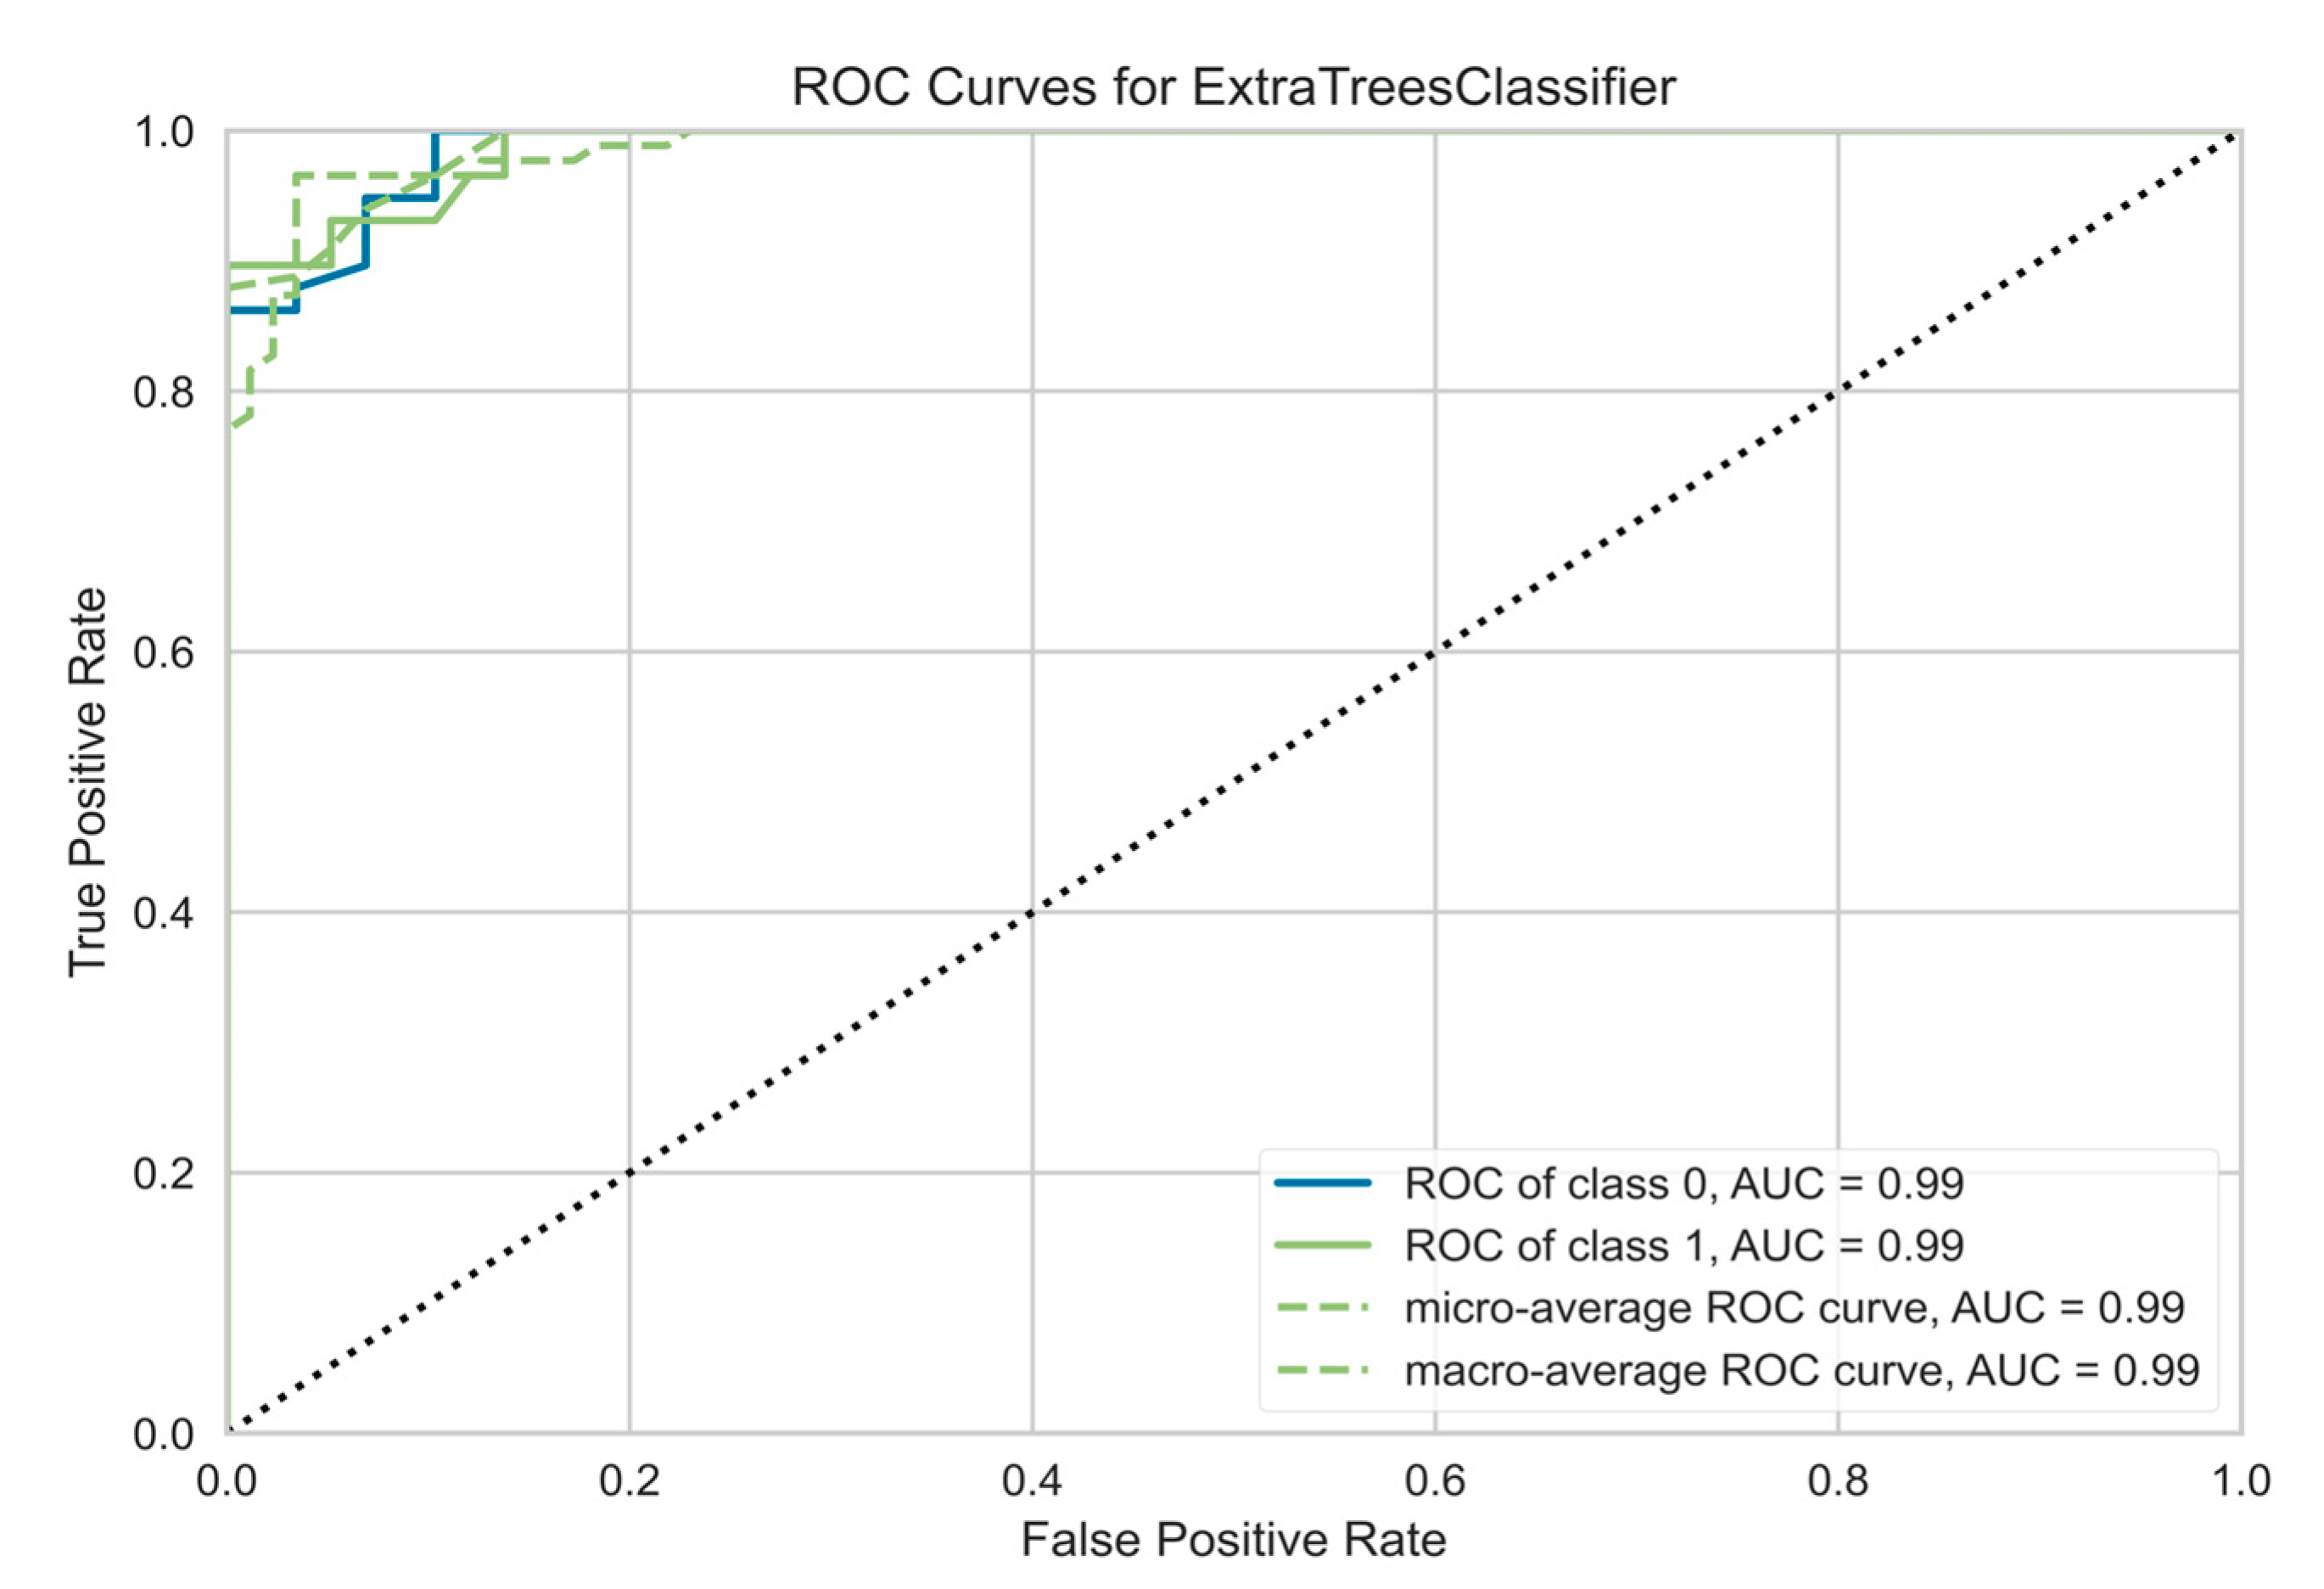
Figure 8.
Confusion matrix (Class 0 = Normal, Class 1 = Abnormal).
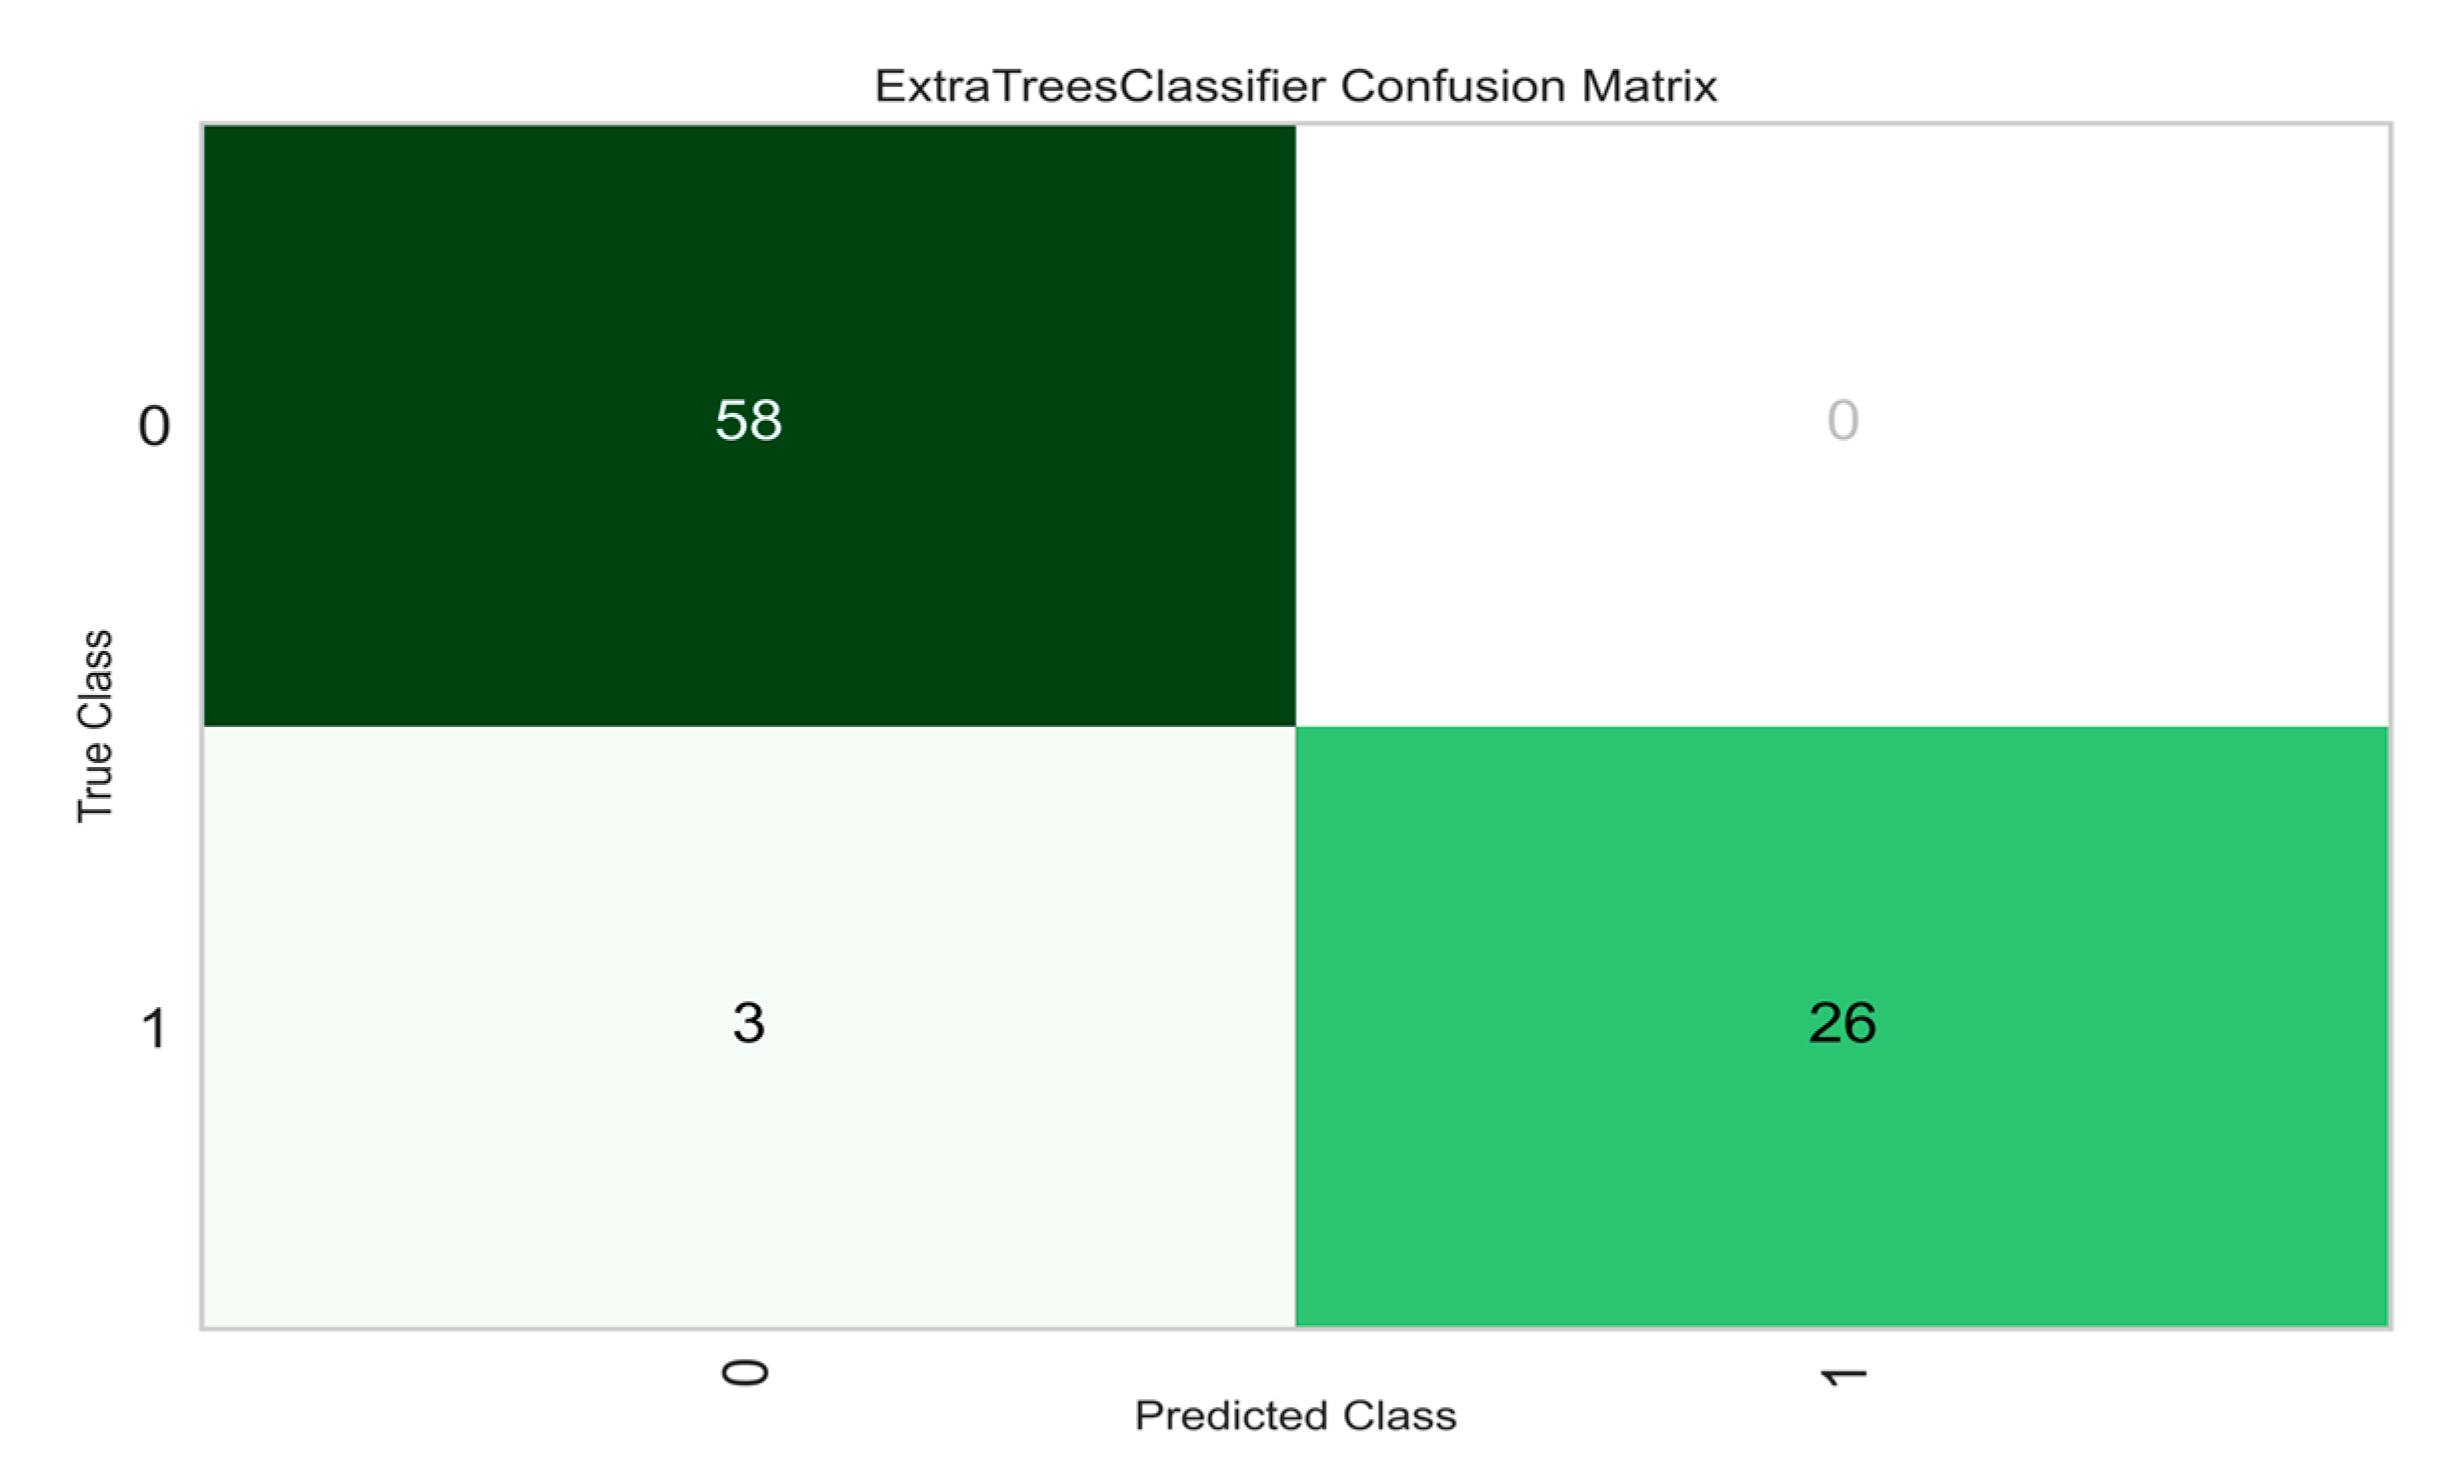
Figure 9.
Sorted importance of the Cole-Cole parameters.
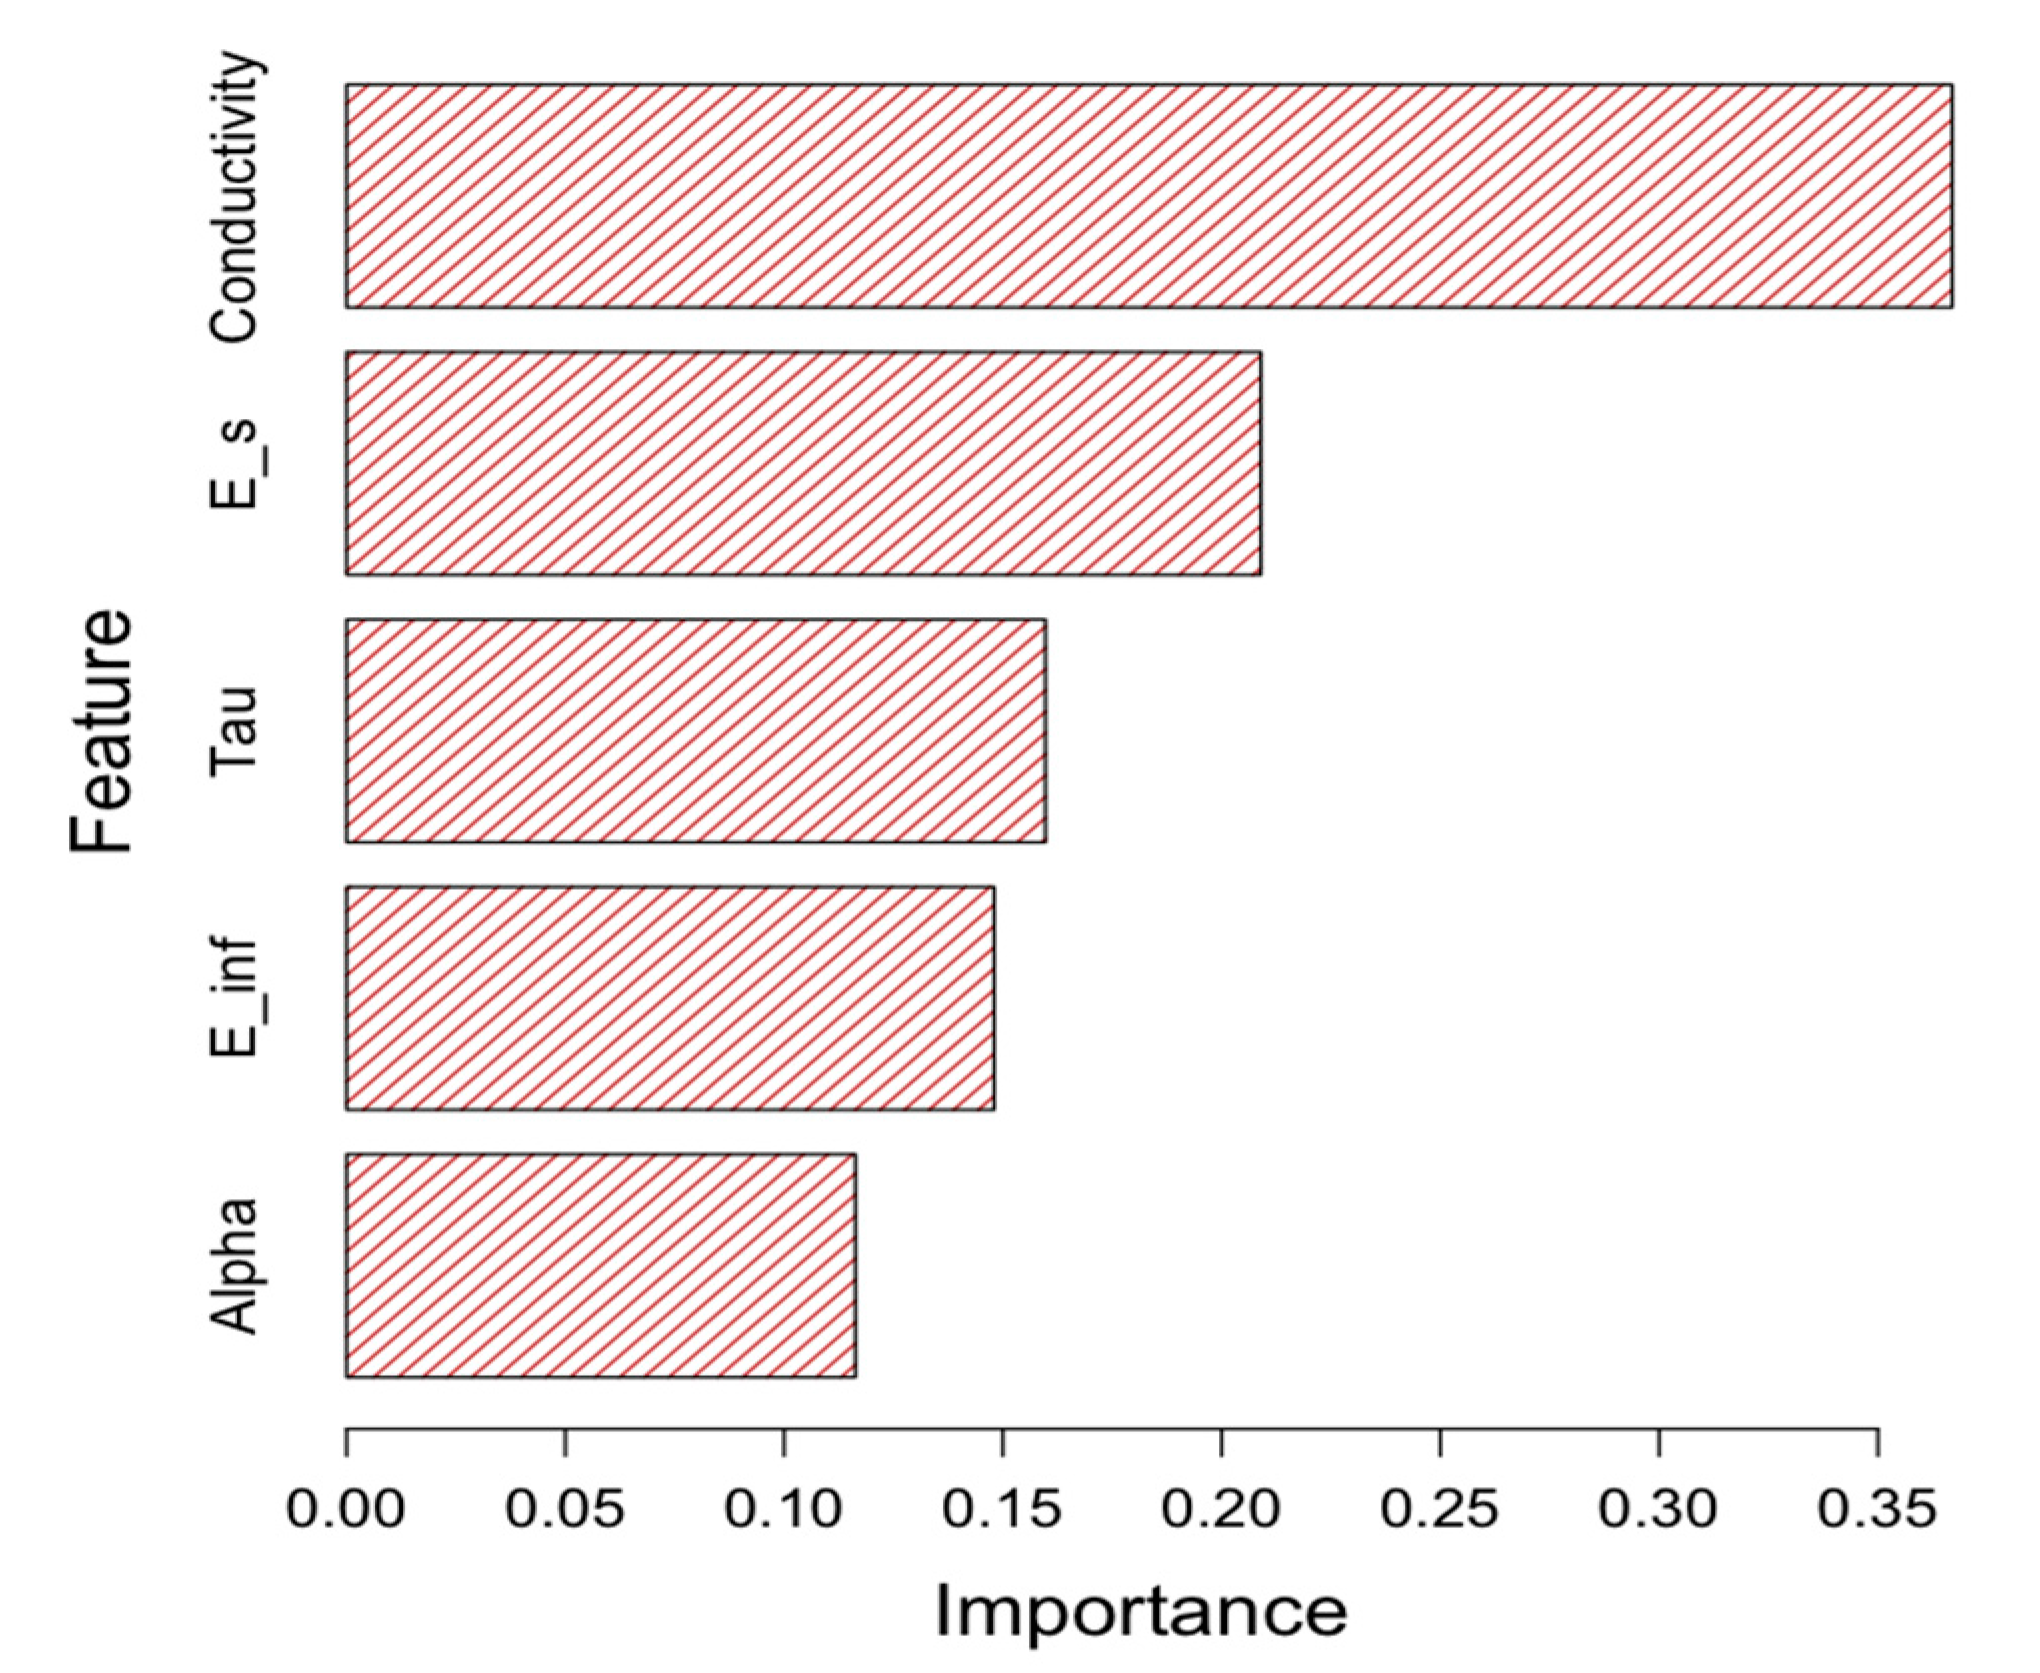

Table 1.
Test equipment.
| Equipment Description | Equipment Model |
|---|---|
| Slim form probe | N1501A Dielectric Probe Kit |
| Vector Network Analyzer (VNA) | Model P9374A |
| Flexible cable | N9910X-708, 3.28 ft, 26.5 GHz |
| PC with VNA software | USB VNA Network Analyzer Software, v18 |
Table 2.
Samples and measurement counts.
| Tissue Type | Samples | Measurements |
|---|---|---|
| Normal | 55 | 219 |
| Abnormal | 16 | 69 |
Table 3.
Average model metrics from cross-validation runs.
| Model | Accuracy | AUC | Recall | Precision | F1 |
|---|---|---|---|---|---|
| Extra Trees Classifier | 0.9350 | 0.9225 | 0.7967 | 0.8672 | 0.8233 |
| K Neighbors Classifier | 0.8951 | 0.8879 | 0.7711 | 0.7281 | 0.7290 |
| Random Forest Classifier | 0.8951 | 0.9175 | 0.7454 | 0.7152 | 0.7274 |
| Naive Bayes | 0.8950 | 0.7999 | 0.6685 | 0.7827 | 0.6950 |
| Quadratic Discriminant Analysis | 0.8851 | 0.8599 | 0.6209 | 0.7553 | 0.6695 |
| Logistic Regression | 0.8800 | 0.8046 | 0.6447 | 0.7438 | 0.6643 |
| Decision Tree Classifier | 0.8800 | 0.8300 | 0.7473 | 0.6857 | 0.7143 |
| Ridge Classifier | 0.8751 | 0.0000 | 0.6447 | 0.7833 | 0.6605 |
| Light Gradient Boosting Machine | 0.8703 | 0.9035 | 0.7234 | 0.6696 | 0.6944 |
| Gradient Boosting Classifier | 0.8702 | 0.8954 | 0.7967 | 0.6300 | 0.7021 |
| SVM - Linear Kernel | 0.8651 | 0.0000 | 0.6209 | 0.6644 | 0.6360 |
| Linear Discriminant Analysis | 0.8602 | 0.8146 | 0.6447 | 0.7572 | 0.6414 |
| Ada Boost Classifier | 0.8550 | 0.8599 | 0.7473 | 0.6078 | 0.6667 |
Table 4.
Performance metrics of Extra Trees classifier on test dataset.
| Model | Accuracy | AUC | Recall | Precision | F1 |
|---|---|---|---|---|---|
| Extra Trees Classifier | 0.9655 | 0.9896 | 0.8966 | 1.0000 | 0.9455 |
Disclaimer/Publisher’s Note: The statements, opinions and data contained in all publications are solely those of the individual author(s) and contributor(s) and not of MDPI and/or the editor(s). MDPI and/or the editor(s) disclaim responsibility for any injury to people or property resulting from any ideas, methods, instructions or products referred to in the content. |
© 2023 by the authors. Licensee MDPI, Basel, Switzerland. This article is an open access article distributed under the terms and conditions of the Creative Commons Attribution (CC BY) license (http://creativecommons.org/licenses/by/4.0/).
Copyright: This open access article is published under a Creative Commons CC BY 4.0 license, which permit the free download, distribution, and reuse, provided that the author and preprint are cited in any reuse.


