Submitted:
31 October 2023
Posted:
01 November 2023
You are already at the latest version
Abstract
In this study, additive manufacturing of reinforced parts using metallic wire as both a reinforcement component and a shape memory stimulus through Fused Deposition Modeling (FDM) was investigated. A Shape Memory Polymer (SMP) restores its original shape and recovers it upon specific stimuli. This research employed chromium-nickel metal wire as a reinforcing component to enhance mechanical properties and introduce the capability for thermal stimulation of polylactic acid (PLA) via electrical current using the "in-situ impregnation" method within FDM process. Reinforced specimens were fabricated with wire with two diameters of 0.1 and 0.15 mm, along with two volume percentages of 5 and 10. Comprehensive evaluations encompassing mechanical (tensile and flexural) and thermal properties of the printed specimens were conducted. The outcomes revealed a significant enhancement in both tensile and flexural properties of the polymer matrix due to the embedding metallic wire, even under elevated temperatures during bending test. Furthermore, the thermal properties of the reinforced specimens were examined by subjecting them to various voltages, resulting in temperature ranging from 36.4 to 150.1°C. These findings highlight the ability to tailor a wide range of mechanical properties and shape recovery in the reinforced specimens by carefully selecting the wire volume fraction, voltage, and wire diameter, thus regulating the materials properties with specific application requirements.
Keywords:
Additive Manufacturing
; Polylactic Acid
; Shape Memory Polymer
; Continuous Fibers
; Thermoplastic Composites
Introduction
Smart materials, also referred to as responsive materials, represent a category of engineered materials characterized by their capability to undergo changes in one or more properties when subjected to external stimuli. Within this class of smart materials notable examples including shape memory polymers (SMPs), shape memory alloys, piezoelectric materials, liquid crystal elastomers, and electroactive polymers [1]. Inspiration for the study of stimuli-responsive materials often stems from, such as the Venus flytrap rapid response to physical contact, closing its leaves to ensnare prey in just 100 milliseconds [2]. SMPs have emerged as widely used smart materials capable of responding to external stimuli by reverting to their original shape from a temporary shape. Shape memory effect found across a spectrum of polymers, encompassing amorphous polymers, semi-crystalline polymers, and liquid crystalline elastomers [3,4,5]. The induction of this shape-memory effect is typically achieved through thermal stimulation, involving heating above the transition temperature of the polymers, such as the glass transition temperature or melting temperature [6]. As a subclass of smart active materials, SMPs exhibit the remarkable ability to be deformed into various shapes when heated to a predetermined transition temperature. Subsequently, they can revert to their original shape when exposed to external stimuli, including heat, moisture, light, pressure, solvents, microwaves, electrical fields, and magnetic fields [7].
The versatility of these materials has led to their utilization across an expansive application such as, textiles, films, smart toys, smart actuators, novel sensors, robotics, biomedical devices, and aerospace structures. Their adaptability to different stimuli positions them at the forefront of innovation and scientific inquiry across numerous industries [8,9].
SMPs and their composites have garnered significant attention in recent years, primarily owing to their low cost, adjustable transition temperatures, lightweight, and ease of processing [1,10,11]. The integration of functional materials into these matrices has resulted in the development of shape memory polymer composites (SMPCs), characterized by enhanced mechanical characteristics and more intricate stimulus-response capabilities [12,13,14,15]. These reinforcements in SMPCs encompass a variety of materials, including nanoparticles, short fibers, and continuous long fibers [10]. SMPCs exhibit remarkable responsiveness to stimuli, including light, electricity, magnetic fields, and solution, while concurrently improving their mechanical performance [1,16]. In order to address the practical demands of real-world applications, the remote-controlled actuation of SMPs, particularly through electrical means, has become imperative. Conductive polymer nanocomposites, such as those incorporating carbon black (CB), nanocarbon powders, carbon nanotubes (CNTs), and graphene, alongside hybrid particles and fibers, as well as silver nanoparticles, exemplify multifunctional materials due to their impressive strength, electrical conductivity, and thermal stability [17,18,19,20].
Electroactive shape memory composites (E-SMCs) constitute a distinct category of stimuli-responsive smart materials, capable of shape alterations under voltage stimulation [21]. These materials hold vast potential across various domains, including robotic actuators, artificial muscles, sensors, and self-deployable devices [22]. To ensure rapid recovery under low-voltage conditions, it becomes essential to fabricate E-SMCs characterized by high conductivity, thereby facilitating the efficient generation of uniform Joule heating throughout the polymer matrix. Unlike other materials, electroactive SMPCs display reduced dependence on environmental factors and achieve shape recovery primarily through the Joule heating effect. These materials further exhibit favorable characteristics, including well-dispersed fillers, even heat distribution, remote controllability, and high driving efficiency [21,23]. In the study by Leng et al. [24], they successfully reduced the electrical resistivity of a polyurethane SMP by incorporating randomly distributed CB and a small amount of Ni micro-particles into the SMP/CB composite. When subjected to a 30 V power source, the [SMP/CB/Ni] sample reached a maximum temperature of approximately 80 °C across the entire sample, leading to nearly complete shape recovery within 120 seconds.
The fabrication of 4D shape-changing structures based on SMPs has been achieved through various methods, including commercially available techniques like spray-evaporate deposition, electrospinning, and compression molding [25,26,27]. Additionally, 4D printing has emerged as a viable manufacturing option, with SMP-based structures produced through fused deposition modeling (FDM), stereolithography (SLA), digital light processing (DLP), and Polyjet technologies [22].
Additive manufacturing (3D printing) technologies have garnered considerable interest due to their ability to produce complex geometries with exceptional reproducibility and process control an achievement often unattainable through conventional manufacturing methods like compression molding [28]. Among these technologies, FDM stands out as a prevalent choice for printing SMPs samples. FDM entails the layer-by-layer deposition of molten thermoplastic polymer onto a printing surface, guided by predefined paths from a computer-aided design (CAD) model. This process allows for the incorporation of additives, such as short and long fibers, into the polymer matrix to enhance mechanical properties, along with other benefits like surface modification for medical applications [29]. In our previous studies, the In-situ impregnation method was developed, and different fibers with various volume fraction was evaluated. Akhoundi et al. evaluated the glass fiber-reinforced specimens with different matrices. According to the result, by adding 30 vol.% of glass fiber to the PLA matrix, tensile strength increased to 296 MPa from 59 MPa, while elastic modulus increased to 20.8 GPa from 3.5 GPa [30,31]. In another study, Hedayati et al. investigated the application of the bio-degradable continuous PGA fiber in medical applications. PCL was used as the matrix, and nHA particles were added to the matrix to enhance both the tensile and compressive properties of the reinforced samples. Based on the results, mechanical properties, as well as degradation profiles, can be tuned via fiber volume content in the polymer matrix [28,29]. Continuous fibers, when used in SMPCs, serve both as a means of stimulation and as an enhancement for mechanical properties.
The majority of documented instances of shape memory behavior primarily rely on external heating and cooling processes. The core objective of this investigation is to achieve SMP actuation through electrical means, a technique that offers numerous advantages, including rapid triggering, uniform heating, and applicability in applications where direct heating is not feasible. This study is centered on enhancing the mechanical properties (both tensile and flexural properties) of 3D-printed PLA SMPs by incorporating continuous Nickel-chromium metallic wire. In-situ impregnation method was used in FDM process, with Nickel-chromium wires serving a dual role as reinforcement and facilitators of electrical actuation, leveraging their ability to generate Joule heating when subjected to voltage. In the present study, an assessment of the mechanical properties of the printed specimens was conducted, encompassing various volume fraction of metal wires with two wire diameters. Additionally, the thermographic properties of the reinforced specimens were evaluated, while the shape recovery performance of the specimens exposed to a 40 V voltage was also assessed.
Material & Method
Materials
Five brands of Polylactic acid (PLA) filaments named Magic, Medrick, ZF, Polytra, and Proto Pasta, with standard diameters of 1.75 mm, were used in this study. Nickel-chromium (Ni80Cr20) metallic wire has been used as continuous wire to evaluate the mechanical properties and provide electrical current for stimulating polymeric PLA and investigating its shape memory properties. Cr/Ni wires with 0.1 and 0.15 mm diameters and electrical resistances of 180 and 82 W/m, respectively, were purchased from Sinton, China.
3D Printing of the Specimens
Composite specimens reinforced with metal wire were also printed using the simultaneous impregnation method based on the FDM process. In summary, in this process, the FDM Quantum 2020 printer, along with a specially designed nozzle for the simultaneous impregnation system, was used so that the metal wire is passed through an orifice drilled into the nozzle and enters the molten chamber, where it is coated with the molten PLA. The impregnated wire is then deposited on the printer bed or the previous layer based on the predefined paths determined by the CAD design [28,29,30,31]. The presence of metal wire in the depositing strands leads to changes in sample design and the printing process, requiring the process parameters and manufacturing conditions to be revised to prevent wire damage during the process. Values were applied to the Simplify 3D V4.1 software, generating the corresponding G-codes. Schematics of the method and Printing parameters are presented in Figure 1 and Table 1, respectively.
Materials and Methods
To select the best filament for further processing, five different PLA filaments were chosen for shape recovery evaluation. Specimens reinforced with 5 vol.% of 0.1 mm wires were printed in a rectangular shape with dimensions of 6 × 12.8 × 1.8 . A three-point bending setup was used at a temperature of 65 to apply deformation to the specimens, and the midpoint displacement was set to 3 millimeters. Subsequently, specimens were exposed to cold water at a temperature of 20 to fix the applied deformation. Then, they were subjected to an alternating voltage of 220V for shape recovery assessment. Images of the specimens were captured using a Dino-Lite digital microscope with a maximum magnification of 250 after the initial deformation and shape recovery with voltage application. Dino Capture V2.0 software was used to analyze the captured images and examine each specimen Shape fixity and recovery values. Figure 2 illustrates the images of the printed specimens. Two half circles with a diameter of 25 millimeters were added at both ends of the sample. These additions were made to improve print quality and maintain wire integrity.
Mechanical Properties
Metal Wire:Elastic modulus and tensile strength of the metal wires were evaluated according to ASTM D2256 using a tensile testing machine (STM-50, Santam Company, Iran). The extension rate in the tensile test of the metal wires was set to 20 mm/min. The nominal diameter of each wire was considered as the average surface area, and their tensile strength and elastic modulus were calculated based on the stress-strain curve obtained from the test.
3D Printed specimens: Tensile and bending tests were performed using a universal testing machine (SANTAM STM-20, Santam Co., Iran) to evaluate the mechanical properties of the 3D printed specimens (Figure 3). The tests were conducted at cross-head displacement speeds of 2 mm/min and 5 mm/min for tensile and bending tests, respectively.
For the tensile test, rectangular reinforced specimens with three different metal wire volume contents (0%, 5%, and 10%) were printed. The printed specimens had dimensions of 6 mm in width and 100 mm in length, with seven layers . Three specimens were tested at each volume content to ensure reliable data, and the results were reported as the average of the obtained data. The load was applied parallel to the deposited raster to assess the maximum effect of continuous wire on the tensile properties.
To evaluate the effect of the metallic wire on the bending properties of the PLA, specimens with similar metal wire contents were printed. Bending tests were conducted on three specimens for each content, following ASTM D 790 standards. The specimens were printed in a rectangular shape with dimensions of 12.8 mm in width, 60 mm in length, and 1.8 mm in height. Additionally, similar samples were used to assess the effect of temperature on the bending properties of both reinforced and non-reinforced parts. The tests were conducted at 60 °C, and the cross-head displacement speed was set at 10 mm/min.
Stress-strain data were computed from the load-displacement measurements, and the elastic/flexural modulus was calculated from the linear region of the resulting curve.
Morphology:
The Scanning Electron Microscope (SEM, Tescan VEGA-II) was used to analyze the morphology of the specimens reinforced with metal wires, examine the structure, assess the adhesion between the polymer matrix and the wires, and observe the fracture surfaces after tensile and bending tests.
Shape Memory Evaluation
Differential Scanning Calorimetry (DSC):To evaluate the thermal properties of the PLA filament, DSC test was conducted using the DSC200 F3Maia. The heating and cooling cycles of the specimens were carried out under a nitrogen gas with a rate of 10 in the range of 25 to 250 , according to ASTM D3418-99 standard, in both heating and cooling cycles. The first cycle was performed to eliminate any thermal history of the specimens and ensure accurate thermal analysis up to a temperature of 250 .
Mechanical thermal dynamic analysis (DMTA):
The DMTA test is commonly used to study the thermo-viscoelastic behavior of polymers. By applying the sinusoidal displacement function with constant stress to the sample and measuring the strain, it is possible to record and measure the loss and storage modulus of the polymer at different temperatures. In addition to measuring the melting and glass temperatures, phase separation, and crystallinity can be checked. It is also possible to investigate the shape memory effect of SMP at different temperatures and strains and measure based on the different type of the DMTA device (compressive, tensile, bending and shearing). The specimens reinforced with both 0.1 and 0.15 mm metal wires with two volume fraction of 5% and 10%, alongside with non-reinforced specimens, were examined in this test. The dimensions of the specimens were equal to 6 × 25 × 1.5 . The tests were conducted in the temperature range of 30 to 70 and at frequency of 1 Hz.
Thermography:
Stimuli in shape memory polymers are generally classified into two categories: direct and indirect. Direct stimulators require full contact and access to the sample during the process, while indirect stimulators can perform stimulation remotely with a lower contact surface. Additionally, the actuators must raise the temperature of the sample above its glass transition temperature to initiate the recovery process. Thermal properties of PLA filament and its glass transition temperature (60°C) were taken into consideration. The temperature of the sample needs to exceed 60°C within a certain time. To achieve this, the thermal properties and temperature profile of specimens reinforced with 0.1 mm and 0.15 mm metal wires, and 5 and 10 vol.%, were examined. Voltage levels of 16, 24, 32, 40, and 48 V DC were applied, and the relevant images were recorded and saved using a Fluke TIS10 thermal camera. Finally, Time-Temperature diagram of all specimens were derived from the captured images.
Shape Memory:
To assess the shape memory properties and measure the recovery ratios, specimens reinforced with metal wire with a diameter of 0.1 mm with two volume percentages of 5 and 10% were printed in a rectangular shape with dimensions of 100 × 12.8 × 1.05 . The temporary shape of the specimens is U-shaped and the deformation is applied at a temperature above the glass temperature. The force-displacement of the test during the deformation of the specimens were recorded. To form the shape of the specimens into a U-shape, special bending jaws were used. The U-shaped bending jaws made of ABS with the ability to withstand high temperature up to 90 were designed and printed with a radius of 7.5 mm.
To record and measure the shape recovery of the reinforced specimens, a dyno optical microscope model am4113tو made in Taiwanو with 250X magnification was used. Shape fixity and shape recovery were measured and calculated using the recorded images with the following equations:
All experimental results were reported as the mean ± standard deviation. 2-sample t-test (Minitab 16 software) was employed for statistical analyses, and a p-value less than 0.05 was considered significant.
Results
Material Selection
Figure 4 demonstrates the 3D printed specimens and Figure 5 presents the shape recovery results of five different PLA filaments subjected to 220 V AC. The findings indicate variations in the shape recovery percentages, ranging from 56.8% to 79%, while the shape fixity values ranged between 88.3% and 95%. Notably, the PolyTerra filament demonstrated the most favorable shape recovery properties compared to the other PLA variants, prompting its selection for further investigation. The observed distinctions in shape recovery performance can be attributed to the presence of additives and plasticizers incorporated into the PLA pellets during the filament-production process.
Raw Materials
DSC test: Figure 6 presents the DSC test result conducted on the PolyTerra PLA filament. The thermal behavior changes of the polymer were recorded within a temperature range of 55 °C, revealing distinct changes indicative of its glass transition temperature. Additionally, a phase change was observed in the temperature range of 146 to 163 °C, characterized by two endothermic peaks occurring at temperatures of 150.2 and 160.5 °C, respectively, signifying the melting temperature of the filament. The initial peak in this range suggests the potential presence of additives within the filaments. Notably, an exothermic peak within the temperature range of 100 to 120 °C was also observed, indicating the occurrence of cold crystallization of the polymer. This rapid crystallization process had insufficient time to fully form during the previous manufacturing stages. It is important to note that the formation of these crystals significantly influences the mechanical properties of the PLA sample [32].
Tensile test: Table 2 provides a summary of the tensile test results conducted on the metal wires. The 0.1 mm and 0.15 mm wires exhibited tensile strengths of 874 MPa and 974 MPa, respectively, along with corresponding elastic modulus of 110 GPa and 52 GPa. In contrast, the tensile strength and elastic modulus of the PLA matrix were measured at 48.8 MPa and 2.4 GPa, as illustrated in Figure 7. These results clearly demonstrate that the mechanical properties of the wires significantly surpass those of the matrix polymer. Moreover, the incorporation of these wire into the substrate of printed specimens holds the potential to substantially enhance their mechanical properties. Notably, the elongation at break for the 0.1 and 0.15 mm wires was determined to be 14% and 13% respectively, surpassing the breaking strain of the PLA material. This disparity suggests that the composite material is expected to experience failure in the polymer matrix initially.
Tensile Tests Specimens
Figure 8 shows the obtained stress-strain diagram of the reinforced and non-reinforced PLA specimens. The figures demonstrate the remarkable effect of embedded metal wire in the PLA matrix even with low volume content.
The tensile strength of the reinforced specimens containing 5 and 10 vol.% of 0.1 mm wire was measured at 79.1 MPa and 116.3 MPa, respectively, while the corresponding elastic moduli were calculated as 7.2 GPa and 11.7 GPa, respectively. Similarly, for the specimens reinforced with 0.15 mm wire, the tensile strength of the composite specimens with 5 and 10 vol.% of 0.15 mm wire was found to be 79.7 MPa and 114.3 MPa, respectively, with corresponding elastic moduli of 4.4 GPa and 6.9 GPa. The results clearly indicate that the presence of metal wires within the polymer matrix significantly enhanced the mechanical properties. In the case of 0.1 mm metal wire, the tensile strength of the reinforced specimens with 5 and 10 vol.% metal wire volume percentage exhibited an increase of 62 and 138%, respectively, compared to those of the unreinforced specimens. Additionally, the corresponding increase in elastic modulus were 200 and 387%, respectively. The difference in strength and elastic modulus values between the specimens reinforced with the two different wires can be attributed to the distinct mechanical properties of each wire. These findings highlight the significant enhancement in the tensile properties of PLA achieved through the in-situ impregnation method, and a sound adhesion of wires to the polymeric matrix, and demonstrate the ability to achieve diverse mechanical properties by utilizing different fibers, diameters, and volume fractions.
Theoretical mechanical properties were calculated and compared to the experimental results, as shown in Figure 9 according to the Rule of Mixture (ROM):
where σ and E denote tensile strength and elastic modulus, is the wire volume fraction, and and subscripts signify composite, wire, and matrix, respectively. Due to the ductile nature of the metal wire and higher elongation compared to the PLA matrix, tensile strength of the wires at the failure of the PLA must be calculated. The parameter is the wire stress value corresponds to the failure strain of the matrix (Figure 7).
Theoretical values of tensile strength for specimens reinforced with 5 and 10 vol.% of 0.1 mm wire were calculated as 87.9 MPa and 126.9 MPa, respectively, while the elastic modulus values were determined as 7.8 GPa and 12.8 GPa. Similarly, for the sample reinforced with 0.15 mm wire, the theoretical tensile strength values were 93.6 MPa and 138.4 MPa, with elastic modulus values of 4.9 GPa and 7.4 GPa, respectively.
Figure 9 provides a summary of the tensile test results for the reinforced specimens, along with the calculated theoretical values and the differences compared to the experimental results. The findings reveal that the disparity between the experimental and theoretical values is smaller for the specimens reinforced with 0.1 mm wire compared to those reinforced with 0.15 mm wire. The largest difference in tensile strength, which occurs in the 0.1 mm sample, amounts to 10%, whereas for the 0.15 mm wire, the difference reaches 17.4%. These differences could be attributed to imperfect interaction between the metal wire and the matrix, leading to suboptimal load transfer from the PLA to the metal wire. Furthermore, the challenges associated with 3D printing, particularly with increasing wire diameter, can contribute to the occurrence of defects during the printing process [29].
Flexural Properties
Ambient temperature: Figure 10 presents the effect of metal wire volume content and diameter on the flexural strengths of the non-reinforced and reinforced PLA specimens. As shown in Figure 10, for the non-reinforced specimens, the flexural strength was 102.2 MPa. Flexural strengths of the composite specimens with 5 and 10 vol.% of 0.1mm wire were 149.9 and 207.3 MPa, respectively, and the flexural modulus for the same specimens were calculated as 10.1 and 16.6 GPa, respectively. Reinforced specimens with 0.15mm wire, the flexural strength with 5 and 10 vol.% were 112.4 and 209.7 MPa, respectively, and the moduli were calculated to be 8.3 and 10.7 GPa, respectively. According to the obtained results, embedding metal wire in the thermoplastic matrix substantially enhanced the bending properties of the reinforced specimens. Notably, in comparison to the non-reinforced PLA, flexural strength increased by 46.7 and 103% and 173 and 349 % for flexural modulus upon adding 5 and 10 vol.% metal yarn, respectively. It has to be mentioned that the variance in strength and flexural modulus values for reinforced specimens with two different wires diameter stems from the inherent mechanical properties of each wire. A comprehensive summary of the bending test results for reinforced specimens is presented in Table 3.
High temperature: Figure 11 illustrates the impact of the temperature on the flexural strengths of the non-reinforced and reinforced PLA specimens. As shown in Figure 11, for the non-reinforced specimens, the flexural strength was 10.7 MPa. As anticipated, flexural properties of the specimens demonstrated a decline with increasing the temperature. The flexural strength of the composite specimens containing 5 and 10 vol.% of 0.1 mm wire measured 28.4 MPa and 50.9 MPa, respectively. Correspondingly, the flexural modulus for these specimens was calculated as 2.4 GPa and 4.1 GPa. For specimens reinforced with 0.15 mm wire, the flexural strength of composite specimens with 5 and 10 vol.% of 0.15 mm wire is 26.2 and 48.4 MPa, respectively.
According to the obtained results, the presence of metal wire in the polymer matrix despite the increasing of the temperature, maintained its positive effect on the bending properties of the specimens reinforced with metal wire. For instance, specimens reinforced with 0.1 mm wire, bending strength increased by 165 and 376% for 5 and 10 vol.%, respectively. Despite the sharp decrease in flexural strength at high temperatures, the effect of wire on the specimens is still dominant. By altering the wire type, diameter, and volume fraction within the polymer matrix, even a minor percentage adjustment can result in a significant enhancement in the bending strength of the specimens. The reinforcing effect of metal wire at high temperature can increase the ability to stabilize the shape of the sample and affect its shape memory properties. Table 4 shows the summary of the high temperature bending test results of the reinforced specimens reinforced.
DMTA
Figure 12 demonstrates the outcome of the DMTA test conducted within the temperature range of 30 to 70 ℃ and at a frequency of 1 Hz for different specimens. As expected, the presence of metal wires had no effect on the general behavior of the polymer and all graphs had a similar profile. Align with the mechanical test results, storage modulus of all reinforced specimens surpassed the non-reinforced specimens. At room temperature and under a frequency of 1 Hz, storage modulus of the specimens reinforced with 0.1 mm wire with 5 and 10 vol.% are equal to 6.3 and 9 GPa, respectively, and these values for the 0.15 mm wire are 4.6 and 5 GPa, respectively. The lower modulus of the 0.15 mm specimens, similar to the bending test specimens can be attributed to the relatively lower mechanical properties of the 0.15 mm wire compared to the 0.1 mm wire. The most prominent reduction in the storage modulus occurred within the temperature of 50 to 60 which is contributed by the softening of the polymer in the range of its glass transition temperature. The peak of the tanδ diagram was in the range of 55 , which is in accordance with the results of the DSC test, which indicates the glass transition temperature of the PLA. According to the test results, after increasing the temperature above the Tg temperature, storage modulus of the non-reinforced sample was almost equal to zero, in contrast wire reinforced specimens were able to retention of their mechanical properties. This is effective in maintaining the shape after increasing the temperature of the specimens during the forming process.
Morphology
Figure 13 shows the SEM image of the composite sample reinforced with 0.1 mm metal wire after tensile and bending tests. The images reveal the successful placement of wires in their intended positions within the matrix polymer of PLA, which effectively enveloped the metal wire. Notably, the SEM images also depict the failure of the metal wire within the composite specimens and the occurrence of necking during the bending tests. Additionally, some porosity and voids are discernible in the SEM images, which may contribute to a reduction in mechanical properties and account for differences between theoretical and experimental results. It is worth noting that these factors are attributed to the sample fabrication process. Finally, the SEM images affirm that the presence of metal wires in the polymer did not disrupt the FDM process to print relatively complex structures and the specimens were printed successfully in accordance with the CAD design.
Thermography
Figure 14 shows the images of specimens reinforced with 0.1 and 0.15 mm wires and volume fractions of 5 and 10%. The objective was to evaluate the temperature profile of these reinforced specimens and investigate the influence of wire diameter and volume percentage on the maximum attainable temperature. Various voltage levels were applied to the specimens for this purpose, as depicted in Figure 15. The results clearly demonstrate that, across all specimens , an increase in voltage led to a corresponding increase in the maximum attainable temperature. It's important to note that the glass transition temperature of PLA is calculated to be 55°C, and surpassing this value is essential to initiate the recovery process.
For specimens reinforced with 0.1 mm wire, both 5 and 10 vol.% reached a stabilized maximum temperature after approximately 100 seconds. By applying the voltages of 16, 24, 32, 40 and 48 volts, the recorded temperature for 5 vol.% specimens were 40.8, 51.2, 62.7, 81 and 99 , respectively, and this value for 10 vol.% reinforced specimens were 36.4, 47.3, 56, 81.2 and 101.5 . It's worth noting that 16, 24, and 32 volts recorded maximum temperatures of 62.7°C, which may still be insufficient to recover shape memory specimens. As voltage increased, the temperature rise rate accelerated and the maximum recorded temperature exceeded the glass transition temperature of PLA.
For specimens reinforced with 0.15 mm wire, both 5% and 10% volume fractions reached their maximum temperature after approximately 100 seconds as well. By applying the voltages of 16, 24, 32, 40 and 48 volts, the recorded temperature for 5 vol.% specimens are equal to 42.1, 51, 80.4, 113.8 and 140 , respectively, and this value for 10 vol.% specimens have been recorded as 39.2, 61.3, 66.9, 75.8 and 150.1 . Notably, voltages of 16 and 24V achieved a maximum temperature of 61.3°C, which may also be insufficient for the recovery of shape memory specimens. However, as the voltage increased to 40 and 48 volts, the maximum temperature approached the polymer melting point, potentially causing local sample damage by exceeding melting temperature. Therefore, these two voltages are not suitable to use in shape recovery of specimens.
The results clearly indicate that as voltage increased, the sample temperature and temperature rise rate also increased. Furthermore, in most specimens, an increase in the percentage of wires correlated with decreased thermal power and a subsequent reduction in the maximum attainable temperature.
Figure 16 and Figure 17 show the thermographic analysis of the reinforced specimens. The results demonstrated that when voltage is applied to the specimens, the heat generated by the wire is absorbed by the matrix polymer, thereby elevating the temperature of the polymer. Examining the images reveals a consistent and uniform distribution of heat across all specimens, without any thermal concentration in any specific region. This uniform temperature distribution, coupled with the attainment of temperatures exceeding the glass transition temperature, stands out as a pivotal and highly influential factor in the successful recovery of these shape memory materials. In conclusion, the findings emphasize that with selection of wire type, diameter, voltage, and the assurance of uniform temperature distribution throughout the entire sample, a diverse array of applications for shape memory materials can be realized, especially in cases where direct stimulation may be challenging or inaccessible.
Shape Recovery
Figure 18 displays the results of shape recovery for specimens reinforced with 0.1 mm wire, with two volume fractions of 5 and 10%. According to the thermography results, these specimens were subjected to a 40-volt voltage, and their shape recovery was assessed. Subsequently, after bending the specimens into a U-shape using a specially designed jaw, the shape fixity ratio was measured. The results reveal that the average shape fixity remained consistent for both specimens , irrespective to the volume content, indicating that the volume percentage did not significantly impact the fixity of the specimens. However, when voltage was applied, the shape recovery of the specimens reinforced with 5% wire was measured at 75.9%, whereas for the specimens reinforced with 10% volume of wire, it was measured as 58.7%.
This discrepancy can be attributed to the increase in modulus and mechanical properties of the reinforced specimens with the higher percentage of wire. Essentially, the metal wire within the base polymer behaves like crystals within the polymer matrix, hindering the recovery of polymer chains after voltage application and temperature elevation in the sample.
Finally, specimens recovered through the integration of metal wires within the polymer matrix. Voltage was applied to generate heat through the metal wire, subsequently raising the temperature of the polymer matrix, all without direct contact to the heat source, such as high-temperature water bath.
Based on the obtained results, wide range of shape recovery properties can be tailored in the reinforced specimens through selection of the metal wire type, volume content, voltage, and wire diameter. This approach allows for the customization of sample properties to precisely match specific application requirements. For instance, some adjustments applied to the printed specimens to enhance their recovery performance. As a result, a sample composed of 9 layers with a height of 0.15 mm was designed. The initial and final three layers consist of pure polymer, while the middle three layers are reinforced with 0.1 mm wire with 5 vol.%, and its recovery was examined under a 40-volt voltage. Figure 19 illustrates the successful full recovery of the sample to its original shape. Notably, the shape recovery commenced within 25 seconds of applying the potential difference.
Conclusion
The in-situ impregnation method was employed within the FDM 3D printing process to create innovative shape memory PLA specimens reinforced with metal. This study aimed to introduce novel specimens characterized by adjustable mechanical and thermal properties, suited for various shape memory applications. The successful embedding of metal wire into the specimens was achieved with two different wire volume contents (5% and 10%) and two distinct wire diameters. These 3D printed specimens were reinforced with chrome-nickel metal wire, and their mechanical, thermal, and shape memory properties were thoroughly examined. The findings of this study lead to the following conclusions:
- Adding 0.1 mm metal wire to the polymer matrix, tensile strength of the 5 and 10 vol.% specimens increased by 62 and 138%, respectively. For elastic modulus, these specimens showed remarkable increases of 200 and 387%, respectively.
- For the 0.15 mm metal wire, tensile strength of the 5 and 10 vol.% specimens increased by 63 and 134%, while the modulus of elasticity showed enhancements of 83 and 187%, respectively.
- As could be predicted, wires also had a positive effect on the bending properties too. For instance, flexural strength of the reinforced specimens with 0.1mm wire with 5 and 10 vol.% increased by 46.7 and 103 percent, respectively. In specimens reinforced with metal wire at a temperature of 60 °C, the presence of metal wire still had a positive effect on the bending properties.
- The thermography test results demonstrated that by altering the wire diameter and volume content, the sample temperature, when subjected to voltage, ranged from 36.4 to 150.1°C.
- In the context of shape memory assessment, specimens reinforced with wires successfully recovered their original shapes by applying 40 V DC voltage. Notably, the shape fixity remained consistent for both specimens reinforced with varying volume contents. When voltage was applied, the shape recovery for the specimens with 5 vol.% reached 75.9%, while for the specimens with 10 vol.%, this value was recorded at 58.7%.
In conclusion, the ability to adjust a wide property of mechanical and thermal properties by incorporating metal wire with varying diameters and volume content opens up new opportunity for the utilization of shape memory polymers, particularly in aerospace, biosensors, and medical applications.
References
- Dong, X., et al., 4D printing of electroactive shape-changing composite structures and their programmable behaviors. 2022. 157: p. 106925. [CrossRef]
- Xia, Y., et al., A review of shape memory polymers and composites: mechanisms, materials, and applications. 2021. 33(6): p. 2000713. [CrossRef]
- Chung, T., A. Romo-Uribe, and P.T.J.M. Mather, Two-way reversible shape memory in a semicrystalline network. 2008. 41(1): p. 184-192. [CrossRef]
- Peponi, L., et al., Synthesis and characterization of PCL–PLLA polyurethane with shape memory behavior. 2013. 49(4): p. 893-903. [CrossRef]
- Yu, L., et al., Programmable 3D shape changes in liquid crystal polymer networks of uniaxial orientation. 2018. 28(37): p. 1802809. [CrossRef]
- Cho, J.W., et al., Electroactive shape-memory polyurethane composites incorporating carbon nanotubes. 2005. 26(5): p. 412-416. [CrossRef]
- Zhang, F., et al., Conductive shape memory microfiber membranes with core–shell structures and electroactive performance. 2018. 10(41): p. 35526-35532. [CrossRef]
- Kim, J., et al., Electroactive shape memory performance of polyurethane/graphene nanocomposites. 2015. 88: p. 1-7. [CrossRef]
- Qian, C., et al., Vapor-grown carbon nanofiber/poly (ethylene-co-vinyl acetate) composites with electrical-active two-way shape memory behavior. 2017. 28(19): p. 2749-2756. [CrossRef]
- Qi, Y., et al., Electrothermally actuated properties of fabric-reinforced shape memory polymer composites based on core–shell yarn. 2022. 292: p. 115681. [CrossRef]
- Sahoo, N.G., et al., Conducting shape memory polyurethane-Polypyrrole composites for an electroactive actuator. 2005. 290(11): p. 1049-1055. [CrossRef]
- Du, F.-P., et al., Electroactive shape memory polymer based on optimized multi-walled carbon nanotubes/polyvinyl alcohol nanocomposites. 2015. 68: p. 170-175. [CrossRef]
- Wang, W., et al., Soft grasping mechanisms composed of shape memory polymer based self-bending units. 2019. 164: p. 198-204. [CrossRef]
- Wei, K., et al., An investigation on shape memory behaviours of hydro-epoxy/glass fibre composites. 2013. 51: p. 169-174. [CrossRef]
- Zhang, F., et al., Magnetic programming of 4D printed shape memory composite structures. 2019, Elsevier. [CrossRef]
- Qi, Y., et al., Full-field strain and temperature evolution of electroactive three-dimensional braided thermoplastic shape memory composites. 2022. 219: p. 109250. [CrossRef]
- Benson, J., et al., Multifunctional CNT-polymer composites for ultra-tough structural supercapacitors and desalination devices. 2013. 25(45): p. 6625-6632. [CrossRef]
- Jakus, A.E., et al., Three-dimensional printing of high-content graphene scaffolds for electronic and biomedical applications. 2015. 9(4): p. 4636-4648. [CrossRef]
- Kim, J.H., et al., Three-dimensional printing of highly conductive carbon nanotube microarchitectures with fluid ink. 2016. 10(9): p. 8879-8887. [CrossRef]
- Su, M., et al., Nanoparticle based curve arrays for multirecognition flexible electronics. 2016. 28(7): p. 1369-1374. [CrossRef]
- Meng, H. and G.J.p. Li, A review of stimuli-responsive shape memory polymer composites. 2013. 54(9): p. 2199-2221. [CrossRef]
- Wan, X., et al., CNT-based electro-responsive shape memory functionalized 3D printed nanocomposites for liquid sensors. 2019. 155: p. 77-87. [CrossRef]
- Zhao, W., et al., Shape memory polymers and their composites in biomedical applications. 2019. 97: p. 864-883. [CrossRef]
- Leng, J., et al., Significantly reducing electrical resistivity by forming conductive Ni chains in a polyurethane shape-memory polymer/carbon-black composite. 2008. 92(20). [CrossRef]
- Thomanny, U.I. and P.J.J.o.T.C.M. Ermanni, The influence of yarn structure and processing conditions on the laminate quality of stampformed carbon and thermoplastic polymer fiber commingled yarns. 2004. 17(3): p. 259-283. [CrossRef]
- Zhang, F., et al., Electrospun nanofiber membranes for electrically activated shape memory nanocomposites. 2014. 23(6): p. 065020. [CrossRef]
- Wang, X., et al., Electrical actuation and shape memory behavior of polyurethane composites incorporated with printed carbon nanotube layers. 2017. 141: p. 8-15. [CrossRef]
- Hedayati, S.K., et al., 3D printed PCL scaffold reinforced with continuous biodegradable fiber yarn: A study on mechanical and cell viability properties. 2020. 83: p. 106347. [CrossRef]
- Hedayati, S.K., et al., Additive manufacture of PCL/nHA scaffolds reinforced with biodegradable continuous Fibers: Mechanical Properties, in-vitro degradation Profile, and cell study. 2022. 162: p. 110876. [CrossRef]
- Akhoundi, B., et al., Improving mechanical properties of continuous fiber-reinforced thermoplastic composites produced by FDM 3D printer. 2019. 38(3): p. 99-116. [CrossRef]
- Akhoundi, B., A.H. Behravesh, and A.J.P.o.t.I.o.M.E. Bagheri Saed, Part B: Journal of Engineering Manufacture, An innovative design approach in three-dimensional printing of continuous fiber–reinforced thermoplastic composites via fused deposition modeling process: in-melt simultaneous impregnation. 2020. 234(1-2): p. 243-259. [CrossRef]
- Jayanth, N., et al., Effect of heat treatment on mechanical properties of 3D printed PLA. 2021. 123: p. 104764. [CrossRef]
Figure 1.
Schematics of the simultaneous impregnation method in FDM process.
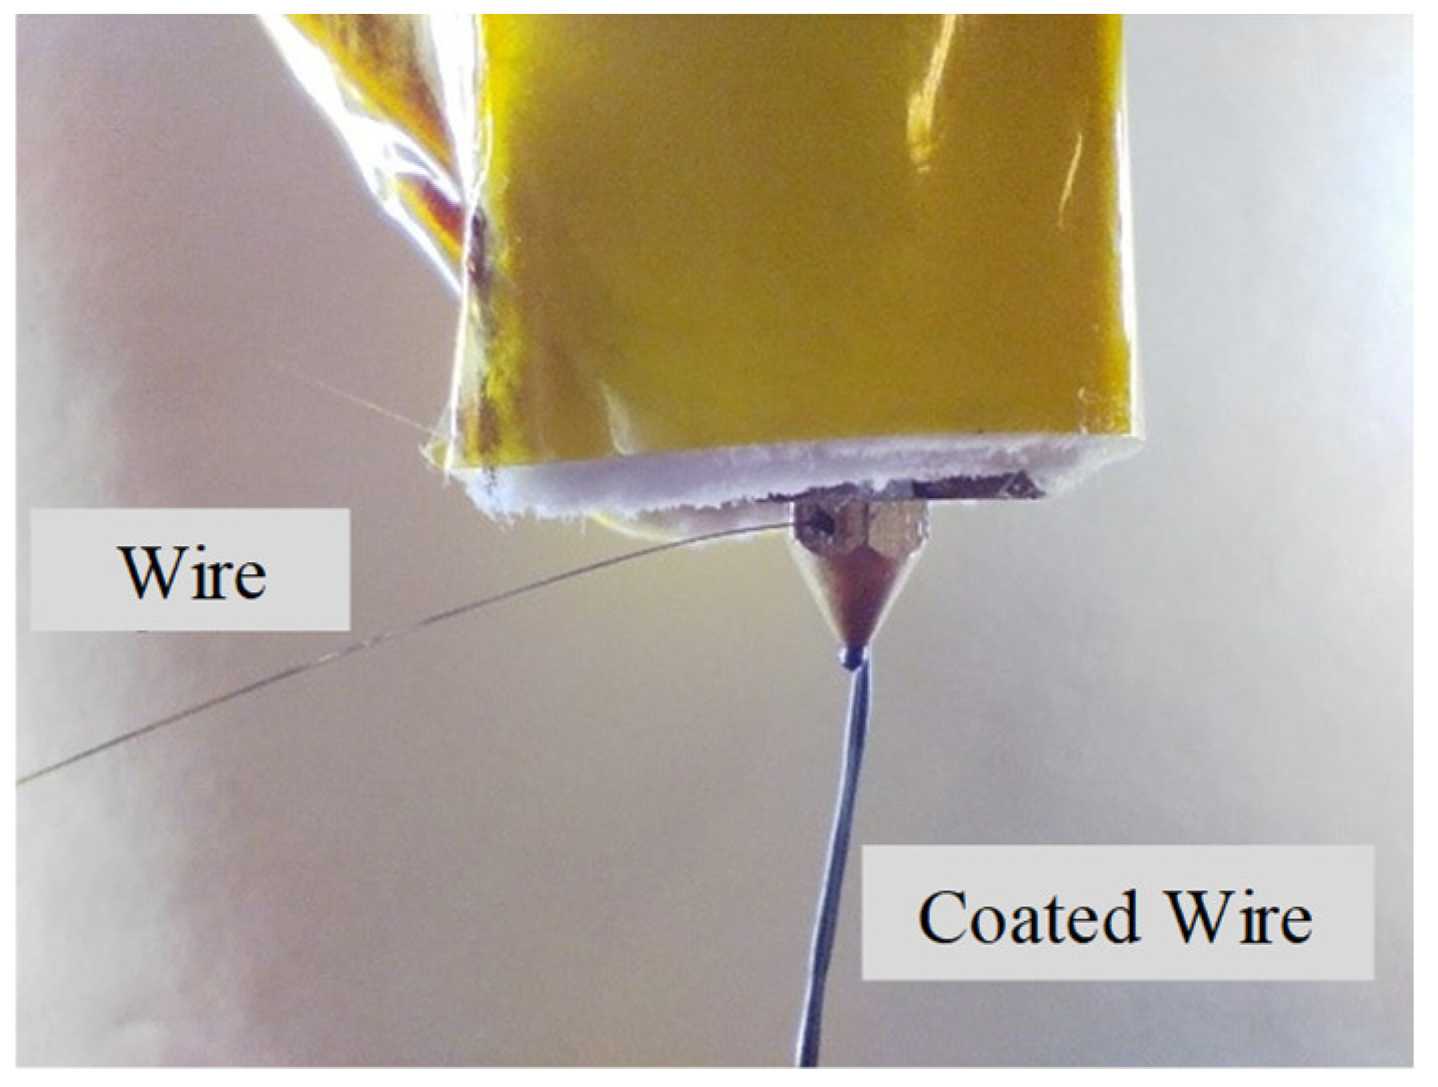
Figure 2.
3D printed specimens reinforced with 5 vol.% metal wires.
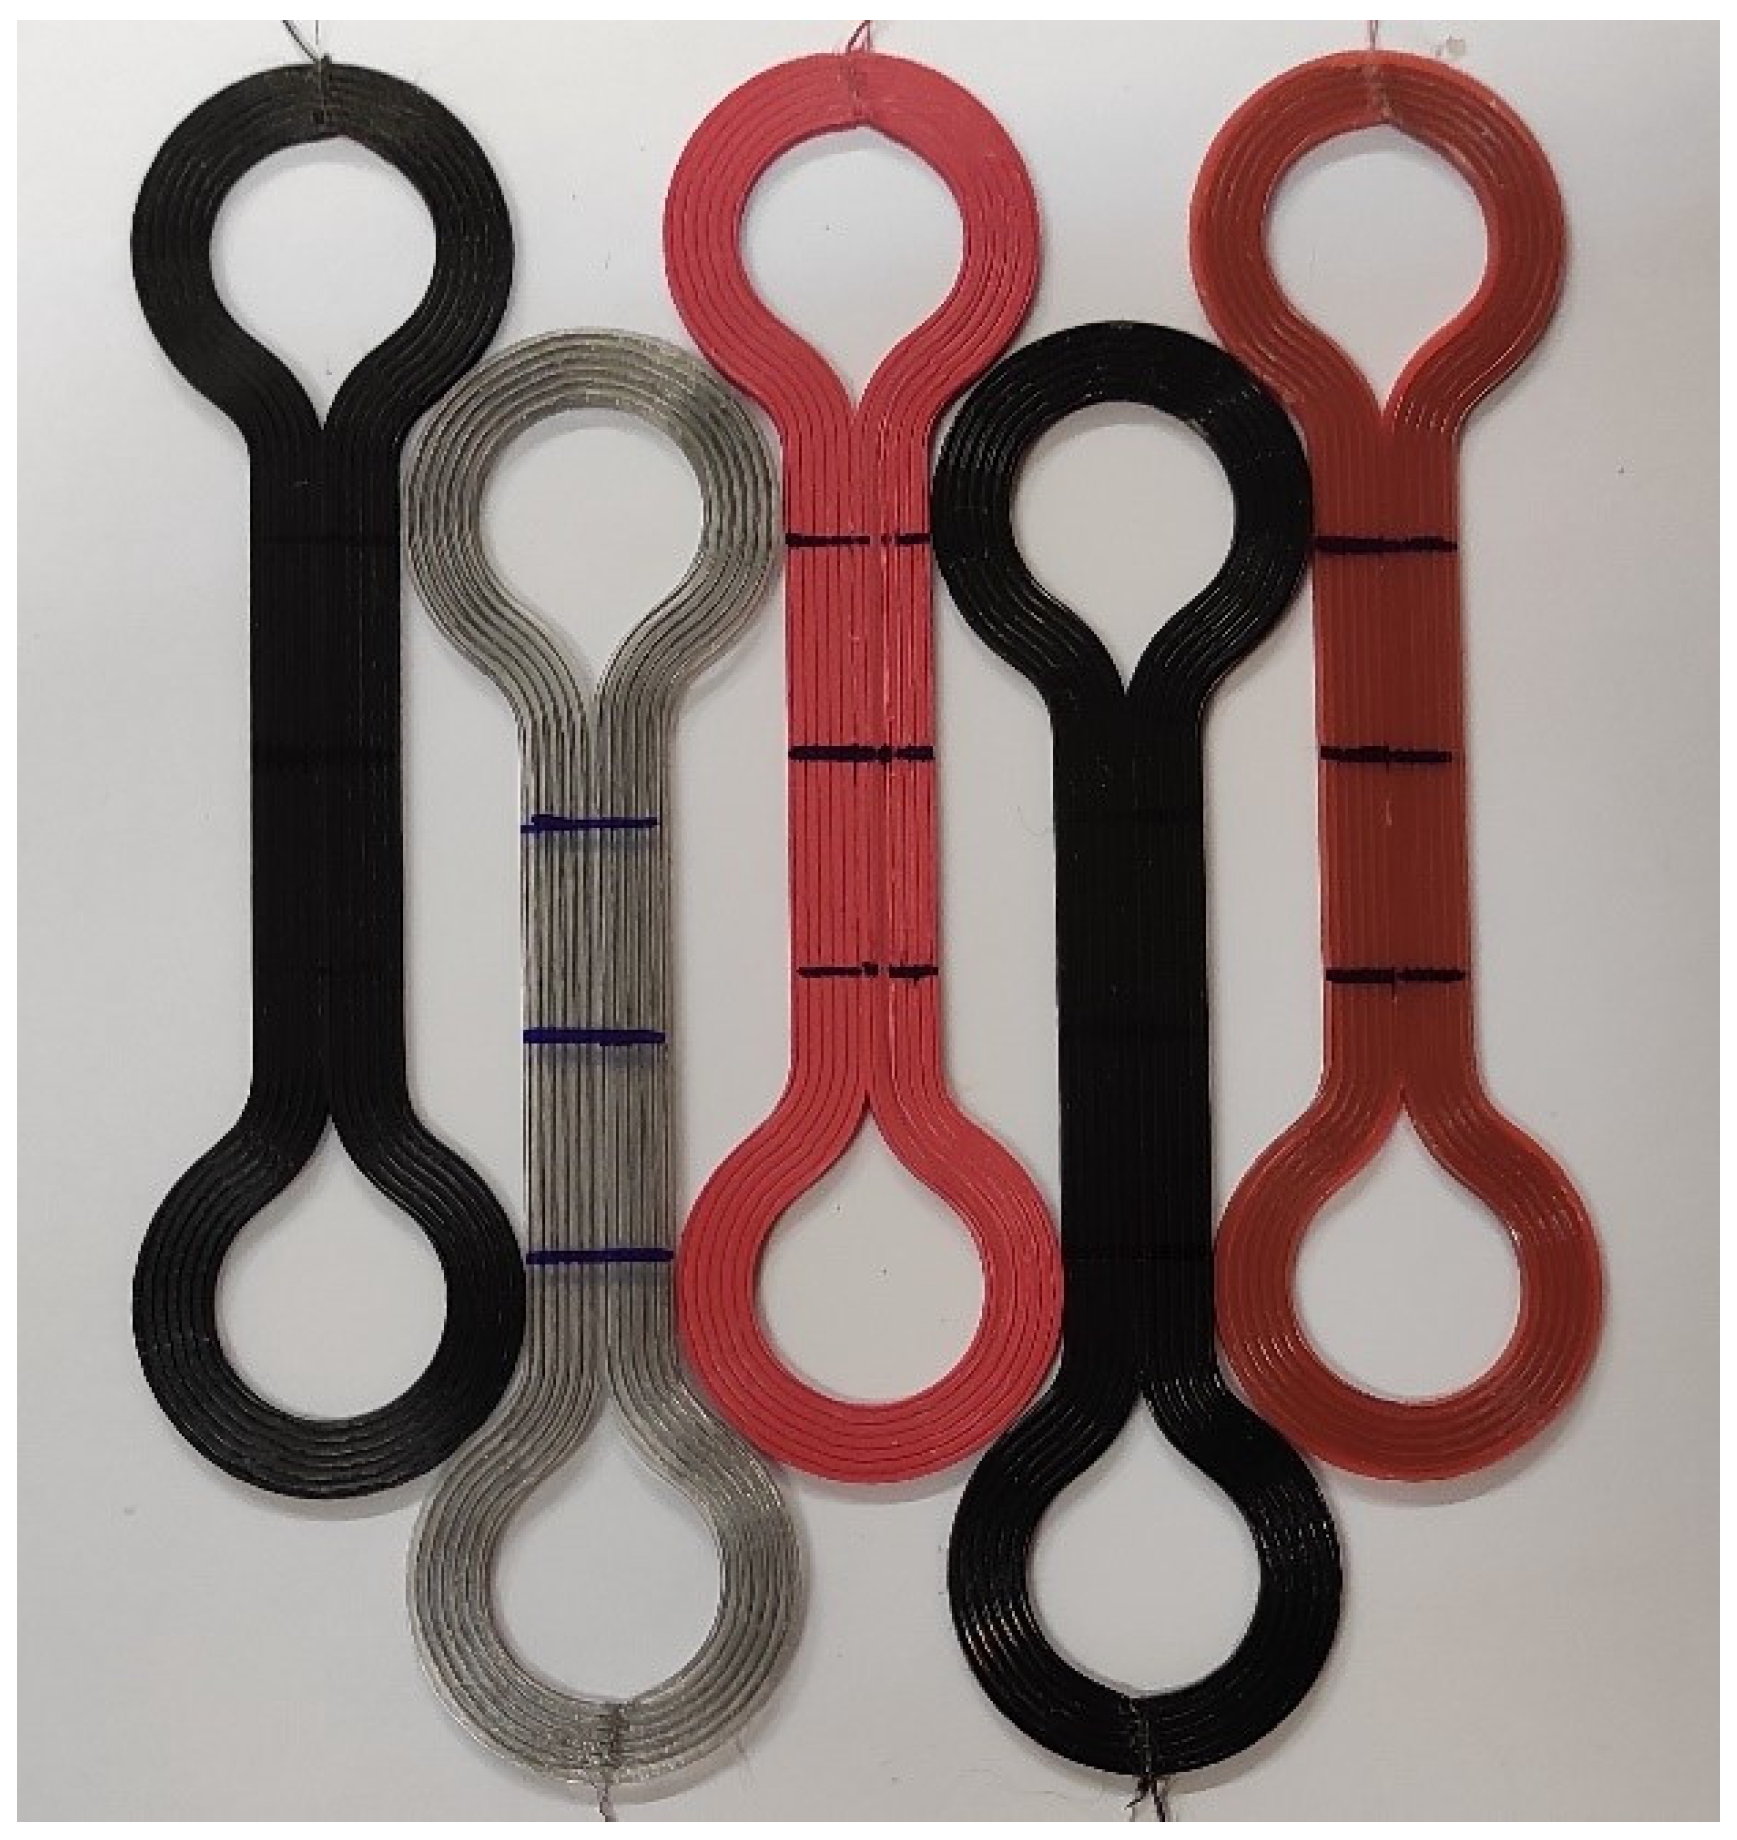
Figure 3.
Schematic view of the (a) tensile sample and (b) bending sample.
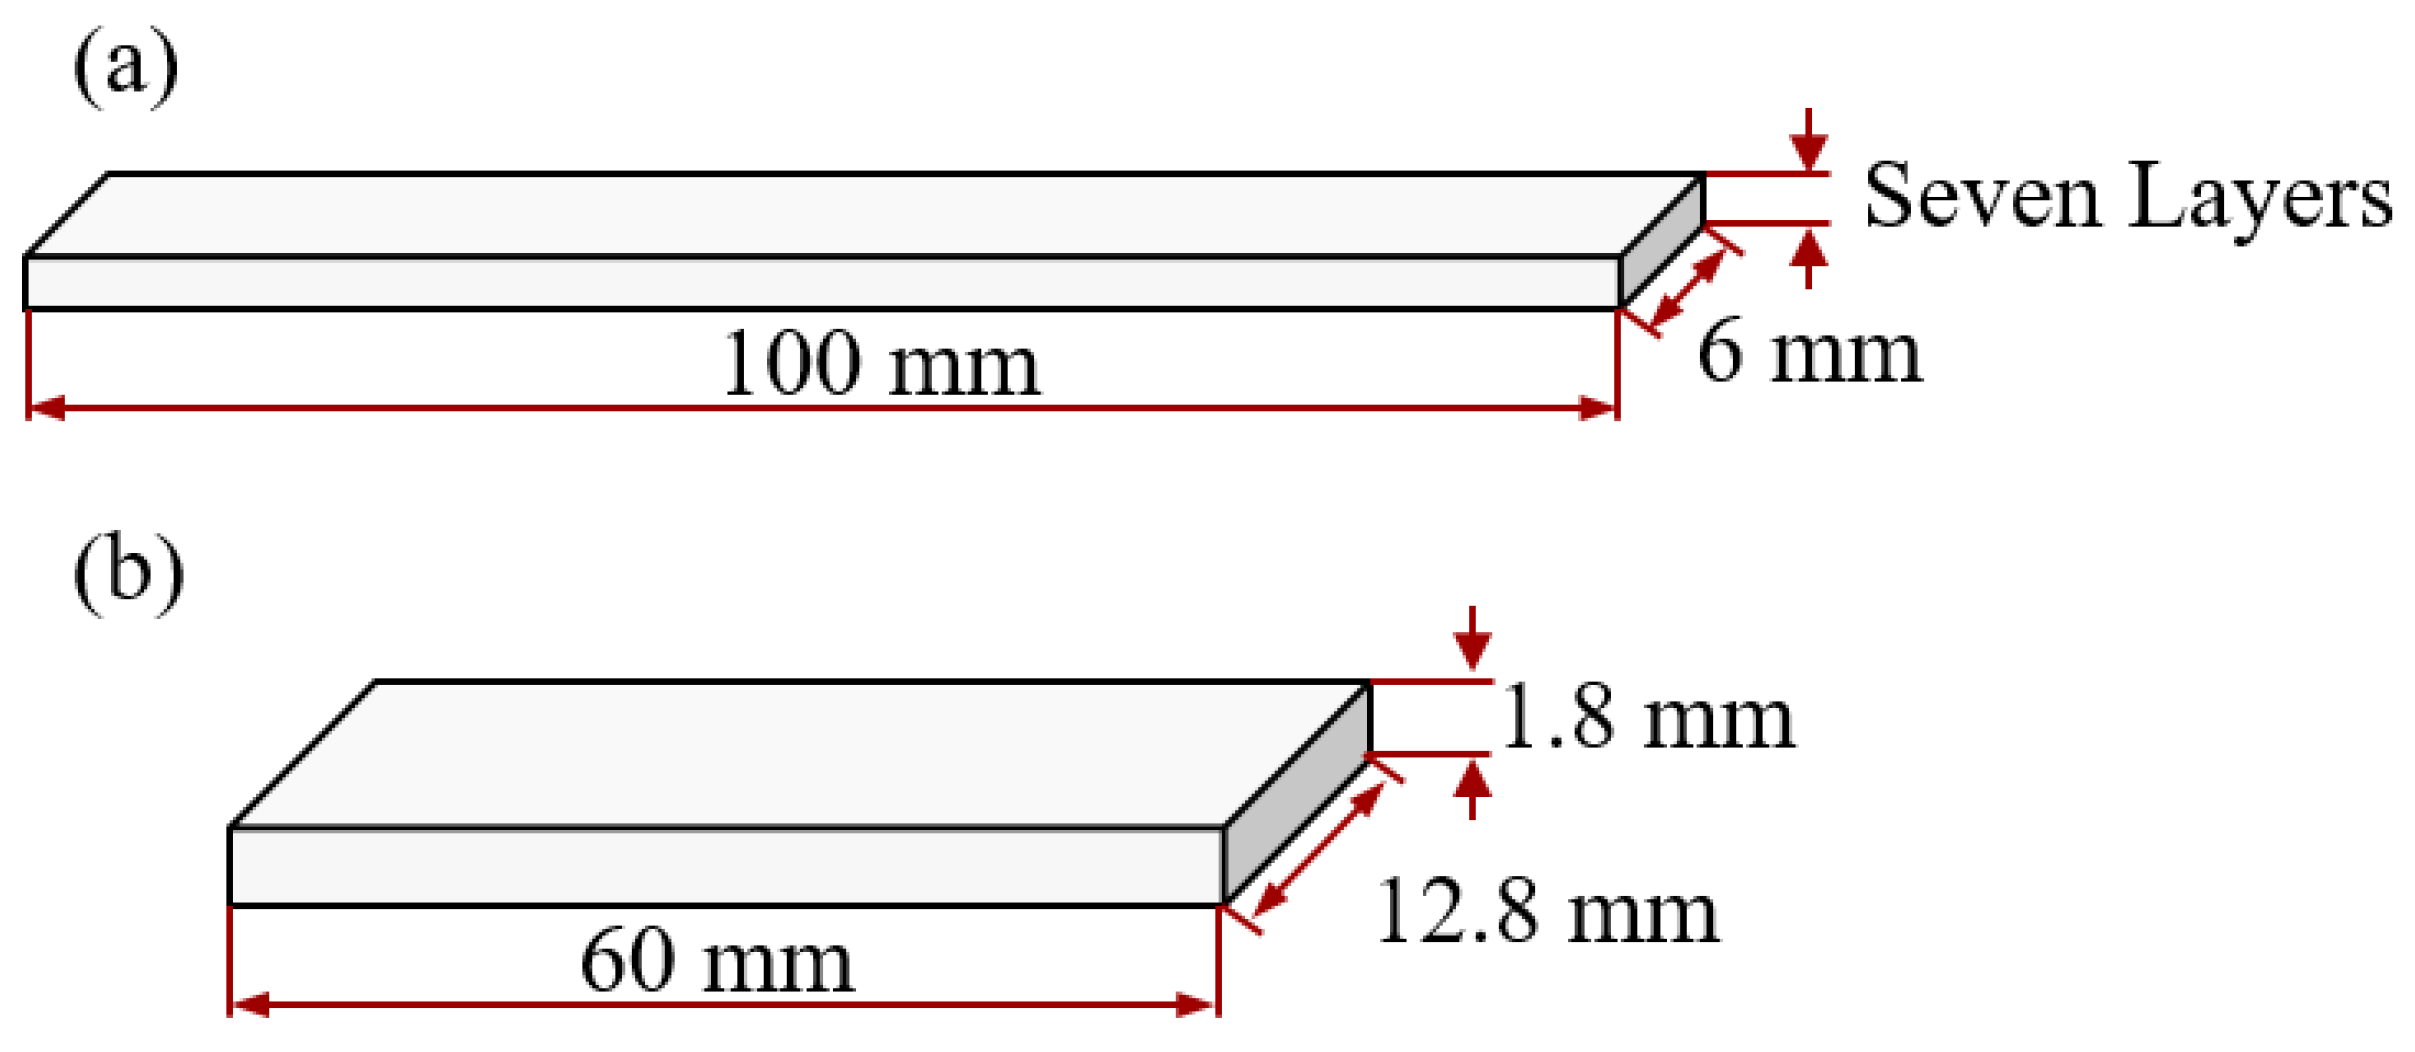
Figure 4.
3D printed specimens with different PLA filaments.
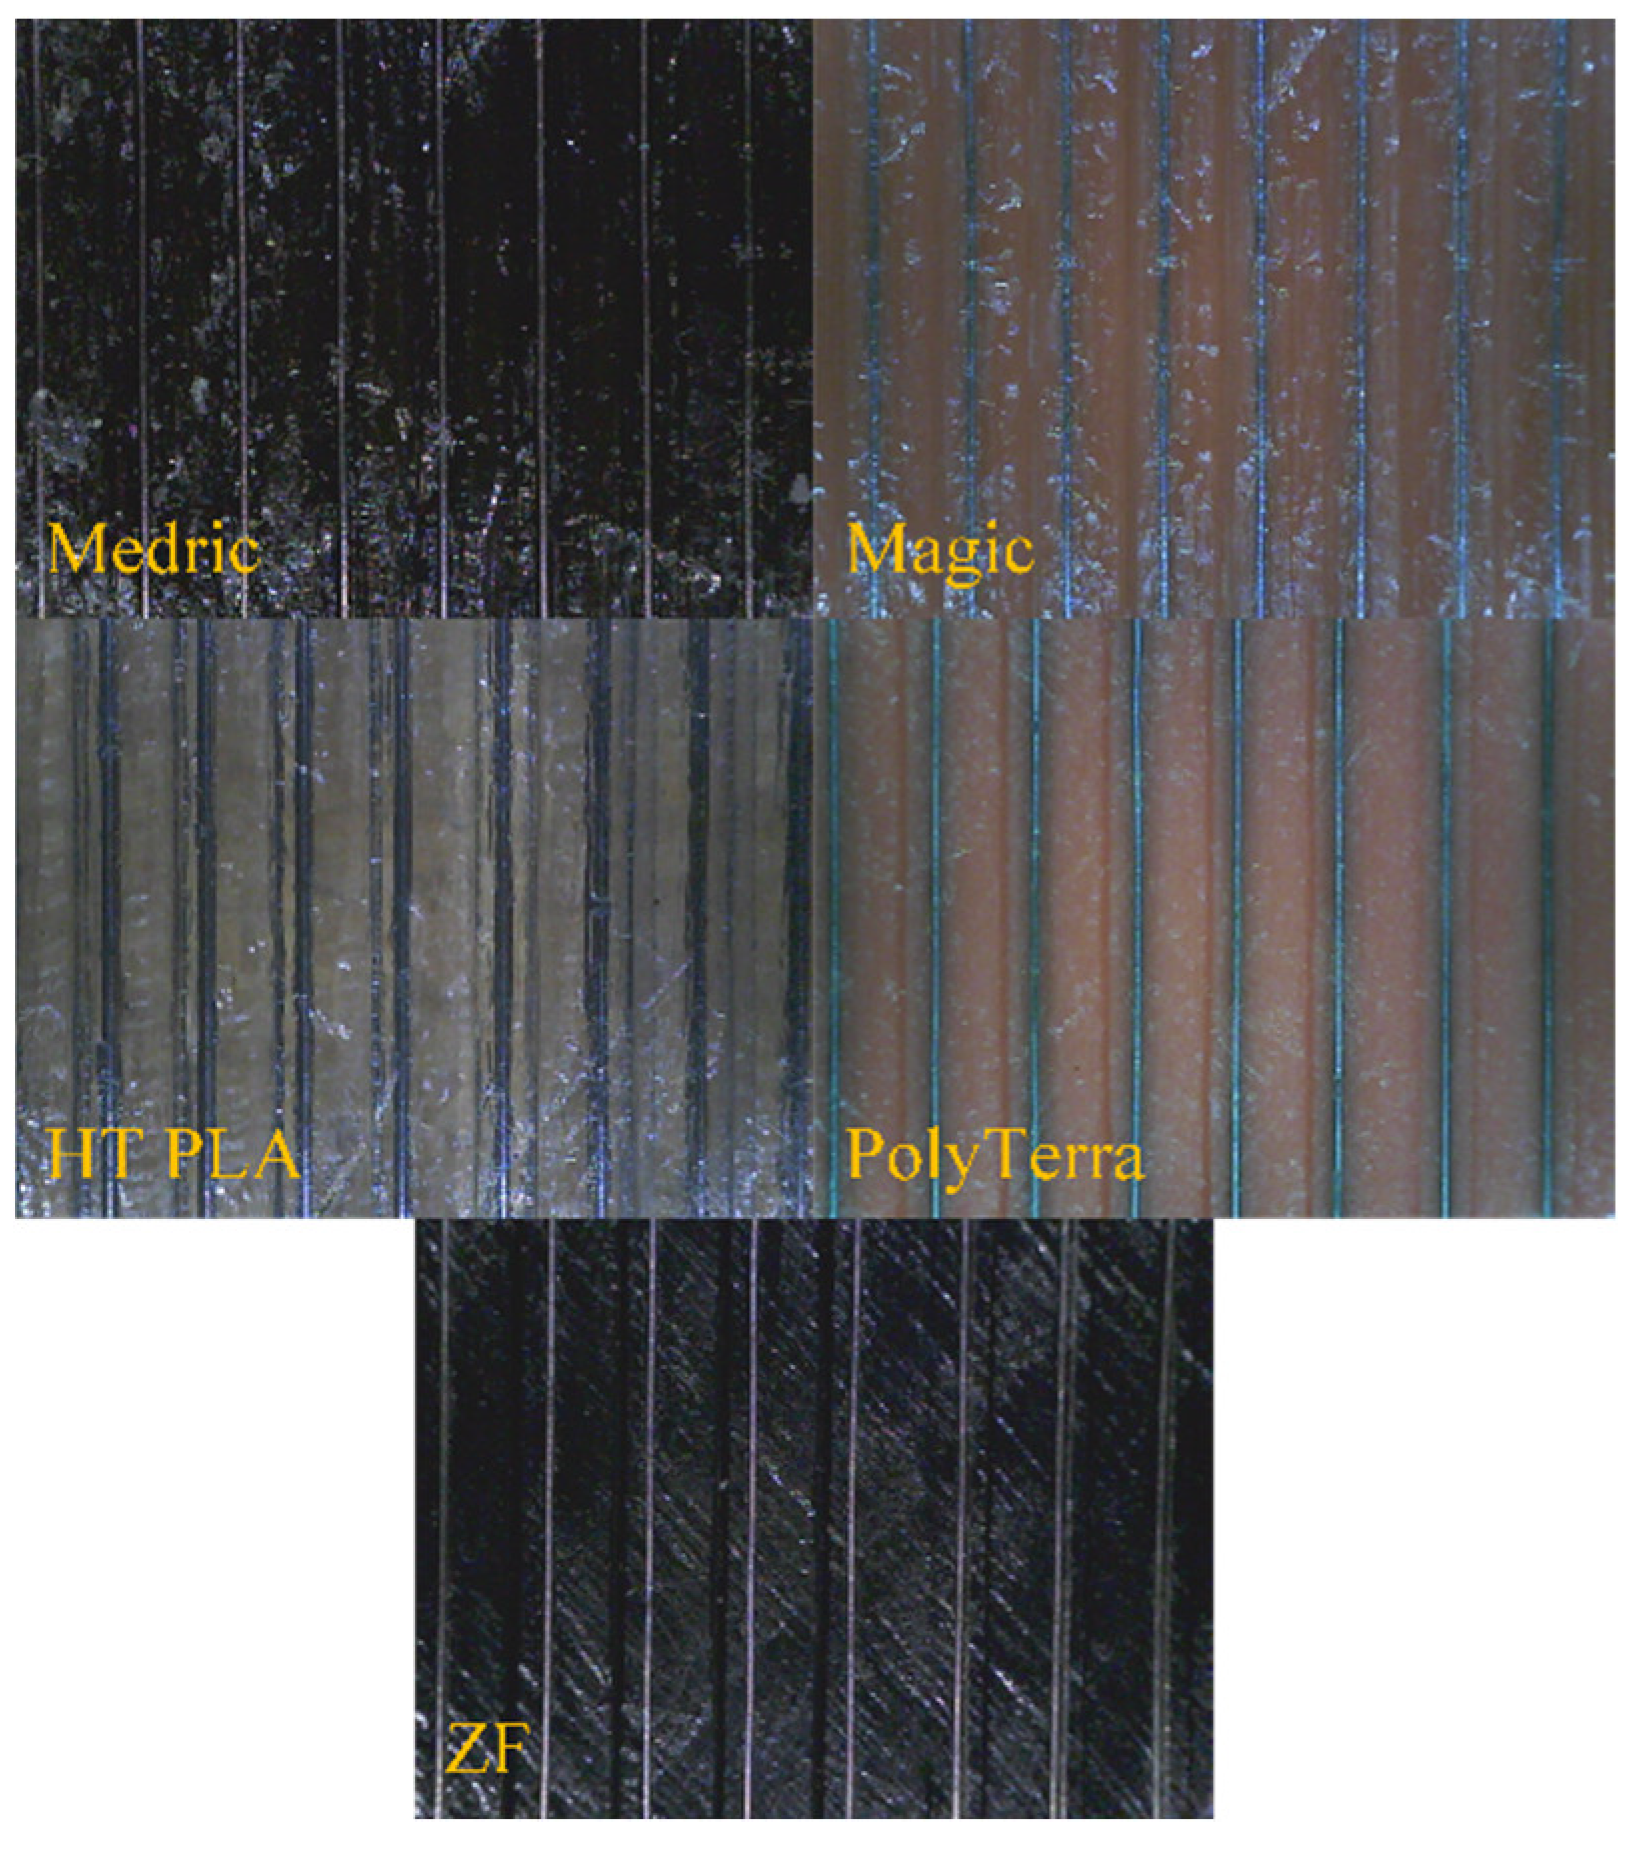
Figure 5.
Shape recovery of the PLA filaments.
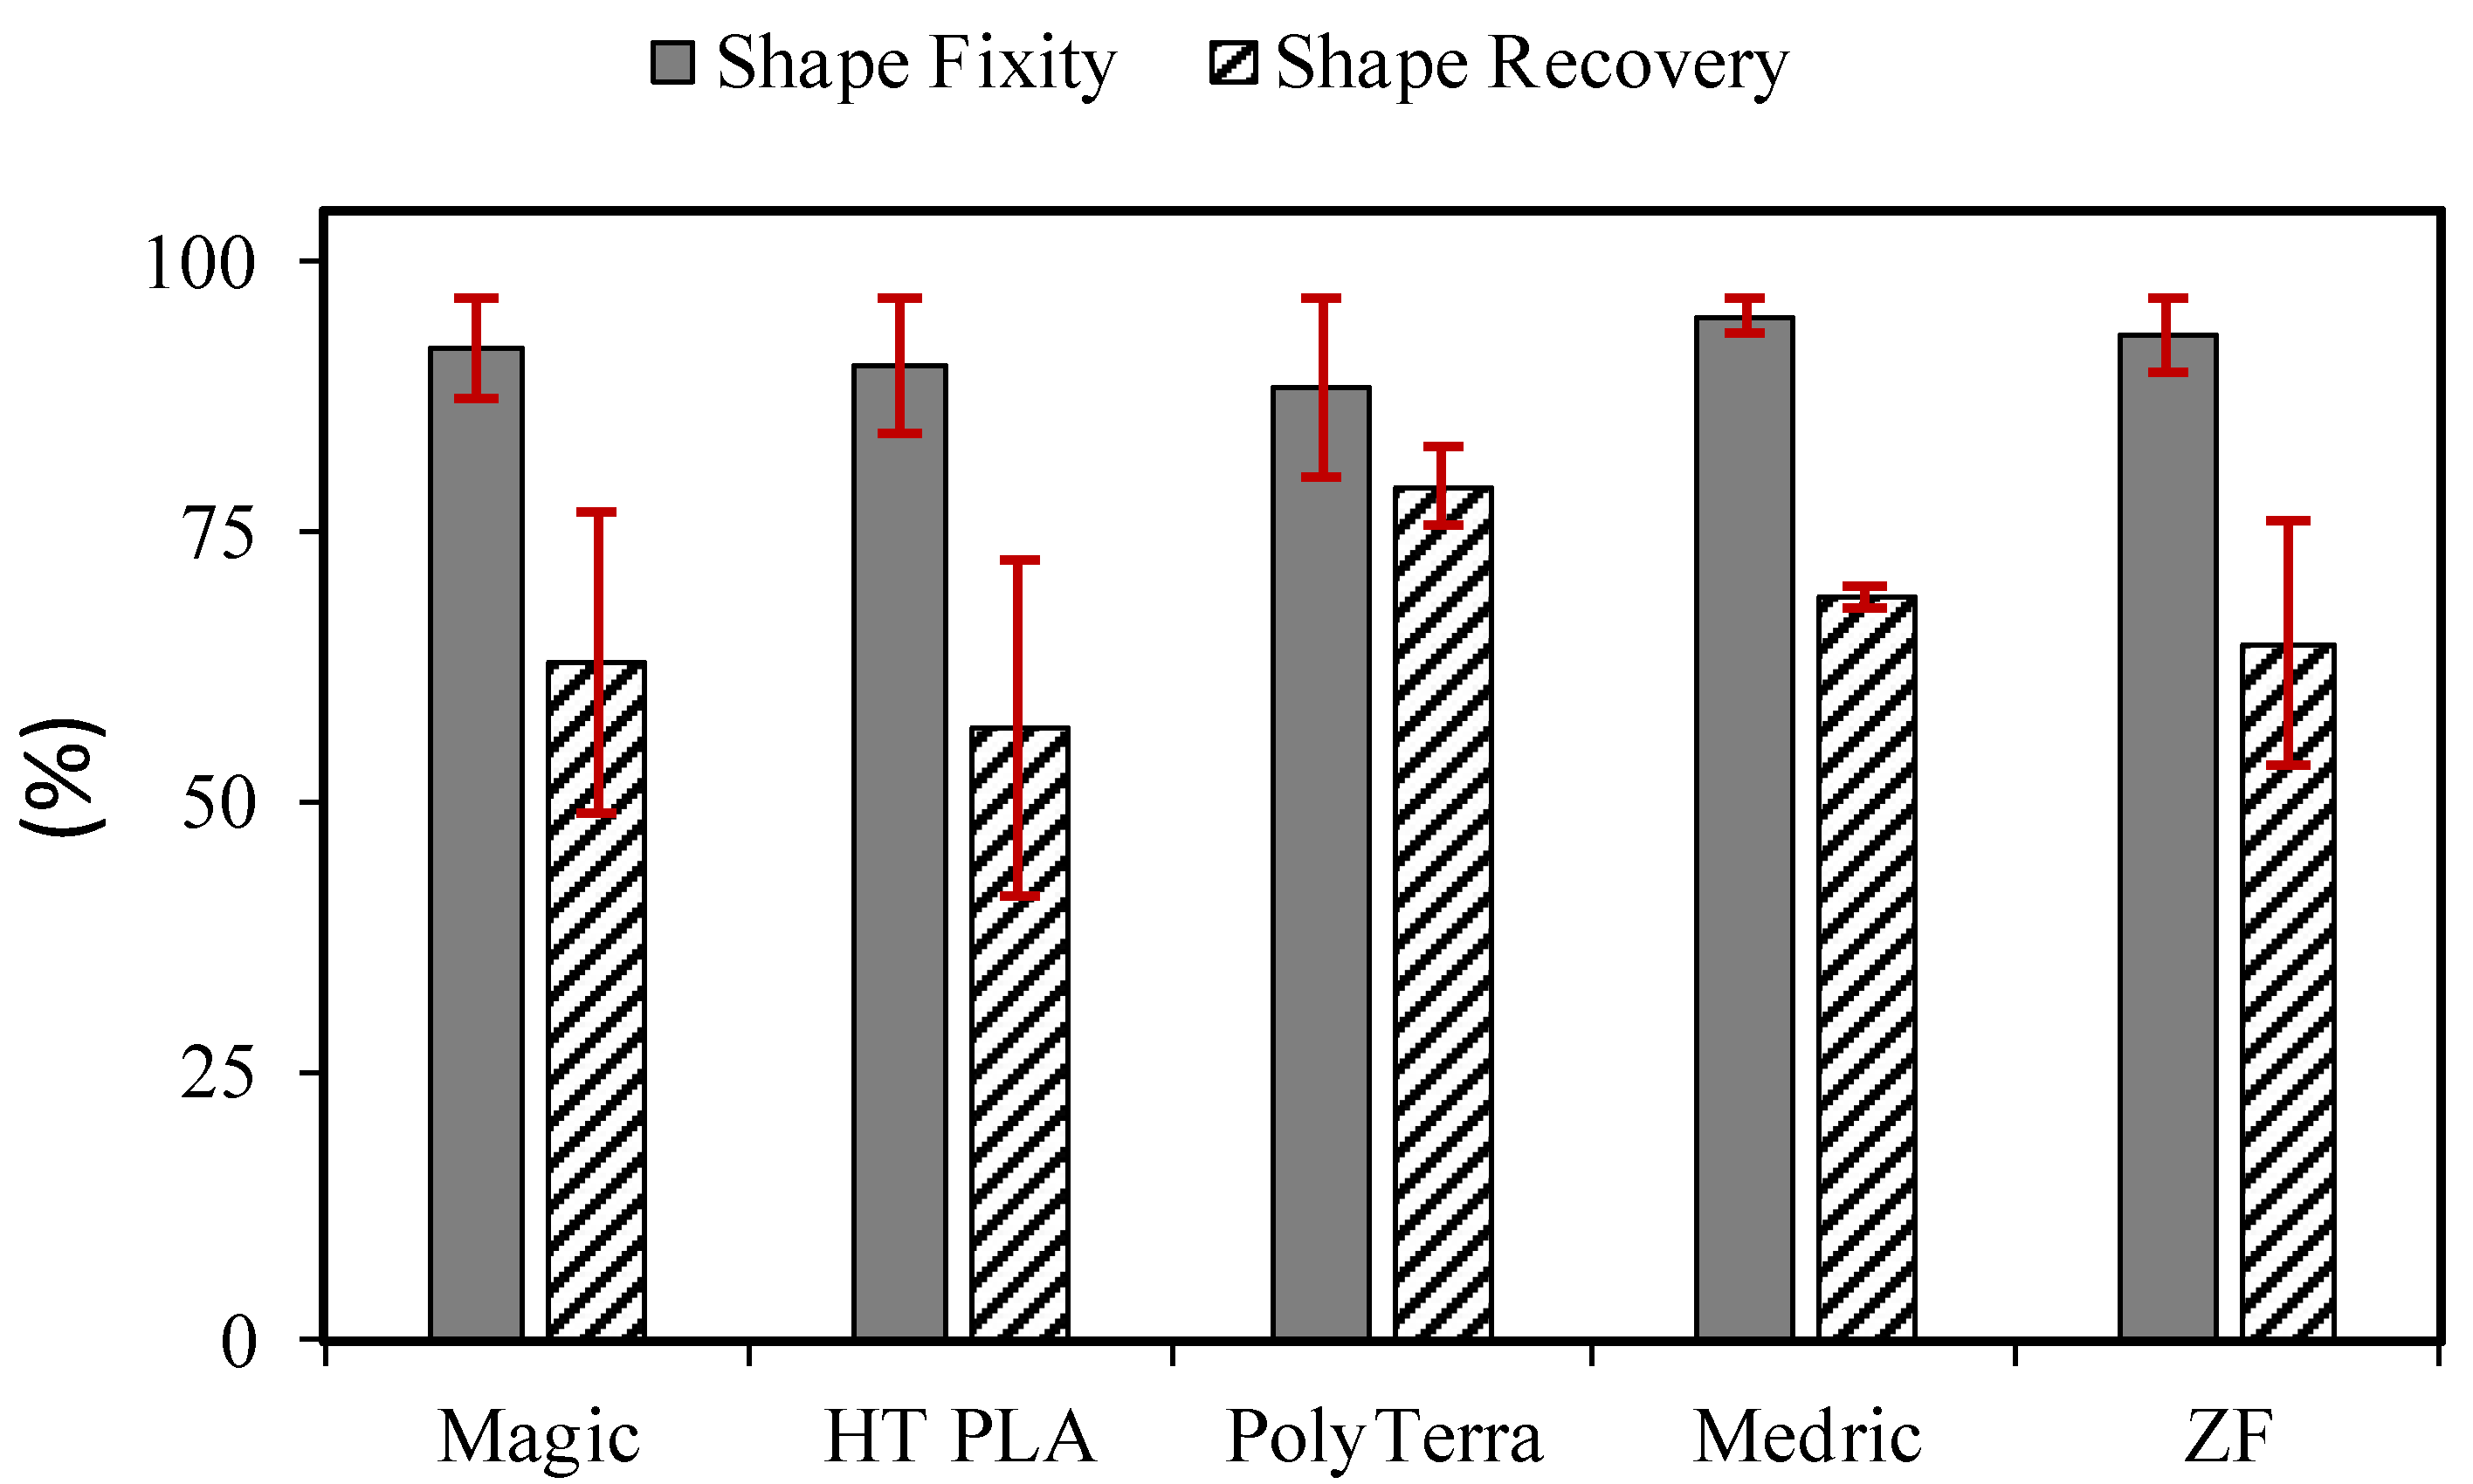
Figure 6.
DSC test results of the PLA filaments.
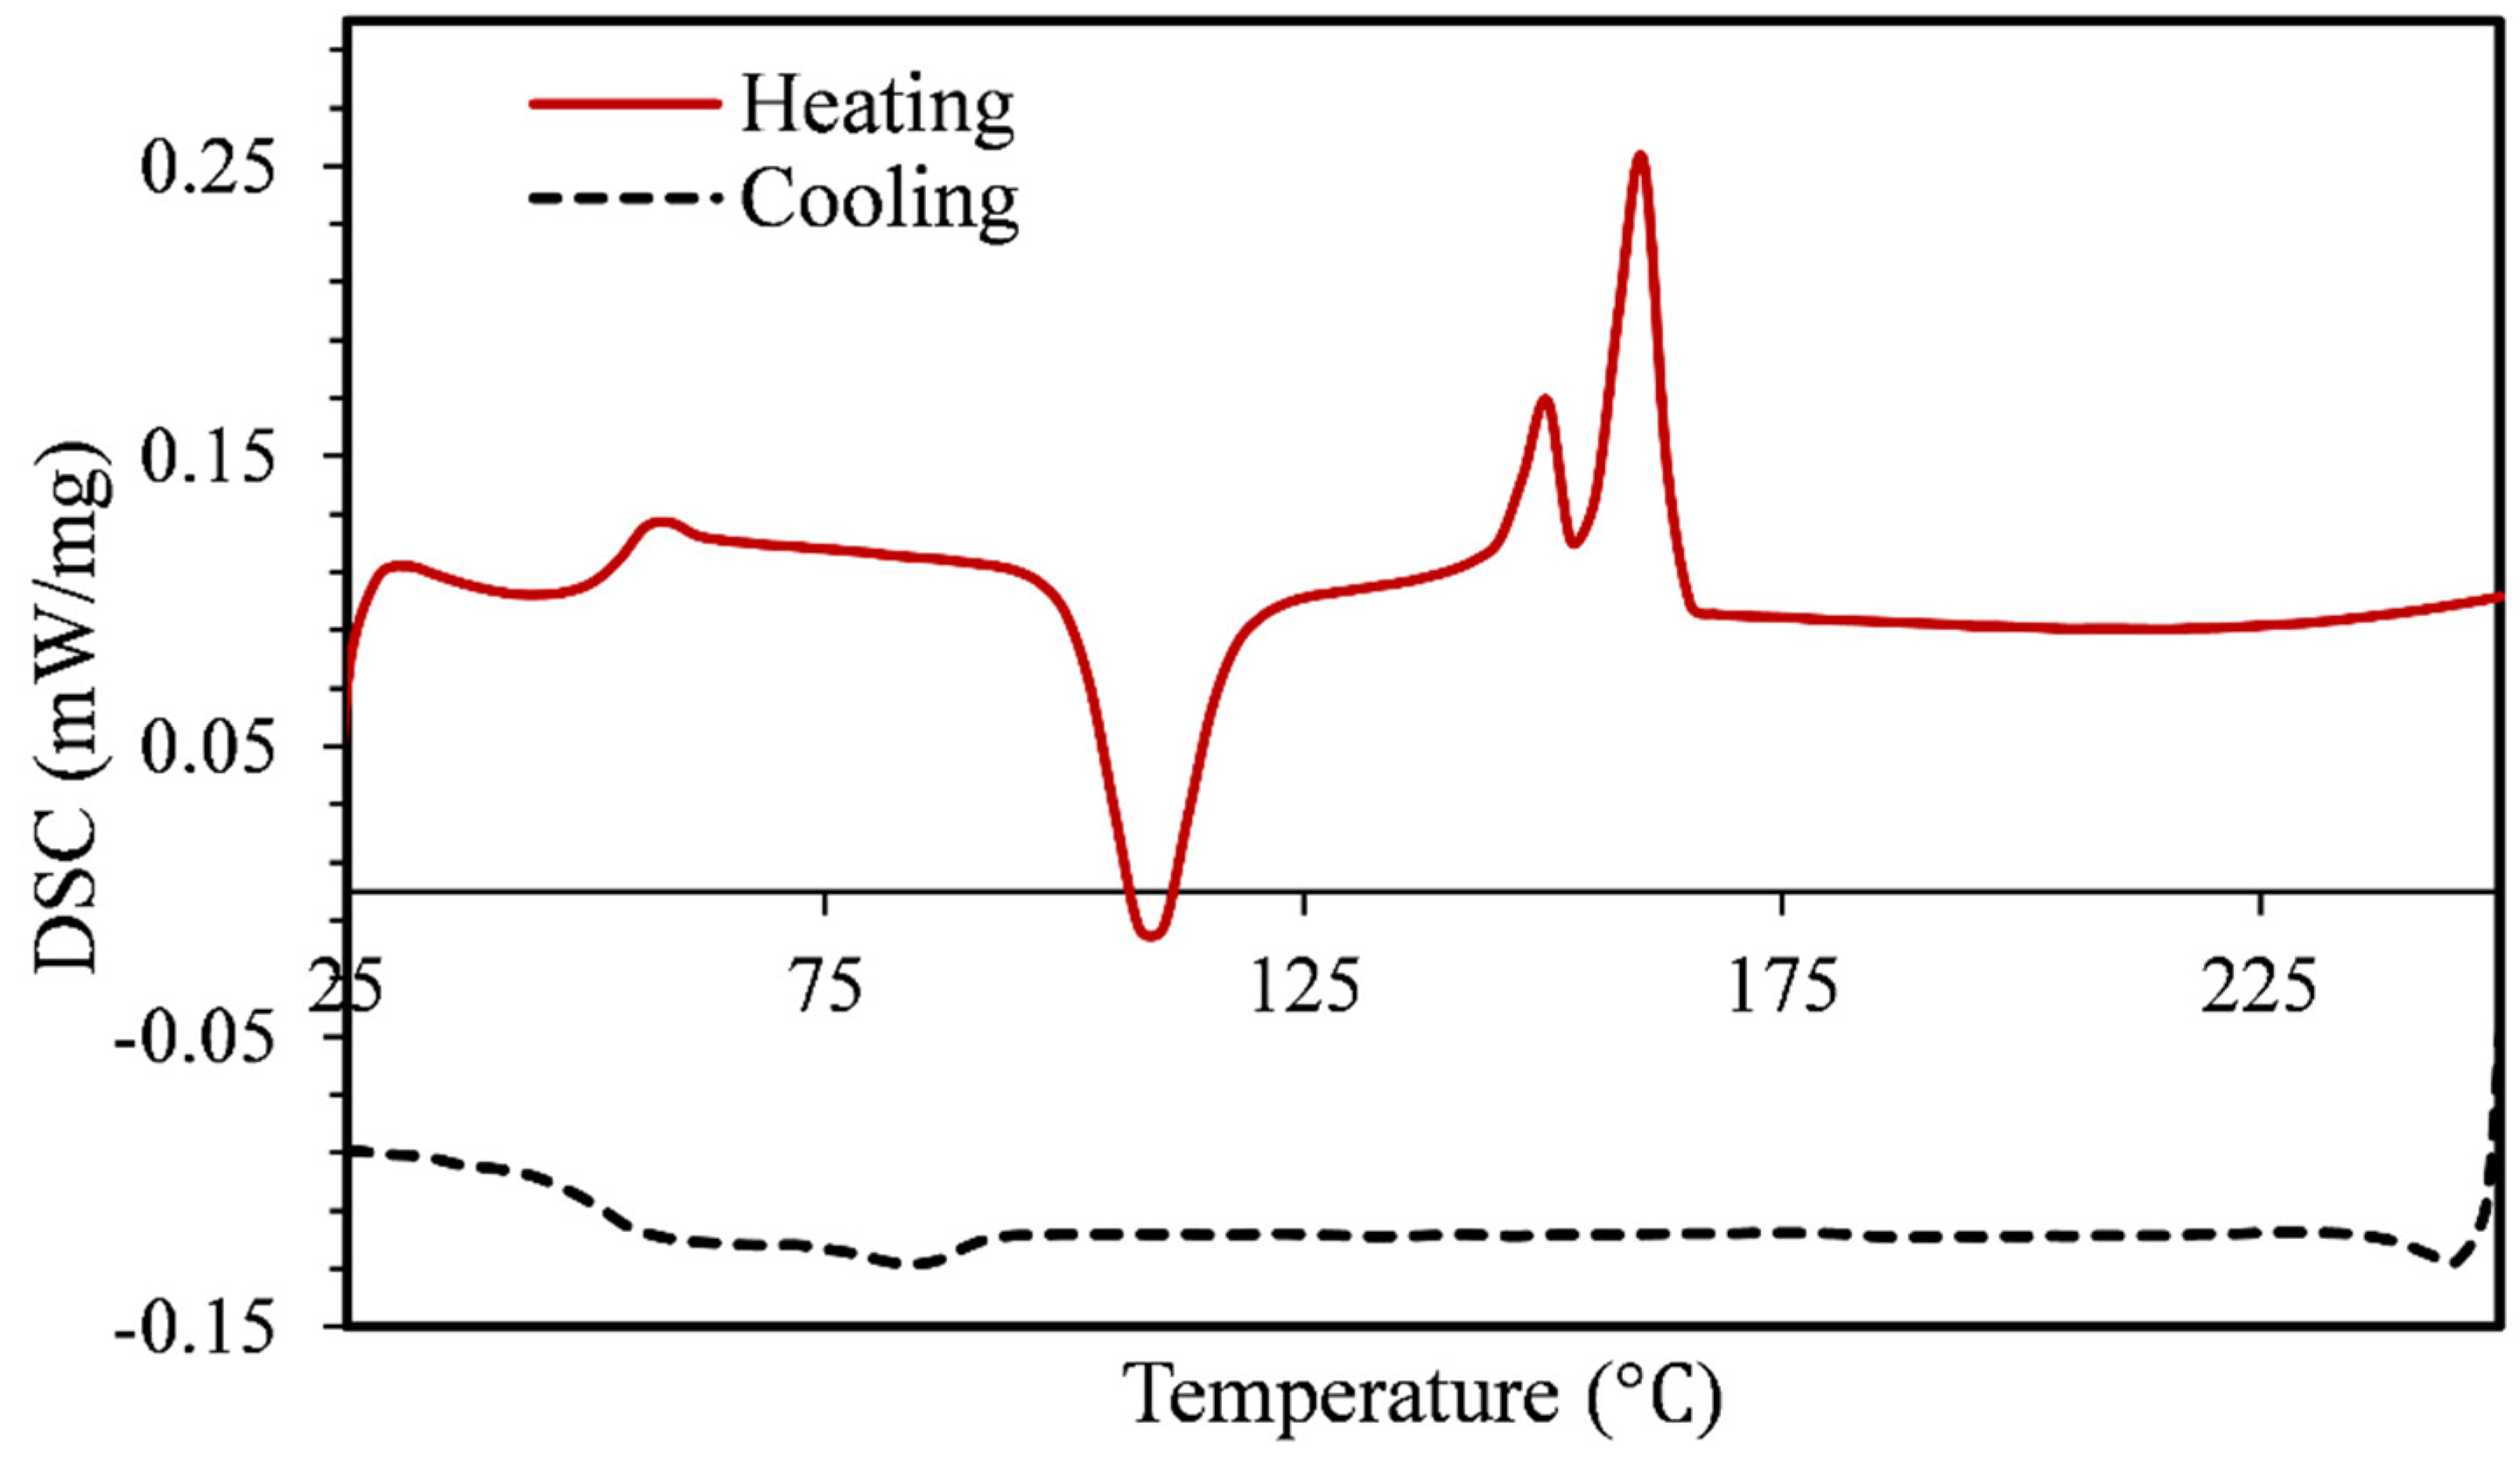
Figure 7.
Tensile stress-strain diagram of the metal wire a) 0.1 mm b) 0.15 mm.
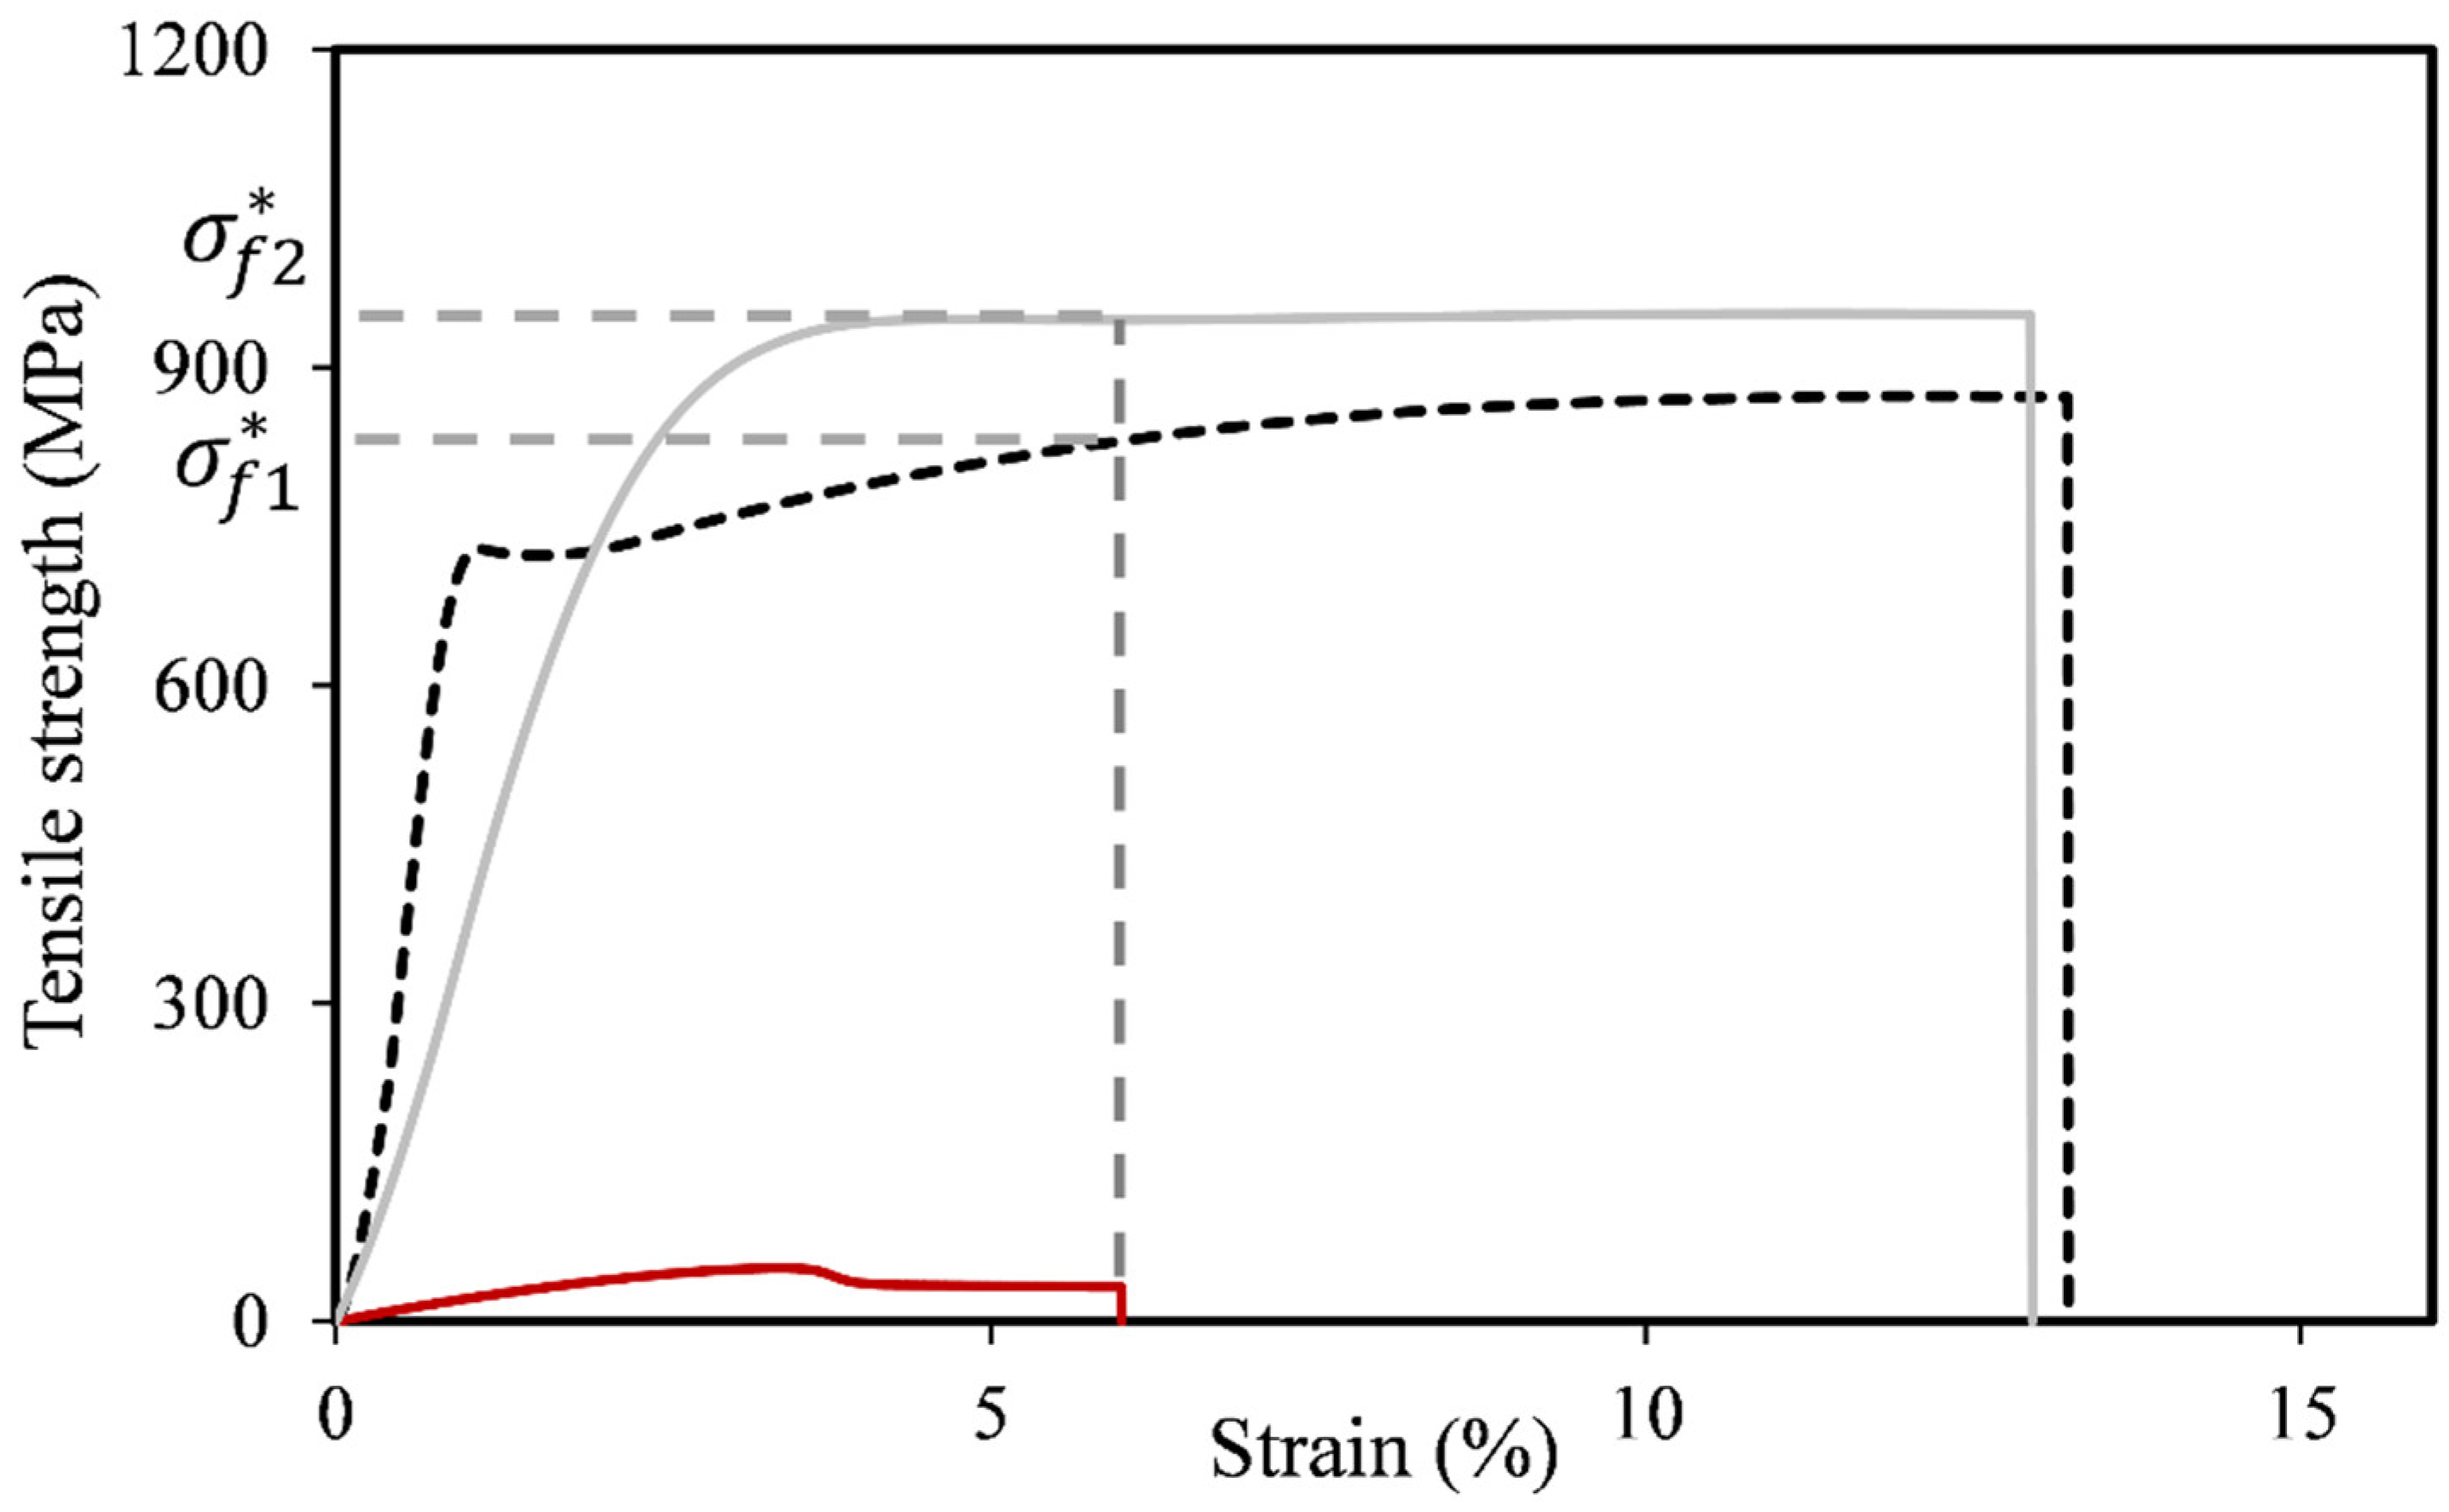
Figure 8.
Tensile stress-strain diagram of the neat and the reinforced PLA a) 0.1 mm b) 0.15 mm.
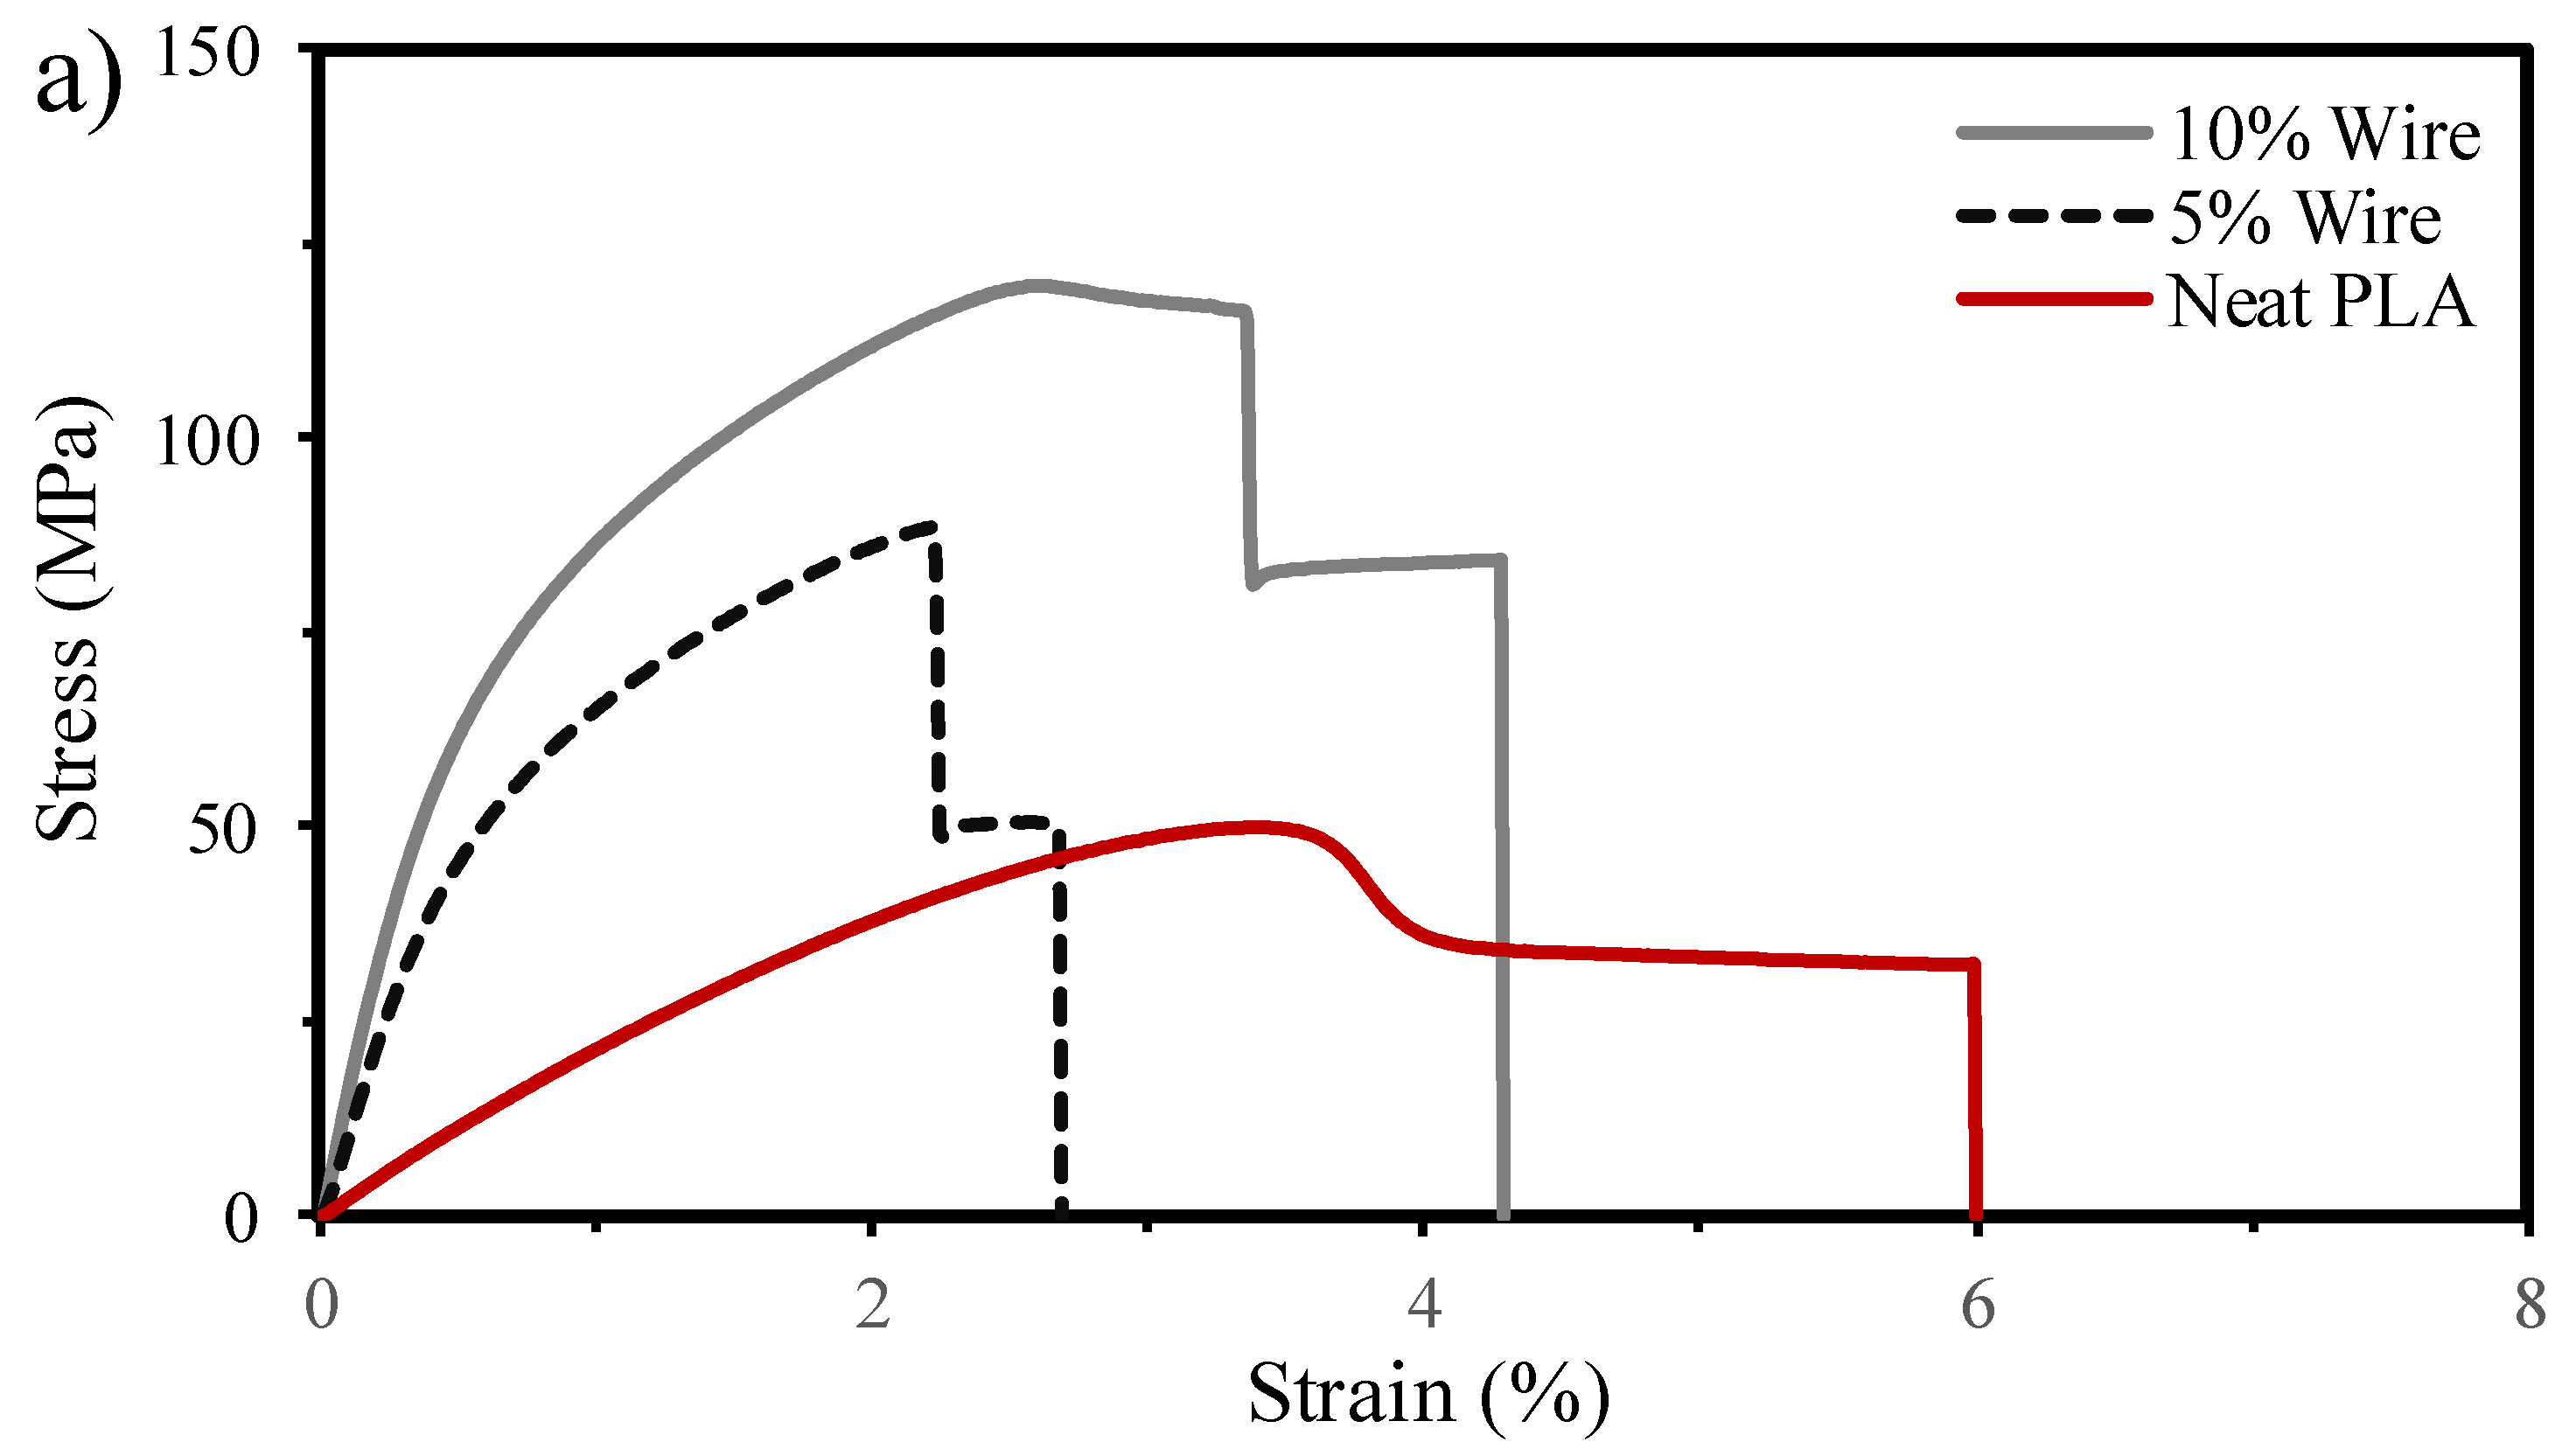
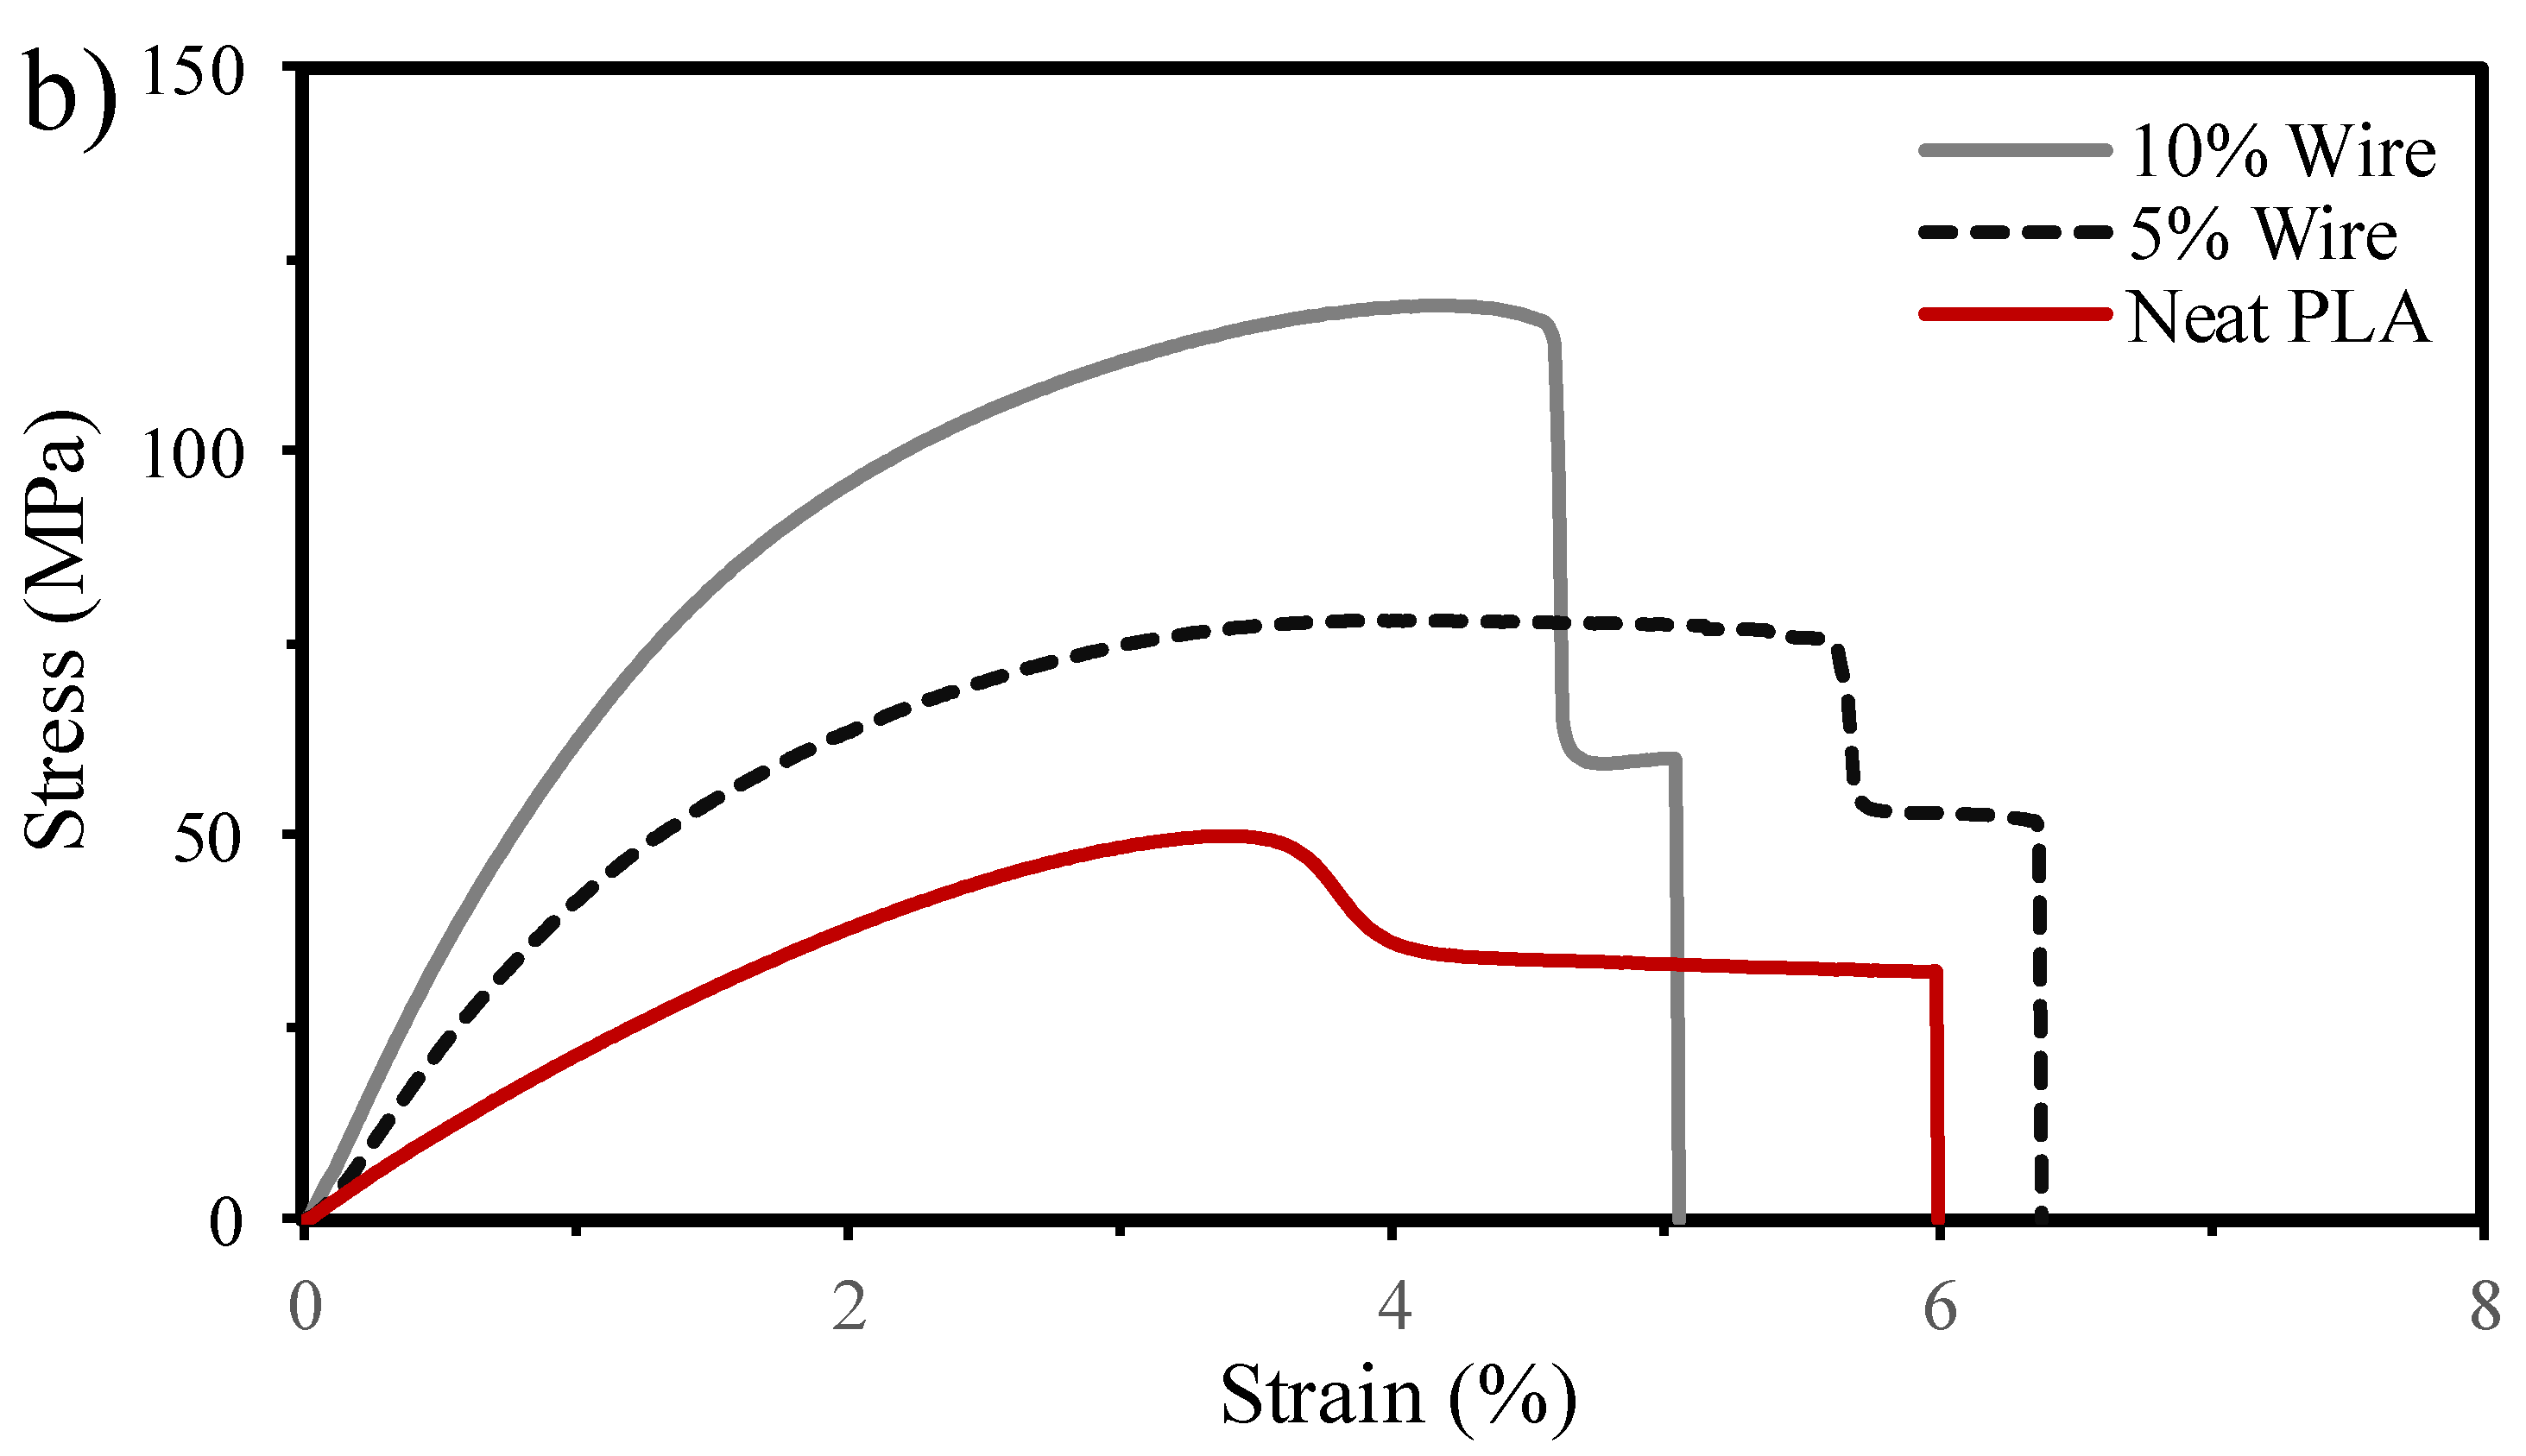
Figure 9.
Experimental and theoretical tensile test results of the reinforced PLA a) tensile strength and b) elastic modulus.
Figure 9.
Experimental and theoretical tensile test results of the reinforced PLA a) tensile strength and b) elastic modulus.
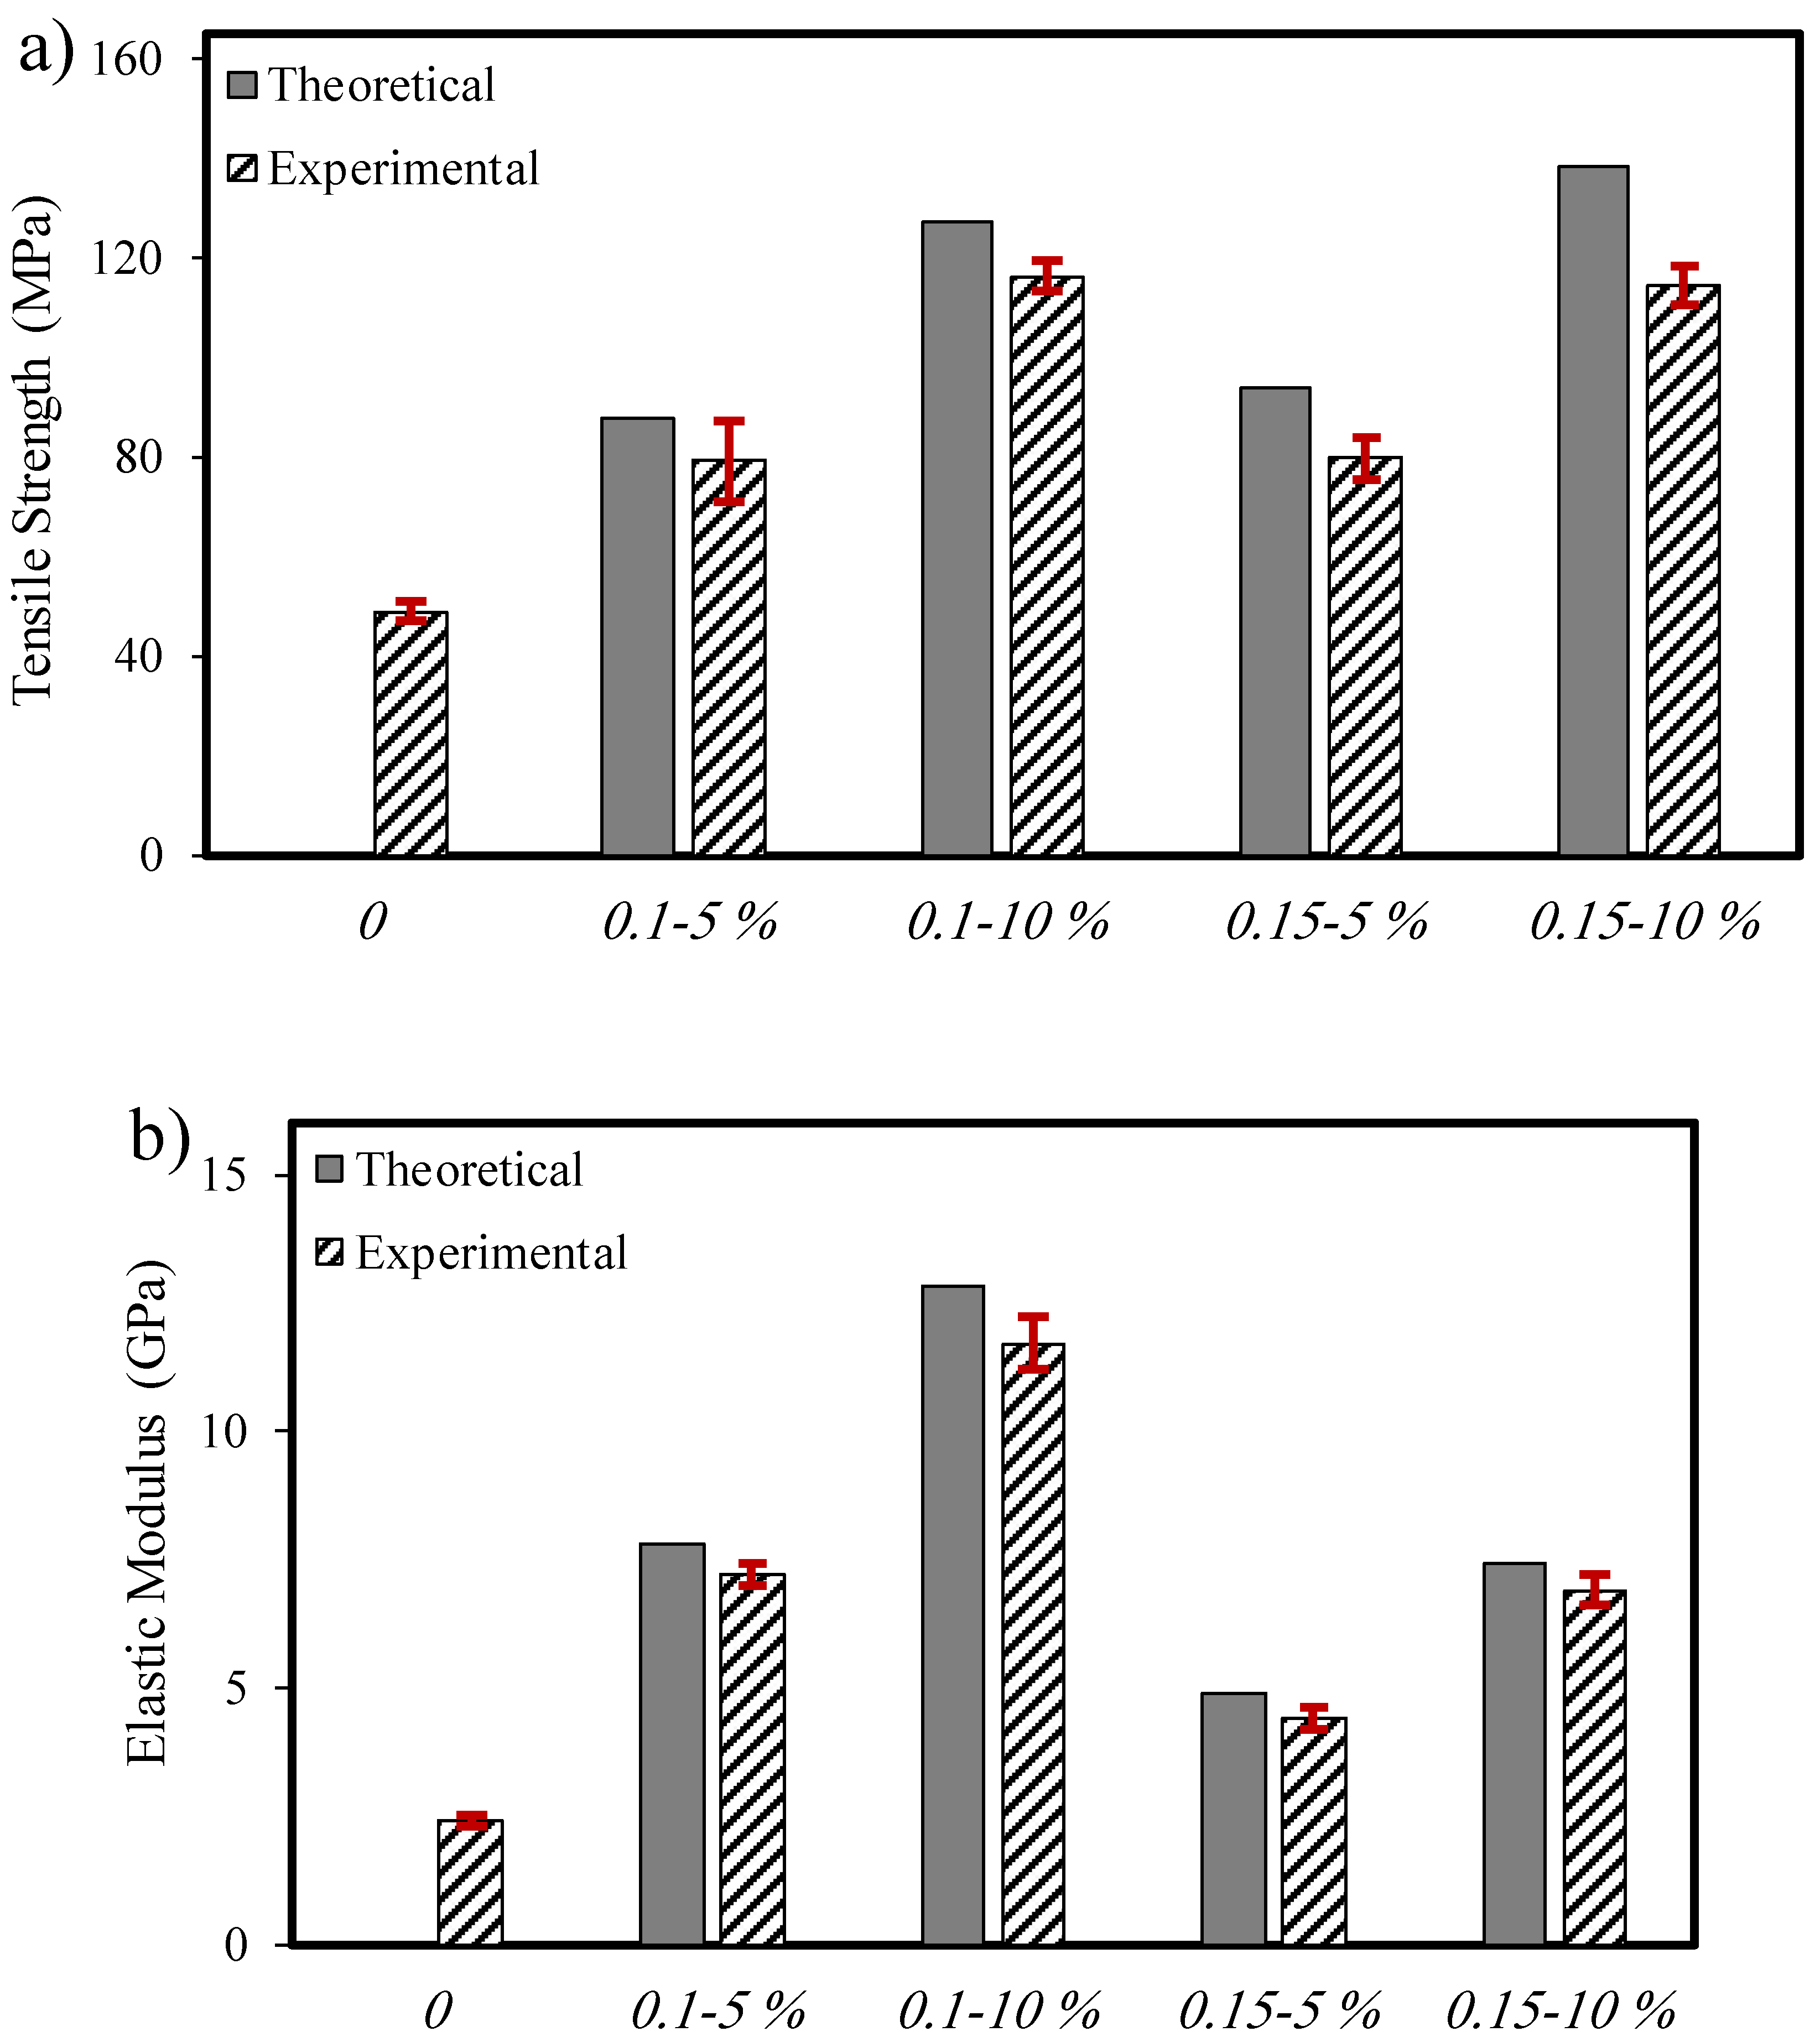
Figure 10.
Flexural stress-strain diagram of the neat and the reinforced PLA a) 0.1 mm b) 0.15 mm.
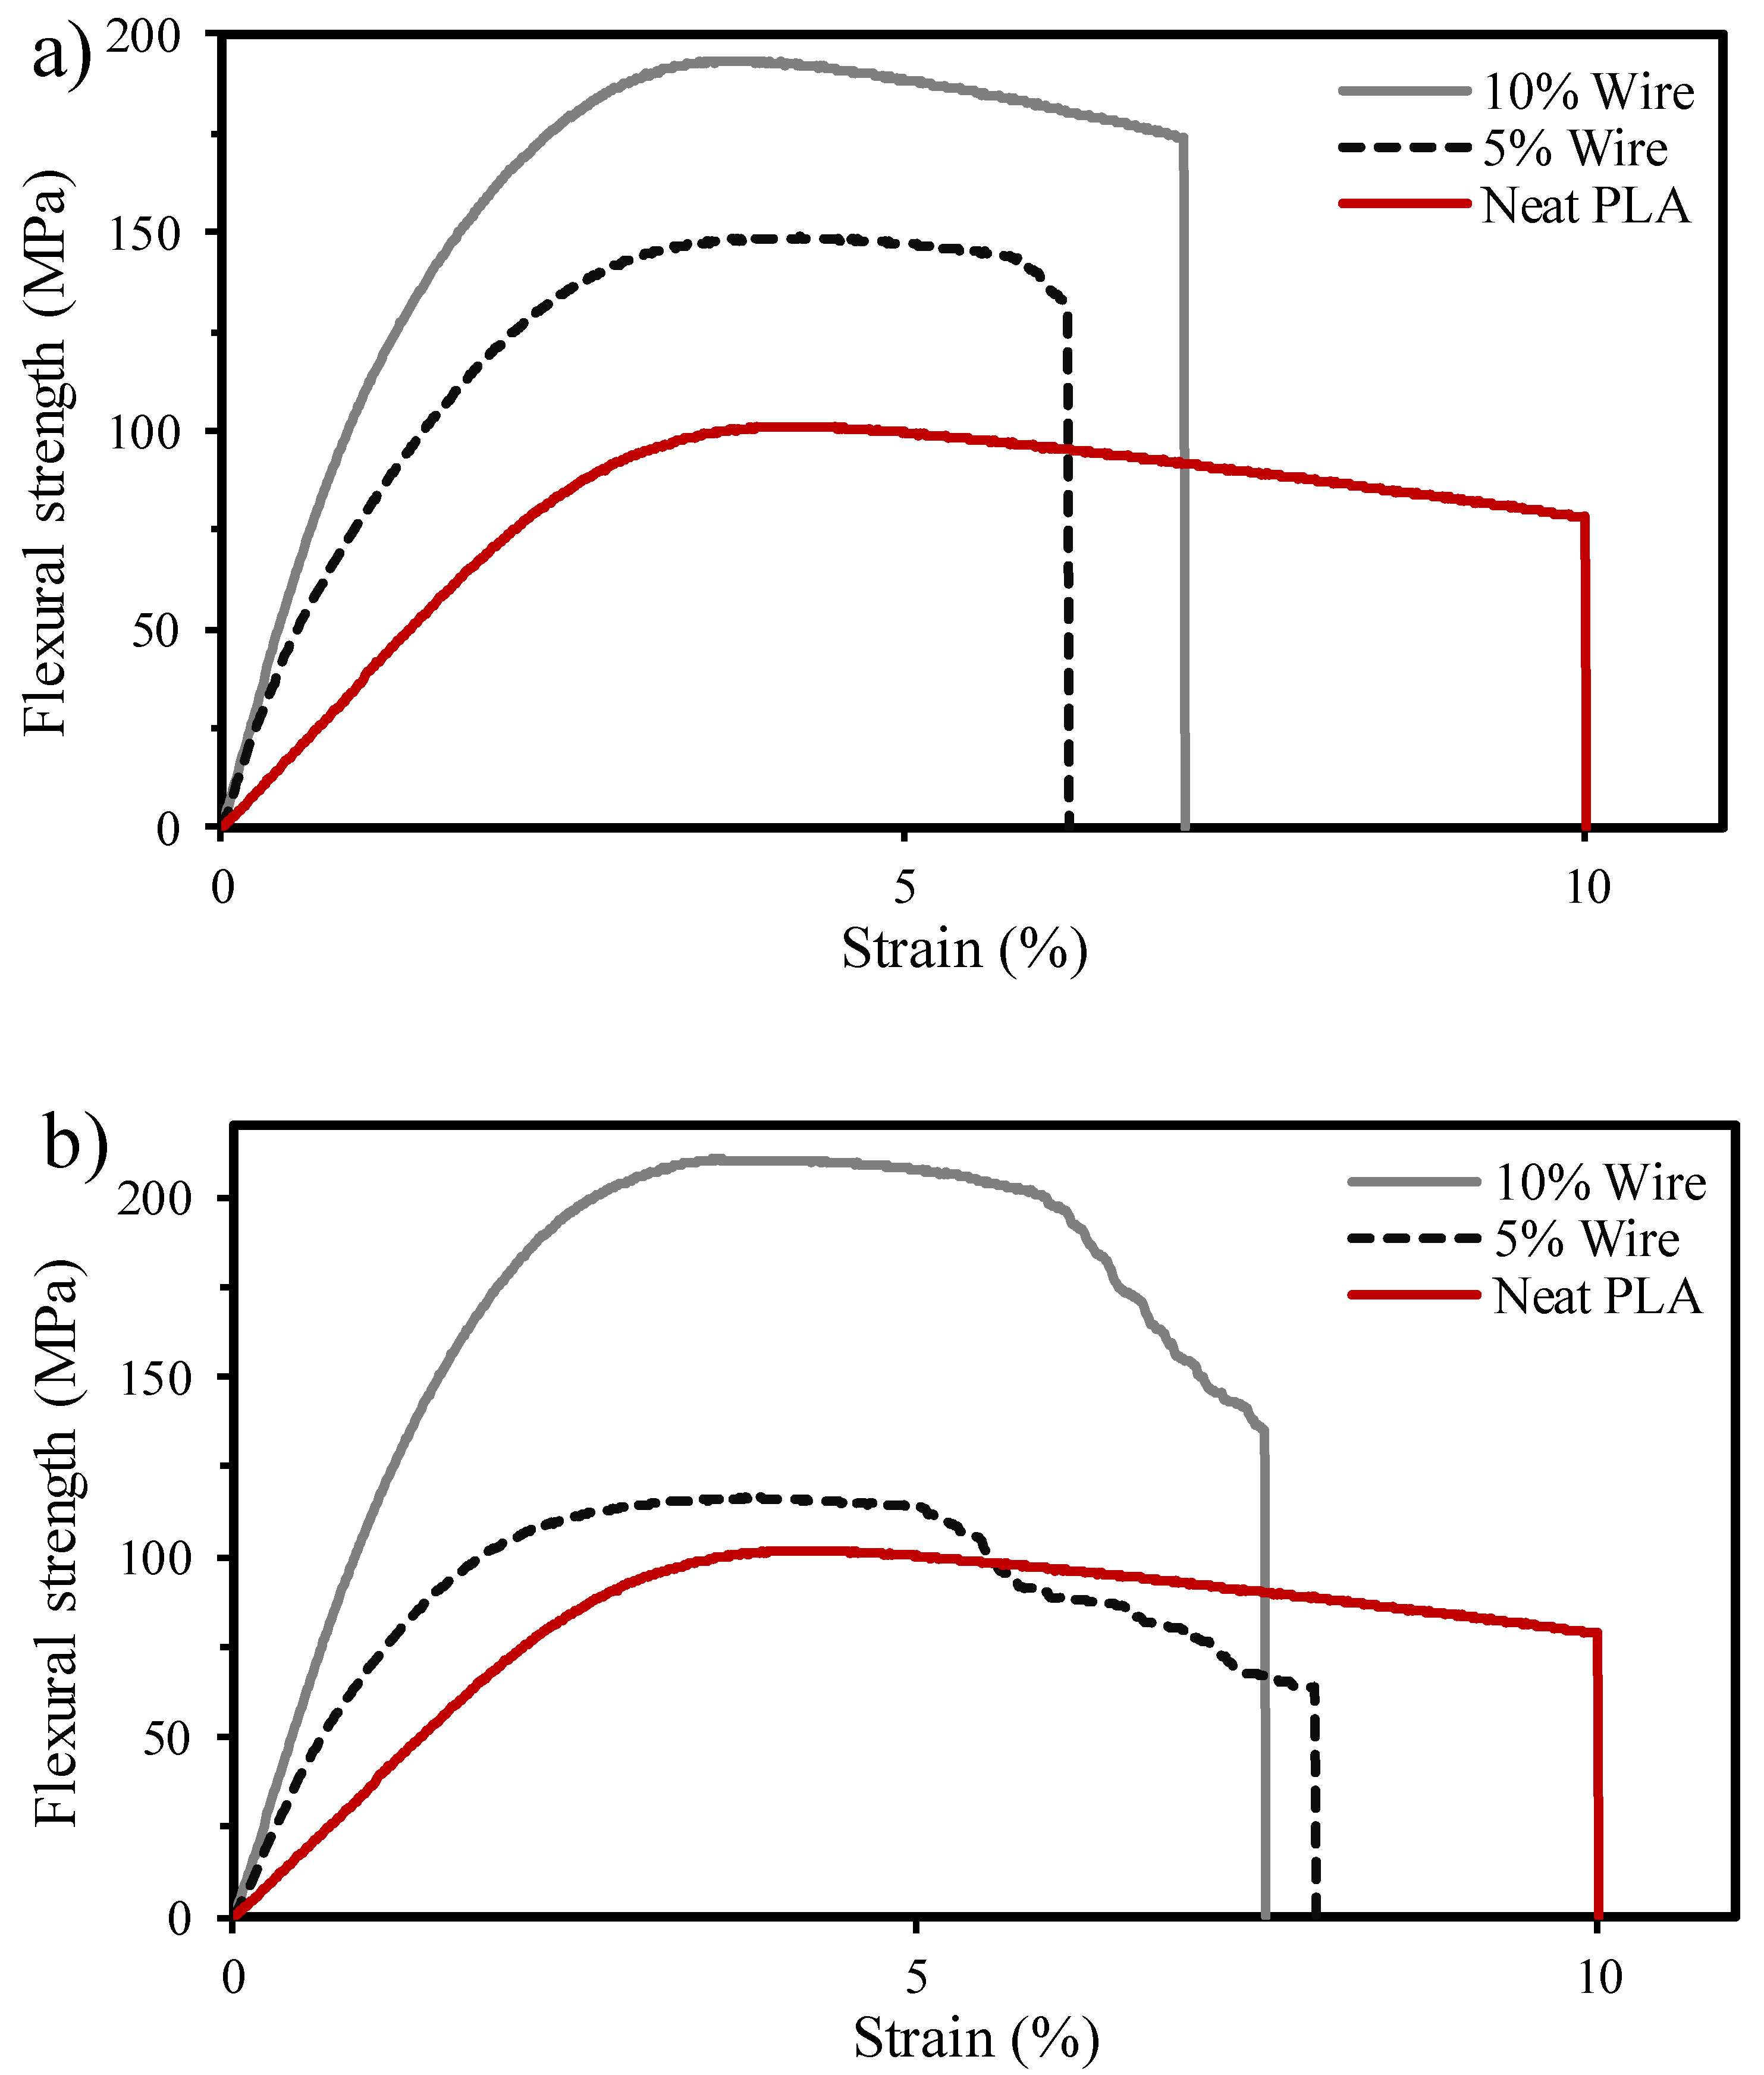
Figure 11.
Flexural stress-strain diagram of the neat and the reinforced PLA at 60 °C a) 0.1 mm b) 0.15 mm.
Figure 11.
Flexural stress-strain diagram of the neat and the reinforced PLA at 60 °C a) 0.1 mm b) 0.15 mm.
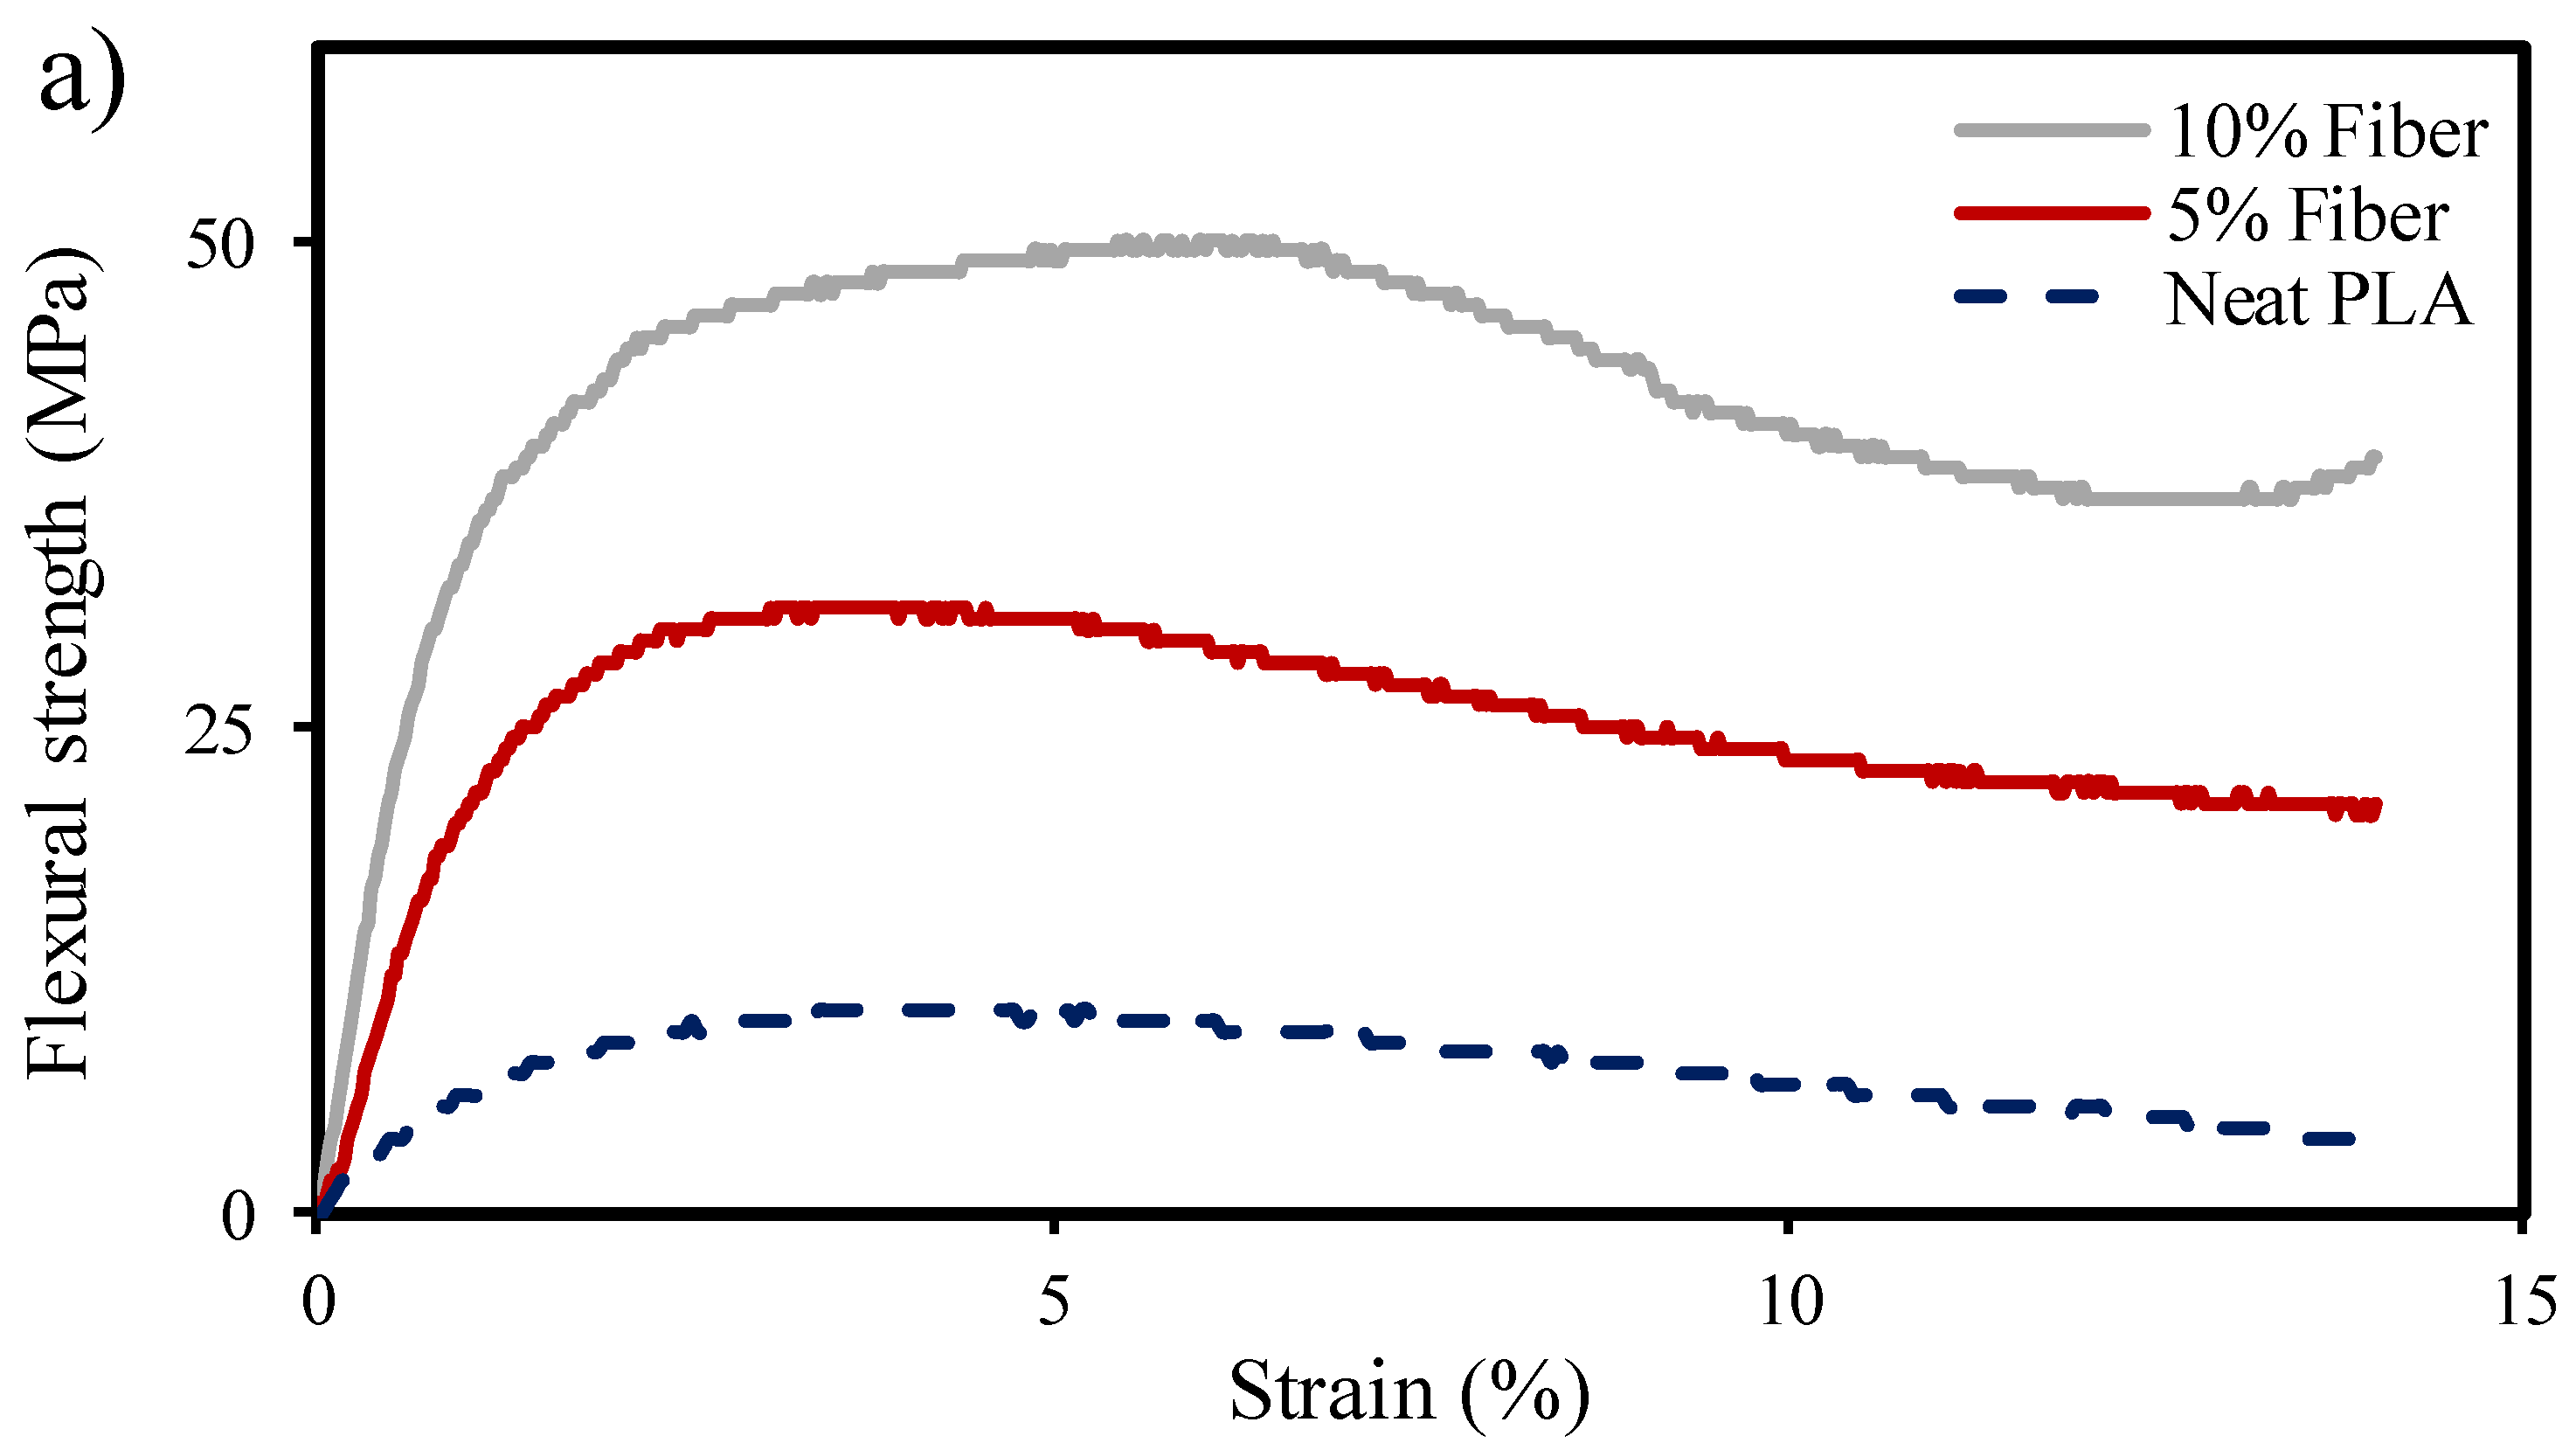
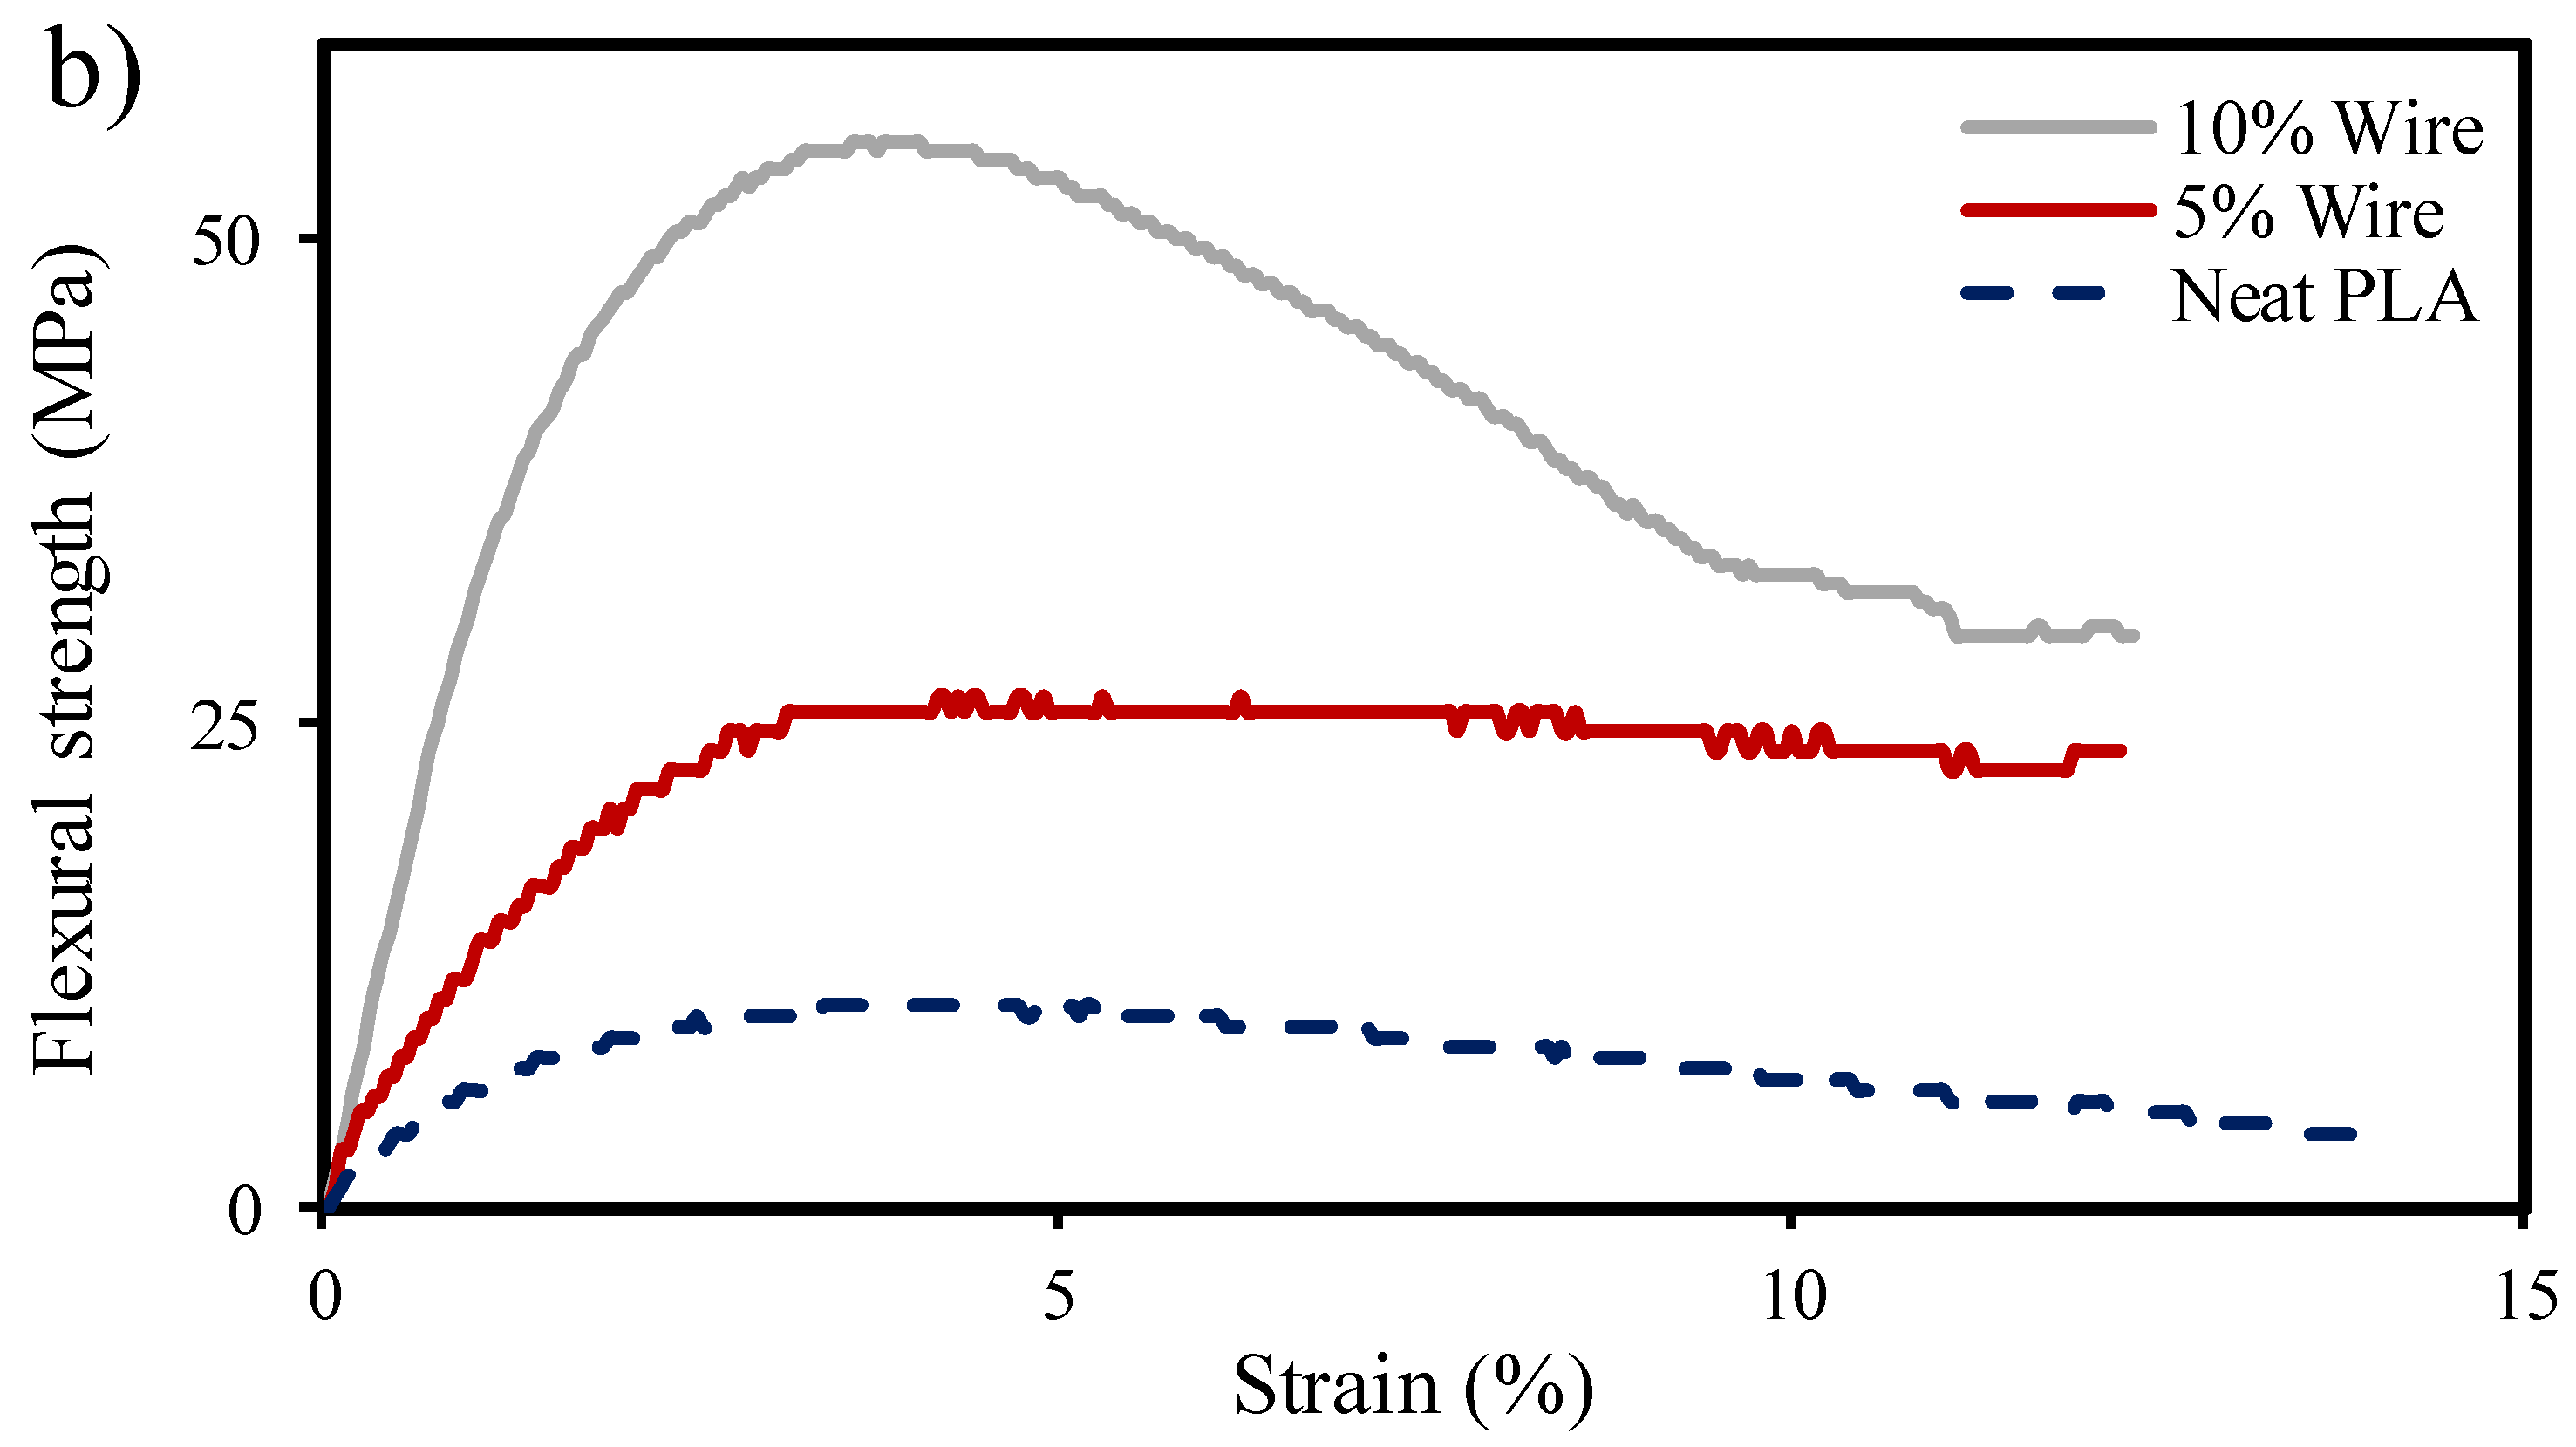
Figure 12.
DMTA test results of non-reinforced and reinforced specimens with wire diameters of 0.1 mm and 0.15 mm with of 5 and 10 vol.%.
Figure 12.
DMTA test results of non-reinforced and reinforced specimens with wire diameters of 0.1 mm and 0.15 mm with of 5 and 10 vol.%.
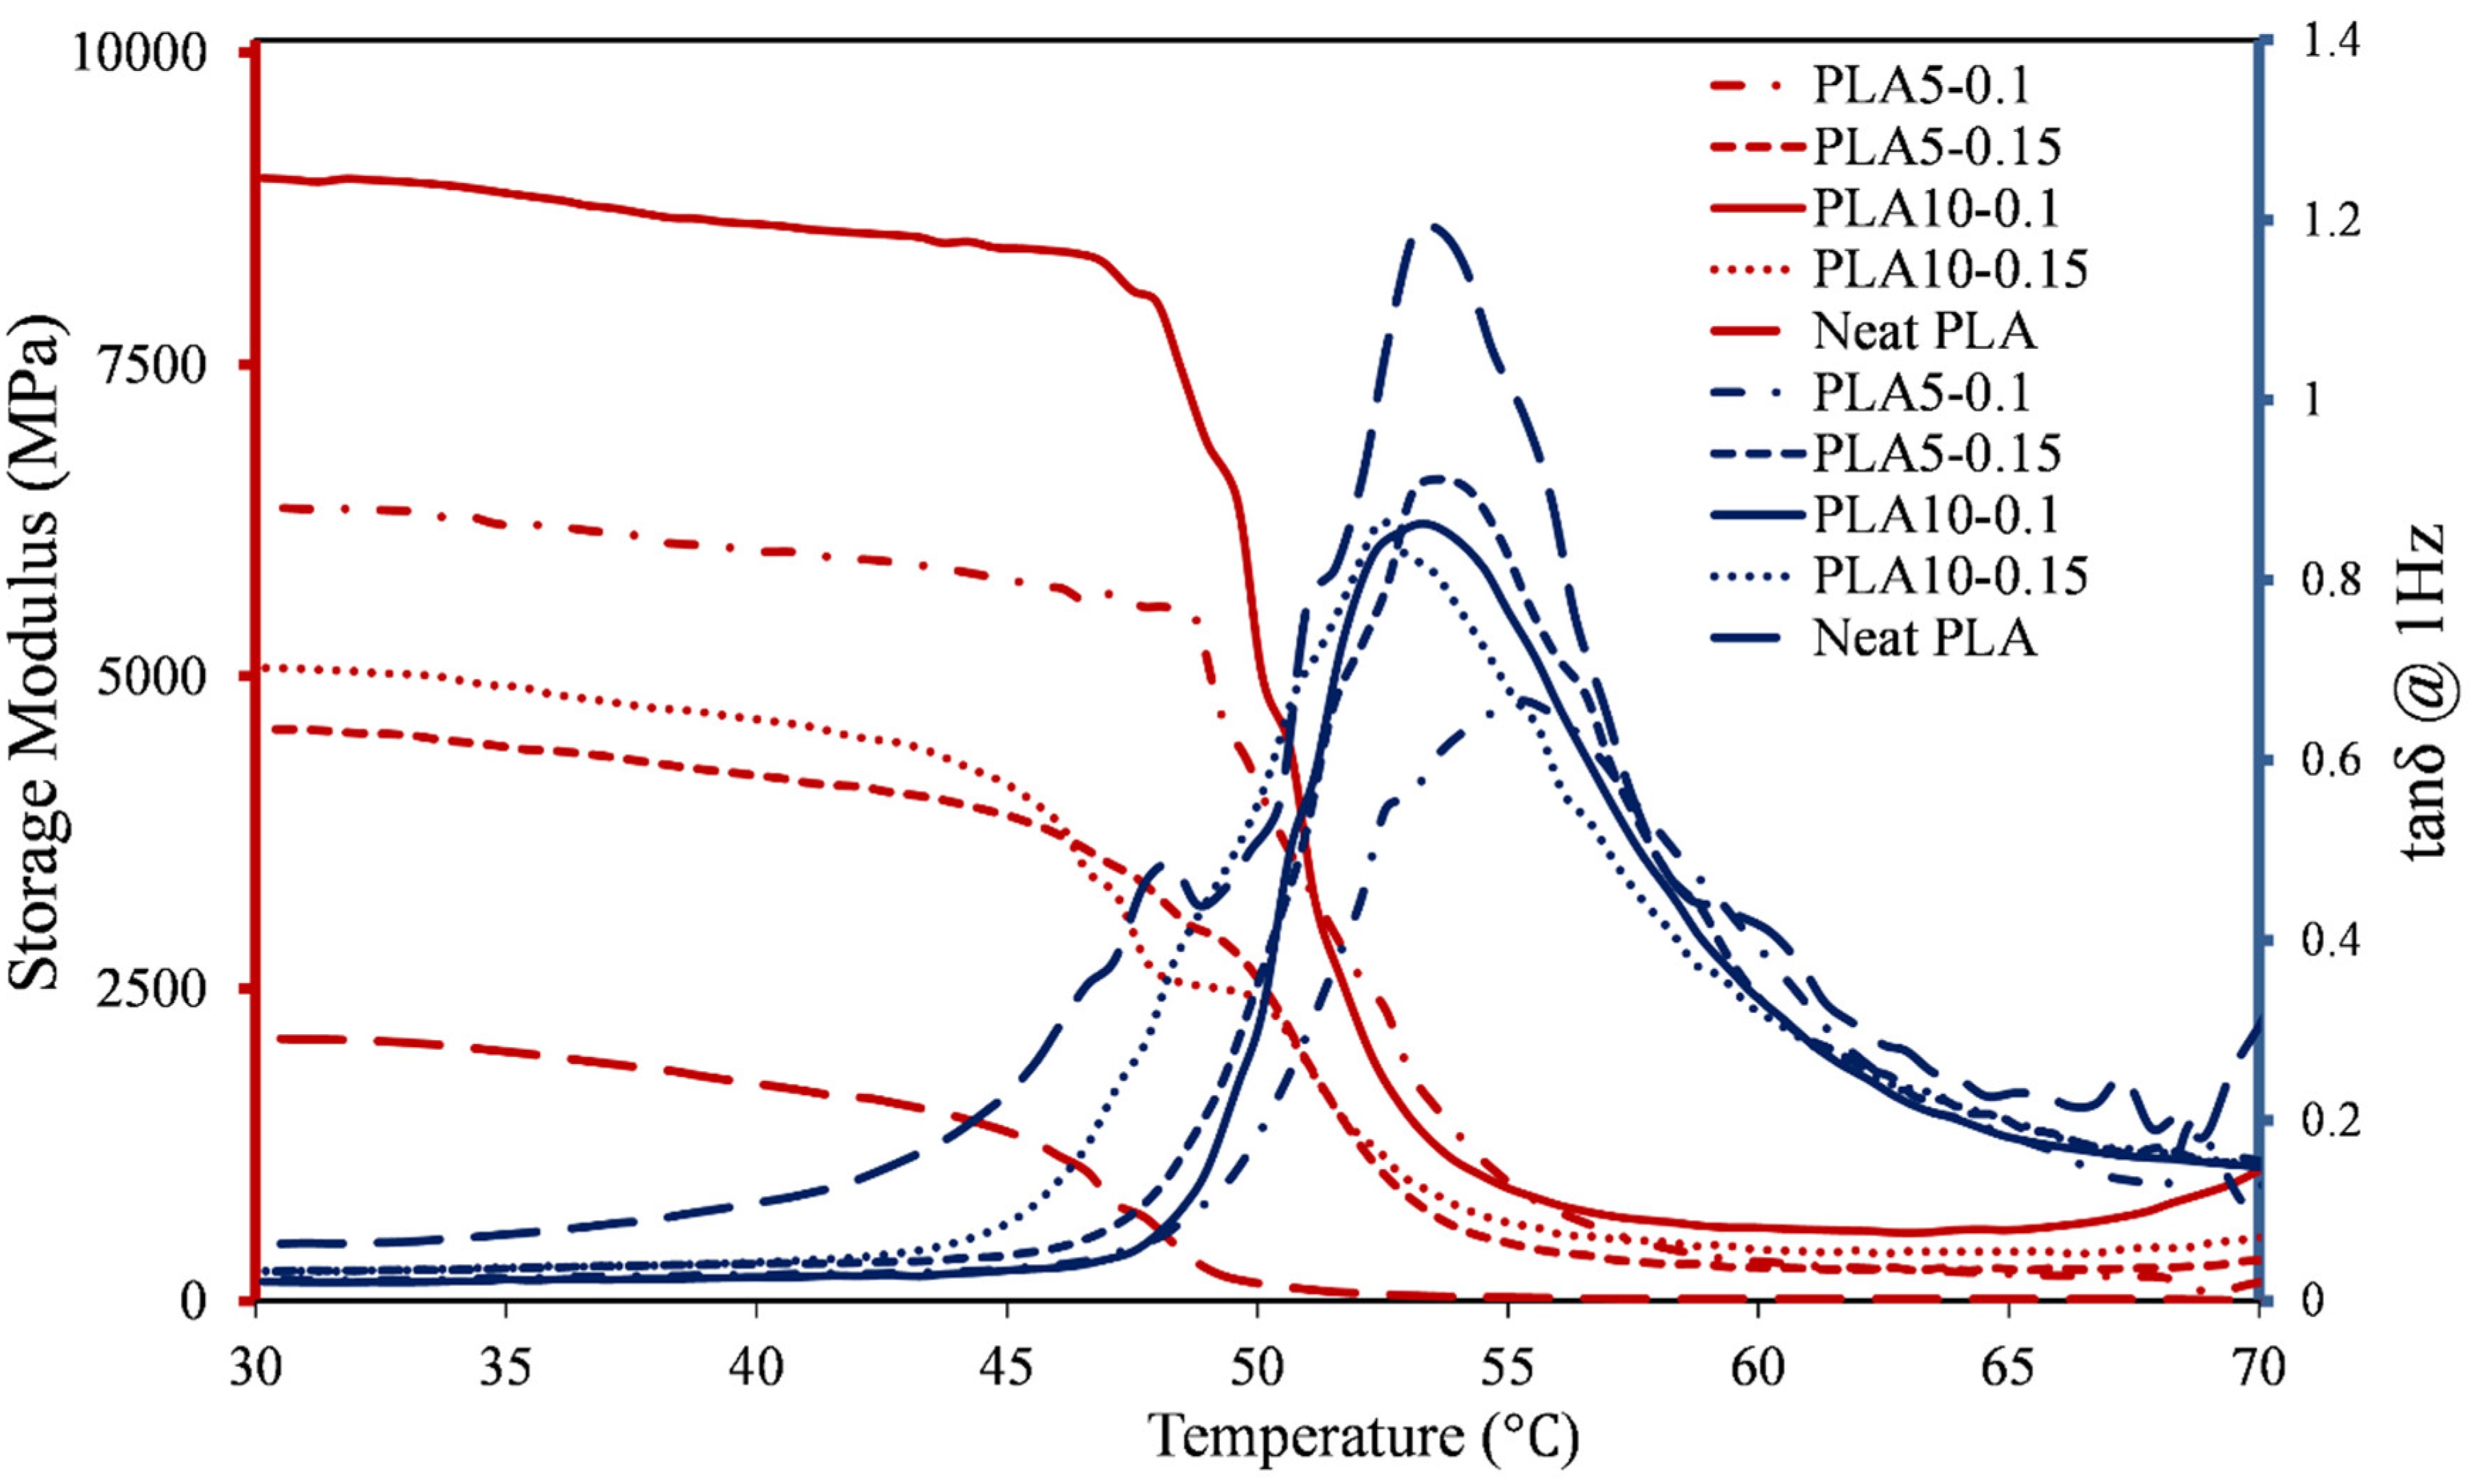
Figure 13.
SEM of the reinforced specimens with two different wire volume content.
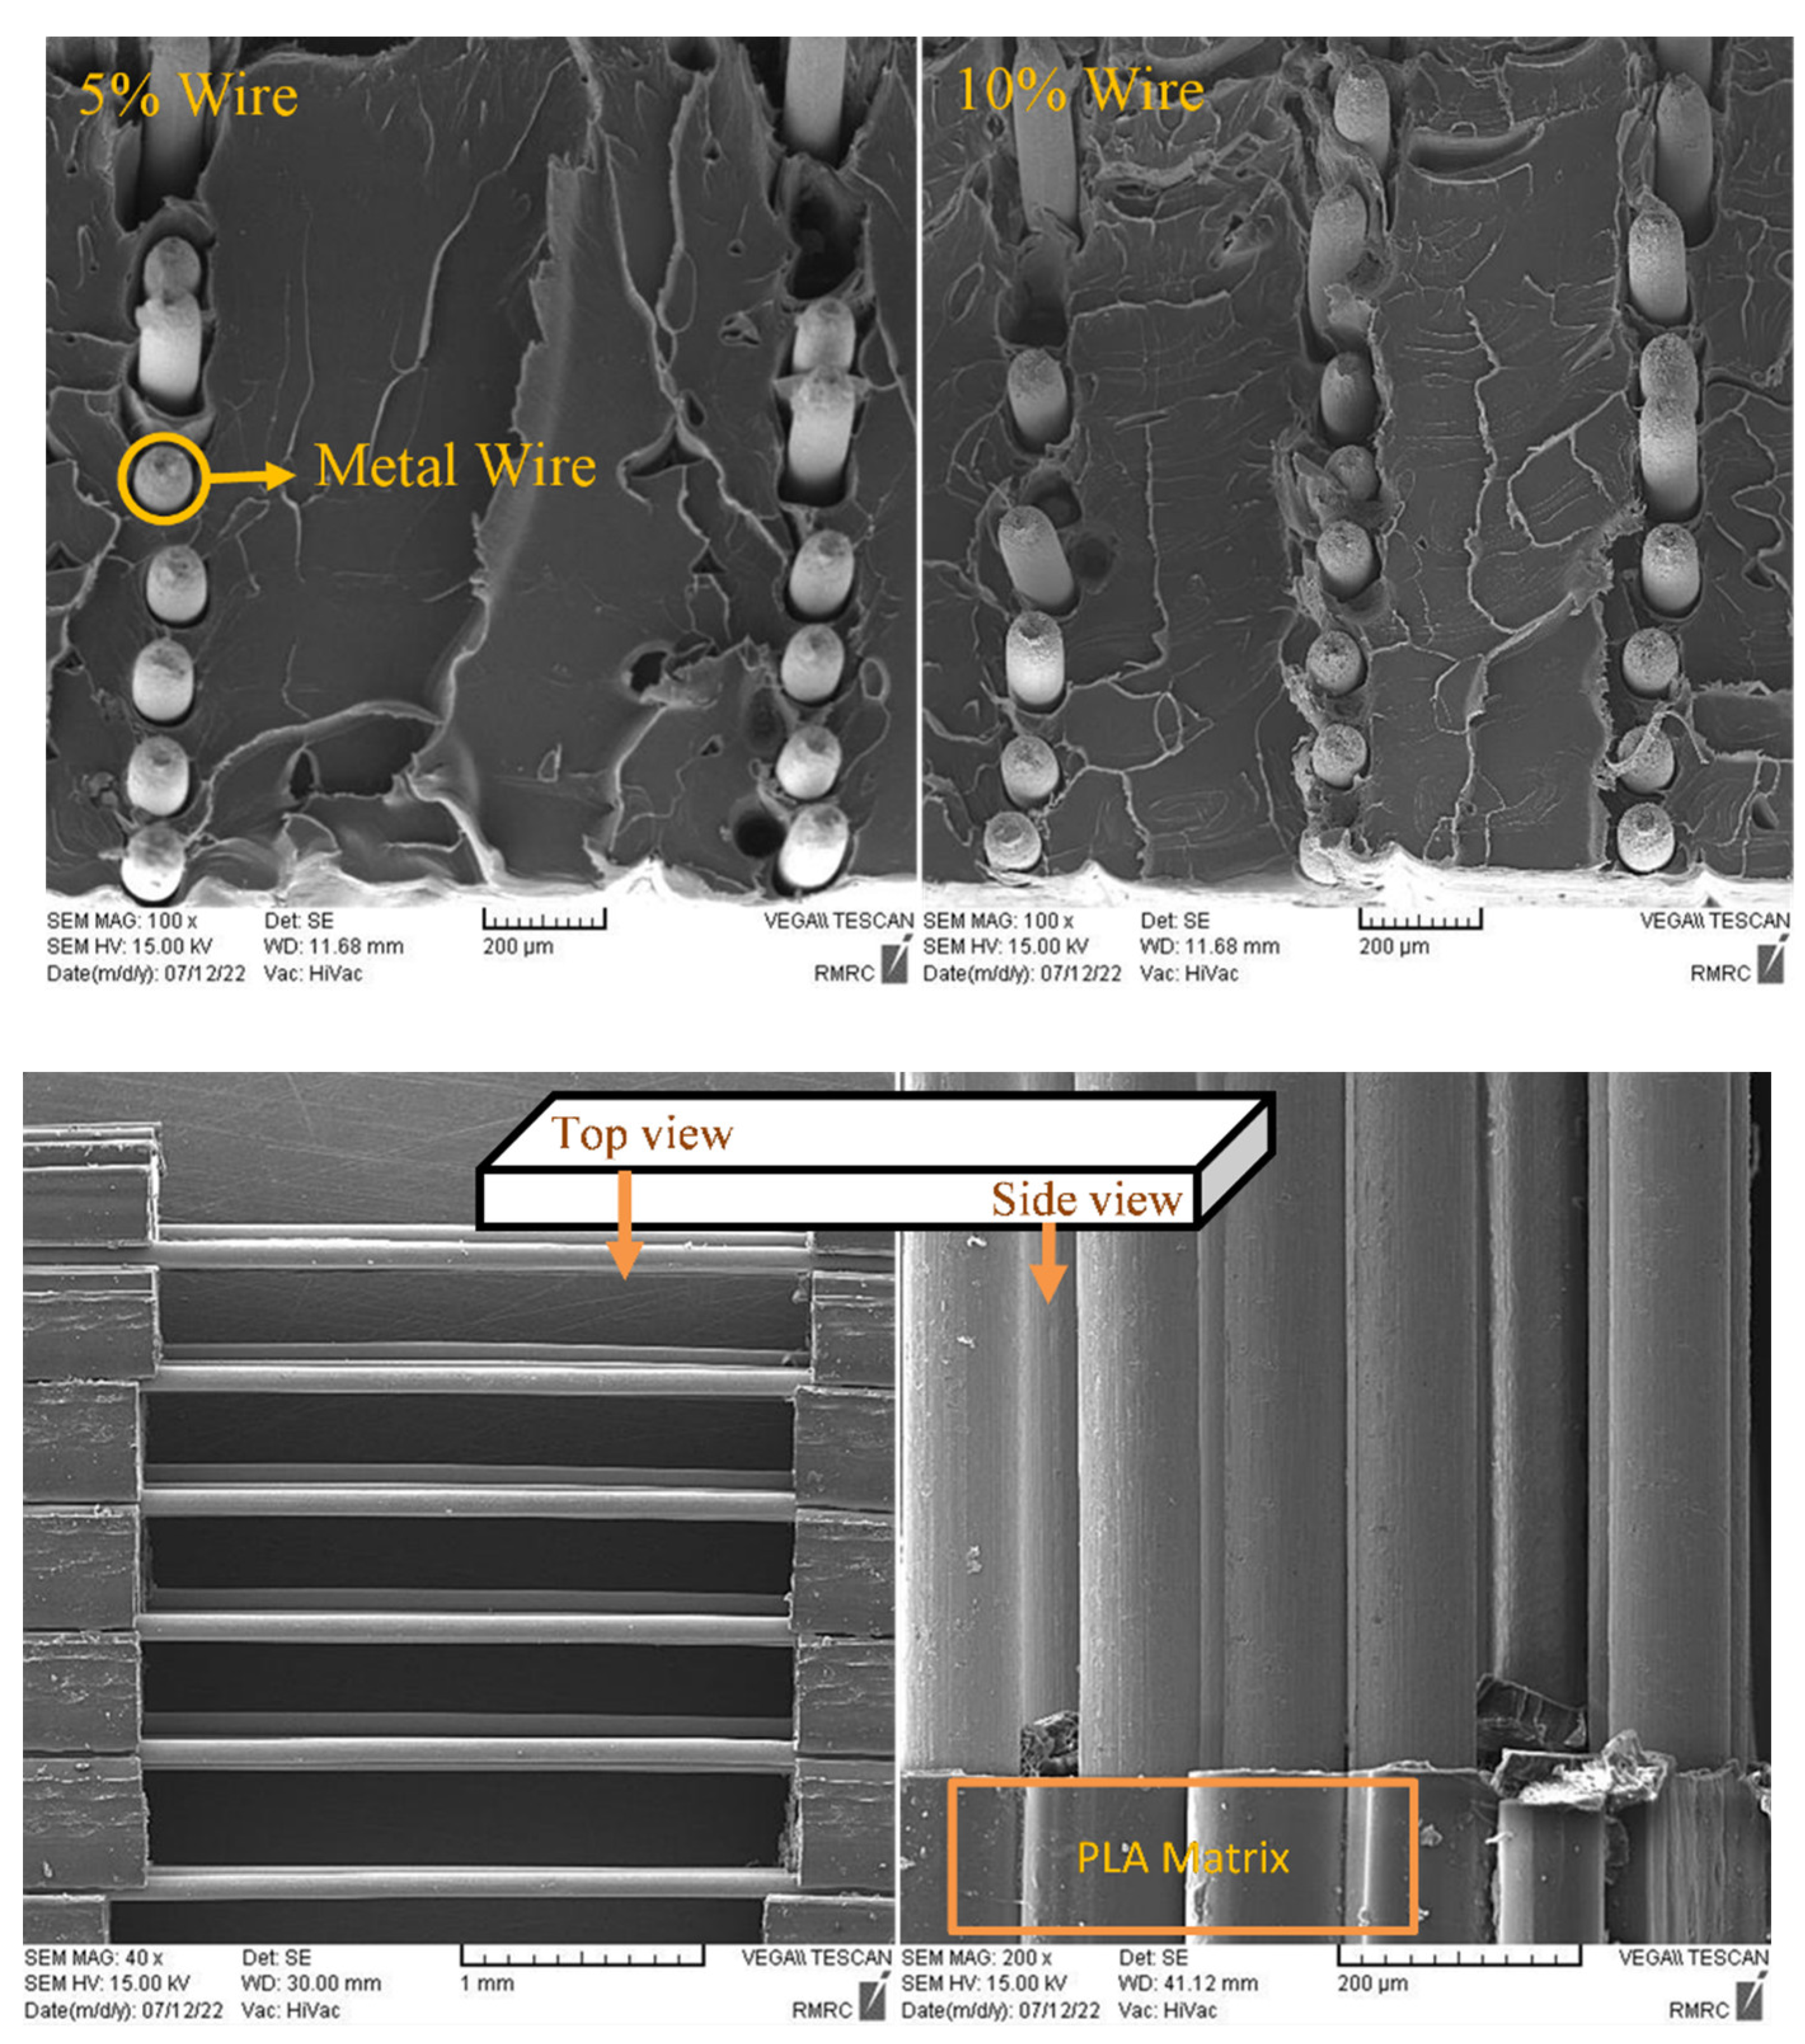
Figure 14.
Reinforced specimens with two different volume content and wire diameter a) 0.1 mm and b) 0.15 mm.
Figure 14.
Reinforced specimens with two different volume content and wire diameter a) 0.1 mm and b) 0.15 mm.
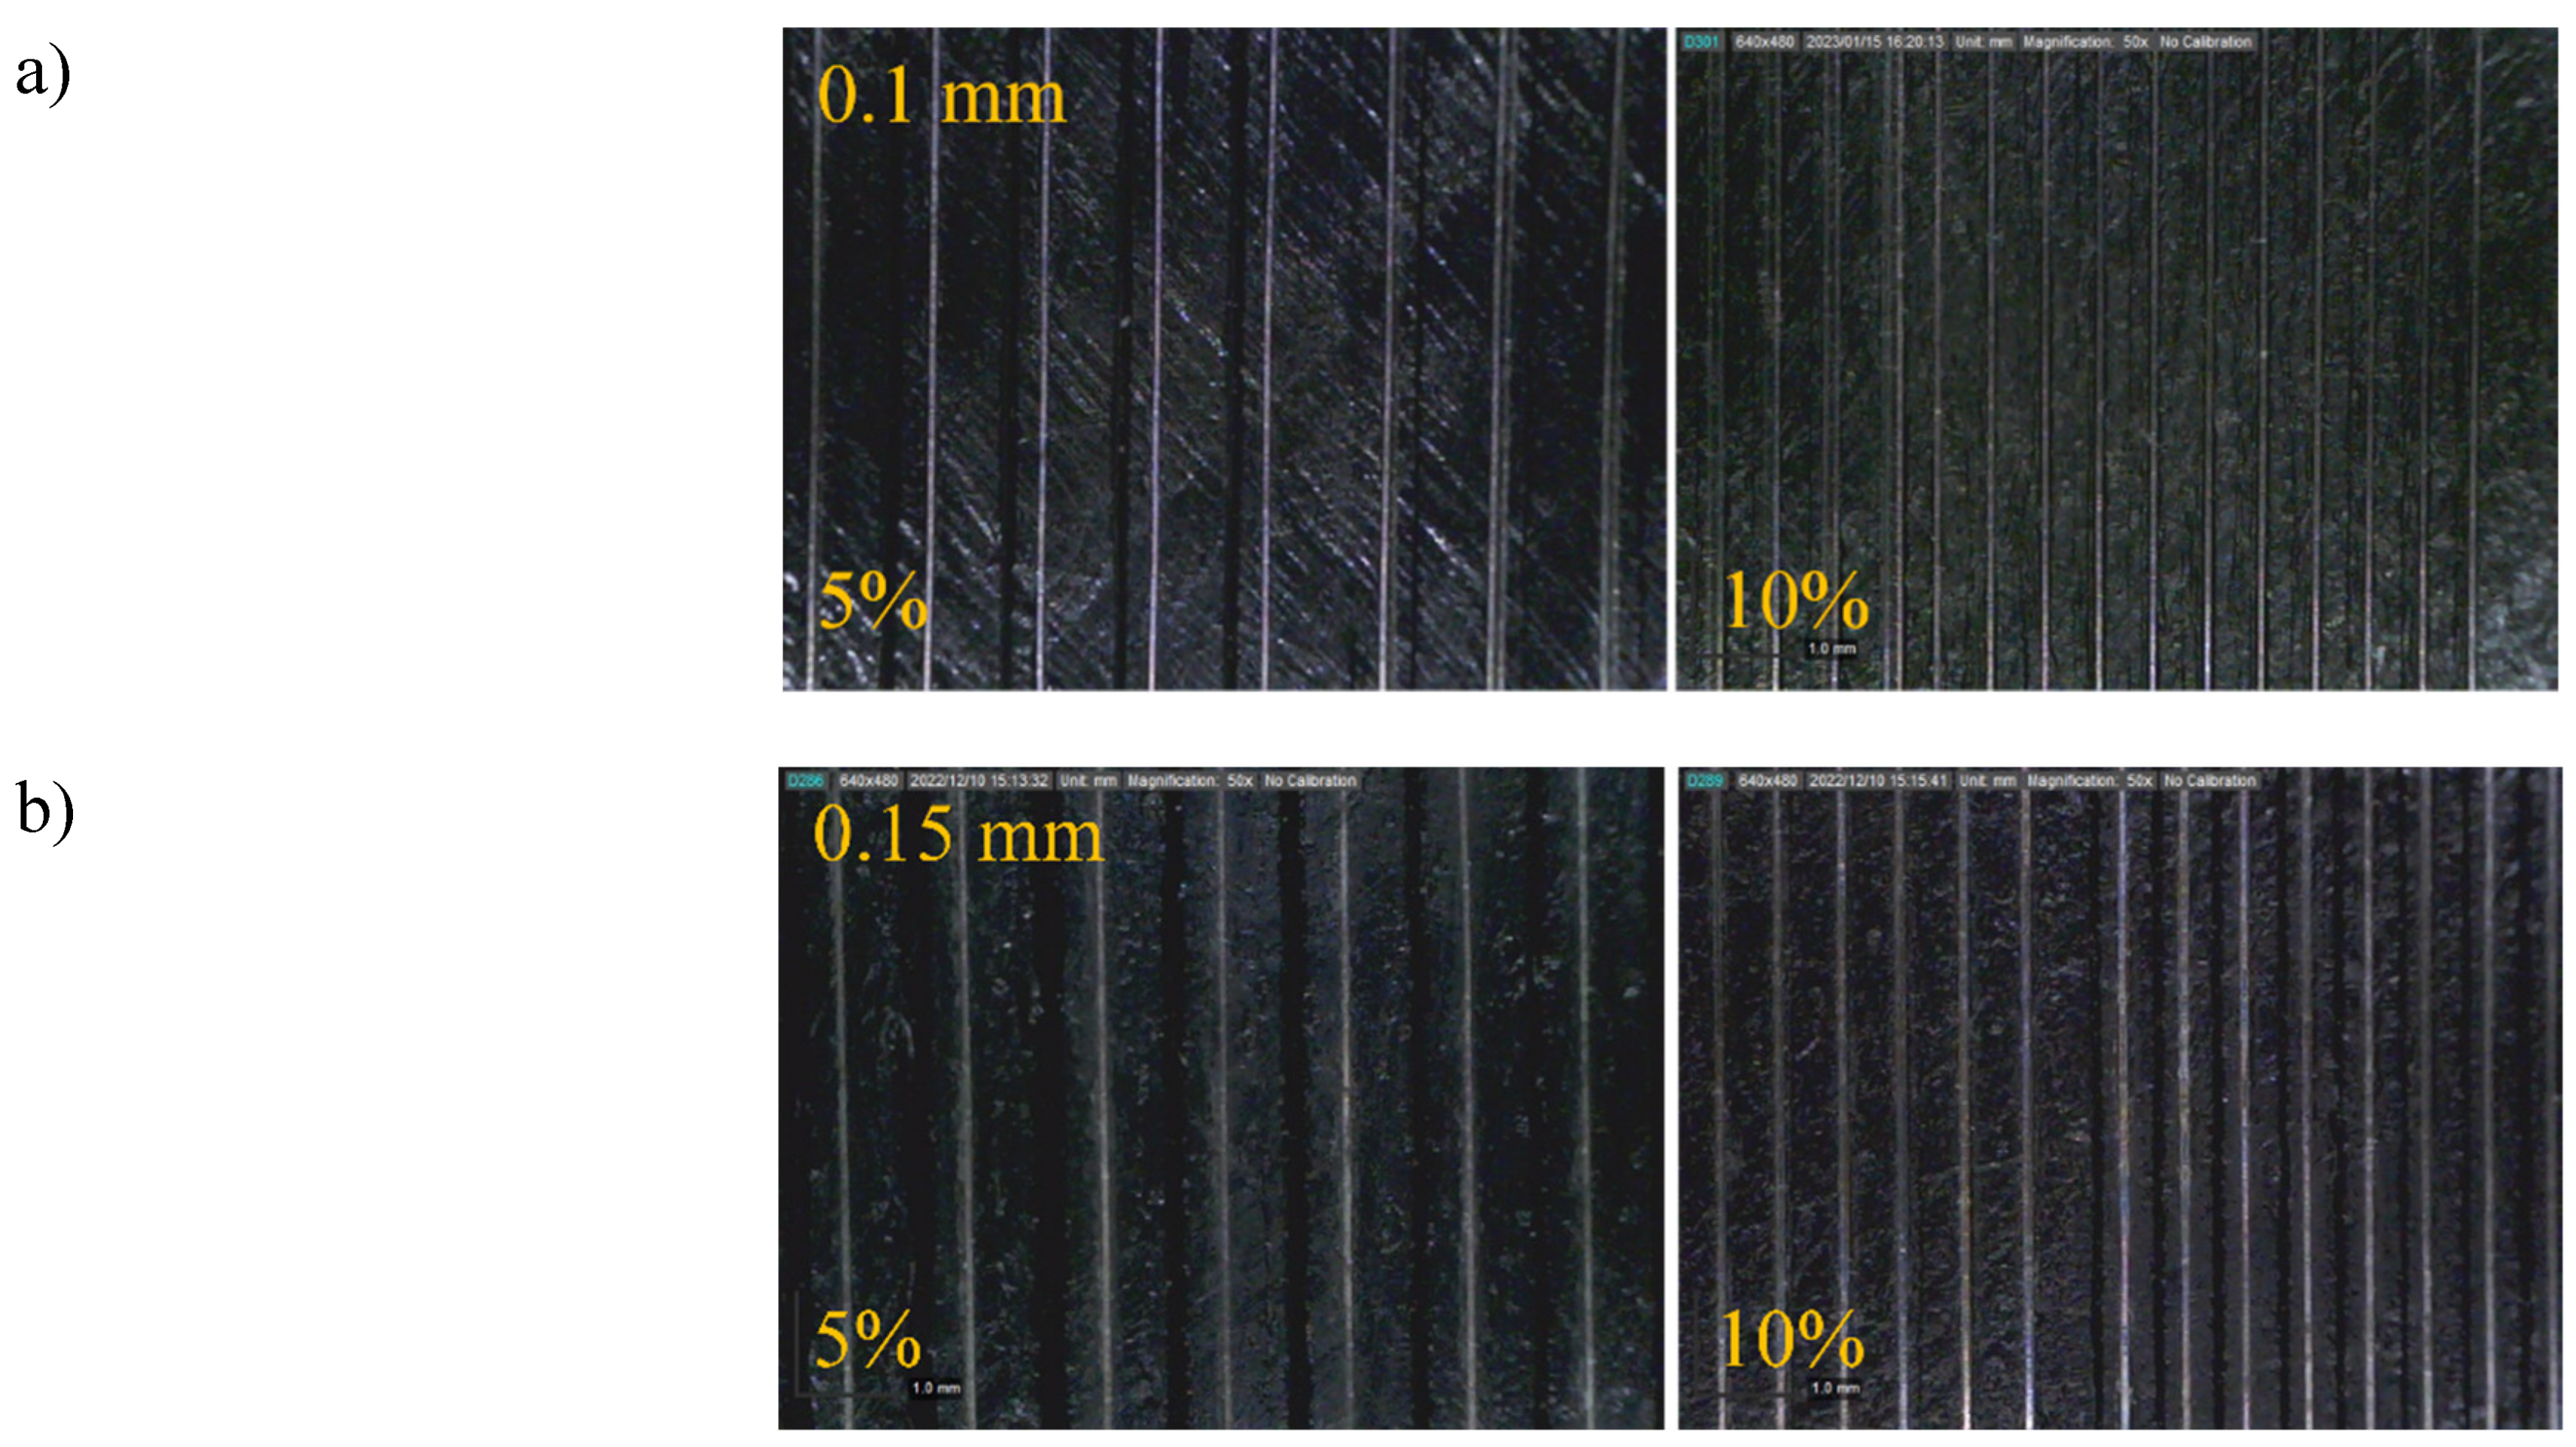
Figure 15.
Time-temperature diagram of the reinforced specimens with different voltages a) 0.1 mm and b) 0.15 mm.
Figure 15.
Time-temperature diagram of the reinforced specimens with different voltages a) 0.1 mm and b) 0.15 mm.
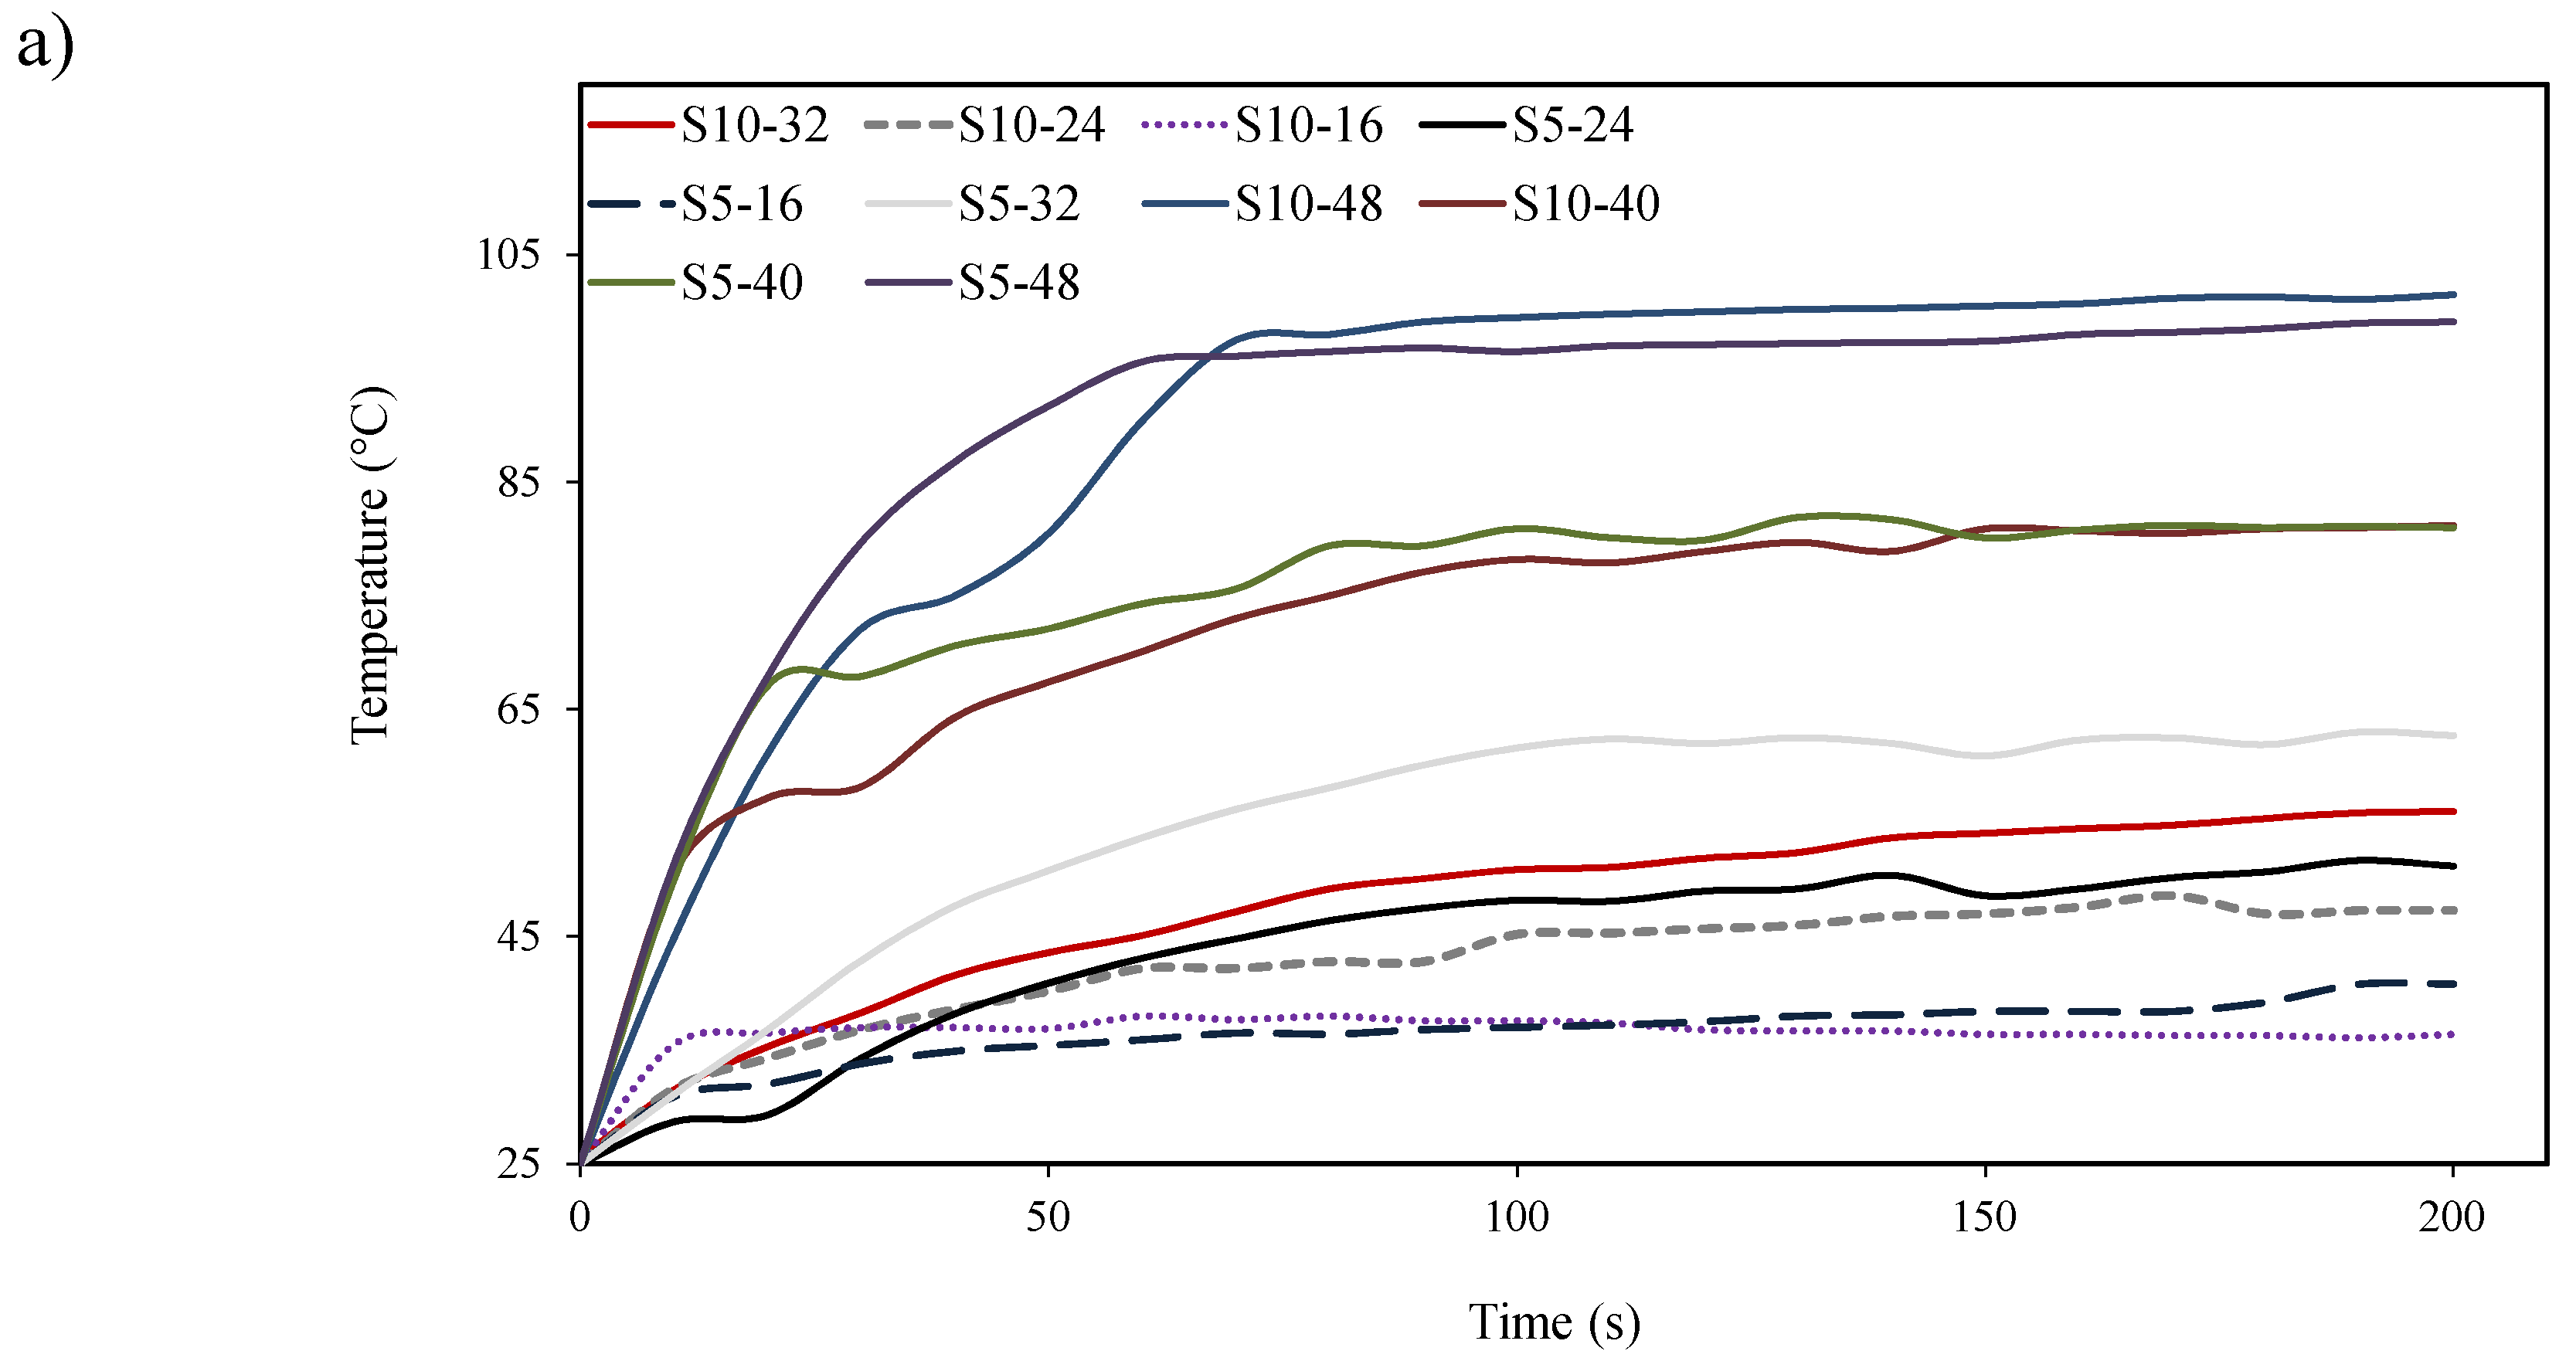
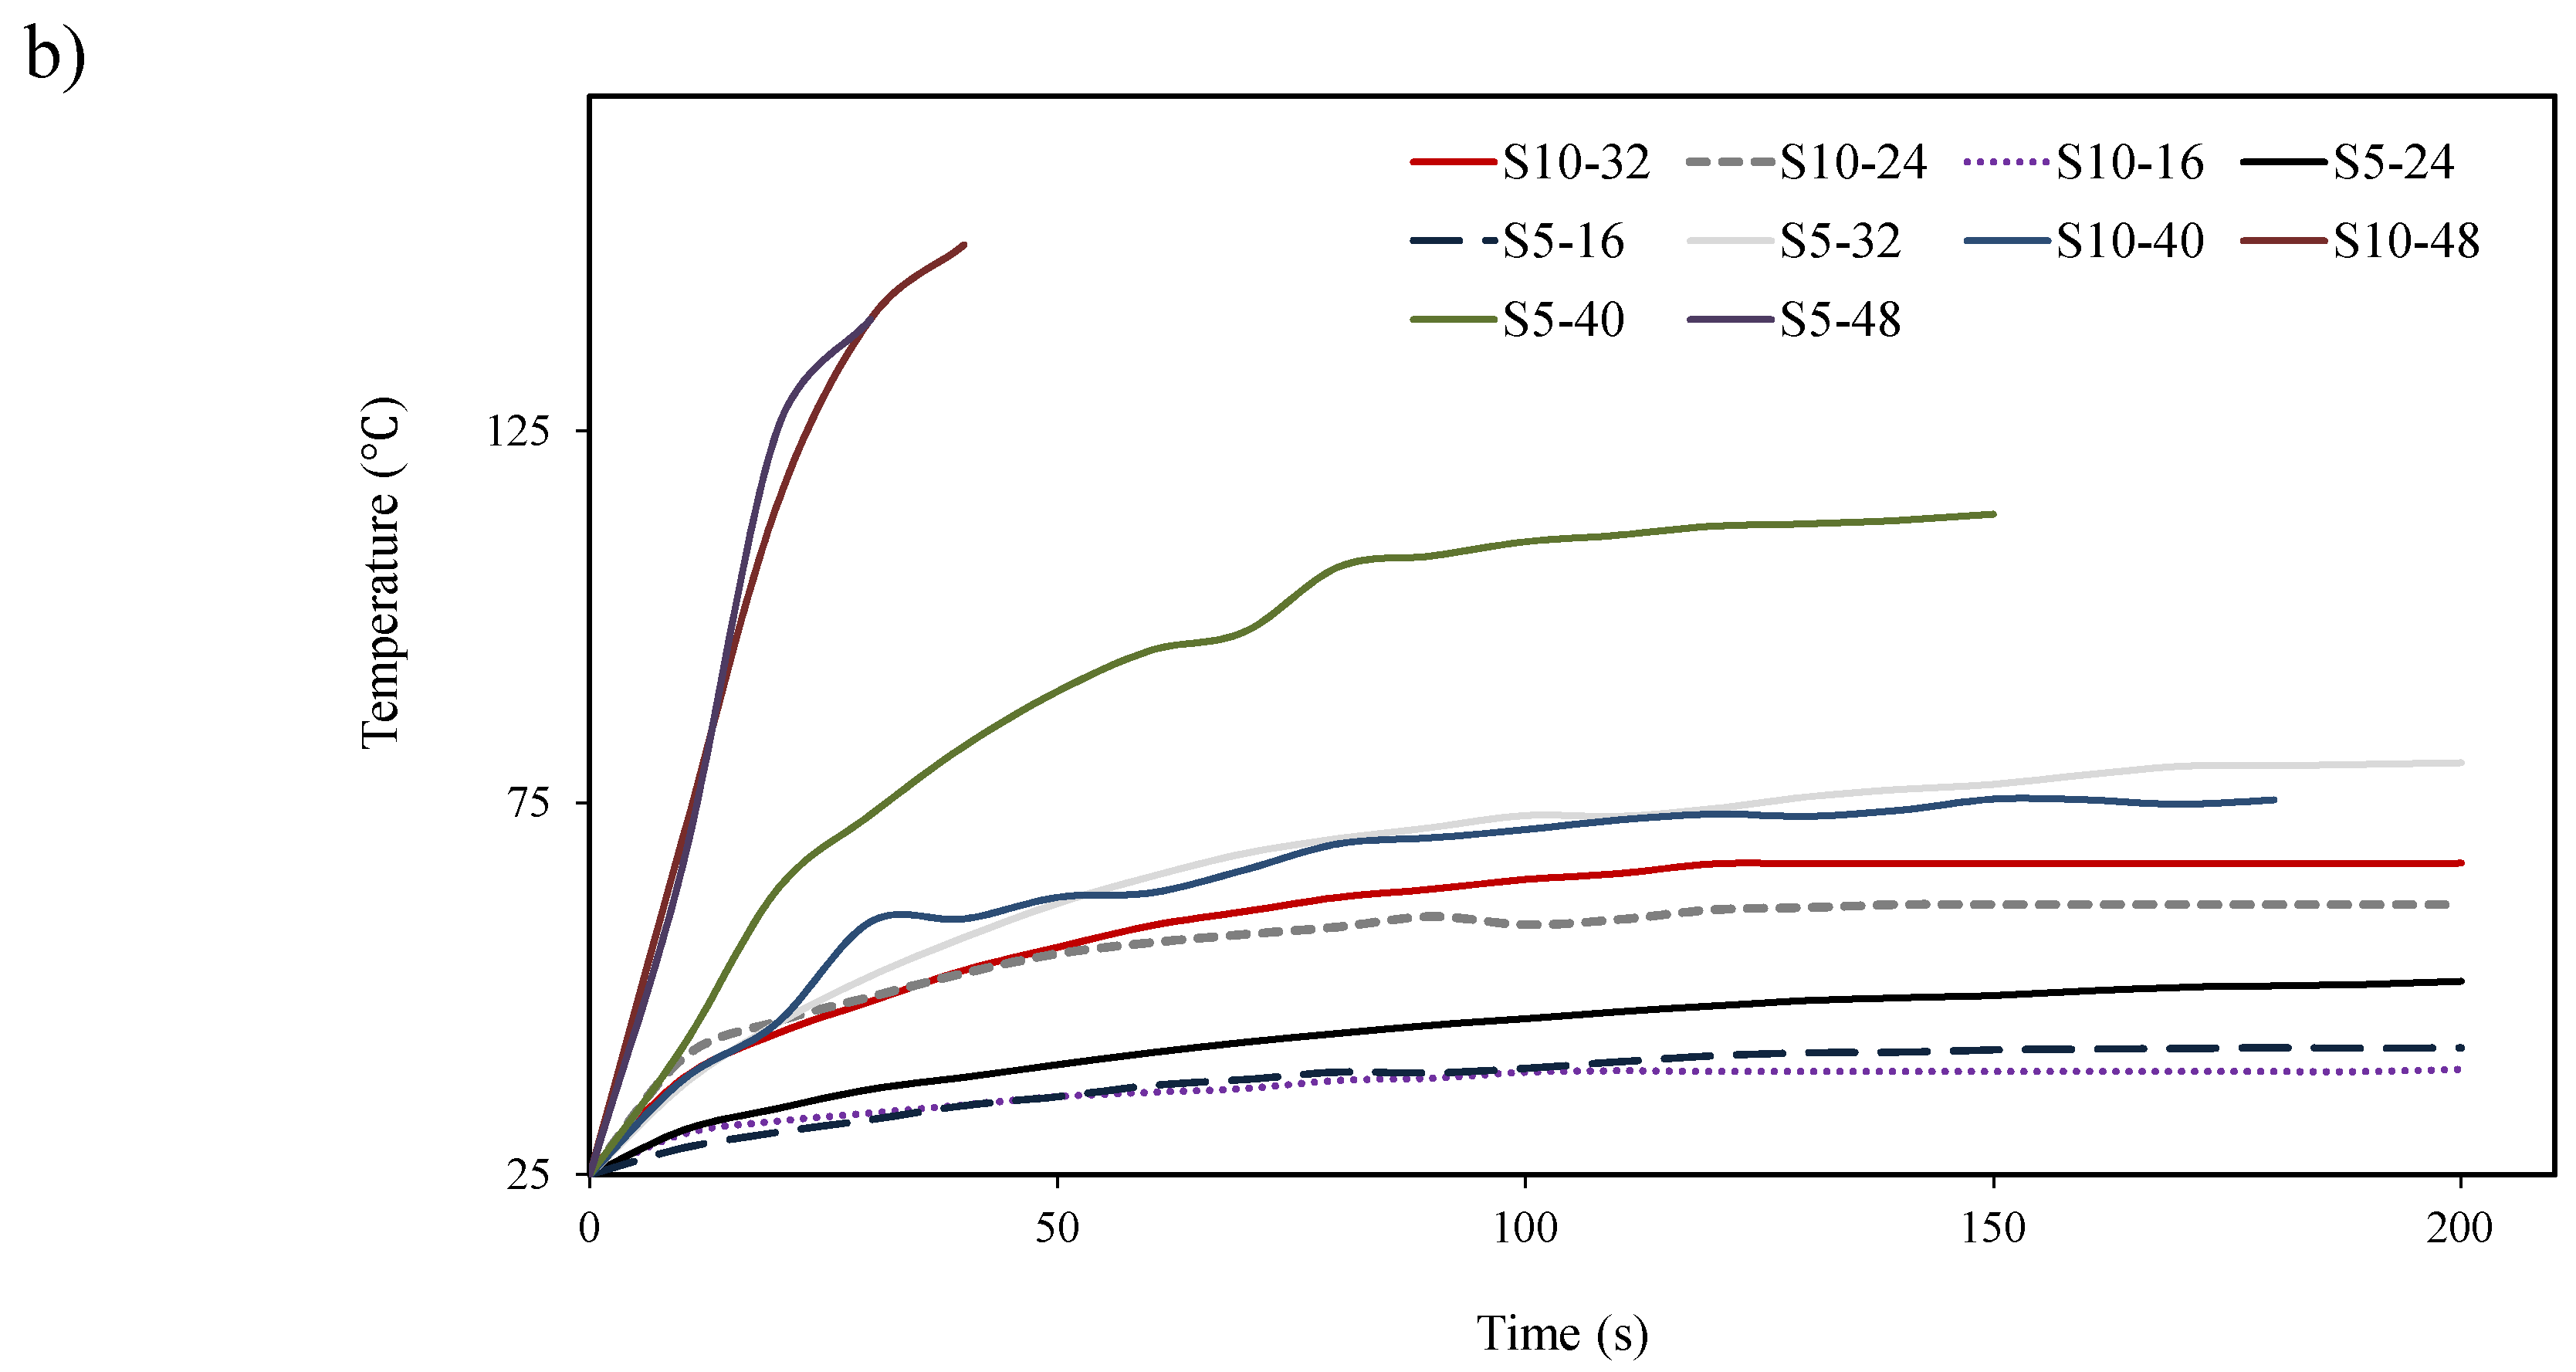
Figure 16.
Thermography of the reinforced specimens with 0.1 mm wire and volume content of a) 5 vol.% and b) 10 vol.%.
Figure 16.
Thermography of the reinforced specimens with 0.1 mm wire and volume content of a) 5 vol.% and b) 10 vol.%.
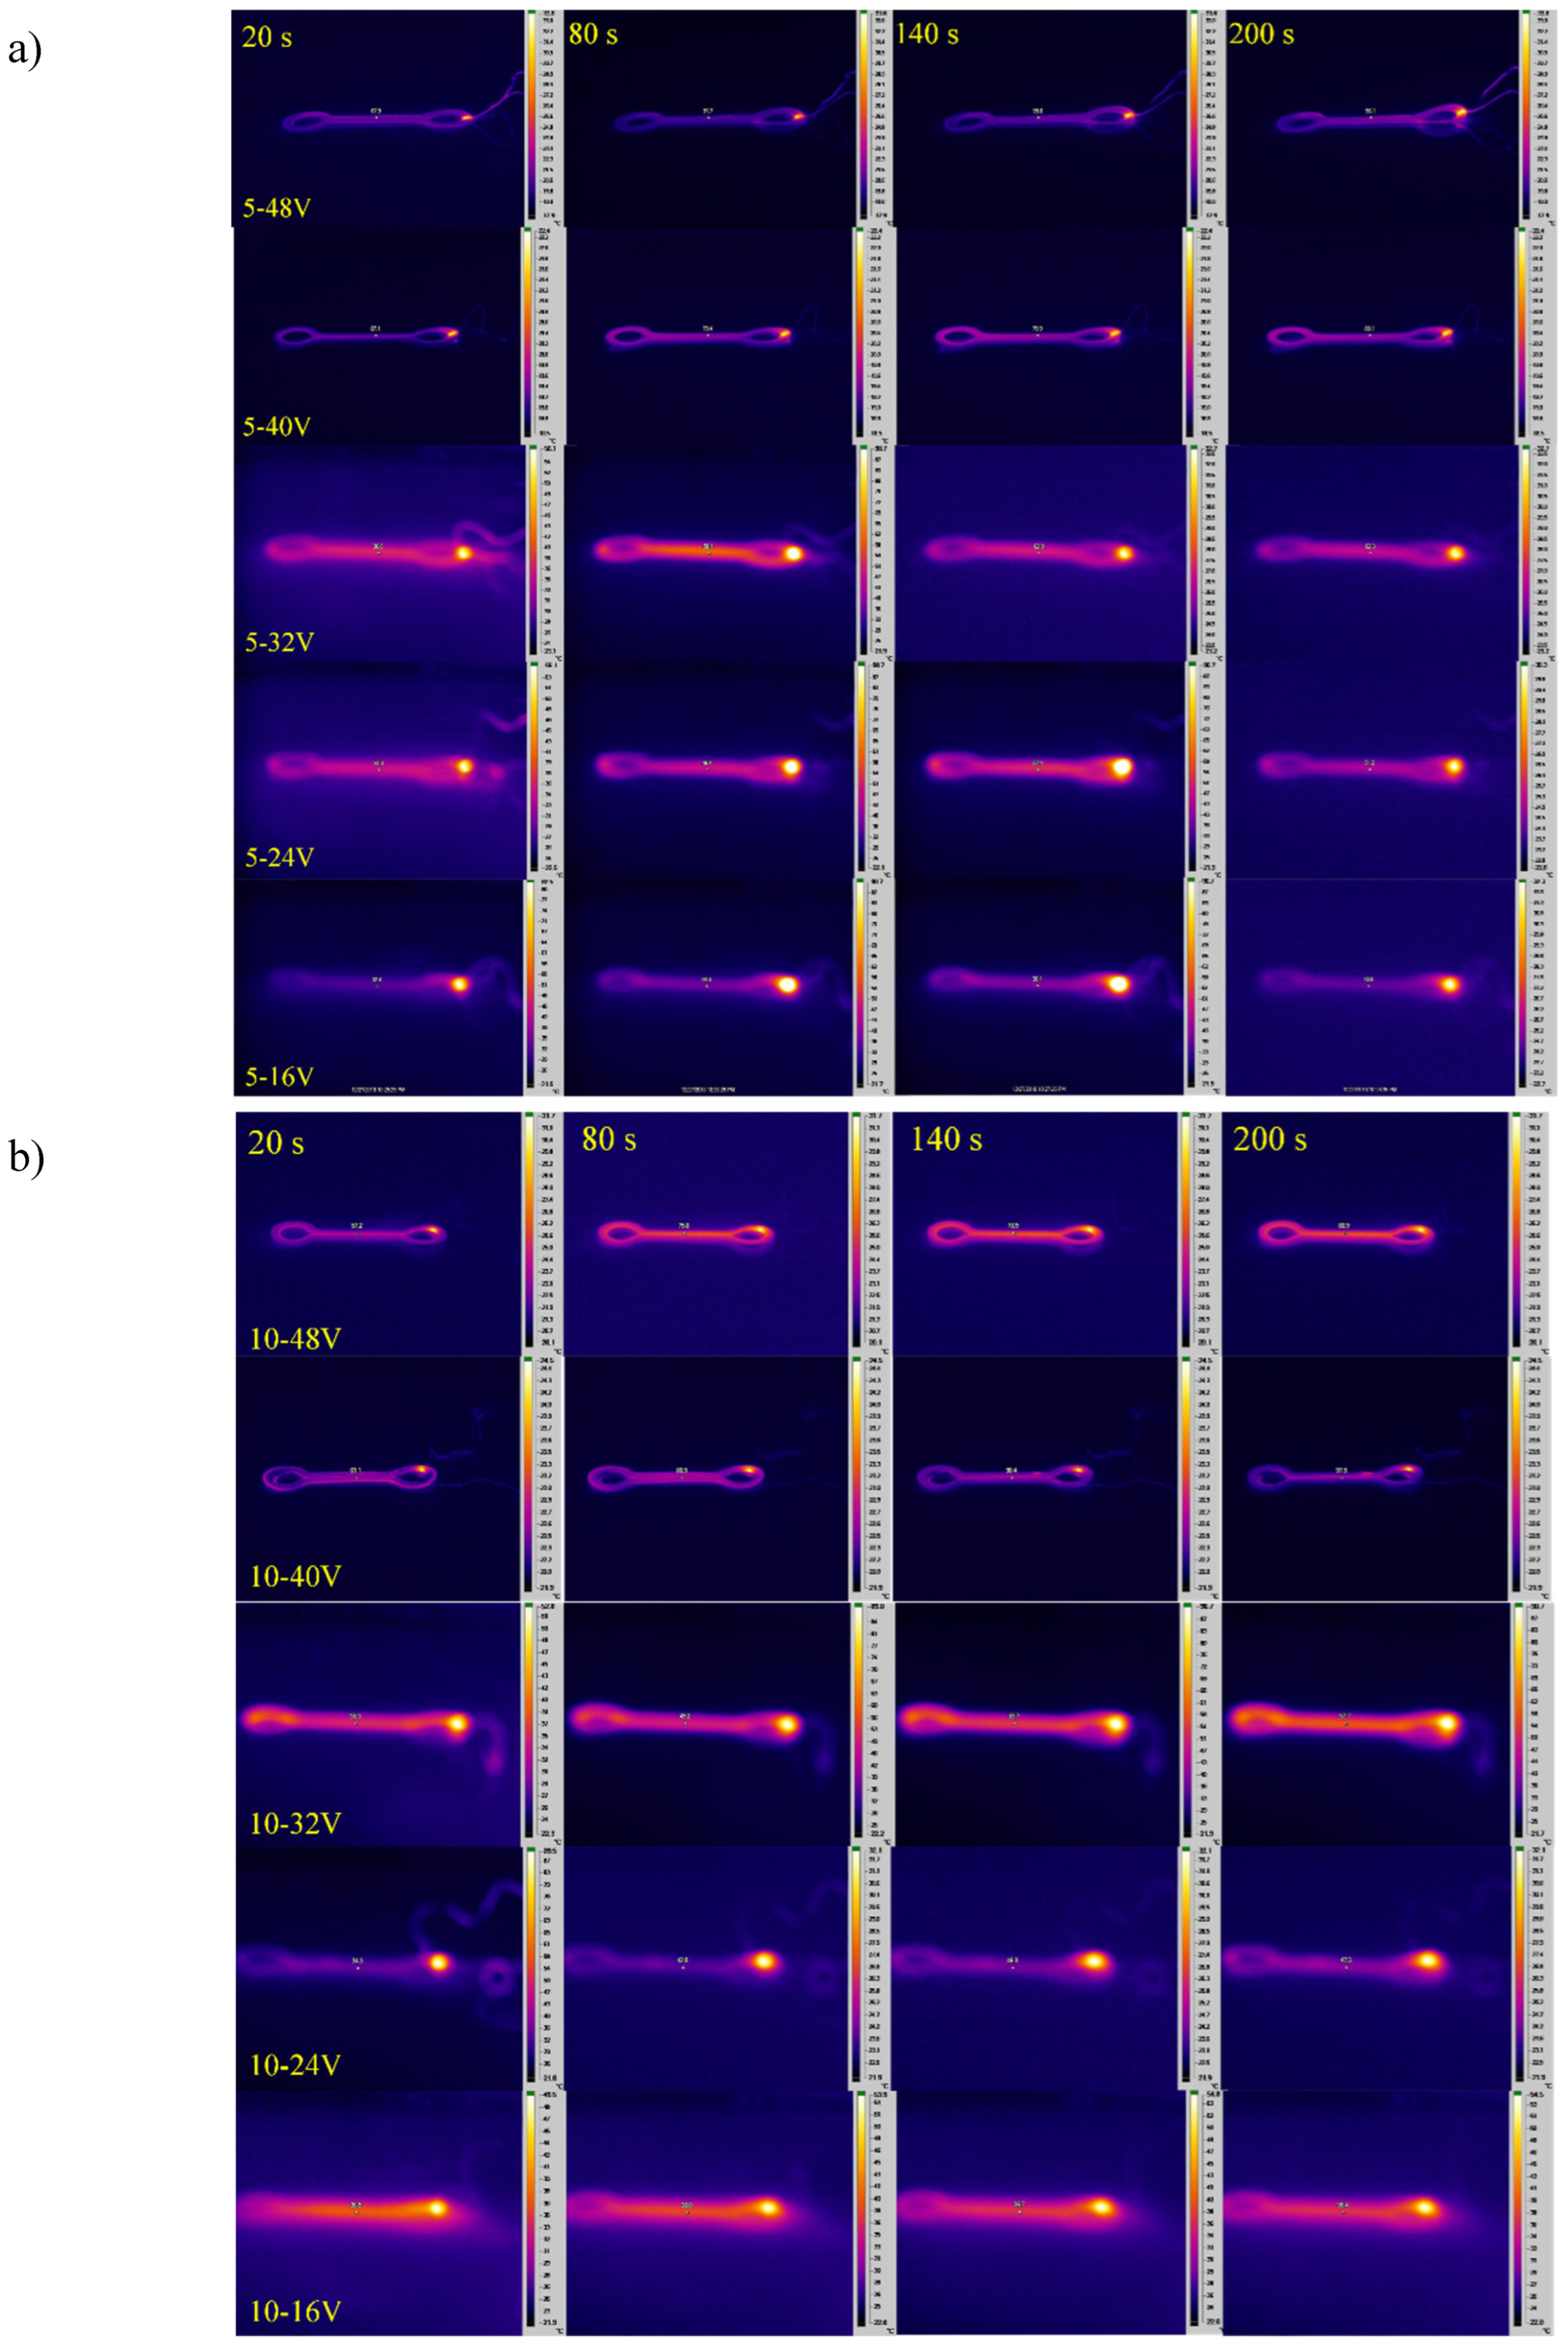
Figure 17.
Thermography of the reinforced specimens with 0.15 mm wire and volume content of a) 5 vol.% and b) 10 vol.%.
Figure 17.
Thermography of the reinforced specimens with 0.15 mm wire and volume content of a) 5 vol.% and b) 10 vol.%.
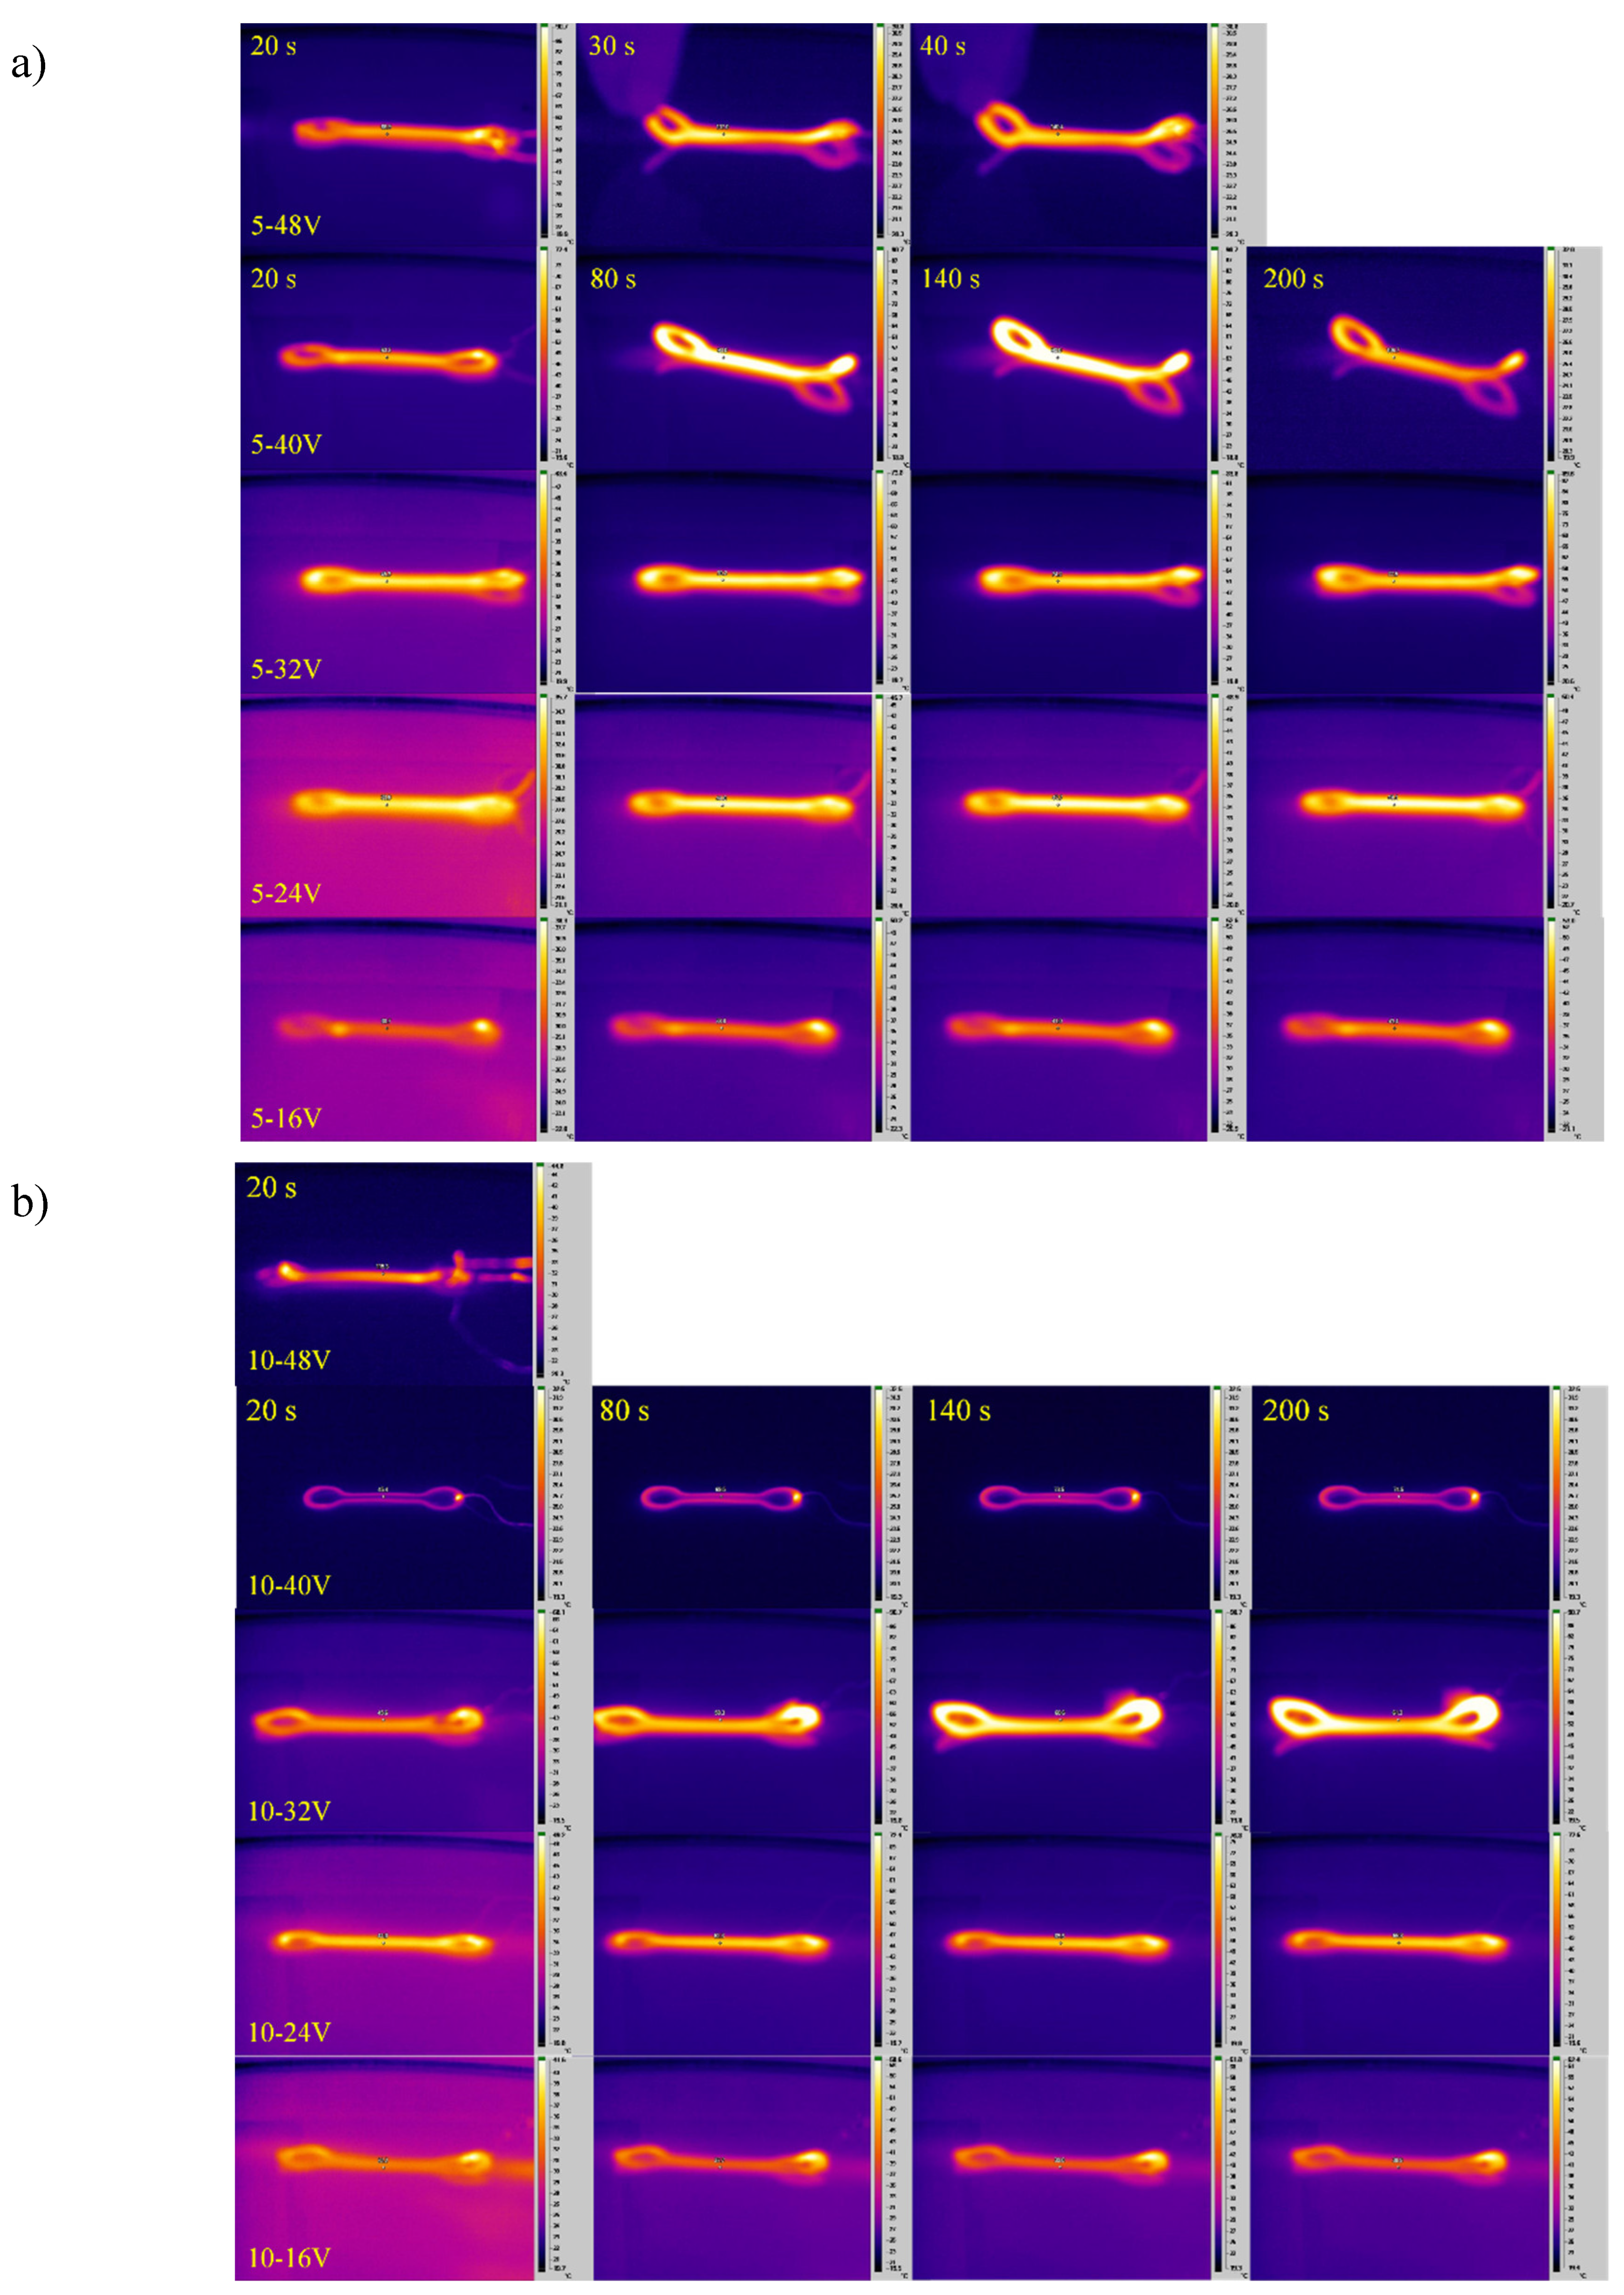
Figure 18.
Shape recovery of the specimens reinforced with 0.1 mm wire applied to the 40 volts.
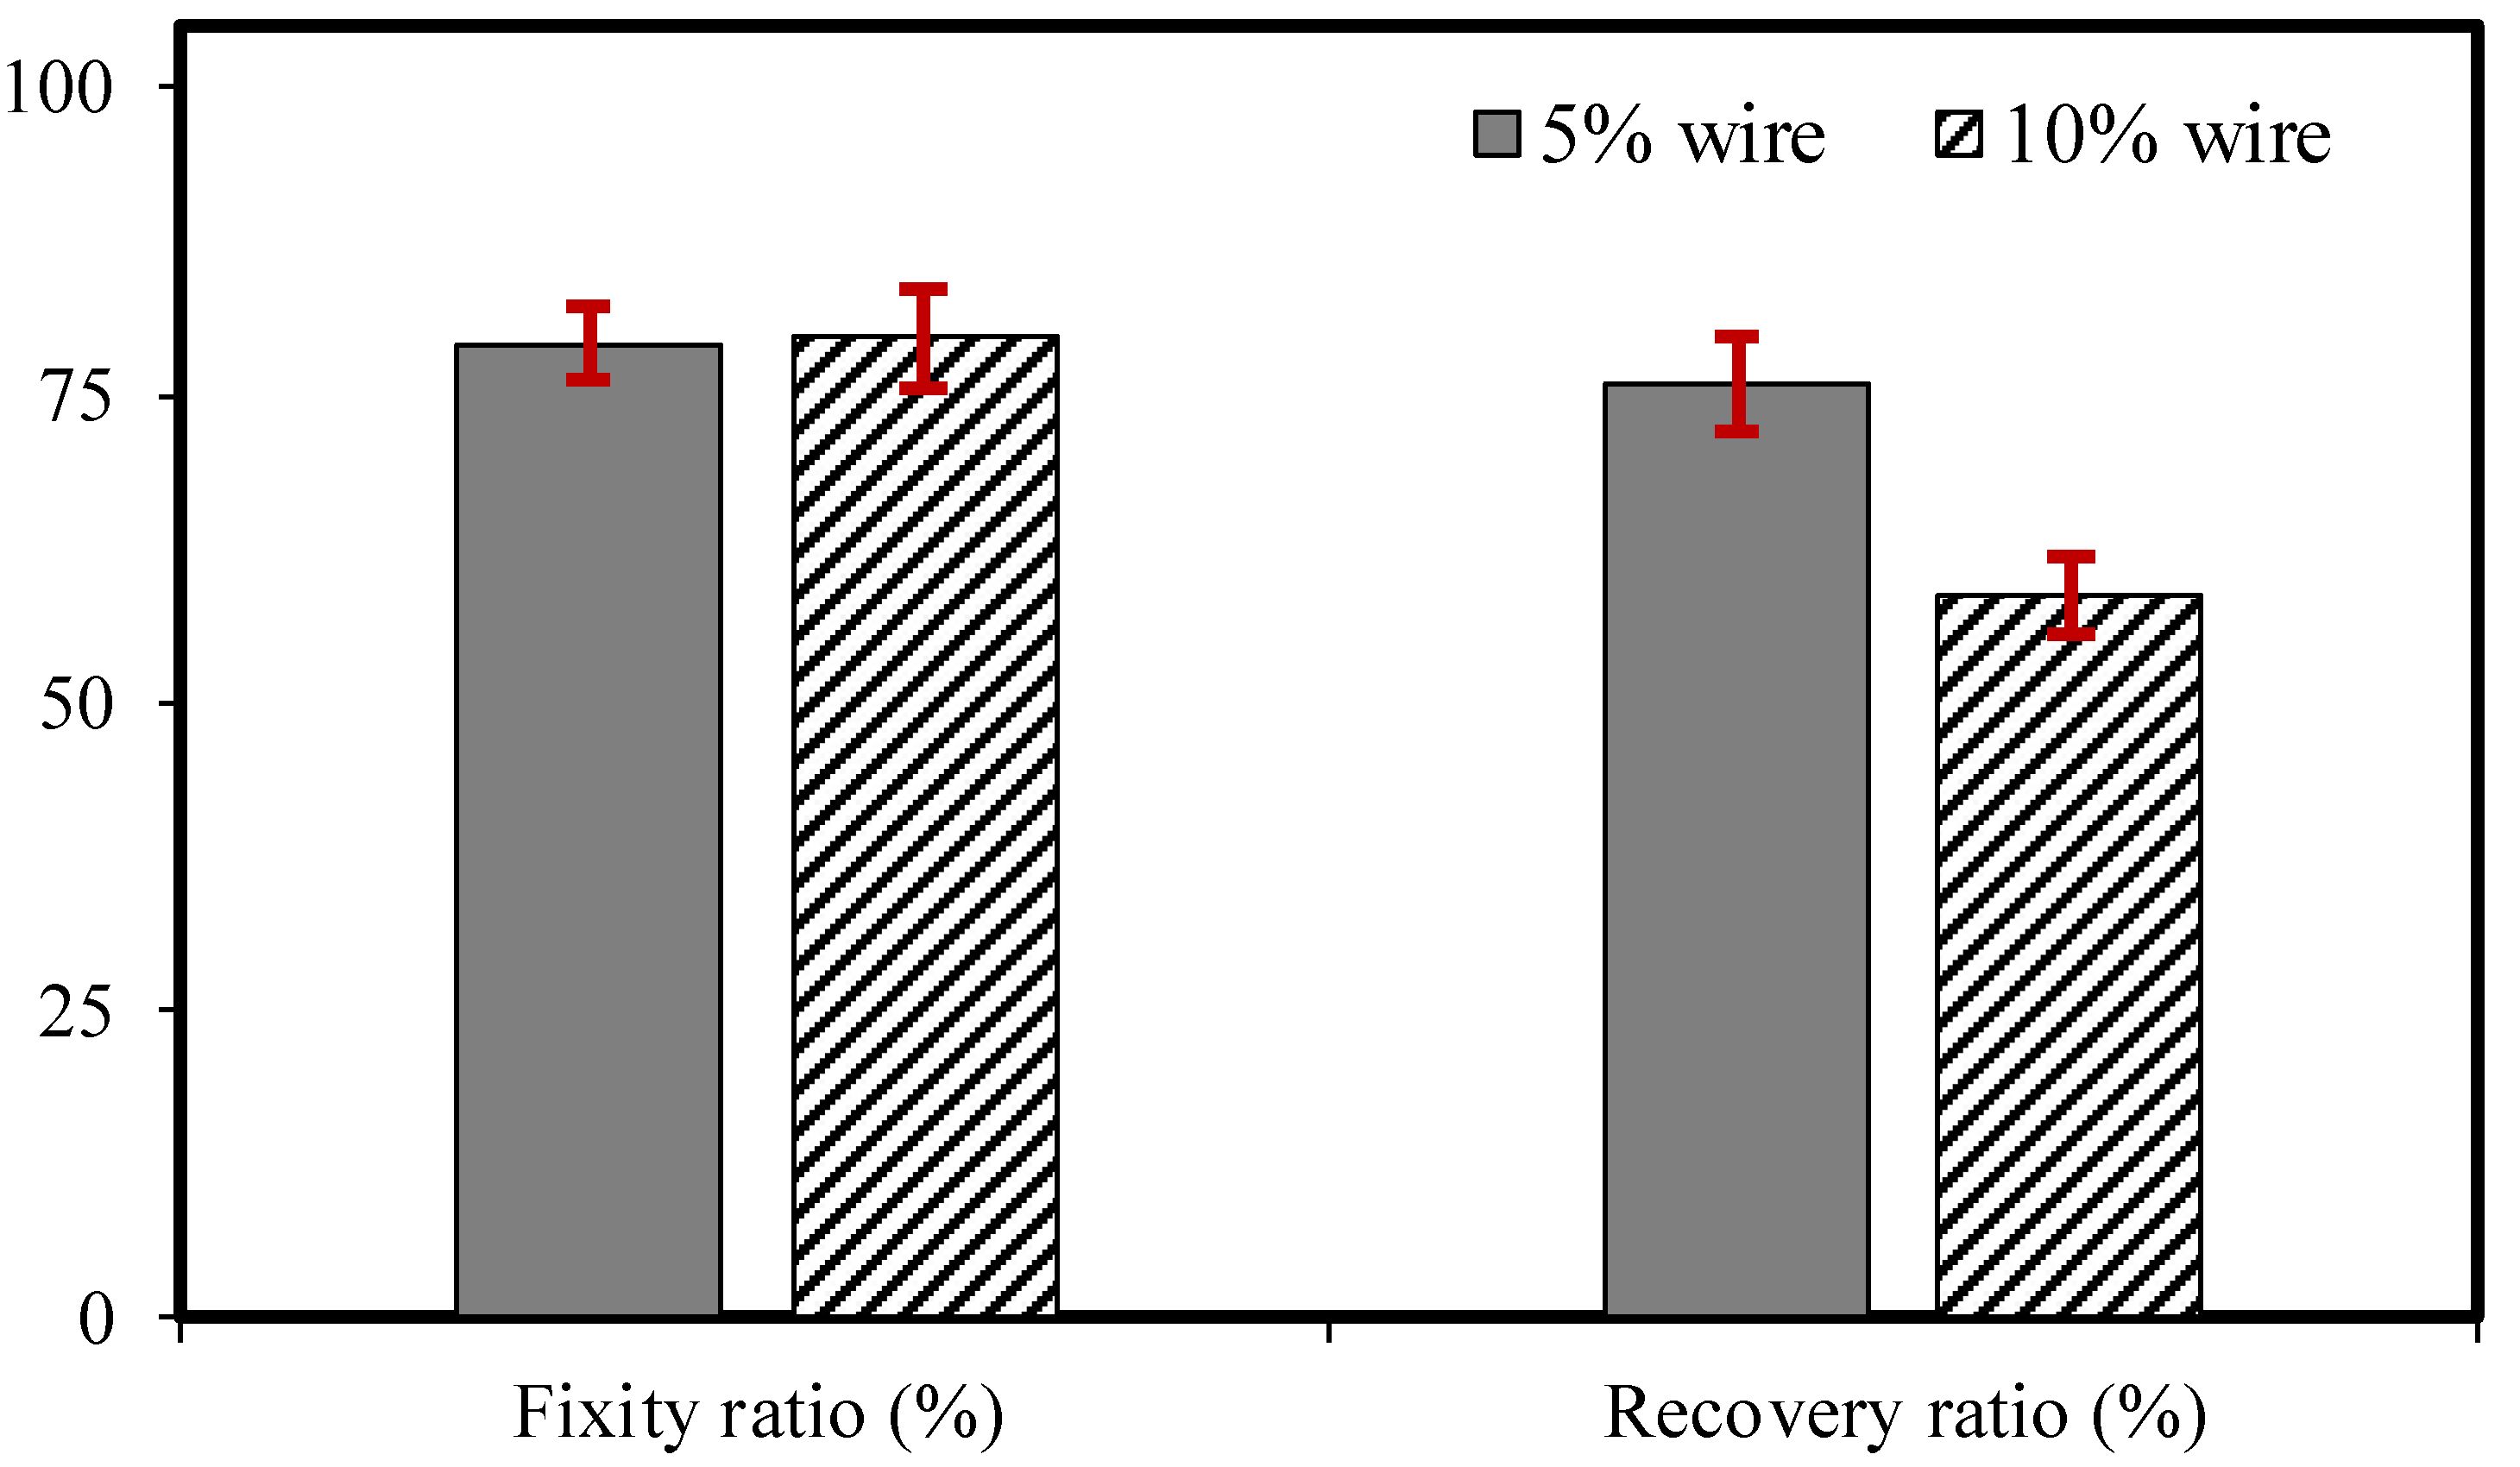
Figure 19.
Shape recovery of the optimized sample with three middle layer of wire.
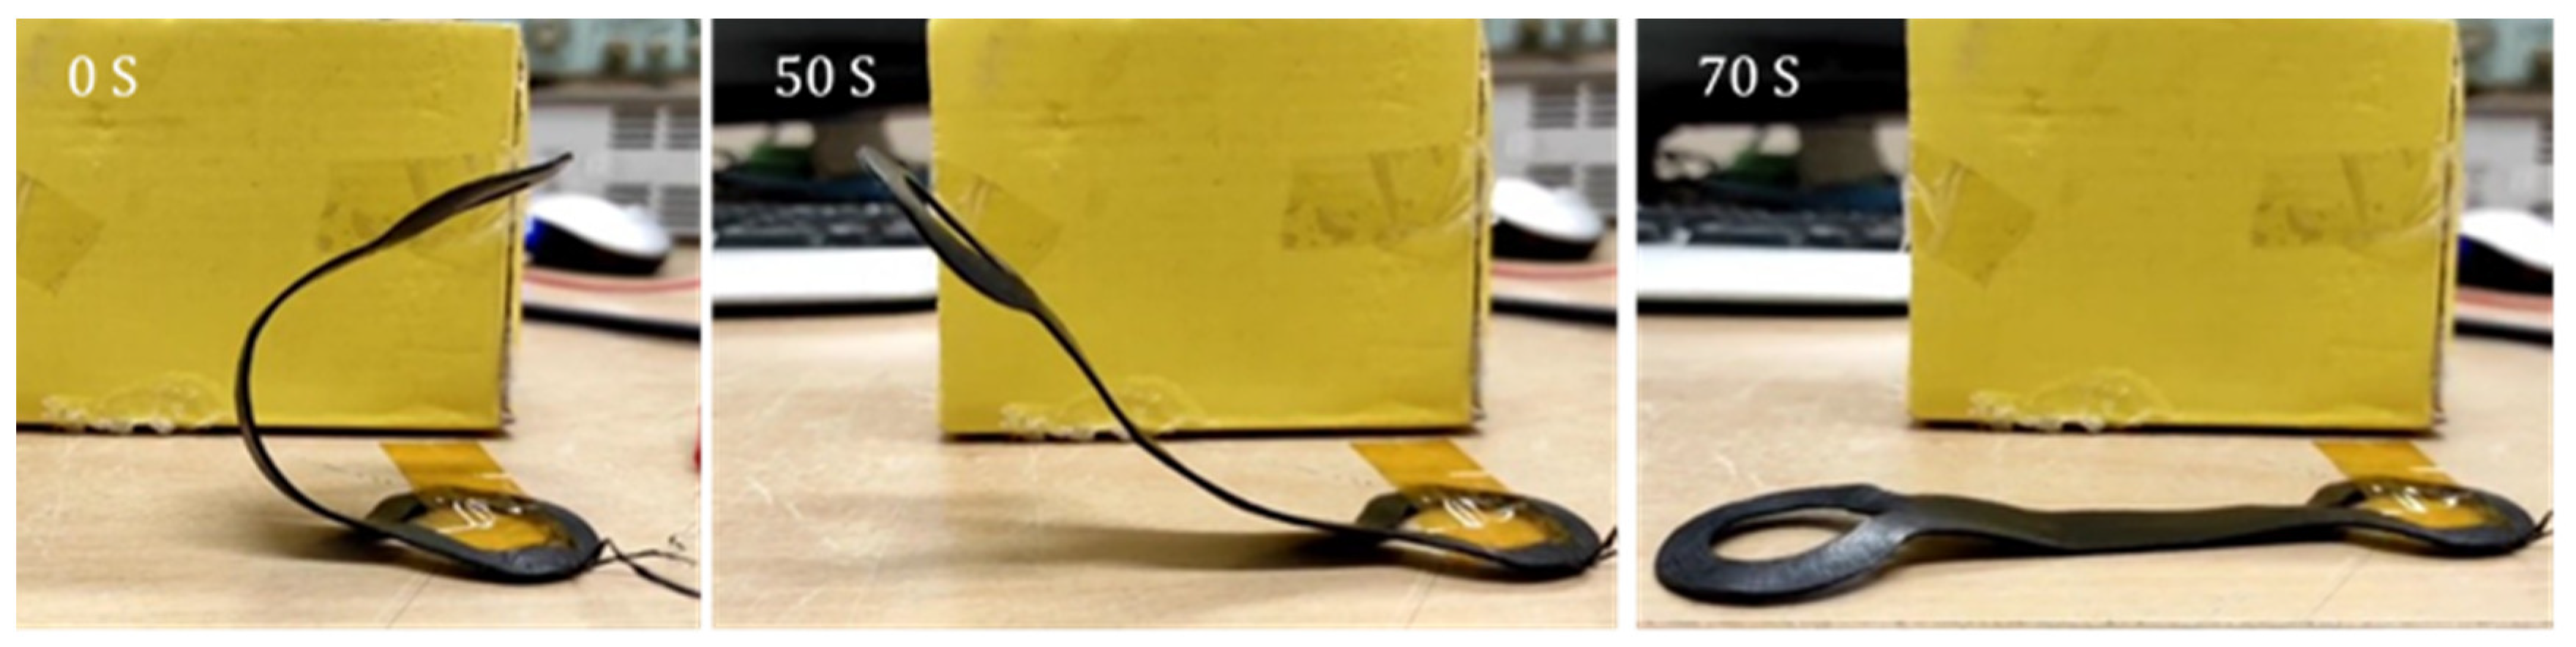

Table 1.
Printing parameters of the specimens.
| Parameter | Value |
| Nozzle diameter | 1 |
| Nozzle temperature | 210˚C |
| Bed temperature | 50˚C |
| Wire-reinforced specimens print Speed | 10 |
| Non-reinforced specimens print Speed | 50 |
Table 2.
Measured mechanical properties of the metal wire.
| Wire Size | Standard | Tensile strength [MPa] | Tensile modulus [GPa] | Elongation at break [%] |
| 0.1 mm | ASTMD2256 | 874 | 110 | 14 |
| 0.15 mm | ASTMD2256 | 974 | 52 | 13 |
Table 3.
Flexural strength and modulus of the wire-reinforced PLA.
| Flexural strength [MPa] | Flexural Modulus [GPa] | |||
| Neat PLA | 102.2 ± 4.8 | 3.7 ± 0.3 | ||
| 0.1 mm | 10% Wire | 207.3 ± 13.8 | 16.6 ± 1.35 | |
| 5% Wire | 149.9 ± 0.9 | 10.1 ± 1.1 | ||
| 0.15 mm | 10% Wire | 209.7 ± 4.4 | 10.7 ± 0.5 | |
| 5% Wire | 112.4 ± 10 | 8.3 ± 0.45 | ||
Table 4.
Flexural strength and modulus of the wire-reinforced PLA at 60 °C.
| Flexural strength (MPa) | Flexural Modulus (GPa) | |||
| Neat PLA | 10.7± 2 | 0.66 ± 0.15 | ||
| 0.1 mm | 5% Wire | 28.4± 2.4 | 2.4 ± 0.15 | |
| 10% Wire | 50.9 ± 2.6 | 4.1 ± 0.35 | ||
| 0.15 mm | 5% Wire | 26.2 ± 2.9 | 2.9 ± 0.35 | |
| 10% Wire | 48.4 ± 5 | 1.2 ± 0.25 | ||
Disclaimer/Publisher’s Note: The statements, opinions and data contained in all publications are solely those of the individual author(s) and contributor(s) and not of MDPI and/or the editor(s). MDPI and/or the editor(s) disclaim responsibility for any injury to people or property resulting from any ideas, methods, instructions or products referred to in the content. |
© 2023 by the authors. Licensee MDPI, Basel, Switzerland. This article is an open access article distributed under the terms and conditions of the Creative Commons Attribution (CC BY) license (http://creativecommons.org/licenses/by/4.0/).
Copyright: This open access article is published under a Creative Commons CC BY 4.0 license, which permit the free download, distribution, and reuse, provided that the author and preprint are cited in any reuse.


