Submitted:
16 October 2023
Posted:
18 October 2023
You are already at the latest version
Abstract
Keywords:
1. Introduction
2. Materials and Methods
2.1. Study Area and Data Used
2.2. Extreme Precipitation Based Climate Indices
2.3. Extreme Precipitation Based Climate Indices
2.3.1. Bias Correction
2.3.2. Mann-Kendall Trend Test
2.3.3. Spearman’s Rho Trend Test
2.3.4. Spatial Analysis
3. Results
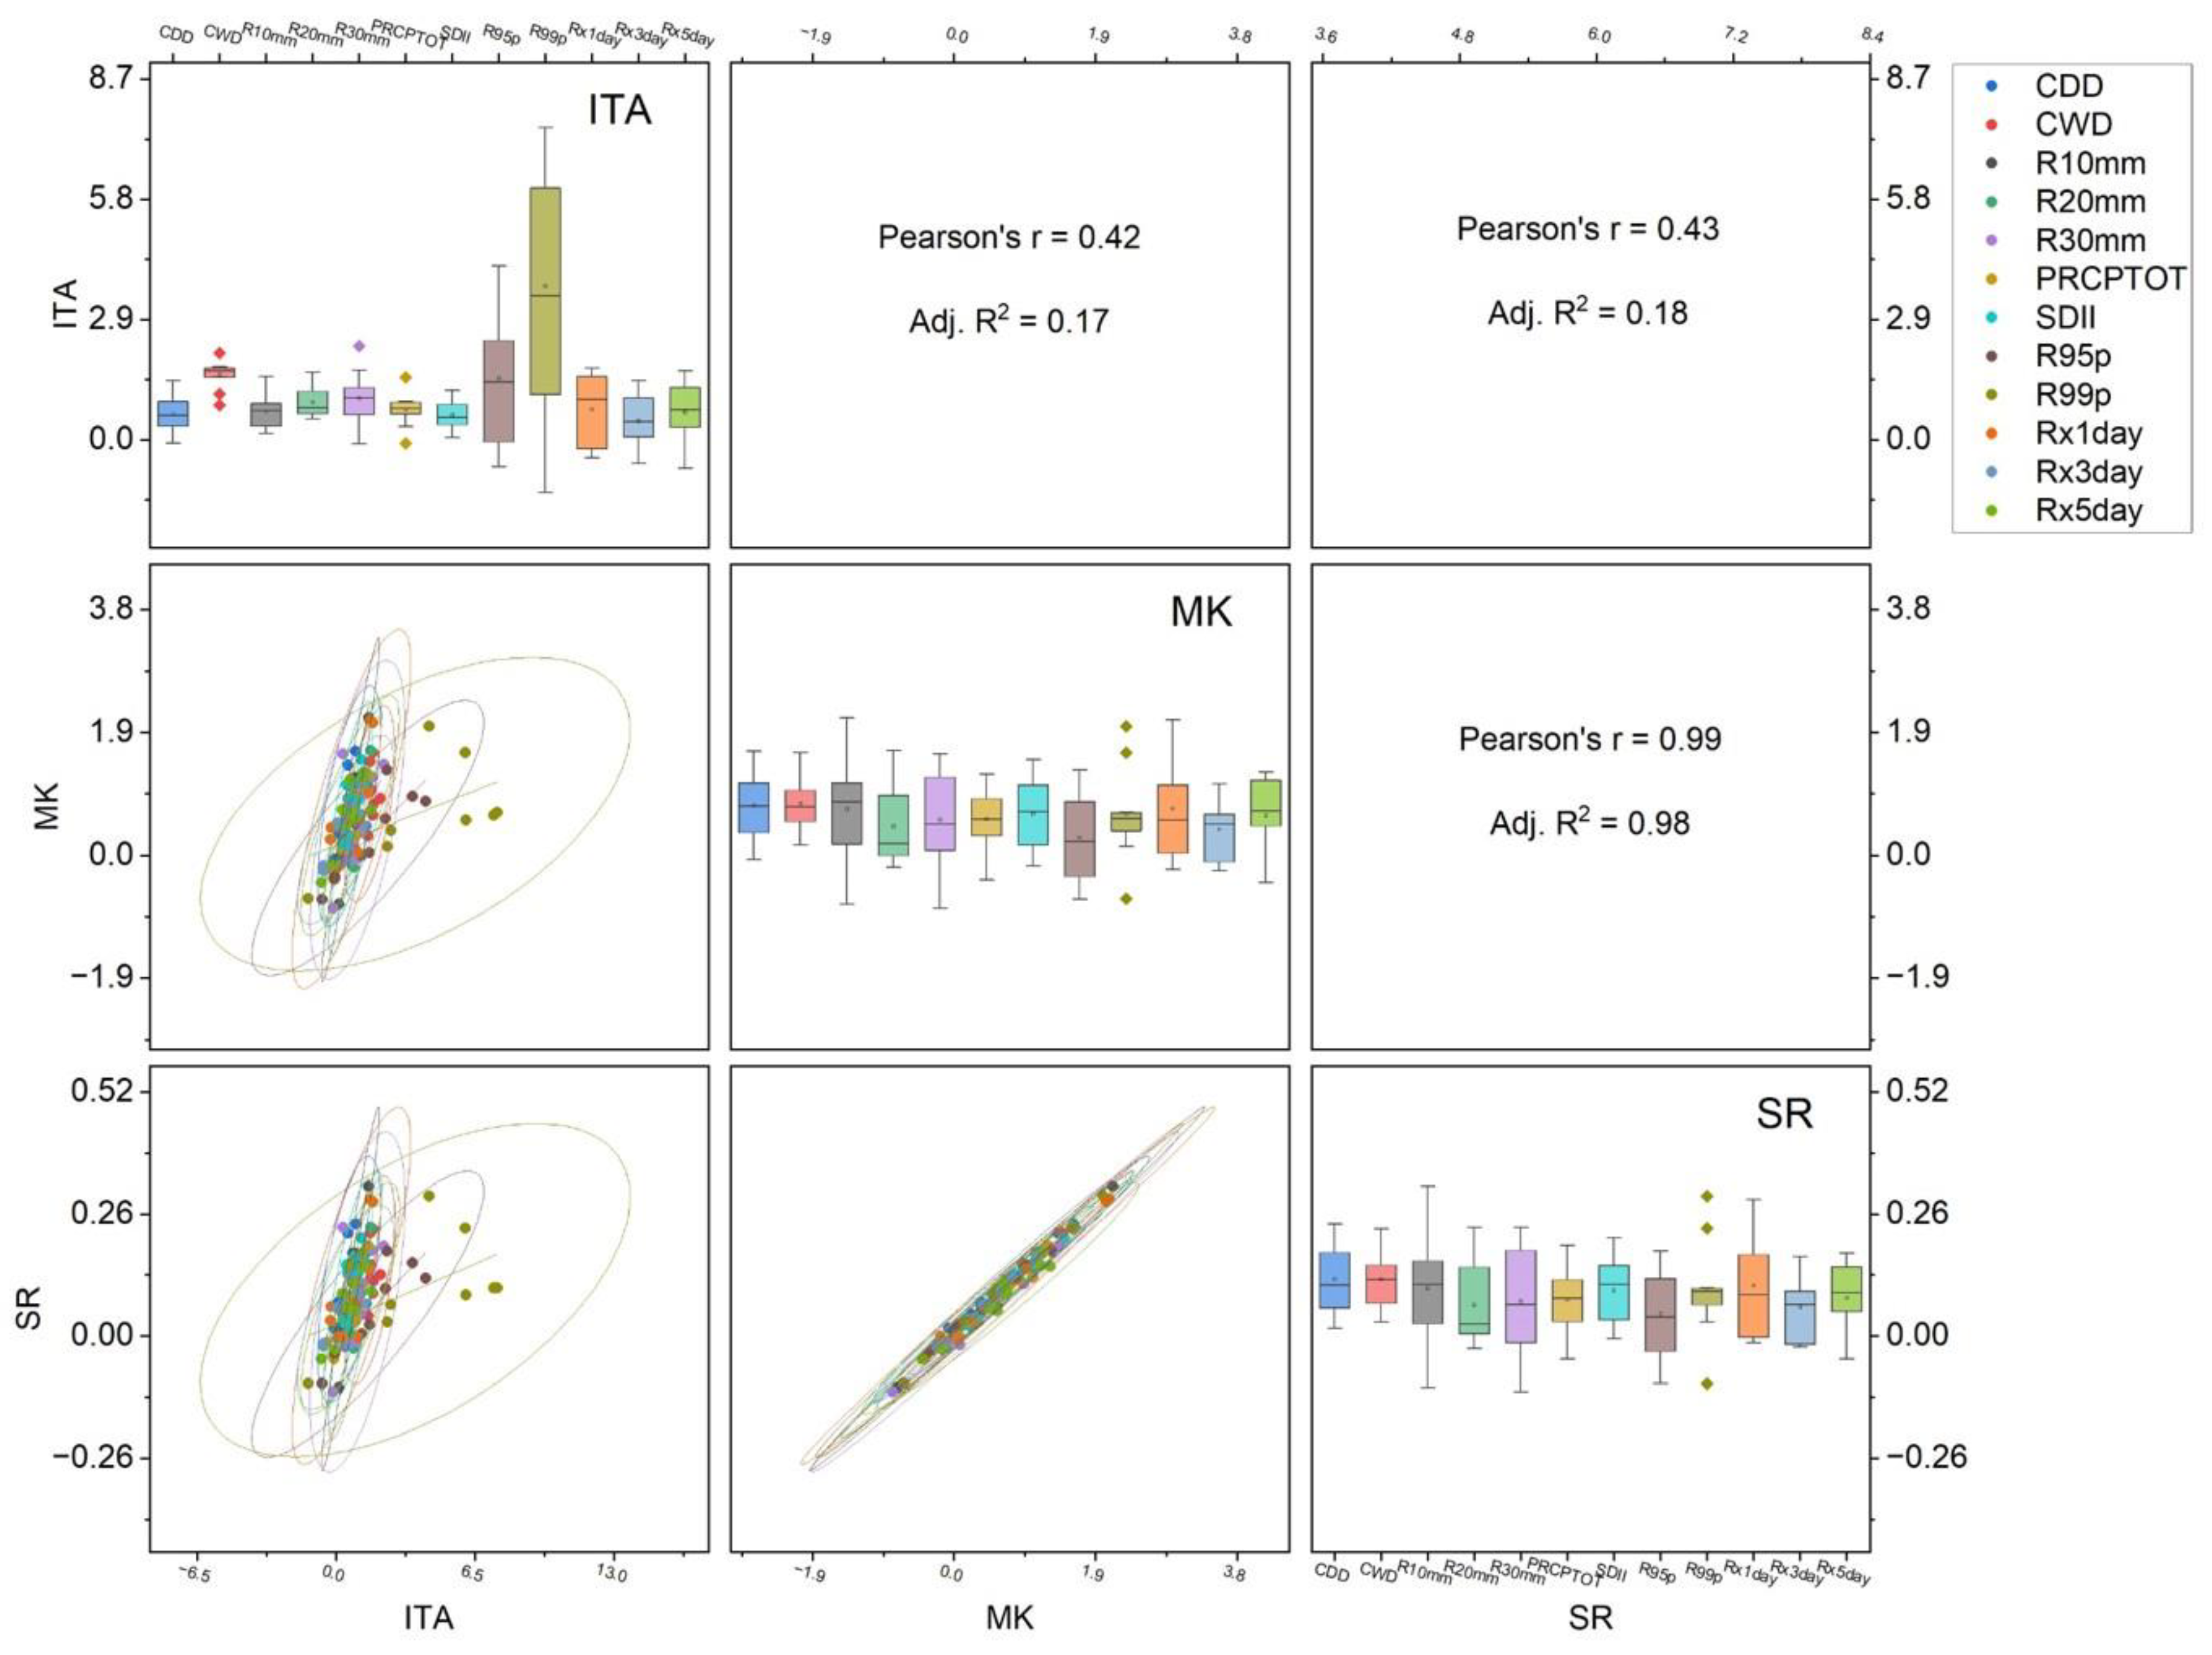
3.1. Temporal Changes and Trends in Climate Indices
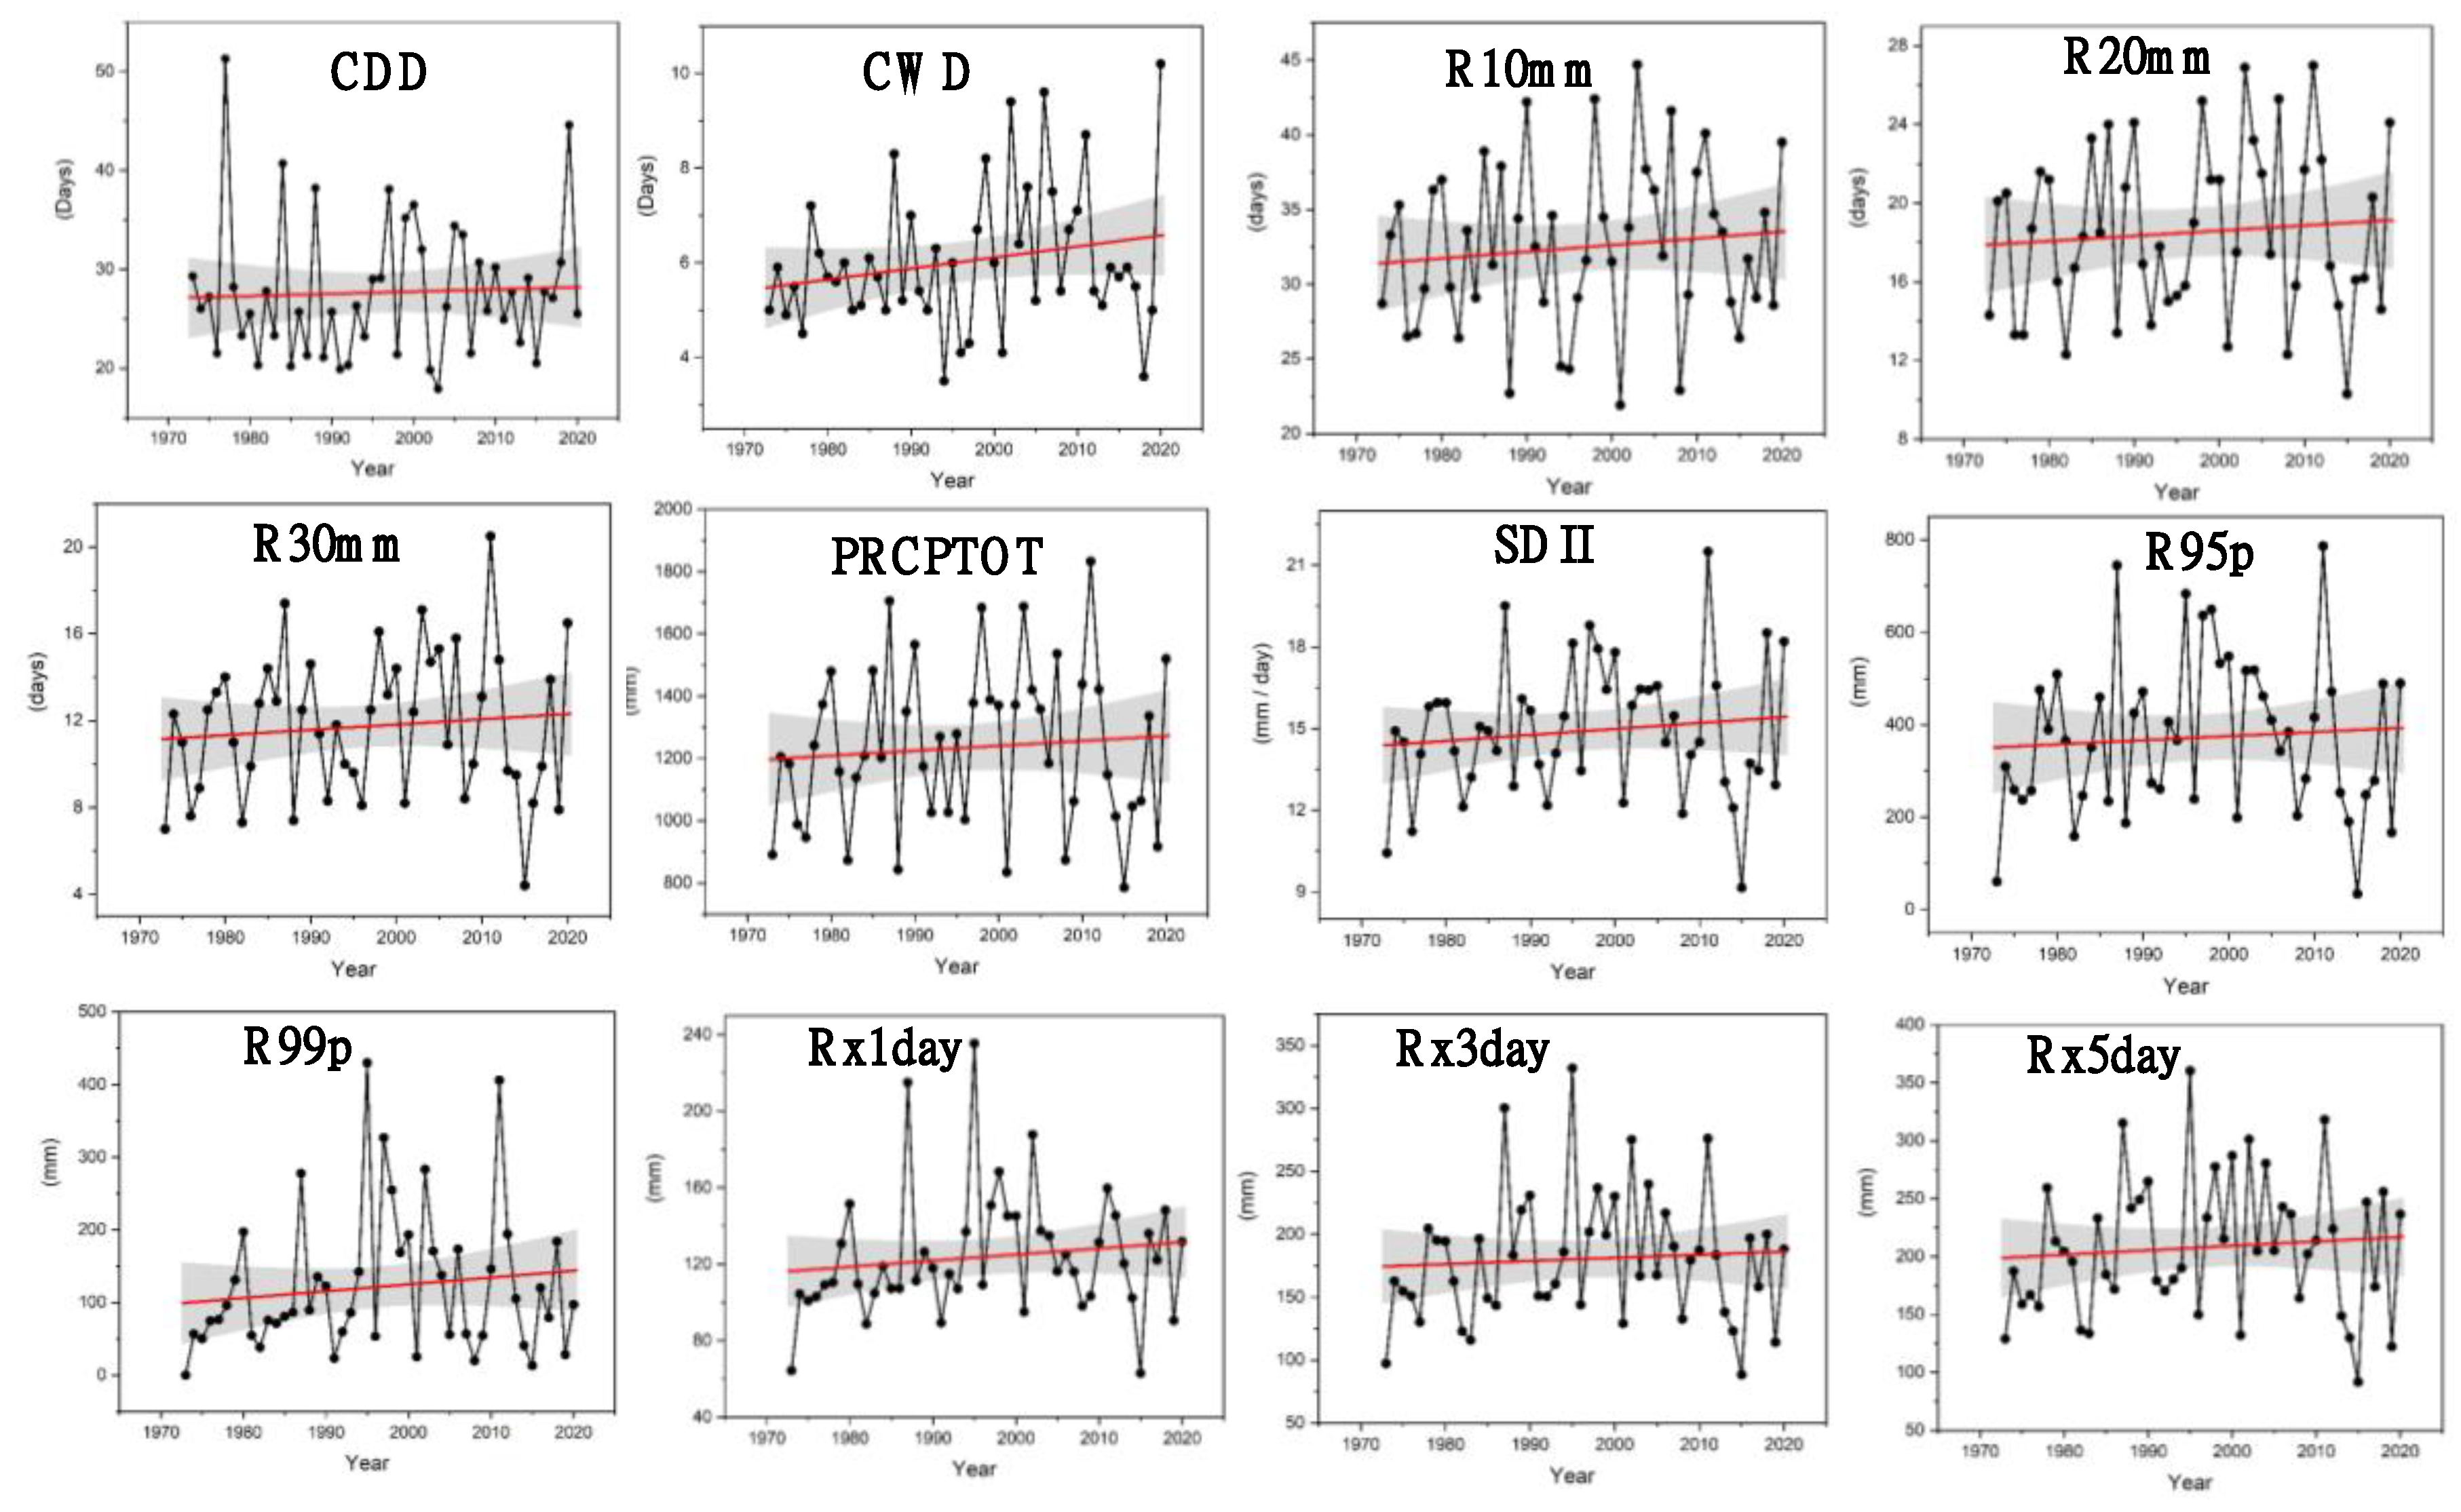
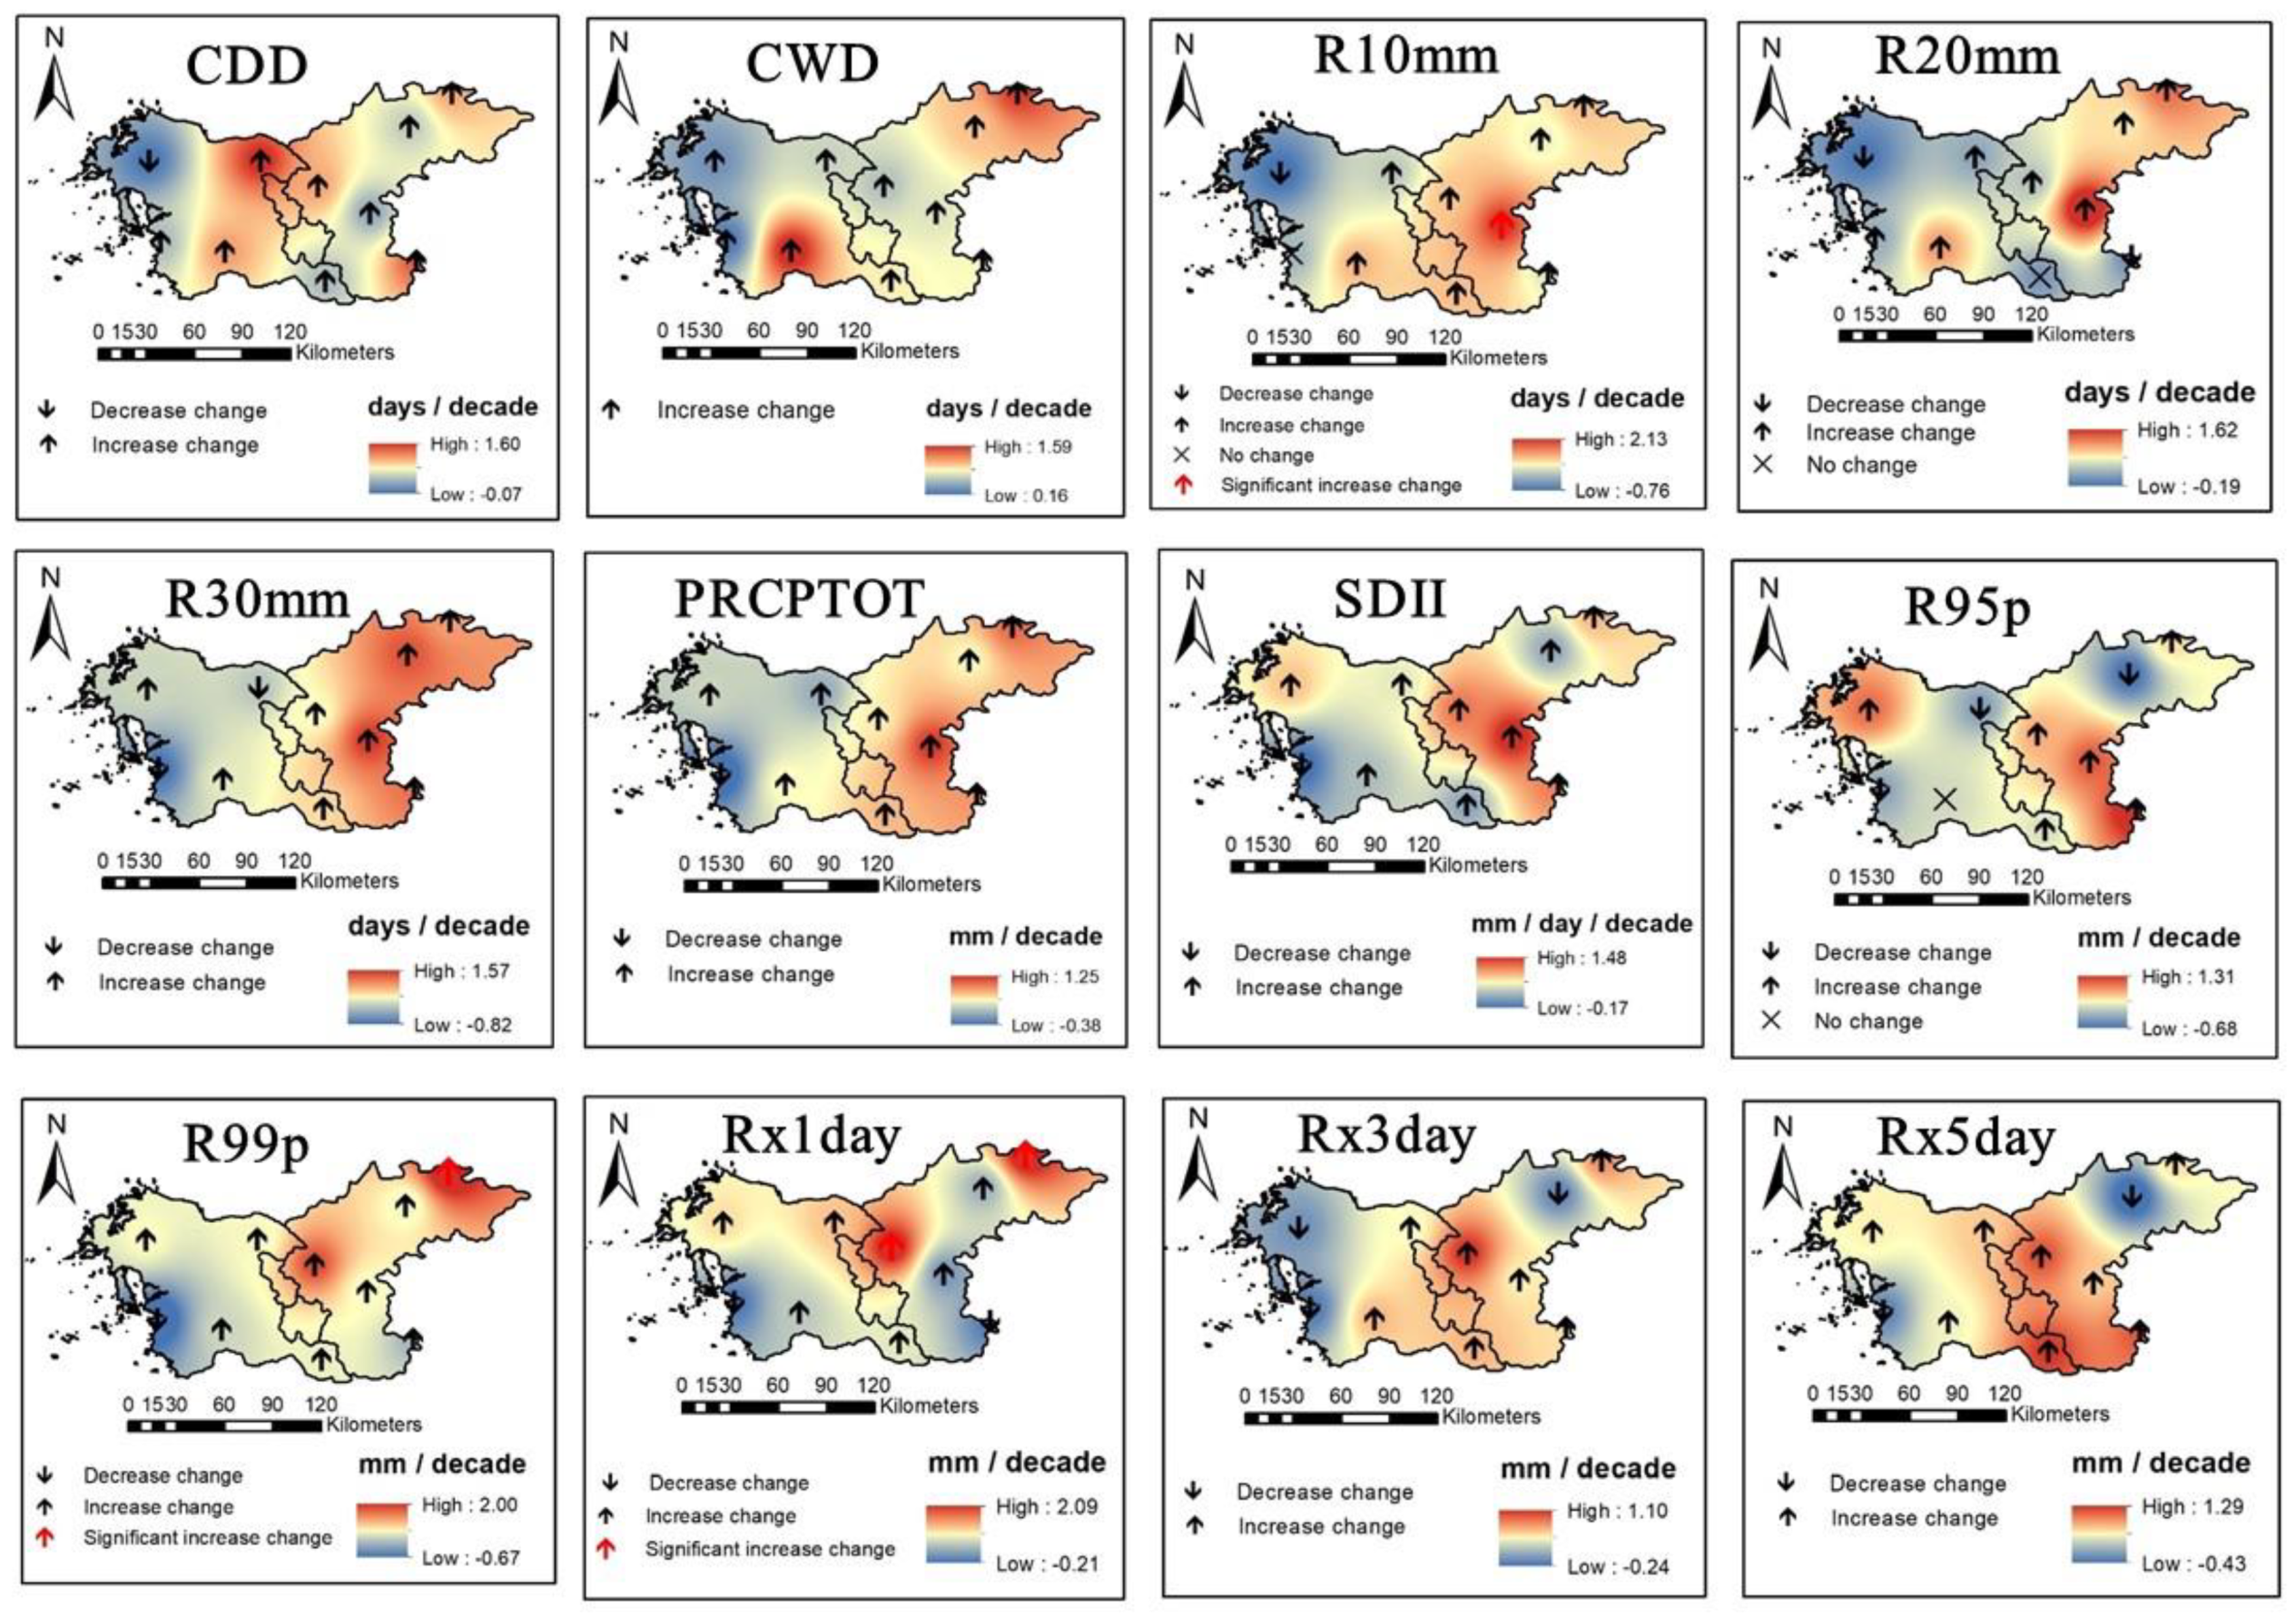
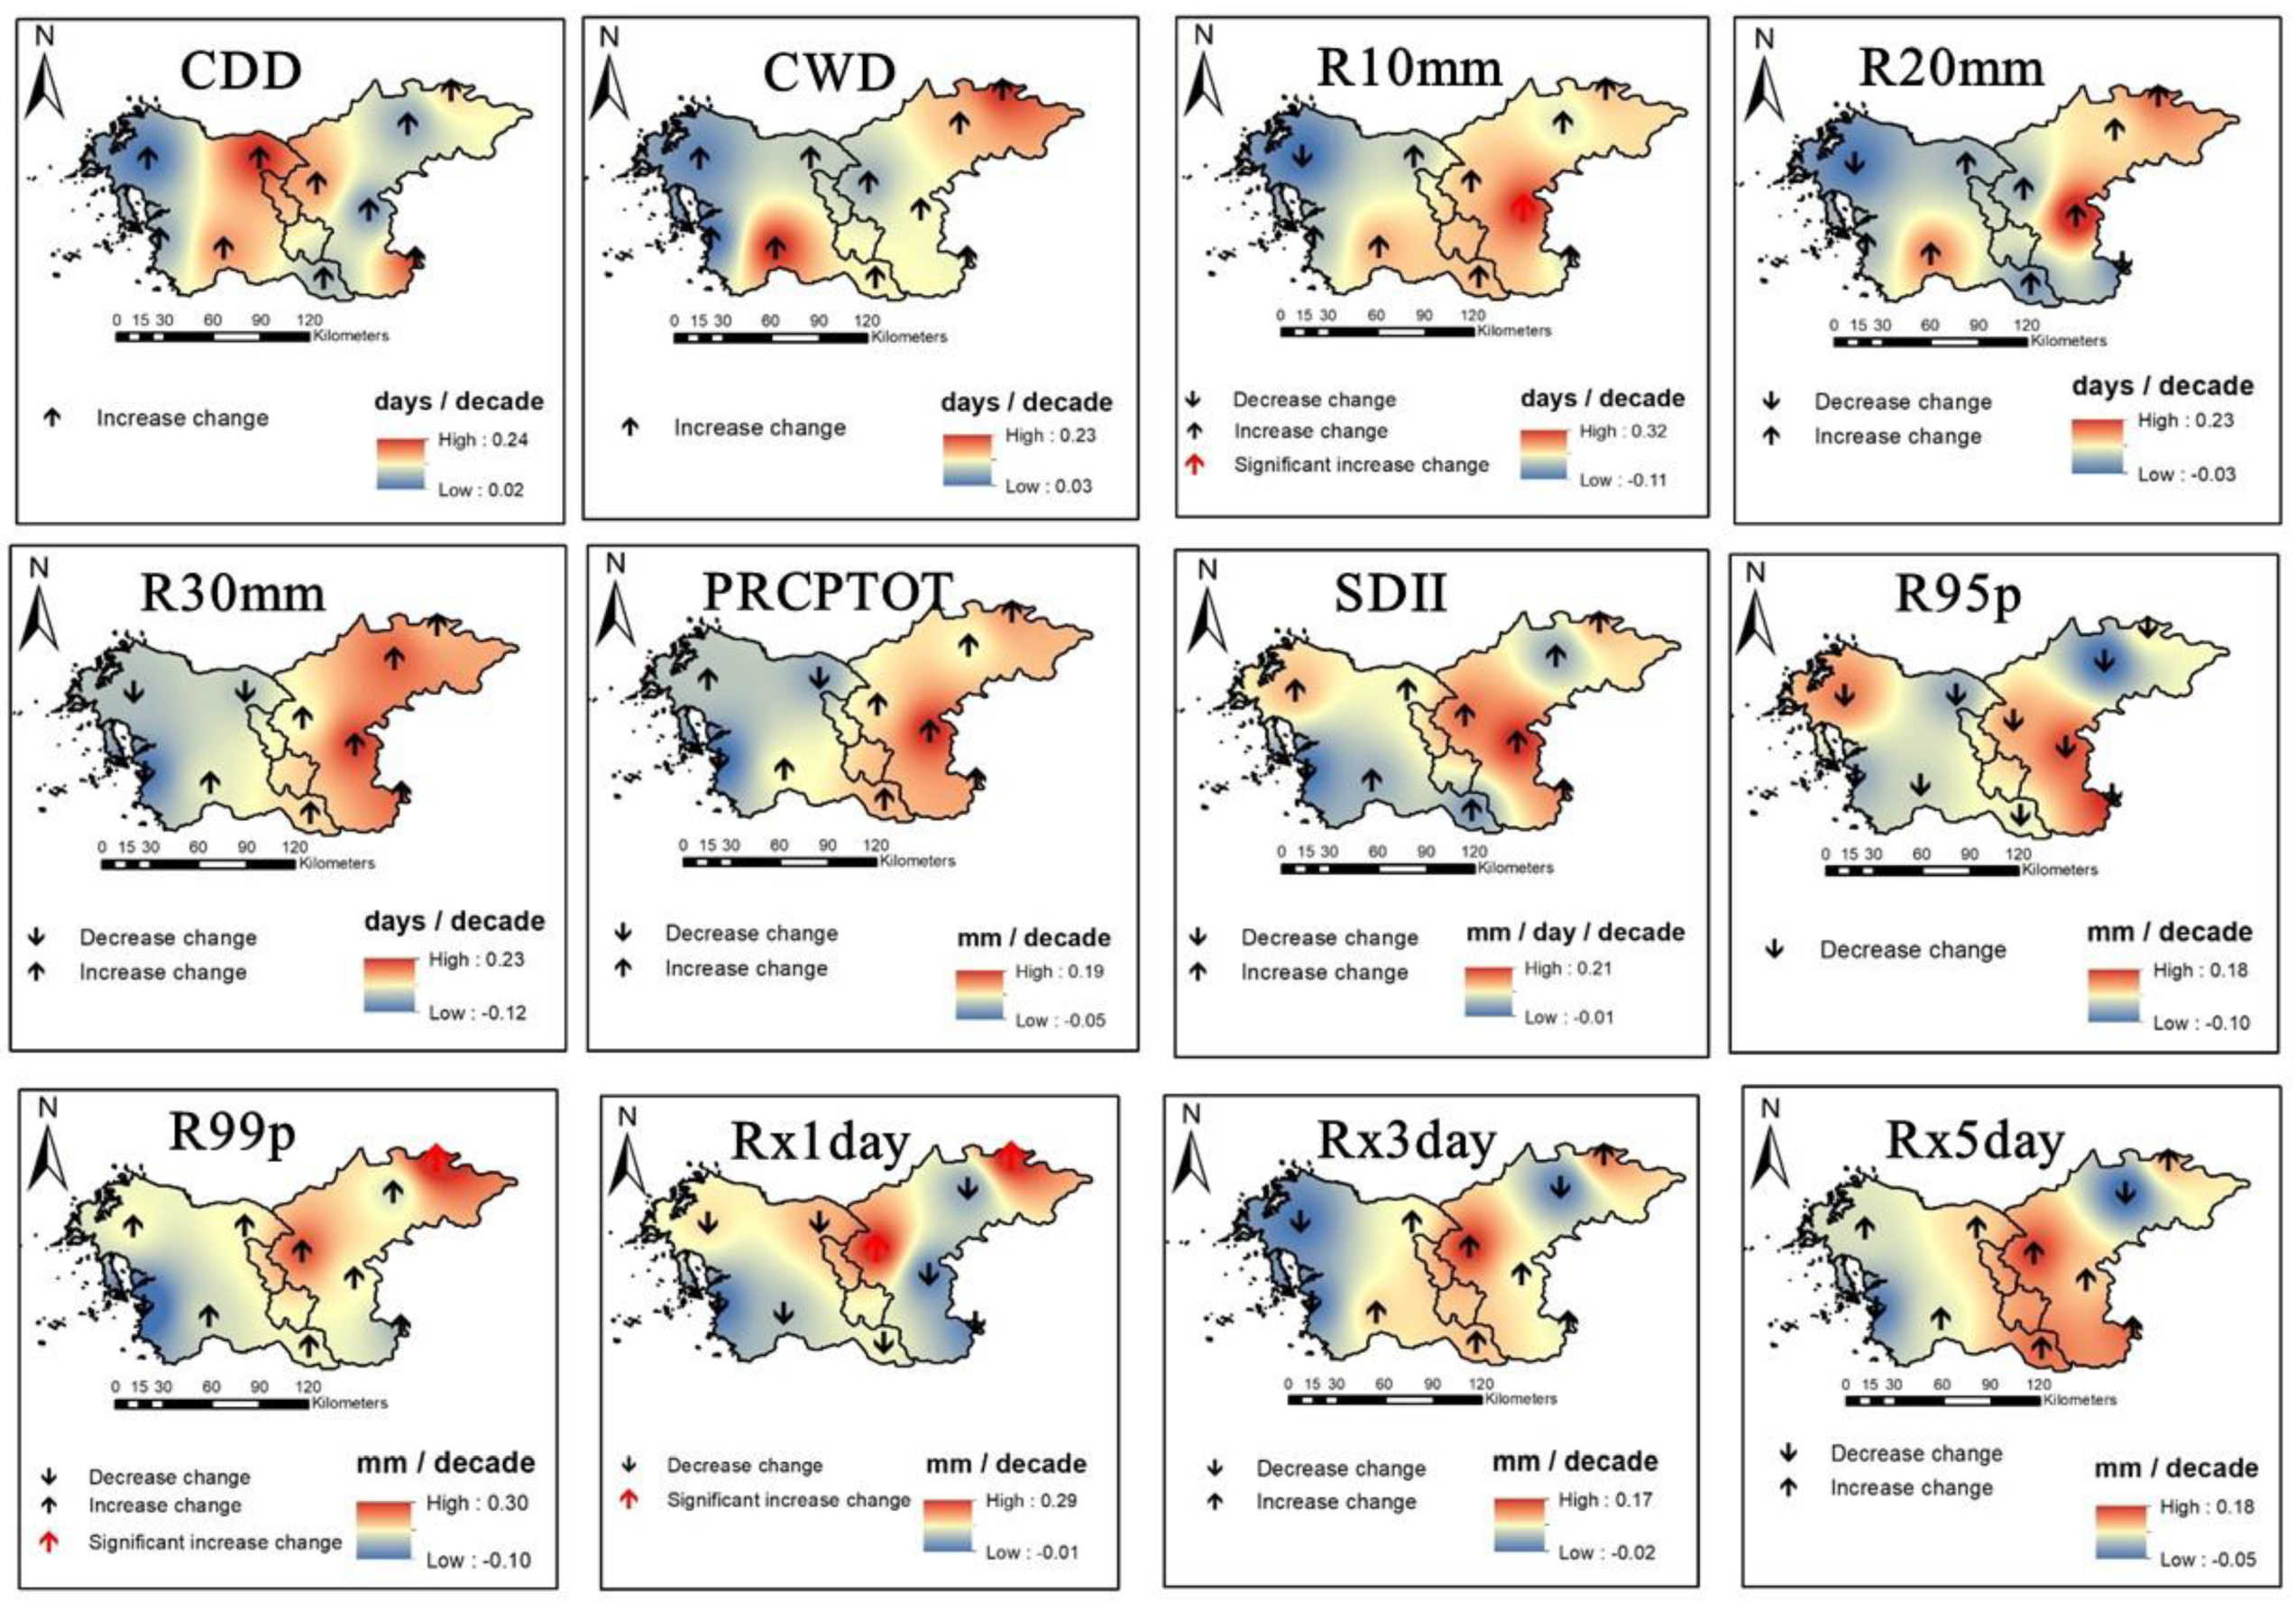
3.2. Spatial Variability and Trends in Extreme Climate Indices
4. Discussion
5. Conclusions
Author Contributions
Funding
Institutional Review Board Statement
Data Availability Statement
Conflicts of Interest
References
- Adelodun, B.; Odey, G.; Lee, S.; Choi, K.S. Investigating the causal impacts relationship between economic flood damage and extreme precipitation indices based on ARDL-ECM framework: A case study of Chungcheong region in South Korea. Sustain. Cities Soc. 2023, 95, 104606. [Google Scholar] [CrossRef]
- Jiang, W.; Tan, Y. Overview on failures of urban underground infrastructures in complex geological conditions due to heavy rainfall in China during 1994–2018. Sustain. Cities Soc. 2022, 76. [Google Scholar] [CrossRef]
- Gimeno, L.; Algarra, I.; Gimeno-sotelo, L. Extreme precipitation events. 2022, 1–21. [CrossRef]
- Organization, W.M. WMO atlas of mortality and economic losses from weather, climate and water extremes; 2019; ISBN 9789263112675Organization, W.M. WMO atlas of mortality and economic losses from weather, climate and water extremes; 2019; ISBN 9789263112675.
- NEMA Annual Report on Disaster.; 2018.
- Kim, Y.; Sohn, H.-G. Disasters from 1948 to 2015 in Korea and Power-Law Distribution. In Disaster Risk Management in the Republic of Korea. Disaster Risk Reduction; 2018; pp. 77–97. ISBN 9789811047893.
- Ahmad, I.; Zhang, F.; Tayyab, M.; Anjum, M.N.; Zaman, M.; Liu, J.; Farid, H.U.; Saddique, Q. Spatiotemporal analysis of precipitation variability in annual, seasonal and extreme values over upper Indus River basin. Atmos. Res. 2018, 213, 346–360. [Google Scholar] [CrossRef]
- Umar, D.A.; Ramli, M.F.; Aris, A.Z.; Jamil, N.R.; Aderemi, A.A. Evidence of climate variability from rainfall and temperature fluctuations in semi-arid region of the tropics. Atmos. Res. 2019, 224, 52–64. [Google Scholar] [CrossRef]
- Gocic, M.; Trajkovic, S. Analysis of changes in meteorological variables using Mann-Kendall and Sen’s slope estimator statistical tests in Serbia. Glob. Planet. Change 2013, 100, 172–182. [Google Scholar] [CrossRef]
- Alifujiang, Y.; Abuduwaili, J.; Maihemuti, B.; Emin, B.; Groll, M. Innovative Trend Analysis of Precipitation in the Lake Issyk-Kul Basin, Kyrgyzstan. Atmosphere (Basel). 2020, 11, 332. [Google Scholar] [CrossRef]
- Şen, Z. Innovative Trend Analysis Methodology. J. Hydrol. Eng. 2012, 17, 1042–1046. [Google Scholar] [CrossRef]
- Caloiero, T.; Coscarelli, R.; Ferrari, E. Application of the Innovative Trend Analysis Method for the Trend Analysis of Rainfall Anomalies in Southern Italy. Water Resour. Manag. 2018, 32, 4971–4983. [Google Scholar] [CrossRef]
- Gedefaw, M.; Yan, D.; Wang, H.; Qin, T.; Girma, A.; Abiyu, A.; Batsuren, D. Innovative trend analysis of annual and seasonal rainfall variability in Amhara Regional State, Ethiopia. Atmosphere (Basel) 2018, 9. [Google Scholar] [CrossRef]
- Dong, Z.; Jia, W.; Sarukkalige, R.; Fu, G.; Meng, Q.; Wang, Q. Innovative trend analysis of air temperature and precipitation in the jinsha river basin, china. Water (Switzerland) 2020, 12. [Google Scholar] [CrossRef]
- Adelodun, B.; Odey, G.; Cho, H.; Lee, S.; Adeyemi, K.A.; Choi, K.S. Spatial-temporal variability of climate indices in Chungcheong provinces of Korea: Application of graphical innovative methods for trend analysis. Atmos. Res. 2022, 280, 106420. [Google Scholar] [CrossRef]
- Shah, S.A.; Jehanzaib, M.; Kim, M.J.; Kwak, D.-Y.; Kim, T.-W. Spatial and Temporal Variation of Annual and Categorized Precipitation in the Han River Basin, South Korea. KSCE J. Civ. Eng. 2022, 26, 1990–2001. [Google Scholar] [CrossRef]
- KOSIS Ministry of Land Infrastructure and Transport Statistics System. Available online: https://kosis.kr/index/index.do (accessed on 25 April 2022).
- Park, S.; Lim, J.; Lim, H.S. Past climate changes over South Korea during MIS3 and MIS1 and their links to regional and global climate changes. Quat. Int. 2019, 519, 74–81. [Google Scholar] [CrossRef]
- Kim, J.E.; Yu, J.; Ryu, J.H.; Lee, J.H.; Kim, T.W. Assessment of regional drought vulnerability and risk using principal component analysis and a Gaussian mixture model. Nat. Hazards 2021, 109, 707–724. [Google Scholar] [CrossRef]
- Alexander, L.; Herold, N. ClimPACT2 indices and software. 2016.
- WMO Guidelines on Analysis of extremes in a changing climate in support of informed decisions for adaptation; WCDMP-No 72. CH-1211. Geneva 2, Switzerland, 2009.
- Zhang, X.; Alexander, L.; Hegerl, G.C.; Jones, P.; Tank, A.K.; Peterson, T.C.; Trewin, B.; Zwiers, F.W. Indices for monitoring changes in extremes based on daily temperature and precipitation data. WIREs Clim. Chang. 2011, 2, 851–870. [Google Scholar] [CrossRef]
- Felix, M.L.; Kim, Y.; Choi, M.; Kim, J.-C.; Do, X.K.; Nguyen, T.H.; Jung, K. Detailed Trend Analysis of Extreme Climate Indices in the Upper Geum River Basin. Water 2021, 13, 3171. [Google Scholar] [CrossRef]
- Mei, C.; Liu, J.; Chen, M. Te; Wang, H.; Li, M.; Yu, Y. Multi-decadal spatial and temporal changes of extreme precipitation patterns in northern China (Jing-Jin-Ji district, 1960–2013). Quat. Int. 2018, 476, 1–13. [Google Scholar] [CrossRef]
- Mtewele, Z.F.; Xu, X.; Jia, G. Heterogeneous Trends of Precipitation Extremes in Recent Two Decades over East Africa. J. Meteorol. Res. 2021, 35, 1057–1073. [Google Scholar] [CrossRef]
- Şen, Z. Innovative trend significance test and applications. Theor. Appl. Climatol. 2017, 127, 939–947. [Google Scholar] [CrossRef]
- Njouenwet, I.; Tchotchou, L.A.D.; Ayugi, B.O.; Guenang, G.M.; Vondou, D.A.; Nouayou, R. Spatiotemporal Variability, Trends, and Potential Impacts of Extreme Rainfall Events in the Sudano-Sahelian Region of Cameroon. Atmosphere (Basel) 2022, 13, 1599. [Google Scholar] [CrossRef]
- Güçlü, Y.S. Multiple Şen-innovative trend analyses and partial Mann-Kendall test. J. Hydrol. 2018, 566, 685–704. [Google Scholar] [CrossRef]
- Mallick, J.; Talukdar, S.; Alsubih, M.; Salam, R.; Ahmed, M.; Kahla, N. Ben; Shamimuzzaman, M. Analysing the trend of rainfall in Asir region of Saudi Arabia using the family of Mann-Kendall tests, innovative trend analysis, and detrended fluctuation analysis. Theor. Appl. Climatol. 2021, 143, 823–841. [Google Scholar] [CrossRef]
- Wu, H.; Qian, H. Innovative trend analysis of annual and seasonal rainfall and extreme values in Shaanxi, China, since the 1950s. Int. J. Climatol. 2017, 37, 2582–2592. [Google Scholar] [CrossRef]
- Kendall, M.G. Rank Correlation Method; Charless Griffin: London, 1975.
- Mann, H.B. Nonparametric Tests Against Trend. Econometrica 1945, 13, 245–259. [Google Scholar] [CrossRef]
- Sneyers, R. On the statistical analysis of series of observations; 192; 1990.
- Spearman, C. The Proof and Measurement of Association between Two Things. Am. J. Psychol. 1987, 100, 441. [Google Scholar] [CrossRef]
- Lehmann, E.L.; D’Abrera, H.J. Nonparametrics: Statistical methods based on ranks; San Francisco, 1975.
- Wang, Y.; Xu, Y.; Tabari, H.; Wang, J.; Wang, Q.; Song, S.; Hu, Z. Innovative trend analysis of annual and seasonal rainfall in the Yangtze River Delta, eastern China. Atmos. Res. 2020, 231, 104673. [Google Scholar] [CrossRef]
- Maeng, S.J.; Azam, M.; Kim, H.S.; Hwang, J.H. Analysis of changes in spatio-temporal patterns of drought across South Korea. Water (Switzerland) 2017, 9, 1–20. [Google Scholar] [CrossRef]
- Boram, P. Heavy rain pummels central S. Korea, leaving 1 firefighter missing Available online:. Available online: https://en.yna.co.kr/view/AEN20200802000700315 (accessed on 21 May 2022).
- Adelodun, B.; Odey, G.; Lee, S.; Choi, K.S. Analysis of Spatial-temporal Variability and Trends of Extreme Precipitation Indices over Chungcheong Province, South Korea. J. Korean Soc. Agric. Eng. 2022, 64, 101–112. [Google Scholar] [CrossRef]
- Seo, L.; Kim, T.-W.; Kwon, H.-H. Investigation of trend variations in annual maximum rainfalls in South Korea. KSCE J. Civ. Eng. 2012, 16, 215–221. [Google Scholar] [CrossRef]
- Jung, I.-W.; Bae, D.-H.; Kim, G. Recent trends of mean and extreme precipitation in Korea. Int. J. Climatol. 2011, 31, 359–370. [Google Scholar] [CrossRef]
- Ahmed, I.A.; Salam, R.; Naikoo, M.W.; Rahman, A.; Praveen, B.; Hoai, P.N.; Pham, Q.B.; Anh, D.T.; Tri, D.Q.; Elkhrachy, I. Evaluating the variability in long-term rainfall over India with advanced statistical techniques. Acta Geophys. 2022, 70, 801–818. [Google Scholar] [CrossRef]
| Classification | Climate Index | Description | Definition | Units |
|---|---|---|---|---|
| Duration | CDD | Consecutive dry days | Maximum number of consecutive dry days | days |
| CWD | Consecutive wet days | Maximum number of consecutive wet days | days | |
| Frequency | R10mm | Number of heavy precipitation days | Annual count of days when RR ≥ 10 mm | days |
| R20mm | Number of very heavy precipitation days | Annual count of days when RR ≥ 20 mm | days | |
| R30mm | Number of very heavy precipitation days | Annual count of days when RR ≥ 30 mm | days | |
| Intensity | PRCPTOT | Annual precipitation | Annual total precipitation when RR ≥ 1 mm | mm |
| R95p | Very wet days | Annual precipitation when RR > 95th percentile | mm | |
| R99p | Extremely wet days | Annual precipitation when RR > 99th percentile | mm | |
| Rx1day | Maximum 1 day of precipitation | Annual highest daily precipitation | mm | |
| Rx3day | Maximum 3 day of precipitation | Annual highest 3 consecutive days of precipitation | mm | |
| Rx5day | Maximum 5 day of precipitation | Annual highest 5 consecutive days of precipitation | mm | |
| SDII | Simple daily intensity index | Annual precipitation divided by number of wet days | mm/day |
Disclaimer/Publisher’s Note: The statements, opinions and data contained in all publications are solely those of the individual author(s) and contributor(s) and not of MDPI and/or the editor(s). MDPI and/or the editor(s) disclaim responsibility for any injury to people or property resulting from any ideas, methods, instructions or products referred to in the content. |
© 2023 by the authors. Licensee MDPI, Basel, Switzerland. This article is an open access article distributed under the terms and conditions of the Creative Commons Attribution (CC BY) license (http://creativecommons.org/licenses/by/4.0/).


