
Submitted:
16 October 2023
Posted:
18 October 2023
You are already at the latest version
Abstract
Corynebacterium glutamicum is prominent for the industrial production of secreted amino acids. Notably, it naturally accumulates the carotenoid pigment decaprenoxanthin in its membranes. Metabolic engineering enabled production of astaxanthin. Here, a bioprocess for astaxanthin production in lab-scale stirred bioreactors was established by a DoE-guided approach to optimize the basic process parameters pH, rDOS, aeration rate as well as inoculation cell density. The DoE-guided approach from 2 L scale cultivation revealed that the pH showed the strongest effect on the product formation. Subsequently, an optimum at pH 8, an aeration rate of 0.25 vvm, 30 % rDOS and an initial optical density of 1 was established that allowed production of 7.6±0.6mg L-1 astaxanthin in batch mode. These process conditions were successfully transferred to a fed-batch process resulting in a high cell density cultivation with up to 60 g CDW L-1 biomass and 64 mg L-1 astaxanthin and thus demonstrating an about 9-fold improvement compared to optimal batch conditions. Moreover, pH shifts experiments indicate that the cells can quickly adapt to a change from pH 6 to 8 and start producing astaxanthin showing the possibility of a biphasic bioprocesses for astaxanthin production.
Keywords:
design of experiment (DoE)
; astaxanthin
; batch and fed-batch fermentation Corynebacterium glutamicum
1. Introduction
Astaxanthin is a red C40 carotenoid with an extraordinary antioxidant activity [1]. It belongs to the xanthophyll group of carotenoids, as it contains oxygen in the form of a keto and hydroxyl group on each ionone ring. The structural properties of astaxanthin enable strong antioxidative properties in addition to high free radical scavenging and singlet oxygen quenching activity [2]. Synthetic astaxanthin is traditionally used as a feed colorant for poultry and is the major carotenoid used in aquatic feed formulations, e.g., for salmon, rainbow trout and crustaceans [3]. In addition, natural astaxanthin is used as a colorant and antioxidant in the food and cosmetics industry, respectively. In recent years, potential medical applications of astaxanthin gained a lot of interest since astaxanthin was shown to exhibit anti-inflammatory, anti-apoptotic, anti-tumor and immune modulating properties, turning it into a potential therapeutic for e.g., cancer [4]. cardiovascular, liver and ocular diseases [5,6,7,8] as well as Alzheimer’s [9] and Parkinson’s disease [10]. Although it is not used as a pharmaceutical yet, natural astaxanthin became prominent as a health-promoting nutraceutical. Due to its attractive properties and commercial value, the global astaxanthin market is predicted to reach about 5 billion US$ in 2028, with an annual growth rate of approximately 17 % [11]. At the present time, astaxanthin sourced form petrochemical synthesis dominates the market as it is the cheapest production method [11,12,13]. However, the nutraceutical, food and cosmetics industries only use naturally sourced astaxanthin [14]. Thus, rising consumer demands facilitated research on alternative and microbial production processes that are both environmentally friendly and scalable. High-level astaxanthin production was enabled in a range of natural and heterologous microbial hosts like Phaffia rhodozyma [16], Yarrowia lipolytica [15,16], Saccharomyces cerevisiae [17], Paracoccus carotinifaciens [18], Escherichia coli [19,20], and Corynebacterium glutamicum [21]. Recently, an astaxanthin oleoresin extracted from C. glutamicum biomass was demonstrated to have an about 9-fold higher antioxidant activity than synthetic astaxanthin [22].
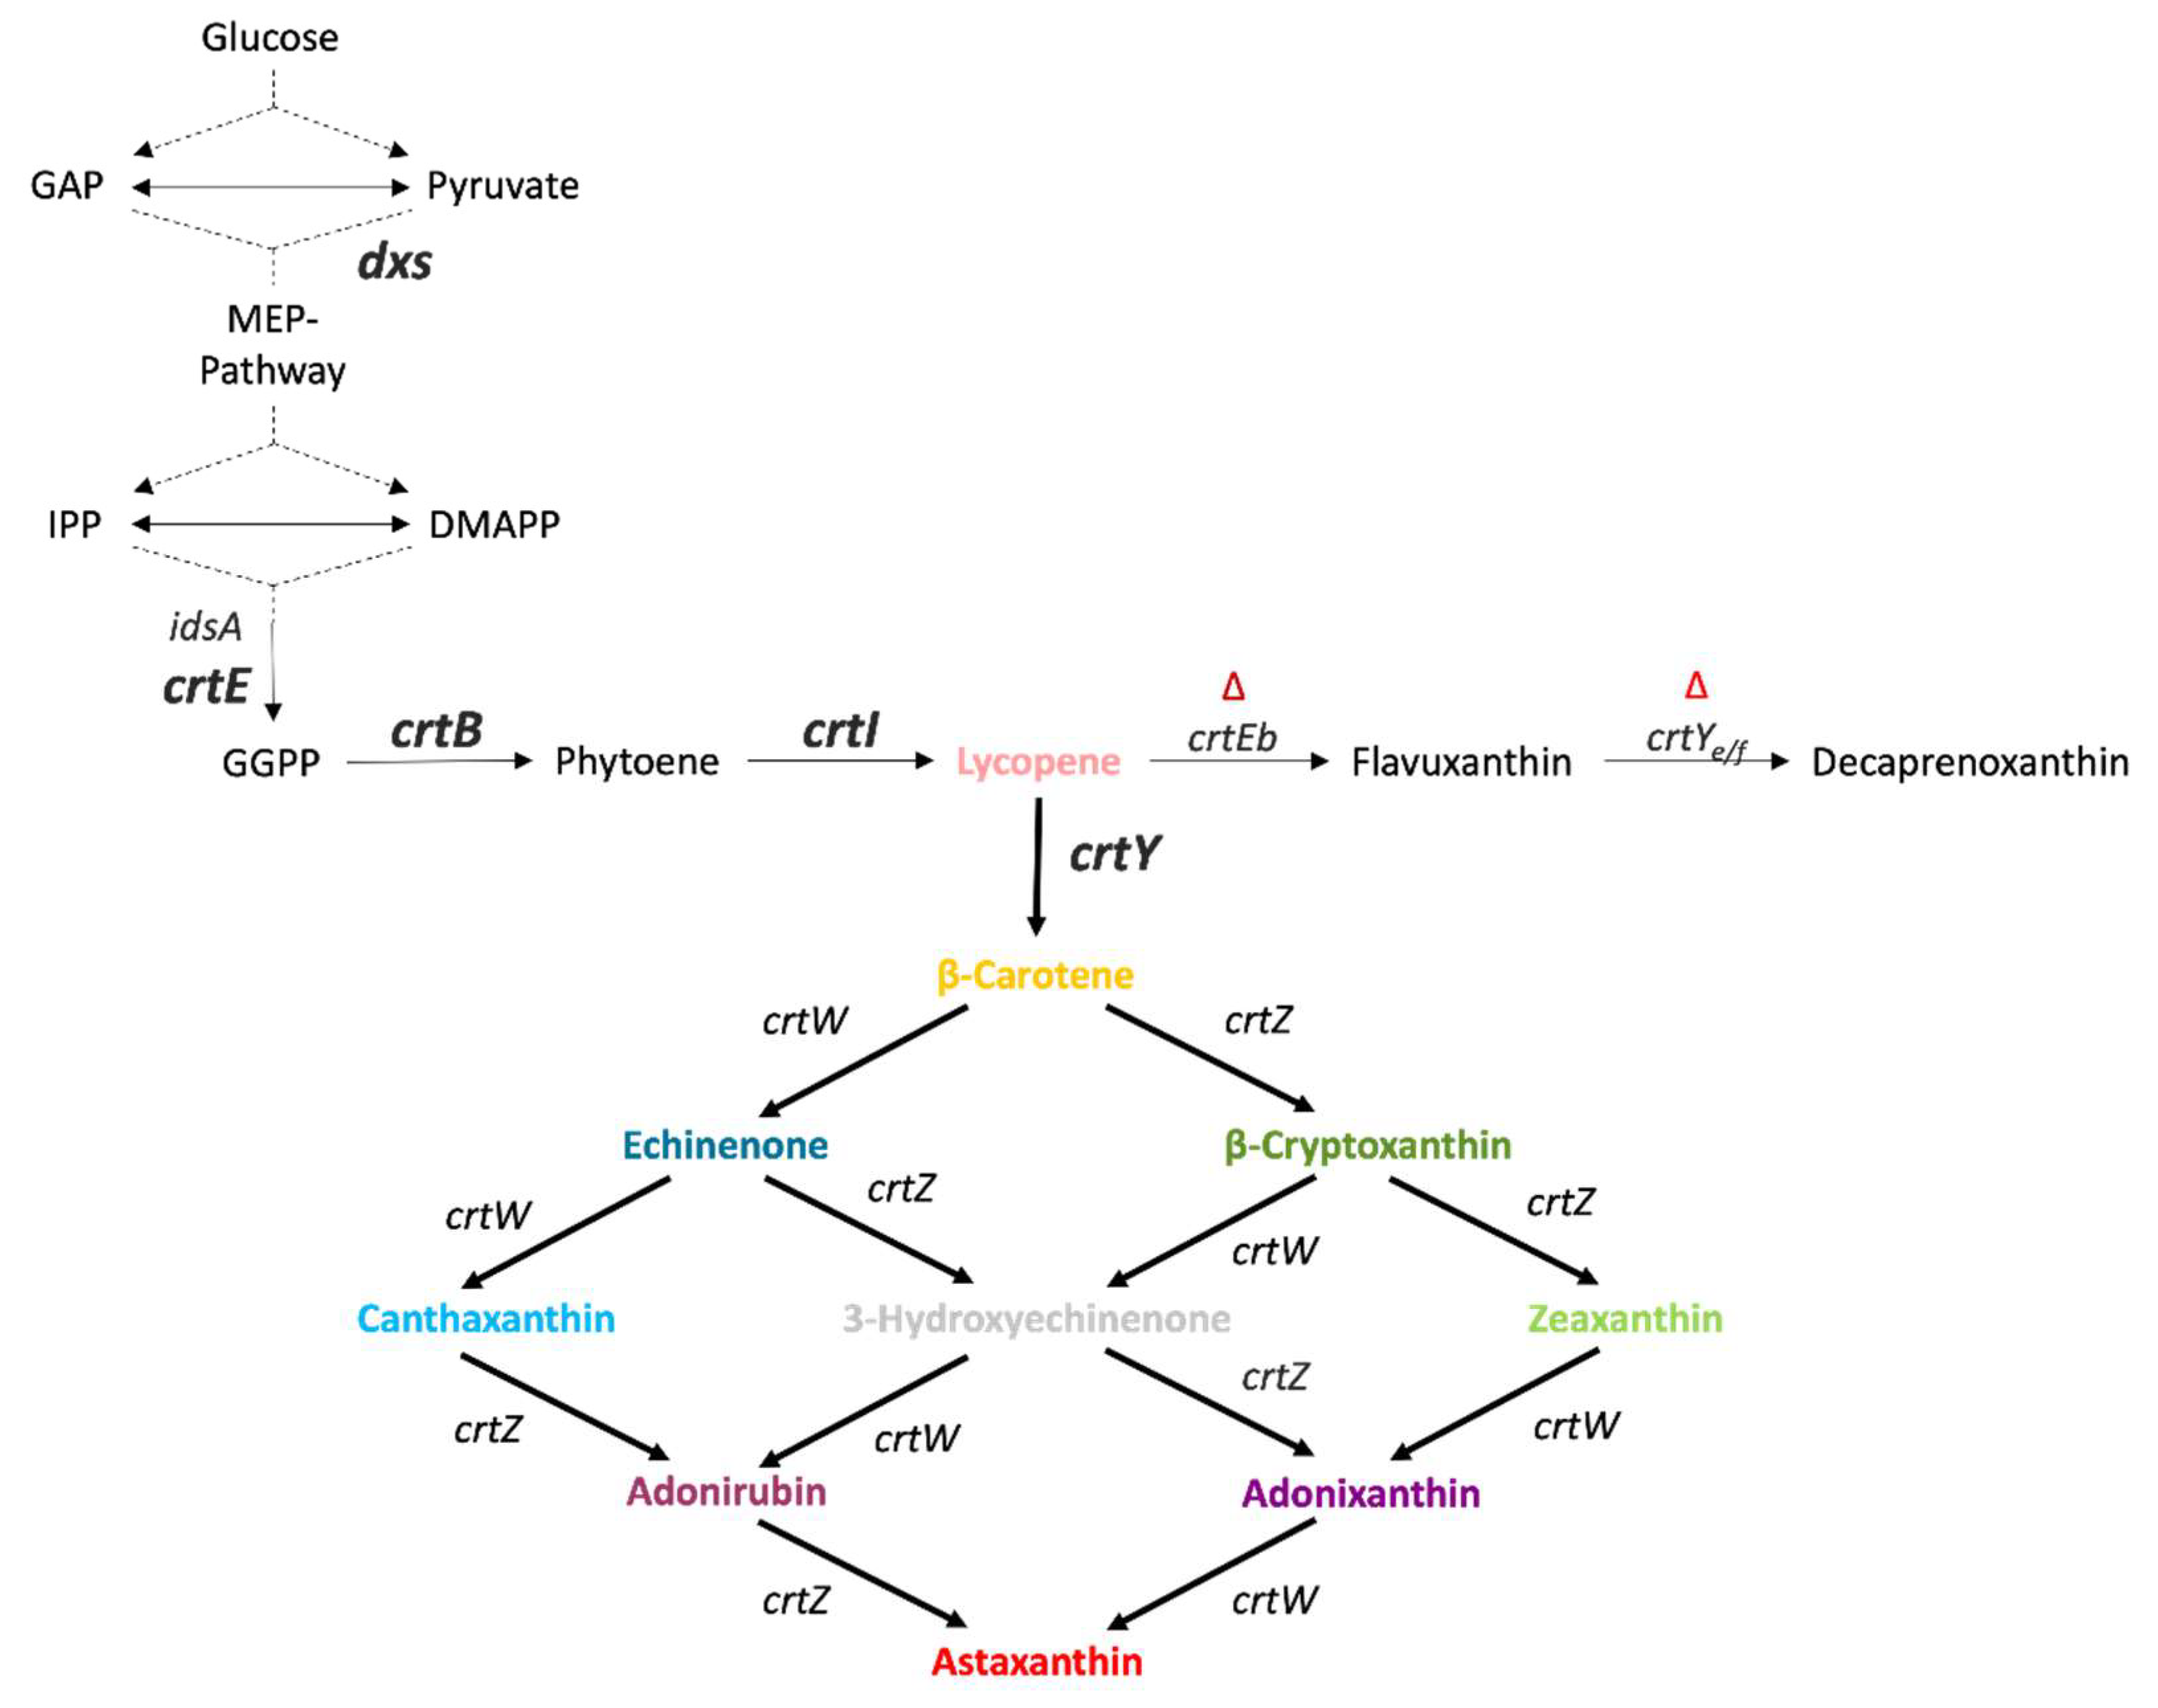
C. glutamicum naturally synthesizes the yellow C50 carotenoid decaprenoxanthin and its glucosides [23]. Over the past decade C. glutamicum was metabolically engineered for efficient production of various carotenoid [24,25,26,27,28,29] and related short-chain terpenoids [30,31,32,33,34]. Rational engineering to enable an improved precursor biosynthesis [29,35], deregulation of the native carotenoid biosynthesis [21,28,36] and abolishment of competing pathways [25,29] have been applied to provide high flux to the astaxanthin precursor lycopene.
For overproduction of the heterologous astaxanthin, first beta-carotene production was established by introduction of the lycopene cyclase gene crtY from Pantoea ananatis [29]. Furthermore, conversion of β-carotene to astaxanthin was established and later improved by a fusion protein comprising the heterologous β-carotene hydroxylase and β-carotene ketolase from Fulvimarina pelagi [21]. Recently, a genome-mining approach with subsequent screening of structurally distinct lycopene β-cyclases revealed that higher astaxanthin production can be achieved with cytosolic lycopene β-cyclase from Synechococcus elongatus and membrane-bound heterodimeric lycopene β-cyclase from Brevibacterium linens [37]. Besides the targeted carotenoid pathway engineering, a systematic CRISPRi library screening identified new genetic targets from central metabolism for optimized carotenoid production. These results further hinted at the effects that seemingly unrelated pathways as well as global regulators can have on carotenoid synthesis and thus also showed the possibility of influencing these through external means, i.e. fermentation parameters or media composition [38]. Apart from the genetic engineering, several other ways of optimizing astaxanthin production were performed previously in C. glutamicum. As it is typically used for amino acid production, a co-production of astaxanthin and l-lysine was established and tested in a 15 L fed-batch fermentation using complex medium [39]. Additionally, we previously published both a batch and fed-batch fermentation process using a minimal medium with the optional addition of aquaculture sidestreams in a 2 L scale [40].
However, both processes suffered from low astaxanthin titers below 10 mg/L. As such we determined that further optimization is necessary to reach commercially relevant product titers.
Industrial scale biotechnological production processes with C. glutamicum have been well established in the industry for several decades [41] as it is used in high-titer production of several amino acids including l-lysine [42] and l-glutamate [43]. As amino acids are secreted products, the cell densities in large scale production processes are deliberately limited [44]. By contrast, carotenoids are biomass-bound products [39]. Hence, a high cell density production process is aimed at for astaxanthin production. Moreover, cultivation in minimal medium is preferred to achieve a reproducible process, which is not disturbed by fluctuations in batch compositions of complex media components [45]. For C. glutamicum, mineral salts, high cell density cultivation (HCDC) media were developed with lignocellulosic acetate [46] or glucose [47] as carbon sources and tested for recombinant protein [48] and l-lysine production, respectively.
For bioprocess intensification, different approaches could be applied. Although being laborious, one factor at a time experiments are still widely used to identify important process variables. However, this makes it impossible to identify combinatorial effects and a large number of experiments are necessary to fully explore the experimental space. Design of experiment (DoE) approaches allow both the identification of combinatorial effects and to minimize the number of necessary experiments and have therefore been applied, especially in bioprocess optimization, as each experiment represents a large investment of time and resources [49,50]. DoE represent a well-established methodology to plan a series of experiments in order to elucidate the impact and correlation of a number of different test-variables to a response variable. Therefore, a DoE approach is suitable to investigate the impact of different bioprocess parameters. It is well known that pH [49,51], aeration rate and rDOS [52] as well as initial inoculum [53] can have wide ranging effects on fermentation processes and can be key to enhancing product yields.
This is why, in this study, we chose these four parameters and analyzed their effects on astaxanthin production with C. glutamicum using a fractional factorial design in batch and fed-batch fermentations.
Figure 1.
Carotenoid biosynthesis in C. glutamicum ASTA*. Gene names are given next to the reactions catalyzed by their gene products, genes overexpressed from the genome are marked in bold, while deleted native genes are marked with a red ∆ above them. GAP: Glyceraldehyde 3-phosphate; IPP: isopenthenyl pyrophosphate; DMAPP: dimethylallyl diphosphate; dxs: 1-deoxy-D-xylulose 5-phosphate synthase; idsA: geranylgeranyl pyrophosphate synthetase; crtE: geranylgeranyl pyrophosphate synthase; crtB: phytoene synthase; crtI: phytoene desaturase; crtEb: lycopene elongase; crtYe/f: ϵ-cyclase; crtY: lycopene β-cyclase from Pantoea ananatis; crtW: β-carotene ketolase from Fulvimarina pelagi; crtZ: β-carotene hydroxylase from Fulvimarina pelagi.
2. Materials and Methods
2.1. Preculture Conditions
All cultivations and fermentation in this study were performed with C. glutamicum ASTA* [21]. Chemicals were delivered by Carl Roth (Karlsruhe, Germany) or VWR International (Radnor, PA, USA) if not stated differently. For inoculation of the bioreactor cultivations a first pre-culture was grown in 50 mL LB medium [54] with addition of 10 g L-1 glucose and 25 µg mL-1 kanamycin in a 500 mL shake flask. An appropriate number of second pre-cultures in 200 mL CGXII minimal medium (20 g L-1 (NH4)2SO4, 1 g L-1 K2HPO4, 1 g L-1 KH2PO4, 5 g L-1 urea, 42 g L-1 MOPS buffer, 0.2 mg L-1 biotin, 30 mg L-1 protocatechuic acid (PCA), 10 mg L-1 CaCl2, 250 mg L-1 MgSO4・7 H2O, trace elements: 10 mg L-1 FeSO4・7 H2O, 10 mg L-1 MnSO4・H2O, 0.02 mg L-1 NiCl2・6 H2O, 0.313 mg L-1 CuSO4・5 H2O, 1 mg L-1 ZnSO4・7 H2O) [55], supplemented with 40 g L-1 glucose and 25 µg mL-1 kanamycin in 2 L shake flasks were inoculated with 1 % (v/v) of the first preculture. The precultures were grown overnight at 30 °C and 120 rpm. Second precultures were combined for inoculation of bioreactors.
2.2. Fermentative Production
Glass bioreactors with a total volume of 3.7 L (KLF, Bioengineering AG, Switzerland) were used for all fermentations. The stirrer to reactor diameter ratio was 0.39 and the aspect ratio of the reactor was 2.6:1.0. The temperature was kept at 30 °C during the fermentations. Samples during the fermentations were collected with autosamplers and cooled down to 4 °C until further use. A Shimadzu UV-1202 spectrophotometer (Duisburg, Germany) was used for OD600 nm measurements. When required, cell dry weight was calculated by dividing OD600 nm by four.
2.2.1. Batch Conditions
For the batch fermentations, two six-bladed Rushton turbines were placed on the stirrer axis with a distance of 6 and 12 cm from the bottom of the reactor. A steady airflow of 0.15 to 0.75 NL min-1 (specified for each experiment in the results section) was maintained from the bottom through a ring-sparger. An automatic control of the stirrer speed between 400 and 1250 rpm kept the relative dissolved oxygen saturation (rDOS) at a given level between 15 and 45 % (specified for each experiment in the results section). A pH of 6.0 to 8.5 (specified for each experiment in the results section) was automatically maintained by the addition of 10 % (v/v) H3PO4 and 4 M KOH. Off-gas CO2 was measured using a MF420-IR-CO2 sensor (LogiDataTech Systems, Baden-Baden, Germany) with a measuring range from 0 to 5% (v/v) CO2. An initial working volume of 2 L CGXII medium without MOPS buffer, supplemented with 40 g L-1 glucose, 25 µg mL-1 kanamycin and 0.6 ml L-1 antifoam 204 (Sigma-Aldrich; St. Louis, MO, USA) was inoculated to an OD600 nm of 0.5 to 2 (specified for each experiment in the results section) from the second pre-culture.
2.2.2. Fed-Batch Conditions
For the fed-batch fermentations three six-bladed Rushton turbines were placed on the stirrer axis with a distance of 6, 12 cm and 18 cm from the bottom of the reactor. Furthermore, a mechanical foam breaker was installed on the stirrer axis with a distance of 22 cm to the bottom of the reactor. The fed-batch fermentations were performed with a head space overpressure of 0.5 bar. A pH of 7.0 or 8.0 was automatically maintained by the addition of 10 % (v/v) H3PO4 and 25 % (v/v) NH3. The fed-batch fermentations were performed with an initial working volume of 1 L HCDC medium (10 g L−1 glucose, 19.75 g L−1 KH2PO4, 39.5 g L−1 K2HPO4, 10 g L−1 (NH4)2SO4, 6.67 g L−1 MgSO4・7 H2O, 0.27 g L−1 CaCl2, 0.53 g L−1 FeSO4・7 H2O, 0.27 g L−1 MnSO4・H2O, 0.027 g L−1 ZnSO4・7 H2O, 0.0053 g L−1 CuSO4, 0.00053 g L−1 NiCl2・6 H2O, 0.0053 g L−1 d(+)-biotin, 0.8 g L−1 PCA) [47], inoculated to an OD600 nm of 1 with the second pre-culture. 1 L 600 g L-1 glucose was used as feed medium. An automatic control increased the stirrer speed from 400 to 1500 rpm every time the relative dissolved oxygen saturation (rDOS) fell below 30 %. The feed was primed when the rDOS fell below 30 % for the first time. The feed pump activated every time the rDOS exceeded 60 % and stopped when it subsequently fell below 60 %, to prevent oversaturation with glucose. A steady airflow of 0.3 to 3.5 NL min-1 was maintained from the bottom through a ring sparger. The airflow was increased manually during the process when the rDOS fell below the desired limit and the agitator was already at its maximum. Foam formation during the fermentation was reduced by addition of 0.6 ml L-1 antifoam 204 to the batch medium and controlled addition of up to 30 ml antifoam 204 via an antifoam probe during the feeding phase.
2.3.1. Quantification of Carotenoids, Carbohydrates and Organic Acids
For all HPLC analyses an Agilent 1200 series system (Agilent Technologies Deutschland GmbH, Böblingen, Germany) was used. Culture samples (200 or 500 µl) were centrifuged at 14000 rpm for 10 min, the supernatants and pellets were stored separately at −20 °C until analysis.
The analysis of carotenoids was performed as previously described [37]. Samples were extracted until the remaining pellet of cell debris was colorless. Carotenoid analysis was performed for all fermentations carried out during this study. For quantification of the carotenoid contents the peak areas detected at 471 nm and calibration curves calculated from authentic standards were used. Astaxanthin, adonirubin, canthaxanthin, echinenone, β-cryptoxanthin, zeaxanthin, β-carotene and lycopene were quantified by comparing the peak area against that of authentic standards. Hydroxyechinenone was calculated as astaxanthin equivalent as there was no authentic standard available. Furthermore, total carotenoids were calculated by converting all measured carotenoid titers to mmol, adding them and then converting back to mg/L of astaxanthin.
The carbohydrates in the cultivation medium were quantified with an organic acid resin column (Organic acid, 300 mm × 8 mm, 10 µm particle size, 25 Å pore diameter; CS-Chromatographie Service GmbH, Langerwehe, Germany) under isocratic conditions with a flow of 0.8 mL min-1 5 mM H2SO4 as described previously [56]. The analytes were detected using a refractive index detector (RID).
2.4. Design of Experiments Setup and Statistical Analysis
The fractional factorial design was generated using R and the rsm package [57,58]. To identify the influence of the factors pH, rDOS, aeration and initial inoculum, we used a fractional factorial cube design (Table 1). The effect of the initial inoculum was confounded with the combined effect of the other three factors (Table 2). Two center points were performed in addition, to test for potential higher level effects. Either the maximum astaxanthin or total carotenoid titer during the process were chosen as response variables.
3. Results
3.1. Design of Experiments for rDOS, Aeration Rate, Initial OD600 nm and pH
To identify the influence of rDOS, aeration rate, initial OD600 nm and pH on the astaxanthin production process, 10 batch fermentations were performed in CGXII medium. These were organized in a fractional factorial cube design and initially based on our previously published batch fermentations [40]. Maximum astaxanthin titers from these runs are shown in Table 2 and Figure 2. In addition, total carotenoid titers were determined and given as astaxanthin equivalents as described in the methods section. These results showed that pH 6 almost completely abolished the formation of any xanthophylls, while pH 8 is beneficial for astaxanthin formation. Effects from the other parameters are harder to distinguish.
To facilitate the analysis of the data we tried fitting a first or second order model. When fitting the latter model, the effect of the two-factor interactions was not significant (Prob > F of 0.82). The first order model however, showed a significant fit (Prob > F of 0.003) and a non-significant lack of fit (Prob > F of 0.86). Additionally, it had an adjusted R2 of 0.89, meaning the first-order model can explain 89 % of the measured variability. Relevant statistical outputs of the regression analysis are shown in Table 3. Overall, the set of DoE fermentations showed a high variance with astaxanthin titers ranging from 0 to 9.84 mg L-1 astaxanthin. The ANOVA indicated a highly significant effect of the pH with regard to the astaxanthin titer, while the other tested variables, namely aeration rate, rDOS and initial OD600 nm showed no significant effects. To further analyze if the pH was masking other potentially significant effects we also performed a Students t-test to only compare changes at the same pH level (Table 4). However, even under these conditions the parameters were not found to be significant.
With regards to the total carotenoids formed, a clear benefit of low pH and low rDOS is visible (Table 2). A model including the two-factor interaction between rDOS and pH, as well as the first order components showed a non-significant lack-of-fit (Prob > F of 0.06), while explaining 70 % of the variability. Further two-factor interactions were omitted as their inclusion only increased the lack-of-fit of the model. Overall, it was possible to increase the total carotenoid titer to 189.77 mg L-1 at low pH, rDOS, aeration and initial OD600 nm, while increasing initial OD600 nm and aeration rate decreased this titer to 103.71 mg L-1. This is an up to ten-fold increase in total carotenoids in comparison to the control condition.
In regards to growth, a significant decrease in growth rates was observed at pH 6 (0.12 ± 0.02 h-1) compared to pH 8 (0.19 ± 0.03 h-1) (Table S1). The maximum CDW was also decreased at pH 6 (5.5 ± 1.4 g L-1) compared to pH 8 (9.4 ± 0.7 g L-1). However, the decrease was not significant due to run 8 showing far higher maximum CDW than the other runs at pH 6.
Detailed information about the carotenoid titers under each condition are shown in Figure S1.
3.2. Validation of Optimal Batch Fermentation Conditions
3.2.1. Further Analysis of the Influence of the Aeration Rate on Astaxanthin Production in Batch Cultivation
The ANOVA indicated no significant effect of the aeration rate on the astaxanthin titer among the tested conditions (Table 4). However, as the pH strongly affected the formation of xanthophylls and might have masked the effect of the aeration rate, we further investigated a potential influence of the aeration rate on the astaxanthin formation. Four batch fermentations were performed with aeration rates of 0.15, 0.25, 0.35 or 0.5 vvm (Figure 3 A-D) and the other parameters were set as follows: rDOS at 30 %, initial OD600 nm of 1 and pH at 7.
The cultures with the lower aeration rates of 0.15 and 0.25 vvm grew to maximum OD600 nm of 52 and 53 (12.9 to 13.4 g CDW L-1) with a growth rate of 0.25 and 0.26 h-1, respectively. At higher aeration rates of 0.35 and 0.5 vvm the growth was slightly impaired with respective growth rates of 0.20 and 0.22 h-1 and maximum OD600 nm of 42 and 46 (10.7 to 11.5 g CDW L-1).
At aeration rates of 0.15 and 0.35 vvm 2.38 mg L-1 and 2.14 mg L-1 astaxanthin were produced respectively, each corresponding to 0.24 mg g-1 CDW. With an even higher aeration rate of 0.5 vvm, i.e. the control condition of the DoE runs, the astaxanthin production dropped to 0.93 mg L-1 (0.11 mg g-1 CDW). An aeration rate of 0.25 vvm led to the highest astaxanthin production of 5.53 mg L-1 (0.61 mg g-1 CDW), with a productivity of 0.12 mg g-1 CDW h-1 (Figure 3 B). In comparison to the other aeration rates, the astaxanthin production was improved about 2-5-fold under these conditions.
To sum up, the aeration rate indeed had an impact on astaxanthin production, optimal production was recorded at an aeration rate 0.25 vvm, as it was already indicated by the DoE approach. Accordingly, all further experiments were conducted with an aeration rate of 0.25 vvm.
3.2.2. Validation of pH 8 as Setpoint for Optimal Astaxanthin Production in Batch Cultivation
The results of the DoE approach highlight the pH as the most important process parameter with regard to maximal astaxanthin titers. During the DoE fermentation runs, only integer pH setpoints were tested. Owing to the high significance of this variable further detailed examination of the pH optimum with regard to astaxanthin production was performed.
Three identical batch fermentations were performed with varied pH setpoints of pH 7.5, 8 and 8.5 (Figure 3 E-G). All other process parameters were kept constant, according to the DoE output (aeration rate of 0.25 vvm, 30 % rDOS and an initial OD600 nm of 1).
The culture at pH 7.5 grew to a maximal biomass concentration of 11.8 g CDW L-1, with a growth rate of 0.26 h-1. Growth was slightly impaired at pH 8, with a reduced growth rate of 0.21 h-1, but comparable biomass formation of 12.6 g CDW L-1. Cultivation at pH 8.5 led to a growth deficit as the culture only grew to a maximal biomass concentration of 8.7 g CDW L-1 with a reduced growth rate of 0.10 h-1. Lowering or increasing the pH setpoint to 7.5 or 8.5, resulted in lower astaxanthin production of 6.07 and 5.91 mg L-1 (0.82 and 0.67 mg g-1 CDW) respectively. Astaxanthin production again was highest at pH 8 with 7.12 mg L-1 (0.81 mg g-1 CDW) of astaxanthin corresponding to a volumetric productivity of 0.15 mg L-1 h-1 and a yield of 0.18 mg g-1 glucose (Figure 3 F).
Considering the total carotenoid production (Figure S2 C, E-G), it becomes apparent, that changes in the pH value do not only impact the astaxanthin production, but also the precursor composition. At pH 7 and 7.5 mainly adonirubin and canthaxanthin accumulated, while at pH 8 lycopene and β-carotene were the predominant precursors being produced.
The cultivation under optimal conditions (pH 8, 0.25 vvm aeration rate, 30 % rDOS, initial OD600 nm of 1) was performed two additional times, adding up to technical triplicates (marked in green in Table S1) with an average astaxanthin titer of 7.61 ± 0.60 mg L-1.
3.2.1. pH-Shift experiments in late exponential phase indicate different pH optima for astaxanthin biosynthesis and its precursor biosynthesis
The DoE results demonstrated that astaxanthin production possesses a pH optimum of 8 (Figure 4 A-D). In contrast, the precursor β-carotene is accumulating to high titers of up to 127 mg L-1 at pH 6 (Figure S1). This indicated that at pH 6 oxy-functionalization to astaxanthin by CrtZ and CrtW is a bottleneck. It was tested whether a two-staged production process starting with a β-carotene accumulating phase at pH 6 followed by a second phase with a pH shift to 8 for conversion to astaxanthin (pH 6→8) is beneficial in comparison to a one-staged bioprocess. Vice versa, a pH shift fermentation was performed starting at pH 8, with a shift to pH 6 at 12 h after inoculation (pH 8→6) (Figure 4 B and D respectively). For comparison, two batch cultivations with a constant pH of 6 or 8 were performed (Figure 4 A and C respectively). All four fermentations were carried out at optimal setpoints (aeration rate of 0.25 vvm; 30 % rDOS and initial OD600 nm of 1) (Figure 4). The fermentation with constant pH 6 showed a strongly impaired growth with a maximum biomass formation of 2.65 g CDW L-1 and a reduced growth rate of 0.12 h-1. Instead, at pH 8, the culture grew to a maximum biomass concentration of 14.25 g CDW L-1 with a growth rate of 0.24 h-1. In comparison, both fermentations with a pH-shift (pH6→8, pH8→6) exhibited slight growth deficits with maximal biomass formation of 10.3 or 11.7 g CDW L-1 and growth rates of 0.21 and 0.23 h-1, respectively. Analysis of the carotenoids revealed that during the fermentation with a constant pH 6 only 0.04 mg L-1 (0.04 mg g-1 CDW) of astaxanthin were produced, while β-carotene accumulated to 18.26 mg L-1 (7.16 mg g-1 CDW) (Figure 4 A).
In the fermentation with a pH-shift from 8 to 6, astaxanthin was mainly produced during the first phase at pH 8 (Figure 4 D). Here 0.33 mg L-1 (0.05 mg g-1 CDW) of astaxanthin accumulated that are comparable to the fermentation with constant pH of 8 at 12 h after inoculation (0.53 mg L-1 (0.07 mg g-1 CDW)) 12 h (Figure 4 C). In the second phase after the pH shift to 6, the astaxanthin content remained low with a maximum production of 0.52 mg L-1 (0.12 mg g-1 CDW). Remarkably, β-carotene also only accumulated during the first phase at pH 8 to a maximum titer of 2.55 mg L-1 (0.37 mg g-1 CDW), whereas β-carotene levels were slowly decreasing in the second phase.
In the two-stage bioprocess with a pH-shift from 6 to 8, no astaxanthin accumulated in the first phase, but in the second phase up to 4.18 mg L-1 (0.57 mg g-1 CDW) of astaxanthin were produced (Figure 4 B). Prior to the pH-shift, β-carotene production was strong and titers comparable to the cultivation with a continuous pH of 6 were reached (19.78 mg L-1 or 4.65 mg g-1 CDW). In the second phase with pH 8, β-carotene was converted to astaxanthin until it started to accumulate again after 30 h of cultivation. It is noteworthy that after the shift form pH 6 to 8, adonirubin and canthaxanthin started to accumulate, while β-carotene remained to be the most abundant precursor (Figure S3 and S4). During the fermentation at continuous pH 8, 7.42 mg L-1 (0.89 mg g-1 CDW) astaxanthin accumulated with a productivity of 0.15 mg L-1 h-1, while β-carotene production remained low (max. 4.57 mg L-1 or 0.32 mg g-1 CDW) (Figure 4 C).
In summary, a two-staged bioprocess with pH-shift (pH 6→8) for (i) initial precursor accumulation and (ii) subsequent conversion to astaxanthin did not increase astaxanthin production. Thus, a one-staged bioprocess with constant pH 8 remains optimal for astaxanthin production.
3.3. Transfer of Optimized Batch Bioprocess Conditions to Fed Batch Bioprocess Accelerated Astaxanthin Production
The optimal conditions for astaxanthin production under batch conditions were transferred to a fed-batch bioprocess. Previously, we used a CGXII based feed solution and while we observed satisfying growth behavior, astaxanthin production was lower than in the best batch fermentations shown here. Additionally, the feed solution showed solubility problems due to high concentrations of phosphate, calcium and magnesium salts [40]. To combat these problems we switched to an established minimal salts HCDC batch medium developed for C. glutamicum [47] with 600 g L-1 glucose as feed solution.
Two fed-batch cultivations were performed in parallel comparing the initial setpoints (0.5 vvm, pH 7) with the optimized batch cultivation conditions (0.25 vvm, pH 8 (Figure 5). Over the course of the process the initial aeration rate was increased manually, to prevent oxygen starvation with increasing cell densities.
Both cultures grew with comparable growth rates of 0.15 and 0.13 h-1 to a maximal biomass concentration of 98 and 60 g CDW L-1 at pH 7 and 8, respectively. In the fermentation at pH 7 55 mg L-1 astaxanthin (0.68 mg g-1 CDW) were produced with a volumetric productivity of 0.73 mg L-1 h-1 and a yield of 0.18 mg g-1 glucose (Figure 5 A). Astaxanthin production at pH 8 surpassed production at pH 7 in all cases. During the fed-batch fermentation at pH 8 64 mg L-1 astaxanthin (1.22 mg g-1 CDW) were produced with a volumetric productivity of 0.85 mg L-1 h-1 and a yield of 0.21 mg g-1 glucose (Figure 5 B).
Considering the total carotenoid output during the fed-batch processes, it can be stated that during both fermentations comparable total carotenoid amounts in astaxanthin equivalents were produced (333 mg L-1 at pH 7 and 317 mg L-1 at pH 8) (Figure S5). Yet, it is remarkable that at pH 7 mostly the direct astaxanthin precursor adonirubin and canthaxanthin accumulated to high amounts (102 and 99 mg L-1 respectively), while at pH 8 these precursors are mostly converted to astaxanthin. Instead, the earlier precursors lycopene and β-carotene accumulated (93 and 94 mg L-1 respectively) during the process at pH 8.
In conclusion, the fed-batch fermentation at pH 8 resulted in the highest astaxanthin titer of 64 mg L-1, which corresponds to an about 9-fold improvement in comparison to the optimized batch process.
4. Discussion
Fermentative astaxanthin production with C. glutamicum was improved in a DoE-guided approach with regard to the process setpoints pH, aeration rate, rDOS and initial optical density in batch and fed-batch mode. The parameter optimization effect was stronger in batch mode (approximately 4-fold improvement compared to control conditions) than it was in fed-batch (approximately 1.2-fold improvement). Compared to the improved batch process the astaxanthin product titer was about 9-fold increased from 7 mg L-1 to 64 mg L-1 in fed-batch fermentation. The more than 4-fold increased maximal biomass formation and the increased astaxanthin content (0.87 to 1.2 mg g-1 CDW) contributed to the improvement. The volumetric productivity improved approx. 6-fold from 0.15 mg L-1 h-1 in batch conditions to 0.86 mg L-1 h-1 in the fed-batch process, while the yield was increased by about 10 % (0.18 and 0.21 mg g-1 glucose respectively). Thus, these three key performance indicators of the high cell density astaxanthin bioprocess could be improved by the described process intensification.
In this study we identified pH as the predominant process parameter to influence growth and carotenoid production of C. glutamicum. C. glutamicum can effectively maintain an intracellular pH of 7.5 ± 0.5 when exposed to external pH values between pH 5.5 and pH 9 [59,60,61]. However, sharp differences were determined in growth and carotenoid production between pH 6, 7 and 8 with the latter one as optimum for astaxanthin production. pH 6 was best for accumulation of the carotenogenic precursor β-carotene whereas both growth rates as well as final biomass titer were reduced. This growth deficiency could be explained with higher oxidative stress at pH 6 in comparison to pH 7.5 or 9 [59]. In contrast, higher oxidative stress levels have shown to influence carotenoid biosynthesis positively in E. coli [62]. Although we did not observe any byproduct formation at pH 6 (data not shown) that could explain a reduced biomass formation as it was previously published with pyruvate accumulation under cultivations at pH 6 [59], it is tempting to speculate that an increased pyruvate availability could boost the methylerythritol phosphate pathway as it serves as its substrate, together with GAP. Indeed, pH 6 was found to be most beneficial for total carotenoid production in this study. The previously observed feedback inhibition from xanthophylls on their precursors [37] likely also plays a role here and could explain the increase in total carotenoids due to the absence of xanthophylls.
NADPH availability was previously identified as a potential bottleneck in carotenoid production with C. glutamicum in BioLector® cultivations at pH 7 [38]. Furthermore, it was reported, that the NADP+/NADPH concentrations are reduced by 50% in C. glutamicum during bioreactor cultivations at pH 6 [59]. This data cannot explain the observations in this study, as the highest total carotenoid (primarily β-carotene) concentrations were measured at pH 6. However, xanthophyll, especially astaxanthin, production was almost fully inhibited at pH 6 and maximal at pH 8. As β-carotene biosynthesis from glucose requires 16 NADPH either directly or transferred via ferredoxin, while terminal astaxanthin biosynthesis requires only 6 reduction equivalents, a limitation in reduction equivalents is not a likely explanation for the inhibited astaxanthin production. pH-shift fermentations suggested that the conversion towards astaxanthin was abolished at pH 6 but biosynthesis could be quickly restored after the pH shift to 8. The enzyme CrtZ~W represents a translational fusion of the β-carotene hydroxylase (CrtZ) and β-carotene ketolase (CrtW) from the marine bacterium F. pelagi. It was exemplified for the xylose isomerase (XI) from F. pelagi that it exhibits its maximum catalytic activity in a pH range from 6.3 to greater than 7.8, while the activity decreased by 70 % at pH 6 [63] corresponding to the alkaline conditions of the ocean with a pH of 8.1 [64]. To the best of our knowledge no enzyme assay data are available for the Crt enzymes of F. pelagi. In vitro assays for other CrtZ and CrtW proofed enzyme activities at pH 8 [65] and pH 7.6 [66] but without the determination of the pH optima.
A comparison of the pH optimum for astaxanthin production is not trivial between different hosts, but it can be summarized that processes have been performed at neutral pH 7.2 for P. carotinifaciens [68] or pH 7 for E. coli [69,70] and Haematococcus pluvialis [71] or at acidic pH, e.g. with yeasts Y. lipolytica [16] and S. cerevisiae [17] at pH 5.5 and 5.8, respectively. The identification of an alkaline pH as optimal for astaxanthin formation is a novelty within this study.
Two other important physical parameters, namely aeration rate and rDOS setpoint controlled via agitation, were identified in this study showing a clear effect on total carotenoid formation at low pH. Additionally, we could later also show that the aeration rate in fact has an effect on astaxanthin formation.
Sufficient oxygen supply is essential for aerobic organisms like C. glutamicum and is influenced by aeration and agitation as bioprocess parameters. However, changing these parameters does not only affect oxygen but also CO2 levels in the fermentation [72,73,74]. As was shown in the initial set of batch fermentations, both aeration and agitation strongly influence the total carotenoid content of the cells, albeit only at pH 6. This low pH further supports the effect being caused by the pCO2 as it moves the reaction balance towards gaseous CO2 and therefore eases off gassing. In addition, changes in aeration rate should only influence CO2 levels as the rDOS is kept constant by changing the stirring rate. This is further supported by changes in off-gas CO2 concentrations we measured. Increasing the rDOS setpoint from 15% to 30% almost doubled the average off-gas CO2 from 1.6 to 3.5% while increasing aeration increased it from 2.2 to 3% (Figure S6). At higher pH a positive effect is still visible, however here we observed an increase in the transformation of β-carotene and intermediates into astaxanthin.
Several studies have focused on the effects of CO2 on C. glutamicum [75,76,77]. Low CO2 concentrations have been shown to increase the thiamine production that represents a competing pathway to the MEP pathway and therefore might reduce carotenoid production. An increased thiamin concentration enables a higher flux through the pyruvate dehydrogenase complex and pyruvate:quinone oxidoreductase that could potentially reduce the available pool of pyruvate and GAP for the MEP pathway [77]. A reduced biomass per substrate yield was observed under low CO2 conditions whereas under high CO2 conditions Blombach et al. observed increased biomass per substrate yields, likely due to changes in the anaplerotic node of C. glutamicum [77]. Correspondingly, in this study a declining biomass formation was observed at pH 6, when combined with high aeration and rDOS that supports the hypothesis that these effects are primarily pCO2 caused. This might explain both the benefits for total carotenoid as well as astaxanthin production that we observed under low aeration and agitation [77].
Moreover, Blombach et al. 2013 observed a differential expression of the dtxR regulon under high CO2 concentrations, indicating an increased availability of reduced iron and subsequently a reduced expression of genes involved in iron uptake [77]. Another study showed that CO2 plays a direct role in the reduction of iron in complexes with PCA or other phenolic compounds [78]. It is tempting to speculate that an increase in reduced iron caused by the low aeration rate has a positive effect on the iron-dependent enzymes CrtZ and CrtW from astaxanthin biosynthesis [65]. It can be hypothesized that the positive effects from the low aeration are based on an increased availability of reduced iron. This is further supported by the inhibition of xanthophyll synthesis at a low pH, as it has been previously shown that a low pH induces the iron-starvation response in C. glutamicum [59]. As such both effects combined could explain the complete absence of astaxanthin at low pH while aeration and rDOS are high.
Under low CO2 conditions it was shown that the ferredoxin gene cysX (cg3117 / WP_011266012.1) and the ferredoxin reductase gene fpr2 (cg3119 / WP_011015406.1) were significantly downregulated [77] Both the β-carotene hydroxylase CrtZ [66] as well as several steps in the MEP pathway (e.g. IspG [79]) are ferredoxin dependent and could be negatively impacted [34]. While the ferredoxin CysX and Fpr2 have been shown to be important for sulfur assimilation, their effect on carotenoid biosynthesis in C. glutamicum is unknown [80].
In addition, altered levels of CO2 could directly change the membrane fluidity [75,81]. Different CO2 concentrations were shown to result in differentially expressed genes encoding for membrane proteins that could lead to changes in membrane fluidity [77]. In fact, it is well known that carotenoids influence membrane fluidity and their biosynthesis could therefore also be sensitive to membrane changes [82]. As membrane engineering has been demonstrated as a strategy for enhanced carotenoid production [83], the possible effect of CO2 on membrane fluidity is interesting for future research. Although most of the membrane proteins are of unknown function [77] similar observations have been made in P. aeruginosa [84] and many other organisms [85].
Our previous work on astaxanthin production with C. glutamicum ASTA* presented a batch fermentation in CGXII medium at pH 7 with an aeration rate of 0.5 vvm, rDOS of 30 % and an initial OD600 nm of 2 [40] achieving an astaxanthin titer of 3.12 mg L-1 [40]. With the here presented optimized process parameters the astaxanthin titer was more than doubled.
Our previous fed-batch attempt with C. glutamicum ASTA* was performed in CGXII supplemented with an aquaculture sidestream as batch and a CGXII concentrate as feed [40]. This led to an 3.5-fold increase in biomass formation compared to batch conditions, while the astaxanthin titer only increased 1.3-fold (6 mg L-1) [40]. Here biomass and astaxanthin titer were improved 4-fold and 9-fold, respectively, by fed-batch fermentation, indicating the superiority of the HCDC medium. The HCDC medium has proven to result in biomass titers of 227 g L-1 CDW based on a 900 g L-1 glucose feed [47], suggesting that astaxanthin production may be further improved with higher glucose concentration in the feed.
Our previous studies on the metabolic engineering of C. glutamicum for astaxanthin indicated that a feedback regulation of the lycopene β-cyclase or further upstream in the carotenoid biosynthetic pathway might limit the overall production [21,37]. This phenomenon is widely described in literature for other microbial hosts such as H. pluvialis [86] and E. coli [20]. As this feedback inhibition has not been solved with metabolic engineering strategies yet, a two-staged bioprocess for optimized precursor and terminal biosynthesis might tackle the challenges of feedback inhibition. The pH-shift experiments in this study revealed, that a two-staged bioprocess to tackle the feedback inhibition in the astaxanthin biosynthesis [37] and to decouple precursor and production formation was not beneficial under the tested batch conditions. It is noteworthy that after the pH shift from pH 6 to 8, adonirubin and canthaxanthin started to accumulate, while β-carotene remained the most abundant precursor. This indicates that CrtW and CrtZ remain bottlenecks after the pH shift in the presented batch process as β-carotene was only partially converted into astaxanthin. In summary, a constant pH 8 remains to be the optimal condition for astaxanthin production in batch mode so far. A two-staged process might still be beneficial in a fed-batch mode when considering all process parameters to be adapted for an optimized precursor production, namely ß-carotene, during the first stage of the bioprocess.
Astaxanthin production by P. rhodozyma was optimized in shake flasks with temperature and carbon concentration as the most impactful process parameters [87]. Accordingly, the cultivation temperature could be optimized for of the here presented process as all fermentations in this study at 30 °C as the standard temperature for C. glutamicum [55]. Furthermore, optimization of the initial carbon concentration, as well as an adapted feed protocol for the fed-batch fermentations may be beneficial. As the current feed protocol relies on recurring carbons starvation, a feed profile which is optimized for a steady carbon concentration or is adapted for exponential growth may be advantageous for product formation [88,89,90].
In this study astaxanthin production by C. glutamicum was successfully transferred from shake flask cultivation to stirred tank batch and fed-batch processes. In regard to an industrial application, a repeated fed-batch or a continuous process strategy may be applied [91]. Both strategies allow for high cell densities [92,93,94] and are designed for frequent or continuous product output, respectively. Furthermore, the current production volume of 2 L would need to be enlarged for an industrial application. A traditional way to scale-up biotechnological processes is to choose one scale-up criterion like the oxygen volumetric mass transfer coefficient (kLa) or the power input per unit volume (P/V) and keep them constant throughout larger scales [95]. From this point of view, the transfer to a continuous process could be one strategy to optimize (P/V) in small scale and later use it as criterion for scale up.
Supplementary Materials
The following supporting information can be downloaded at the website of this paper posted on Preprints.org. Figure S1: Carotenoid titers of C. glutamicum ASTA* at the time of maximum astaxanthin titer of each DoE run.; Figure S2: Carotenoid titers and biomass formation of C. glutamicum ASTA* during batch fermentations at different aeration rates and pH.; Figure S3: Carotenoids titers and biomass formation of C. glutamicum ASTA* during batch fermentations at different pH values and with pH-shifts.; Figure S4: Cellular carotenoid contents of C. glutamicum ASTA* during fermentations at different pH values and with pH-shifts.; Figure S5: Carotenoid titers and biomass formation of C. glutamicum ASTA* during fed-batch fermentations.; Table S1: Fermentation parameters, astaxanthin production and growth indicators.
Author Contributions
Conceptualization, F.M., I.S., V.F.W. and N.A.H.; investigation, F.M. and I.S.; resources: T.S.; writing—original draft preparation, I.S. and F.M..; writing—review and editing, V.F.W. and N.A.H.; supervision, V.F.W. and N.A.H.; project administration, N.A.H.; funding acquisition, V.F.W. and N.A.H. All authors have read and agreed to the published version of the manuscript.
Funding
This research was funded by the German Federal Ministry of Education and Research (BMBF) project KaroTec (grant number: 03VP09460). IS, FM, and NAH acknowledge funding by the ERA CoBlueBio project SIDESTREAM cofunded by the BMBF (grant number: 161B0950A). Support for the article processing charge by the Deutsche Forschungsgemeinschaft and the Open Access Publication Fund of Bielefeld University is acknowledged. The funding bodies had no role in the design of the study or the collection, analysis, or interpretation of data, or in writing the manuscript.
Institutional Review Board Statement
Not applicable.
Informed Consent Statement
Not applicable.
Data Availability Statement
All data are presented in the manuscript and its supplementary material.
Acknowledgments
We thank Joe Max Risse from Fermentation Technology, Technical Faculty and CeBiTec, Bielefeld University, for technical assistance and advice. Furthermore, we thank Petra Peters-Wendisch from the Institute for Genetics of Prokaryotes, Faculty of Biology and CeBiTec, Bielefeld University for scientific discussion. Additionally, we thank Alina Witt for assistance during the DoE fermentation runs and Charlotte Bramers for assistance with preliminary fermentation tests.
Conflicts of Interest
The authors declare no conflict of interest.
References
- Naguib, Y.M.A. Antioxidant Activities of Astaxanthin and Related Carotenoids. Journal of Agricultural and Food Chemistry 2000, 48, 1150–1154. [Google Scholar] [CrossRef]
- Dose, J.; Matsugo, S.; Yokokawa, H.; Koshida, Y.; Okazaki, S.; Seidel, U.; Eggersdorfer, M.; Rimbach, G.; Esatbeyoglu, T. Free Radical Scavenging and Cellular Antioxidant Properties of Astaxanthin. International Journal of Molecular Sciences 2016, 17, 103. [Google Scholar] [CrossRef] [PubMed]
- Pereira da Costa, D.; Campos Miranda-Filho, K. The Use of Carotenoid Pigments as Food Additives for Aquatic Organisms and Their Functional Roles. Reviews in Aquaculture 2020, 12, 1567–1578. [Google Scholar] [CrossRef]
- Zhang, L.; Wang, H. Multiple Mechanisms of Anti-Cancer Effects Exerted by Astaxanthin. Marine Drugs 2015, 13, 4310–4330. [Google Scholar] [CrossRef] [PubMed]
- Chang, M.X.; Xiong, F. Astaxanthin and Its Effects in Inflammatory Responses and Inflammation-Associated Diseases: Recent Advances and Future Directions. Molecules 2020, 25, 5342. [Google Scholar] [CrossRef] [PubMed]
- Giannaccare, G.; Pellegrini, M.; Senni, C.; Bernabei, F.; Scorcia, V.; Cicero, A.F.G. Clinical Applications of Astaxanthin in the Treatment of Ocular Diseases: Emerging Insights. Marine Drugs 2020, 18, 239. [Google Scholar] [CrossRef]
- Pereira, C.P.M.; Souza, A.C.R.; Vasconcelos, A.R.; Prado, P.S.; Name, J.J. Antioxidant and Anti-inflammatory Mechanisms of Action of Astaxanthin in Cardiovascular Diseases (Review). International Journal of Molecular Medicine 2021, 47, 37–48. [Google Scholar] [CrossRef]
- Li, J.; Guo, C.; Wu, J. Astaxanthin in Liver Health and Disease: A Potential Therapeutic Agent. Drug Design, Development and Therapy 2020, 14, 2275–2285. [Google Scholar] [CrossRef]
- Oliyaei, N.; Moosavi-Nasab, M.; Tanideh, N.; Iraji, A. Multiple Roles of Fucoxanthin and Astaxanthin against Alzheimer’s Disease: Their Pharmacological Potential and Therapeutic Insights. Brain Research Bulletin 2023, 193, 11–21. [Google Scholar] [CrossRef]
- Shen, D.-F.; Qi, H.-P.; Ma, C.; Chang, M.-X.; Zhang, W.-N.; Song, R.-R. Astaxanthin Suppresses Endoplasmic Reticulum Stress and Protects against Neuron Damage in Parkinson’s Disease by Regulating miR-7/SNCA Axis. Neuroscience Research 2021, 165, 51–60. [Google Scholar] [CrossRef]
- Grand-View-Research Astaxanthin Market Size, Share & Trends Analysis Report By Product (Oil, Softgel, Liquid), By Source (Natural, Synthetic), By Application (Aquaculture & Animal Feed, Nutraceuticals), By Region, And Segment Forecasts, 2021 - 2028. 2021.
- Lim, K.C.; Yusoff, F.Md.; Shariff, M.; Kamarudin, M.S. Astaxanthin as Feed Supplement in Aquatic Animals. Reviews in Aquaculture 2018, 10, 738–773. [Google Scholar] [CrossRef]
- Butler, T.; Golan, Y. Astaxanthin Production from Microalgae. In Microalgae Biotechnology for Food, Health and High Value Products; Alam, Md.A., Xu, J.-L., Wang, Z., Eds.; Springer: Singapore, 2020; ISBN 9789811501692. [Google Scholar]
- Stachowiak, B.; Szulc, P. Astaxanthin for the Food Industry. Molecules 2021, 26, 2666. [Google Scholar] [CrossRef]
- Ma, Y.; Li, J.; Huang, S.; Stephanopoulos, G. Targeting Pathway Expression to Subcellular Organelles Improves Astaxanthin Synthesis in Yarrowia Lipolytica. Metabolic Engineering 2021, 68, 152–161. [Google Scholar] [CrossRef]
- Tramontin, L.R.R.; Kildegaard, K.R.; Sudarsan, S.; Borodina, I. Enhancement of Astaxanthin Biosynthesis in Oleaginous Yeast Yarrowia Lipolytica via Microalgal Pathway. Microorganisms 2019, 7, 472. [Google Scholar] [CrossRef]
- Jiang, G.; Yang, Z.; Wang, Y.; Yao, M.; Chen, Y.; Xiao, W.; Yuan, Y. Enhanced Astaxanthin Production in Yeast via Combined Mutagenesis and Evolution. Biochemical Engineering Journal 2020, 156, 107519. [Google Scholar] [CrossRef]
- Hayashi, M.; Ishibashi, T.; Kuwahara, D.; Hirasawa, K. Commercial Production of Astaxanthin with Paracoccus Carotinifaciens. In Carotenoids: Biosynthetic and Biofunctional Approaches; Misawa, N., Ed.; Advances in Experimental Medicine and Biology; Springer: Singapore, 2021; ISBN 9789811573606. [Google Scholar]
- Park, S.Y.; Binkley, R.M.; Kim, W.J.; Lee, M.H.; Lee, S.Y. Metabolic Engineering of Escherichia Coli for High-Level Astaxanthin Production with High Productivity. Metabolic Engineering 2018, 49, 105–115. [Google Scholar] [CrossRef] [PubMed]
- Zhang, C.; Seow, V.Y.; Chen, X.; Too, H.-P. Multidimensional Heuristic Process for High-Yield Production of Astaxanthin and Fragrance Molecules in Escherichia Coli. Nat Commun 2018, 9, 1858. [Google Scholar] [CrossRef] [PubMed]
- Henke, N.A.; Wendisch, V.F. Improved Astaxanthin Production with Corynebacterium Glutamicum by Application of a Membrane Fusion Protein. Marine Drugs 2019, 17, 621. [Google Scholar] [CrossRef] [PubMed]
- Seeger, J.; Wendisch, V.F.; Henke, N.A. Extraction and Purification of Highly Active Astaxanthin from Corynebacterium Glutamicum Fermentation Broth. Marine Drugs 2023, 21, 530. [Google Scholar] [CrossRef] [PubMed]
- Krubasik, P.; Takaichi, S.; Maoka, T.; Kobayashi, M.; Masamoto, K.; Sandmann, G. Detailed Biosynthetic Pathway to Decaprenoxanthin Diglucoside in Corynebacterium Glutamicum and Identification of Novel Intermediates. Archives of Microbiology 2001, 176, 217–223. [Google Scholar] [CrossRef] [PubMed]
- Heider, S.A.E.; Peters-Wendisch, P.; Netzer, R.; Stafnes, M.; Brautaset, T.; Wendisch, V.F. Production and Glucosylation of C50 and C40 Carotenoids by Metabolically Engineered Corynebacterium Glutamicum. Applied Microbiology and Biotechnology 2014, 98, 1223–1235. [Google Scholar] [CrossRef] [PubMed]
- Heider, S.A.E.; Peters-Wendisch, P.; Wendisch, V.F. Carotenoid Biosynthesis and Overproduction in Corynebacterium Glutamicum. BMC Microbiology 2012, 12, 198. [Google Scholar] [CrossRef] [PubMed]
- Li, C.; Swofford, C.A.; Rückert, C.; Chatzivasileiou, A.O.; Ou, R.W.; Opdensteinen, P.; Luttermann, T.; Zhou, K.; Stephanopoulos, G.; Jones Prather, K.L.; et al. Heterologous Production of α-Carotene in Corynebacterium Glutamicum Using a Multi-Copy Chromosomal Integration Method. Bioresource Technology 2021, 341, 125782. [Google Scholar] [CrossRef]
- Taniguchi, H.; Henke, N.A.; Heider, S.A.E.; Wendisch, V.F. Overexpression of the Primary Sigma Factor Gene sigA Improved Carotenoid Production by Corynebacterium Glutamicum : Application to Production of β-Carotene and the Non-Native Linear C50 Carotenoid Bisanhydrobacterioruberin. Metabolic Engineering Communications 2017, 4, 1–11. [Google Scholar] [CrossRef]
- Henke, N.A.; Heider, S.A.E.; Hannibal, S.; Wendisch, V.F.; Peters-Wendisch, P. Isoprenoid Pyrophosphate-Dependent Transcriptional Regulation of Carotenogenesis in Corynebacterium Glutamicum. Frontiers in Microbiology 2017, 8. [Google Scholar] [CrossRef] [PubMed]
- Henke, N.A.; Heider, S.; Peters-Wendisch, P.; Wendisch, V. Production of the Marine Carotenoid Astaxanthin by Metabolically Engineered Corynebacterium Glutamicum. Marine Drugs 2016, 14, 124. [Google Scholar] [CrossRef] [PubMed]
- Kang, M.-K.; Eom, J.-H.; Kim, Y.; Um, Y.; Woo, H.M. Biosynthesis of Pinene from Glucose Using Metabolically-Engineered Corynebacterium Glutamicum. Biotechnol Lett 2014, 36, 2069–2077. [Google Scholar] [CrossRef]
- Frohwitter, J.; Heider, S.A.E.; Peters-Wendisch, P.; Beekwilder, J.; Wendisch, V.F. Production of the Sesquiterpene (+)-Valencene by Metabolically Engineered Corynebacterium Glutamicum. Journal of Biotechnology 2014, 191, 205–213. [Google Scholar] [CrossRef]
- Ravikumar, S.; Woo, H.M.; Choi, J.-I. Analysis of Novel Antioxidant Sesquarterpenes (C35 Terpenes) Produced in Recombinant Corynebacterium Glutamicum. Appl Biochem Biotechnol 2018, 186, 525–534. [Google Scholar] [CrossRef]
- Henke, N.A.; Wichmann, J.; Baier, T.; Frohwitter, J.; Lauersen, K.J.; Risse, J.M.; Peters-Wendisch, P.; Kruse, O.; Wendisch, V.F. Patchoulol Production with Metabolically Engineered Corynebacterium Glutamicum. Genes 2018, 9, 219. [Google Scholar] [CrossRef]
- Lim, H.; Park, J.; Woo, H.M. Overexpression of the Key Enzymes in the Methylerythritol 4-Phosphate Pathway in Corynebacterium Glutamicum for Improving Farnesyl Diphosphate-Derived Terpene Production. J. Agric. Food Chem. 2020, 68, 10780–10786. [Google Scholar] [CrossRef] [PubMed]
- Heider, S.A.E.; Wolf, N.; Hofemeier, A.; Peters-Wendisch, P.; Wendisch, V.F. Optimization of the IPP Precursor Supply for the Production of Lycopene, Decaprenoxanthin and Astaxanthin by Corynebacterium Glutamicum. Frontiers in Bioengineering and Biotechnology 2014, 2. [Google Scholar] [CrossRef]
- Henke, N.A.; Austermeier, S.; Grothaus, I.L.; Götker, S.; Persicke, M.; Peters-Wendisch, P.; Wendisch, V.F. Corynebacterium Glutamicum CrtR and Its Orthologs in Actinobacteria: Conserved Function and Application as Genetically Encoded Biosensor for Detection of Geranylgeranyl Pyrophosphate. IJMS 2020, 21, 5482. [Google Scholar] [CrossRef]
- Göttl, V.L.; Pucker, B.; Wendisch, V.F.; Henke, N.A. Screening of Structurally Distinct Lycopene β-Cyclases for Production of the Cyclic C40 Carotenoids β-Carotene and Astaxanthin by Corynebacterium Glutamicum. J. Agric. Food Chem. 2023. [Google Scholar] [CrossRef] [PubMed]
- Göttl, V.L.; Schmitt, I.; Braun, K.; Peters-Wendisch, P.; Wendisch, V.F.; Henke, N.A. CRISPRi-Library-Guided Target Identification for Engineering Carotenoid Production by Corynebacterium Glutamicum. Microorganisms 2021, 9, 670. [Google Scholar] [CrossRef] [PubMed]
- Henke, N.A.; Wiebe, D.; Pérez-García, F.; Peters-Wendisch, P.; Wendisch, V.F. Coproduction of Cell-Bound and Secreted Value-Added Compounds: Simultaneous Production of Carotenoids and Amino Acids by Corynebacterium Glutamicum. Bioresource Technology 2018, 247, 744–752. [Google Scholar] [CrossRef] [PubMed]
- Schmitt, I.; Meyer, F.; Krahn, I.; Henke, N.A.; Peters-Wendisch, P.; Wendisch, V.F. From Aquaculture to Aquaculture: Production of the Fish Feed Additive Astaxanthin by Corynebacterium Glutamicum Using Aquaculture Sidestream. Molecules 2023, 28, 1996. [Google Scholar] [CrossRef]
- Wendisch, V.F. Metabolic Engineering Advances and Prospects for Amino Acid Production. Metabolic Engineering 2020, 58, 17–34. [Google Scholar] [CrossRef]
- Liu, J.; Xu, J.-Z.; Rao, Z.-M.; Zhang, W.-G. Industrial Production of L-Lysine in Corynebacterium Glutamicum: Progress and Prospects. Microbiological Research 2022, 262, 127101. [Google Scholar] [CrossRef]
- Hirasawa, T.; Wachi, M. Glutamate Fermentation-2: Mechanism of l-Glutamate Overproduction in Corynebacterium Glutamicum. In Amino Acid Fermentation; Yokota, A., Ikeda, M., Eds.; Advances in Biochemical Engineering/Biotechnology; Springer Japan: Tokyo, 2017; ISBN 978-4-431-56520-8. [Google Scholar]
- Kircher, M.; Pfefferle, W. The Fermentative Production of L-Lysine as an Animal Feed Additive. Chemosphere 2001, 43, 27–31. [Google Scholar] [CrossRef]
- Burgardt, A.; Prell, C.; Wendisch, V.F. Utilization of a Wheat Sidestream for 5-Aminovalerate Production in Corynebacterium Glutamicum. Front Bioeng Biotechnol 2021, 9, 732271. [Google Scholar] [CrossRef]
- Kiefer, D.; Merkel, M.; Lilge, L.; Hausmann, R.; Henkel, M. High Cell Density Cultivation of Corynebacterium Glutamicum on Bio-Based Lignocellulosic Acetate Using pH-Coupled Online Feeding Control. Bioresour Technol 2021, 340, 125666. [Google Scholar] [CrossRef]
- Knoll, A.; Bartsch, S.; Husemann, B.; Engel, P.; Schroer, K.; Ribeiro, B.; Stöckmann, C.; Seletzky, J.; Büchs, J. High Cell Density Cultivation of Recombinant Yeasts and Bacteria under Non-Pressurized and Pressurized Conditions in Stirred Tank Bioreactors. Journal of Biotechnology 2007, 132, 167–179. [Google Scholar] [CrossRef]
- Kiefer, D.; Tadele, L.R.; Lilge, L.; Henkel, M.; Hausmann, R. High-Level Recombinant Protein Production with Corynebacterium Glutamicum Using Acetate as Carbon Source. Microbial Biotechnology 2022, 15, 2744–2757. [Google Scholar] [CrossRef] [PubMed]
- Schewe, H.; Kreutzer, A.; Schmidt, I.; Schubert, C.; Schrader, J. High Concentrations of Biotechnologically Produced Astaxanthin by Lowering pH in a Phaffia Rhodozyma Bioprocess. Biotechnol Bioproc E 2017, 22, 319–326. [Google Scholar] [CrossRef]
- Mandenius, C.-F.; Brundin, A. Bioprocess Optimization Using Design-of-Experiments Methodology. Biotechnology Progress 2008, 24, 1191–1203. [Google Scholar] [CrossRef] [PubMed]
- Park, P.K.; Cho, D.H.; Kim, E.Y.; Chu, K.H. Optimization of Carotenoid Production by Rhodotorula Glutinis Using Statistical Experimental Design. World J Microbiol Biotechnol 2005, 21, 429–434. [Google Scholar] [CrossRef]
- Prell, C.; Burgardt, A.; Meyer, F.; Wendisch, V.F. Fermentative Production of L-2-Hydroxyglutarate by Engineered Corynebacterium Glutamicum via Pathway Extension of l-Lysine Biosynthesis. Front Bioeng Biotechnol 2021, 8, 630476. [Google Scholar] [CrossRef] [PubMed]
- Pérez-Rodríguez, N.; Pinheiro de Souza Oliveira, R.; Torrado Agrasar, A.M.; Domínguez, J.M. Ferulic Acid Transformation into the Main Vanilla Aroma Compounds by Amycolatopsis Sp. ATCC 39116. Appl Microbiol Biotechnol 2016, 100, 1677–1689. [Google Scholar] [CrossRef] [PubMed]
- Bertani, G. STUDIES ON LYSOGENESIS I: The Mode of Phage Liberation by Lysogenic Escherichia Coli. J Bacteriol 1951, 62, 293–300. [Google Scholar] [CrossRef] [PubMed]
- Eggeling, L.; Reyes, O. Experiments. In Handbook of Corynebacterium glutamicum; CRC Press: Boca Raton, FL, USA, 2005; pp. 3535–3566. [Google Scholar]
- Schneider, J.; Niermann, K.; Wendisch, V.F. Production of the Amino Acids L-Glutamate, l-Lysine, l-Ornithine and l-Arginine from Arabinose by Recombinant Corynebacterium Glutamicum. J Biotechnol 2011, 154, 191–198. [Google Scholar] [CrossRef] [PubMed]
- Lenth, R.V. Response-Surface Methods in R, Using Rsm. Journal of Statistical Software 2010, 32, 1–17. [Google Scholar] [CrossRef]
- Lenth, R. Response-Surface Analysis 2021.
- Follmann, M.; Ochrombel, I.; Krämer, R.; Trötschel, C.; Poetsch, A.; Rückert, C.; Hüser, A.; Persicke, M.; Seiferling, D.; Kalinowski, J.; et al. Functional Genomics of pH Homeostasis in Corynebacterium Glutamicum Revealed Novel Links between pH Response, Oxidative Stress, Iron Homeostasis and Methionine Synthesis. BMC Genomics 2009, 10, 621. [Google Scholar] [CrossRef]
- Jakob, K.; Satorhelyi, P.; Lange, C.; Wendisch, V.F.; Silakowski, B.; Scherer, S.; Neuhaus, K. Gene Expression Analysis of Corynebacterium Glutamicum Subjected to Long-Term Lactic Acid Adaptation. Journal of Bacteriology 2007, 189, 5582–5590. [Google Scholar] [CrossRef]
- Täuber, S.; Blöbaum, L.; Wendisch, V.F.; Grünberger, A. Growth Response and Recovery of Corynebacterium Glutamicum Colonies on Single-Cell Level Upon Defined pH Stress Pulses. Frontiers in Microbiology 2021, 12. [Google Scholar] [CrossRef]
- Lu, Q.; Liu, J.-Z. Enhanced Astaxanthin Production in Escherichia Coli via Morphology and Oxidative Stress Engineering. J. Agric. Food Chem. 2019, 67, 11703–11709. [Google Scholar] [CrossRef] [PubMed]
- Lajoie, C.A.; Kitner, J.B.; Potochnik, S.J.; Townsend, J.M.; Beatty, C.C.; Kelly, C.J. Cloning, Expression and Characterization of Xylose Isomerase from the Marine Bacterium Fulvimarina Pelagi in Escherichia Coli. Biotechnology Progress 2016, 32, 1230–1237. [Google Scholar] [CrossRef] [PubMed]
- Garcia-Soto, C.; Cheng, L.; Caesar, L.; Schmidtko, S.; Jewett, E.B.; Cheripka, A.; Rigor, I.; Caballero, A.; Chiba, S.; Báez, J.C.; et al. An Overview of Ocean Climate Change Indicators: Sea Surface Temperature, Ocean Heat Content, Ocean pH, Dissolved Oxygen Concentration, Arctic Sea Ice Extent, Thickness and Volume, Sea Level and Strength of the AMOC (Atlantic Meridional Overturning Circulation). Frontiers in Marine Science 2021, 8. [Google Scholar]
- Fraser, P.D.; Miura, Y.; Misawa, N. In Vitro Characterization of Astaxanthin Biosynthetic Enzymes *. Journal of Biological Chemistry 1997, 272, 6128–6135. [Google Scholar] [CrossRef]
- Bouvier, F.; Keller, Y.; d’Harlingue, A.; Camara, B. Xanthophyll Biosynthesis: Molecular and Functional Characterization of Carotenoid Hydroxylases from Pepper Fruits (Capsicum Annuum L.). Biochim Biophys Acta 1998, 1391, 320–328. [Google Scholar] [CrossRef]
- Cho, J.-C.; Giovannoni, S.J. Fulvimarina Pelagi Gen. Nov., Sp. Nov., a Marine Bacterium That Forms a Deep Evolutionary Lineage of Descent in the Order “Rhizobiales.” Int J Syst Evol Microbiol 2003, 53, 1853–1859. [Google Scholar] [CrossRef]
- Hirasawa, K.; Yoneda, H.; Yata, T.; Azuma, M. Method for Producing Astaxanthin by Fermentation 2013, 15.
- Zhang, M.; Gong, Z.; Tang, J.; Lu, F.; Li, Q.; Zhang, X. Improving Astaxanthin Production in Escherichia Coli by Co-Utilizing CrtZ Enzymes with Different Substrate Preference. Microbial Cell Factories 2022, 21, 71. [Google Scholar] [CrossRef] [PubMed]
- Gong, Z.; Wang, H.; Tang, J.; Bi, C.; Li, Q.; Zhang, X. Coordinated Expression of Astaxanthin Biosynthesis Genes for Improved Astaxanthin Production in Escherichia Coli. J. Agric. Food Chem. 2020, 68, 14917–14927. [Google Scholar] [CrossRef]
- Kwak, H.S.; Kim, J.Y.H.; Sim, S.J. A Microreactor System for Cultivation of Haematococcus Pluvialis and Astaxanthin Production. Journal of Nanoscience and Nanotechnology 2015, 15, 1618–1623. [Google Scholar] [CrossRef] [PubMed]
- Ahmad, M.N.; Holland, C.R.; McKay, G. Mass Transfer Studies in Batch Fermentation: Mixing Characteristics. Journal of Food Engineering 1994, 23, 145–158. [Google Scholar] [CrossRef]
- Nyiri, L.; Lengyel, Z.L. Studies on Ventilation of Culture Broths. I. Behavior of CO2 in Model Systems. Biotechnology and Bioengineering 1968, 10, 133–150. [Google Scholar] [CrossRef]
- Royce, P.N.C.; Thornhill, N.F. Estimation of Dissolved Carbon Dioxide Concentrations in Aerobic Fermentations. AIChE J. 1991, 37, 1680–1686. [Google Scholar] [CrossRef]
- Bäumchen, C.; Knoll, A.; Husemann, B.; Seletzky, J.; Maier, B.; Dietrich, C.; Amoabediny, G.; Büchs, J. Effect of Elevated Dissolved Carbon Dioxide Concentrations on Growth of Corynebacterium Glutamicum on D-Glucose and L-Lactate. J Biotechnol 2007, 128, 868–874. [Google Scholar] [CrossRef] [PubMed]
- Buchholz, J.; Graf, M.; Freund, A.; Busche, T.; Kalinowski, J.; Blombach, B.; Takors, R. CO2/HCO3− Perturbations of Simulated Large Scale Gradients in a Scale-down Device Cause Fast Transcriptional Responses in Corynebacterium Glutamicum. Appl Microbiol Biotechnol 2014, 98, 8563–8572. [Google Scholar] [CrossRef]
- Blombach, B.; Buchholz, J.; Busche, T.; Kalinowski, J.; Takors, R. Impact of Different CO2/HCO3− Levels on Metabolism and Regulation in Corynebacterium Glutamicum. Journal of Biotechnology 2013, 168, 331–340. [Google Scholar] [CrossRef]
- Müller, F.; Rapp, J.; Hacker, A.-L.; Feith, A.; Takors, R.; Blombach, B. CO2/HCO3- Accelerates Iron Reduction through Phenolic Compounds. mBio 2020, 11, e00085–20. [Google Scholar] [CrossRef]
- Zepeck, F.; Gräwert, T.; Kaiser, J.; Schramek, N.; Eisenreich, W.; Bacher, A.; Rohdich, F. Biosynthesis of Isoprenoids. Purification and Properties of IspG Protein from Escherichia Coli. J. Org. Chem. 2005, 70, 9168–9174. [Google Scholar] [CrossRef] [PubMed]
- Rückert, C.; Koch, D.J.; Rey, D.A.; Albersmeier, A.; Mormann, S.; Pühler, A.; Kalinowski, J. Functional Genomics and Expression Analysis of the Corynebacterium Glutamicum Fpr2-cysIXHDNYZ Gene Cluster Involved in Assimilatory Sulphate Reduction. BMC Genomics 2005, 6, 121. [Google Scholar] [CrossRef]
- Isenschmid, A.; Marison, I.W.; von Stockar, U. The Influence of Pressure and Temperature of Compressed CO2 on the Survival of Yeast Cells. Journal of Biotechnology 1995, 39, 229–237. [Google Scholar] [CrossRef]
- Seel, W.; Baust, D.; Sons, D.; Albers, M.; Etzbach, L.; Fuss, J.; Lipski, A. Carotenoids Are Used as Regulators for Membrane Fluidity by Staphylococcus Xylosus. Sci Rep 2020, 10, 330. [Google Scholar] [CrossRef]
- Wu, T.; Ye, L.; Zhao, D.; Li, S.; Li, Q.; Zhang, B.; Bi, C.; Zhang, X. Membrane Engineering - A Novel Strategy to Enhance the Production and Accumulation of β-Carotene in Escherichia Coli. Metabolic Engineering 2017, 43, 85–91. [Google Scholar] [CrossRef] [PubMed]
- Follonier, S.; Escapa, I.F.; Fonseca, P.M.; Henes, B.; Panke, S.; Zinn, M.; Prieto, M.A. New Insights on the Reorganization of Gene Transcription in Pseudomonas Putida KT2440 at Elevated Pressure. Microbial Cell Factories 2013, 12, 30. [Google Scholar] [CrossRef] [PubMed]
- Dixon, N.M.; Kell, D.B. The Inhibition by CO2 of the Growth and Metabolism of Micro-Organisms. J Appl Bacteriol 1989, 67, 109–136. [Google Scholar] [CrossRef] [PubMed]
- Basiony, M.; Ouyang, L.; Wang, D.; Yu, J.; Zhou, L.; Zhu, M.; Wang, X.; Feng, J.; Dai, J.; Shen, Y.; et al. Optimization of Microbial Cell Factories for Astaxanthin Production: Biosynthesis and Regulations, Engineering Strategies and Fermentation Optimization Strategies. Synthetic and Systems Biotechnology 2022, 7, 689–704. [Google Scholar] [CrossRef]
- Ramı́rez, J.; Gutierrez, H.; Gschaedler, A. Optimization of Astaxanthin Production by Phaffia Rhodozyma through Factorial Design and Response Surface Methodology. Journal of Biotechnology 2001, 88, 259–268. [Google Scholar] [CrossRef]
- Carsanba, E.; Pintado, M.; Oliveira, C. Fermentation Strategies for Production of Pharmaceutical Terpenoids in Engineered Yeast. Pharmaceuticals 2021, 14, 295. [Google Scholar] [CrossRef]
- Morschett, H.; Jansen, R.; Neuendorf, C.; Moch, M.; Wiechert, W.; Oldiges, M. Parallelized Microscale Fed-Batch Cultivation in Online-Monitored Microtiter Plates: Implications of Media Composition and Feed Strategies for Process Design and Performance. Journal of Industrial Microbiology and Biotechnology 2020, 47, 35–47. [Google Scholar] [CrossRef]
- Jia, D.; Xu, S.; Sun, J.; Zhang, C.; Li, D.; Lu, W. Yarrowia Lipolytica Construction for Heterologous Synthesis of α-Santalene and Fermentation Optimization. Appl Microbiol Biotechnol 2019, 103, 3511–3520. [Google Scholar] [CrossRef] [PubMed]
- Chang, H.N.; Kim, N.-J.; Kang, J.; Jeong, C.M.; Choi, J.; Fei, Q.; Kim, B.J.; Kwon, S.; Lee, S.Y.; Kim, J. Multi-Stage High Cell Continuous Fermentation for High Productivity and Titer. Bioprocess Biosyst Eng 2011, 34, 419–431. [Google Scholar] [CrossRef] [PubMed]
- Gupta, V.; Odaneth, A.A.; Lali, Arvind. M. High Cell Density Continuous Fermentation for L-Lactic Acid Production from Cane Molasses. Preparative Biochemistry & Biotechnology 2023, 0, 1–15. [Google Scholar] [CrossRef]
- Mei, Y.; Yang, Z.; Kang, Z.; Yu, F.; Long, X. Enhanced Surfactin Fermentation via Advanced Repeated Fed-Batch Fermentation with Increased Cell Density Stimulated by EDTA–Fe (II). Food and Bioproducts Processing 2021, 127, 288–294. [Google Scholar] [CrossRef]
- Riesenberg, D.; Guthke, R. High-Cell-Density Cultivation of Microorganisms. Appl Microbiol Biotechnol 1999, 51, 422–430. [Google Scholar] [CrossRef]
- Neubauer, P.; Junne, S. Scale-Up and Scale-Down Methodologies for Bioreactors. In Bioreactors; John Wiley & Sons, Ltd, 2016; pp. 323–354 ISBN 978-3-527-68336-9.
Figure 2.
Dotplots of the DoE results clustered by pH value. These graphs represent the results of the DoE fermentations for maximal astaxanthin titers (A) and total carotenoid titers given as astaxanthin equivalents (B). Results are clustered by pH value to enhance readability. Fermentations were performed in a 2L CGXII medium using C. glutamicum ASTA* at 30°C. pH was controlled using 4 M KOH and 10 % H3PO4. Aeration, rDOS, pH and initial OD600 nm were varied according to the design-of-experiment approach.
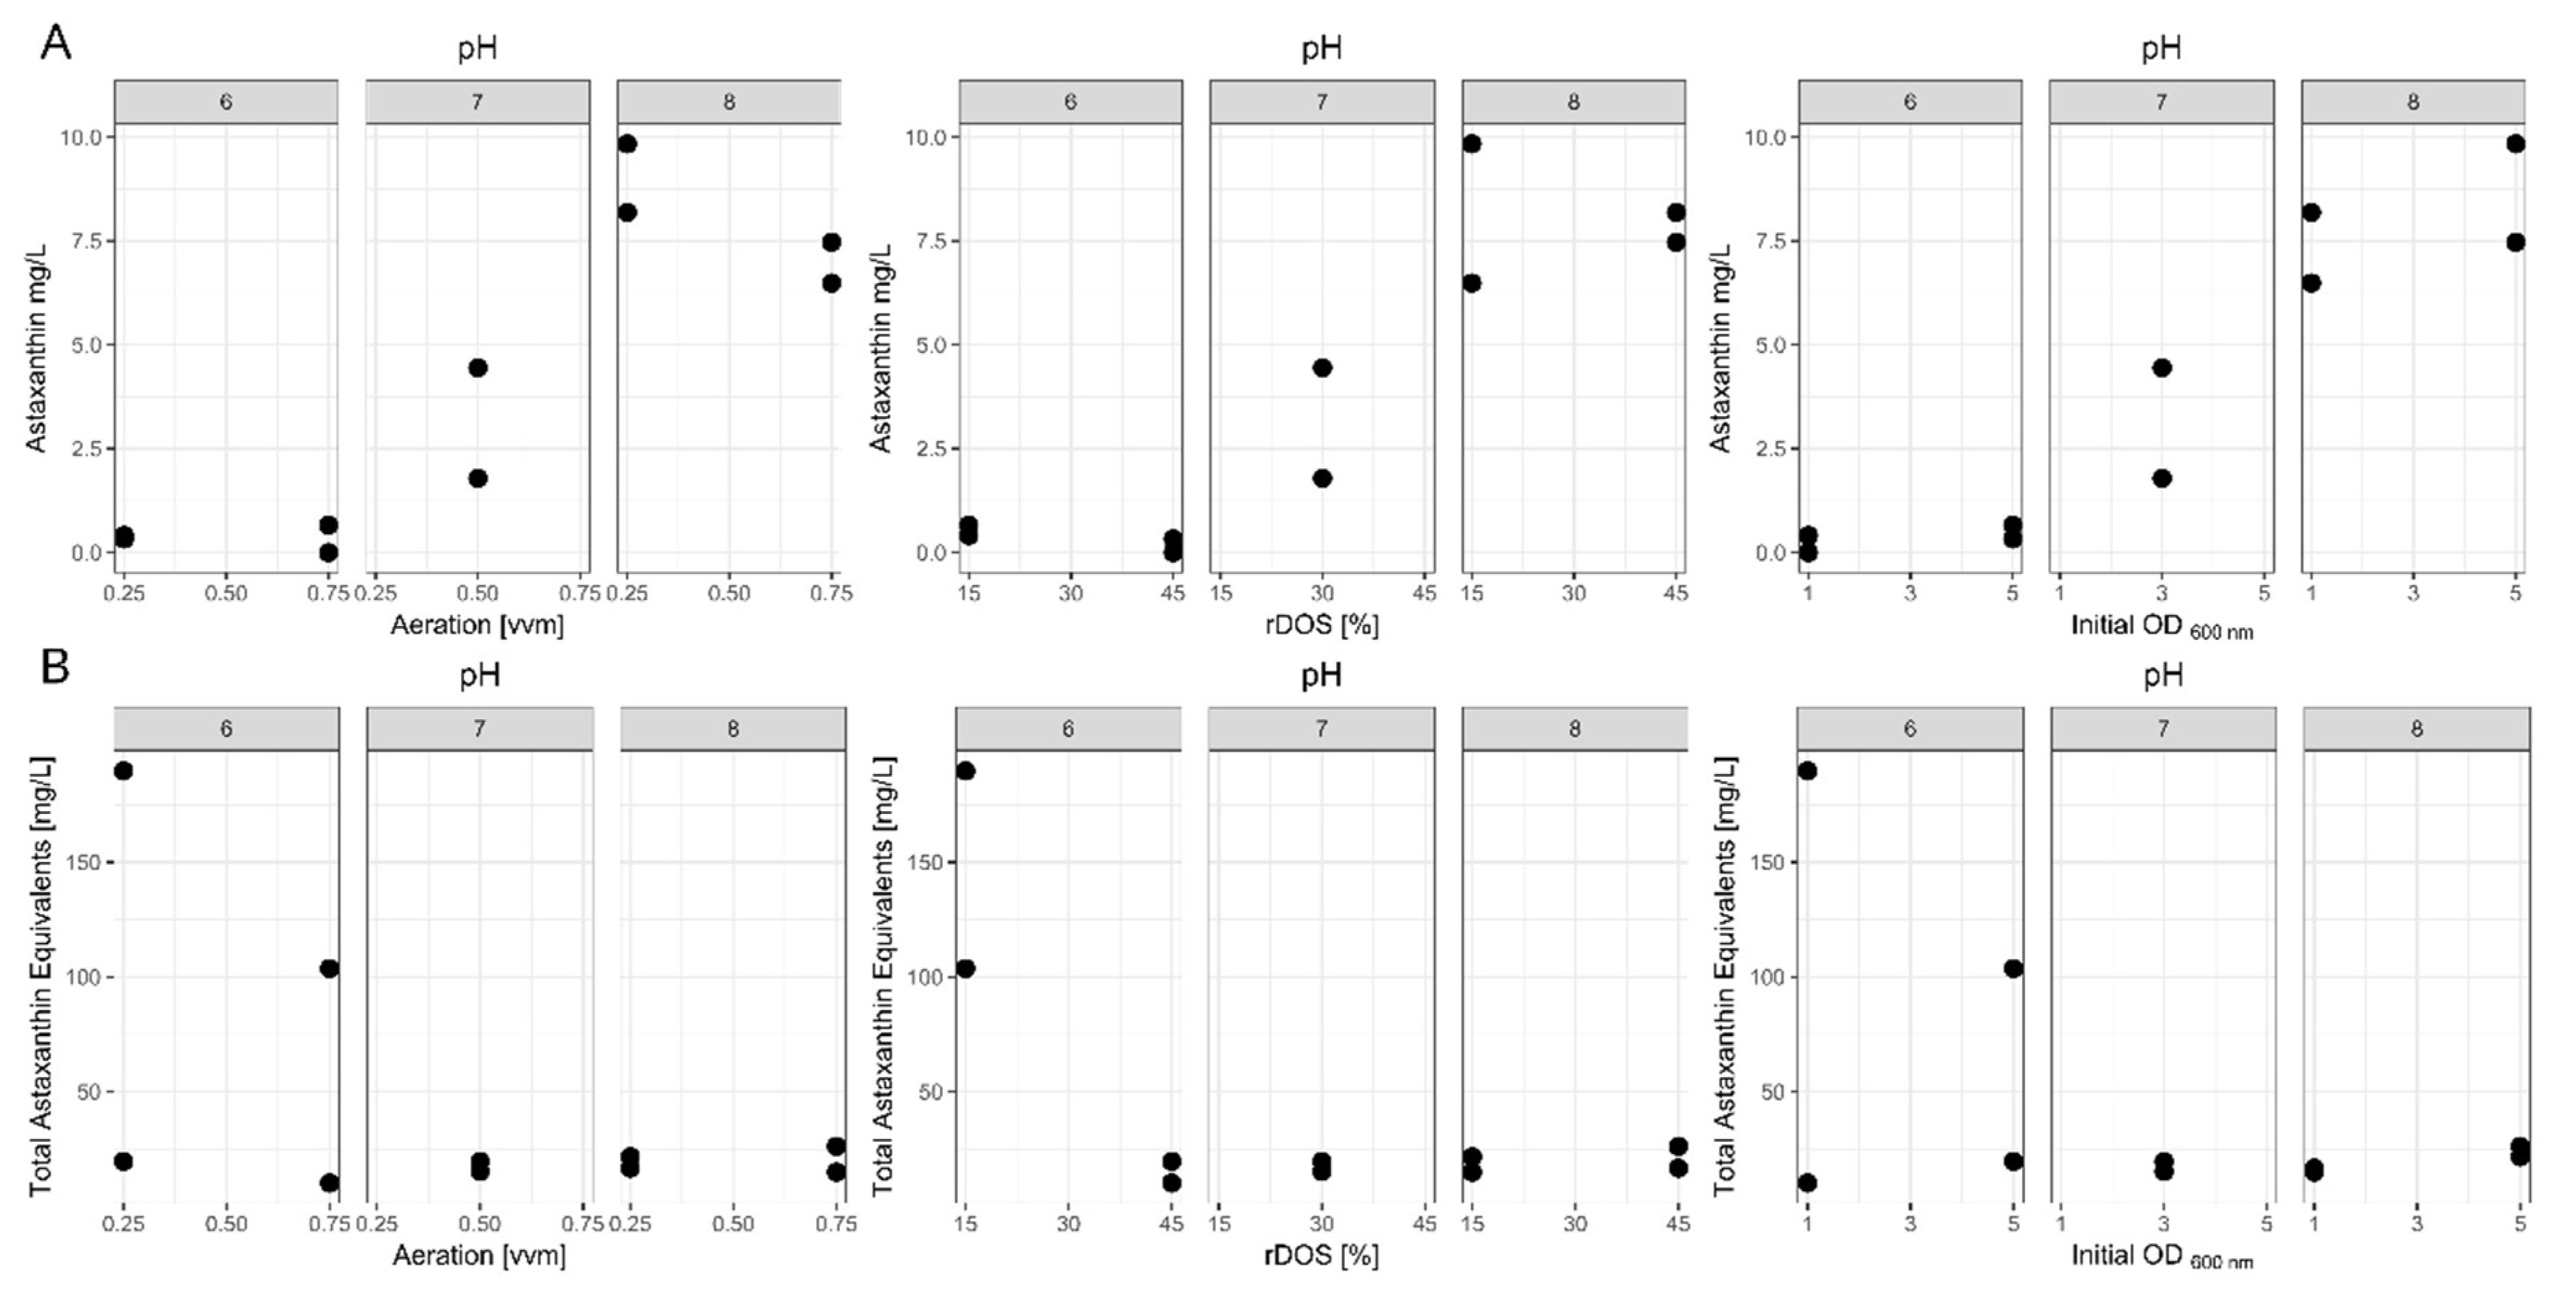
Figure 3.
Batch fermentations at different aeration rates and pH. Astaxanthin titers (red squares), biomass (cell dry weight; green dots), agitator speed (grey line), rDOS (dark blue line), aeration rate (light blue line) and pH (orange line) over time during batch fermentations with C. glutamicum ASTA* grown in 2 L CGXII medium at pH 7 with an aeration rate of 0.15 vvm (A), 0.25 vvm (B), 0.35 vvm (C) or 0.5 vvm (D); or with an aeration rate of 0.25 vvm at pH 7.5 (E), pH 8 (F) or pH 8.5 (G). All fermentations were performed with an initial OD600 nm of 1, at rDOS of 30 %.
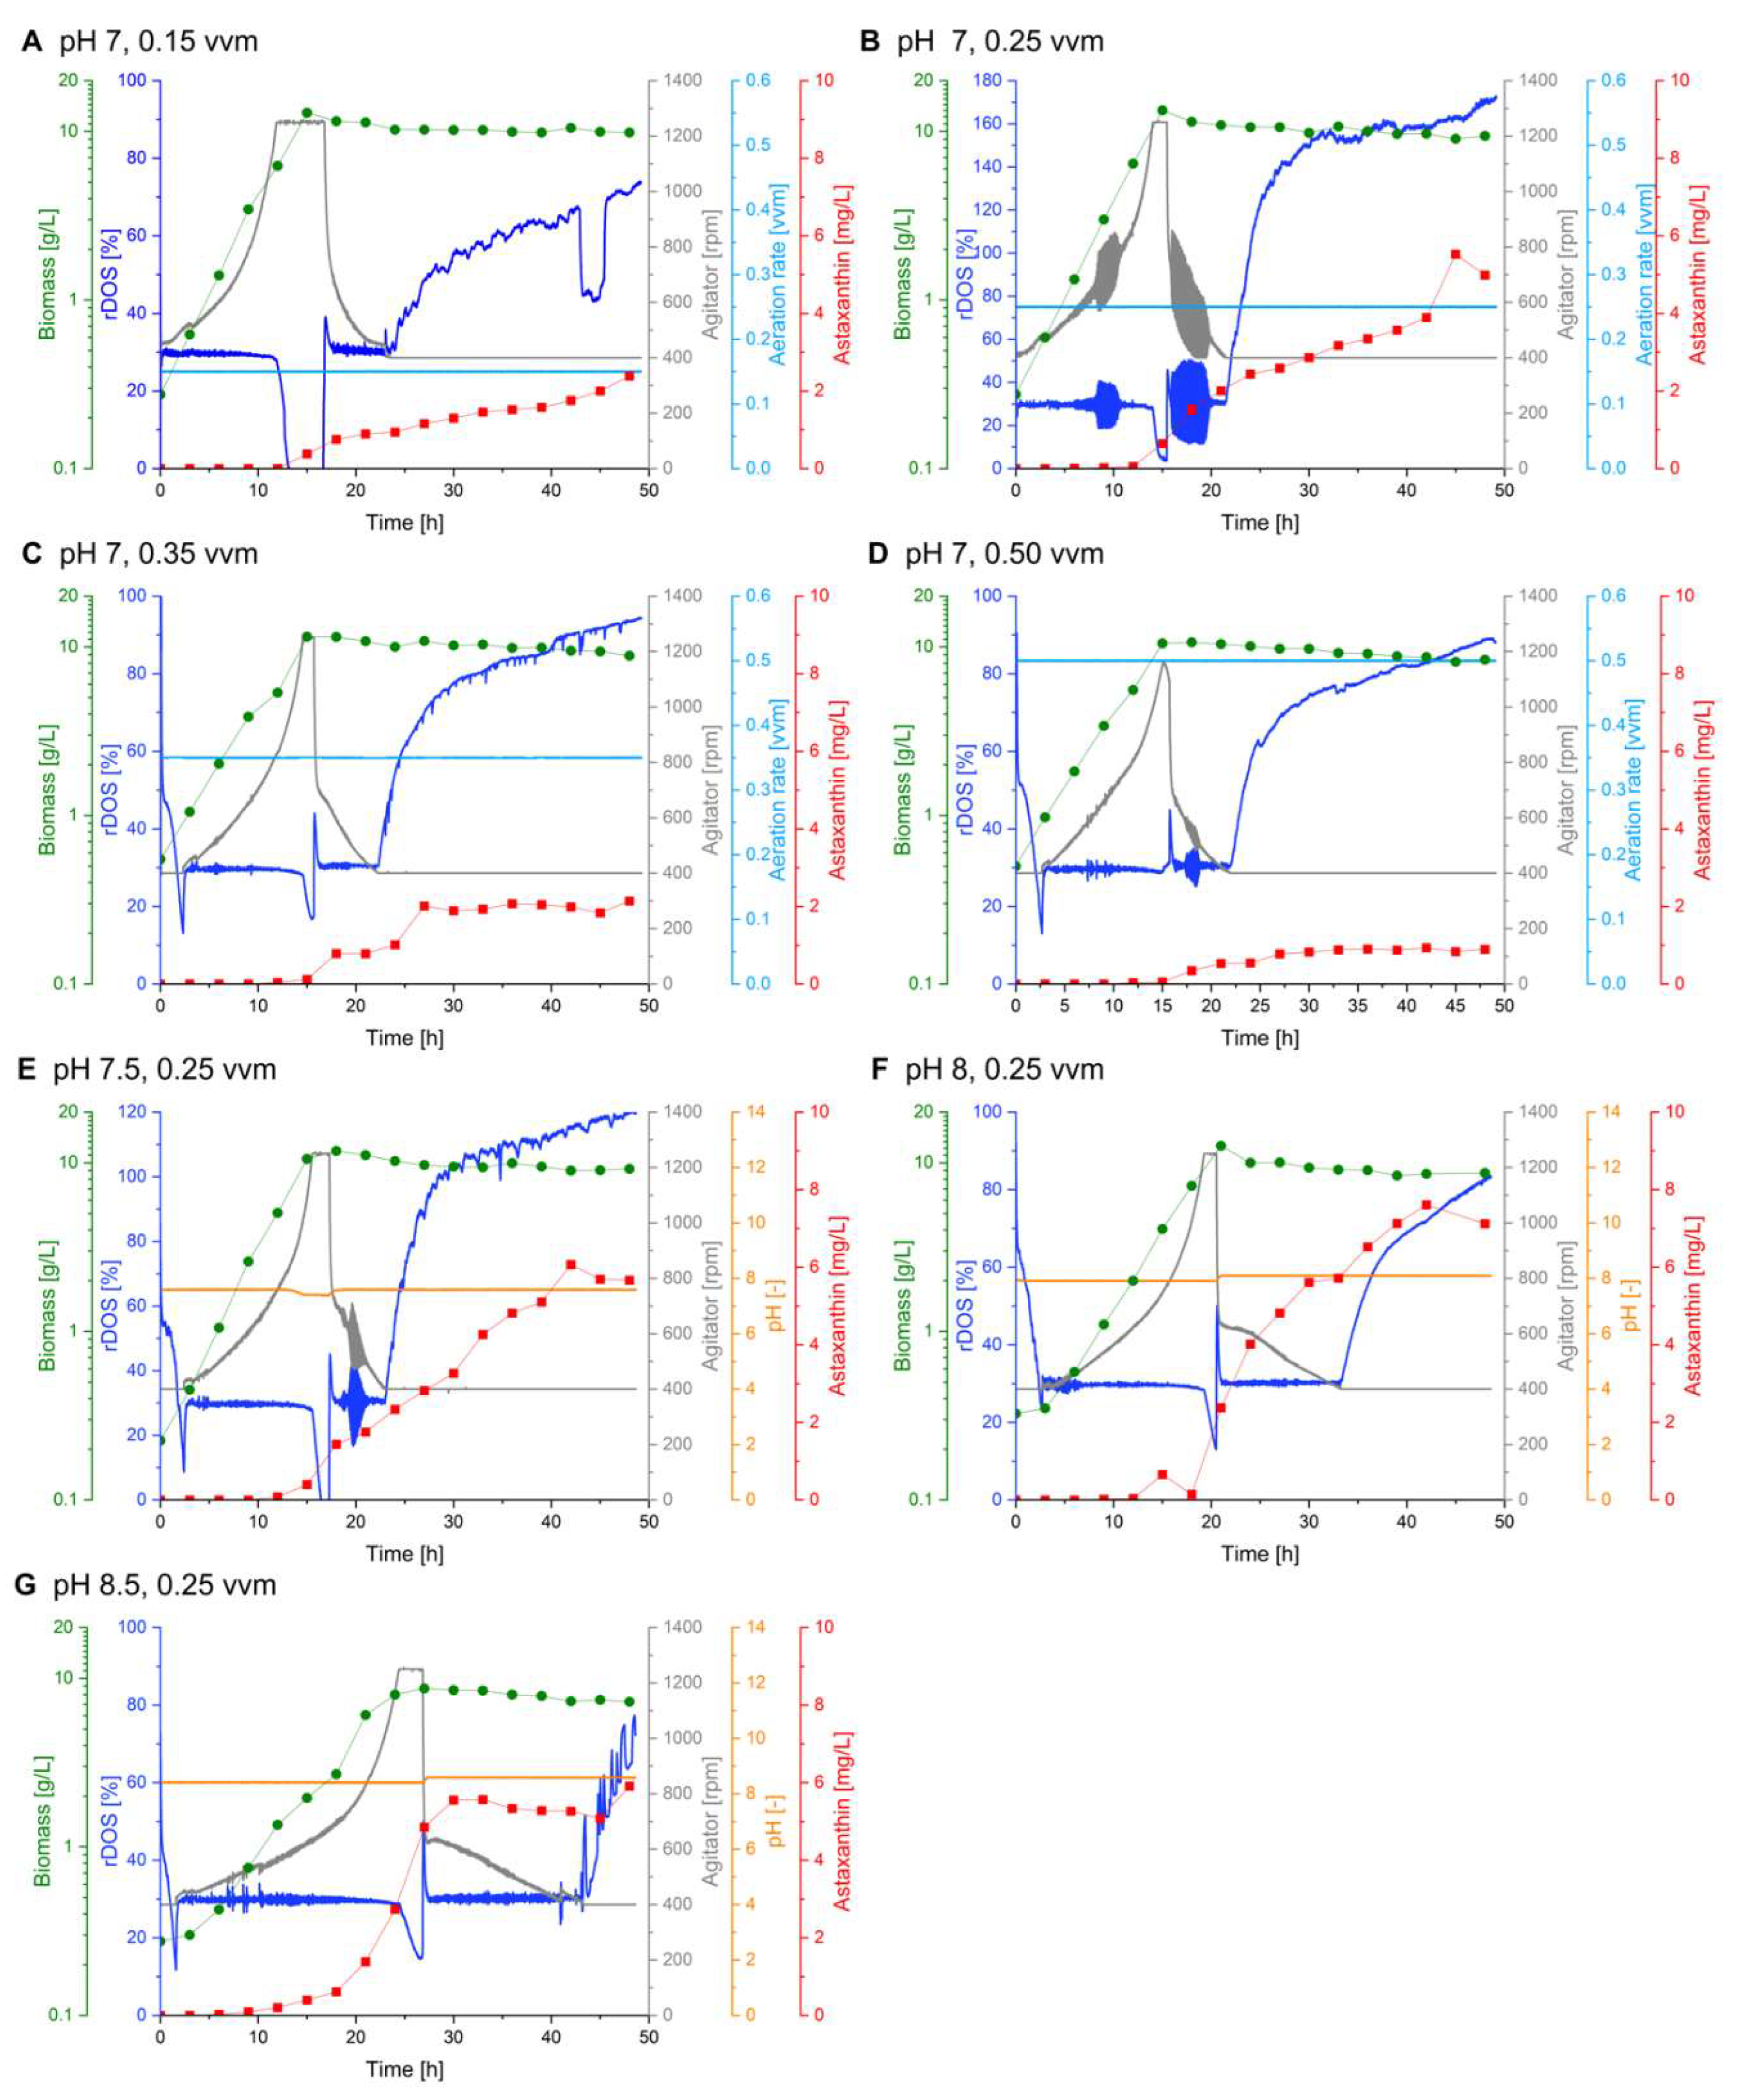
Figure 4.
Batch fermentations for pH-shift experiments. Astaxanthin titer (red squares), β-carotene titer (yellow squares), biomass (cell dry weight; green dots) and pH (orange line) over time during batch fermentations with C. glutamicum ASTA* grown in 2 L CGXII medium steady at pH 6 (A), pH 8 (B) or with a pH shift after 12 h from pH 6 to pH 8 (C) or from pH 8 to pH 6 (D). All fermentations were performed with an initial OD600 nm of 1, at rDOS of 30 % and an aeration rate of 0.25 vvm.
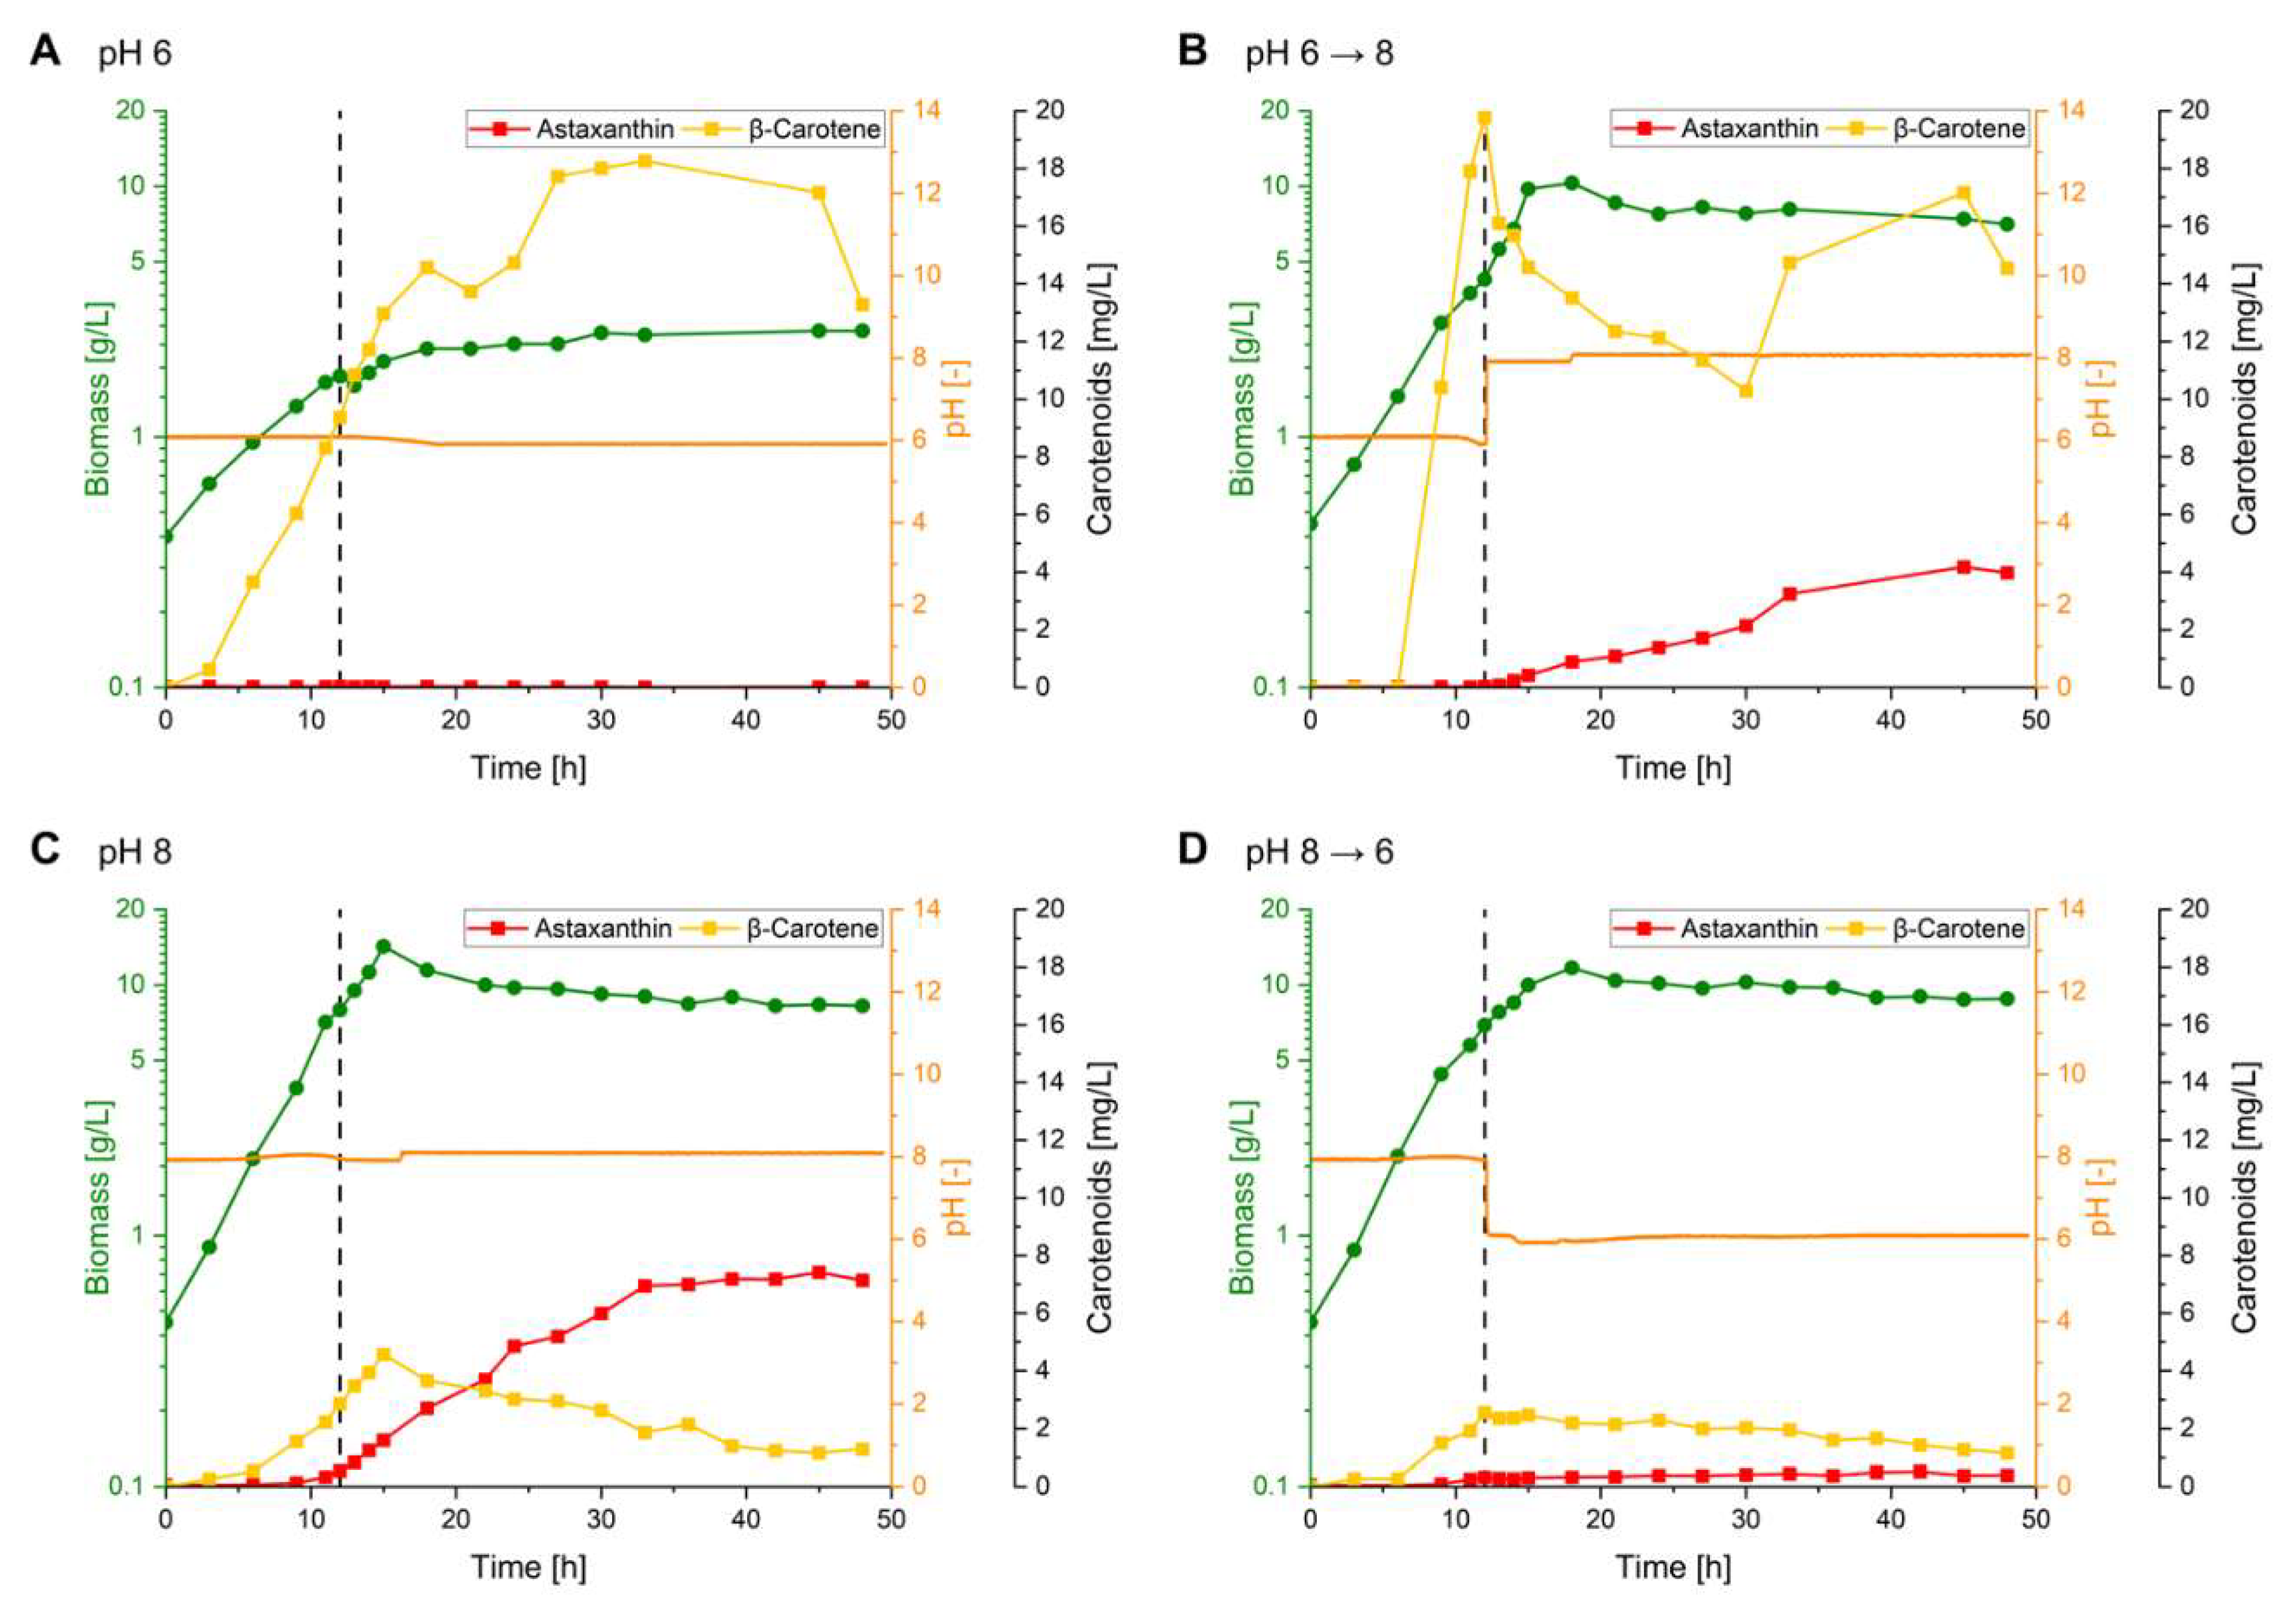
Figure 5.
Fed-batch fermentations. Astaxanthin titers (red squares), β-carotene titers (yellow squares), biomass (cell dry weight; green dots), feed intake (purple line), agitator speed (grey line), moving average rDOS (dark blue line), and aeration rate (light blue line) over time during fed-batch fermentations with C. glutamicum ASTA* grown in 1 L HCDC as batch medium, fed with 1 L 600 g L-1 glucose at pH 7 with an initial aeration rate of 0.5 vvm (A) or at pH 8 with an initial aeration rate of 0.25 vvm (B).
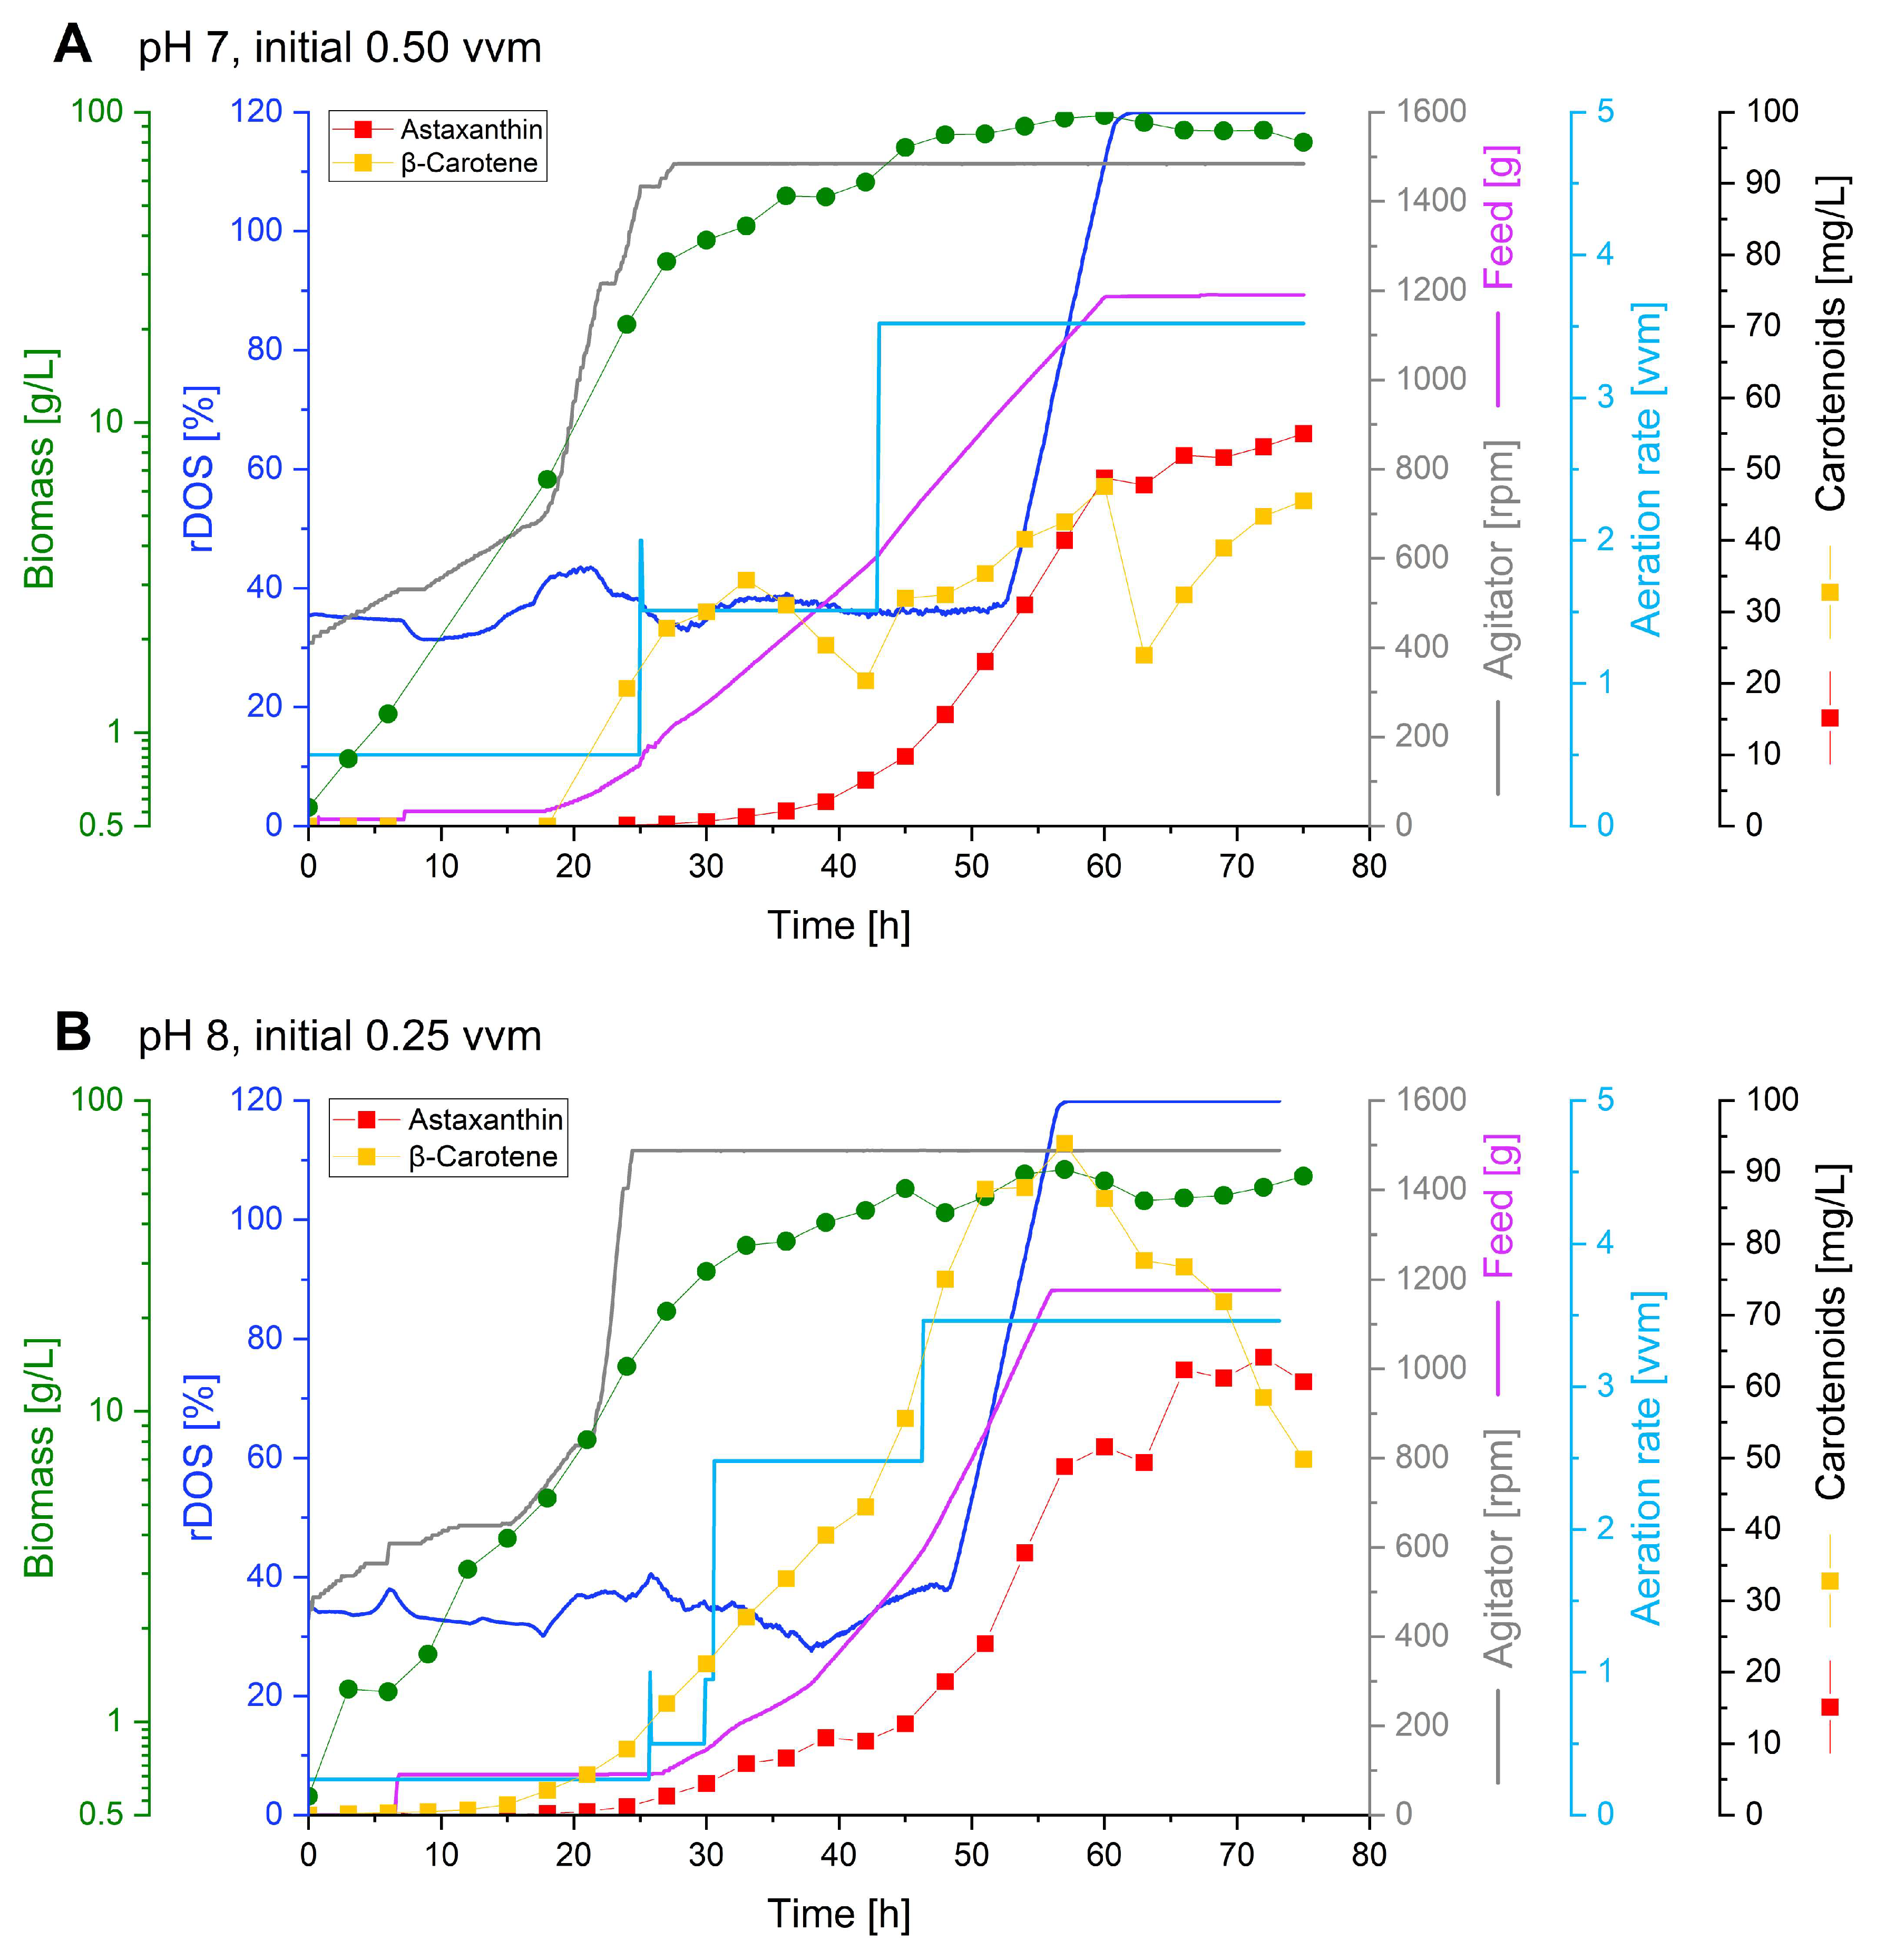

Table 1.
Overview over the tested bioprocess parameters and their respective levels.
| Modified parameter | Level | ||
| -1 | 0 | +1 | |
| Aeration [vvm] | 0.25 | 0.5 | 0.75 |
| Initial OD600 nm [-] | 1 | 3 | 5 |
| pH [-] | 6 | 7 | 8 |
| rDOS [%] | 15 | 30 | 45 |
Table 2.
Overview of randomized DoE fermentation runs. The rDOS, aeration rate and pH setpoint, as well as the initial OD600 nm for each fermentation are stated. Control runs are marked gray. n.d. = not detectable.
Table 2.
Overview of randomized DoE fermentation runs. The rDOS, aeration rate and pH setpoint, as well as the initial OD600 nm for each fermentation are stated. Control runs are marked gray. n.d. = not detectable.
| Run | rDOS [%] | Aeration rate [vvm] | Initial OD600 nm | pH | Astaxanthin titer [mg L-1] |
Total carotenoids as astaxanthin equivalents [mg L-1] | max. CDW [g L-1] |
| 1 | 30 | 0.50 | 3 | 7 | 1.79 | 19.57 | 13 |
| 2 | 15 | 0.75 | 5 | 6 | 0.66 | 103.71 | 5.25 |
| 3 | 45 | 0.25 | 1 | 8 | 8.19 | 16.67 | 9.5 |
| 4 | 45 | 0.75 | 5 | 8 | 7.47 | 26.20 | 9.25 |
| 5 | 15 | 0.25 | 5 | 8 | 9.84 | 21.62 | 10.25 |
| 6 | 45 | 0.25 | 5 | 6 | 0.33 | 19.65 | 7 |
| 7 | 30 | 0.50 | 3 | 7 | 4.45 | 15.24 | 8 |
| 8 | 15 | 0.25 | 1 | 6 | 0.41 | 189.77 | 12.25 |
| 9 | 15 | 0.75 | 1 | 8 | 6.49 | 14.95 | 8.5 |
| 10 | 45 | 0.75 | 1 | 6 | n.d. | 10.20 | 4.25 |
Table 3.
Overview over the regression model and its components. Models for both astaxanthin titer and total carotenoid titer (given as astaxanthin equivalents) are shown. The shown two-factor interactions are confounded due to the model design and can therefore not be distinguished. Furthermore, the two-factor interaction was not included for the astaxanthin model as it only increased the lack of fit. Statistical significances were calculated using either the Students t-test (t-values and corresponding probabilities) or Fisher’s test (F-Value and corresponding probabilities).
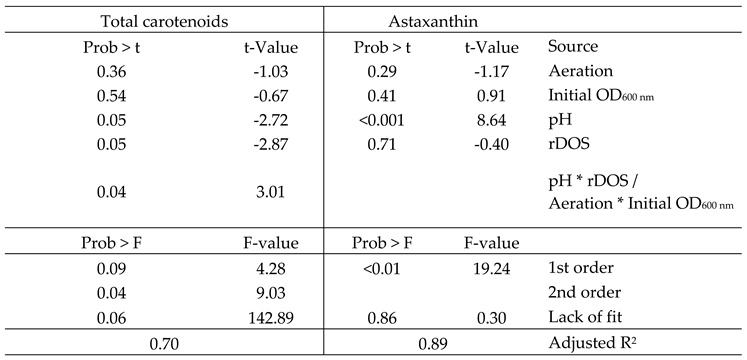
Table 4.
DoE Output. For each variable of the DoE the p-value for a linear correlation (calculated via ANOVA), the p-value for the variables just at pH 8 (calculated via T-test) and the resulting outputs are stated.
Table 4.
DoE Output. For each variable of the DoE the p-value for a linear correlation (calculated via ANOVA), the p-value for the variables just at pH 8 (calculated via T-test) and the resulting outputs are stated.
| Variable | t-value (ANOVA) |
p-value (data points at pH 8) |
Output |
|---|---|---|---|
| pH | <0.001 | - | Optimum at pH 8 |
| Aeration rate | 0.29 | 0.17 | Setpoint at 0.25 vvm as no significance detected |
| Initial OD600 nm | 0.41 | 0.46 | Setpoint at 1 as no significance detected |
| rDOS | 0.71 | 0.86 | Setpoint set to 30% as no significant effect |
Disclaimer/Publisher’s Note: The statements, opinions and data contained in all publications are solely those of the individual author(s) and contributor(s) and not of MDPI and/or the editor(s). MDPI and/or the editor(s) disclaim responsibility for any injury to people or property resulting from any ideas, methods, instructions or products referred to in the content. |
© 2023 by the authors. Licensee MDPI, Basel, Switzerland. This article is an open access article distributed under the terms and conditions of the Creative Commons Attribution (CC BY) license (http://creativecommons.org/licenses/by/4.0/).
Copyright: This open access article is published under a Creative Commons CC BY 4.0 license, which permit the free download, distribution, and reuse, provided that the author and preprint are cited in any reuse.


