Submitted:
04 October 2023
Posted:
12 October 2023
You are already at the latest version
Abstract
In the United States, the ballot measure power was born during the 1990s Progressive Era, ushered in by populists, socialists, and labor activists. Early on, activists used the measure to curb political corruption through campaign finance and other election reforms. Those early efforts also sought to improve labor conditions, minimize the influence of wealthy special interests, and require powerful corporate interests to pay more taxes. While the measure has been used by conservatives and progressives alike, the legacy of the process as a vehicle for progressive change is undeniable. However, the ballot measure landscape of the last two decades is marked by politicians growing increasingly hostile to its use. From requiring supermajorities to pass measures to refusing to implement measures approved by voters, lawmakers have made every attempt to restrict voters’ access to the measure power. In particular, Republican state legislators have become increasingly hostile to the ballot measure process, crafting creative ways to prevent measures from making it to the ballot or to stop voters from approving progressive measures. To fully understand how the measure process has been manipulated in recent years, we examined how legislators have attempted to change the process. Here, we examined a series of hypotheses to determine whether the political party affiliation of the sponsor of proposed ballot measure legislation is a predictor of whether the legislation restricts the ballot measure process. We tested these hypotheses by analyzing data from 2010 to 2022 and conducting empirical tests to determine the relationship between political party affiliation and the restrictiveness of proposed ballot measure legislation. We also analyzed how the patterns of ballot measure legislation affected states where the state government is under unified and split control. In reviewing this legislation, we found that Democrats initially attempted to restrict the ballot measure process. However, as progressives successfully passed more progressive ballot measures, Republicans – and particularly when Republicans held a trifecta in state government – attempted to restrict the ballot measure process far more extensively than any attempts by Democrats. We can draw three significant conclusions from our analysis. First, Democrats are willing to restrict the ballot measure process in some circumstances. This is evident based on conservative attempts to restrict gay marriage and other conservative policy through the ballot measure in the 2000s and Democratic efforts to stop those attacks. Second, Republican attempts to restrict the ballot measure process far outpace any initial attempts by Democrats during the period we studied, especially when Republicans have a trifecta in the state government. This speaks to the long-term Republican strategy of power-grabbing seen not only here, but throughout the political process in recent years. Lastly, our research indicates that as progressives continue to see success with ballot measures, Republican efforts to restrict the ballot measure process are expected to continue.
Keywords:
ballot measure legislation
; ballot initiatives
I. The Birth of the Ballot Initiative
The Progressive Era (1897 to 1920) saw the adoption of a suite of democratic reforms, including the right to direct democracy in nineteen states. Concerned with the “failing health of American democracy,” progressive reformers, often members of populist, socialist, and labor movements, advocated for the initiative, referendum, and recall powers (Smith and Tolbert 2009). Reformers hoped that these processes would serve as a check on the legislature – balancing their legislative power with the people’s power – and encourage the electorate to more actively engage in their government (Smith and Tolbert 2009). Progressives also sought to balance the influence of wealthy special interests and monopolistic industry by providing voters with lawmaking power (Levinson 2014; Persily 1997).
Within the first twenty years of its establishment, the statewide ballot initiative was used to seek reform in labor, tax, representative government, campaign finance, and elections and voting laws in twenty-one states. Some of the more common early uses of direct democracy were voters giving themselves the right to vote directly for candidates in primaries in Maine, Montana, and South Dakota, and for their state’s U.S. Senators in Oregon, Montana, and Oklahoma. Voters also repeatedly attempted (and in some cases succeeded at) expanding suffrage to women in state law in Arizona, Oregon, Oklahoma, and Ohio.
Proponents in Missouri, Oregon, Arkansas, Montana, and Colorado placed primary, secondary, and higher education public school funding on the ballot. Voters in North Dakota, California, and Oregon saw initiatives to raise or levy taxes–often on powerful industries, like mining, railroads and agriculture–to fund infrastructure, education, and crop insurance. Several early initiative campaigns in Washington, Colorado, Oregon, California, and Arkansas sought to further regulate big business and protect workers in other ways, including establishing eight-hour workdays, abolishing child labor, and capping the maximum working hours per week.
Finally, and perhaps most significantly for our purposes, voters used the initiative in its first twenty years of existence to expand and protect their initiative rights. For example, in North Dakota, voters reformed their initiative process from indirect, which only allowed amendments proposed by the legislature, to direct, which allows citizens to directly propose constitutional amendments. In Ohio, voters gave themselves the referendum power, while in Arizona, voters shielded successful ballot initiatives from the Governor’s veto and from legislative alteration and repeal.
That voters used early initiatives to obtain, protect, and flex their democratic control of big business, education, and their own governance is further evidence of the power of ballot initiatives as a method of securing progressive change.
II. Examining the Modern Ballot Initiative
A. The Modern Use of the Ballot Initiative
To contextualize the ballot measure process changes between 2010 through 2022, we examined how the ballot measure was used during the modern period, from 2000 through 2022. In particular, we examined the use of the measure through the use of the ballot initiative.
In examining this period, there were two stretches of particularly high ballot measure engagement: 2000 to 2008, and 2016 to 2018 (Figure 1). The unevenness in the graph is due to ballot initiatives typically appearing on even-year election ballots, either due to state law requirements or as a strategy for high voter turnout. The surges in number of ballot measures around 2006 and 2016 reflect an increased use of the ballot measure, highlighted by Republican turnout pushes, during the 2000s and a subsequent progressive movement on social and economic issues during the 2010s , as described in detail below.
B. Ballot Measure Topic Trends
Between 2000 and 2022, individuals and groups of all stripes turned to the initiative process to push proposals and avoid the traditional legislative process (Persily 1997). As noted above, there were two significant periods of high ballot measure engagement during this era. First, a strong push during the 2000s, highlighted by Republicans pushing conservative measures to spur Republican turnout and advance conservative policy. Second, during the 2010s, ballot initiatives emerged as a critical tool for progressives to enact policy change, particularly in states where Republicans held a trifecta in state government.
1. The Conservative Push
The 2000s marked a highpoint of ballot measure engagement, with conservative measure strategy leading the way. This conservative strategy is best exemplified by the anti-gay marriage measure efforts. In the early 2000s, conservatives used the ballot measure to push anti-gay marriage amendments to boost conservative turnout (Isenstadt 2017). In fact, most believe that anti-gay marriage amendments across 11 states paved the way for President Bush’s reelection in 2004. Although many of these measures were placed on the ballot by the legislature, measures in Arkansas, Michigan, Montana, North Dakota, Ohio, and Oregon were all placed on the ballot through the initiative process (Matsusaka 2006). In 2006, seven more states approved constitutional amendments that restricted marriage to be between a man and a woman (Colorado, Idaho, South Carolina, South Dakota, Tennessee, Virginia, and Wisconsin) (Matsusaka 2006). And, in 2008, Arizona, California, and Florida passed same-sex marriage bans (Matsusaka 2008). The nation’s highest profile measure, California’s Proposition 8 that banned same-sex marriage, was approved with 52 percent of the vote (Matsusaka 2008).
Republicans continued to use the ballot measure as a tool for policy change throughout the decade. During this period, voters approved other conservative efforts including anti-union, voter ID, and anti-healthcare measures (Matsusaka 2010). In 2010 alone, voters approved several anti-union measures (in Arizona, South Carolina, Louisiana, and Utah) and anti-healthcare measures (in Arizona and Oklahoma), while rejecting pro-marijuana-related measures in California, Arizona, Oregon, and South Dakota (Matsusaka 2010).
However, in 2010, Republicans also saw huge candidate victories, solidifying power in state legislatures and Governors’ mansions across the country (Roff 2010). These victories enabled Republican legislators and governors in many states to enact policy through the legislature, bypassing voters and forecasting the seismic conservative strategy shift.
2. The Progressive Comeback
Although much of the focus during the 2000s was on conservative efforts, progressives also started to use the initiative power more aggressively to introduce measures that increased the minimum wage, and authorized medical marijuana among other progressive issues (Matsusaka 2006). For example, in 2006, initiatives to increase the minimum wage appeared on the ballot in Arizona, Colorado, Montana, Missouri, Nevada, and Ohio, and all were approved. Likewise, throughout the 2000s, several states approved the use of medical marijuana (Matsusaka 2006).
And with conservatives more focused on direct legislative-gains during the 2010s, progressives sought, and won, even more significant progressive change through ballot measures. In particular, progressives focused on social and economic measures during this period (Scott 2022), typically centering on policies popular with voters, such as minimum wage increases, marijuana legalization, same-sex marriage rights, and Medicaid expansion. For instance, in 2012, Colorado and Washington voters approved initiatives legalizing possession and use of marijuana; Maine, Maryland, and Washington voters approved same-sex marriage; and Minnesota voters rejected an anti-gay marriage ban (Matsusaka 2012). These 2012 victories spurred further progressive victories in 2014, including the legalization of recreational use marijuana in Alaska, Oregon, and the District of Columbia and minimum wage increases in Alaska, Arkansas, Illinois, Nebraska, and South Dakota (Matsusaka 2014).
In 2016, 2018, and 2020, progressives again saw even more significant victories across the country, on medical and recreational marijuana, Medicaid expansion, and minimum wage increases (Matsusaka 2019). In 2018, voters in Idaho, Nebraska, and Utah expanded Medicaid via ballot measure; and, in 2020, Oklahoma, and Missouri also approved Medicaid expansion measures (Matsusaka 2019). In 2018 and 2020, Arizona, New Jersey, Montana, South Dakota, Michigan, Oklahoma, and Utah took steps to legalize marijuana (Matsusaka 2019, 2020).
The progressive ballot measure surge coincided with President Trump’s election and tenure, indicating that the increase in progressive activism affected progressive issues, as well as Democratic electoral wins in the years directly after Trump’s election (Edwards-Levy 2017).
These ballot measure successes continued in 2022 with victories on reproductive rights, progressive tax increases, and voting rights (Sharkey and Morrison 2023). States also saw victories on expanded economic security policies (Scott 2022). However, while progressive victories continue, the sheer number of initiatives on the ballot dropped significantly, indicating that progressives may be succumbing to the conservative efforts to restrict the process.
III. Ballot Measure Process Changes
With this foundational understanding in place, we can now turn to the analysis of the 2010-2022 ballot measure process legislation.
The driving questions are:
- Has there been a change in the number of restrictive ballot measure legislations proposed by each political party between 2010 and 2022?
- Do political parties introduce varying numbers of bills that restrict or increase accessibility to the ballot measure process?
- To what extent does the control of state government by one political party versus the other affect the number of bills introduced to restrict or increase accessibility to the ballot measure process?
- Have there been any changes in the trends of such bills proposed over time?
To examine these questions, we compiled and categorized legislation from across the country between 2010 and 2022 related to the ballot measure process. All hypotheses are laid out in Appendix A.
A. Research Method
The data used in this study were collected from state legislative databases, which provide all bills introduced in the state legislatures across the country. To filter these bills, Boolean searches narrowed the bills to those potentially relevant. The search was done as a Boolean Search: (“initiative” AND “petition” AND (“referendum” OR “amendment”)) OR (ballot /3 measure AND (initiative OR petition)) OR signature /10 (voter OR elector). If a bill included both Republican and Democratic sponsors or Independent sponsors, we did not include the bill in the analysis. The bills were then reviewed manually to determine whether the bills were relevant and, if relevant, reviewed further to determine (i) whether the bill made the ballot measure process more accessible or more restrictive, and (ii) the topics of each bill. The topics include: petition form, petition circulators, signature requirements, single subject/title, financial impact, ballot measure topics, legislative process, implementation, agency process, election process, challenge process, public engagement, legislative alternation (pre- or post-passage), and new ballot measure process. Bills that did not clearly fall into these categories were excluded from the analysis. We also created a binary variable indicating whether the sponsor was a Democrat or a Republican. Once the bills were categorized, data were collected from each state for each year to determine whether the control of state government was split between the parties or in control of one party.
B. Data / Analysis
1. Ballot Measure Process Legislation
Based on the initial search, the full universe of bills considered between 2010 and 2022 included 12,701 bills. Of those bills, we found that 724 bills were relevant to the ballot measure process (Table 1). And, of those bills, 381 attacked the ballot measure process, while 343 of those bills strengthened the ballot measure process; the remainder were not relevant for the purpose of this analysis.
The bills that restricted the ballot measure process attempted to do so in a multitude of ways. Signature requirements, petition circulator rules, agency process, and election process issues were the most common ways in which legislators attempted to limit the ballot measure process (Figure 2).
The restrictive bills were concentrated in several states, including Missouri, Oklahoma, Arizona, Washington, and California (Figure 3). The accessible ballot measure process bills focused on making the process more accessible primarily by creating new ballot measure processes, and proposing more accessible signature requirements and agency processes (Figure 4). Notably, pro-accessibility bills were concentrated in specific states, including those states without ballot measure processes in place, such as New Jersey and Rhode Island.
For data visualization, we divided bills based on whether: (i) the bills restrict or make the ballot measure process more accessible, and (ii) the bills were sponsored by a Democrat or Republican and plotted those numbers by year (Figure 6). These time series analyses were repeated for legislation proposed in states with total state control by Republicans (Figure 7), total state control by Democrats (Figure 8), and in states with split control (Figure 9).
To determine if trends we observed in the time series analysis were significant, we split the data into 2010 - 2016 and 2017 - 2022. Initially, we reviewed 2017 - 2021 data to see if any patterns emerged related to the legislation. We found that Republican-controlled legislatures attempted to restrict the ballot measure process when they had a trifecta. To confirm whether this trend extended beyond this time period, we reviewed all potentially relevant data from 2010 - 2022. We used logistic regression to model the relationship between party affiliation and the likelihood of proposing accessible legislation. Specifically, we fit a generalized linear model (GLM) using the glm function in R (version 4.1.1) , with the binary dependent variable of accessible or restrictive legislation and the independent variable of party affiliation (Democrat or Republican).
IV. Results
1. Has there been a change in the number of restrictive ballot measure legislations proposed by each political party between 2010 and 2022?
In our time series analyses, we identified a marked increase in the number of bills sponsored by Republicans following 2016 (Figure 6). This pattern was strongest in states with total state government control by Republicans (Figure 7) and absent from Democrat and split control states (Figure 8 and Figure 9).
We also identified a switch in the numbers of accessible and permissive ballot measure legislation sponsored by Democrats beginning around 2016, with slightly favoring restrictive legislation prior to 2016 and accessible legislation in more recent years (Figure 6, Figure 7 and Figure 8). In subsequent analyses, first we analyze bills from all years and then break the bills into those proposed between 2010 and 2016 and those between 2017 and 2022.
2. Do political parties introduce different numbers of bills that restrict or increase accessibility to the ballot measure process?
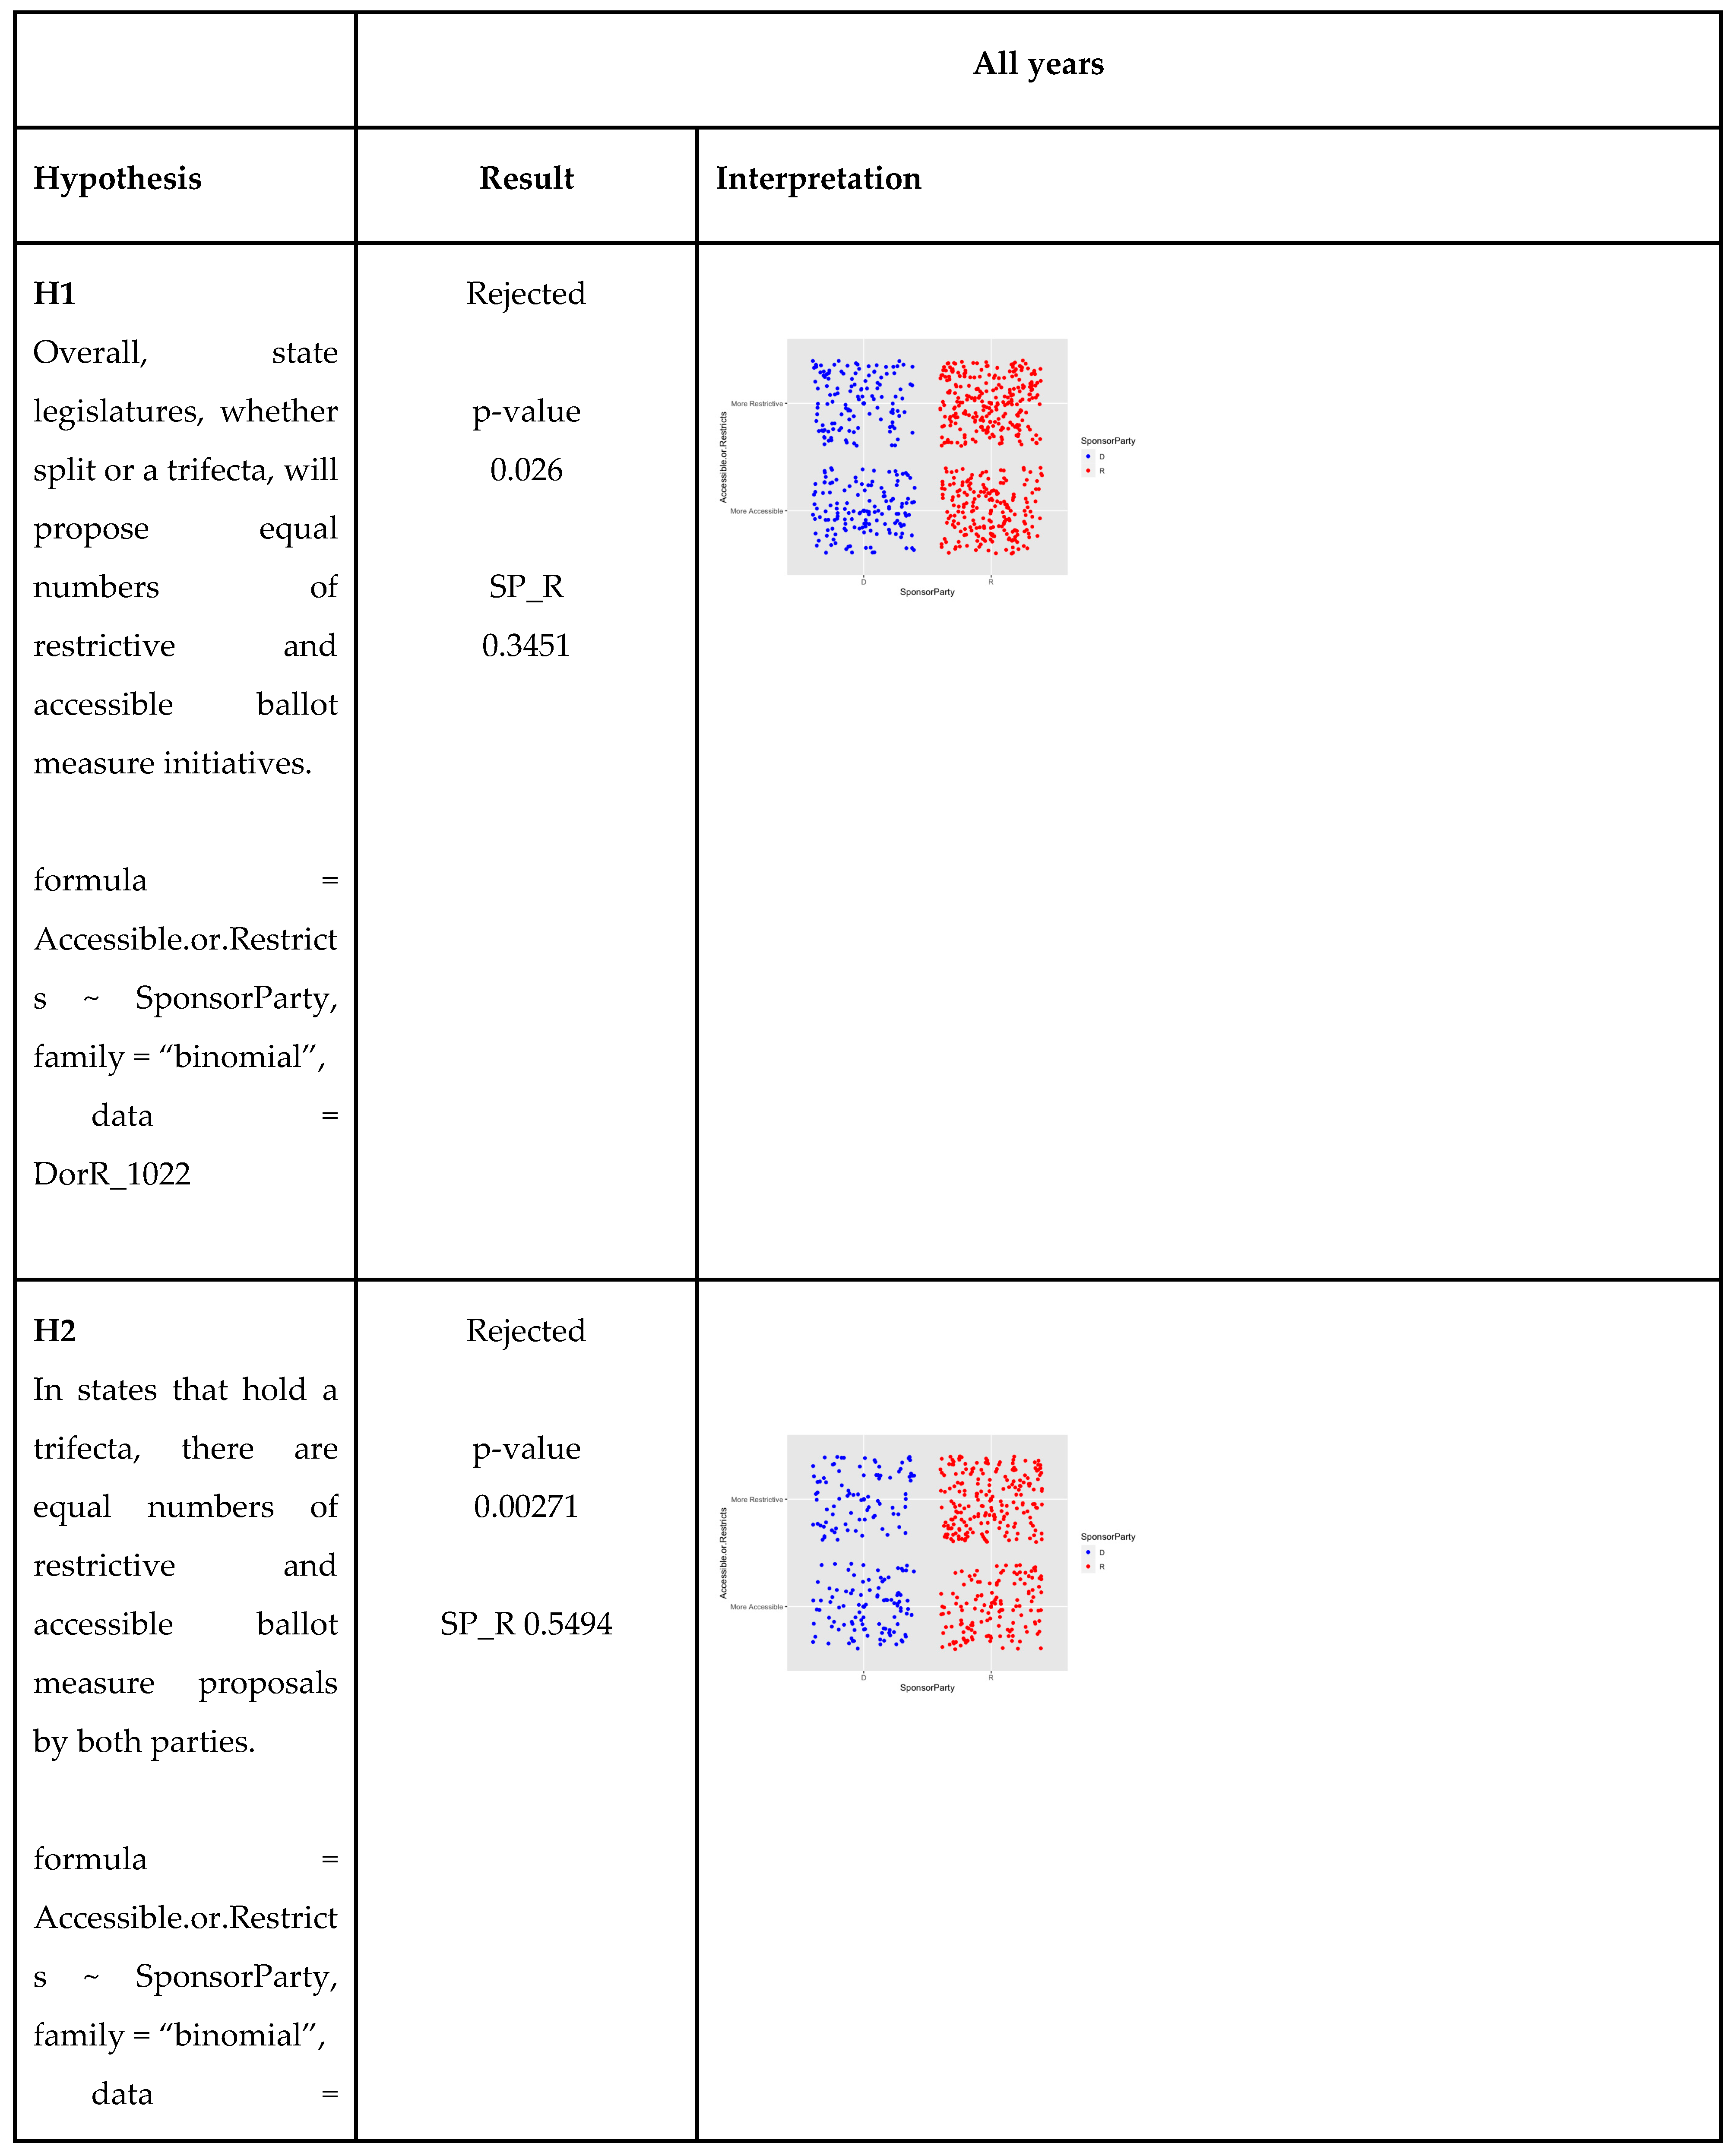
We conducted logistic regression analysis to examine the relationship between the political party affiliation of the sponsor of a bill legislating the ballot measure process. The response variable was whether the bill restricted the ballot measure process or made the process more accessible and the sponsor party as the term. When considering bills proposed between 2010 and 2022, we found that the political party affiliation was significantly related to the likelihood of whether a proposed bill restricted the ballot measure process (Figure 10). Specifically, Republicans were more likely to propose bills that restricted the process (p = 0.026). The odds ratio of Republican sponsored bills was 1.41, indicating the odds of observing a restrictive bill were approximately 1.4 times higher if the bills were sponsored by Republicans compared to bills sponsored by Democrats.
3. To what extent does the control of state government by one political party versus the other affect the number of bills introduced to restrict or increase accessibility to the ballot measure process?
In general, states that have unified party control of the executive branch and both chambers of the legislative branch had more extreme biases in their proposed ballot measure legislation. We found the odds of observing a restrictive bill was 1.7 times more likely when the bill is sponsored by a Republican in states with a unified party control (p = 0.00271).
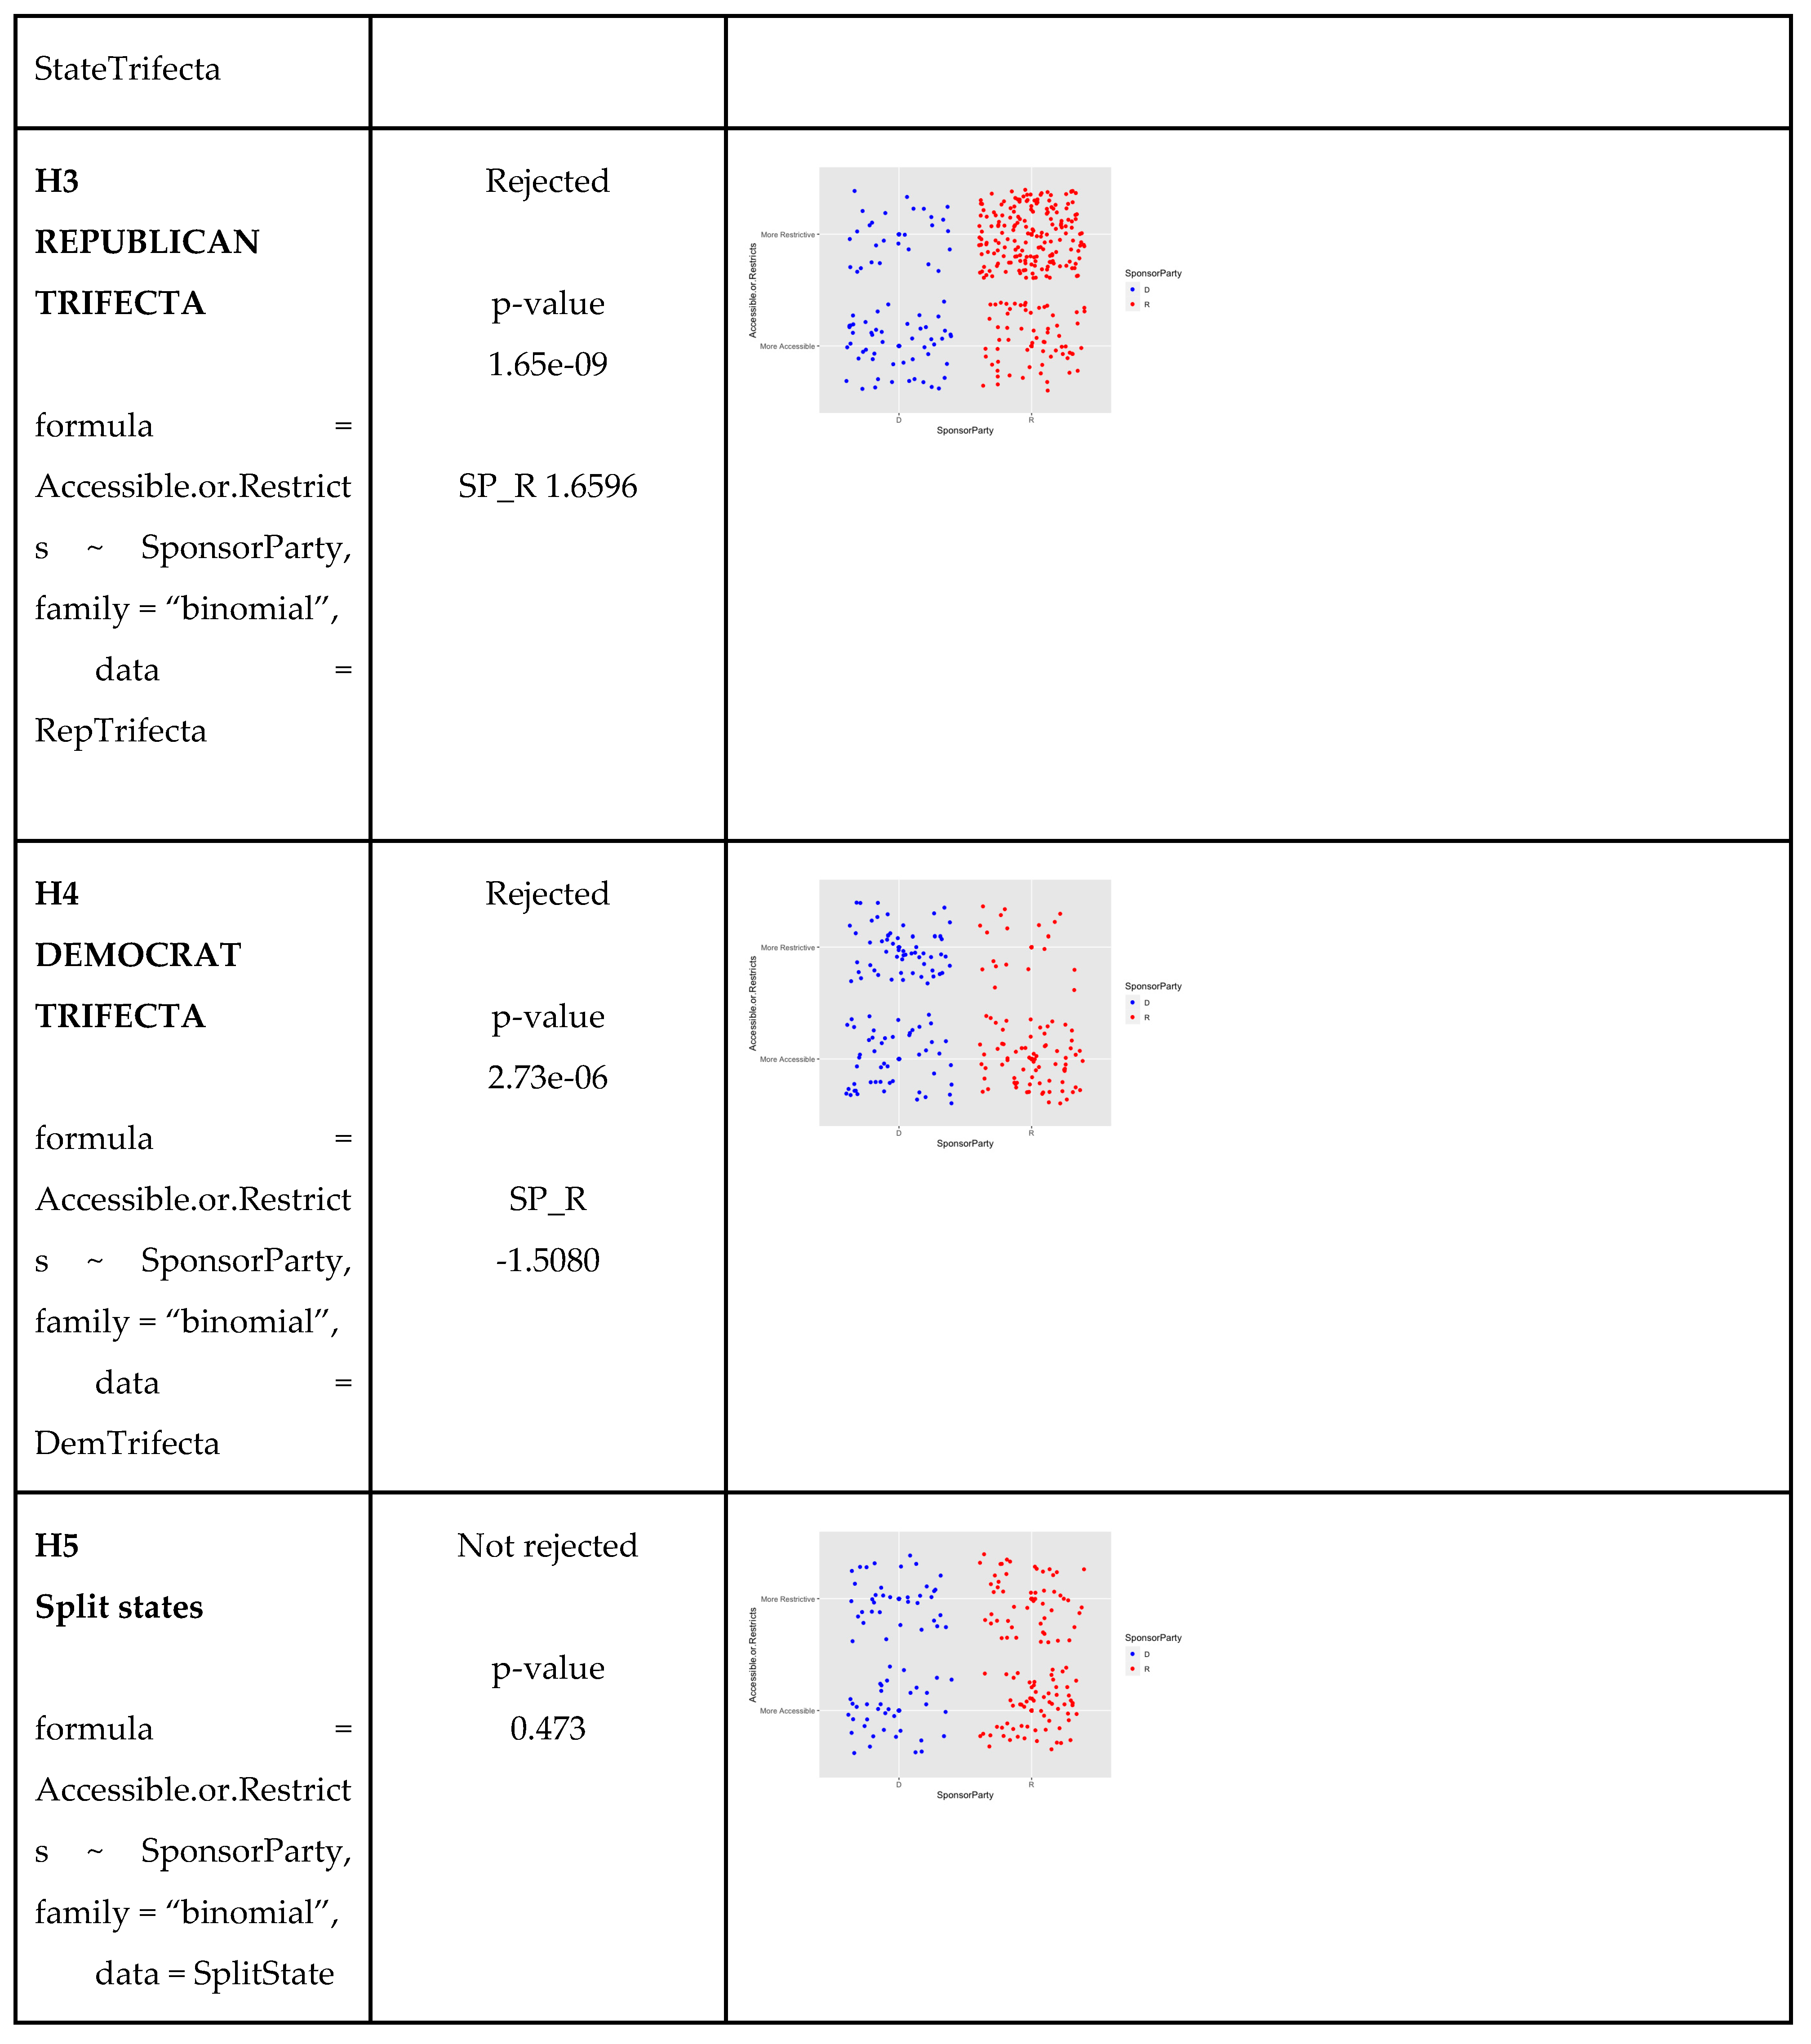
When states were broken into those with either Republican or Democratic unified party control, the patterns were opposing and much stronger. In states with unified Republican control, the odds of observing a restrictive bill were 5.2 times more likely when the sponsor was Republican (p <0.001). When the patterns are analyzed, we found that not only did Republicans propose more restrictive bills, but Democrats proposed more accessible bills.
In states with unified Democratic control, we found an entirely different pattern. Democrats propose roughly equal numbers of bills that restrict or open the ballot measure process. However, Republicans propose many more bills that make the ballot measure process more accessible. In our analysis, we found the odds of observing an accessible bill was 4.5 times more likely when the sponsor was a Republican.
When we repeated the analysis in states with split state government control, we found no difference in the numbers of accessible or restrictive legislation of the ballot measure process between the sponsoring parties.
These results show that from 2010 to 2016, Republicans proposed many more bills to restrict the ballot measure process, especially when they held unified control. When they did not hold complete control, they proposed legislation to make the ballot measure process more accessible. In this same time period, Democrats sponsored roughly equal numbers of bills to restrict and facilitate the ballot measure process, except when Republicans held unified control and Democrats proposed legislation to make the process more accessible.
4. Have there been any changes in the trends of such bills proposed over time?
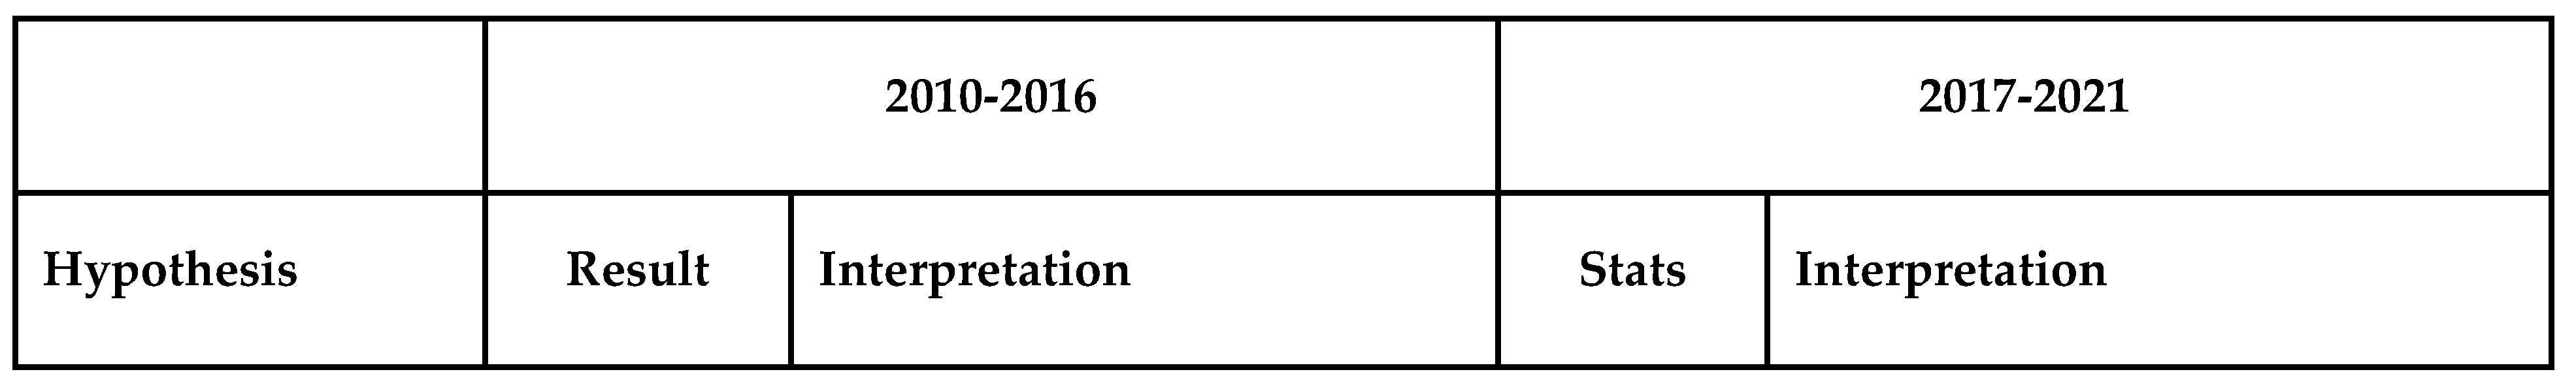
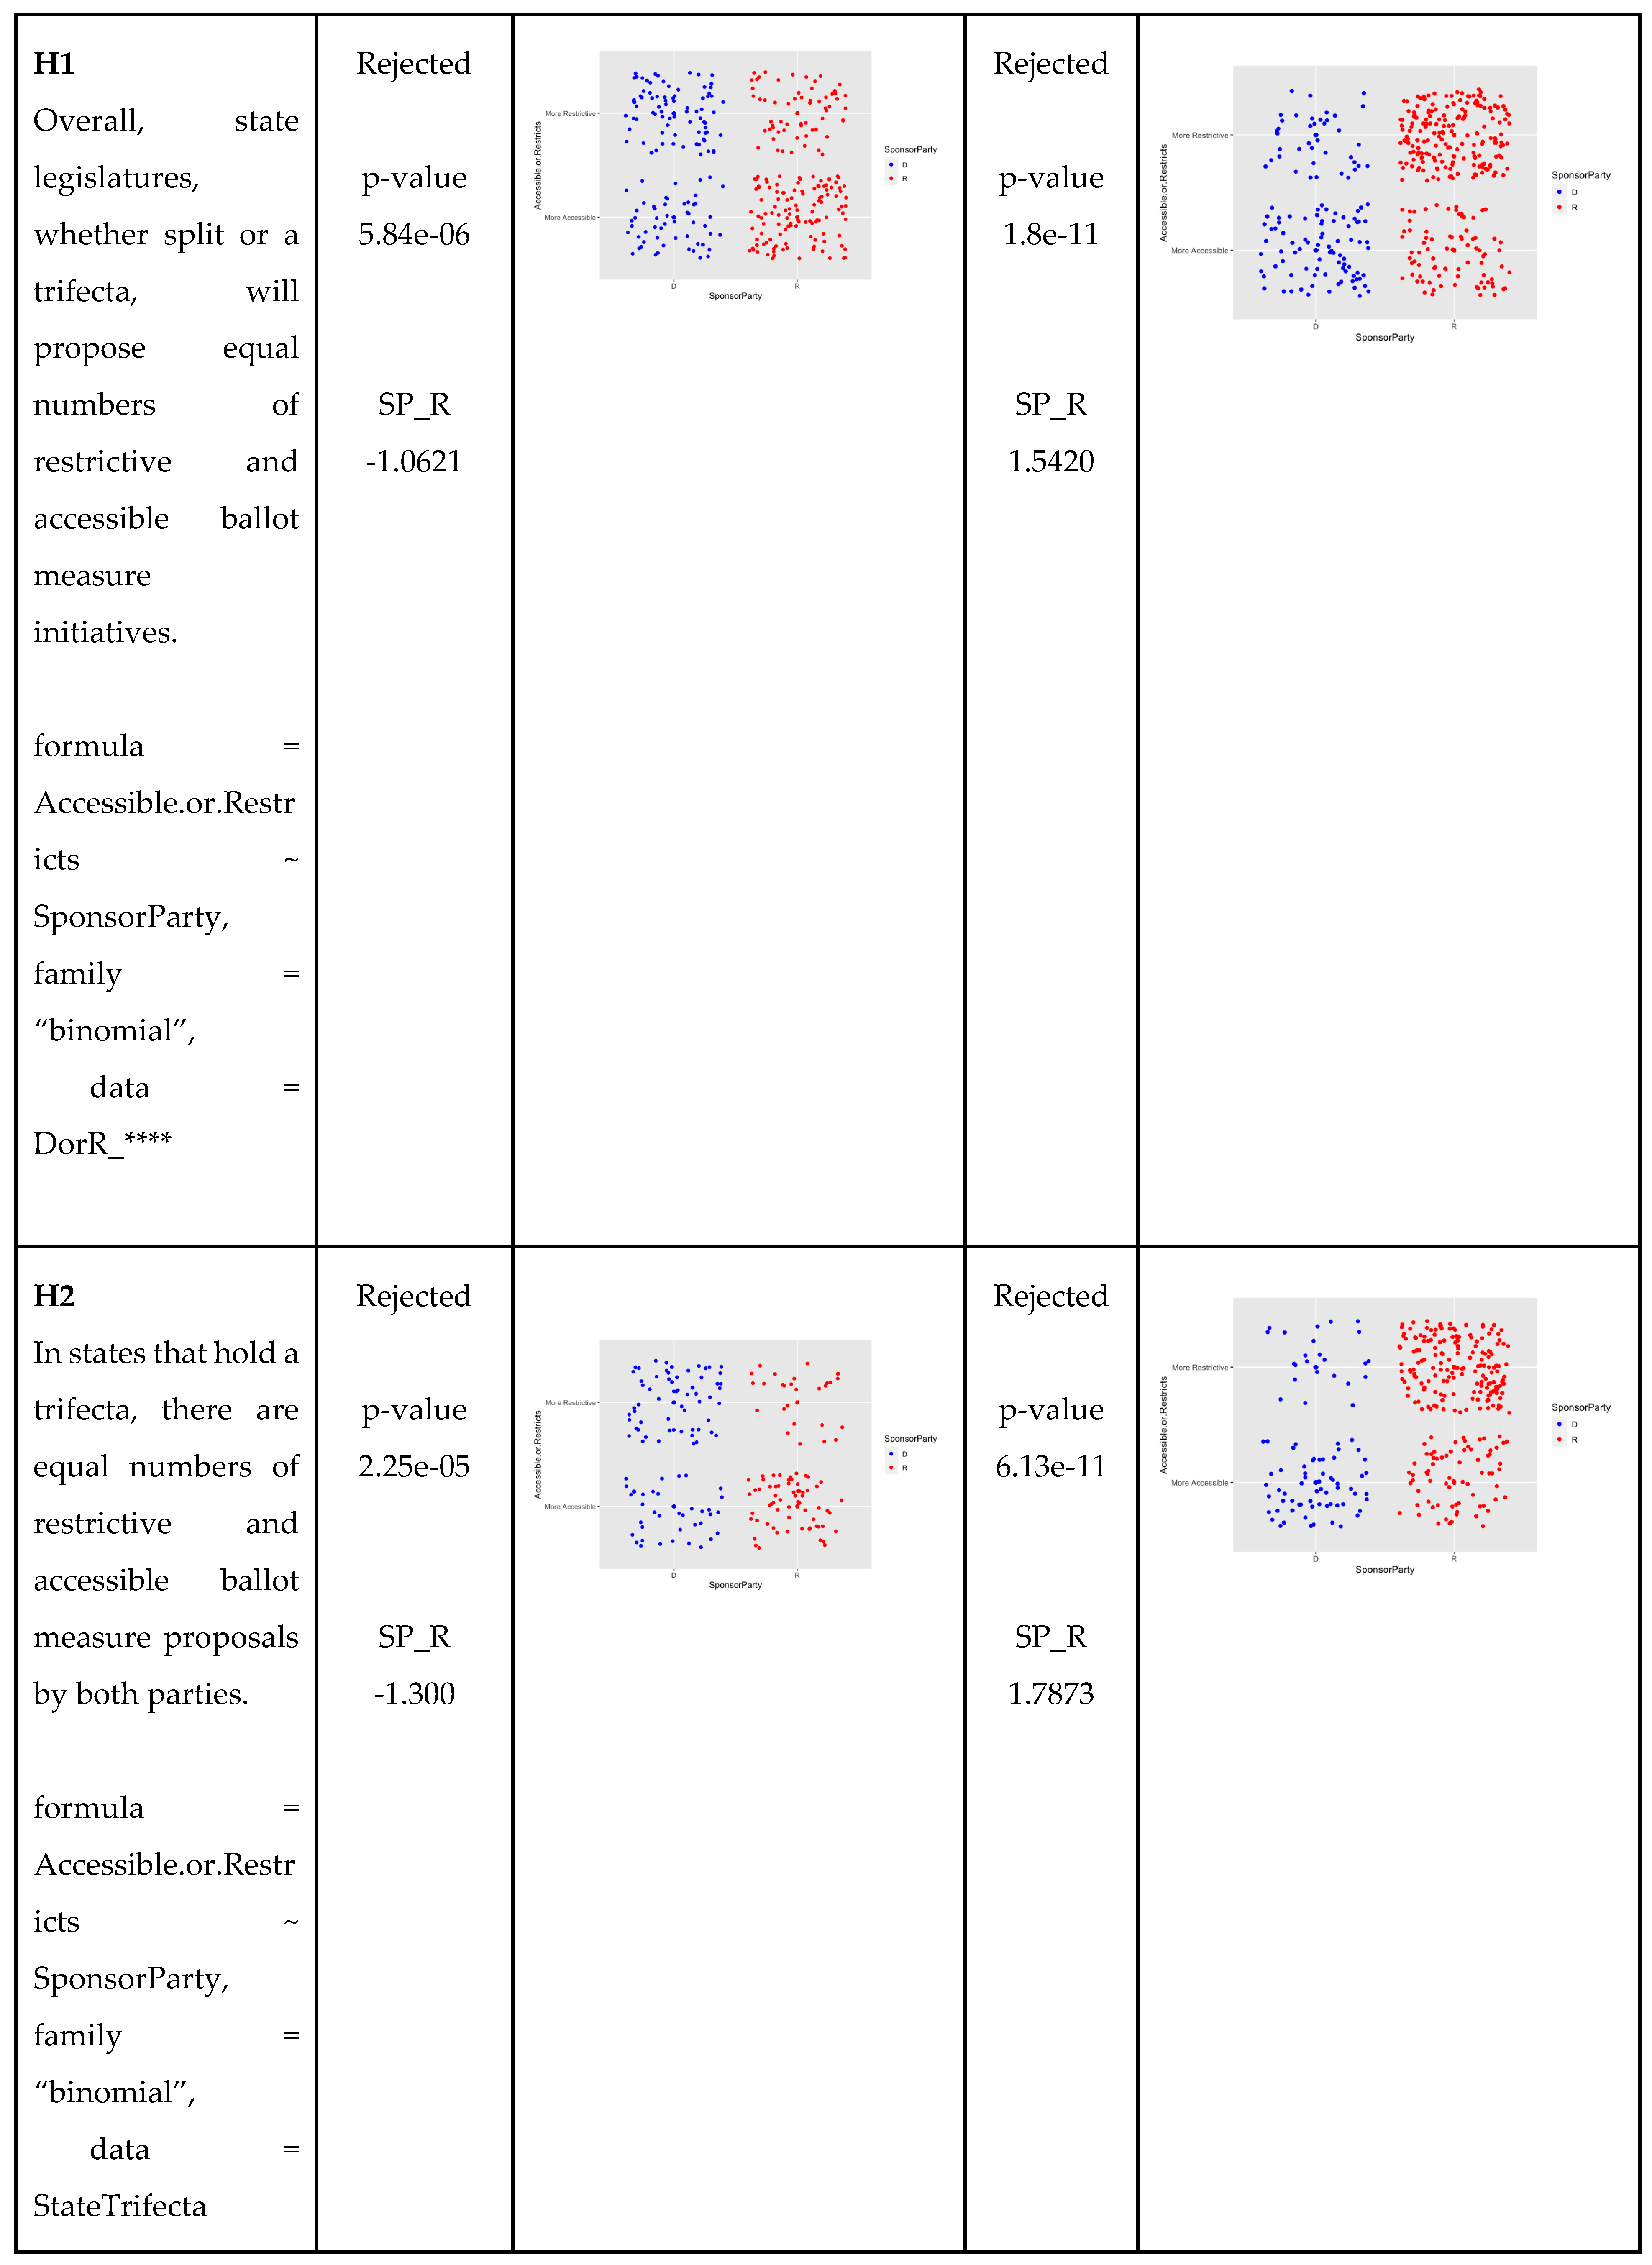
There was a marked change in the total number of ballot measures regulating bills proposed after 2016 and a shift in the relative proportions of accessible and restrictive bills proposed by the parties. Given these time-series trends, we broke the dataset into bills from 2010 to 2016 and from 2017 to 2022 and repeated all of the above analyses on both datasets. Our results indicate a dramatic shift in the use of the ballot measure by the parties over our study period.
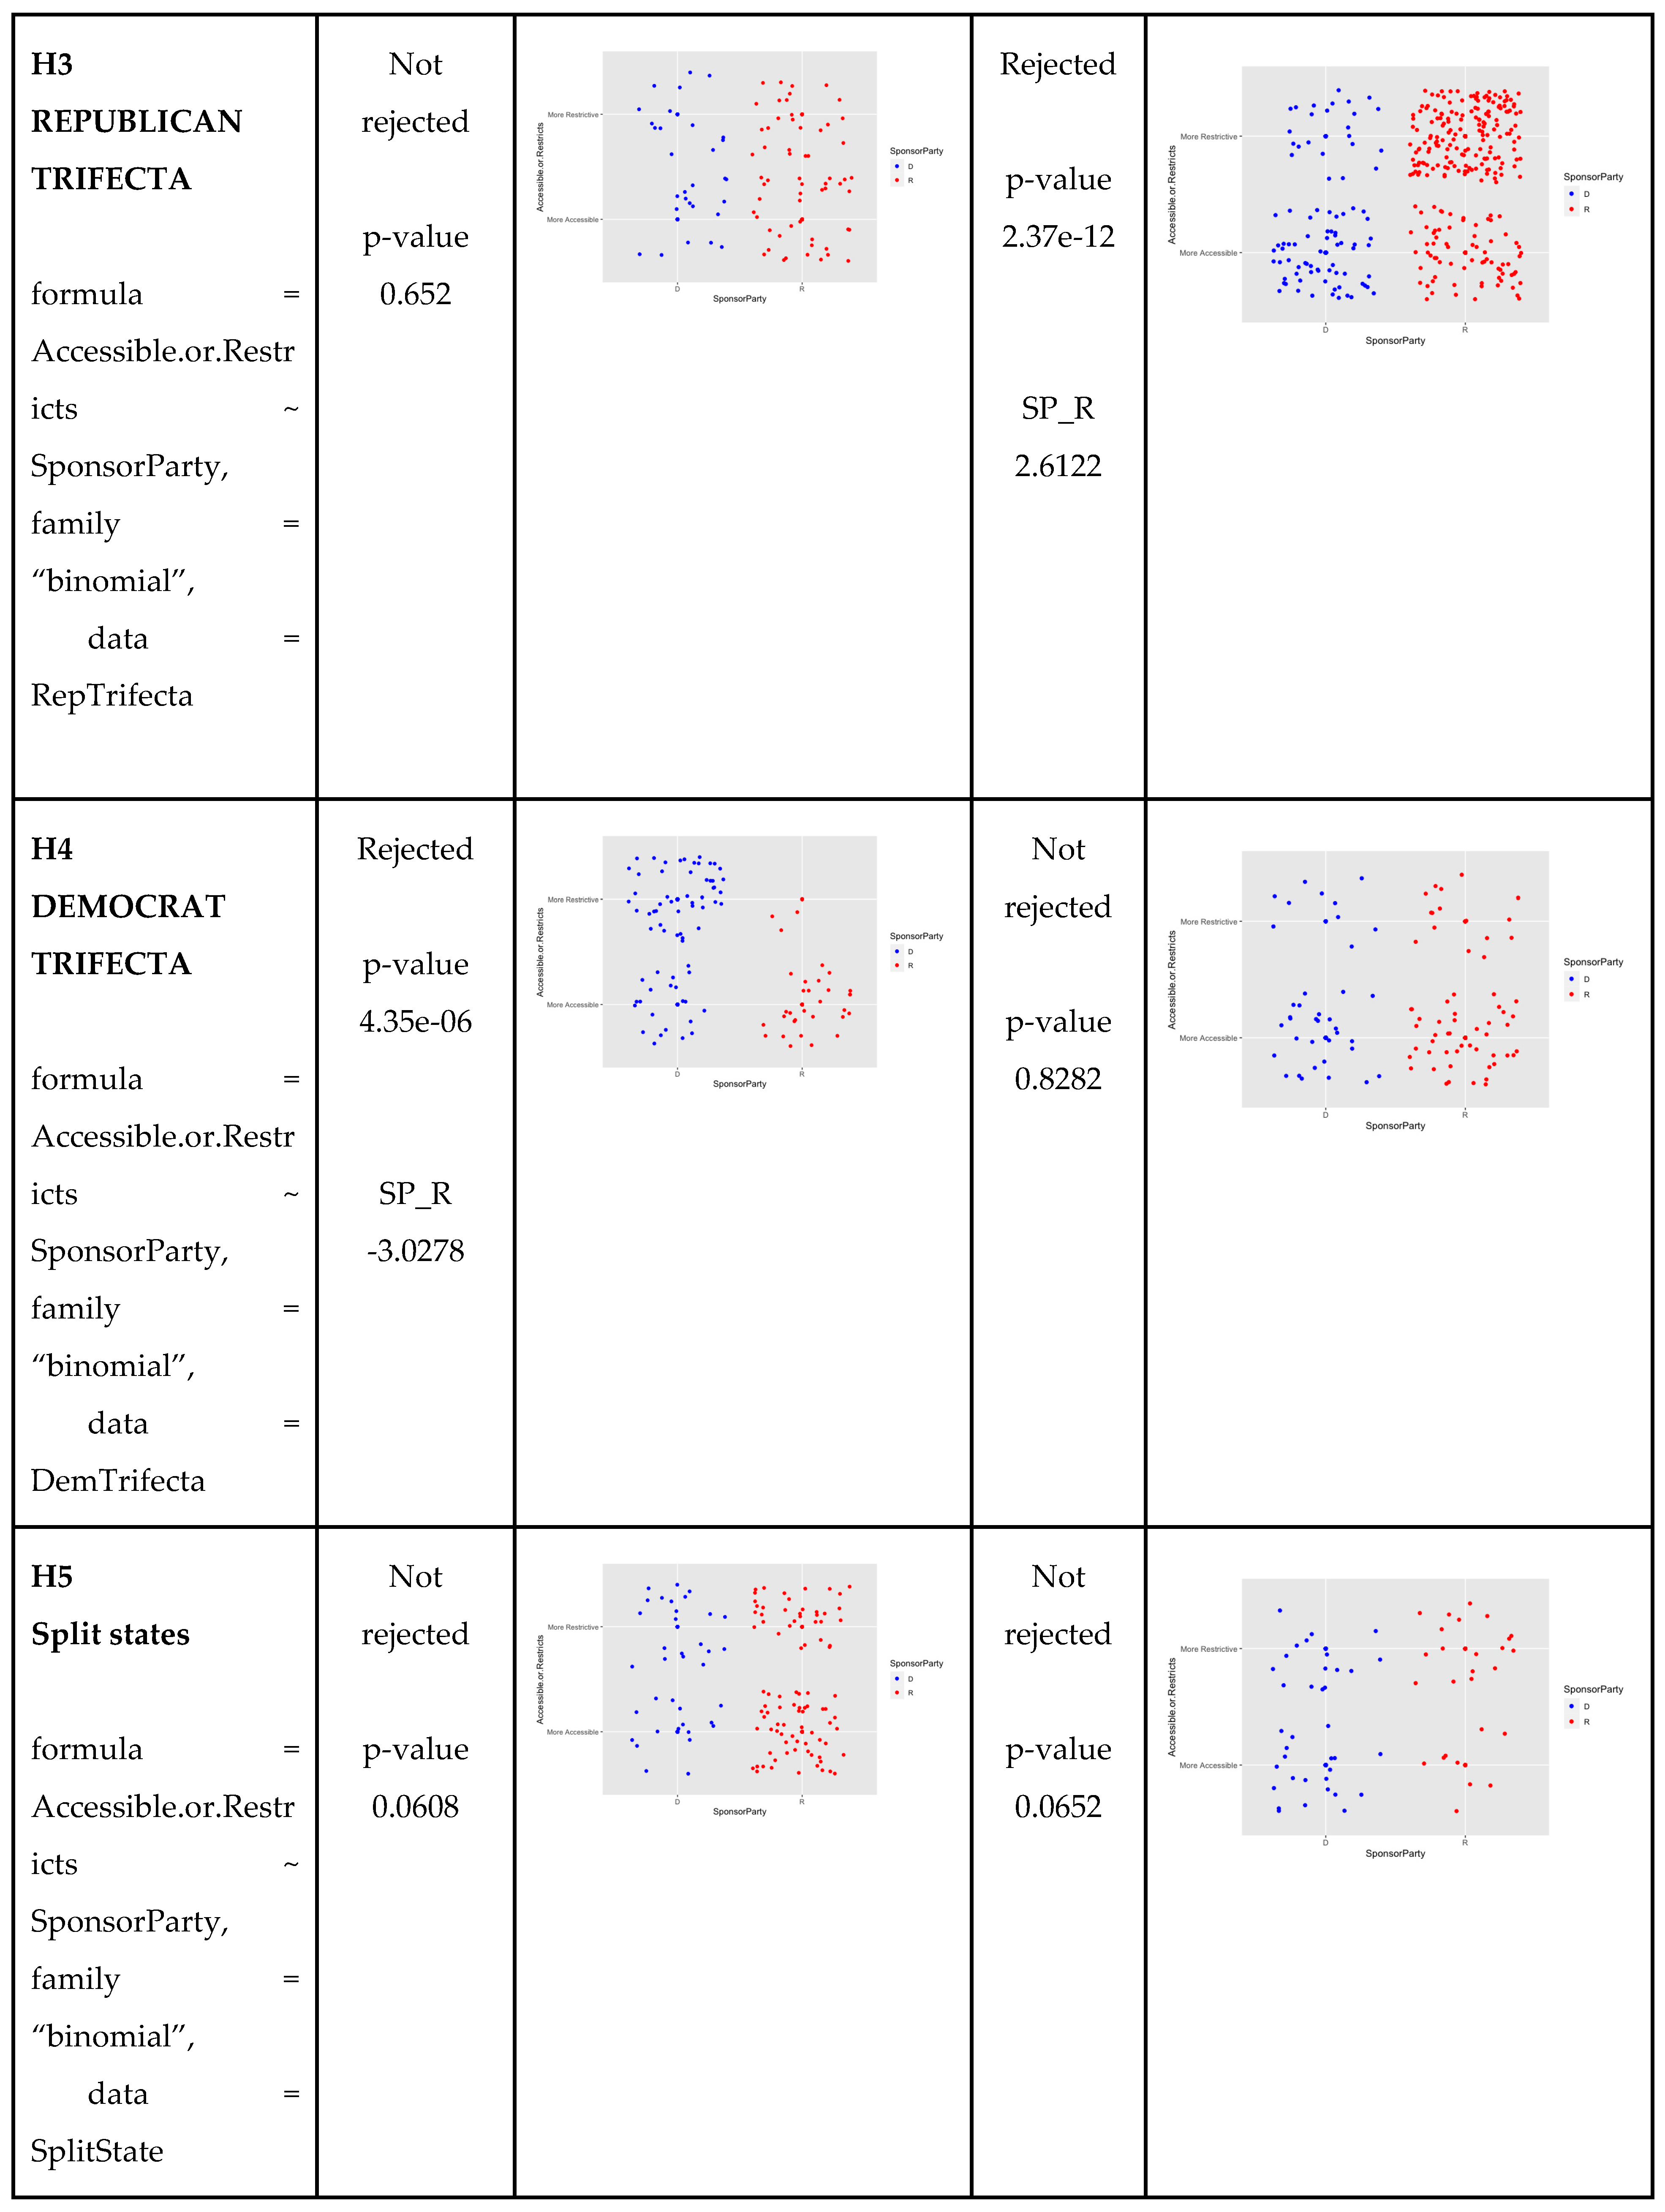
Prior to 2017, we found that the odds of observing a bill restricting the ballot measure process is more likely when the sponsor was a Democrat. Between 2010 and 2016, the pattern of Democrats proposing more restrictive legislation and Republicans proposing more accessible legislation held true when all states are included in the analysis (odds ratio 2.9, p<0.001), when considering all states with unified state control (odds ratio 3.7, p<0.001) and in states with unified Democratic control (odds ratio 20.6, p<0.001). We found no difference in states with unified Republican control (p = 0.652) or states with split control (p = 0.0608).
Between 2017 and 2022, the odds of observing a bill restricting the ballot measure process was more likely when the proposer was a Republican. We found this pattern when considering all states (odds ratio 4.7, p<0.001), states with unified control (odds ratio 6.0, p<0.001) and in states with unified Republican control (odds ratio 13.6, p<0.001). This pattern was driven by Democrats proposing proportionally more accessible legislation and Republicans proposing a high proportion of bills restricting the ballot measure process. We found no difference in states with unified Democratic control (p = 0.8282) or states with split control (p = 0.0652) in this time period. Interestingly, in states with unified Democratic control, both Democrats and Republicans sponsored many more bills to increase access to the ballot measure process.
The most recent data suggest that when Republicans already have complete control of state government, they propose many bills to restrict the ballot measure process. Although prior to 2017, Democrats had a significant trend of doing the same thing, the numbers of restrictive bills introduced by Republicans in the last six years has far outpaced any attempts to restrict the process by Democrats prior to 2017.
In an analysis of the number of bills produced by the state, we found a disproportionate number of legislation originating from Missouri (Figure 10). To ensure the conclusions reached from the total dataset were not driven by the excess bills proposed by Missouri legislators, we removed Missouri bills from the dataset and repeated our initial time series analysis, identifying a similar trend. We also repeated the logistic regression from the 2017 to 2022 time period and came to the same conclusion; the odds of observing a bill restricting the ballot measure process was 3.78 times more likely when the proposer was a Republican (p < 0.001).
V. What This Means and How to Combat These Attempts
As detailed above, our review of the ballot measure process-related legislation from 2010 through 2022 found that Democrats initially attempted to restrict the ballot measure process when Republicans used the process to pass measures that restricted individual rights. However, as progressives had more success with passing progressive ballot measures, Republicans – especially when holding a trifecta in state government – attempted to restrict the ballot measure process far more extensively than any attempts to restrict the process by Democrats prior to 2017.
Therefore, we can draw three significant conclusions from these patterns. First, Democrats are willing to restrict the ballot measure process when conservatives attempt to use the process to restrict rights. This is evident based on conservative attempts to restrict gay marriage through the ballot measure in the 2000s and Democratic efforts to stop those attacks. Second, Republican attempts to restrict the ballot measure process far outpace any initial attempts by Democrats during the period we studied, especially when Republicans have a trifecta in the state government. This speaks to the long-term Republican strategy of power-grabbing seen not only here, but throughout the political process in recent years (The Washington Post 2020). Finally, with continued progressive success with ballot measures, the patterns show that Republicans will only continue to attempt to restrict the ballot measure process.
Progressives need to fight to keep the process available for generations to come. In practice, that means progressives need to elect legislators who support making the ballot measure process more accessible and lobby legislators to ensure they are not making the process more restrictive. Progressives can also enact ballot measures that make the process stronger, including limiting the legislature’s ability to change ballot measures and broadening the ballot measure process.
Appendix A
Hypotheses:
State legislatures introduce an equal number of bills that both facilitate and restrict the ballot measure process. There is no difference in the number of bills that aim to increase accessibility or impose restrictions, sponsored by Democrats and Republicans.
Summary of hypotheses: All Years
Summary of hypotheses: Split Years
References
- Edwards-Levy, Ariel. 2017. “Progressive Activism Has Surged Since Donald Trump Took Office.” HuffPost. March 30, 2017. https://www.huffpost.com/entry/progressive-activism-surge-donald-trump-took-office_n_58dd8950e4b0e6ac7093b3c1.
- Isenstadt, Alex. 2017. “Team Trump Turns to Rove Playbook to Juice 2018 Turnout.” POLITICO. August 28, 2017. https://www.politico.com/story/2017/08/28/trump-karl-rove-2018-elections-242074.
- Levinson, Jessica A. 2014. “Taking the Initiative: How to Save Direct Democracy.” Lewis & Clark L. Rev. 18: 1019. https://heinonline.org/hol-cgi-bin/get_pdf.cgi?handle=hein.journals/lewclr18§ion=43.
- Matsusaka, John G. 2006. “Election Results 2006.” Initiative & Referendum Institute. November 5, 2006. http://www.iandrinstitute.org/.
- ———. 2008. “Election 2008: Mixed Results.” Initiative & Referendum Institute. December 10, 2008. http://www.iandrinstitute.org/.
- ———. 2010. “Election Results 2010: Tea Party Spillover?” Initiative & Referendum Institute. November 5, 2010. http://www.iandrinstitute.org/.
- ———. 2012. “Election Results 2012: Breakthrough Wins for Marijuana and Same-Sex Marriage.” Initiative & Referendum Institute. November 8, 2012. http://www.iandrinstitute.org/.
- ———. 2014. “Election Results 2014: Yes on Marijuana and Minimum Wage, No on Taxes.” Initiative & Referendum Institute. November 5, 2014. http://www.iandrinstitute.org/.
- ———. 2019. “November 2018 Election Results.” Initiative & Referendum Institute. January 3, 2019. http://www.iandrinstitute.org/.
- ———. 2020. “November 2020 Election Results.” Initiative & Referendum Institute. November 1, 2020. http://www.iandrinstitute.org/.
- Persily, Nathaniel A. 1997. “The Peculiar Geography of Direct Democracy: Why the Initiative, Referendum and Recall Developed in the American West.” Mich. L. & Pol’y Rev. 2: 11. https://heinonline.org/hol-cgi-bin/get_pdf.cgi?handle=hein.journals/mlpr2§ion=6.
- Roff, Peter. 2010. “Measuring the Size of Election 2010′s Republican Sweep.” U.S. News & World Report. November 5, 2010. https://www.usnews.com/opinion/blogs/peter-roff/2010/11/05/measuring-the-size-of-election-2010s-republican-sweep.
- Scott, Dylan. 2022. “What Wins for Medicaid and the Minimum Wage Mean for the Future of Ballot Initiatives.” November 9, 2022. https://www.vox.com/policy-and-politics/23435259/2022-election-results-ballot-initiatives-arizona-south-dakota.
- Sharkey, Emma Olson, and Zachary P. Morrison. 2023. “Republicans Aim to Weaken Ballot Measure Process after Progressive Victories.” Salon.com. March 15, 2023. https://www.salon.com/2023/03/15/aim-to-weaken-ballot-measure-process-after-progressive-victories/.
- Smith, Daniel A., and Caroline Tolbert. 2009. Educated by Initiative: The Effects of Direct Democracy on Citizens and Political Organizations in the American States. University of Michigan Press. https://play.google.com/store/books/details?id=D5mhyg2F4-4C.
- The Washington Post. 2020. “Wisconsin Republicans Are Exploiting the Pandemic to Grab Power. It’s a Dangerous Precedent,” April 5, 2020. https://www.washingtonpost.com/opinions/2020/04/05/wisconsin-republicans-are-exploiting-pandemic-grab-power-its-dangerous-precedent/.
Figure 1.
Number of ballot initiatives.
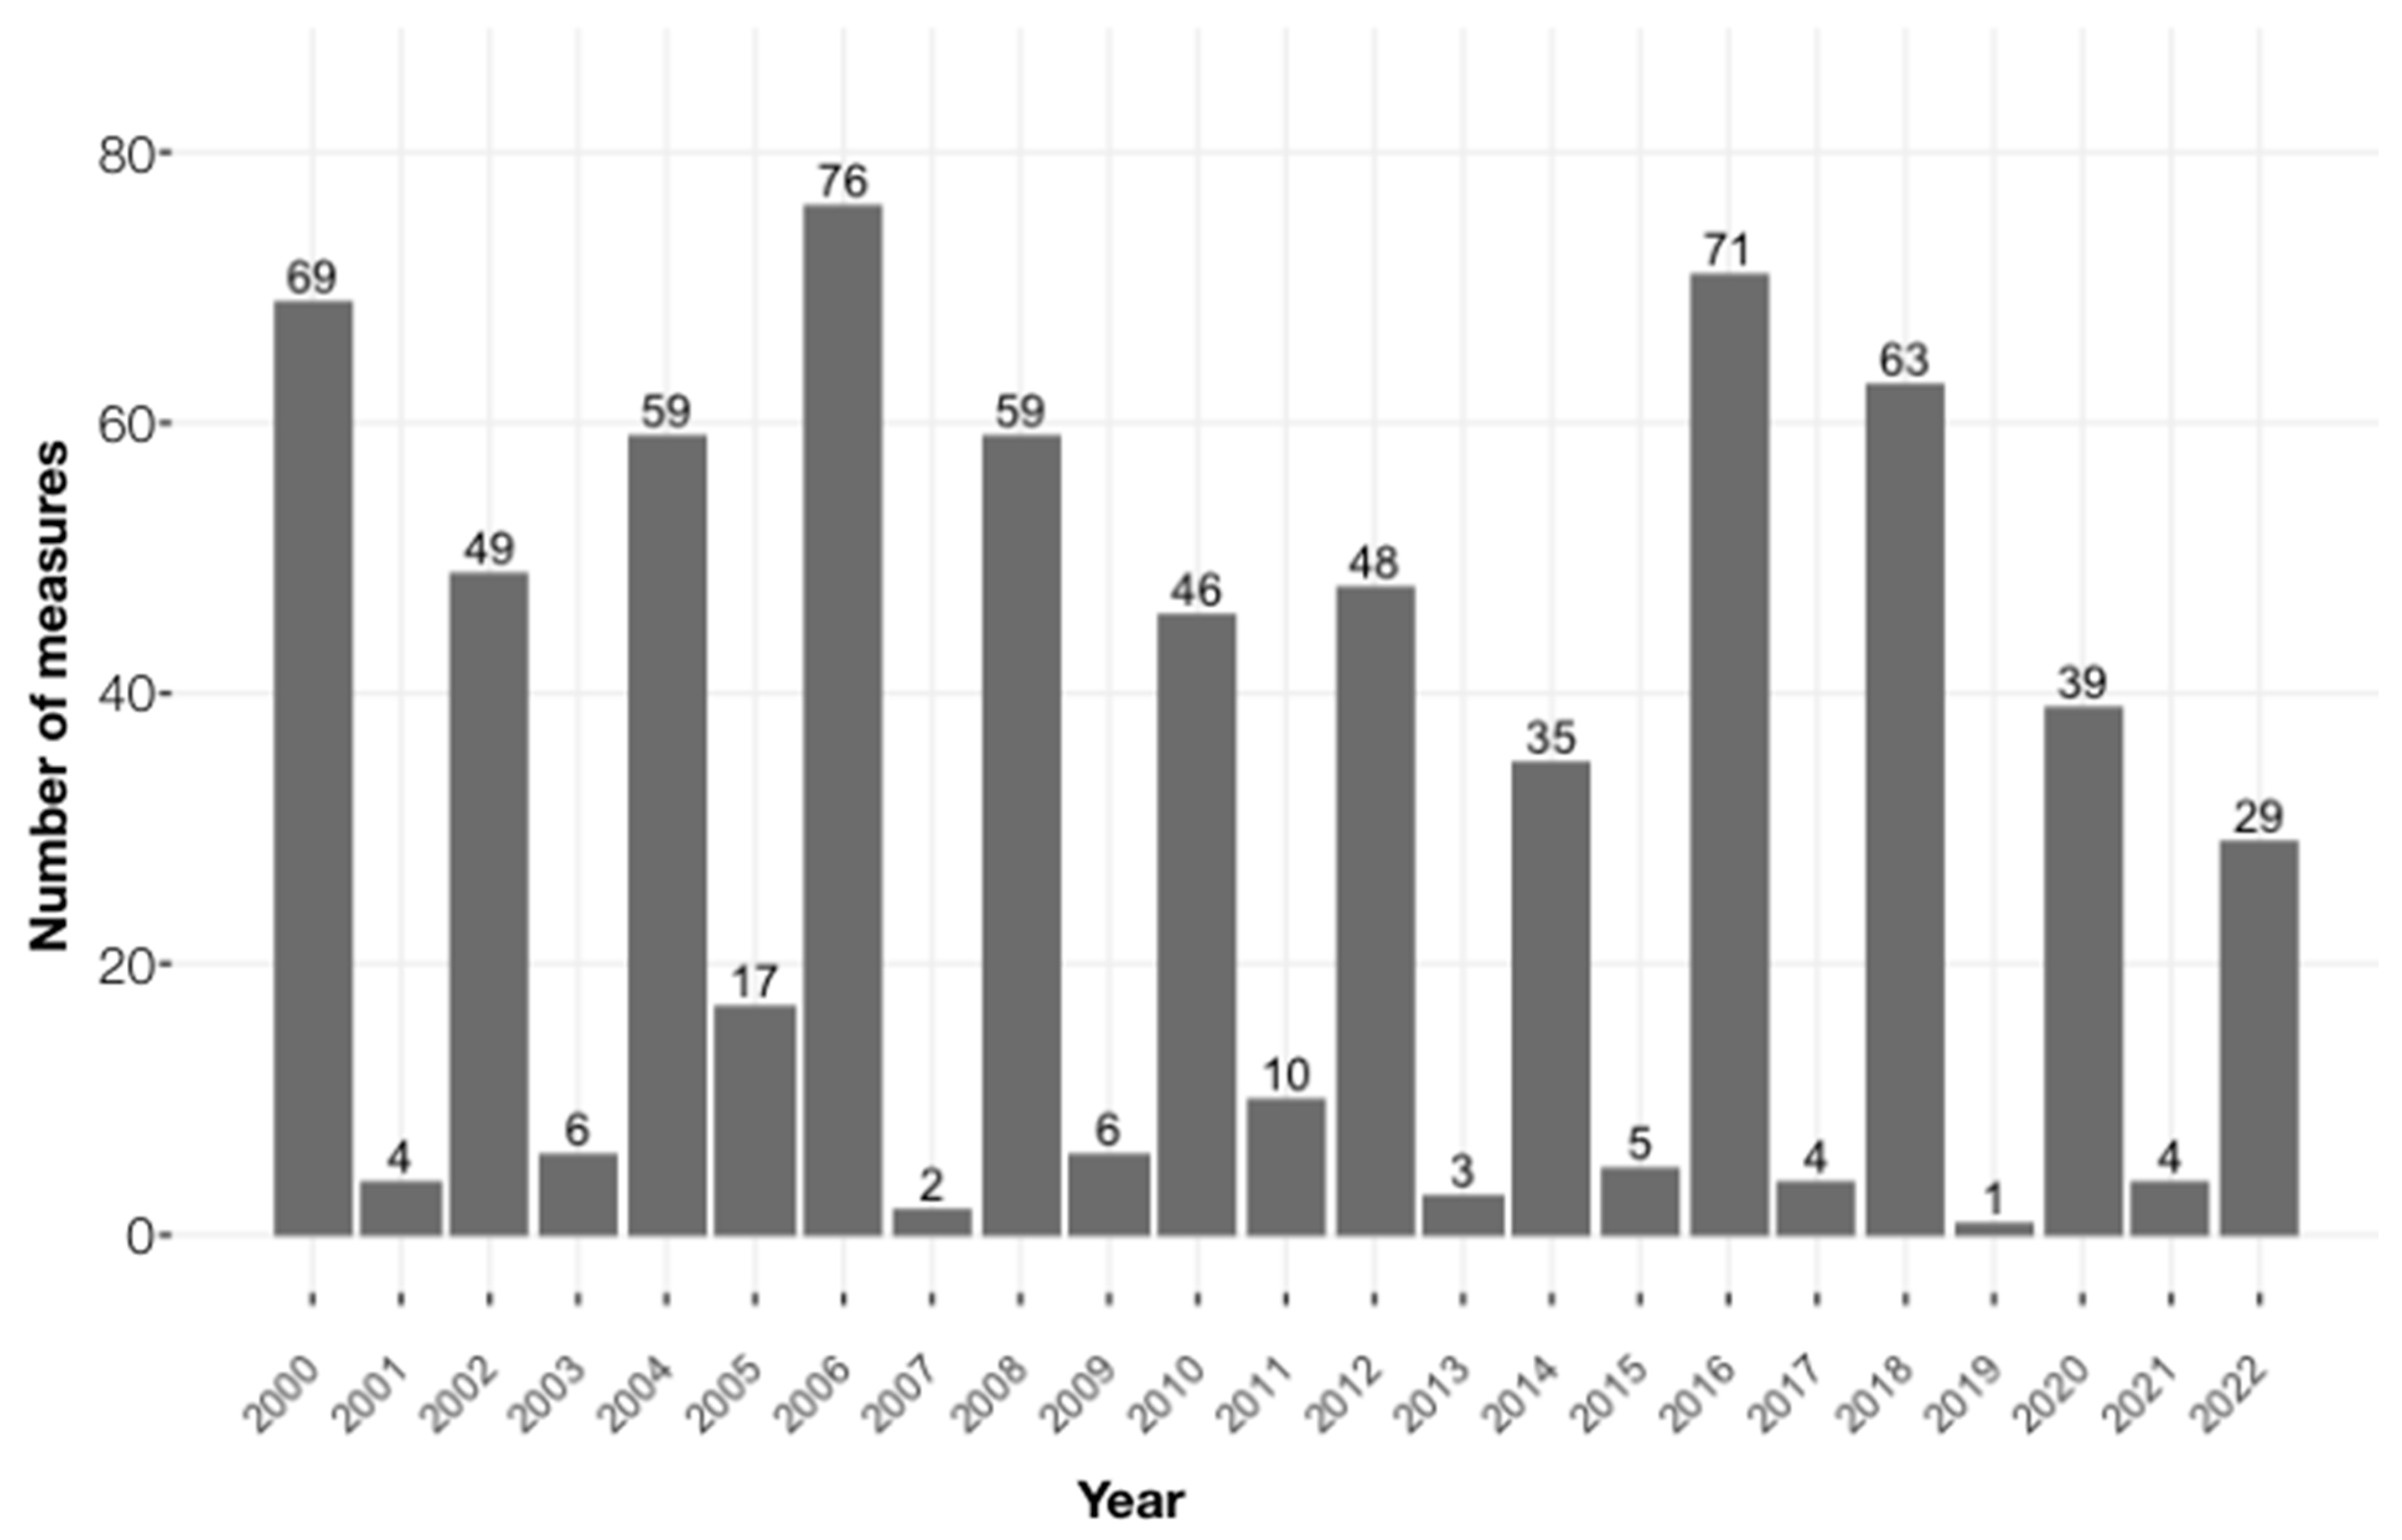
Figure 2.
Restrictive Ballot Measure Process Legislation By Category.
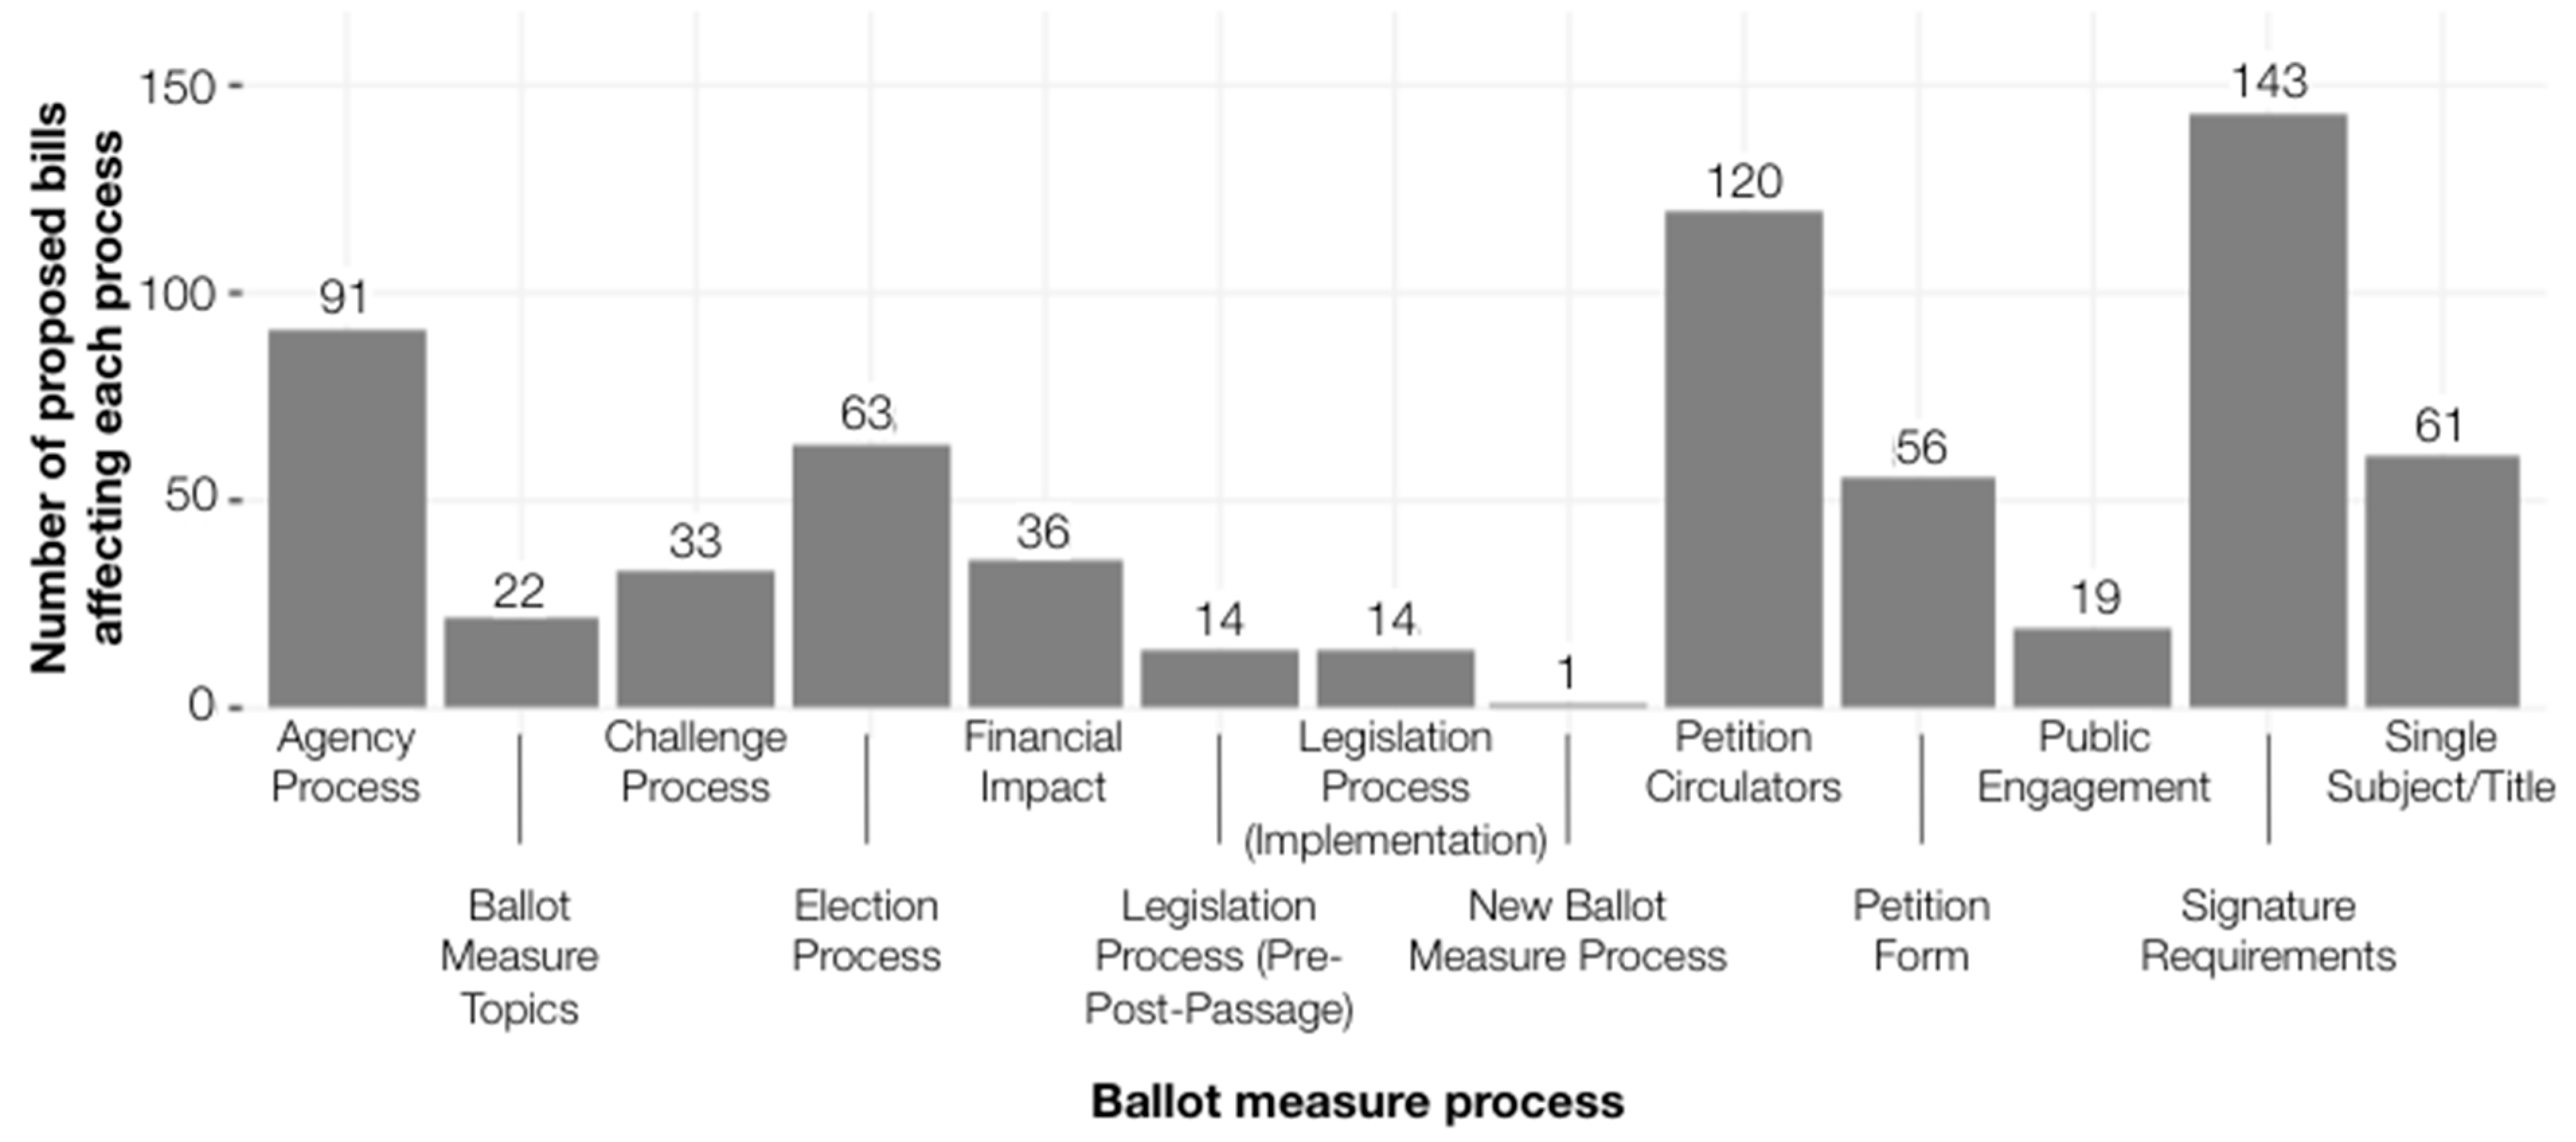
Figure 3.
Restrictive Ballot Measure Process Legislation By State.
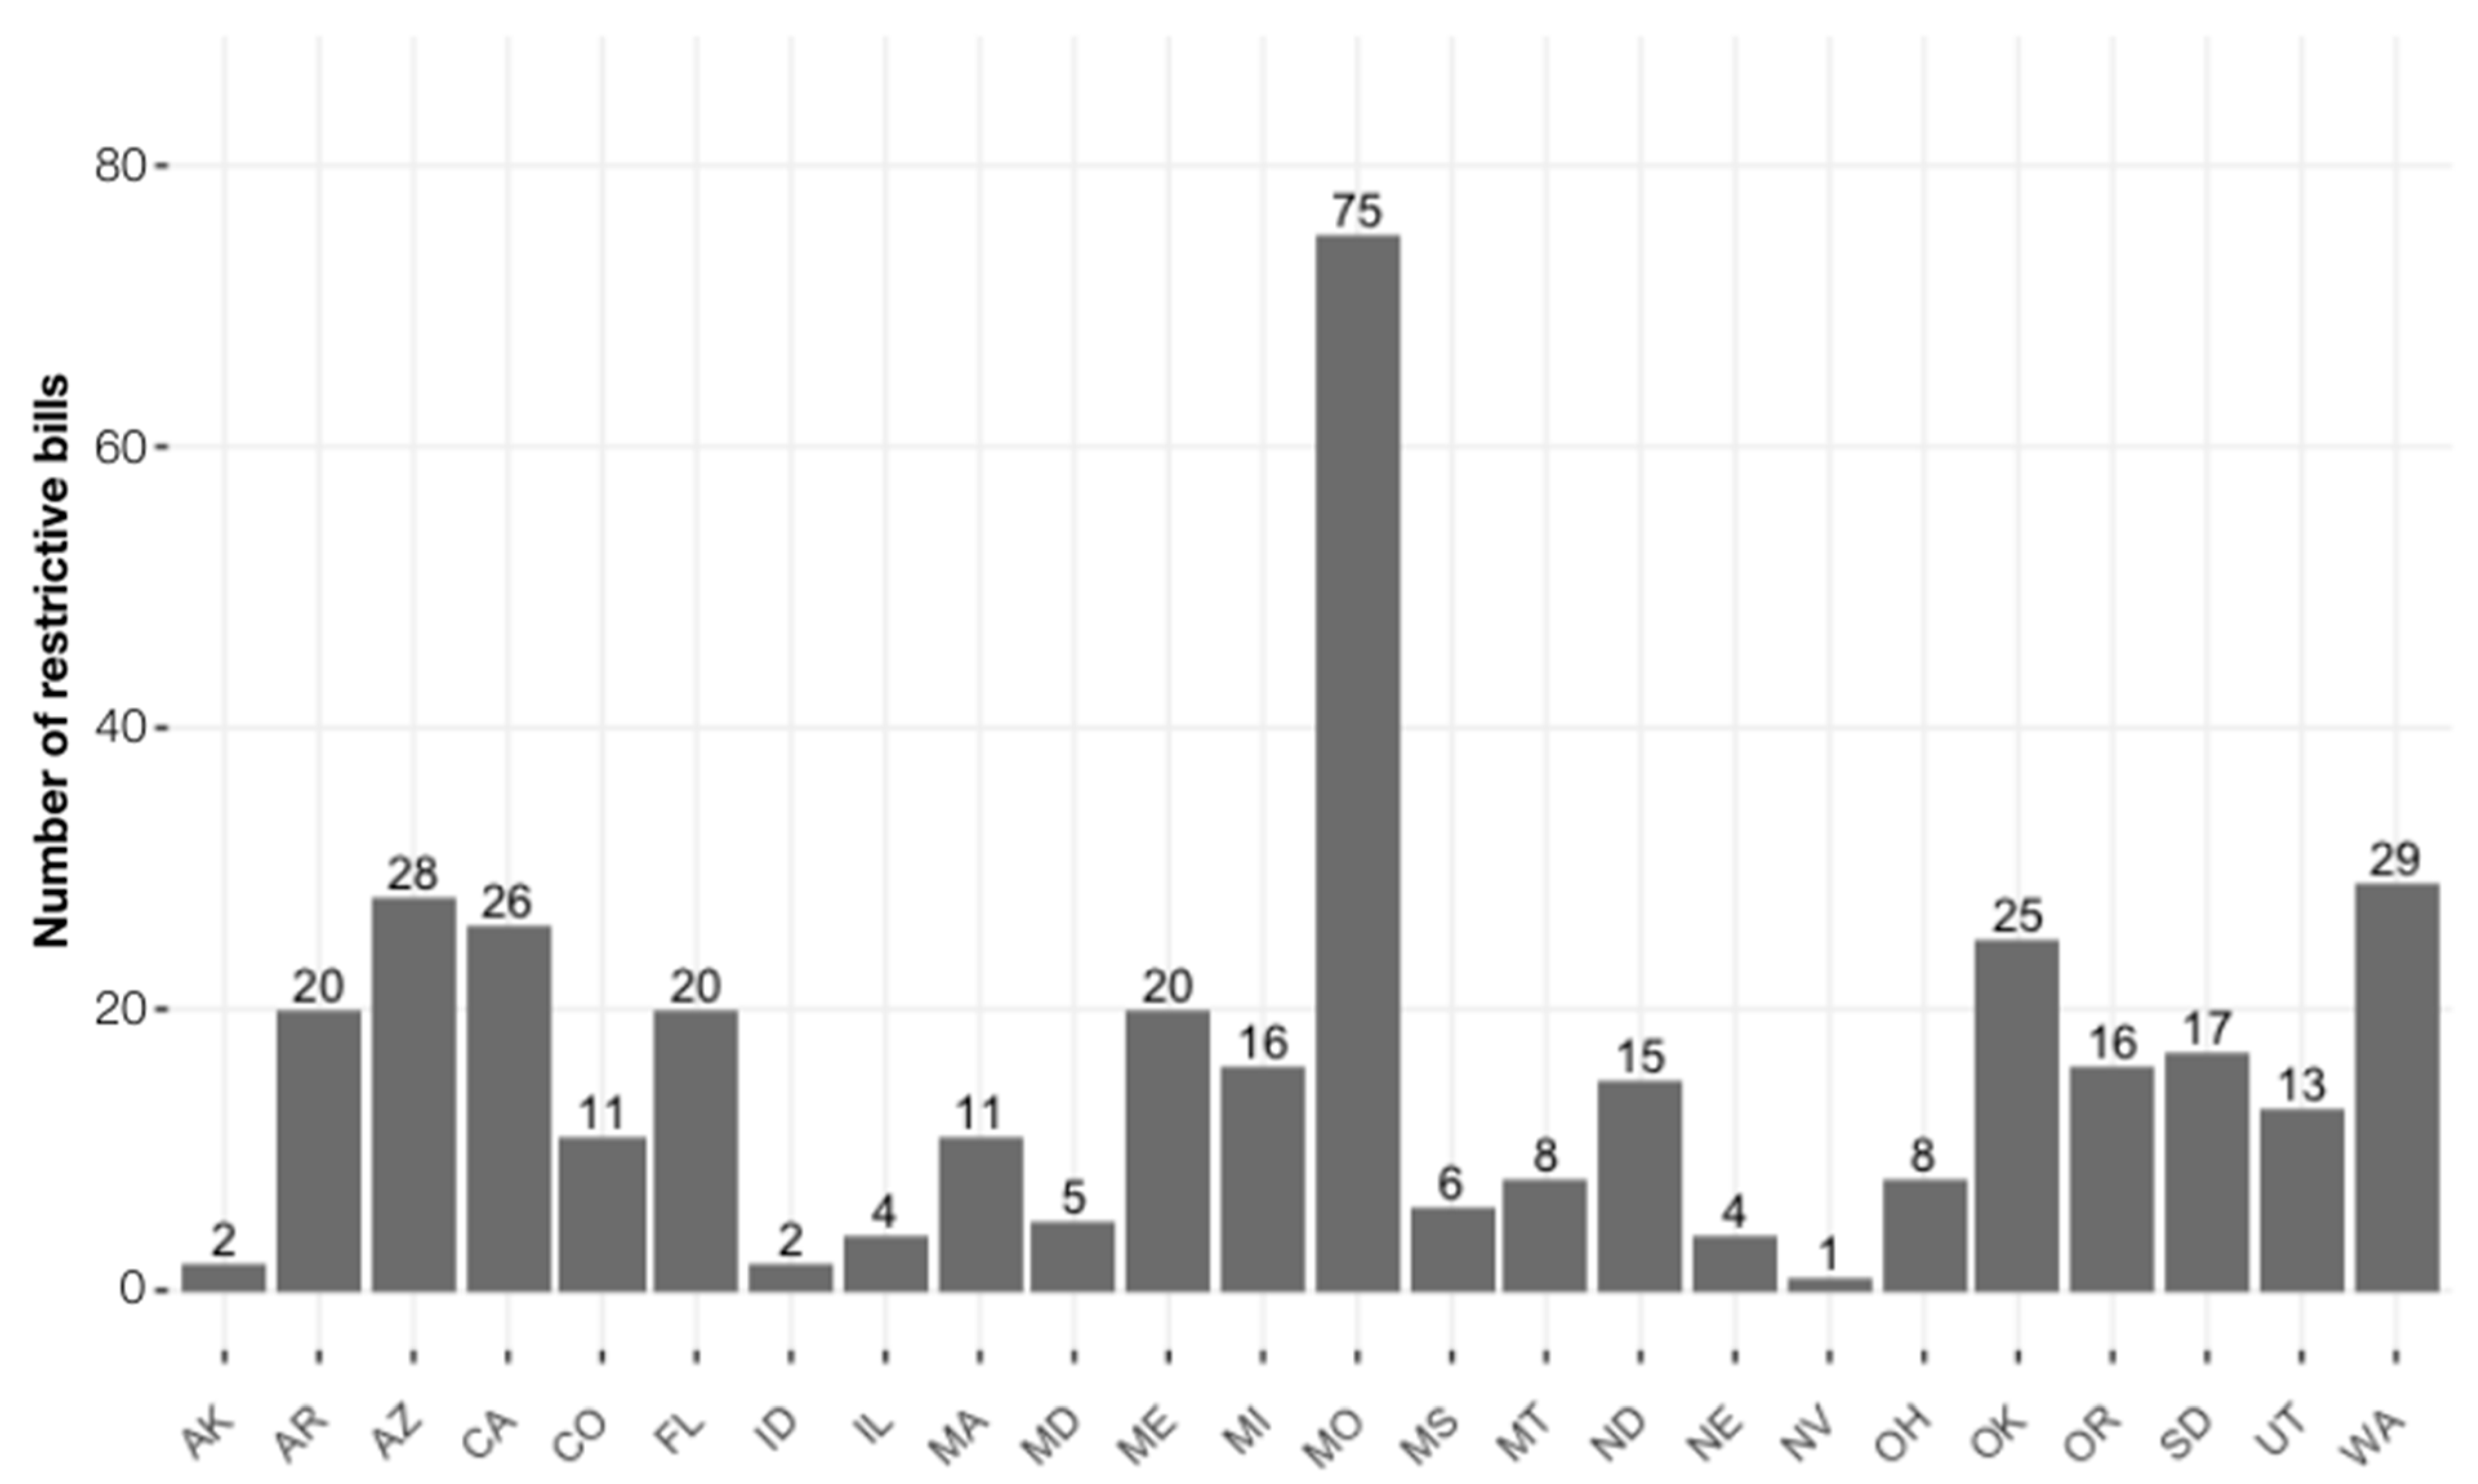
Figure 4.
Accessible Ballot Measure Process Legislation by Category.
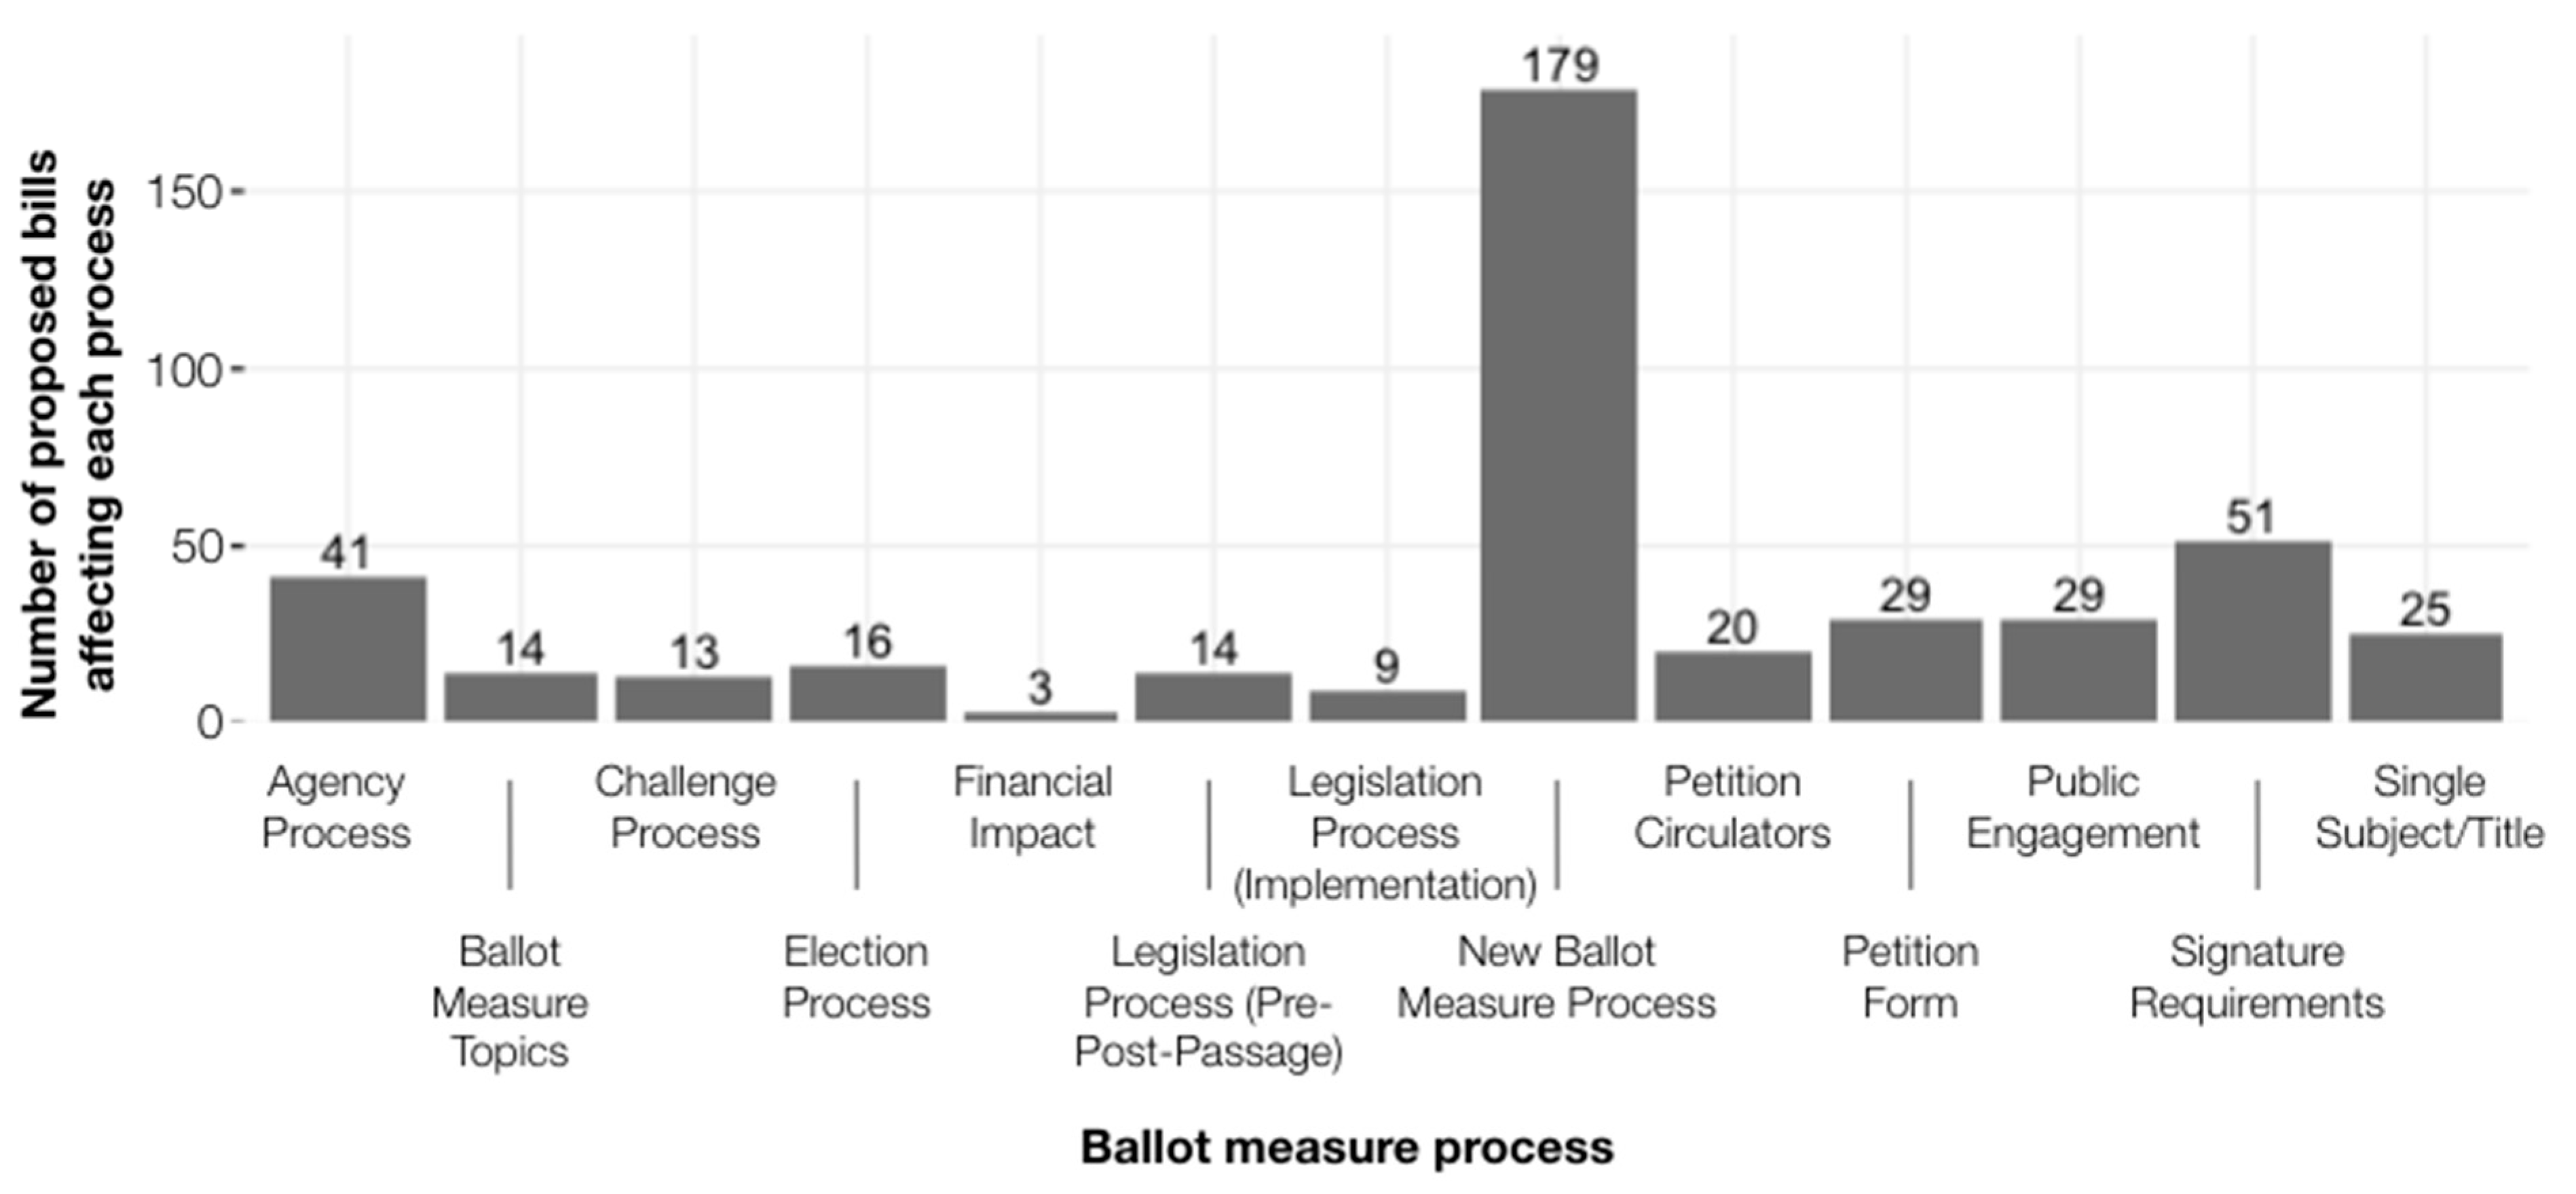
Figure 5.
Accessible Ballot Measure Process Legislation by State.
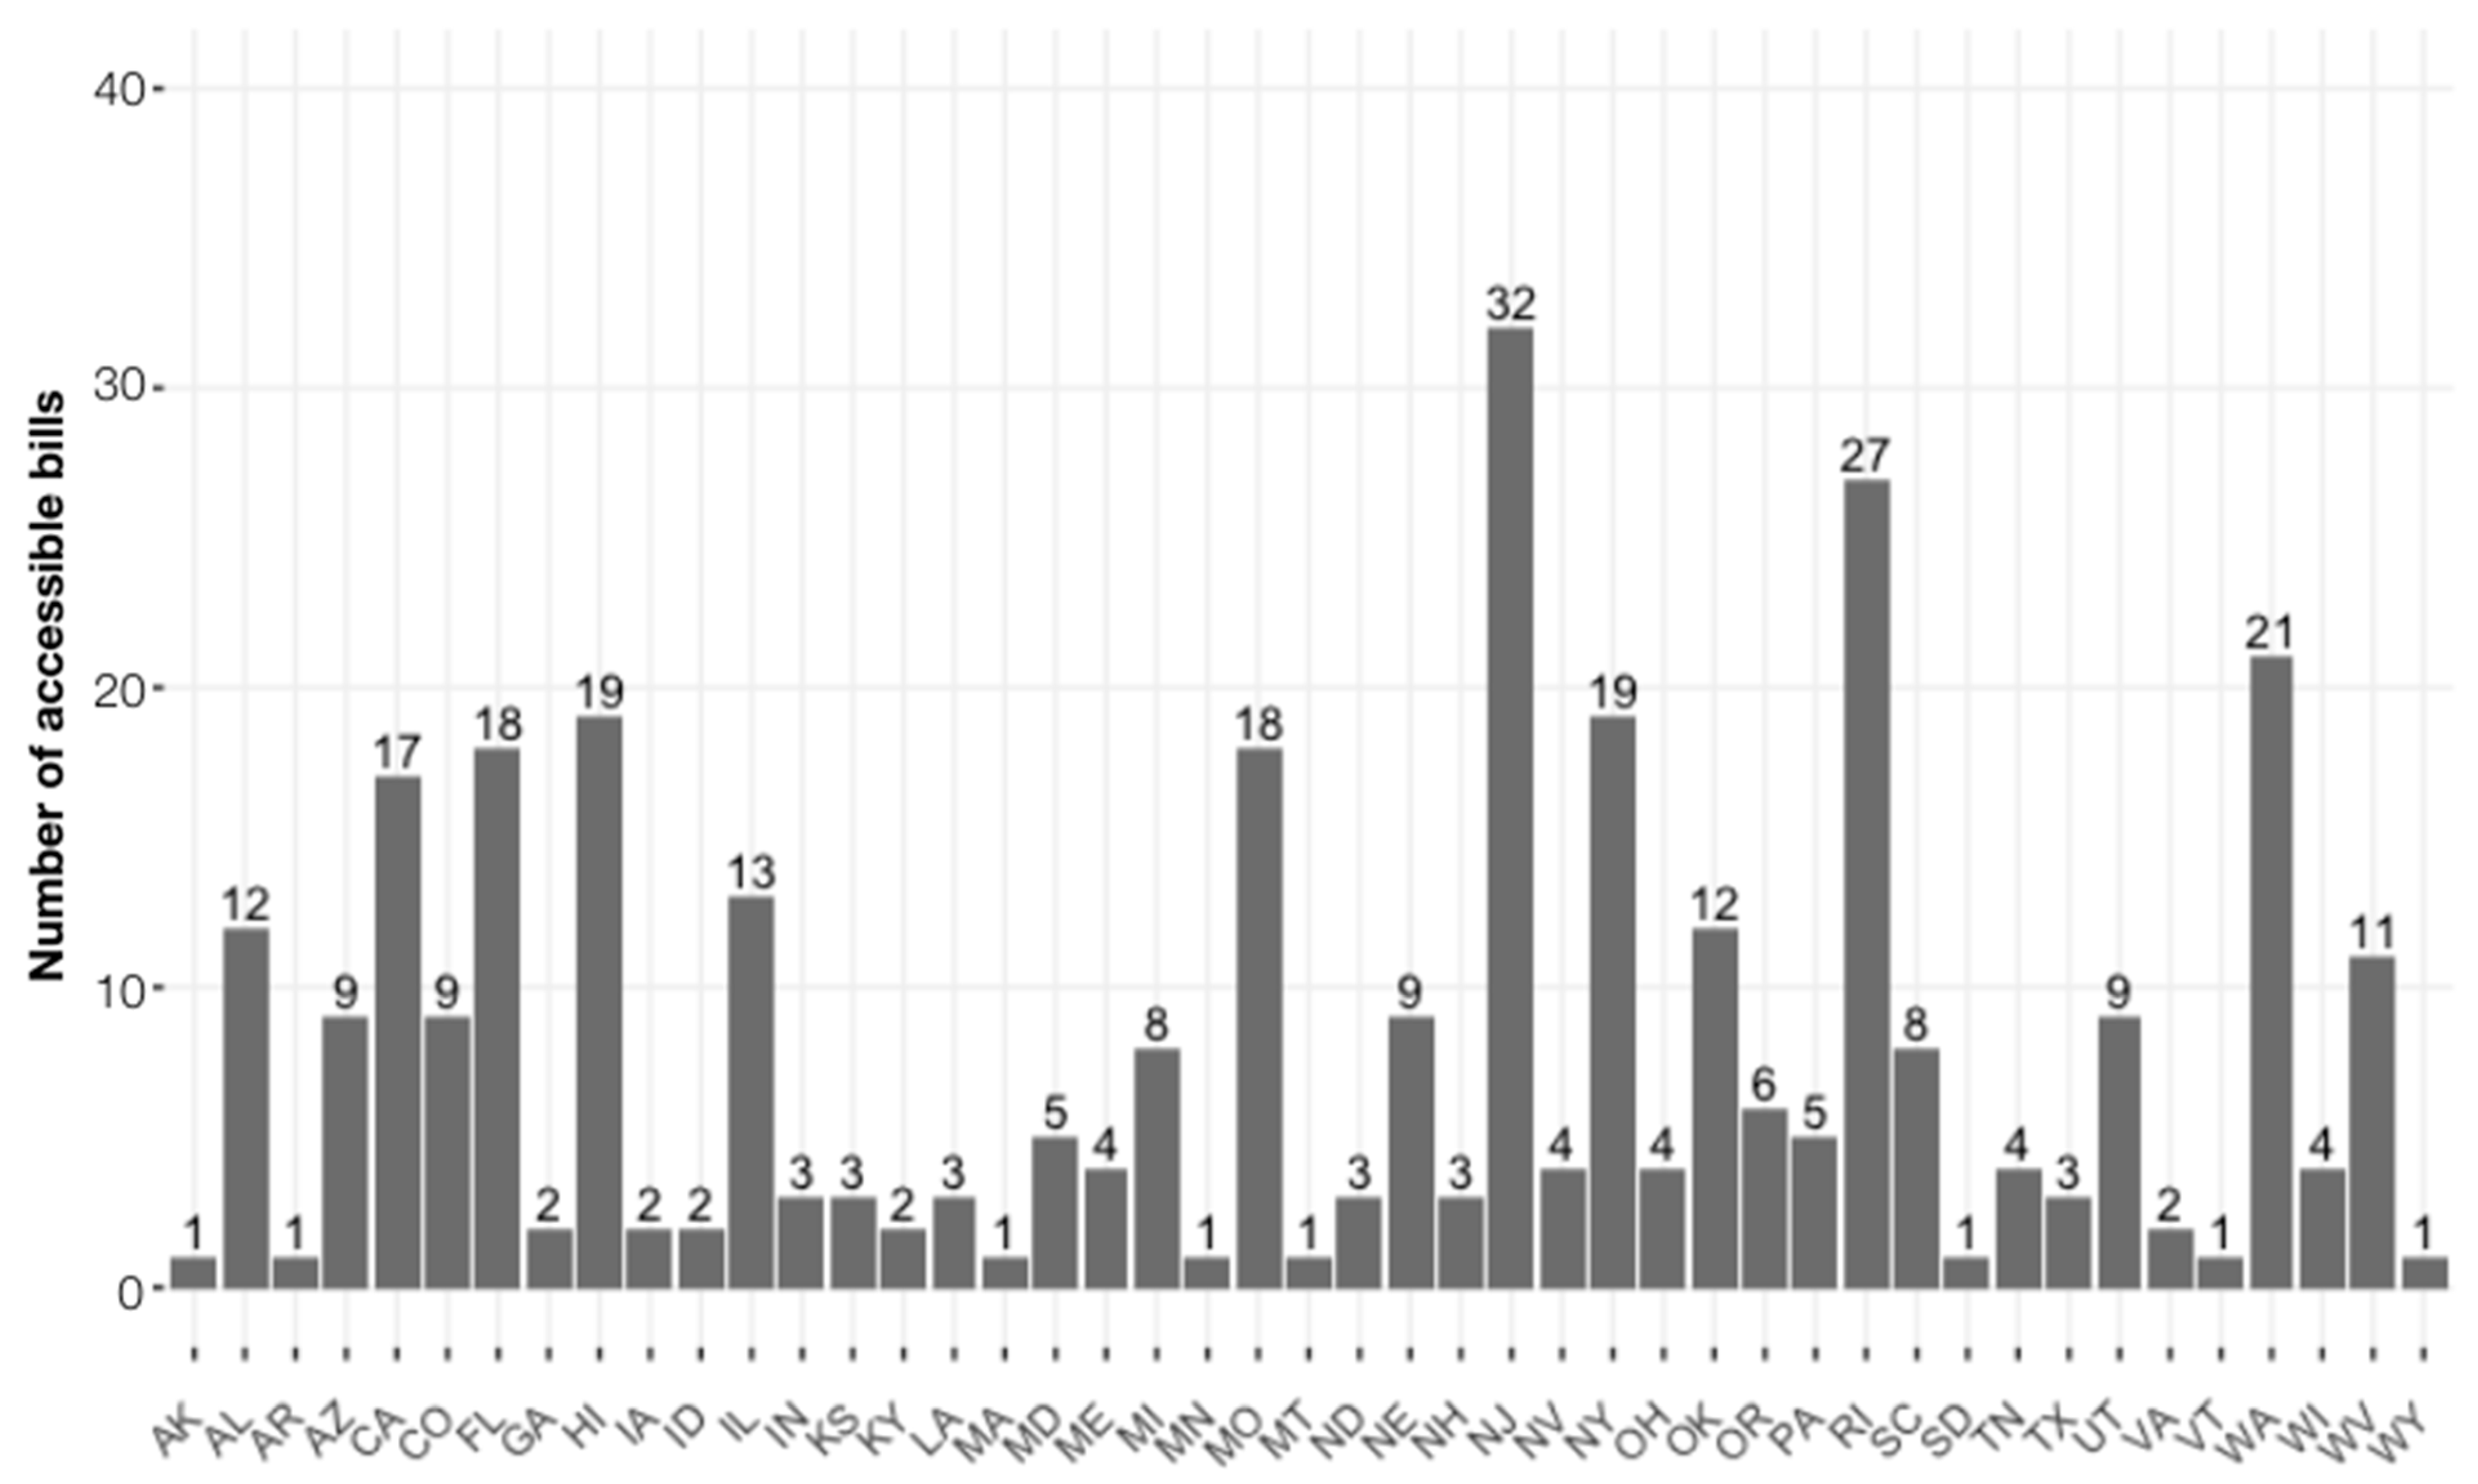
Figure 6.
Number of accessible and restrictive bills proposed by year in all states.
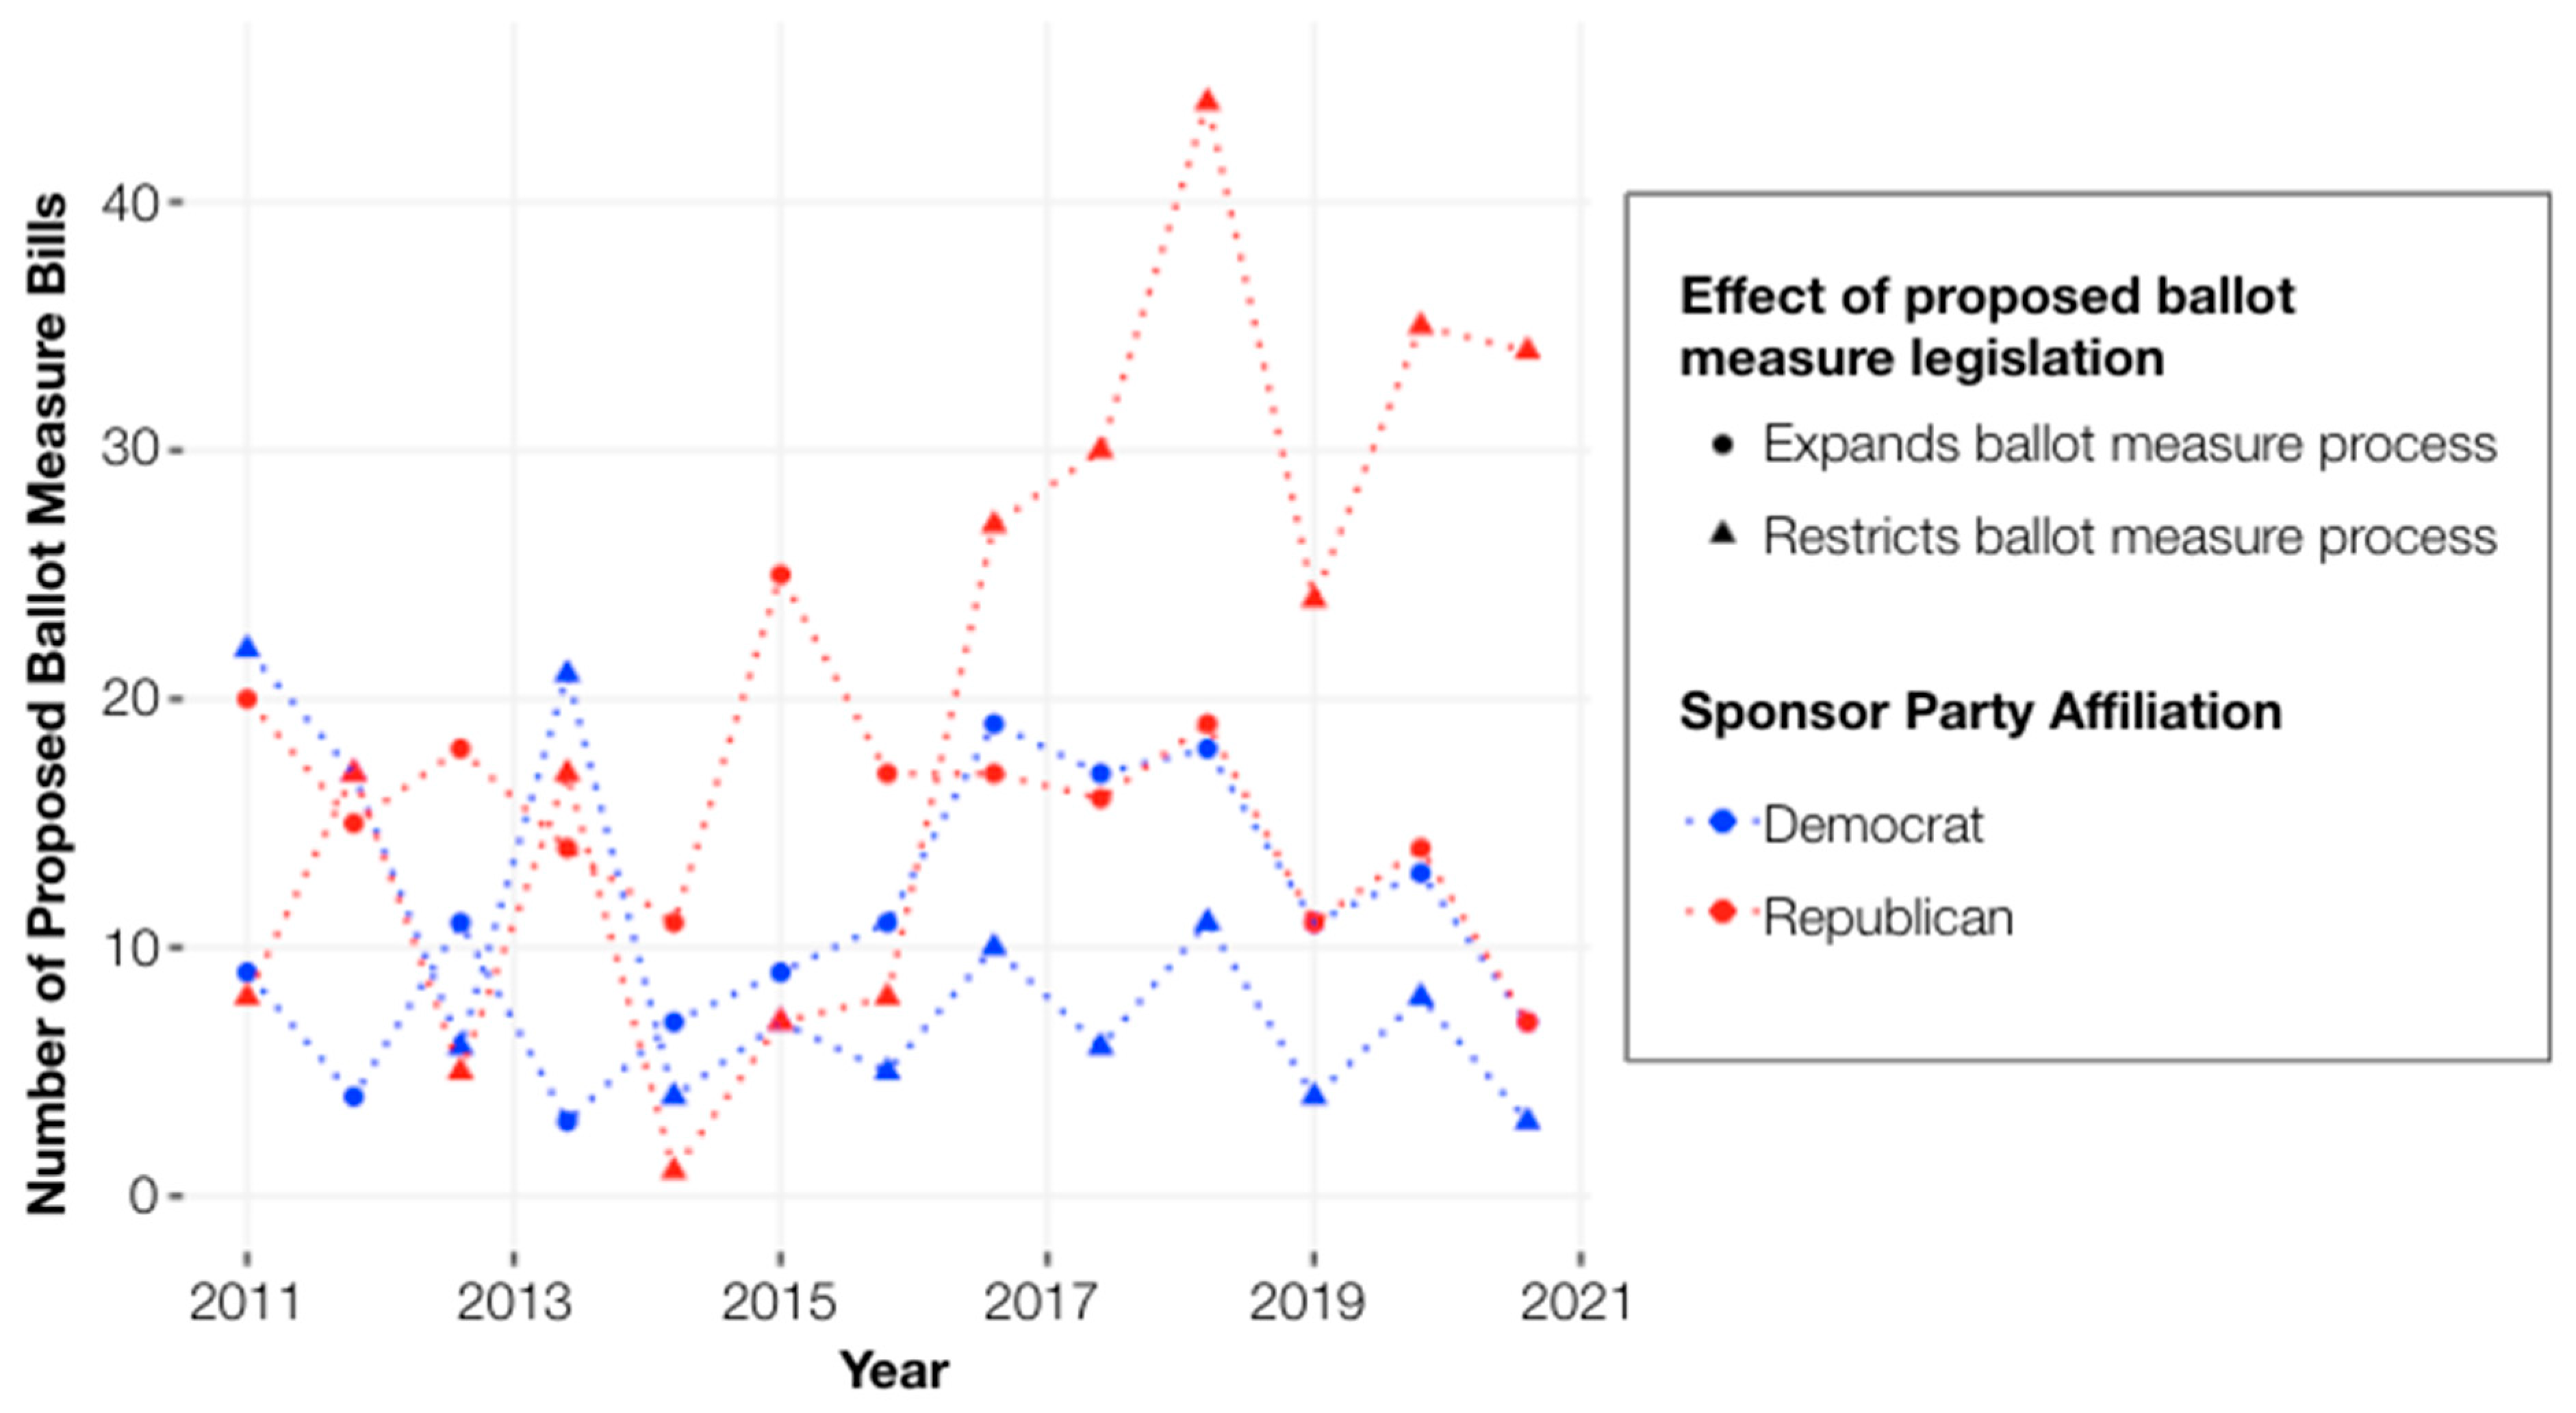
Figure 7.
Number of accessible and restrictive bills proposed by year in states with unified Republican control when the legislation was introduced.
Figure 7.
Number of accessible and restrictive bills proposed by year in states with unified Republican control when the legislation was introduced.
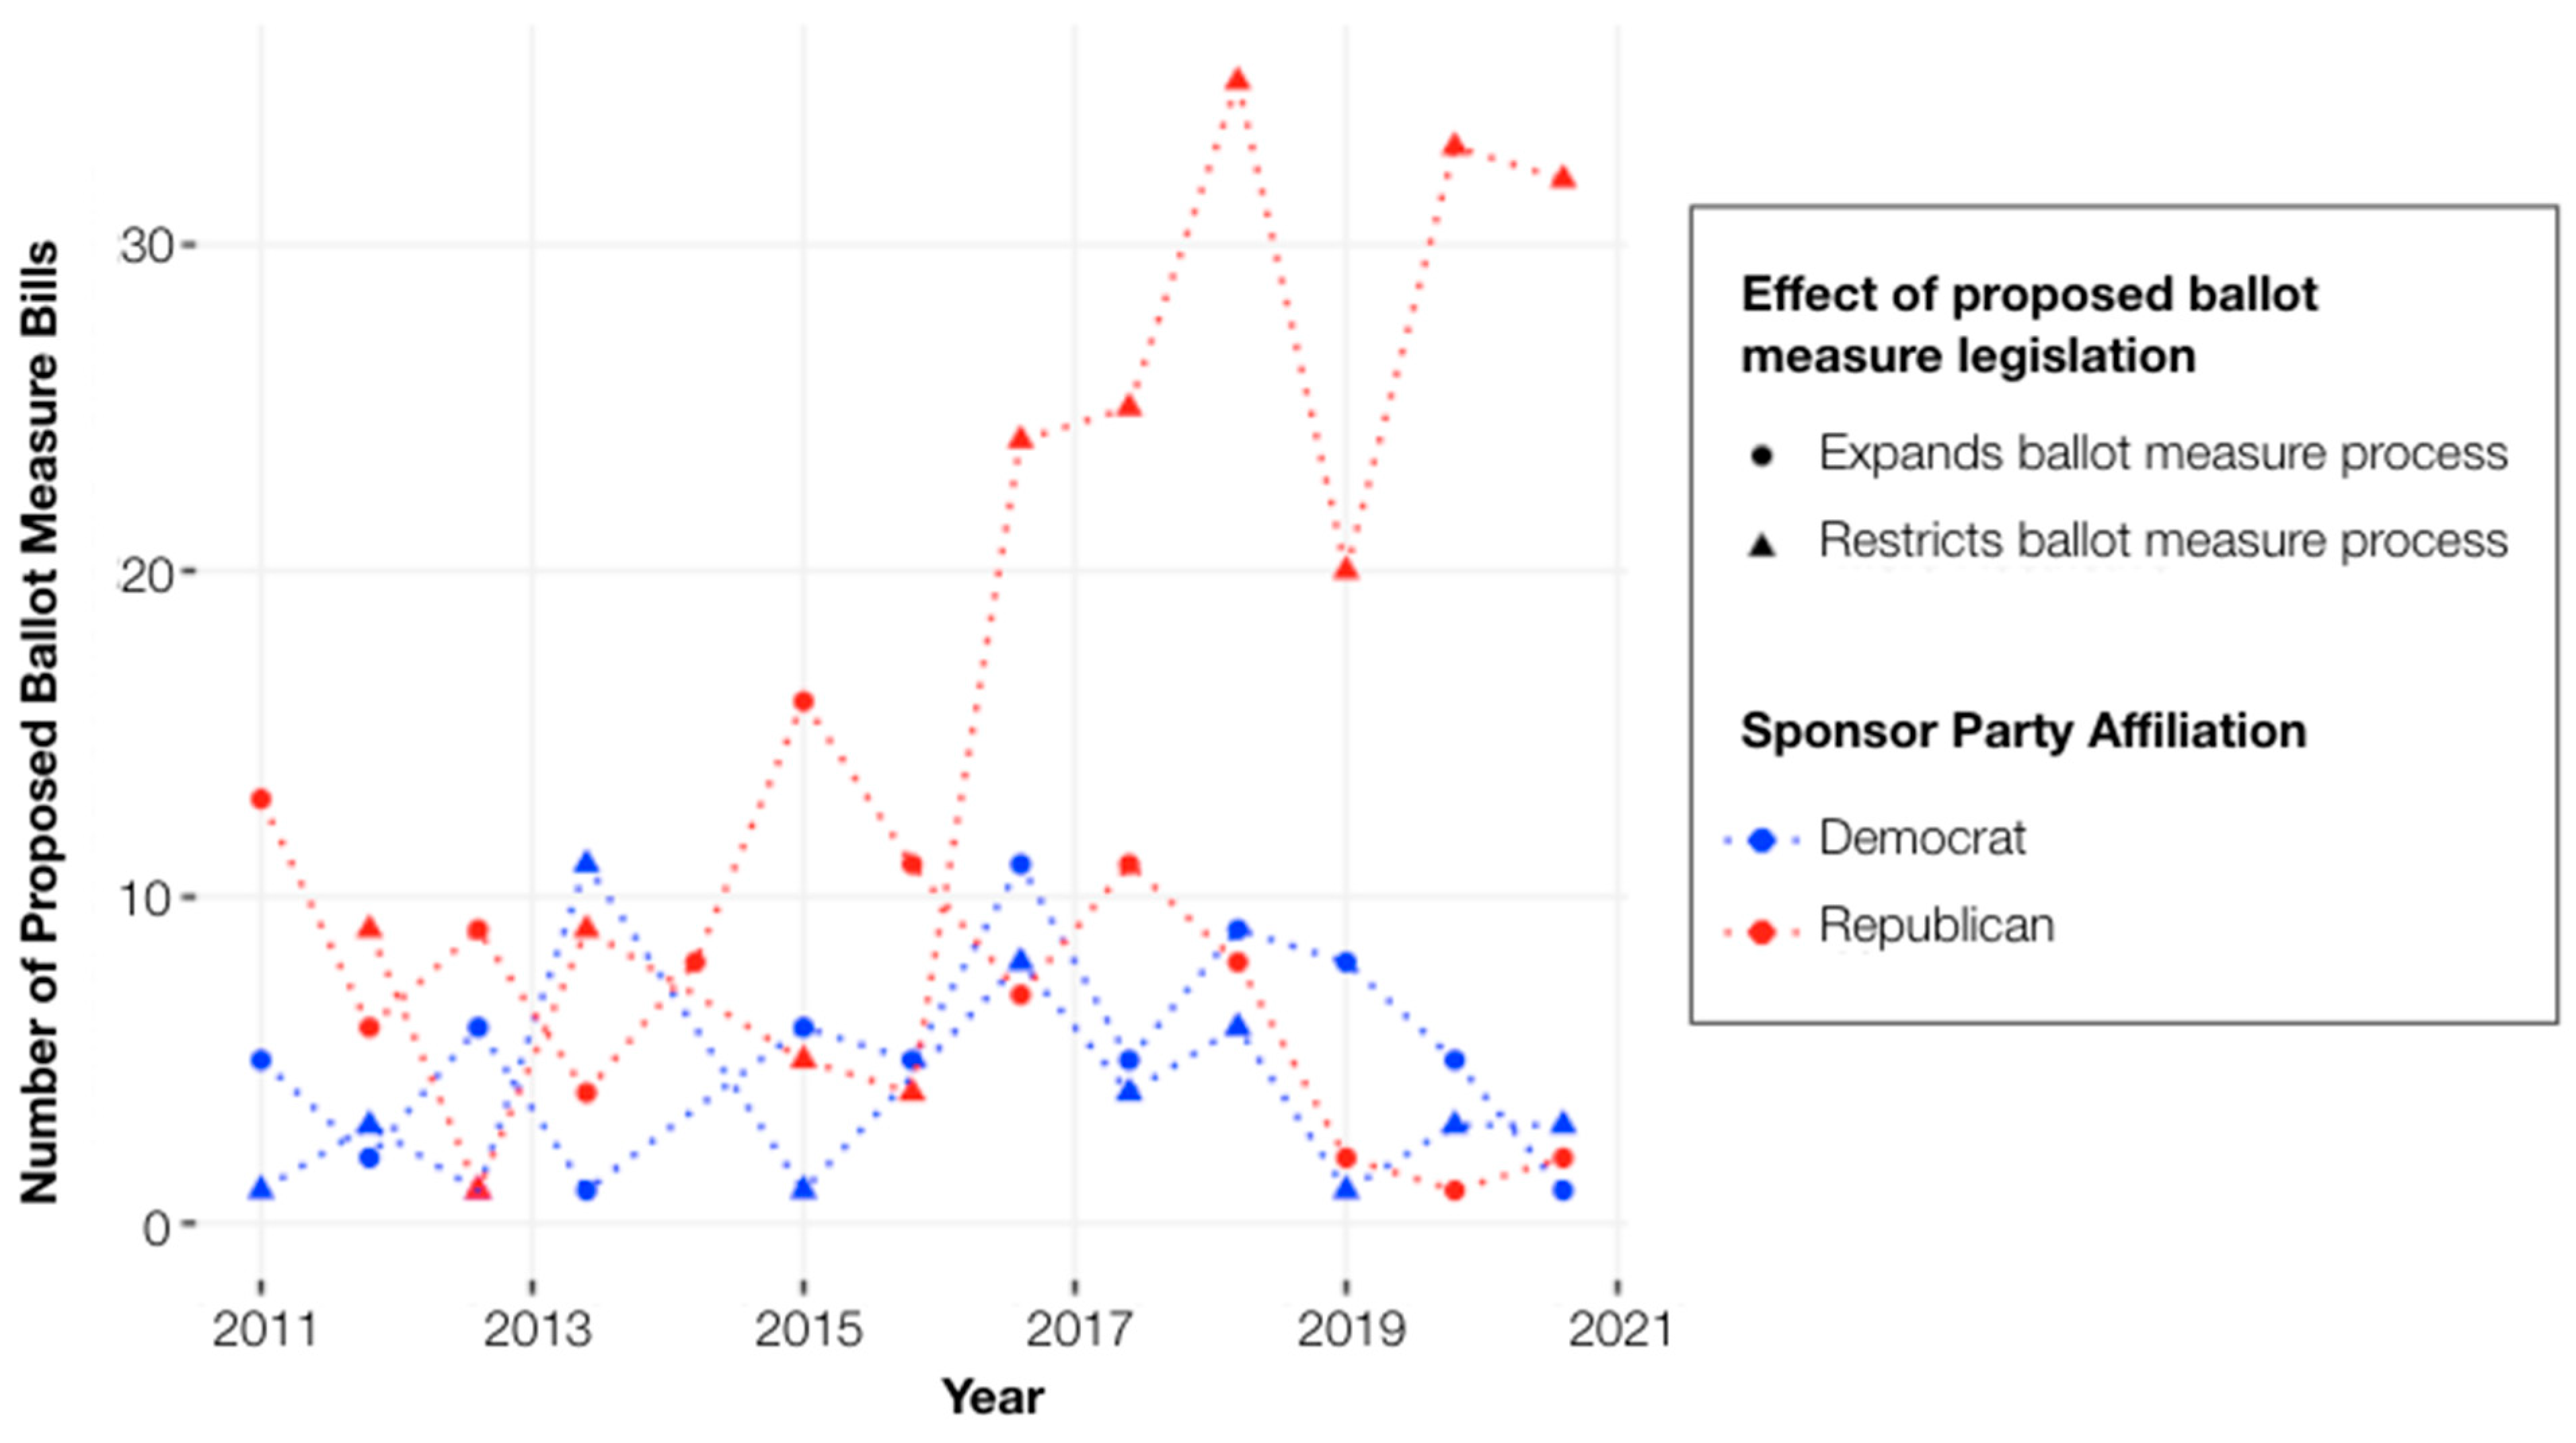
Figure 8.
Number of accessible and restrictive bills proposed by year in states with unified Democrat control when the legislation was introduced.
Figure 8.
Number of accessible and restrictive bills proposed by year in states with unified Democrat control when the legislation was introduced.
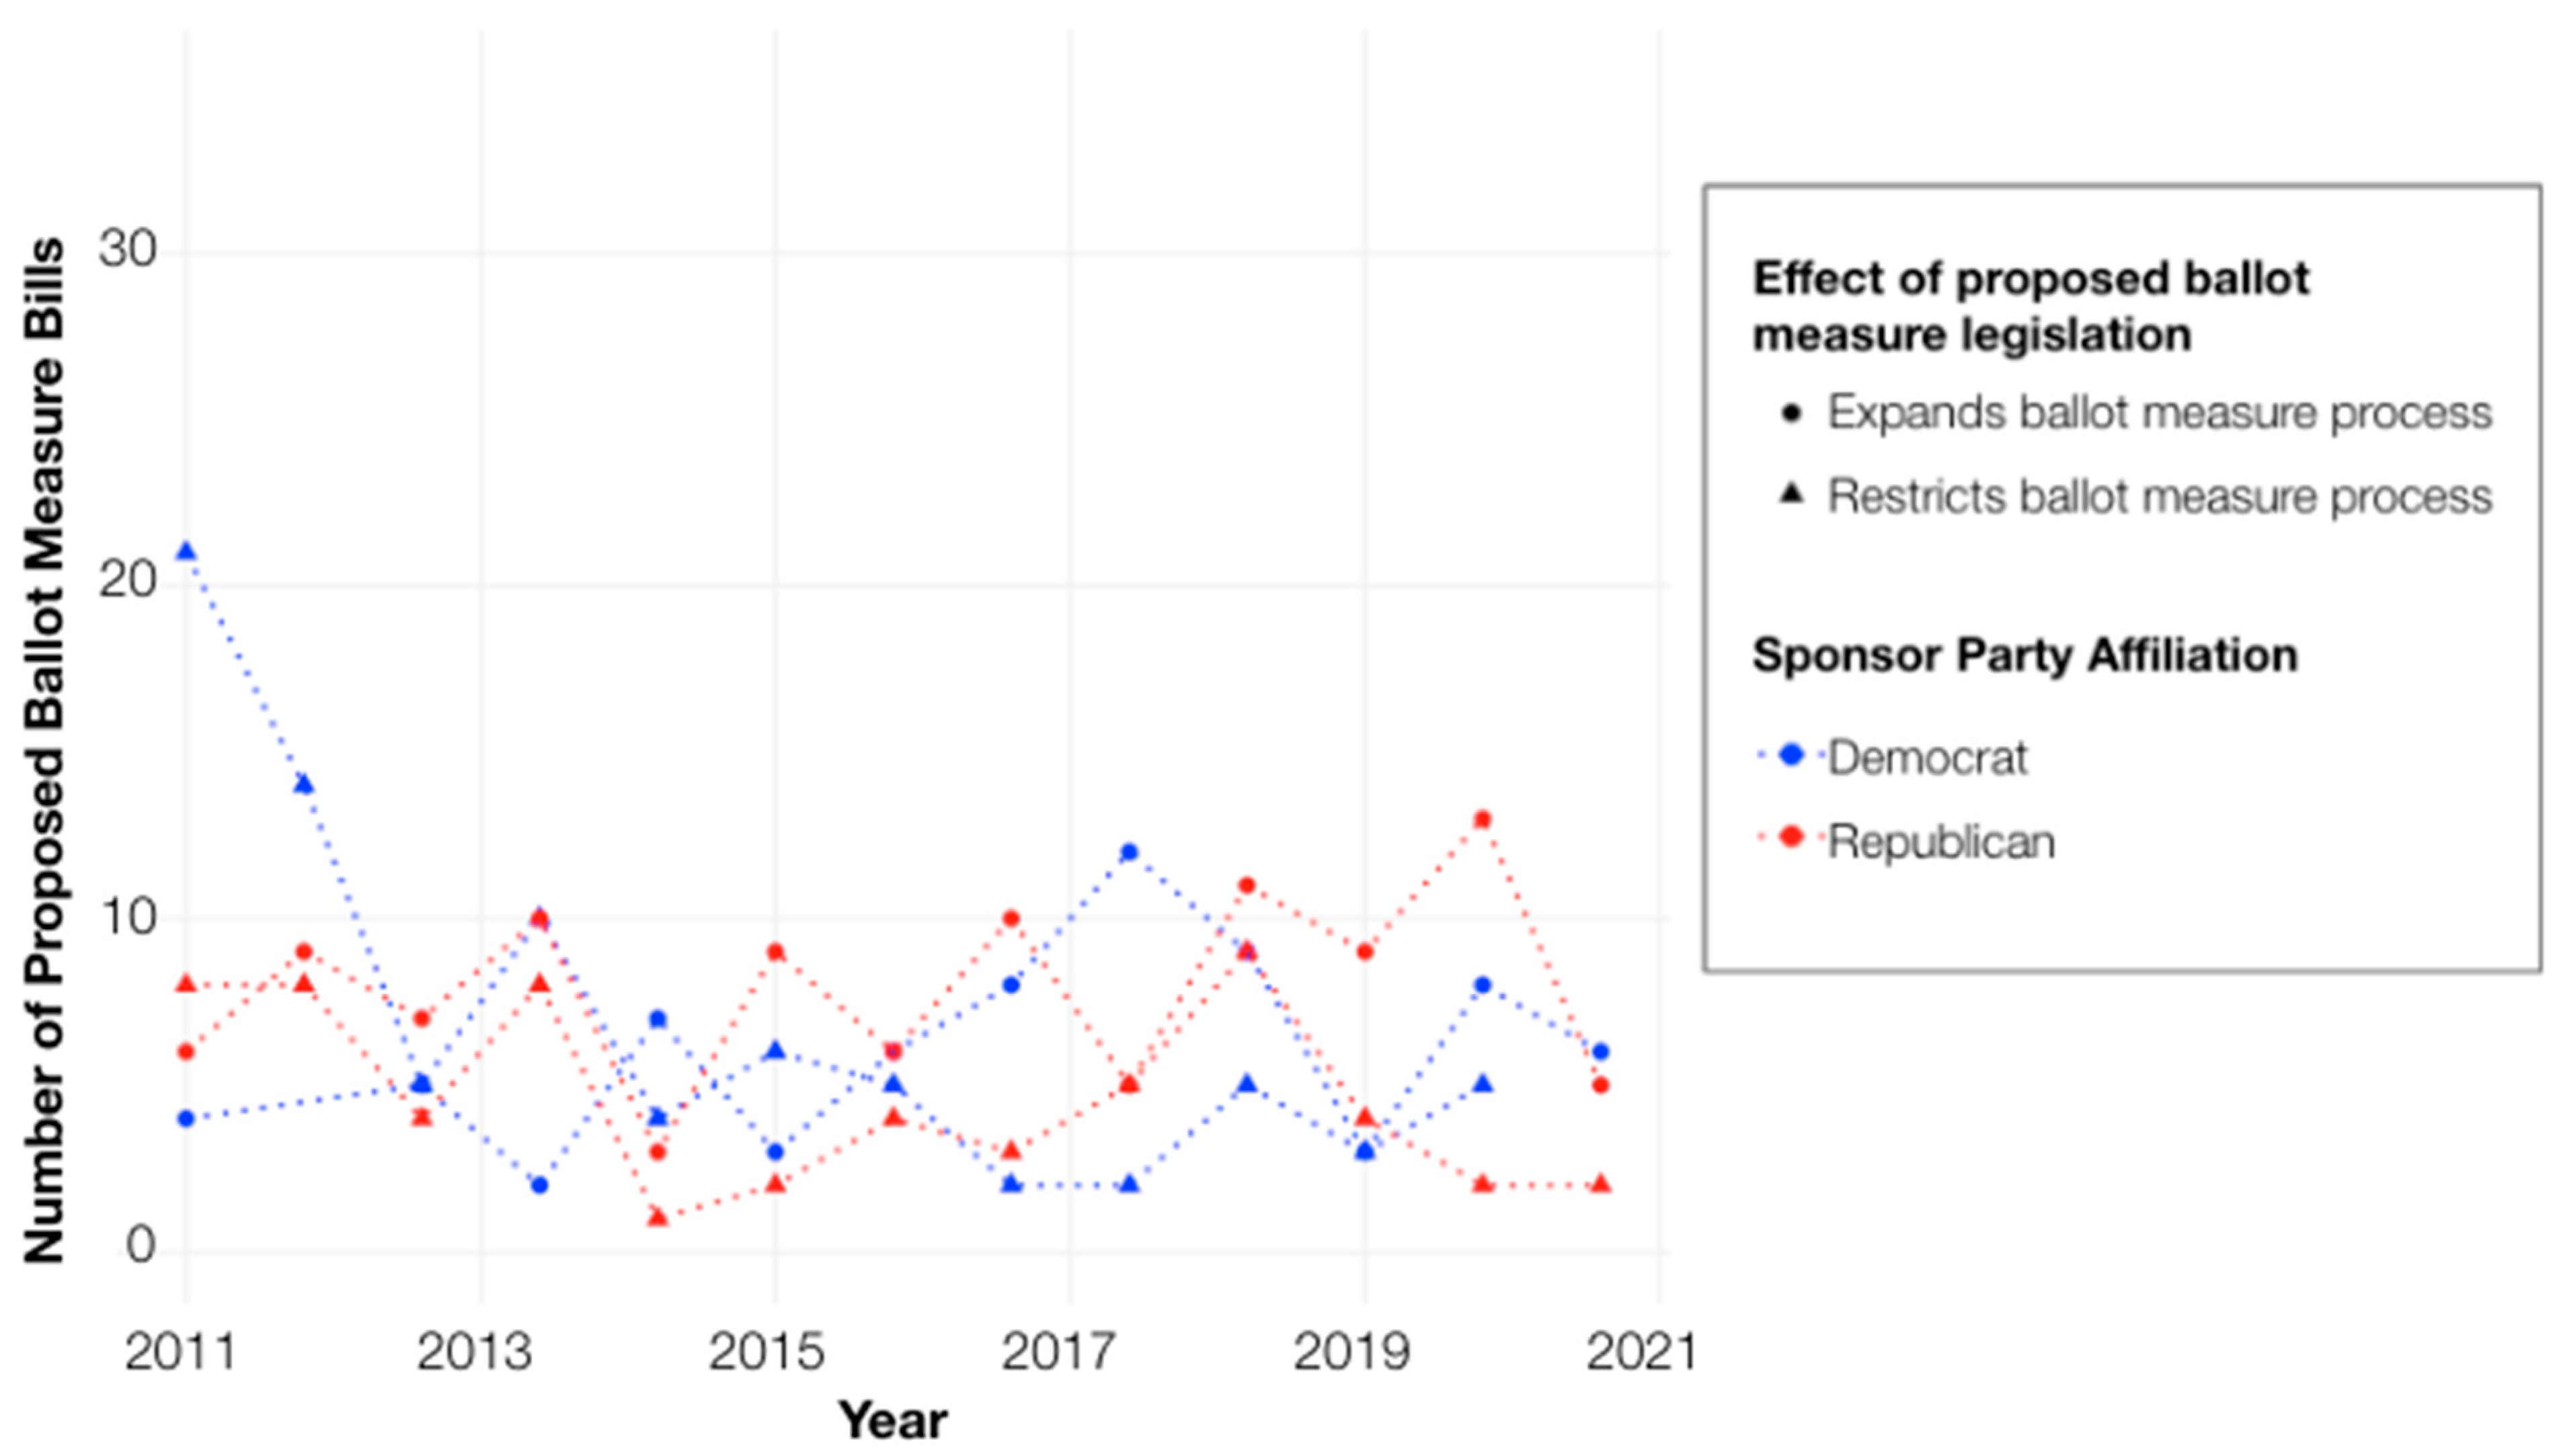
Figure 9.
Number of accessible and restrictive bills proposed by year in states with split control.
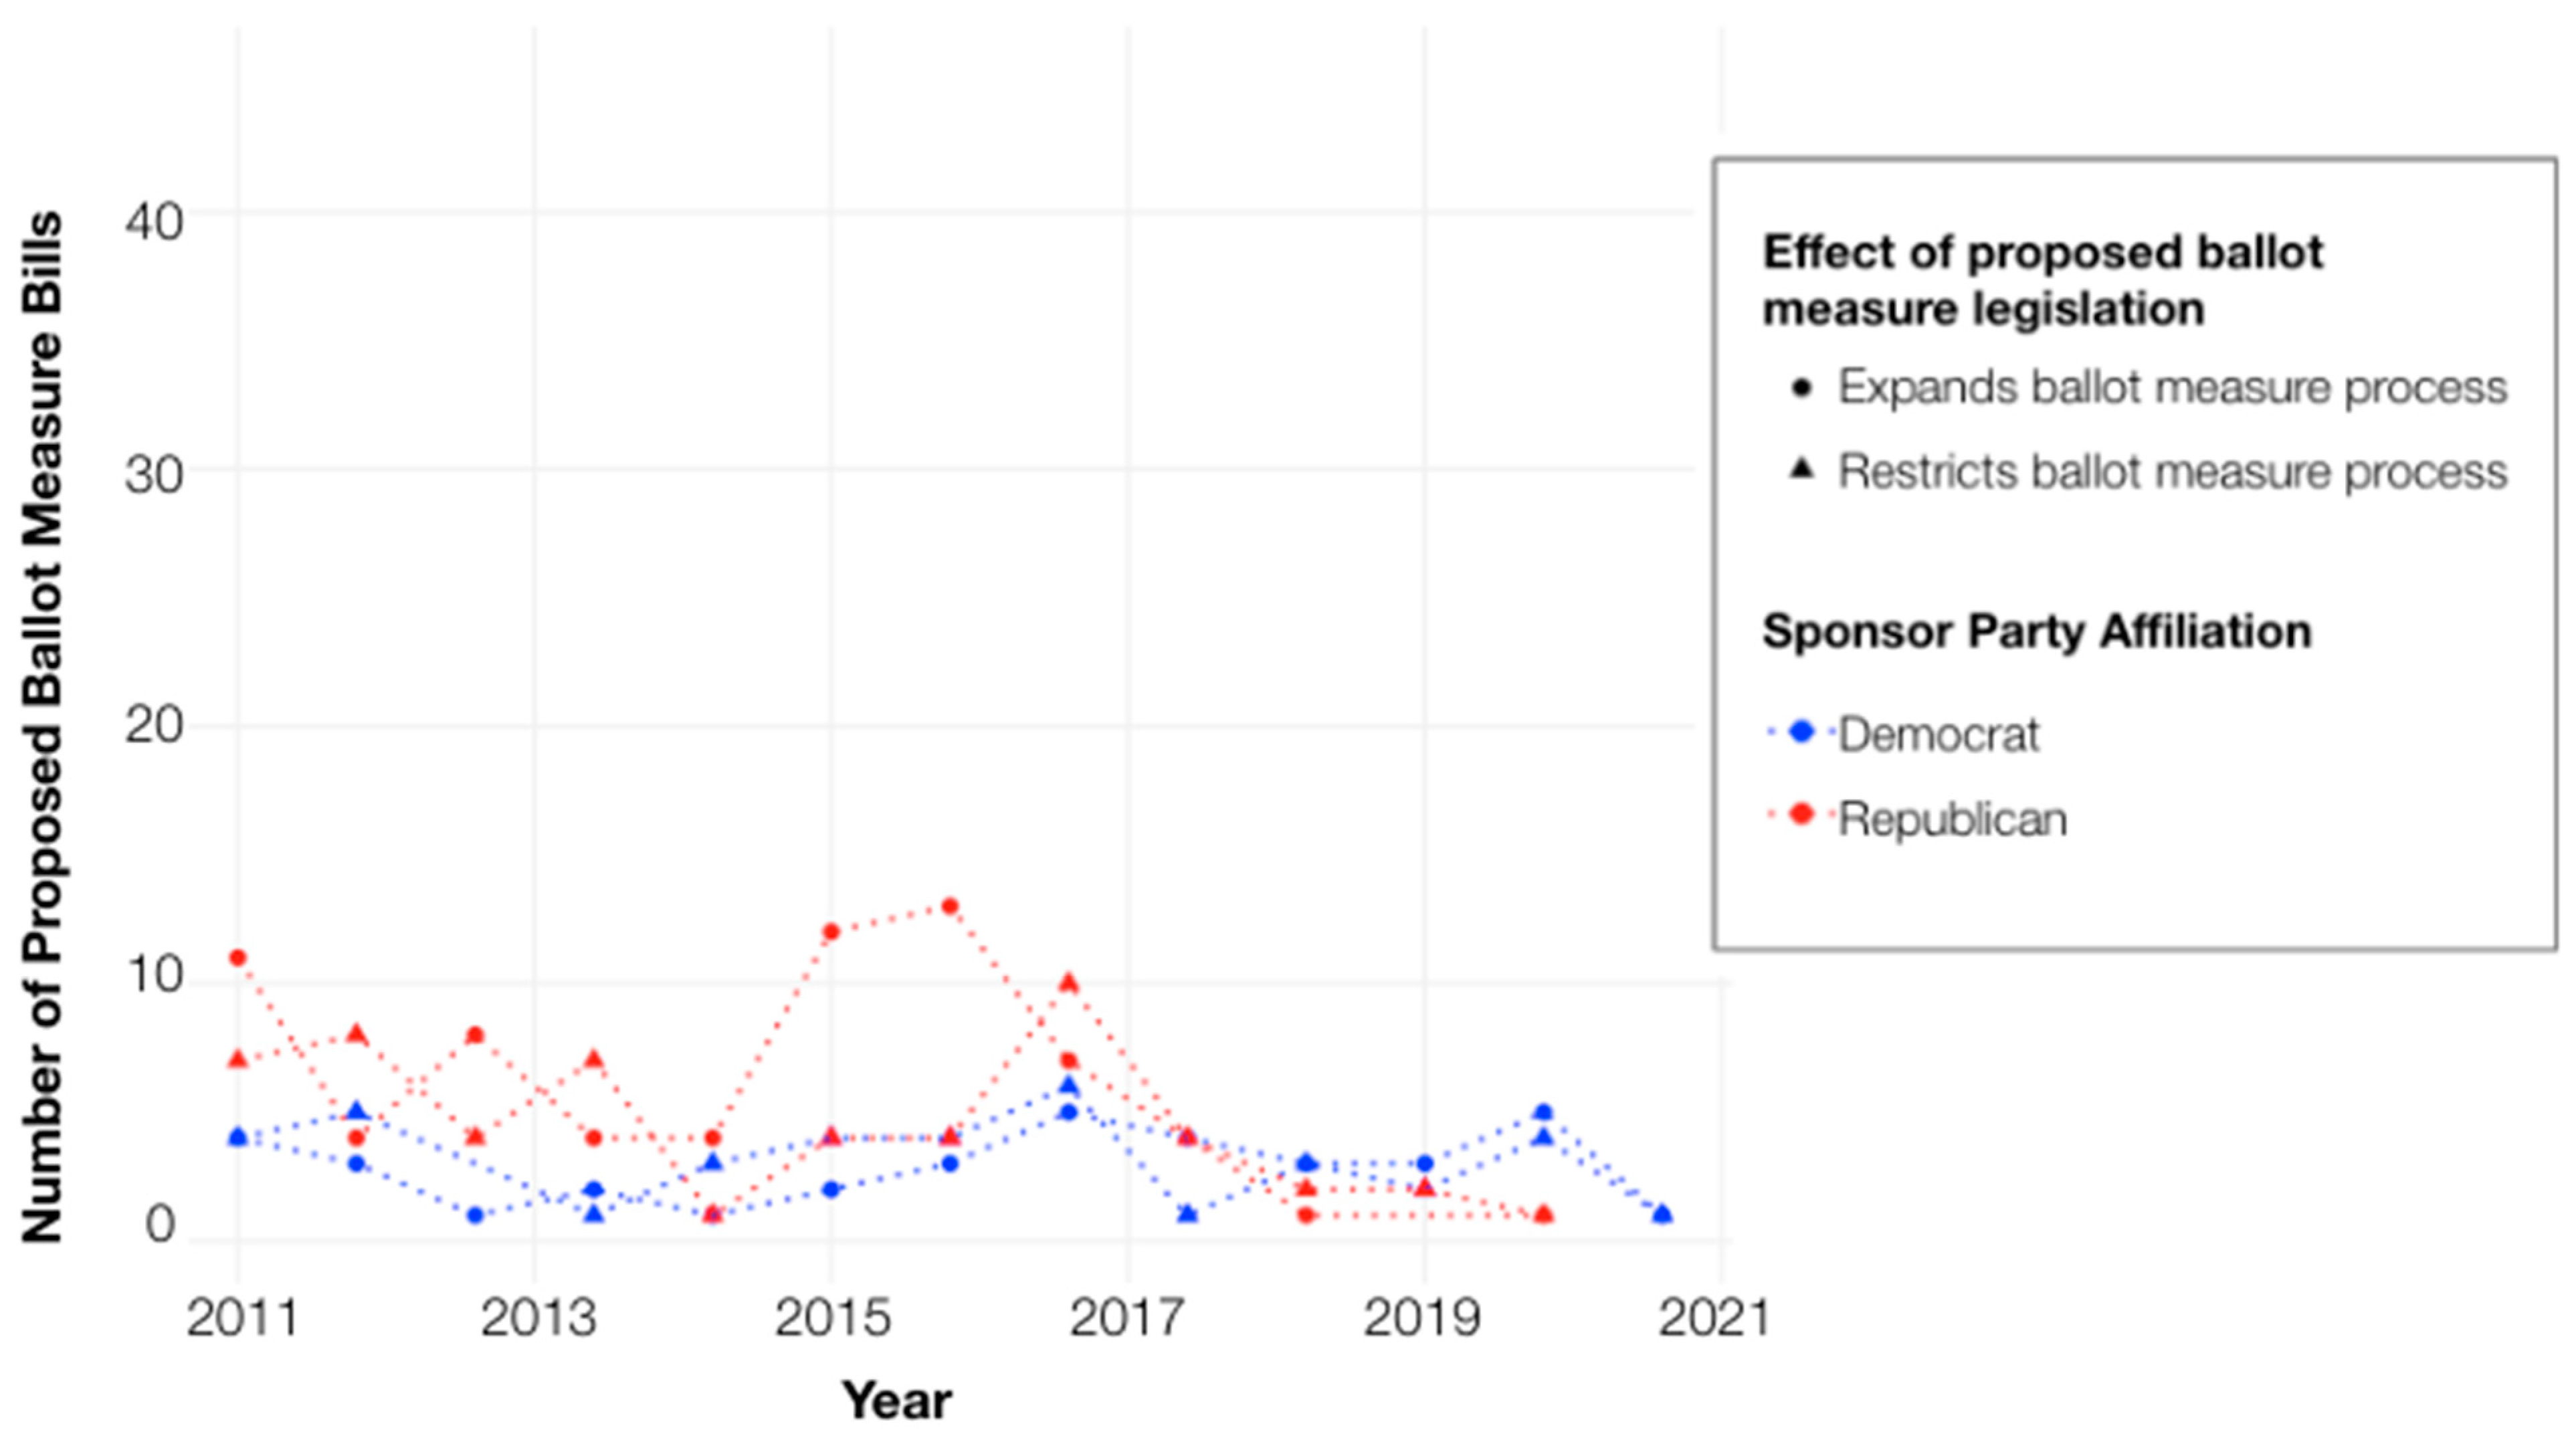
Figure 10.
Bills (represented by circles) legislating the ballot measure process by state between 2010 and 2022.
Figure 10.
Bills (represented by circles) legislating the ballot measure process by state between 2010 and 2022.
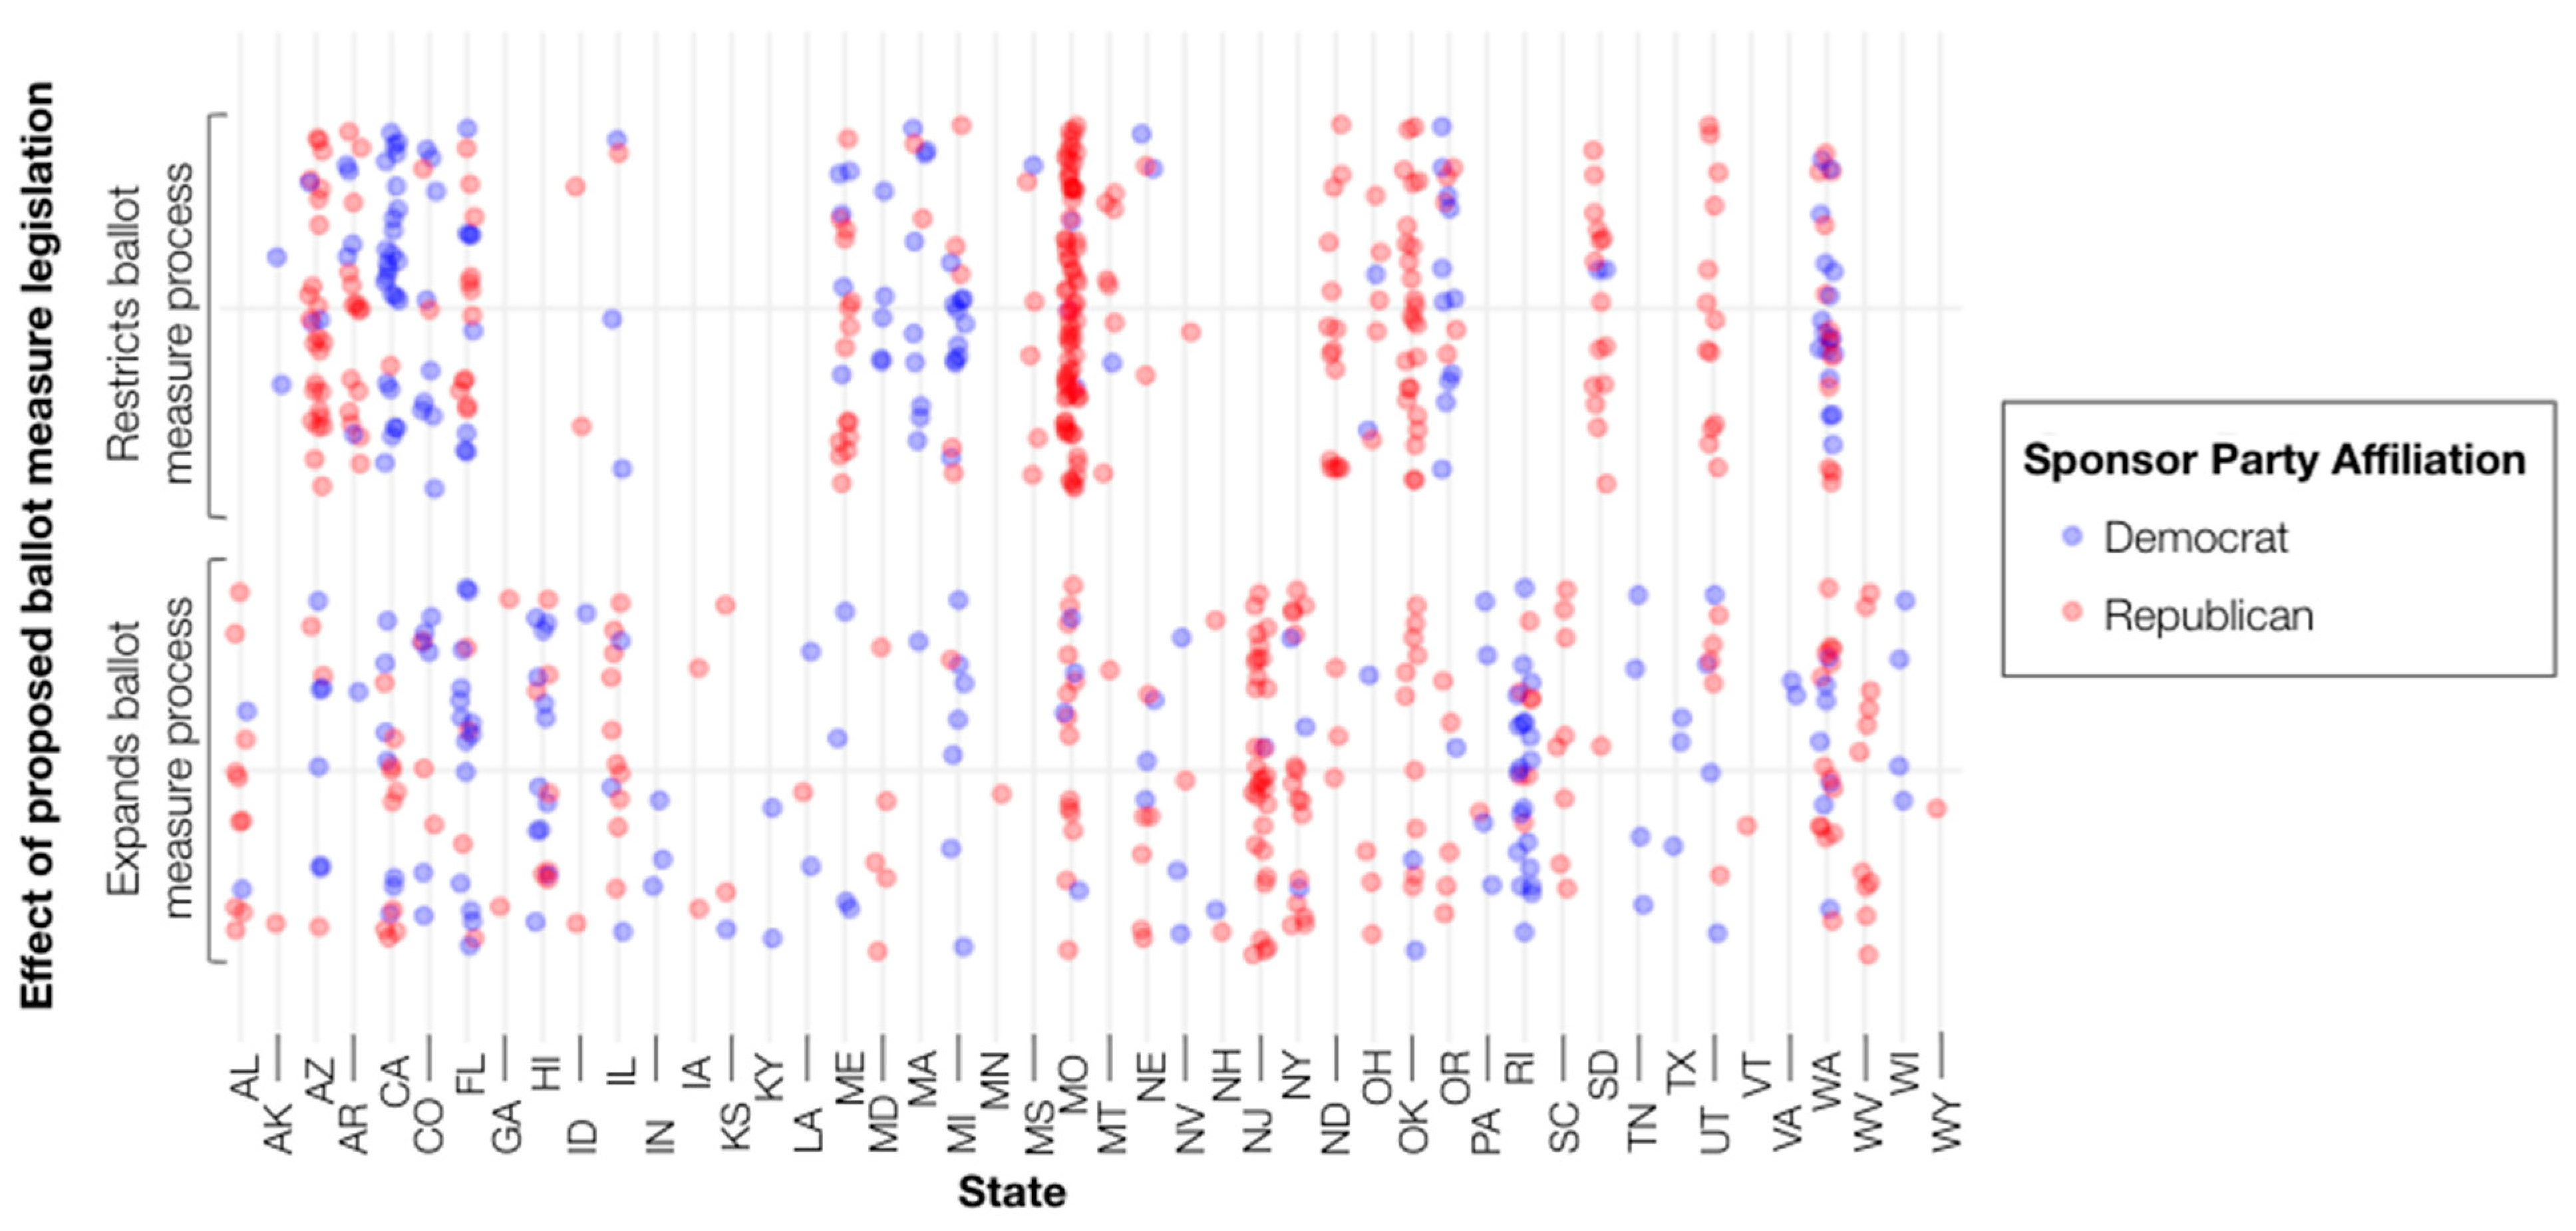

Table 1.
Counts of Ballot Measure Bills Split into Relevant Categories.
| Democrat Sponsor | Republican Sponsor | |
|---|---|---|
| Bills in analysis | 260 | 458 |
| Accessible bills | 138 | 203 |
| Restrictive bills | 122 | 255 |
| Republican Trifecta Accessible |
28 | 183 |
| Democratic Trifecta Accessible |
57 | 19 |
| Republican Trifecta Restrictive |
51 | 65 |
| Democratic Trifecta Restrictive |
50 | 73 |
| Split states Accessible |
37 | 65 |
| Split states Restrictive |
37 | 53 |
Disclaimer/Publisher’s Note: The statements, opinions and data contained in all publications are solely those of the individual author(s) and contributor(s) and not of MDPI and/or the editor(s). MDPI and/or the editor(s) disclaim responsibility for any injury to people or property resulting from any ideas, methods, instructions or products referred to in the content. |
© 2023 by the authors. Licensee MDPI, Basel, Switzerland. This article is an open access article distributed under the terms and conditions of the Creative Commons Attribution (CC BY) license (http://creativecommons.org/licenses/by/4.0/).
Copyright: This open access article is published under a Creative Commons CC BY 4.0 license, which permit the free download, distribution, and reuse, provided that the author and preprint are cited in any reuse.


