
Submitted:
05 October 2023
Posted:
06 October 2023
You are already at the latest version
Abstract
Carbon nanomaterial is widely used in structural health monitoring due to the advantage of sensitivity and good mechanical properties. This study presents a novel approach employing carbon nanocomposite materials (CNM) to characterize deformation and damage evolution in physical modelling. As the primary measurement method, the CNM is used to investigate the deformation characteristics of a 200-400 m thick sandstone bed at a 1 km deep longwall mine. The sandstone unit is identified as an ultra-thick key stratum (UTKS), with its thicknesses varying across different mining panels of the UTKS. The results of CNM monitoring show that the UTKS remains stable even after a consecutive excavation of 900 m in width. This stability impedes the upward propagation of overlying strata failure, leading to minimal surface subsidence. The study demonstrates the huge potential of CNM in the mining area, which can be useful for investigating material damage in physical modelling studies. The findings suggest that the cumulative extraction width in individual mining areas of the mine should be controlled to avoid a sudden collapse of the UTKS, and that special attention should be paid to where the UTKS's thickness changes substantially. The substantial variation in UTKS thickness significantly impacts the pattern of overburden subsidence.
Keywords:
Massive sandstone
; Ultra-thick key stratum
; Strata movement
; mining engineering
; Carbon nanocomposite material
1. Introduction
The geological conditions significantly impact ground behaviours in mining and civil engineering (Dai and Finkelman, 2018) and can lead to safety risks (Das et al., 2023). Typically, the overburden strata contain one or multiple thick, strong geological layers (Khanal et al., 2022; J. Xu et al., 2021). Recognising their significant role in governing overburden subsidence and movement processes, Chinese researchers commonly define such competent geological layers as a key stratum (KS) (Han et al., 2019a; Hu et al., 2022; Ju and Xu, 2013; Miao et al., 2011). KS can vary in thickness, with a typical range of 10-50 m. Some coal mines may encounter an exceptionally thick KS with a thickness exceeding 100 m. Such a thick KS can be referred to as an ultra-thick-key-stratum (UTKS) (Han et al., 2019b, 2019a; Xuan et al., 2014).
The western coalfield in China is currently the largest coal production field in the country, contributing 59.7% of the total production in 2020 (China Coal Industry Association, 2021). Many coal mines in this region feature a UTKS, a distinct geological feature compared to mines in eastern China (Han et al., 2019b, 2019a). The UTKS is commonly composed of strong sandstone layers(Ning et al., 2022). In recent years, these mines have increasingly reported high-energy microseismic events and dynamic failures such as rock bursts (Zhou et al., 2022, 2020). Therefore, it is critical to understand the deformational behaviours of UTKS and its impact on the overburden subsidence process at coal mines where site geological conditions differ.
Due to its substantial thickness, UTKS behaves differently in deformation and failure processes from a typical KS with an average thickness. The traditional beam theory may not be suitable for UTKS (Niranjan and Patil, 2012; Ramirez et al., 1998). Previous theoretical analyses (Ning et al., 2017; Wang et al., 2016) and field measurements (Wang et al., 2022; Xuan et al., 2014) have reported a distinct surface subsidence scenario: the subsidence coefficient in mines with a UTKS is significantly small. As UTKS is capable of sustaining overburden load over a large span (Xuan et al., 2014), a sudden collapse can lead to severe dynamic failures (Guoxiang et al., 2012). Notwithstanding these findings, the deformation process and failure mechanisms of the UTKS are poorly investigated compared to the KS with typical thicknesses.
There are four typical methods that can be employed to investigate deformational behaviours of geological formations: theoretical analysis (Hu et al., 2022; Singh and Yadav, 1995), numerical simulation (Hung et al., 2022; Wang et al., 2018), field measurement (Wang et al., 2021a, 2022; J. Xu et al., 2021), and physical simulation (Li et al., 2020; Ning et al., 2017). These methods offer different advantages but also have their drawbacks. The theoretical analyses and numerical simulation methods are mostly based on continuum mechanics, which have limitations in investigating strata movement post-breakage. The field measurement method provides valuable first-hand data but is time-consuming and expensive(J. Xu et al., 2021). In contrast, the physical simulation method offers a vivid representation of the entire process of overburden deformation and strata movement(Peng et al., 2013). It also allows for back-analysis (Jiang et al., 2018) and geologic parametric studies (Zhu et al., 2019) for refining and optimising underground engineering design. For its advantages, the physical simulation method has been widely used in studying overburden strata deformation characteristics in longwall mining with differing geological features (Heydarnoori et al., 2020).
This study employs physical simulation as the primary method to investigate the deformation characteristics of a massive sandstone bed with a thickness of 200 m - 400 m at a deep longwall mine in China. A large-scale physical model consisting of eight longwall panels was constructed for this purpose. In addition to the conventional photogrammetry technique for monitoring material deformation, a novel approach of using carbon nanocomposite material (CNM) was employed to characterise material damage by measuring changes in resistance. It is worth noting that this is the first instance of using CNM in this type of physical simulation study in underground mining engineering.
2. Geological condition of study mine
The study mine (Gaojiapu Coal Mine) is in the Changwu County of Shaanxi Province, China. It has a designed production capacity of 5 Mt/a. The mine extracts coal from the No.4 seam with an 800-1000 m depth of cover. The seam is relatively stable, with an average thickness of 10.5 m and a maximum thickness of 15.75 m. The coal seam is assessed to be prone to coal bursts.
The mine is divided into several areas for exploitation. Area 1, consisting of longwalls 101 to 103, was mined between 2015 and 2017. Area 2, comprising longwall 201 to 205, was mined between 2016 and 2021. During the excavation of Area 1, multiple dynamic events occurred on the main roads between Areas 1 and 2 (Figure 1).
Coal extraction from Longwall 101 to 205 resulted in minor surface subsidence. The maximum subsidence in Area 2 was measured at 443 millimetres, only about 0.044 times the extraction thickness (10m on average). This subsidence coefficient is significantly smaller than that measured at an adjacent coal mine, which was about 0.65 (Wang et al., 2021b; Han et al., 2019b).
Figure 2a displays the stratigraphic profile of the study Mine, generated from the logging data from the exploration holes 12-2, 31-2, 27-2, 30-3, 11-3 and 29-3. Figure 2b,c present the stratigraphic columns of two of the boreholes. The Luohe Formation (K11) is composed of sandstones with a total thickness of over 100 m. The entire thickness of the Luohe Formation varies across different panels, forming a thickened zone over the pillar between Areas 1 and 2. The KSPB software(Xu and Qian, 2000) was used to identify the key stratum units, and the result suggests that the Luohe formation is a UTKS.
3. The physical model
3.1. Experimental scheme
A relatively large physical model of 5.0 m wide and 1.66 m high was designed and constructed to simulate the deformation characteristics of the UTKS. The overlying strata were simplified, as shown in Figure 3. The thickness variation of the UTKS was considered in the model based on the thickness contour shown in Figure 2a. Model similarity ratio is a key factor in the design of the model parameters. Previously successful physical simulations have provided good references for selecting proper ratios. Based on the experience of (Zhu et al., 2019, 2017), the geometric, stress and density similarity ratio were determined as 1:400, 1:480, and 1:1.2, respectively.
The materials used to simulate rock layers consisted of calcium carbonate, gypsum, and river sand. The strength of these simulation materials was determined in correlation with the proportions of the material components. Mechanical test results from exploration drilling samples (as presented in Table 1) demonstrated that the Luohe formation (K1l) exhibits distinctively higher strength than other formations in UCS and tensile strength. The overburden was represented by four different types of rocks, namely weak, UTKS, sub-key-stratum, and coal seam. The details regarding the thickness and ratios of each layer can be found in Table 2.
The simulated coal seam was excavated following the sequence: Area 1 → Panel 201 → Panel 202 → Panel 203 → Panel 204 → Panel 205. The total excavation length was 315 cm, of which panels 201-205 were 45 cm each, and Area 1 was 90 cm. The excavation rate was 5 cm/hour to ensure the overburden deformation reached equilibrium.
3.2. The conventional monitoring system of deformation
The final model and the monitoring system are exhibited in Figure 4. The overburden deformation during the mining process was monitored with the CoordMeasis photogrammetry system, which supports 2D and 3D measurements and has a measurement accuracy of ≤0.10 mm. The system comprises a 24-megapixel SLR Nikon camera, code points, and a click ruler. Seven displacement measuring lines (numbered DML1-DML7) were arranged on different levels of the model. The displacement of each measuring point was calculated after each excavation.
Before excavation, code points were laid horizontally with a spacing of 10 m on the exterior surface of the model. Gauge points were arranged vertically on the measurement line to mark the monitoring points. Rulers and code points were placed on the frame around the model. These code points were fixed, serving as measurement benchmarks.
4. Using carbon nanocomposite material (CNM) to characterise damage
To enhance the characterisation of the UTKS deformation characteristics, we introduced a novel approach of using highly conductive CNM to reflect material deformation characteristics by measuring material resistance changes. Applications of similar materials in concrete deformations (Luo et al., 2022; Muñoz et al., 2018) have demonstrated their sensitivity to deformation and damage.
4.1. Preparation of the CNM
The CNM was composed of 6 mm long chopped carbon fibre (Figure 5a) and nano carbon black (Figure 5b). The two materials have a resistance of approximately 0.15 Ω·m and 1.5 Ω·m, respectively.
A previous study on concrete specimens (Cholker and Tantray, 2019) suggested that a low-weight content of carbon fibre has a negligible impact on the material strength and that a content of over 1.5% would exhibit adequate sensitivity to deformation. Based on these findings, the weight content of carbon fibre materials in this study was determined as 2%.
The CNM was prepared in several steps. First, the chopped carbon fibre, nano-carbon black and water were mixed by a high-speed mixer. Next, the mixture was transferred into another mixer, where they were evenly blended with gypsum, calcium carbonate and river sand for 3 min. Subsequently, a designed amount of water was added, and the mixing continued for another 3 min.
4.2. Resistance change of CNM during model settlement
Three layers of 2 cm thick CNM were laid in the top, middle and bottom sections of the UTKS, respectively (Figure 3 and Figure 6a). The resistance of a CNM layer and the conventional material were measured during the settlement process of the model. The monitoring instrument used is a Victor LCR digital bridge (VC4090A, accuracy 0.05%). Figure 6b presents the results, which show that the resistance of the conventional material significantly increased as the model settled down, whereas the resistance of the CNM was almost unchanged. The results demonstrate the high conductivity of the CNM compared to the conventional materials and a negligible impact of moisture loss.
4.3. Using resistance change to reflect material damage
Various studies(Chen and Liu, 2008; Cholker and Tantray, 2019; Dong et al., 2019; Hong et al., 2018; Luo et al., 2022) have suggested that the electrical resistance of the CNM changes as the material experiences damage. This correlation leads to the idea of incorporating CNM in the simulated rock layers to measure their electrical resistance changes as a result of excavation. In the physical model, the buried CNM layers would form the primary circuit of conduction (Chuang et al., 2017). When a crack forms in a layer (as illustrated in Figure 7), the connection between carbon nanomaterials will disengage, and the carbon fiber will fracture. This leads to the conductive circuit being partially or entirely cut off, increasing the resistance of the CNM (Chen and Liu, 2008; Zhao et al., 2020). In other words, increasing resistance reflects certain damage to the material.
As a longwall face advances, its overlying strata behind the longwall face generally undergo bending deformation, with the lower section fractured and caved. Under such deformation modes, the electrical resistance on different levels and at different times would experience various patterns such as gradual increase, abrupt increase and stabilisation. These changing patterns, which can be measured, are indicative of distinct characteristics of deformation (Chen et al., 2004; Cui et al., 2022). For instance, an abrupt increase in resistance would mean significant damage to the conductive network (Cholker and Tantray, 2019; Kamani et al., 2018; C. Xu et al., 2021).
In order to characterise the evolution of UTKS's damage in this modelling study, a parameter named resistance change ratio (RCR) of the CNM is defined in this paper and is expressed below.
where Rt represents measured resistance during excavation, R0 is the initial resistance before the excavation.
5. Physical simulation results
5.1. Overburden subsidence process
Figure 8 shows the simulation results during the excavation process, starting from Area 1 to the five panels in Area 2 (201-205). These results reflect overburden subsidence development. The immediate roof, which is a weak rock unit, caves immediately following the extraction of each panel. Above the immediate roof, mining-induced fractures extend up to the bottom of the UTKS. Significant bedding separation is formed beneath the UTKS in the Area 2 panels, with its lateral extent increasing as excavation continues. No fractures can be visually observed within and above the UTKS.
The extended bedding separation in Area 2 led to the UTKS overhanging over a large span of up to 900 m (approximately 225 cm in the model at a 1:400 scale) without losing stability. The stable UTKS has impeded further propagation of strata fracturing, resulting in minor subsidence of its overlying strata.
5.2. Deformation of the overlying strata on different levels
The vertical displacement measured by various measurement lines during the excavation is depicted in Figure 9. The results show that, after the extraction of Areas 1 and 2, the KS1 and the weak strata (reflected by line DML 5-7) sag significantly, whereas the UTKS (reflected by line DML 2-4) undergoes only minor displacement.
After all the panels are excavated (Figure 9(f)), the maximum displacements on DMLs 5, 6, and 7 are -27.24 mm, -31.05 mm, and -39.99 mm, or 68.10%, 77.7%, and 99.8% of the extraction thickness (40 mm), respectively. In contrast, the maximum subsidences of DMLs 1, 2, 3 and 4 within and above the UTKS are only -2.86 mm, -3.10 mm, -3.50 mm and -3.65mm, or 7.2%, 7.8%, 8.8% and 9.2% of the extraction thickness, respectively. The significant difference in subsidence leads to the large separation beneath the UTKS (up to 23.90 mm) and a small subsidence coefficient on the top of the model (only 0.072 mm).
Figure 9 also suggests that the overlying strata near Panel 202 undergo the most significant displacement. To further analyse overburden movement, the subsidence value at the middle point of Panel 202 (Figs. 9(e) and 9(f)) on various measurement lines were extracted and plotted in Figure 10. The weak strata (DML 5-7) exhibit a three-stage of subsidence, similar to the typical process measured in situ with surface extensometers(Qu et al., 2021).
5.3. Deformation distribution within the UTKS
With MATLAB surface interpolation, the displacement distribution within the UTKS was extrapolated to a contour format, as shown in Figure 11. The results show that minor deformation in the UTKS occurs, and the deformation values vary horizontally and vertically. The maximum deformation is located in the area above Panels 201 and 202. In Panels 203 – 205 area, the deformation is vertically similar but varies horizontally.
The location of the maximum deformation appears to be related to the change in the UTKS thickness, which increases from Panels 201 and 202 towards the Area pillar. In the area above Panels 203, 204 and 205, the thickness of the UTKS is uniform, and the deformation does not vary in the vertical direction.
5.4. Damage distribution within the UTKS
As discussed in section 4.3, changes in material resistance can reflect the level of material damage. After each excavation, the resistance of each part was measured, and the damage index RCR was calculated. Figure 12 shows the results.
The results show that RCR at each point gradually increases as the excavation progresses, and the RCR values are different at different measurement points. The highest RCR value appears in the area above Panels 201 and 202 (Figure 12(f)). Prior to the excavation of these two panels (Figure 12a,b), the RCR of these three layers has little changes. However, after these two panels were excavated (Figure 12(d)), the RCR in the area above 201 and 202 increased quickly to 3.60% and 2.83%. The two values further increased with the excavation of panels 204 and 205 (Figure 12e,f), and eventually peaked at 4.86% and 11.44%, respectively. The relatively high RCR value above the Panels 201 and 202 area suggests that the UTKS experienced significantly more damage than in other zones.
To better understand the damage evolution, Figure 13 shows the evolution of RCR value at the middle point of the three CNM layers. The figures also compare RCR to the displacement and the resistance change rate (ΔR), a parameter calculated as the difference between every two consecutive measurements.
Figure 13 clearly shows that the change in RCR values correlates with the change in displacement. After the excavation has passed the measuring point, both displacement and RCR show an increasing trend. The top line has the least maximum value (4.21%), whereas the middle and bottom lines are significantly larger, about 10.42% and 11.44%, respectively.
ΔR appears to be a good indicator of damage evolution. For ML 2, ΔR reached the maximum (0.022) when the excavation was 215 cm wide. The value is approximately eight times the average value (0.003) of ML 2 during the entire excavation process. While the displacement data shows no discernable differences between different measurement lines of the UTKS (Figure 9 and Figure 10), the RCR values on these three lines differ clearly.
6. Further analysis with analytical models
6.1. Influence of UTKS thickness and span on its deformation
To further analyse the influence of KS thickness and the excavation width on its deformation, the deflection of a fixed beam model was analysed using elasticity theory and the finite element method (FEM)(Kattan, 2010). The deflection is solved with a simplified formulation expressed in Eq (2).
Where ν is the beam deflection at the point x=0, y=0, l is the half beam span, ρ is the volumetric weight of the rock formation, g is the gravitational acceleration going, q is the overlying rock load, and E is the modulus of elasticity.
Figure 14 shows the analysed results. With a thickness of 400 m (Figure 14a), the deflection is minimal at a span of 800 m. This theoretical analysis result is consistent with the experimental results shown in Section 4.2. It also agrees with the field survey data that has suggested a maximum surface subsidence of only 0.44 m after panels 201 - 204 were mined out (the total excavation width is 720 m)(Ning et al., 2022).
The deflection gradually increases with increasing span. After reaching a span of approximately 1000 m, the deflection increases rapidly, indicating material damage (Chiaia et al., 2021; Jiang and Yu, 2017). Given that substantial damage in the UTKS can result in intensive seismicity, the total excavation width should be controlled to prevent the occurrence of dynamic hazards. Optimising the mine layout, such as retaining wide pillars between mining areas to discontinue the subsidence effect, can be helpful.
Smaller thicknesses result in greater deflections at the same span and smaller critical spans, as shown in Figure 14a–d. For instance, when the thickness is 50 m (Figure 14d), the critical span reduces to 200 m only. This result suggests that special attention should be paid to regions where the thickness of the UTKS changes significantly.
6.2. The influence of varying thickness on deformation
The physical modelling results suggest that the UTKS would experience an asymmetrical deformation across the excavated panels, with the maximum subsidence in the Panel 202 area. This finding contrasts the typical symmetrical deformation predicted by the beam model (Goodno and Gere, 2020; Lemaitre and Chaboche, 1994). A likely cause of this discrepancy is the varying thickness of the UTKS.
To illustrate this explanation, we established two FEM models, with one having a uniform thickness (Figure 15a) and the other with a varying thickness (Figure 15b). The latter has a thickness increasing from 100 to 500 m in the x-coordinate, representing the thickening part of the UTKS shown in the physical model.
Figure 15c compares the analysed deformation from these two models. The results show that the displacement of the uniform-thickness beam is symmetrical, whereas it is asymmetrical in the thickness-varying beam model. The increase in thickness results in an overall decrease in displacement. Comparing the two displacement curves, the greatest difference in displacements locates approximately 100 m from the thickness-changing point (X=100 m). The deformation behaviour derived from these thick beam models is consistent with that obtained from the physical model, highlighting that special attention should be paid to regions where the thickness of UTKS changes.
6.3. The influence of changing thickness on the location of UTKS damage
Previous studies (Goodno and Gere, 2020; Lemaitre and Chaboche, 1994) suggest that a rock stratum analysed as a fixed beam generally starts to experience damage from the two fixed ends. However, the physical model shows that the UTKS experiences damage in the middle area of the excavation. Again, this difference may be attributed to the irregular shape of the UTKS. To further understand the damage characteristics of UTKS with varying thickness, von Mises theory(Mises, 1913), which uses the value of Von Mises stress (σmises) to predict if a material will yield or fracture, is employed. Higher σmises values mean greater potential for material damage or failure (Senthil et al., 2019; Tavoosi et al., 2020).
Figure 16 shows the contours of σmises for three models with different lengths. These models reflect the progressive excavation from panel 201 to panel 205 (Figure 3). All the models show that the two fixed ends present larger σmises values than other parts of the beam, which agree with the analysed damage pattern for a typical fixed beam model.
The σmises values in all three models exhibit an asymmetric distribution. At the early mining stage (Figure 16a), the left end, or the thinner end, presents the highest σmises. Within the span extended under a uniform-thickness region (-300~-100 m shown in Figure 16b), the σmises at the thickness changing point (-100 on the x-coordinate) become the largest except for the two ends of the fixed beam. Further increase in the span (further progression of the mining) results in increasing σmises at the thickness-changing point. The results also show that the thicker section of the beam has smaller σmises than the thinner section. These observations explain the phenomenon observed in the physical model that UTKS in the Panel 202 region, which is below the thickness-changing point of the UTKS, undergoes the most significant damage than in other excavation areas.
7. Conclusions
The presence of a massive, strong sandstone bed in a mining engineering context can pose significant threats to mining safety. To address this issue, CNM (carbon nanocomposite materials) was introduced for the first time in this type of physical modelling method as an innovative approach to conventional deformation measurement methods, analyzing material damage by measuring resistance changes. This is crucial for assessing and managing safety risks. Additionally, analytical models were established to enhance the understanding of the physical modelling results. The following conclusions can be drawn from this study.
(1) The 200-400 m thick sandstone layer remains stable after a cumulative excavation width of 900 m. The stability prevents upward propagation of strata failure, resulting in significant bedding separation underneath the sandstone layer and minor surface subsidence of only 0.072% of the excavation thickness.
(2) Although the thick sandstone layer remains unbroken, it undergoes continuous deformation as excavation progresses. Minor deformation is observed in the first 540 m excavation, which then increases evidently. The maximum deformation was found in the middle part of the total excavation.
(3) The varying thickness of the thick sandstone layer shows a significant impact on the caving process and overall subsidence pattern. Both the physical and analytical models show that the thick rock layer experiences considerable damage in the thickness-changing region, emphasising the need for special attention to this area.
(4) To mitigate risks associated with the thick sandstone layer, it is recommended that the mine should control the cumulative excavation width within a critical limit in each individual mining area. Continuous monitoring and assessment of the behaviour of the thick layer are also essential.
(5) The carbon nanocomposite materials demonstrate high sensitivity to deformation, suggesting its feasibility for use as an alternative or complementary measurement method in similar physical modelling studies.
Given the limitation of the size of the physical model, the eventual failure of the thick sandstone layer was not achieved. Therefore, an assessment of the failure consequence was not possible. A smaller geometry similarity ratio enabling simulation of a larger area may be considered for future physical modelling studies with similar geological conditions.
Carbon nanocomposite materials show potential for physical modelling of overburden subsidence and damage. Further research is necessary for the specific methods employed for material formulations,electors layout, and other technology details. A deeper understanding of these details would enrich the study and serve as a guide for future research in the mining field.
Author Contributions
Conceptualization, J.X.(Jianlin Xie) and W.Z.; formal analysis, J.X.(Jianlin Xie);writing—original draft preparation, S.N.; writing—review and editing, W.Z. and Q.Q.; simulation experiment, S.N. and B.Z.; validation, Q.Q. and J.X.(Jialin Xu). All authors have read and agreed to the published version of the manuscript.
Data availability: The datasets used or analysed during the current study are available from the corresponding author upon reasonable request.
Acknowledgments
Supported by the National Natural Science Foundation of China (Grant No. 52074265,52274097), the Postgraduate Research & Practice Innovation Program of Jiangsu Province (Grant No. KYCX22_2618), the Graduate Innovation Program of China University of Mining and Technology (Grant No. 2022WLKXJ049).
References
- Chen, B., Liu, J., 2008. Damage in carbon fiber-reinforced concrete, monitored by both electrical resistance measurement and acoustic emission analysis. Construction and Building Materials 22, 2196–2201. [CrossRef]
- Chen, B., Wu, K., Yao, W., 2004. Conductivity of carbon fiber reinforced cement-based composites. Cem. Concr. Compos. 26, 291–297. [CrossRef]
- Chiaia, B., De Biagi, V., Placidi, L., 2021. A damaged non-homogeneous Timoshenko beam model for a dam subjected to aging effects. Math. Mech. Solids 26, 694–707. [CrossRef]
- China Coal Industry Association, 2021. 2020 Annual Report on the Development of the Coal Industry. China Coal Industry Association, Beijing, China.
- Cholker, A.K., Tantray, M.A., 2019. Micro carbon fiber based concrete as a strain-damage sensing material. Materials Today: Proceedings 19, 152–157. [CrossRef]
- Chuang, W., Geng-sheng, J., Bing-liang, L., Lei, P., Ying, F., Ni, G., Ke-zhi, L., 2017. Dispersion of carbon fibers and conductivity of carbon fiber-reinforced cement-based composites. Ceramics International 43, 15122–15132. [CrossRef]
- Cui, K., Liang, K., Chang, J., Lau, D., 2022. Investigation of the macro performance, mechanism, and durability of multiscale steel fiber reinforced low-carbon ecological UHPC. Constr. Build. Mater. 327, 126921. [CrossRef]
- Dai, S., Finkelman, R.B., 2018. Coal geology in China: an overview. International Geology Review 60, 531–534. [CrossRef]
- Das, A.J., Mandal, P.K., Ghosh, N., Singh, A.P., Kumar, R., Tewari, S., Bhattacharjee, R., 2023. Evaluation of energy accumulation, strain burst potential and stability of rock mass during underground extraction of a highly stressed coal seam under massive strata-a field study. Engineering Geology 322, 107178. [CrossRef]
- Dong, W., Li, W., Lu, N., Qu, F., Vessalas, K., Sheng, D., 2019. Piezoresistive behaviours of cement-based sensor with carbon black subjected to various temperature and water content. Composites Part B: Engineering 178, 107488. [CrossRef]
- Goodno, B.J., Gere, J.M., 2020. Mechanics of materials. Cengage learning.
- Guoxiang, C., Linming, D., Xing, X., 2012. Research on prevention of rock burst with relieving shot in roof, in: Changgen, F., Shengcai, L. (Eds.), 2012 International Symposium on Safety Science and Technology. Elsevier Science Bv, Amsterdam, pp. 904–909. [CrossRef]
- Han, H., Xu, J., Wang, X., Xie, J., Xing, Y., 2019a. Surface Subsidence Prediction Method for Coal Mines with Ultrathick and Hard Stratum. Adv. Civ. Eng. 2019, 3714381. [CrossRef]
- Han, H., Xu, J., Wang, X., Xie, J., Xing, Y., 2019b. Method to calculate working surface abutment pressure based on key strata theory. Advances in Civil Engineering 2019. [CrossRef]
- Heydarnoori, V., Khosravi, M.H., Bahaaddini, M., 2020. Physical modelling of caving propagation process and damage profile ahead of the cave-back. Journal of Mining and Environment 11. [CrossRef]
- Hong, Y., Li, Z., Qiao, G., Ou, J., Cheng, W., 2018. Pressure sensitivity of multiscale carbon-admixtures-enhanced cement-based composites. Nanomater. Nanotechnol. 8, 1847980418793529. [CrossRef]
- Hu, Q., Cui, X., Liu, W., Feng, R., Ma, T., Li, C., 2022. Quantitative and dynamic predictive model for mining-induced movement and deformation of overlying strata. Engineering Geology 311, 106876. [CrossRef]
- Hung, C.-H., Chan, P.-C., Lin, C.-H., Lin, M.-L., 2022. Numerical investigation of the roles of gravel fabric on composite strata deformation induced by thrust faulting. Engineering Geology 311, 106921. [CrossRef]
- Jiang, F., Yu, W., 2017. Damage analysis by physically nonlinear composite beam theory. Compos. Struct. 182, 652–665. [CrossRef]
- Jiang, J., Wu, Quan-sen, Wu, Quan-lin, Wang, P., Zhang, C., Gong, B., 2018. Study on Distribution Characteristics of Mining Stress and Elastic Energy Under Hard and Thick Igneous Rocks. Geotech. Geol. Eng. 36, 3451–3466. [CrossRef]
- Ju, J., Xu, J., 2013. Structural characteristics of key strata and strata behaviour of a fully mechanized longwall face with 7.0m height chocks. International Journal of Rock Mechanics and Mining Sciences 58, 46–54. [CrossRef]
- Kamani, R., Kamali Dolatabadi, M., Asgharian Jeddi, A.A., Nasrollahzadeh, K., 2018. Damage detection of carbon fiber-reinforced concrete under bending test. Journal of Textiles and Polymers 6, 39–45.
- Kattan, P.I., 2010. MATLAB guide to finite elements: an interactive approach. Springer Science & Business Media.
- Khanal, M., Qu, Q., Zhu, Y., Xie, J., Zhu, W., Hou, T., Song, S., 2022. Characterization of Overburden Deformation and Subsidence Behavior in a Kilometer Deep Longwall Mine. Minerals 12, 543. [CrossRef]
- Lemaitre, J., Chaboche, J.-L., 1994. Mechanics of solid materials. Cambridge university press.
- Li, Z., Yu, S., Zhu, W., Feng, G., Xu, J., Guo, Y., Qi, T., 2020. Dynamic loading induced by the instability of voussoir beam structure during mining below the slope. Int. J. Rock Mech. Min. Sci. 132, 104343. [CrossRef]
- Luo, T., Pan, X., Sun, Q., Liu, F., Hua, C., Yi, Y., 2022. A study on damage of steel fiber reinforced concrete (SFRC) under uniaxial compression based on the electrical resistivity method. Mater Struct 55, 173. [CrossRef]
- Miao, X., Cui, X., Wang, J., Xu, J., 2011. The height of fractured water-conducting zone in undermined rock strata. Eng. Geol. 120, 32–39. [CrossRef]
- Mises, R. v, 1913. Mechanik der festen Körper im plastisch-deformablen Zustand. Nachrichten von der Gesellschaft der Wissenschaften zu Göttingen, Mathematisch-Physikalische Klasse 1913, 582–592.
- Muñoz, J.A., Avalos, M., Bolmaro, R.E., 2018. Heterogeneity of strain path, texture and microstructure evolution of AA6063-T6 processed by Equal Channel Angular Sheet Extrusion (ECASE). Journal of Alloys and Compounds 768, 349–357. [CrossRef]
- Ning, J., Wang, J., Jiang, L., Jiang, N., Liu, X., Jiang, J., 2017. Fracture analysis of double-layer hard and thick roof and the controlling effect on strata behavior: a case study. Engineering Failure Analysis 81, 117–134.
- Ning, S., Zhu, W., Xie, J., Song, S., Wang, X., Yu, D., Lou, J., Xu, J., 2022. Influence of stress distribution in coal seams of non-uniform extremely thick key stratum and disaster-causing mechanisms. Scientific Reports 12, 14465. [CrossRef]
- Niranjan, B.R., Patil, S.S., 2012. Analysis of RC deep beam by finite element method. International Journal of Modern Engineering Research (IJMER) 2, 4664–4667.
- Peng, J., Chen, L., Huang, Q., Men, Y., Fan, W., Yan, J., 2013. Physical simulation of ground fissures triggered by underground fault activity. Engineering Geology 155, 19–30. [CrossRef]
- Qu, Q., Guo, H., Khanal, M., 2021. Monitoring and analysis of ground movement from multi-seam mining. International Journal of Rock Mechanics and Mining Sciences 148, 104949. [CrossRef]
- Ramirez, J., French, C., Adebar, P., Bonacci, J., Collins, M., Darwin, D., Dilger, W., Gogate, A., Hawkins, N., Hsu, T., Klein, G., Krauthammer, T., MacGregor, J., Mitchell, D., Oesterle, R., Polak, M., Rajagopalan, K., Reineck, K., Rogowsky, D., Sabnis, G., Sanders, D., Wight, J., Zia, P., ASCE-ACI Comm 445 Shear Torison, 1998. Recent approaches to shear design of structural concrete. JOURNAL OF STRUCTURAL ENGINEERING 124, 1375–1417. [CrossRef]
- Senthil, K., Singhal, A., Shailja, B., 2019. Damage mechanism and stress response of reinforced concrete slab under blast loading. Coupled Syst. Mech. 8, 315–338. [CrossRef]
- Singh, R.P., Yadav, R.N., 1995. Prediction of subsidence due to coal mining in Raniganj coalfield, West Bengal, India. Engineering Geology 39, 103–111. [CrossRef]
- Tavoosi, M., Sharifian, Mehrdad, Sharifian, Mehrzad, 2020. A hybrid method to update stress for perfect von-Mises plasticity coupled with Lemaitre damage mechanics. Eng. Comput. 37, 705–729. [CrossRef]
- Wang, P., Jiang, J., Zhang, P., Wu, Q., 2016. Breaking process and mining stress evolution characteristics of a high-position hard and thick stratum. International Journal of Mining Science and Technology 26, 563–569. [CrossRef]
- Wang, P., Jiang, L., Jiang, J., Zheng, P., Li, W., 2018. Strata behaviors and rock burst–inducing mechanism under the coupling effect of a hard, thick stratum and a normal fault. International Journal of Geomechanics 18, 04017135.
- Wang, X., Xie, jianlin, Zhu, W., Xu, J., 2022. The field monitoring experiment of the high-level key stratum movement in coal mining based on collaborative DOFS and MPBX. Sci Rep 12, 665. [CrossRef]
- Wang, X., Zhu, W., Xie, J., Han, H., Xu, Jingmin, Tang, Z., Xu, Jialin, 2021a. Borehole-Based Monitoring of Mining-Induced Movement in Ultrathick-and-Hard Sandstone Strata of the Luohe Formation. Minerals 11, 1157. [CrossRef]
- Wang, X., Zhu, W., Xie, J., Han, H., Xu, Jingmin, Tang, Z., Xu, Jialin, 2021b. Borehole-Based Monitoring of Mining-Induced Movement in Ultrathick-and-Hard Sandstone Strata of the Luohe Formation. Minerals 11, 1157. [CrossRef]
- Xu, C., Fu, J., Sun, L., Masuya, H., Zhang, L., 2021. Fatigue damage self-sensing of bridge deck component with built-in giant piezoresistive Cementitious Carbon Fiber Composites. Composite Structures 276, 114459. [CrossRef]
- Xu, J., Qian, M., 2000. Method to distinguish key strata in overburden. Journal of China University of Mining and Technology 29, 21–25.
- Xu, J., Zhu, W., Xu, Jialin, Wu, J., Li, Y., 2021. High-intensity longwall mining-induced ground subsidence in Shendong coalfield, China. Int. J. Rock Mech. Min. Sci. 141, 104730. [CrossRef]
- Xuan, D., Xu, J., Zhu, W., 2014. Dynamic disaster control under a massive igneous sill by grouting from surface boreholes. Int. J. Rock Mech. Min. Sci. 71, 176–187. [CrossRef]
- Zhao, X., Deng, L., Xu, J., 2020. Defining Stress Thresholds of Granite Failure Process Based on Acoustic Emission Activity Parameters. Shock and Vibration 2020, 1–8. [CrossRef]
- Zhou, K., Dou, L., Gong, S., Li, J., Zhang, J., Cao, J., 2020. Study of Rock Burst Risk Evolution in Front of Deep Longwall Panel Based on Passive Seismic Velocity Tomography. Geofluids 2020, e8888413. [CrossRef]
- Zhou, K., Dou, L., Li, X., Song, S., Cao, J., Jinzheng, B., Ma, X., 2022. Coal burst and mining-induced stress evolution in a deep isolated main entry area - A case study. Eng. Fail. Anal. 137, 106289. [CrossRef]
- Zhu, W., Chen, L., Zhou, Z., Shen, B., Xu, Y., 2019. Failure Propagation of Pillars and Roof in a Room and Pillar Mine Induced by Longwall Mining in the Lower Seam. Rock Mechanics and Rock Engineering 52, 1193–1209. [CrossRef]
- Zhu, W., Xu, J., Li, Y., 2017. Mechanism of the dynamic pressure caused by the instability of upper chamber coal pillars in Shendong coalfield, China. Geosciences Journal 21, 729–741. [CrossRef]
Figure 1.
Layout of Gaojipu coal mine. The red-shaded areas had undergone several dynamic events during the extraction of the 101-103 panels of Area 1.
Figure 1.
Layout of Gaojipu coal mine. The red-shaded areas had undergone several dynamic events during the extraction of the 101-103 panels of Area 1.
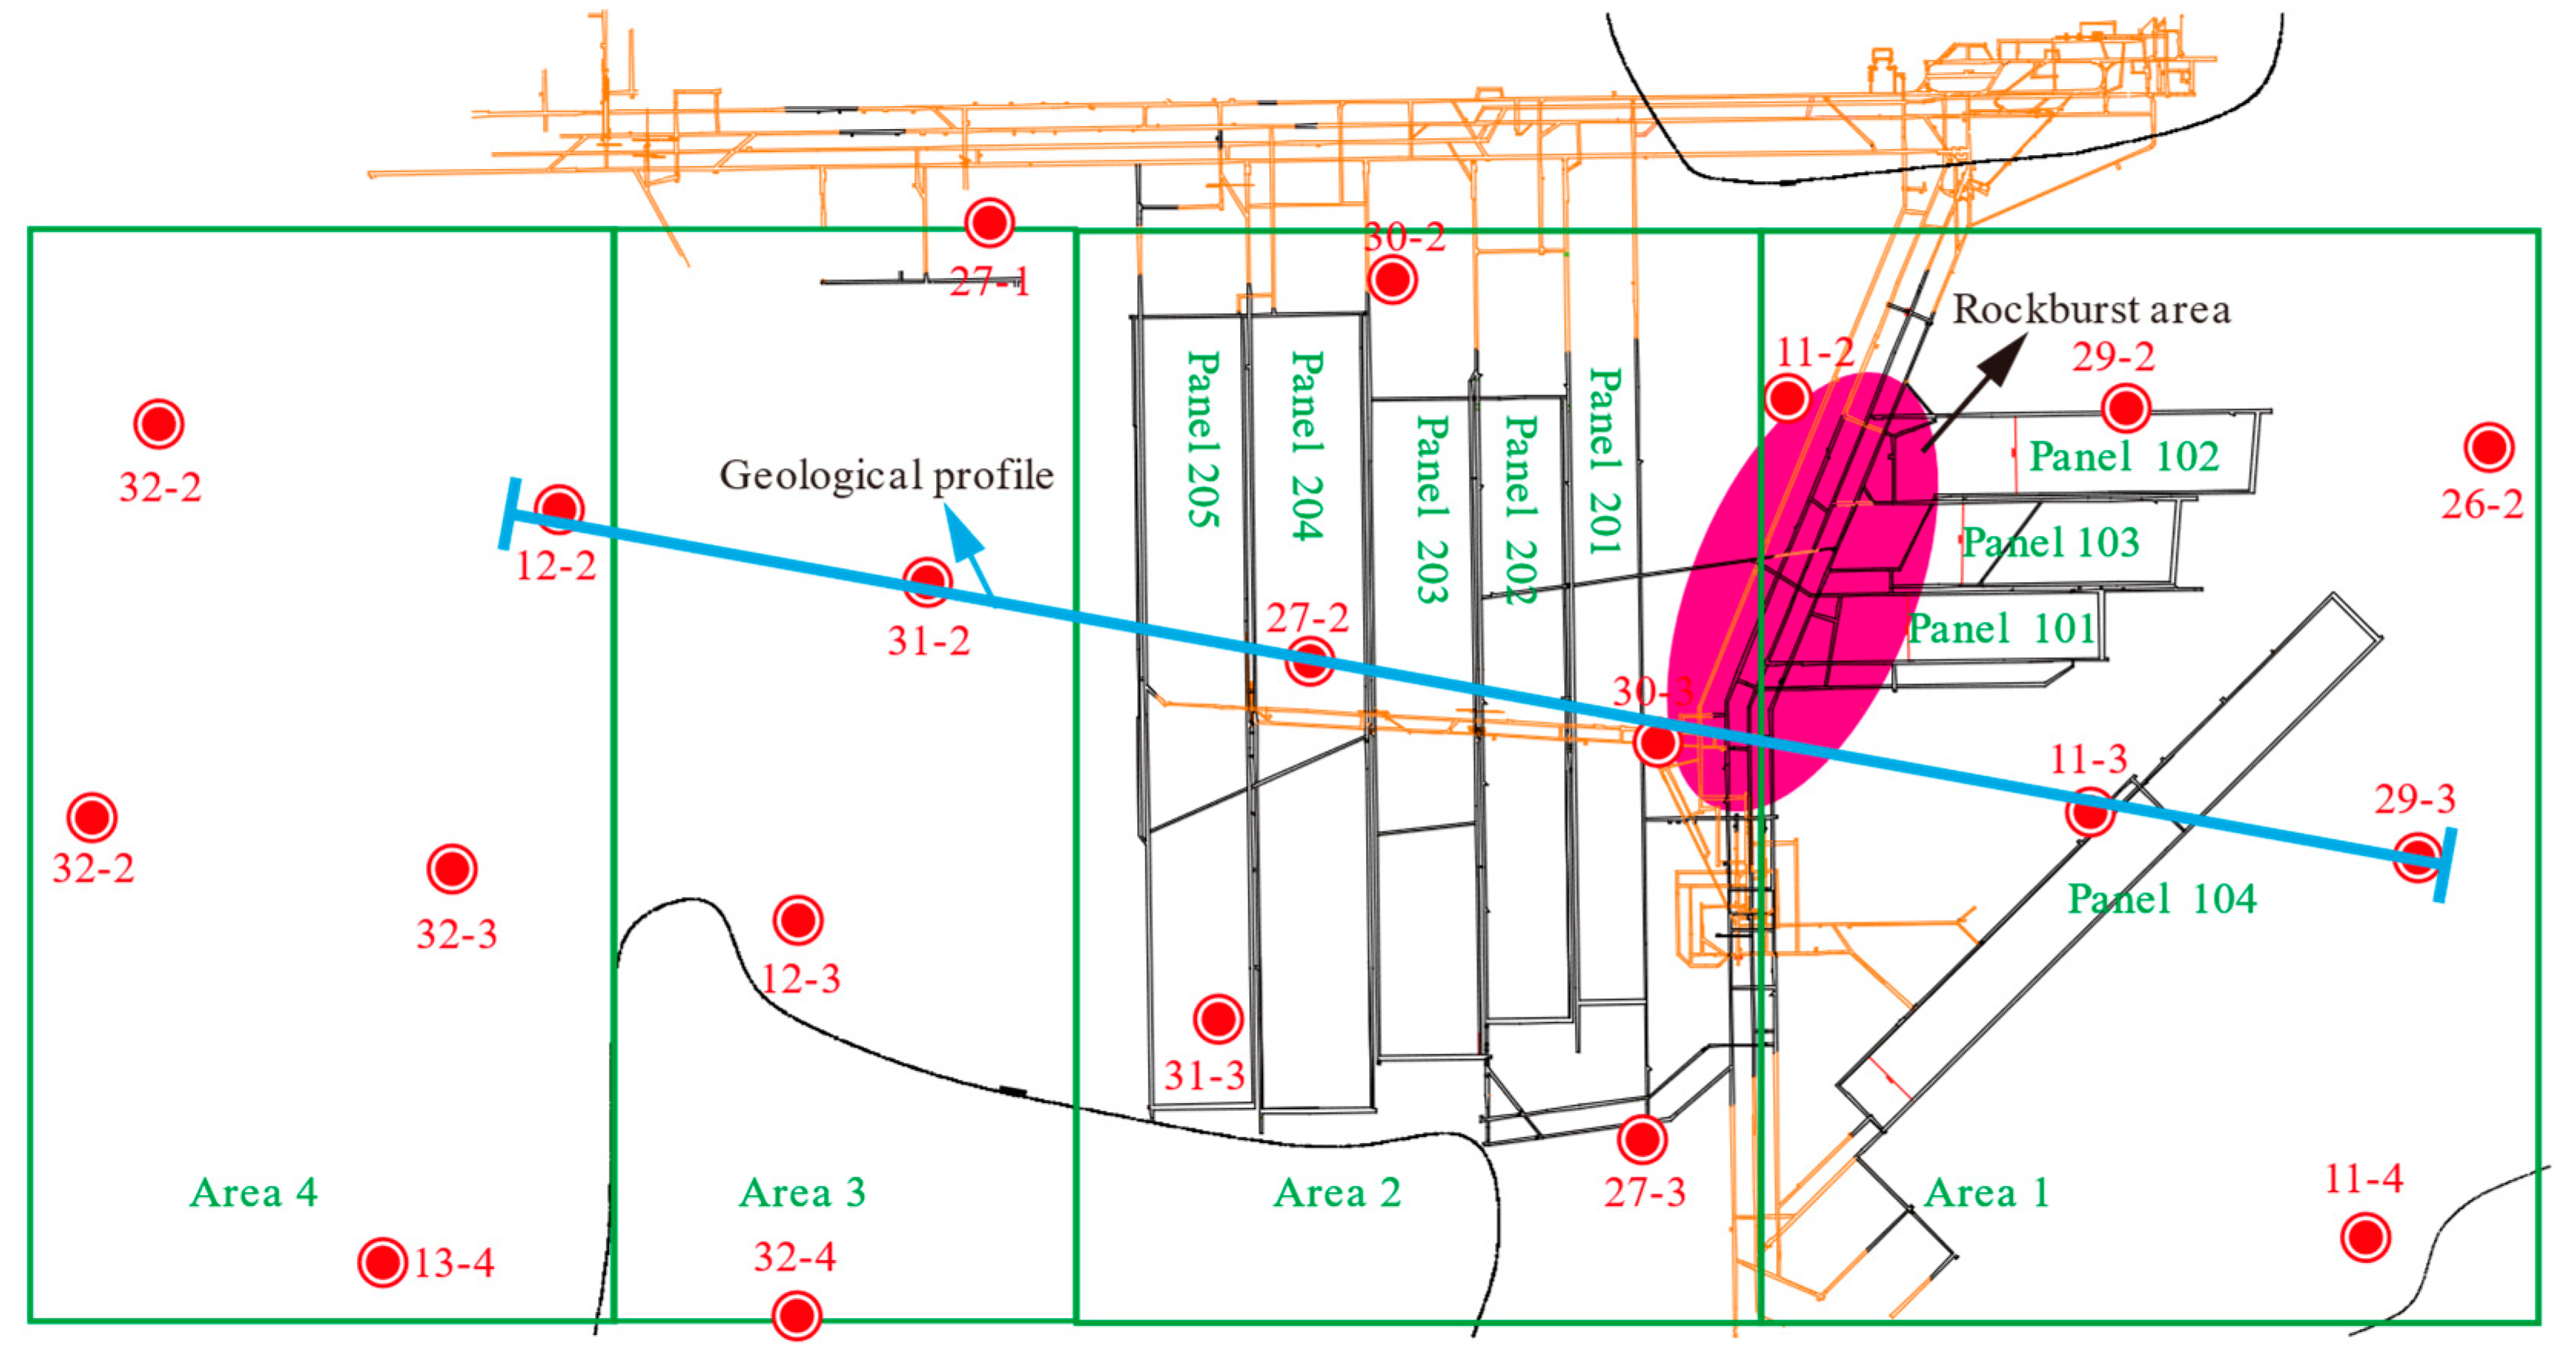
Figure 2.
Gaojiapu Mine stratigraphic distribution profile.
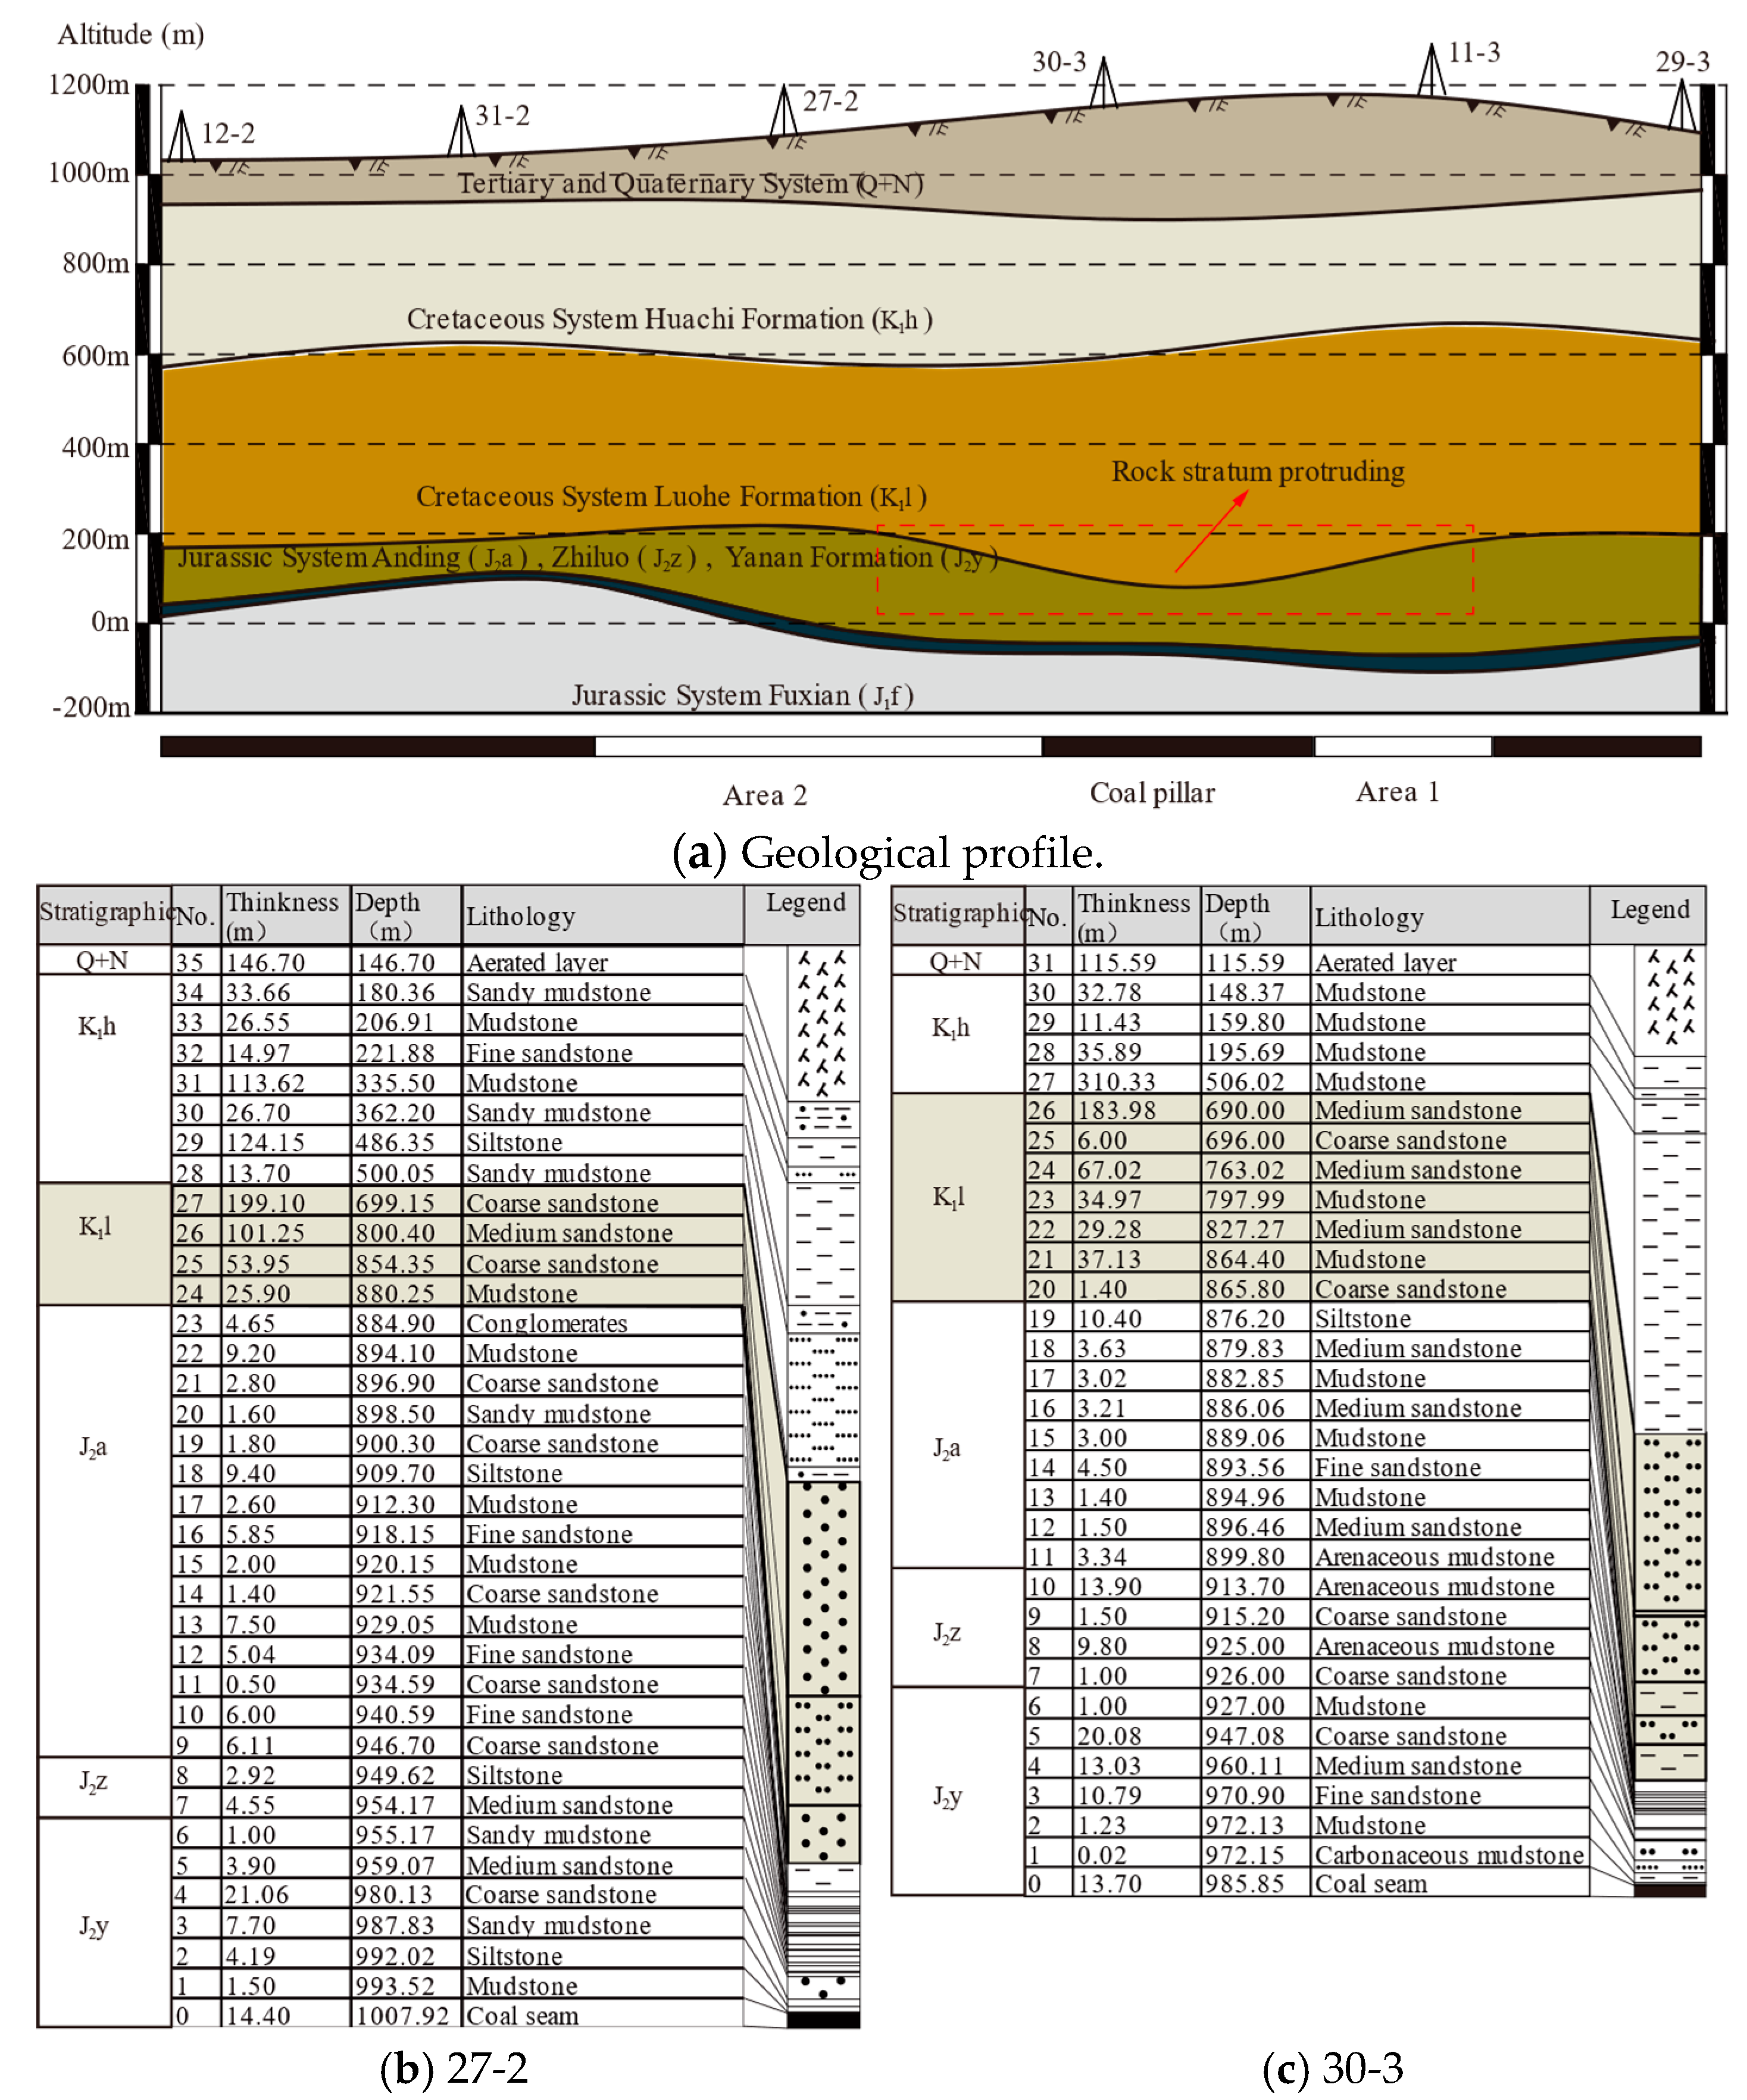
Figure 3.
Model laying scheme.
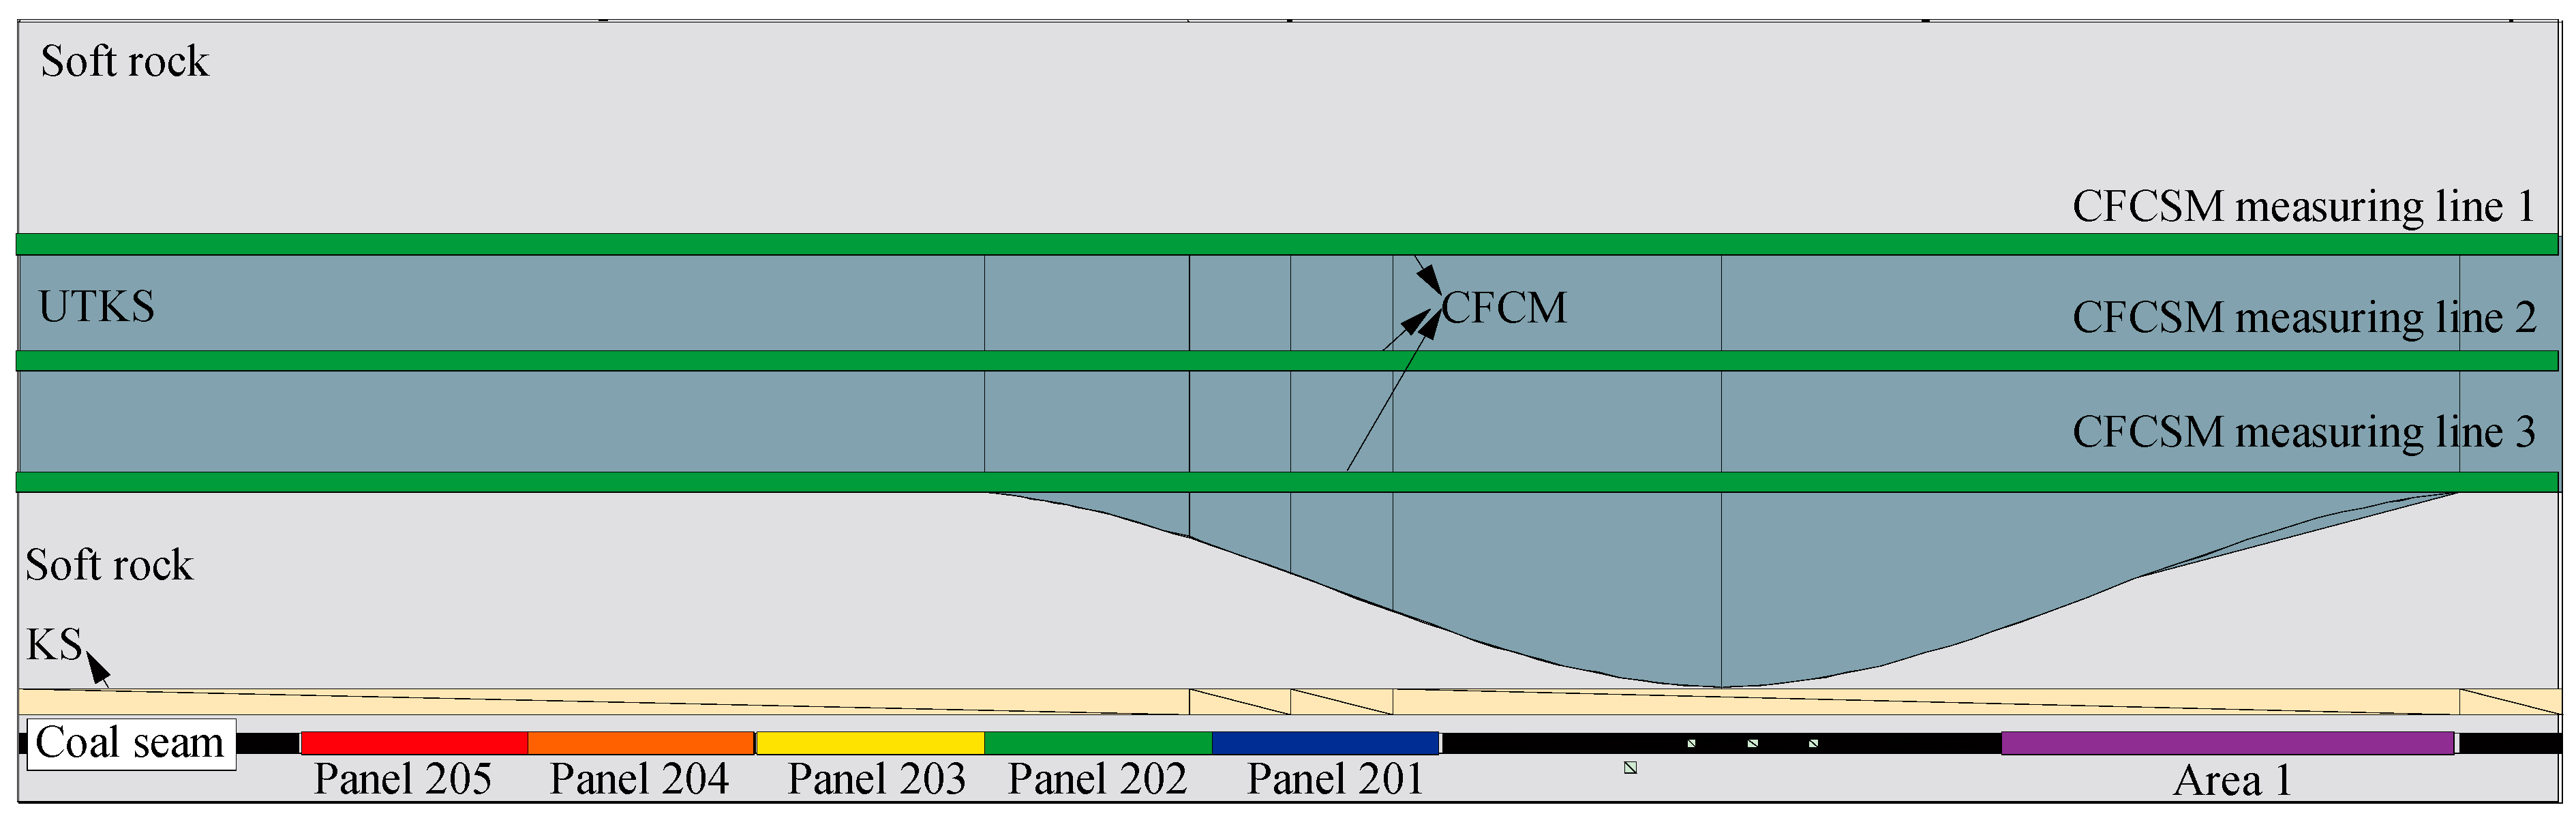
Figure 4.
The experiment model and monitoring system. It is noted that a baffle plate was installed in the middle of the model to prevent a collapse of the 5m wide model. Two thin layers of polyvinyl chloride film smeared with mechanical lubricants were placed between the plate and the model to reduce frictional forces.
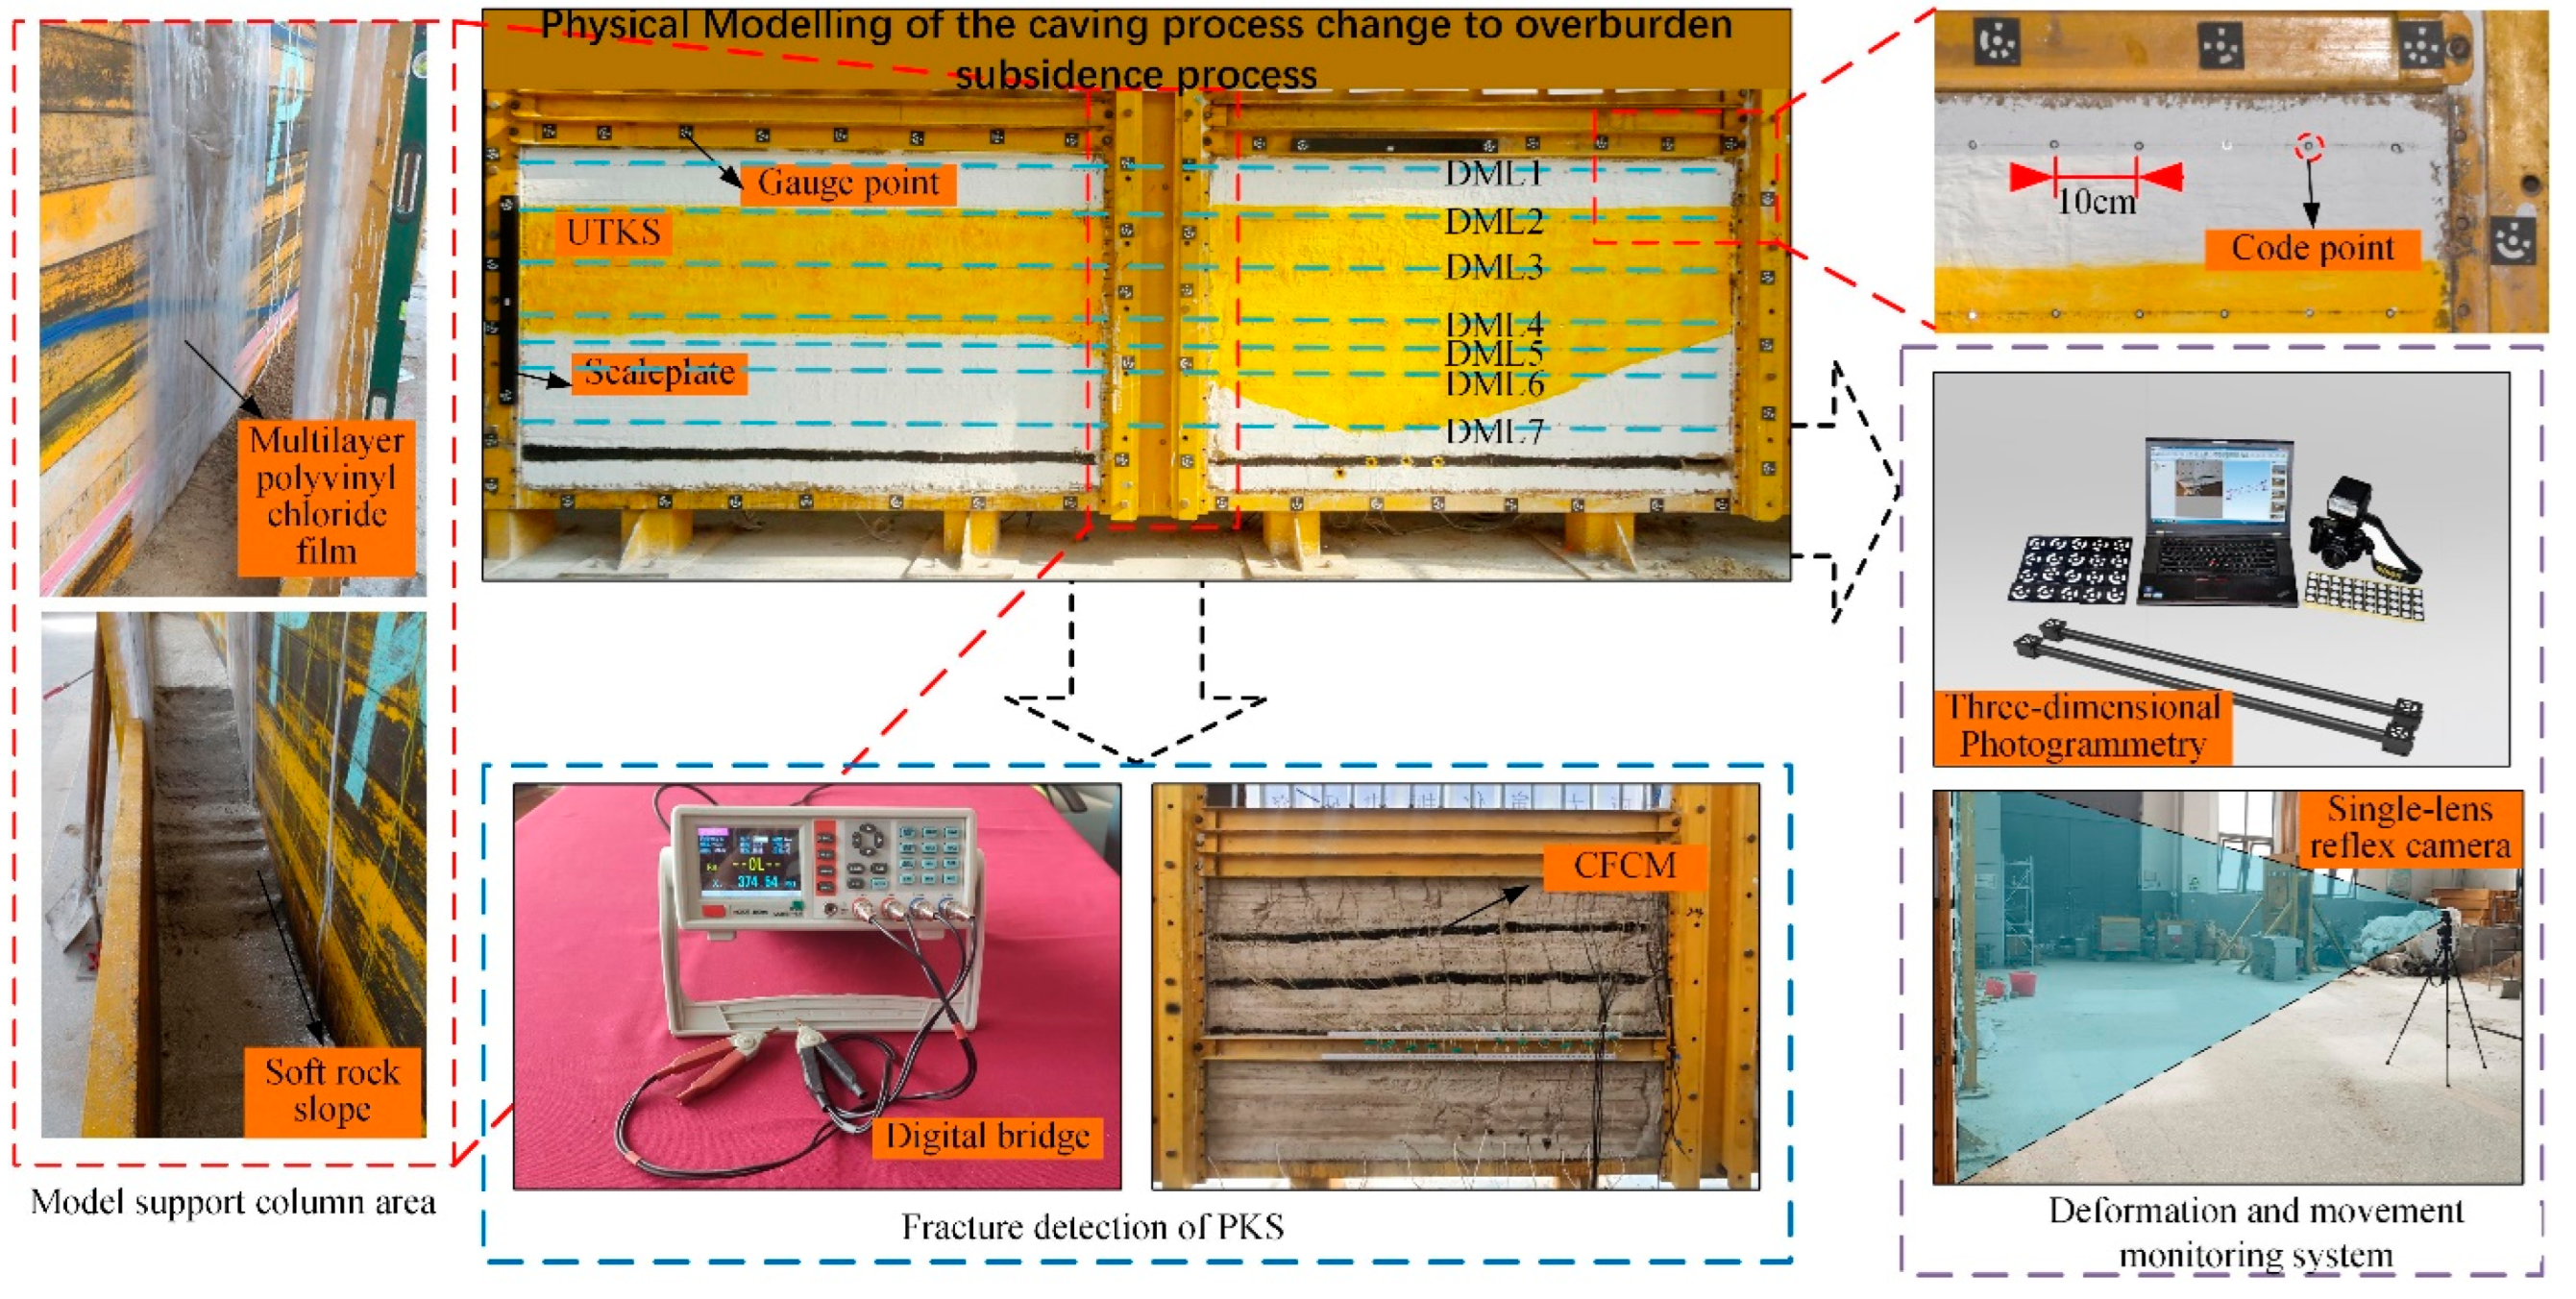
Figure 5.
The CNM materials: (a) the chopped carbon fibre sourced from Toray Industries, Inc.; and (b) the nano-carbon black sourced from Suqian Xigu Nanotechnology Co., Ltd.
Figure 5.
The CNM materials: (a) the chopped carbon fibre sourced from Toray Industries, Inc.; and (b) the nano-carbon black sourced from Suqian Xigu Nanotechnology Co., Ltd.
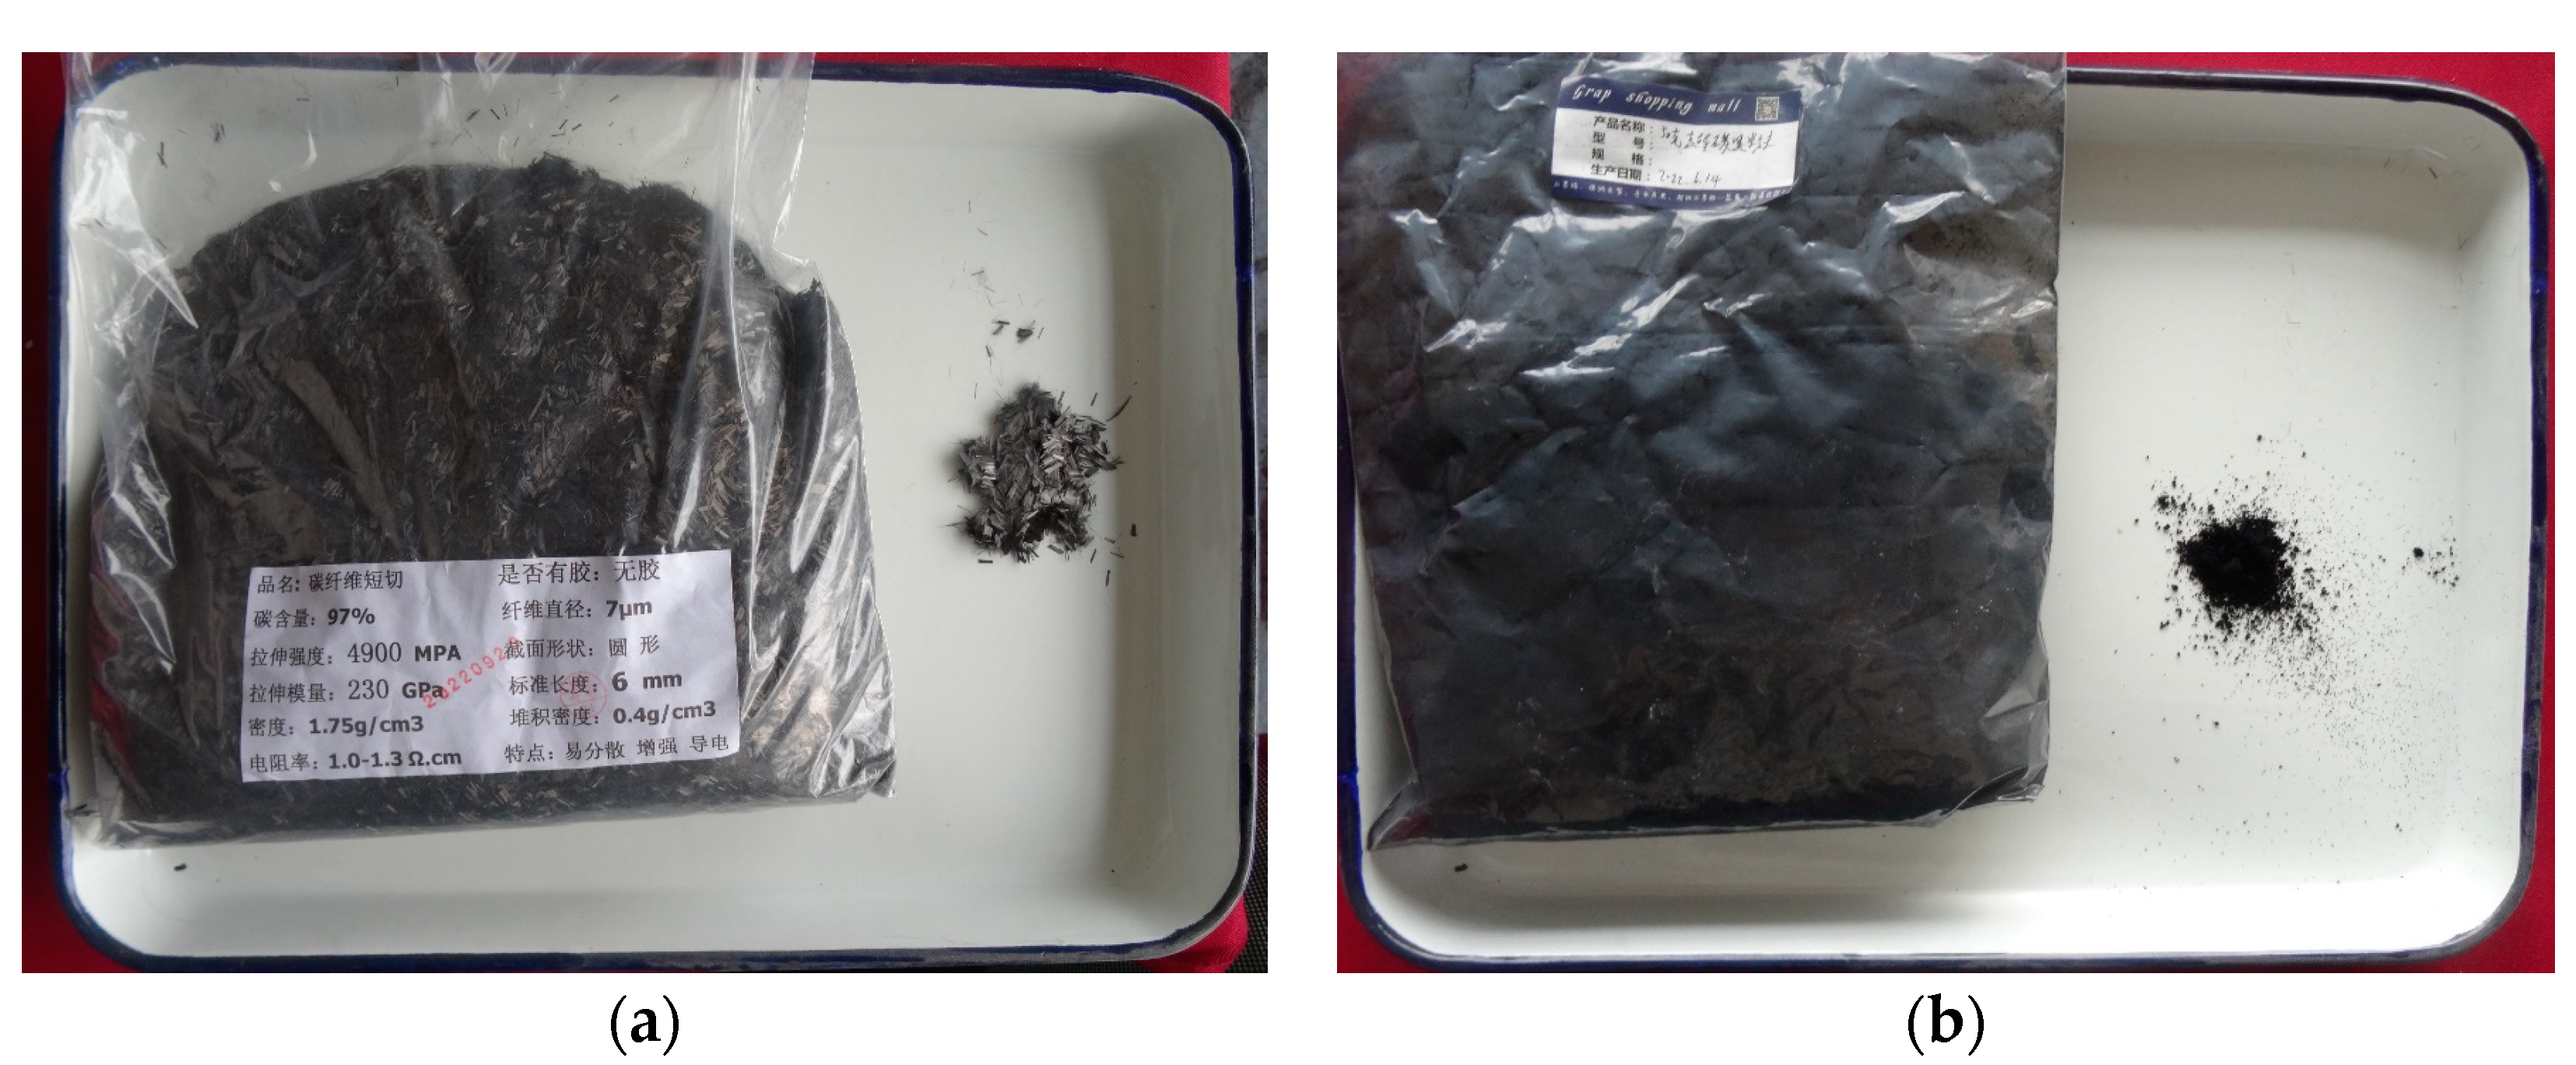
Figure 6.
Variation in resistance during the settlement period of the materials.
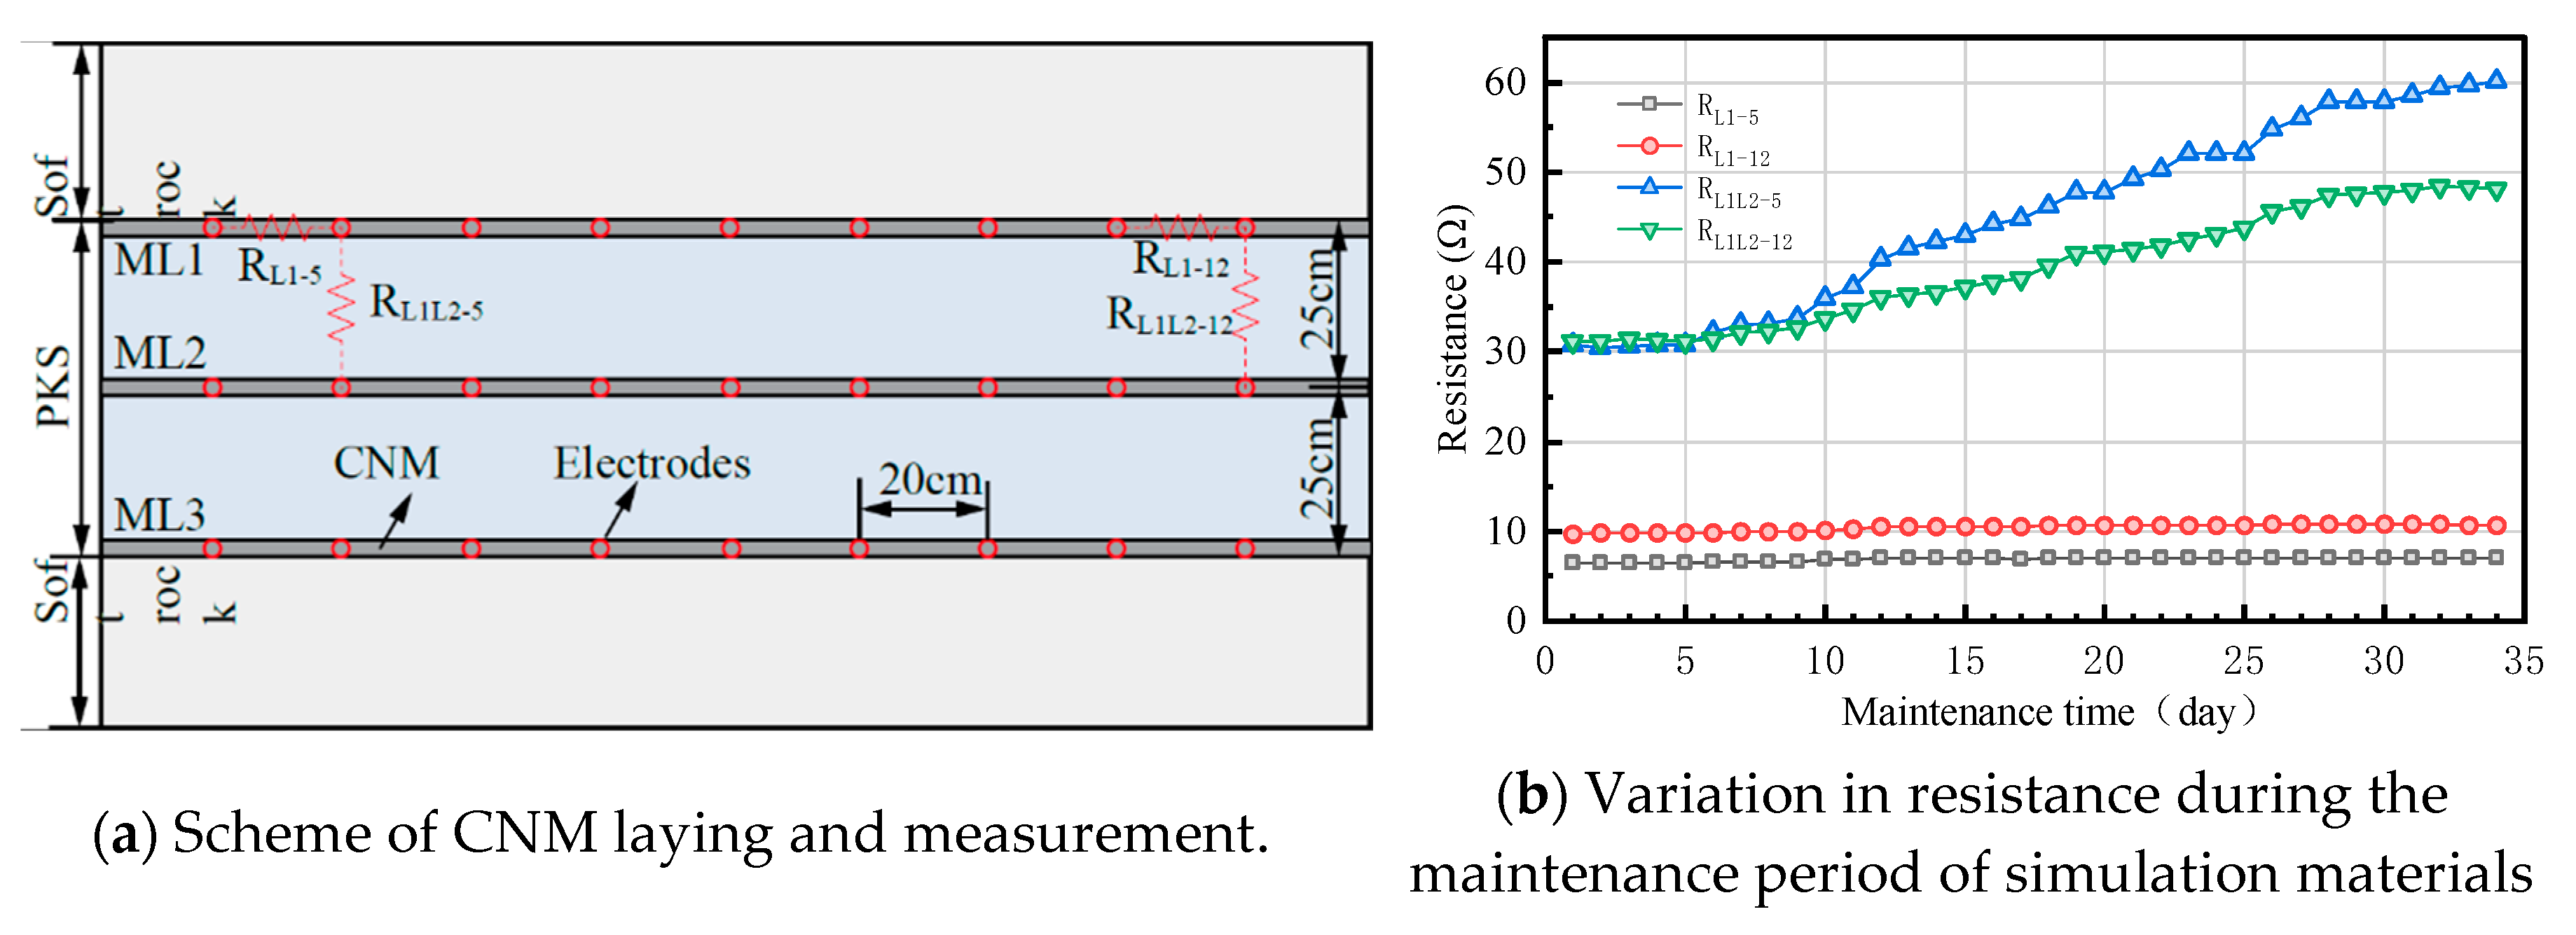
Figure 7.
Schematic diagram of the conductive circuit with a crack formed in the bottom of the CNM.
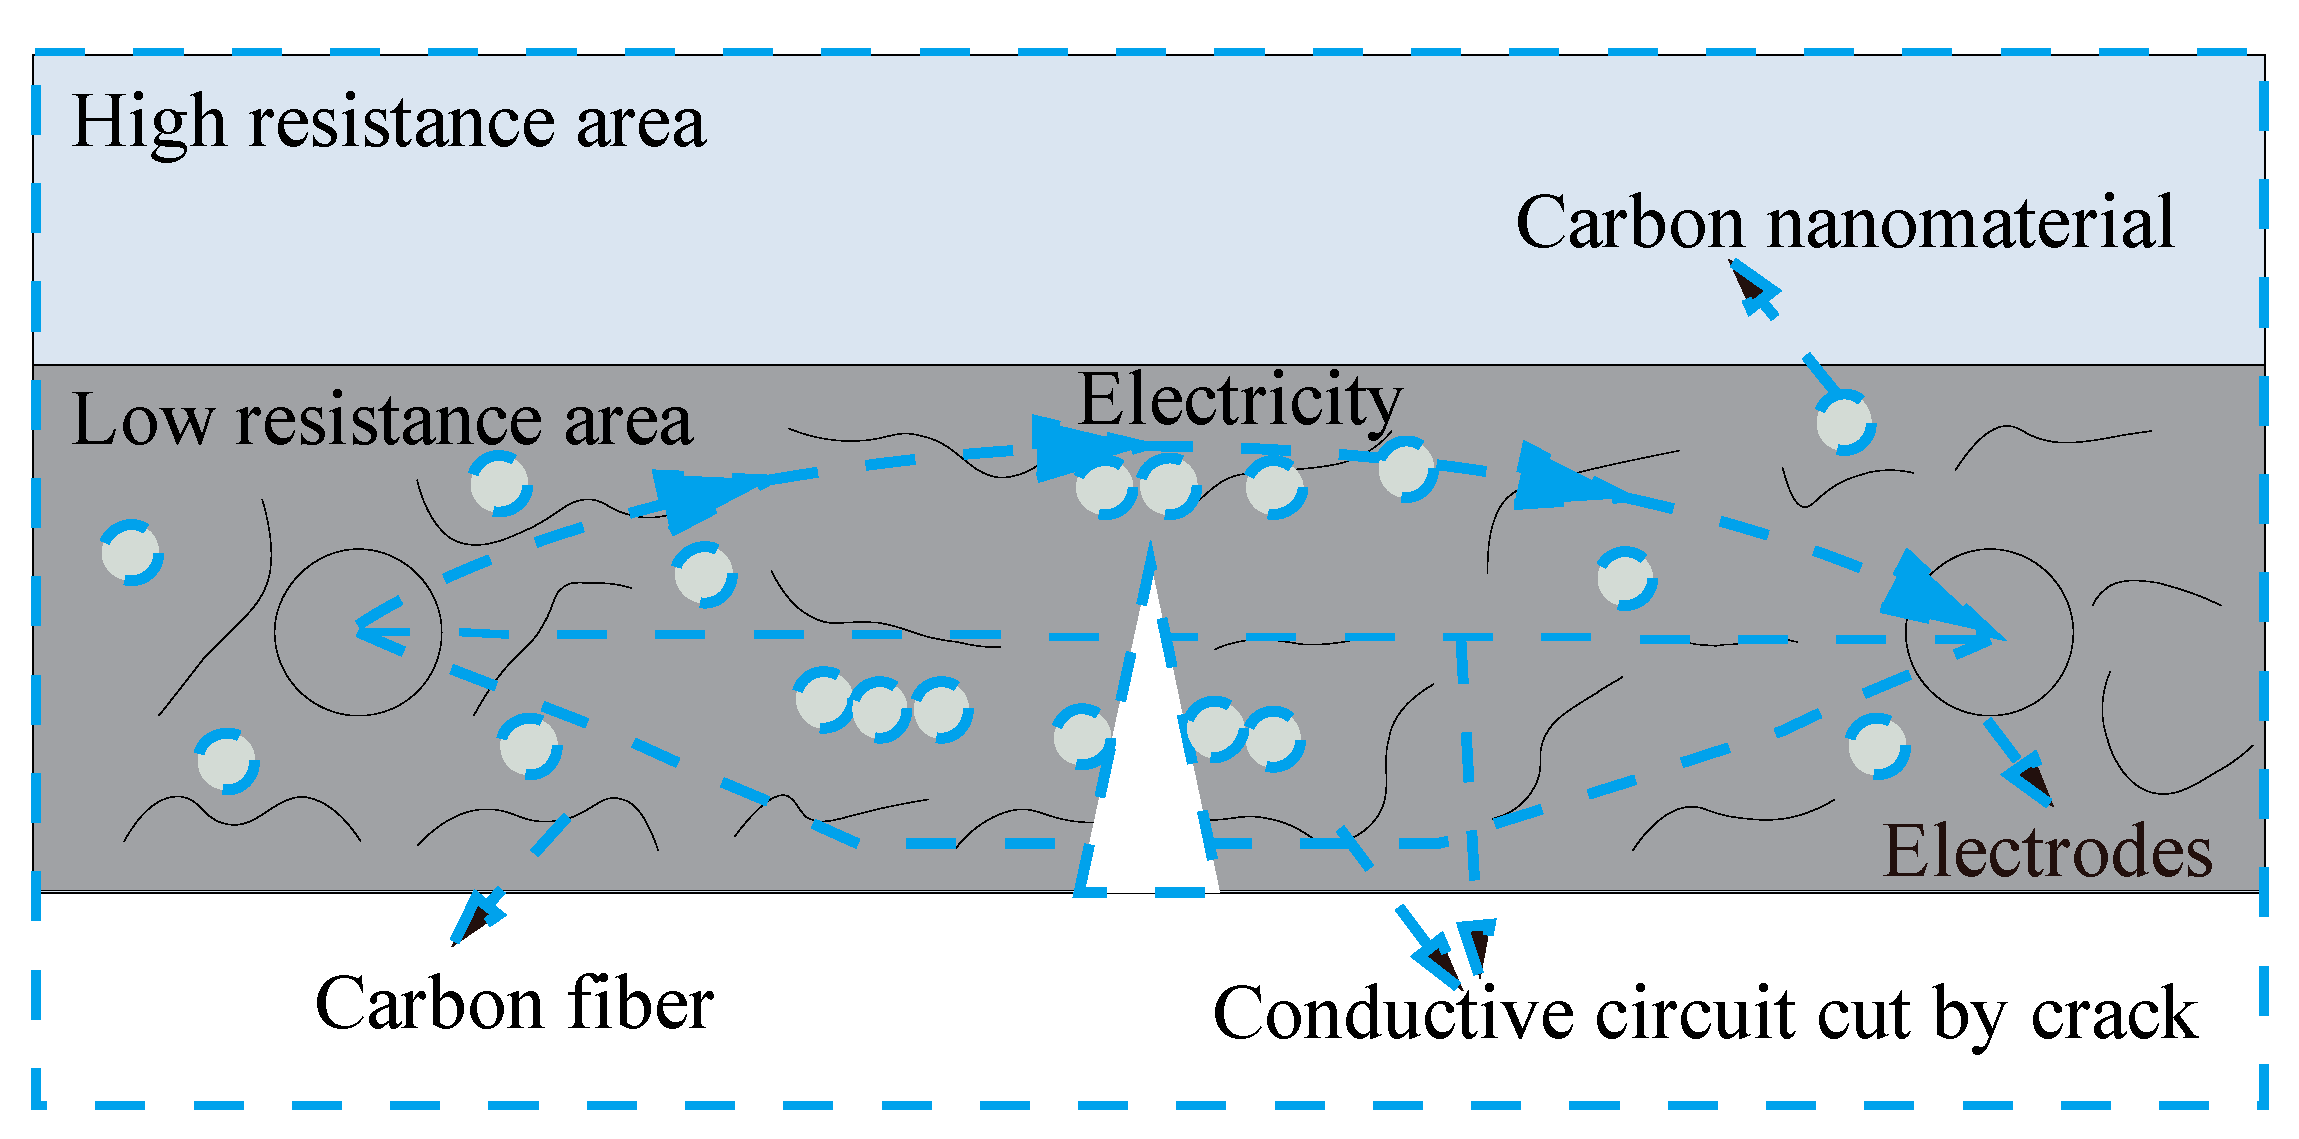
Figure 8.
The simulated caving and fracturing process of overburden.
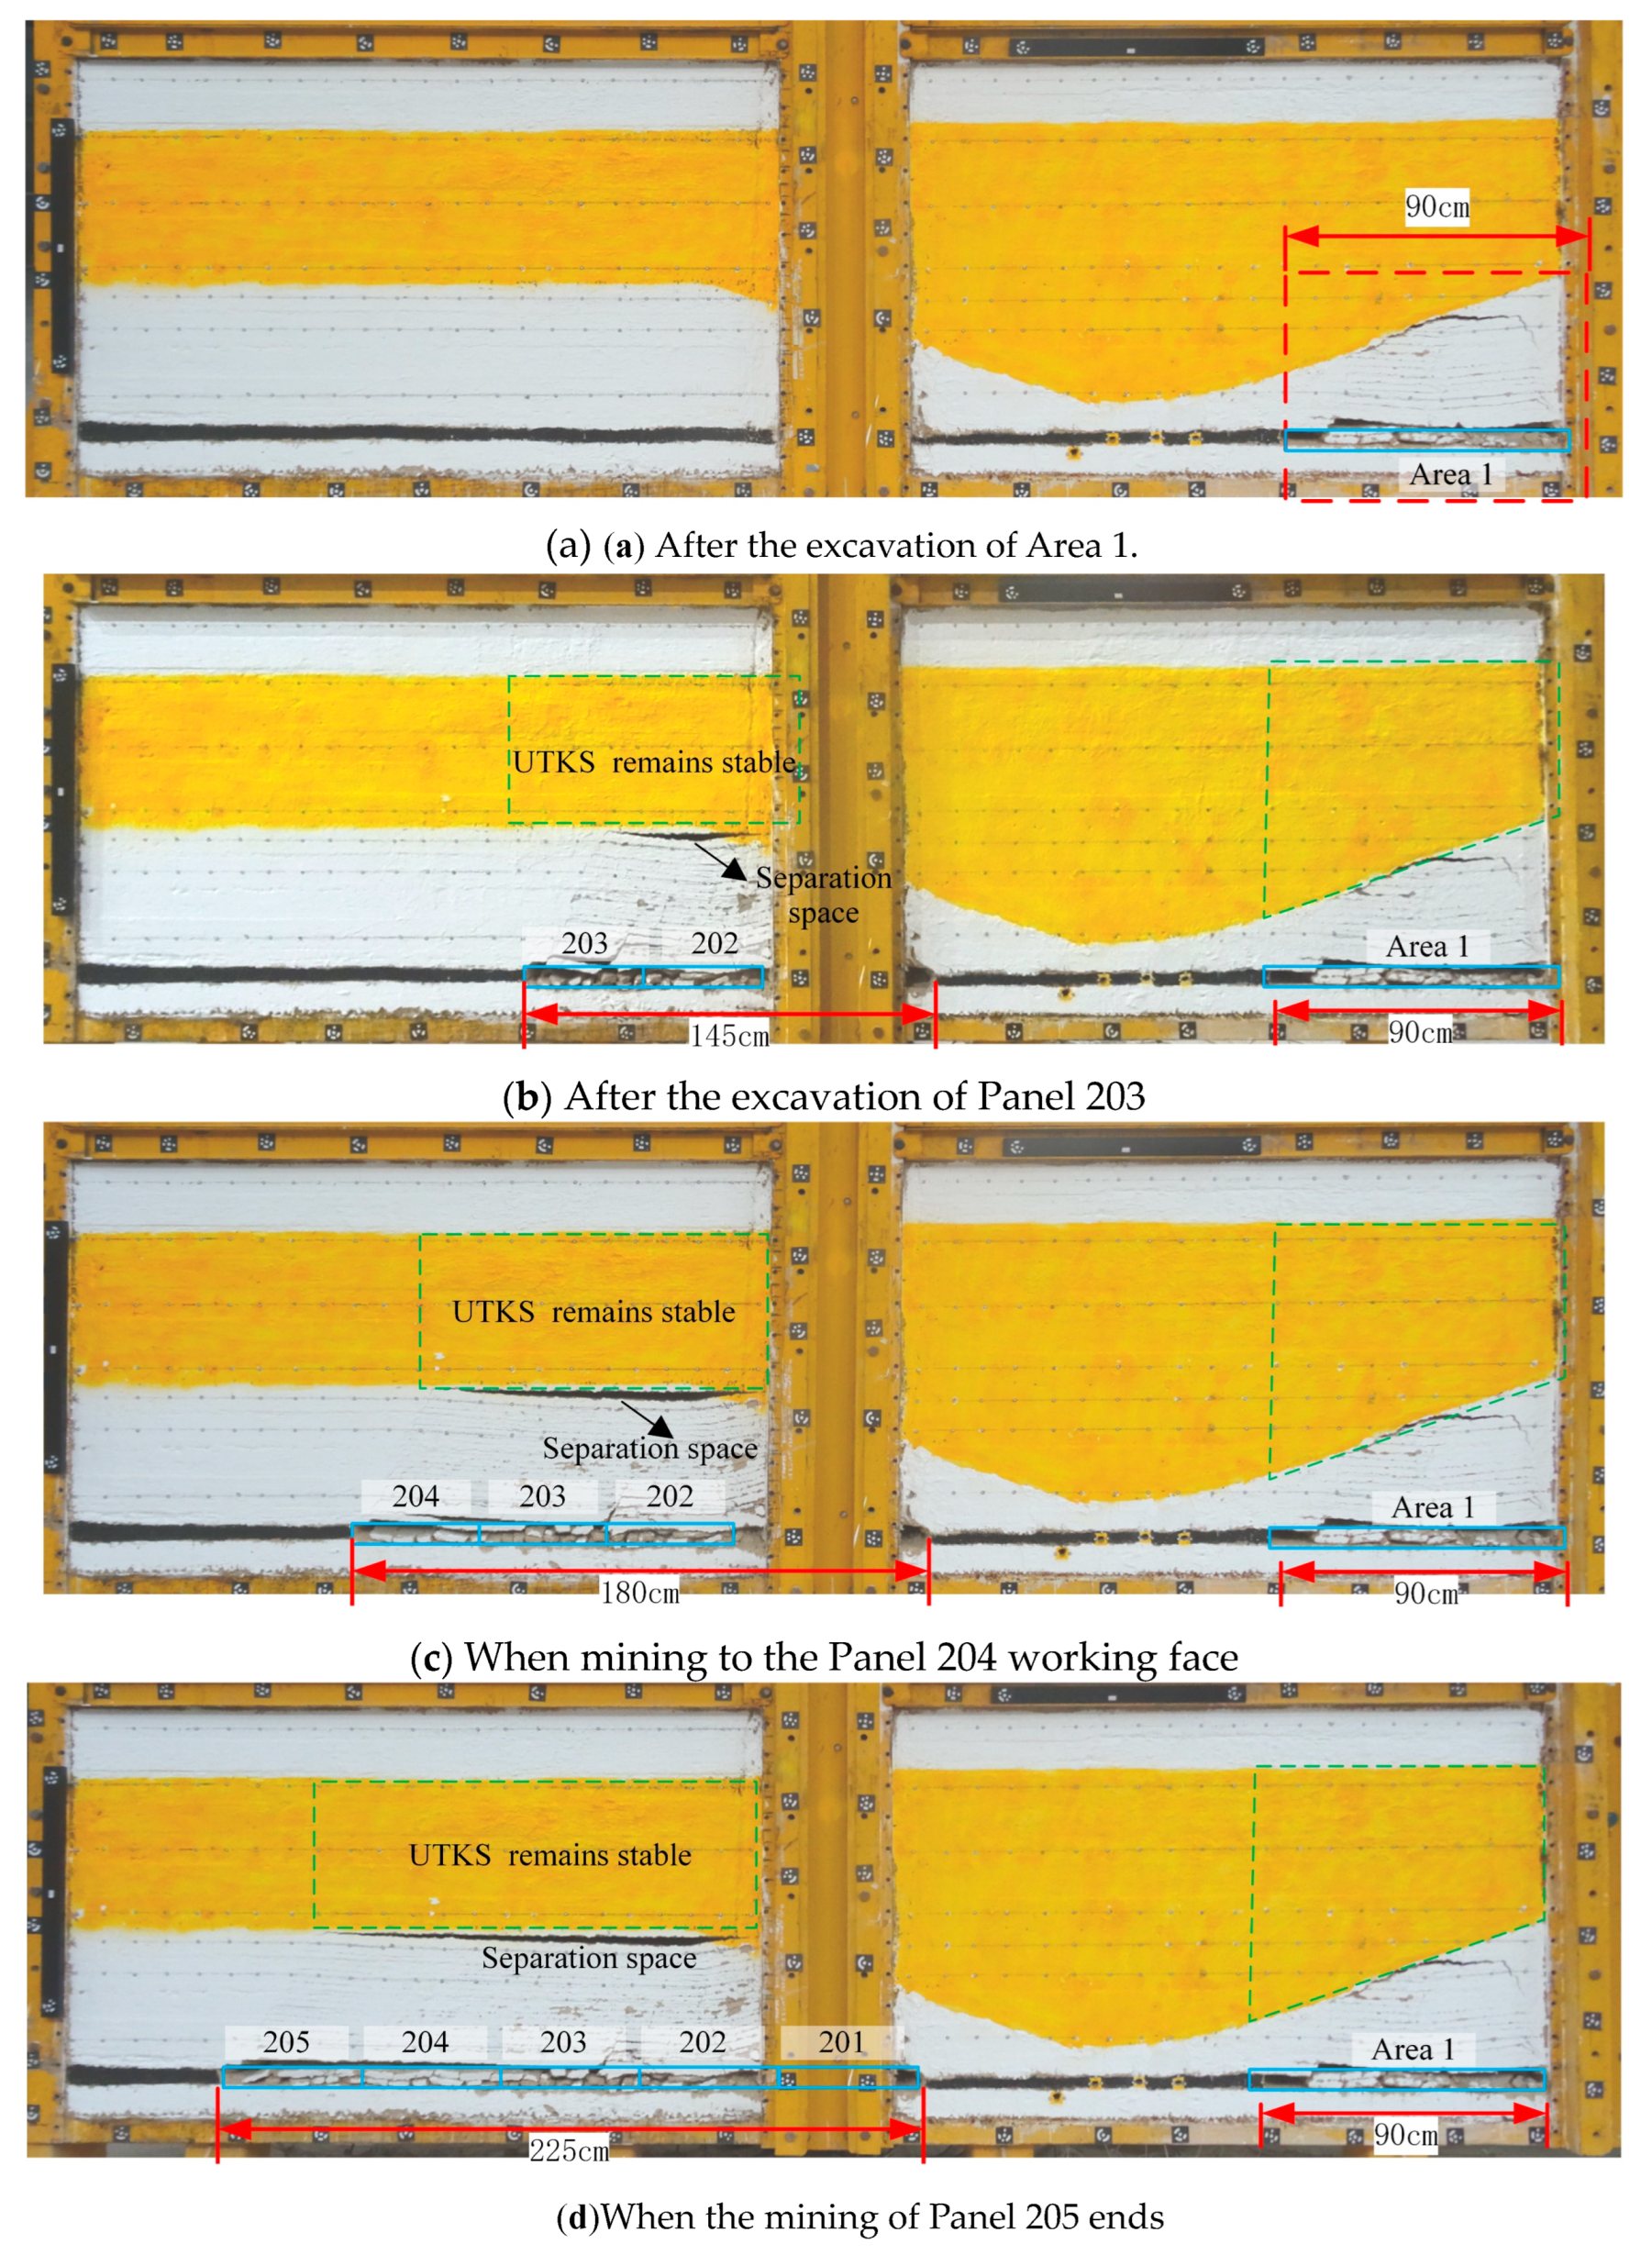
Figure 9.
Subsidence of measuring lines after mining of each panel.
Figure 10.
Strata movement in the middle of Panel 202.
Figure 11.
Analysed distribution of displacement in the UTKS during excavation.
Figure 12.
Variations of RCR under different mining conditions.
Figure 13.
Displacement, RCR and resistance difference change curves of UTKS during coal seam mining.
Figure 13.
Displacement, RCR and resistance difference change curves of UTKS during coal seam mining.
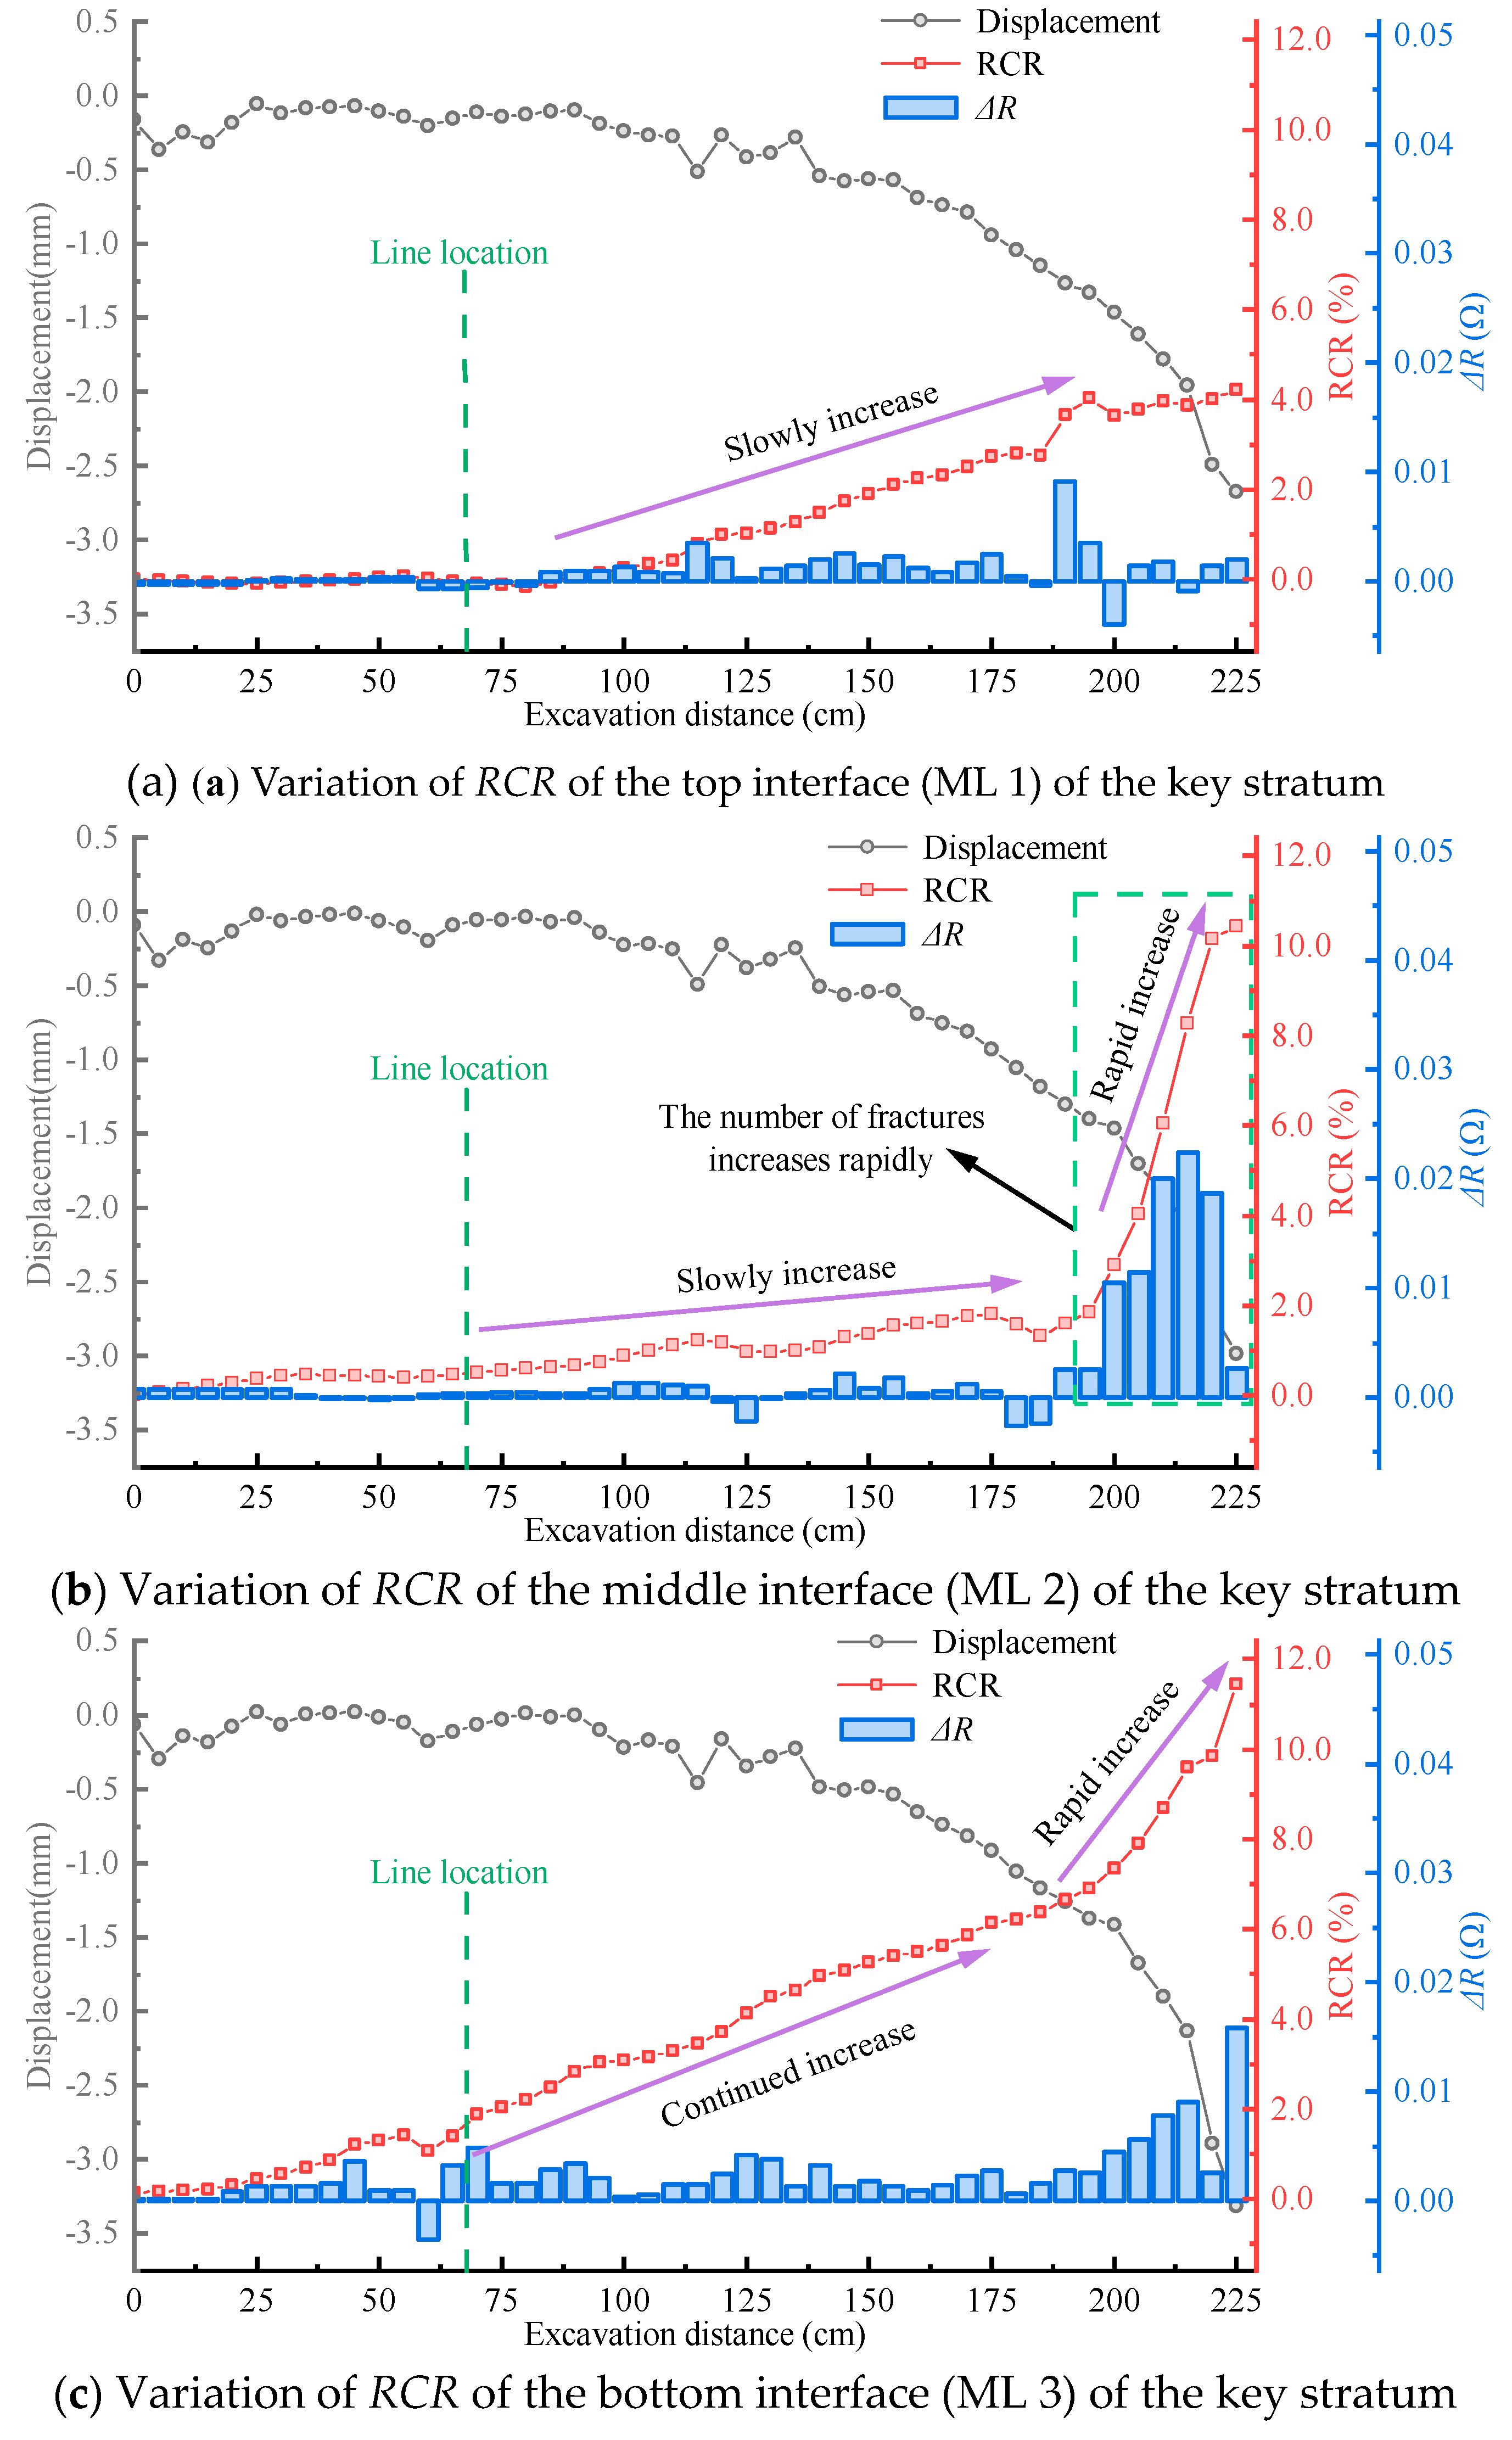
Figure 14.
The deflection of different thickness UTKS: (a) 400 m; (b) 200 m; (c) 100 m; and (d) 50 m.
Figure 14.
The deflection of different thickness UTKS: (a) 400 m; (b) 200 m; (c) 100 m; and (d) 50 m.
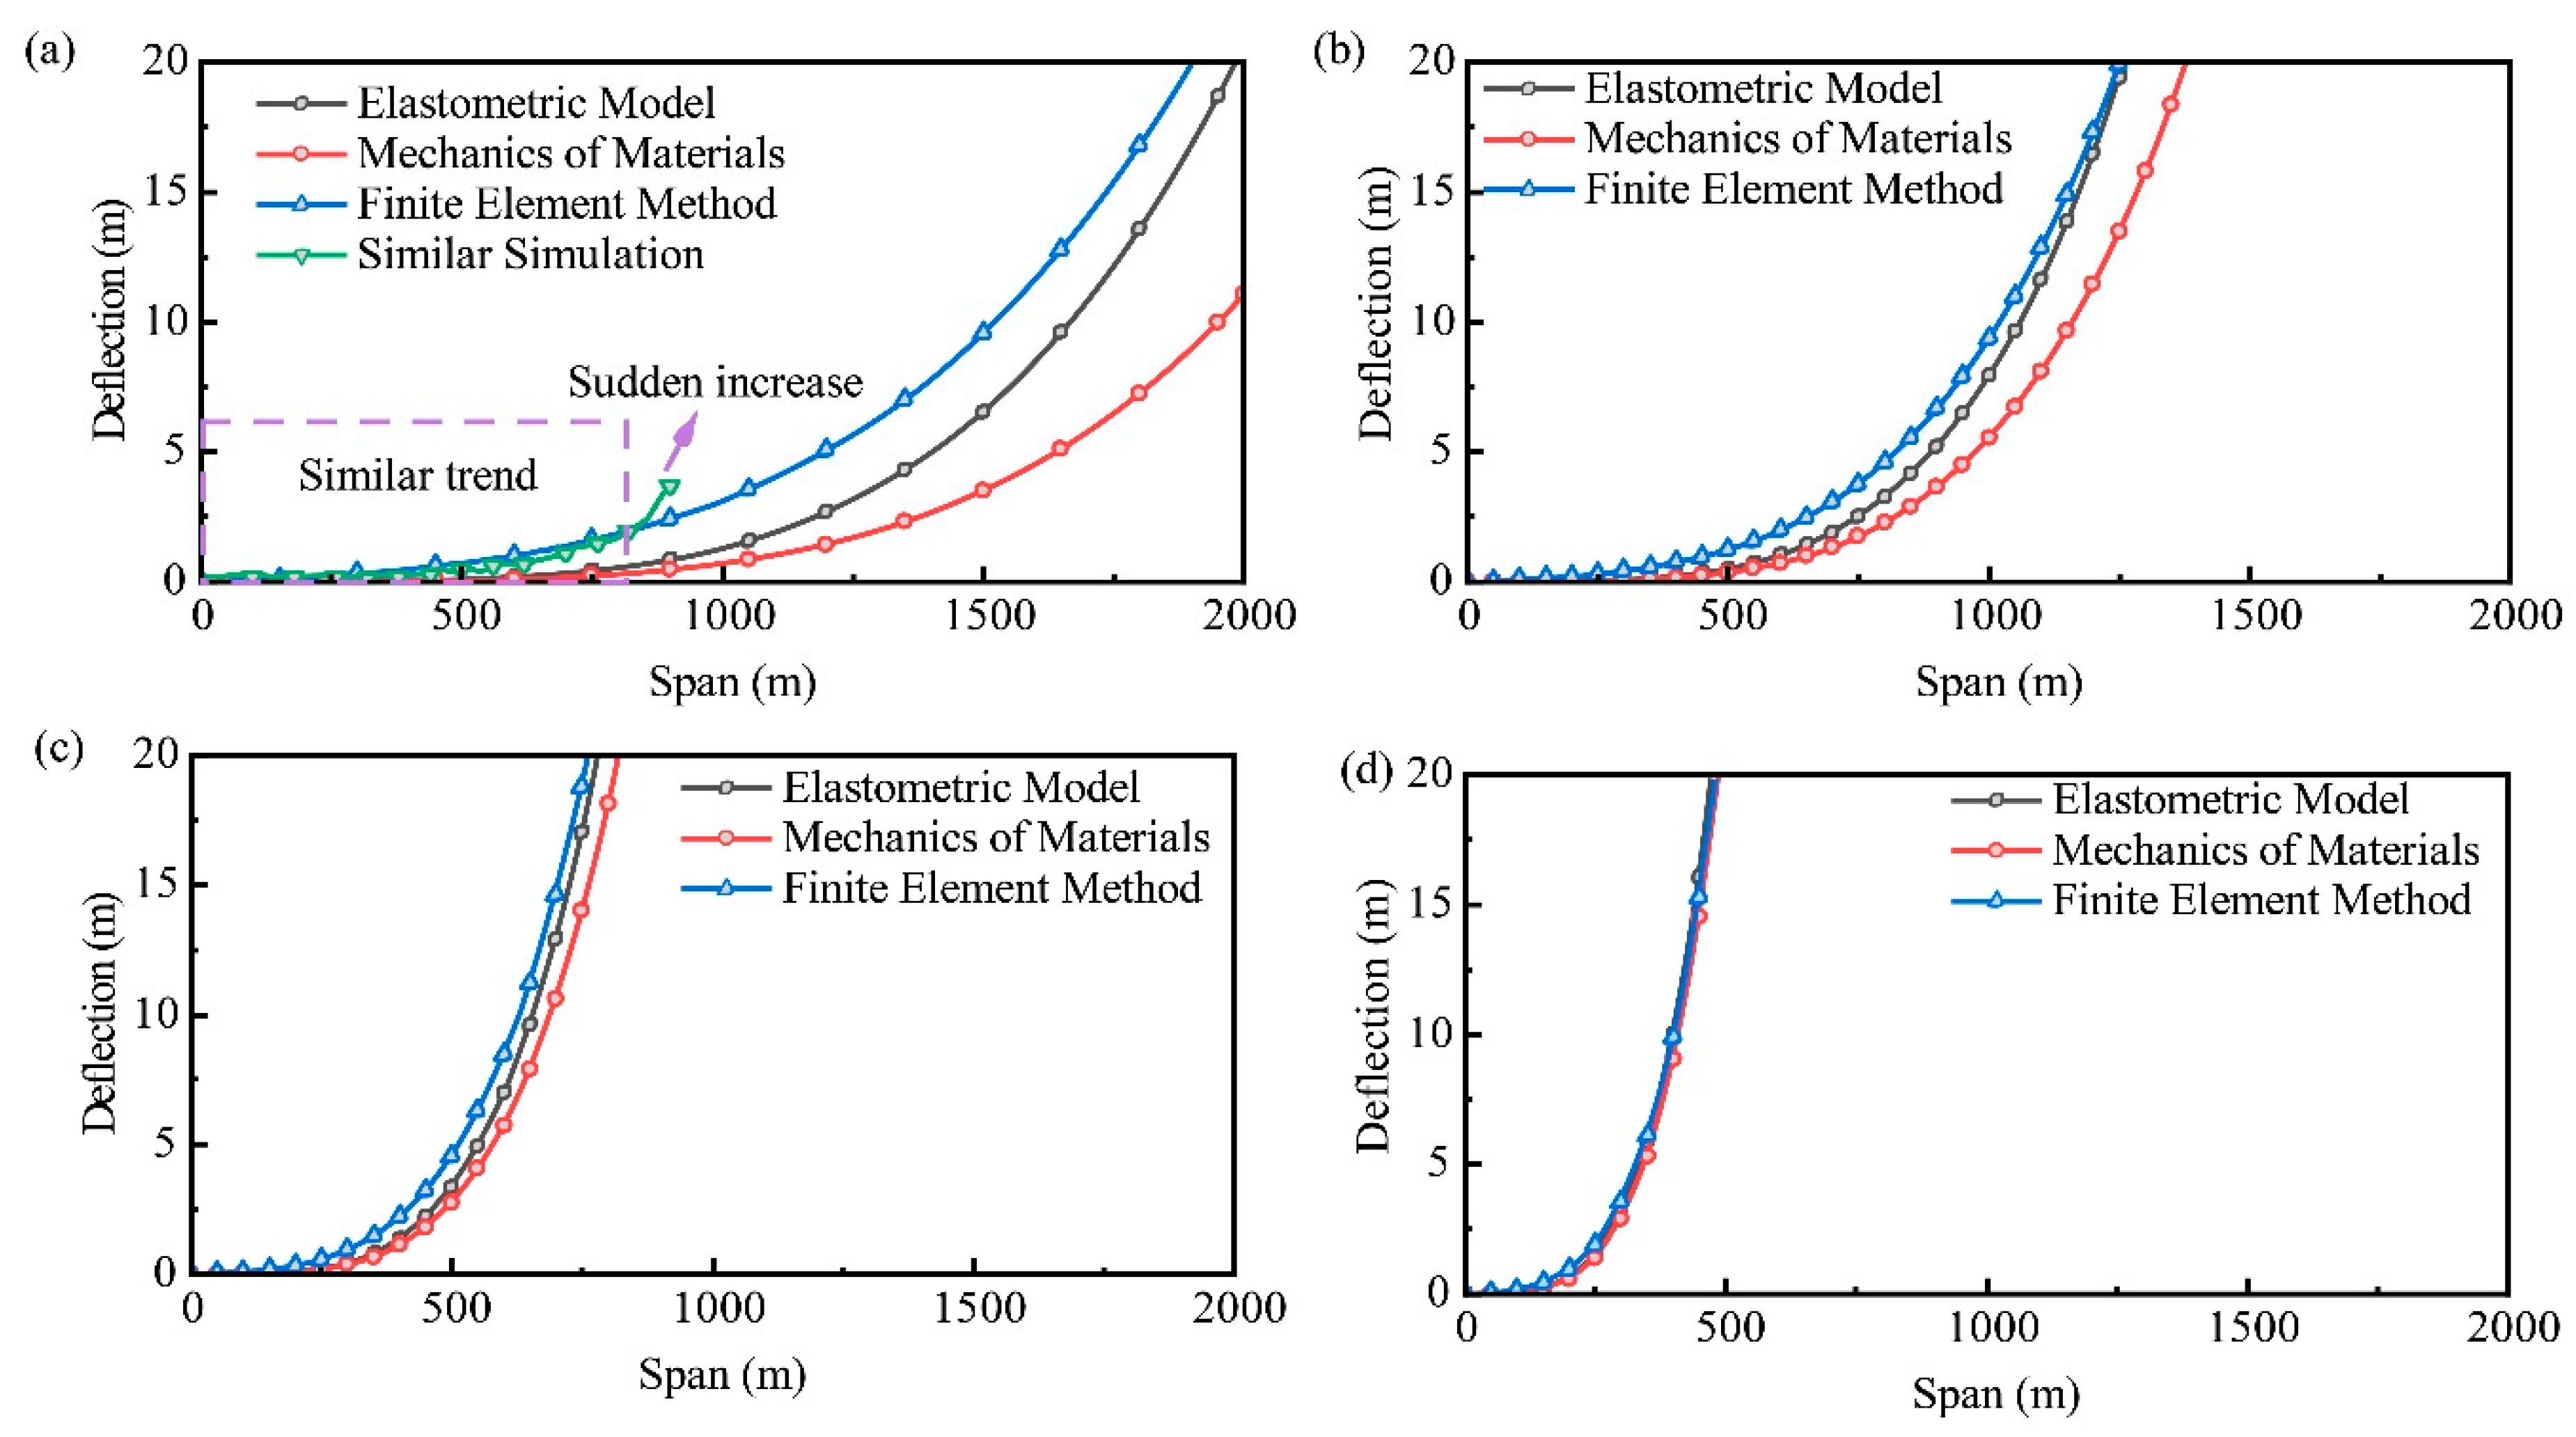
Figure 15.
Analysed displacement of a thick beam: (a) with a uniform thickness; (b) with a varying thickness; (c) a comparison of the displacement on the bottom. (In (a) and (b), the grids in black lines show the initial model, and the grids in red lines are the analysed deformed model.).
Figure 15.
Analysed displacement of a thick beam: (a) with a uniform thickness; (b) with a varying thickness; (c) a comparison of the displacement on the bottom. (In (a) and (b), the grids in black lines show the initial model, and the grids in red lines are the analysed deformed model.).
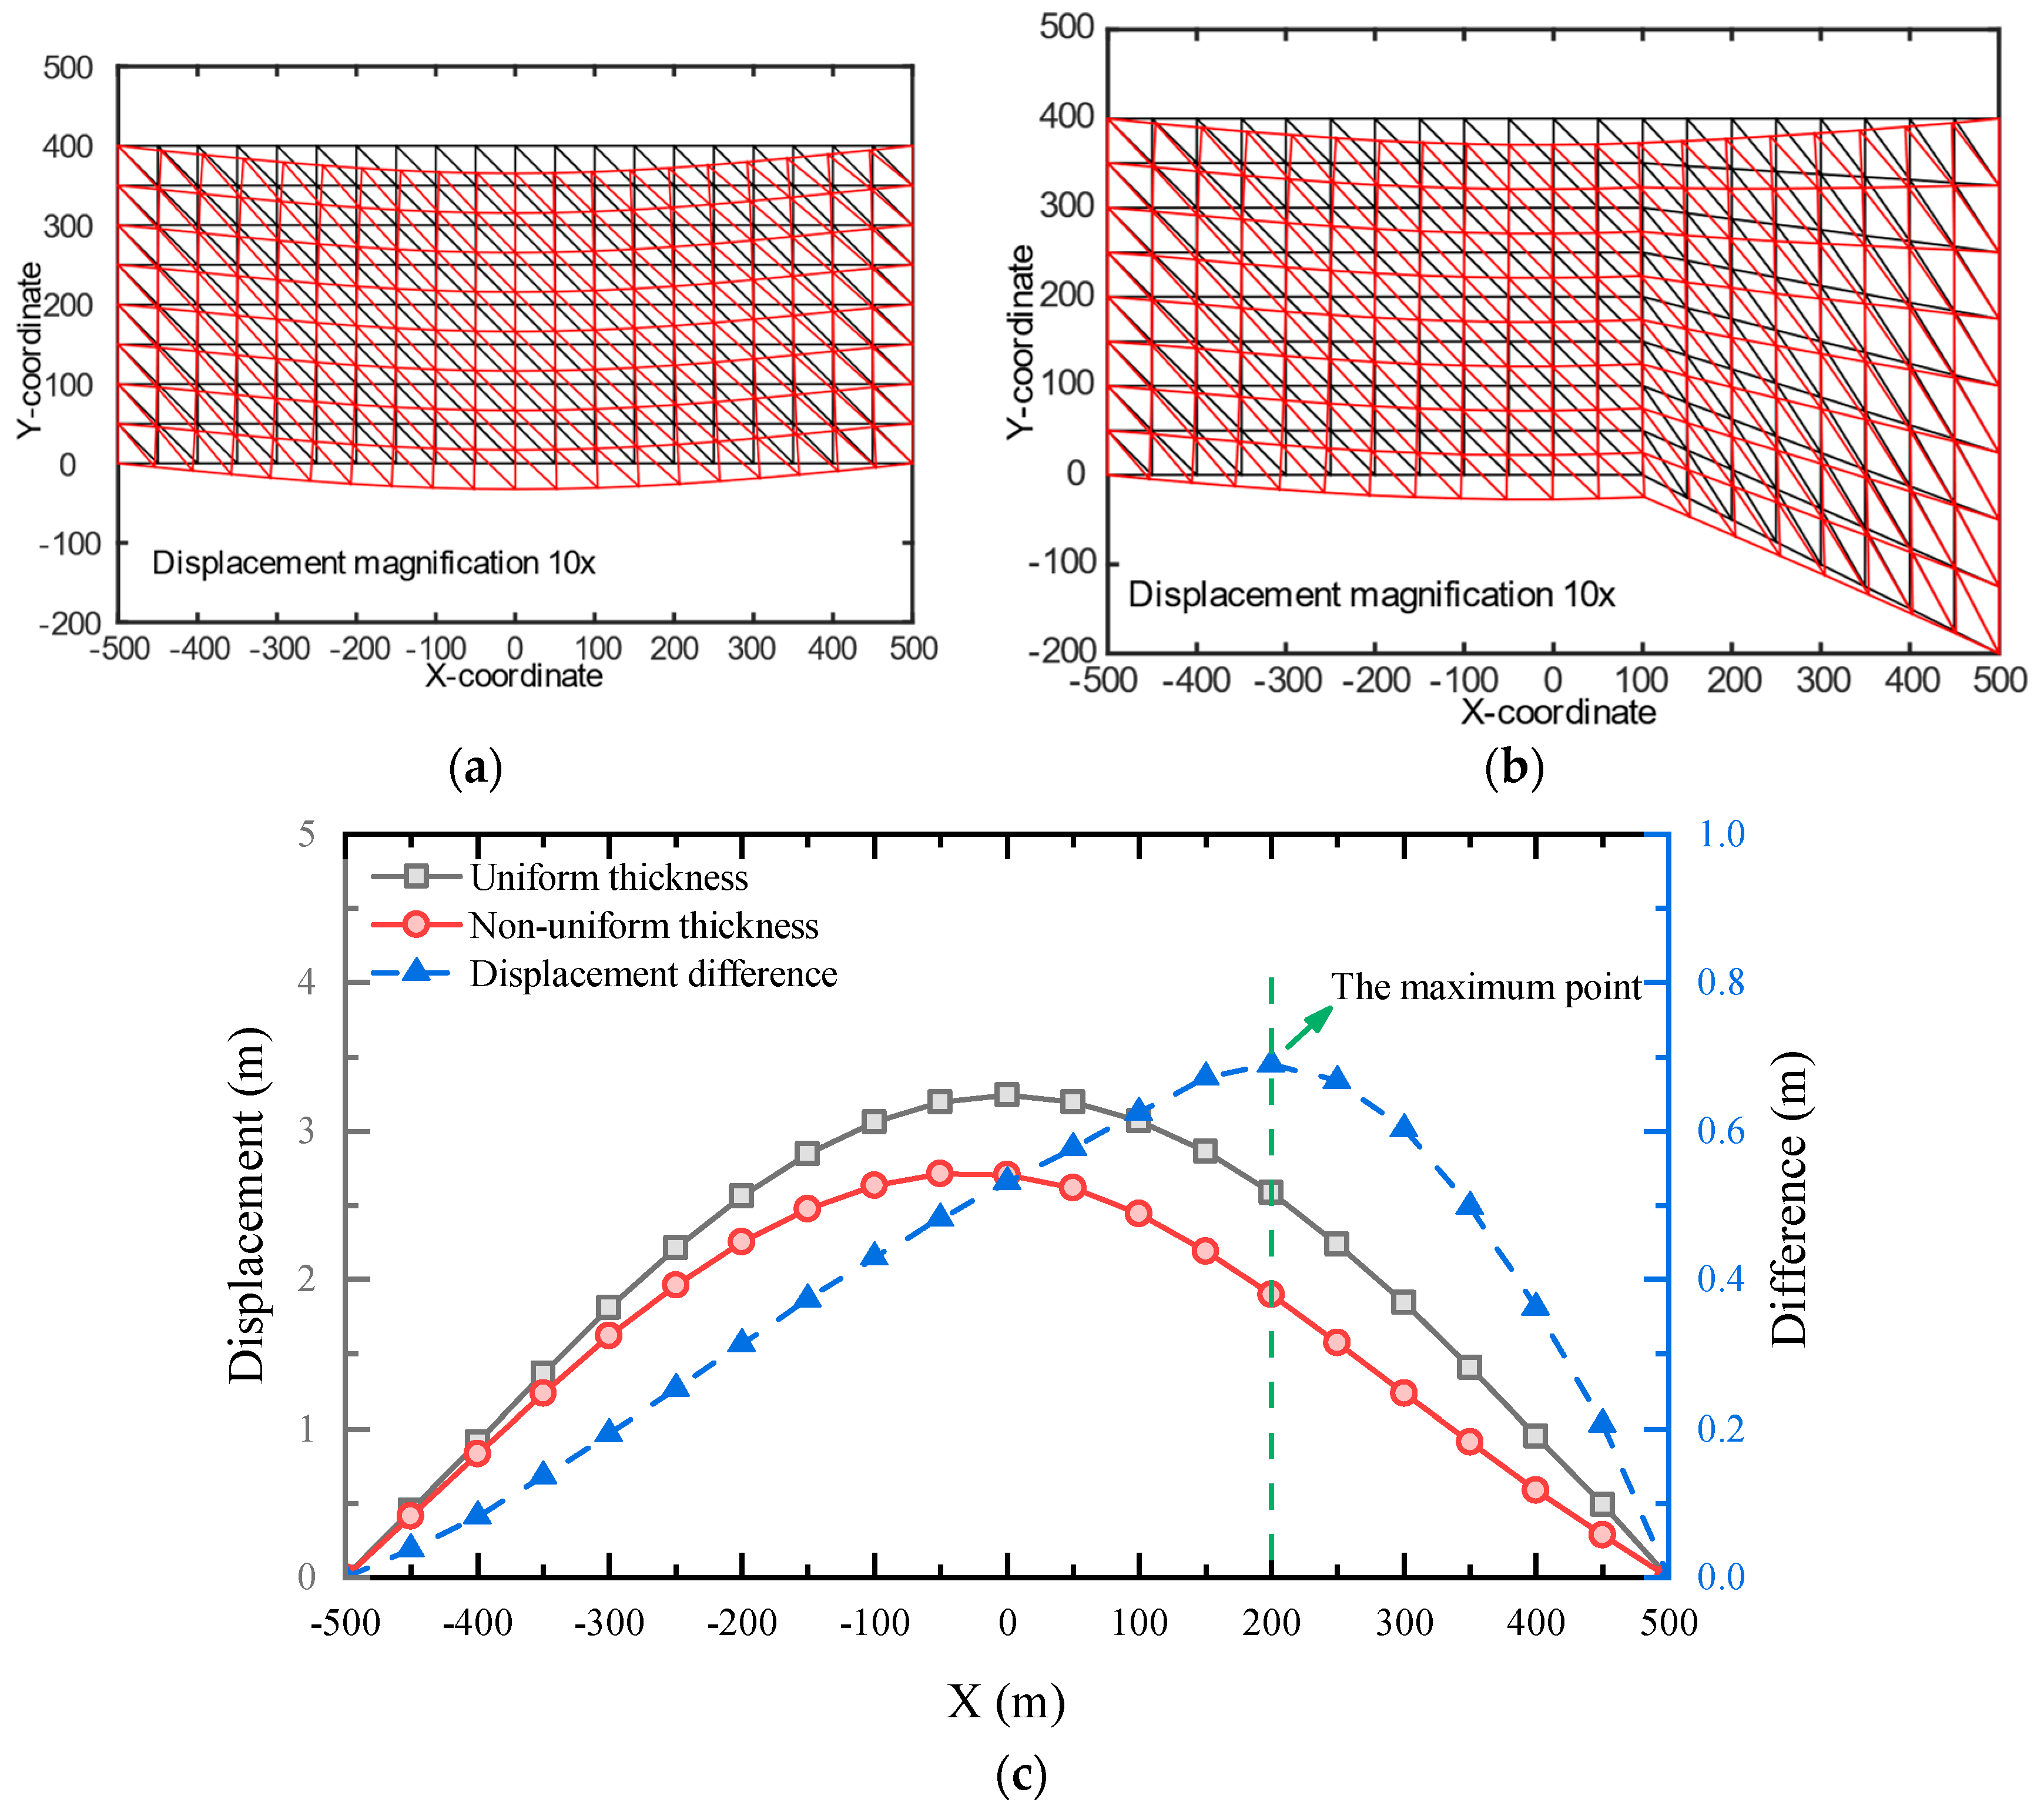
Figure 16.
Distribution of σmises in three non-uniform thickness models: (a) with a span of 400 m; (b) with a span of 600 m; (c)with a span of 800 m.
Figure 16.
Distribution of σmises in three non-uniform thickness models: (a) with a span of 400 m; (b) with a span of 600 m; (c)with a span of 800 m.
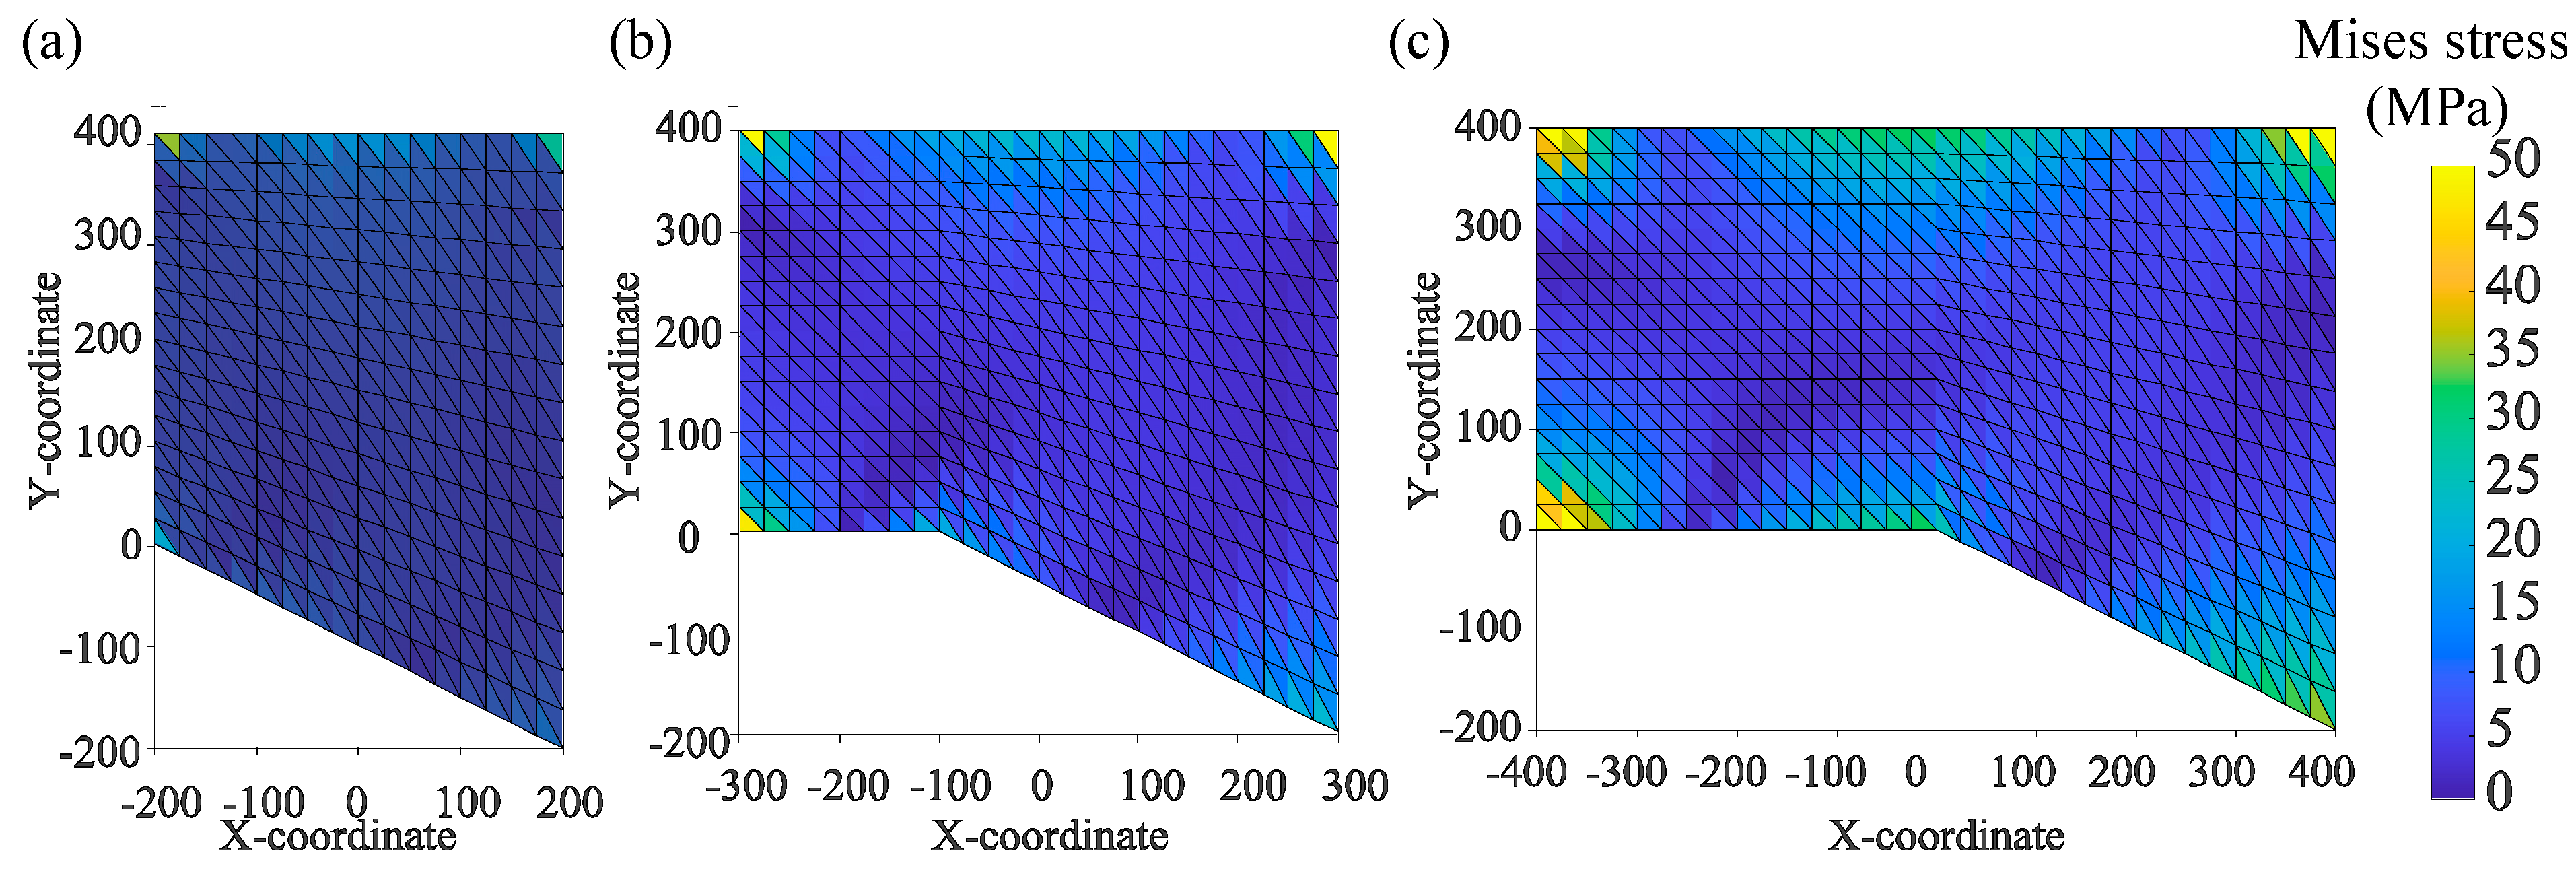

Table 1.
Mechanical test results of geological drilling samples.
| Stratigraphic age | Lithology | Compressive strength(MPa) | Tension strength(MPa) | Young's modulus(GPa) | Poisson's ratio |
| Min-Max | Min-Max | Min-Max | Min-Max | ||
| Huachi formation (K1h) | Mudstone | 25.1-35.2 | 0.83-0.88 | 8.38 | 0.25 |
| Sandy mudstone | 23.8-79.9 | 0.79-3.19 | 9.12-16.02 | 0.20-0.26 | |
| Siltstone | 58.3-72.8 | 2.85-3.04 | 13.16 | 0.18 | |
| Fine sandstone | 40.6-56.1 | 2.71-3.22 | 13.95 | 0.2 | |
| Luohe formation (K1l) | Sandy mudstone | 58.2-68.9 | 2.14-2.20 | 11.04 | 0.19 |
| Siltstone | 44.4-79.0 | 1.60-4.49 | 12.08-19.12 | 0.18-0.22 | |
| Fine sandstone | 31.2-62.6 | 2.13-3.60 | 9.57-18.23 | 0.17-0.23 | |
| Medium sandstone | 25.8-42.6 | 0.67-2.05 | 9.36 | 0.24 | |
| Coarse sandstone | 38.2-44.3 | 1.09-1.22 | 10.21 | 0.2 | |
| Anding formation (J2a) | Sandy mudstone | 20.1-30.7 | 1.96-1.99 | 12.27 | 0.2 |
| Zhiluo formation (J2z) | Siltstone | 25.9-29.3 | 1.11-1.28 | 9.53 | 0.23 |
Table 2.
Model laying scheme.
| Rock stratum | Thickness/m | Laying thickness/cm | Ratio number | Sand/kg | Calcium carbonate/kg | Gypsum/kg |
|---|---|---|---|---|---|---|
| Weak rock | 82.0 | 20.5 (2.0 cm each layer) | 673 | 516.6 | 60.2 | 28.8 |
| UTKS | 200.0-440.0 | 50.0-88.0 | 437 | 1553.6 | 116.5 | 271.9 |
| Weak rock | 100.0 | 38.5 (2.0 cm each layer) | 673 | 690.5 | 80.5 | 34.5 |
| Sub-key stratum | 20.0 | 5.0 | 455 | 126.0 | 7.5 | 17.6 |
| Weak rock | 14.0 | 3.5 | 673 | 88.2 | 10.2 | 4.4 |
| Coal seam | 16.0 | 4.0 | 773 | 100.8 | 10.1 | 4.3 |
| Weak rock | 40.0 | 10.0 (2.0 cm each layer) | 673 | 252.0 | 29.4 | 12.6 |
| Total | 1047.0 | 166.0 | 3327.7 | 314.4 | 374.1 |
Disclaimer/Publisher’s Note: The statements, opinions and data contained in all publications are solely those of the individual author(s) and contributor(s) and not of MDPI and/or the editor(s). MDPI and/or the editor(s) disclaim responsibility for any injury to people or property resulting from any ideas, methods, instructions or products referred to in the content. |
© 2023 by the authors. Licensee MDPI, Basel, Switzerland. This article is an open access article distributed under the terms and conditions of the Creative Commons Attribution (CC BY) license (http://creativecommons.org/licenses/by/4.0/).
Copyright: This open access article is published under a Creative Commons CC BY 4.0 license, which permit the free download, distribution, and reuse, provided that the author and preprint are cited in any reuse.


