
Submitted:
23 September 2023
Posted:
25 September 2023
You are already at the latest version
Abstract
This study aims to investigate how the adoption of an online to offline (O2O) transition strategy impacts the sales volume of Kampoeng Merdeka Clothing. The O2O strategy includes various components, such as establishing O2O platforms, delivering personalized services, ensuring secure transactions, and engaging in offline business activities. The research employs a quantitative approach, focusing on consumers who have made clothing purchases from Kampoeng Merdeka Clothing in Macassar. The sample size comprises 83 respondents, deliberately selected using the Slovin approach. The data analysis and methodology involve the application of Partial Least Squares (PLS) structural equation modeling to assess both the external and internal models.
The findings of this study emphasize the significant and positive influence of the variables "Build O2O Network Platform," "Provide Personalized Experience," "Safeguard Transactions Security," and "Offline Business" on driving the sales growth of Kampoeng Merdeka Clothing. These results indicate that the O2O transition strategy has a substantial impact on the brand's sales performance, with the establishment of O2O platforms and personalized services playing crucial roles. Additionally, ensuring secure transactions and engaging in offline business activities further contribute to the overall success of Kampoeng Merdeka Clothing in the market. This research sheds light on the effectiveness of the O2O approach in boosting sales for clothing brands and underscores the importance of integrating online and offline elements to maximize business outcomes.
Keywords:
Online to Offline (O2O) transition strategy
; transaction security
; sales volume
; O2O networks
Introduction
According to a survey conducted by the Association of Internet Service Providers Indonesia (APJII), the proportion of internet users in Indonesia has been steadily increasing over the years. In 2015, there were 88.1 million internet users, accounting for 34% of the country's total population of 255.5 million. The number rose to 132.7 million users in 2016, representing 51.7% of the 256.2 million people in the entire country. Subsequently, in 2017, the number reached 143.26 million users, equivalent to 54.68% of Indonesia's total population, indicating a growth of 10.56 million individuals from the previous year. The figure continued to surge, with 171.17 million users in 2018 and 175.4 million users by 2019, constituting 64.8% of Indonesia's population, or 264.16 million people, who were now connected to the Internet.
The rise of e-commerce has significantly influenced consumer buying patterns in Indonesia, with a notable shift towards online shopping, particularly for electronics. Consequently, some retail businesses faced challenges, leading to the closure of over 50 retail stores in 2017. The Association of Indonesian Retailers (APRINDO) predicted that these retailers would seek to adopt new business models to meet changing consumer demands. The impact of online retailers (E-Commerce) led to the closure of numerous department stores, as reported by CNN Indonesia in 2017. The expansion of online commerce has prompted companies to rethink their marketing strategies and adapt to new patterns in the market. According to (Rademakers et al., 2019), an effective marketing strategy involves comprehensive operational ideas that enable a company to remain competitive, function efficiently, and deliver returns to its shareholders.
(Chentao & Yongle, 2014) conducted a study titled "Online to Offline Business Model: A Comparative Study of Chinese O2O Companies." Their research revealed that the O2O model in China encourages internet users to transition between online and offline environments to utilize services and vice versa. Among various sectors, the catering industry is the most commonly adopted O2O model, followed by the tourism sector. Companies that extensively researched the market tended to target larger cities as their primary markets.

Table 1.
Tabular data on Kampoeng Merdeka sales from 2017 to 2019.
| Year | Online Sales (Rp) | Offline Sales(Rp) |
|---|---|---|
| 2017 | 220.000.000 | 570.000.000 |
| 2018 | 450.000.000 | 235.000.000 |
| 2019 | 530.000.000 | 670.000.000 |
| 2020 | 280.000.000 | 210.000.000 |
Source: Interview with the owner of Kampoeng Merdeka Clothing.
The table presented above indicates that the sales figures at Kampoeng Merdeka Stores have shown a fluctuating trend, particularly with regard to offline sales. In 2017, the retail sales reached Rp. 570,000,000, while the online sales accounted for Rp. 220,000,000. However, the following year, in 2018, the internet sales increased to Rp. 450,000,000, whereas the retail sales declined to Rp. 235,000,000. Subsequently, there was an improvement in 2019, with both online and offline sales reaching Rp. 530,000,000 and Rp. 670,000,000, respectively. Until 2020, only Rp. 280,000,000 were generated from online sales, and Rp. 210,000,000 from offline sales. This study is based on earlier research focused on exploring the role of online to offline (O2O) marketing methods in driving sales growth.
"The Study of O2O Business Model Development Strategy in SMEs," conducted by (Xing & Zhu, 2014), provides significant findings that demonstrate the positive impact of adopting effective O2O business models on enhancing sales volume, especially for Small to Medium-sized Enterprises (SMEs). The study emphasizes the importance of several key factors in the successful development of an O2O business model, which are as follows: Building O2O platforms, delivering a seamless customer experience, ensuring transaction security, and creating a conducive offline business environment.
The data in the table reveals that Kampoeng Merdeka Stores has experienced variations in its sales performance over the years. Offline sales seem to be less consistent, while online sales have shown some improvement. In 2017, the retail sales were at their peak with Rp. 570,000,000, but the online sales were relatively lower at Rp. 220,000,000. However, the scenario changed in 2018, where online sales increased to Rp. 450,000,000, surpassing offline sales that declined to Rp. 235,000,000. The subsequent year, 2019, saw a balanced growth with both online and offline sales reaching Rp. 530,000,000 and Rp. 670,000,000, respectively.
This study delves into the significance of O2O marketing methods and their impact on sales growth, drawing insights from earlier research conducted by (Xing & Zhu, 2014). The findings indicate that developing a successful O2O business model is crucial for SMEs seeking to boost sales. The key elements highlighted in this context include the establishment of O2O platforms, providing a seamless customer experience, ensuring secure transactions, and creating a conducive offline business environment. These factors collectively contribute to enhancing sales volume and driving sustainable growth for businesses in the current market landscape.
Literature Review
Offline to Online (O2O)
The concept of Offline to Online (O2O) represents the integration of offline and internet-based businesses, with "O2O" standing for "online to offline." This idea has broad applications in various business settings, where companies develop their online presence while retaining their offline operations (Xu & Zhang, 2015). Internet to offline business, another aspect of the O2O model, involves the combination of online trading and offline business activities. Under this model, information flow and financial transactions are managed online, while actual trading and logistics take place offline. The O2O concept centers around providing information, services, discounts, and other incentives through online platforms to drive traffic to offline outlets. Essentially, O2O aims to attract online users to visit physical establishments, implying that consumers may purchase goods or services online and then use them in-store or at the offline outlet (Mossakowski & Zhang, 2014).
(Weng & Zhang, 2015), in their study, Weng and Zhang (2015) define O2O as a contemporary online-based electronic commerce model that facilitates higher levels of customer engagement. According to their research, the O2O model effectively bridges the divide between the virtual and physical realms, appealing to the digitally-connected population of today. Merchants adopt the O2O business model with the ultimate aim of capitalizing on the potential synergy between offline and online resources, harnessing the strengths of both to accomplish their business objectives. The O2O model has emerged as a compelling approach to cater to the evolving preferences of modern consumers, who seek seamless experiences that seamlessly integrate online convenience with offline interactions. By blending the best of both worlds, businesses can cater to the diverse needs of their customer base, delivering a cohesive and satisfying experience that fosters strong customer loyalty and brand advocacy.
The effectiveness of the O2O model hinges on its ability to leverage digital technology to enhance offline experiences. Retailers, for instance, can utilize online platforms and mobile applications to engage with customers before they step into a physical store. Personalized promotions, discounts, and interactive content can create anticipation and excitement, motivating customers to visit the store in person.
Moreover, (Schaffner, 2016) characterizes O2O as a business model aimed at providing customers with a positive experience, enhancing consumer engagement, and driving sales through various marketing platforms. Companies utilize the O2O strategy to entice customers to their websites through email promotions, online advertising, and incentivizing in-person visits to pick up products ordered online or participate in surveys related to their online shopping habits. In summary, Offline to Online (O2O) is a dynamic and effective approach that amalgamates offline and online elements in the business world. The concept enables businesses to create seamless experiences for customers, foster higher engagement, and leverage both online and offline resources to achieve their goals. As merchants continue to embrace O2O strategies, it becomes evident that this model holds significant potential in the digital age, creating synergies that contribute to business growth and success.
Figure 1.
Model O2O Commerce. Source : Du and Tang (2014).
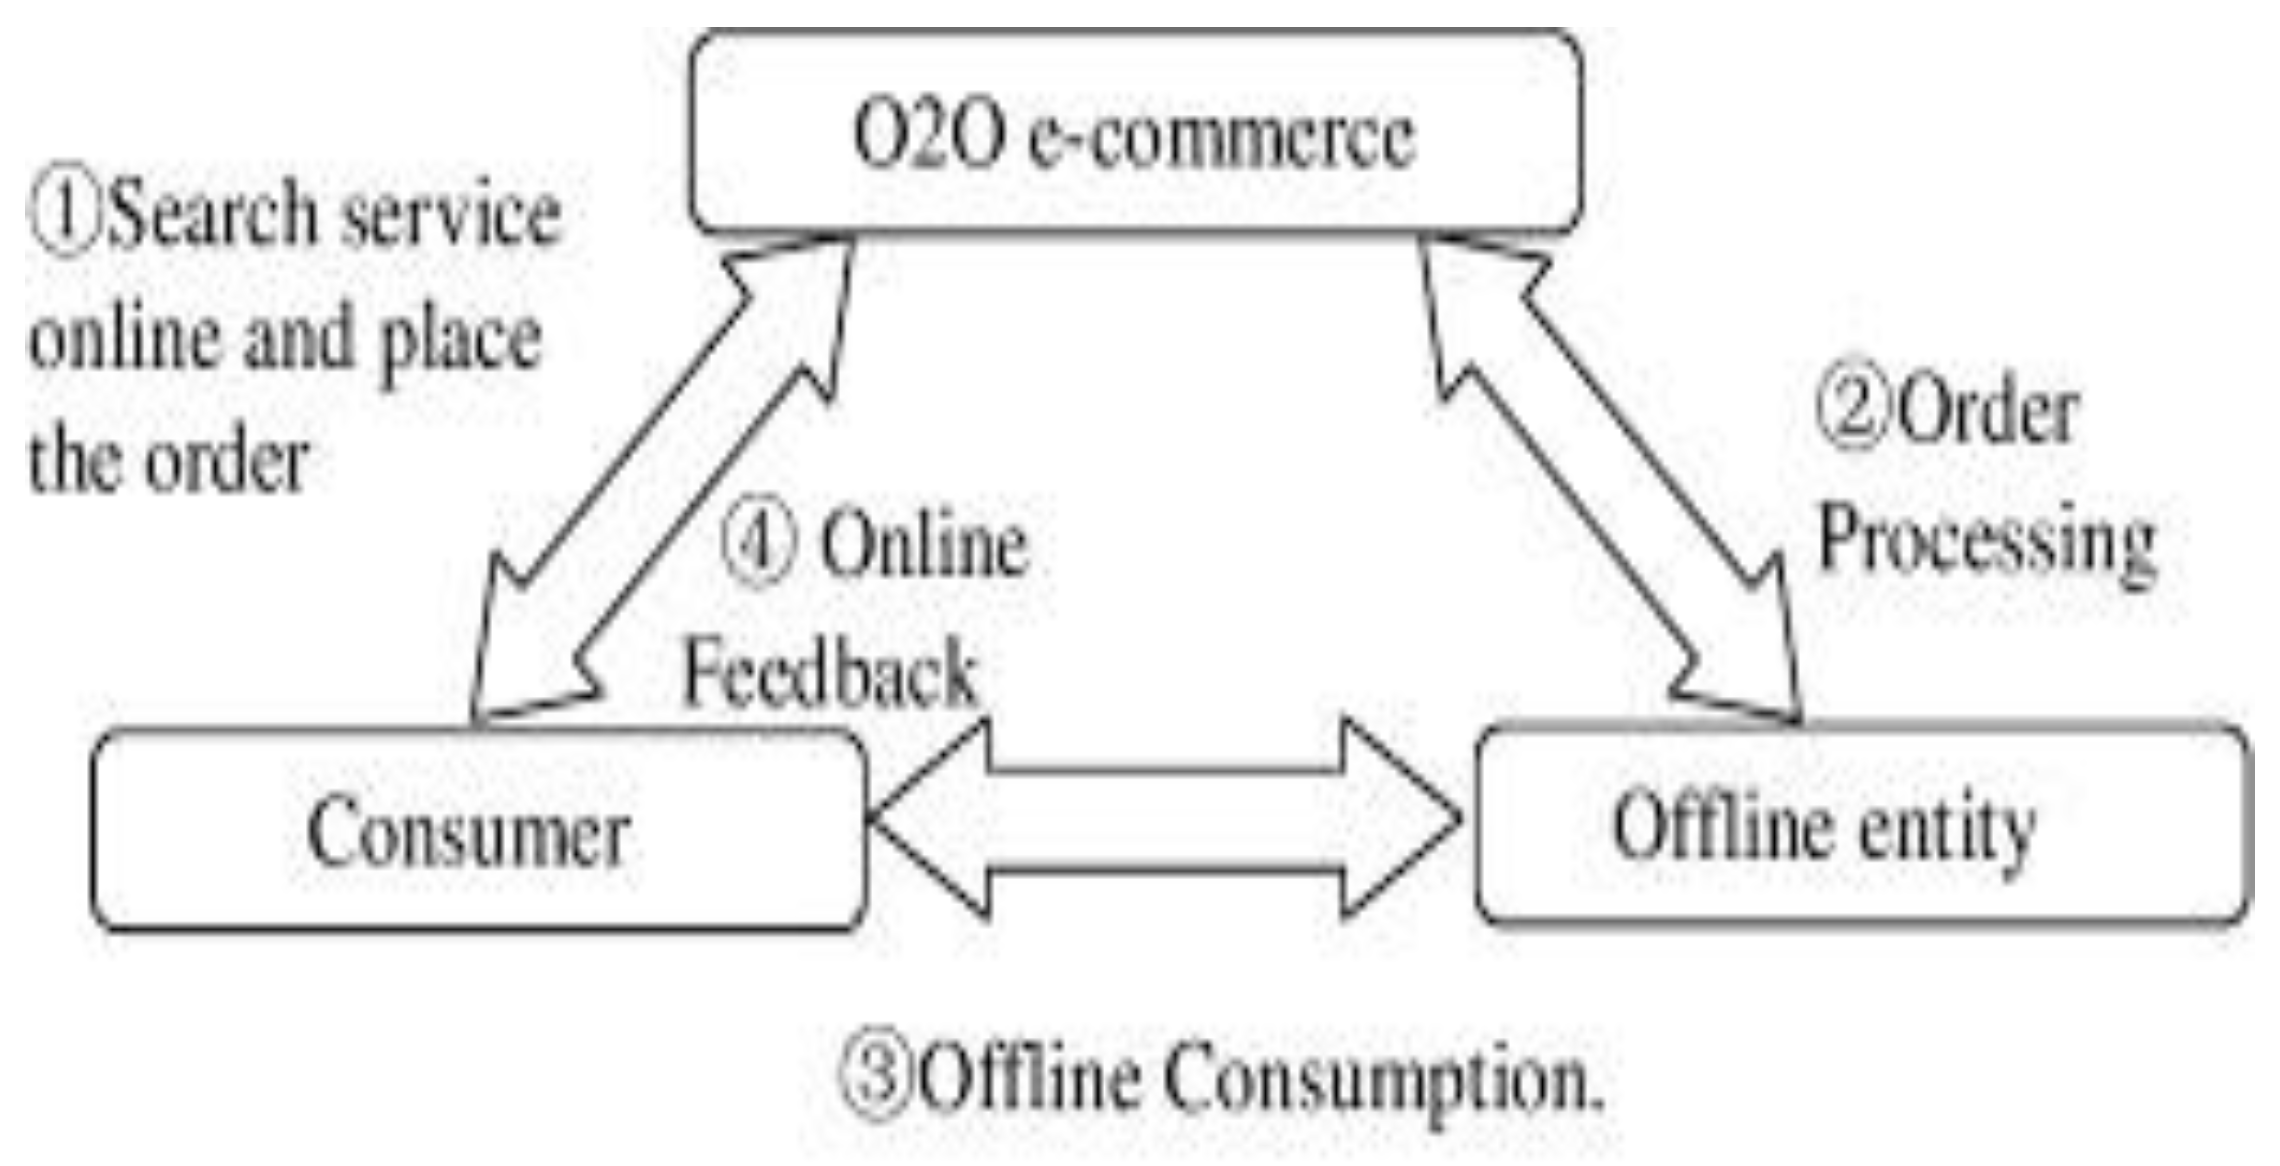
Offline consumption plays a pivotal role in the success of the O2O model. If customers do not receive the expected service in an offline setting, it can be considered a failure of the O2O approach. Consequently, consumer trust in O2O platforms may be significantly affected by this aspect. Improving the quality of service in offline client retention and loyalty becomes essential for the success of O2O platforms.
(Xing & Zhu, 2014) suggest several crucial steps that organizations must undertake to execute O2O business models successfully, ensuring that customers receive high-quality goods and services. The following indicators are key to supporting the success of the O2O strategy:
- Develop O2O platforms: This involves creating robust O2O network platforms that seamlessly integrate online and offline elements. A well-designed platform facilitates smooth interactions for customers between the virtual and physical realms.
- b. Provide customized experiences: Personalization is essential in the O2O model. Tailoring experiences to individual preferences and needs enhances customer satisfaction and fosters a sense of connection with the brand.
- c. Ensure transaction security: Security is paramount in online transactions. Organizations must implement robust measures to protect customer data and ensure safe and secure financial transactions to build trust and confidence among consumers.
- d. Create an inviting offline business environment: The physical space where customers interact with the brand offline should be welcoming and engaging. A pleasant in-store experience can positively influence customer perceptions and encourage repeat visits.
According to (Liang & Sharp, 2016), the integration of online and offline channels has become increasingly vital for businesses in the digital age. The O2O model presents unique opportunities to deliver personalized experiences to customers while utilizing the convenience of online platforms and the tangible interactions of offline environments.
Furthermore, research by (Lie et al., 2019)) underscores the significance of trust in O2O platforms. They found that a positive offline service experience significantly influences consumer trust in online services, which in turn impacts their willingness to use O2O platforms. Hence, investing in offline service quality and ensuring consistency between online promises and offline delivery is paramount to building and maintaining customer trust. In conclusion, the O2O model heavily relies on offline consumption and service quality to thrive. Organizations need to prioritize creating seamless O2O platforms, providing personalized experiences, ensuring secure transactions, and cultivating an inviting offline business environment. These steps, supported by insights from experts and research findings, play a crucial role in building consumer trust and loyalty, driving the success of O2O platforms in today's digital landscape.
Sales
Volume sales hold significant importance as they represent the extent of successful sales efforts in persuading customers to make purchases. Sales, as defined by (. & Leviäkangas, 2012), refer to the monetary value charged to a consumer for a product or service, which can be transacted through credit or cash. (Fauziah et al., 2019) further elaborates on volume sales, stating that it quantifies the number of products or services sold. The primary purpose of tracking sales volume is to determine the profitability of selling a product to a customer and the associated costs incurred.
(Siahtiri et al., 2014),while the terms "selling" and "marketing" are frequently used interchangeably, there are distinctions between the two concepts, leading to misunderstandings not only in sales techniques but also in the organizational structure of businesses. While some view the two as synonymous, in reality, marketing encompasses a broader range of business functions, with sales being just one component of the overall marketing activity. As a result, marketing and sales should not be considered the same.
(Biemans et al., 2022), marketing involves various activities aimed at promoting and delivering products or services to customers. It includes market research, product development, pricing strategies, distribution channels, advertising, and promotional efforts. The goal of marketing is to understand customer needs and preferences, create value for customers, and build long-term relationships to achieve organizational objectives.
(Hughes & Ogilvie, 2020), sales specifically focus on the actual process of selling products or services to customers. Sales representatives are responsible for engaging with potential buyers, addressing their concerns, and persuading them to make a purchase. The sales function involves direct interactions with customers, negotiating terms, and closing deals. It is crucial for businesses to recognize the distinction between marketing and sales, as they require different skill sets and play distinct roles in the overall business strategy. While marketing lays the foundation for generating leads and creating customer interest, sales teams are responsible for converting those leads into actual sales.
(Brunswick, 2014), In modern business practices, the lines between marketing and sales have become more blurred due to the advent of digital technology and the internet. Digital marketing, for instance, often involves using online platforms and tools to attract leads and convert them into customers, effectively bridging the gap between marketing and sales efforts. In conclusion, volume sales provide a valuable metric for evaluating the success of sales activities and understanding the profitability of selling products or services to customers. It is essential to distinguish between marketing and sales, as they serve different purposes and require different approaches. A cohesive marketing and sales strategy that aligns with business goals can contribute significantly to the overall success and growth of a company.
Research Methods
This research is a causal study aimed at examining the influence of variables such as Build O2O network platform, Provide personalized experiences, safeguard Transaction Security, Offline Business, and sales volume. Additionally, this research aims to predict and develop theory. Given the complex model structure and the presence of multiple endogenous variables, the appropriate analytical technique employed is the variance-based Structural Equation Modeling (SEM) or Partial Least Squares (PLS).
According to (Buku Metode Penelitian Pendidikan Sugiyono, n.d.) , PLS is a variance-based SEM analysis that can simultaneously conduct testing for measurement models and structural models. The use of PLS-based SEM is akin to multiple linear regression, wherein the goal is to maximize the explained variance in latent endogenous variables (dependent variables). An additional aspect involves assessing data quality based on measurement model characteristics.
Population in research refers to the area that the researcher intends to study. According to (Buku Metode Penelitian Pendidikan Sugiyono, n.d.), population is a generalized area encompassing objects with specific qualities and characteristics that the researcher applies to study and draw conclusions from. In this study, the population used consists of 500 consumers of Kampoeng Merdeka in the year 2019. As per (Buku Metode Penelitian Pendidikan Sugiyono, n.d.), a sample is a subset of the population that serves as the data source in research, representing a portion of the characteristics possessed by the population. In the research, the focus is on the sample that represents the entire population. In this study, the sample size of 84 Kampoeng Merdeka consumers is determined using the Slovin Formula.
Result and Discussion
Characteristics of the Respondent are Described
- a.
- Description of gender
The description of the respondent's gender is used to describe the gender group that makes up the study's sample of respondents. The following table shows the sex groups:
Table 2.
Respondents' Characteristics by Gender.
| Gender | Total | Percentage |
|---|---|---|
| Man | 55 | 66,3% |
| Woman | 28 | 33,7% |
| Amount | 83 | 100,0% |
Primary Data as of 2023.
According to the aforementioned table, 83 respondents met the criteria for respondents based on gender, with 28 female respondents making up 33.7% of the total, and 55 male respondents making up 66.3%. As a result, men made up the majority of the respondents in this survey.
- b.
- Age Description
The description of the age of the respondents is meant to describe the age group of the respondents who are the sample in this study. Where the age group of the respondents consisted of: <20 years, 20-30 years, > 30 years. The age groups of respondents can be seen in the following table:
Table 3.
Characteristics of Respondents by Age.
| Age | Amount | Percentage |
|---|---|---|
| <20 year | 13 | 15,7% |
| 20 – 30 year | 65 | 78,3% |
| >30 year | 5 | 6,0% |
| Amount | 83 | 100,0% |
Primary Data as of 2023.
Based on the aforementioned data, it can be deduced that there were 83 respondents in this survey, of whom 13 (15.7%) were under the age of 20, 65 (78.3%) were between the ages of 20 and 30, and 5 (6.0%) were over the age of 30. the respondents in this study were primarily between the ages of 20 and 30.
- c.
- long-term commitment
Table 4.
Respondent Characteristics Based on Length of Subscription.
| Subscription Duration | Amount | Percentage |
|---|---|---|
| <5 year | 36 | 43,4% |
| ≥5 year | 47 | 56,6% |
| Amount | 83 | 100,0% |
Primary Data as of 2023.
According to the aforementioned data, there were 83 total respondents in this study, of whom 36 (43.4%) had subscribed for less than five years and 47 (56.6%) for more than five years. Therefore, participants in this study who had been subscribers for more than five years predominated.
Responses from Respondents
Description Build O2O Network Platform in Reaction
Table 5.
Responses to Build Network Platform Variables from Respondents.
|
X1 |
Build Network Platform (X1) |
SCORE |
MEAN |
|||||||||
|---|---|---|---|---|---|---|---|---|---|---|---|---|
| STS | TS | CS | S | SS | ||||||||
| F | % | F | % | F | % | F | % | F | % | |||
| X11 | 1 | 1,2 | 8 | 9,6 | 35 | 42,2 | 33 | 39,8 | 6 | 7,2 | 284 | 3,42 |
| X12 | 3 | 3,6 | 12 | 14,5 | 25 | 30,1 | 40 | 48,2 | 3 | 3,6 | 277 | 3,34 |
| X13 | 4 | 4,8 | 17 | 20,5 | 27 | 32,5 | 29 | 34,9 | 6 | 7,2 | 265 | 3,19 |
| X14 | 1 | 1,2 | 12 | 14,5 | 32 | 38,6 | 33 | 39,8 | 5 | 6,0 | 278 | 3,35 |
Primary Data as of 2023.
The most prevalent statement indicator, with an average value of 3.42, is concerning free access to Kampoeng Merdeka websites and social media, according to the responses of respondents to the four aforementioned indicators. then a 3.35 average rating for the product selection on the Kampoeng Merdeka website and social media.
Also having average values of 3.34 and 3.19 respectively are accessibility and openness in product display.
Responses from Respondents Offer Customized Experience
Table 6.
Responses from Respondents Offer Customized Experience.
|
X2 |
Provide Personalized Experience (X2) |
SCORE |
MEAN |
|||||||||
|---|---|---|---|---|---|---|---|---|---|---|---|---|
| STS | TS | CS | S | SS | ||||||||
| F | % | F | % | F | % | F | % | F | % | |||
| X21 | 0 | 0,0 | 8 | 9,6 | 29 | 34,9 | 38 | 45,8 | 8 | 9,6 | 295 | 3,55 |
| X22 | 0 | 0,0 | 8 | 9,6 | 39 | 47,0 | 26 | 31,3 | 10 | 12, 0 |
287 | 3,46 |
| X23 | 0 | 0,0 | 11 | 13,3 | 29 | 34,9 | 40 | 48,2 | 3 | 3,6 | 284 | 3,42 |
| X24 | 0 | 0,0 | 16 | 19,3 | 27 | 32,5 | 32 | 38,6 | 8 | 9,6 | 281 | 3,39 |
Primary Data as of 2023.
The most prevalent statement indicator, with an average value of 3.55, is regarding product recommendations based on consumer demands, according to the responses of respondents to the four aforementioned indicators. Then, with an average value of 3.46, the product recommendation indications are based on consumer preferences. Additionally, with an average value of 3.42, product recommendations constantly follow the trend. Additionally, the average value of product suggestions of all shapes and sizes is 3.39.
Response from Respondents to Protect Transaction Security
Table 7.
Responses to Respondents for Safeguard Transaction Security.
|
X3 |
Safeguard Transaction Security (X3) |
SCORE |
MEAN |
|||||||||
|---|---|---|---|---|---|---|---|---|---|---|---|---|
| STS | TS | CS | S | SS | ||||||||
| F | % | F | % | F | % | F | % | F | % | |||
| X31 | 1 | 1,2 | 14 | 16,9 | 35 | 42,2 | 26 | 31,3 | 7 | 8,4 | 273 | 3,29 |
| X32 | 3 | 3,6 | 18 | 21,7 | 31 | 37,3 | 19 | 22,9 | 12 | 14,5 | 268 | 3,23 |
| X33 | 5 | 6,0 | 17 | 20,5 | 32 | 38,6 | 23 | 27,7 | 6 | 7,2 | 257 | 3,10 |
| X34 | 2 | 2,4 | 19 | 22,9 | 34 | 41,0 | 24 | 28,9 | 4 | 4,8 | 258 | 3,11 |
Primary Data as of 2023.
The security indicator of network transactions, with an average value of 3.29, is the most predominate statement indicator based on the responses of respondents to the four indicators mentioned above. When performing transactions, the customer convenience indicator has an average value of 3.23. Additionally, indicators of customer payment alternatives with average values of 3.11 and 3.10 are provided.
Responses from Offline Business Respondents
Table 8.
Responses from Offline Business Respondents.
|
X4 |
Offline Business (X4) |
SKOR |
MEAN |
|||||||||
|---|---|---|---|---|---|---|---|---|---|---|---|---|
| STS | TS | CS | S | SS | ||||||||
| F | % | F | % | F | % | F | % | F | % | |||
| X41 | 1 | 1,2 | 15 | 18,1 | 32 | 38,6 | 30 | 36,1 | 5 | 6,0 | 272 | 3,28 |
| X42 | 0 | 0,0 | 14 | 16,9 | 34 | 41,0 | 23 | 27,7 | 12 | 14,5 | 282 | 3,40 |
Primary Data as of 2023.
The ability of the company to provide services without discrimination, with an average value of 3.40, is the most dominating statement indicator, according to the findings of respondents' responses to the four indicators mentioned above. The following metrics, which have an average value of 3.28, reflect the caliber of the services and goods offered.
Respondents' Sales Volume Response
Table 9.
Responses of Sales Volume Respondents.
|
Y |
Volume of sales (Y) |
Score |
Mean |
|||||||||
|---|---|---|---|---|---|---|---|---|---|---|---|---|
| STS | TS | CS | S | SS | ||||||||
| F | % | F | % | F | % | F | % | F | % | |||
| Y1 | 0 | 0,0 | 11 | 13,3 | 31 | 37,3 | 36 | 43,4 | 5 | 6,0 | 284 | 3,42 |
| Y2 | 0 | 0,0 | 15 | 18,1 | 36 | 43,4 | 28 | 33,7 | 4 | 4,8 | 270 | 3,25 |
| Y3 | 0 | 0,0 | 13 | 15,7 | 38 | 45,8 | 26 | 31,3 | 6 | 7,2 | 274 | 3,30 |
| Y4 | 0 | 0,0 | 10 | 12,0 | 28 | 33,7 | 38 | 45,8 | 7 | 8,4 | 291 | 3,51 |
Primary Data as of 2023.
The purchasing power indication, with an average value of 3.51, is the most important indicator, according to the responses of respondents to the four aforementioned indicators. then a measure of the intensity of purchases with an average value of 3.42. Additionally, the indicator of discount has an average value of 3.30, and the indication of high levels of spending intensity has an average value of 3.25.
Test of the measurement model's outer model
The outer model is a model that explains how latent variables and their indicators relate to one another. The exterior model has undergone the following tests:
Test for validity
Convergent and discriminant validity calculations were used to assess the construct validity.
- Convergent validity
Outer loading or loading factor values are tested for convergent validity, the values of Average Variance Extracted (AVE). If the loading factor value is greater than 0.7 and the AVE value is greater than 0.6, the indicator is said to achieve convergent validity in the good category. The value of each indicator's loading factor on the research variables is as follows:
Table 10.
Loading Factor.
| Variable | Item | Loading Factor | Description |
|---|---|---|---|
|
Build O2O Network Platform |
BNP1 | 0,833 | Valid |
| BNP2 | 0,859 | Valid | |
| BNP3 | 0,822 | Valid | |
| BNP4 | 0,813 | Valid | |
|
Provide Personalized Experience |
PPE1 | 0,772 | Valid |
| PPE2 | 0,861 | Valid | |
| PPE3 | 0,837 | Valid | |
| PPE4 | 0,855 | Valid | |
|
Safeguard Transaction Security |
STS1 | 0,828 | Valid |
| STS2 | 0,831 | Valid | |
| STS3 | 0,799 | Valid | |
| STS4 | 0,835 | Valid | |
| Offline Business | OB1 | 0,888 | Valid |
| OB2 | 0,889 | Valid | |
| Volume of Sales | VP1 | 0,889 | Valid |
| VP2 | 0,816 | Valid | |
| VP3 | 0,753 | Valid | |
| VP4 | 0,832 | Valid |
SmartPLS 3 output, processed primary data, 2023.
The results of the loading factor test are shown in the table above, and they indicate that all items measuring the Build O2O Network Platform, Provide Personalized Experience, Safeguard Transaction Security, Offline Business, and Sales Volume variables are worth more than 0.7. As a result, the item is acknowledged as measuring the variable and meeting convergent validity.
Table 11.
Average Variance Extracted (AVE).
| AVE | |
|---|---|
| Build Network Platform (X1) | 0,693 |
| Provide Personalized Experience (X2) | 0,692 |
| Safeguard Transaction Security (X3) | 0,677 |
| Offline Busines (X4) | 0,790 |
| Volume of sales (Y) | 0,679 |
SmartPLS 3 output, processed primary data, 2023.
All of the variables employed in this study have an Average Variance Extracted (AVE) value larger than 0.6, as can be seen from the table above. Where Sales Volume is 0.679, Offline Business is 0.790, Safeguard Transaction Security is 0.677, Provide Personalized Experience is 0.692, and Build O2O Network Platform has an AVE value of 0.693. Therefore, all research variables can be regarded to be valid and to meet convergent validity.
2). Different Validity
The cross loading value is used in the discriminant validity test. If an indicator's correlation value to a variable is higher than the correlation between other variables, it is said to have discriminant validity. The cross loading value for each indication is as follows:
Table 12.
Cross Loading.
| BNP [X1] | PPE [X2] | STS [X3] | OB [X4] | VP [Y] | |
|---|---|---|---|---|---|
| BNP1 | 0,833 | 0,573 | 0,461 | 0,051 | 0,620 |
| BNP2 | 0,859 | 0,581 | 0,390 | 0,171 | 0,638 |
| BNP3 | 0,822 | 0,534 | 0,385 | 0,167 | 0,588 |
| BNP4 | 0,813 | 0,566 | 0,464 | 0,066 | 0,545 |
| PPE1 | 0,504 | 0,772 | 0,494 | 0,188 | 0,564 |
| PPE2 | 0,627 | 0,861 | 0,542 | 0,304 | 0,678 |
| PPE3 | 0,593 | 0,837 | 0,589 | 0,260 | 0,706 |
| PPE4 | 0,518 | 0,855 | 0,475 | 0,251 | 0,630 |
| STS1 | 0,450 | 0,512 | 0,828 | 0,064 | 0,557 |
| STS2 | 0,411 | 0,488 | 0,831 | 0,078 | 0,597 |
| STS3 | 0,433 | 0,507 | 0,799 | 0,201 | 0,523 |
| STS4 | 0,381 | 0,585 | 0,835 | 0,101 | 0,513 |
| OB1 | 0,136 | 0,228 | 0,084 | 0,888 | 0,292 |
| OB2 | 0,109 | 0,312 | 0,151 | 0,889 | 0,294 |
| VP1 | 0,623 | 0,841 | 0,624 | 0,384 | 0,889 |
| VP2 | 0,573 | 0,622 | 0,600 | 0,288 | 0,816 |
| VP3 | 0,536 | 0,591 | 0,510 | 0,186 | 0,753 |
| VP4 | 0,639 | 0,663 | 0,456 | 0,211 | 0,832 |
SmartPLS 3 output, processed primary data, 2023.
The aforementioned table demonstrates the cross loading value's strong discriminating validity. Whereas the correlation between indicators of the variables has a larger total value than the correlation between indicators and other variables. The loading value for BNP1 (question indicator for the Build Network Platform variable) is, for instance, 0.833 larger than the loading values for the other variables, namely PPE (0.573), STS (0.461), OB (0.051), and VP (0.620).
Test of Reliability
- 1.
- Reliability of Composites
The component used to evaluate the dependability of indicators on a variable is called composite reliability. If a variable's composite reliability value is greater than 0.70, it can be declared to meet composite reliability requirements. The composite reliability value for each variable utilized in this study is as follows:
Table 13.
Composite Reliability.
| Construct | Composite Reliability |
|---|---|
| BNP (X1) | 0,900 |
| PPE (X2) | 0,900 |
| STS (X3) | 0,894 |
| OB (X4) | 0,882 |
| VP (Y) | 0,894 |
SmartPLS 3 output, processed primary data, 2023.
The Composite Reliability value of all the variables in this study is > 0.70, as can be seen from the table above. The variables Build Network Platform, Provide Personalized Experience, Safeguard Transaction Security, Offline Business, and Sales Volume all have values of 0.900, 0.894, 0.882, and 0.900 respectively. Thus, all items are deemed reliable for measuring their hidden variables based on Composite Reliability estimates.
Cronbach's Alpha
The value of the dependability of indicators on a variable is tested using Cronbach's Alpha in addition to composite reliability. If a variable's Cronbach's Alpha value is more than 0.60, it can be said to have a dependable value. The Cronbach's Alpha value for each is listed below, utilized as a variable in this study:
Table 14.
Cronbach's Alpha.
| Construct | Cronbach’s Alpha |
|---|---|
| BNP (X1) | 0,852 |
| PPE (X2) | 0,852 |
| STS (X3) | 0,841 |
| OB (X4) | 0,733 |
| VP (Y) | 0,841 |
SmartPLS 3 output, processed primary data, 2023.
The value of all Cronbach's alpha variables in this study is > 0.60, as can be seen from the table above. The values for the variables Build Network Platform (0.852), Provide Personalized Experience (0.852), Safeguard Transaction Security (0.841), Offline Business (0.733), and Sales Volume (0.841) are all positive numbers. Therefore, all sub-variables were evaluated for reliability in measuring their latent variables using Cronbach's Alpha calculations.
Structural Model Test (Inner Model)
To determine the relationship between the constructs, the significance level, and the R-square of the research model, the inner model or structural model is tested. The R-square for endogenous variables, the t test, and the significance of the structural path parameter coefficients were used to assess the structural model. A schematic representation of the Inner Model is as follows:
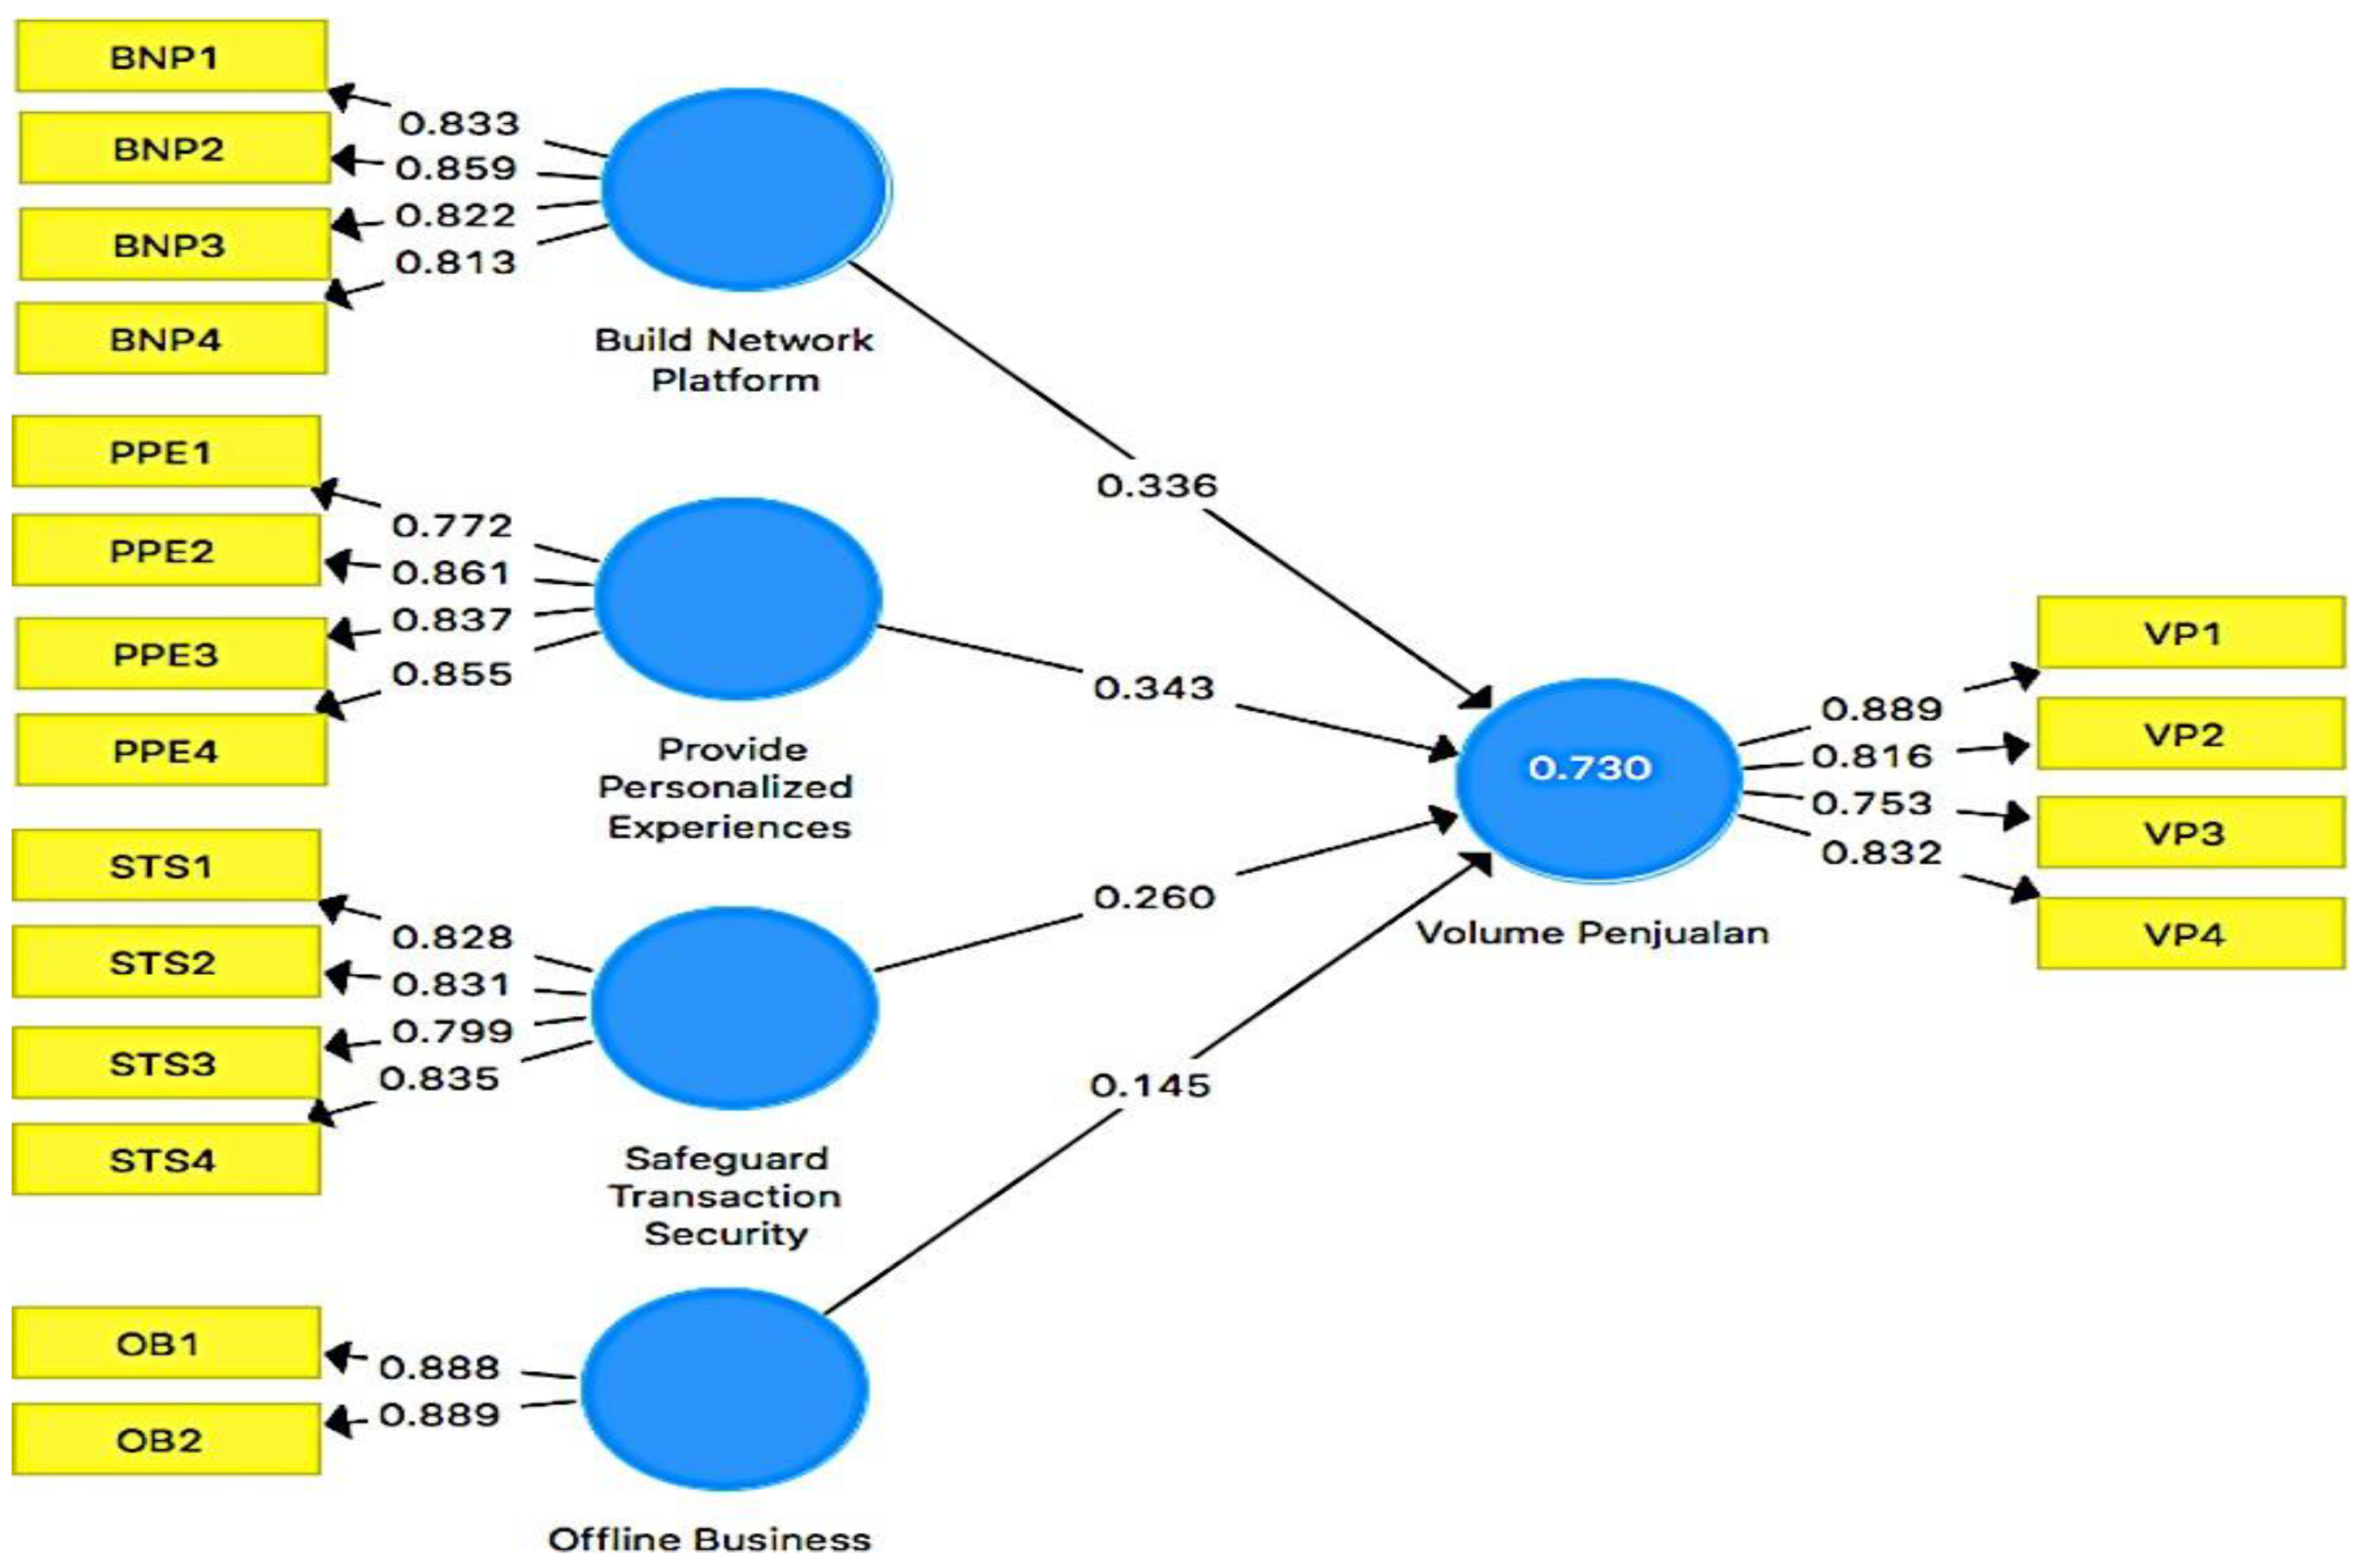
Figure 2.
structural model.
Test for Path Coefficient (path coefficient)
This test is run to ascertain the relationship's direction or the degree to which exogenous variables have an impact on endogenous variables. The following table shows the direct influence in this study:
Table 15.
Test the Path Coefficient (path coefficient).
| BNP | PPE | STS | OB | |
|---|---|---|---|---|
| Sales Amount | 0,336 | 0,343 | 0,260 | 0,145 |
SmartPLS 3 output, processed primary data, 2023.
The four exogenous variables all have a direct impact on the endogenous variables, as can be seen from the table above. Where the STS variable was 0.260, the 0B variable was 0.730, the PPE variable was 0.343, and the BNP variable had a value of 0.336. Thus, it can be said that every exogenous factor in this study has a favorable impact on sales volume. And the PPE variable, with a value of 0.343, is the one that has the biggest impact.
Test for Determination Coefficient (R2)
The ability of endogenous variables to explain the variety of exogenous variables, or, to put it another way, the amount to which exogenous variables contribute to endogenous variables, is assessed using the coefficients of determination. The table below shows the outcomes of the goodness-of-fit test, and they are as follows:
Table 16.
Coefficient of Determination (R2).
| R Square | Adjusted R Square | |
|---|---|---|
| Sales Amount (Y) | 0,730 | 0,716 |
SmartPLS 3 output, processed primary data, 2023.
It is clear from the table above that the Sales Volume variable's R-Square value is 0.730. This figure indicates that 73.0% of the sales volume may be attributed to the development of network platforms, personalized experiences, transaction security protection, and offline business. Other factors not examined in this study account for the remaining 27.0%. As a result of these findings, it can be said that the research model has a good goodness of fit.
Testing hypotheses
Testing Hypotheses The outcomes can be utilized to answer the study's hypothesis based on the data processing that has been done. In this study, the T-Statistics values and P-Values were used to test the hypotheses. Research premise is acceptable if the P-Values are less than 0.05. The following are the findings of the hypothesis testing carried out in this study using Calculate Boottropping's inner model:
Table 17.
T-Statistics and P-Values.
|
Variable |
Authentic Sample (O) | Sample Mean (M) | Standard Deviation (STDEV) |
T Statistics (|O/STDEV|) |
P Values |
|---|---|---|---|---|---|
| BNP -> VP | 0.336 | 0.333 | 0.092 | 3.657 | 0.000 |
| PPE -> VP | 0.343 | 0.338 | 0.096 | 3.570 | 0.000 |
| STS -> VP | 0.260 | 0.268 | 0.072 | 3.614 | 0.000 |
| OB -> VP | 0.145 | 0.148 | 0.054 | 2.684 | 0.008 |
SmartPLS 3 output, processed primary data, 2023.
Figure 3.
Bootstrapping output.
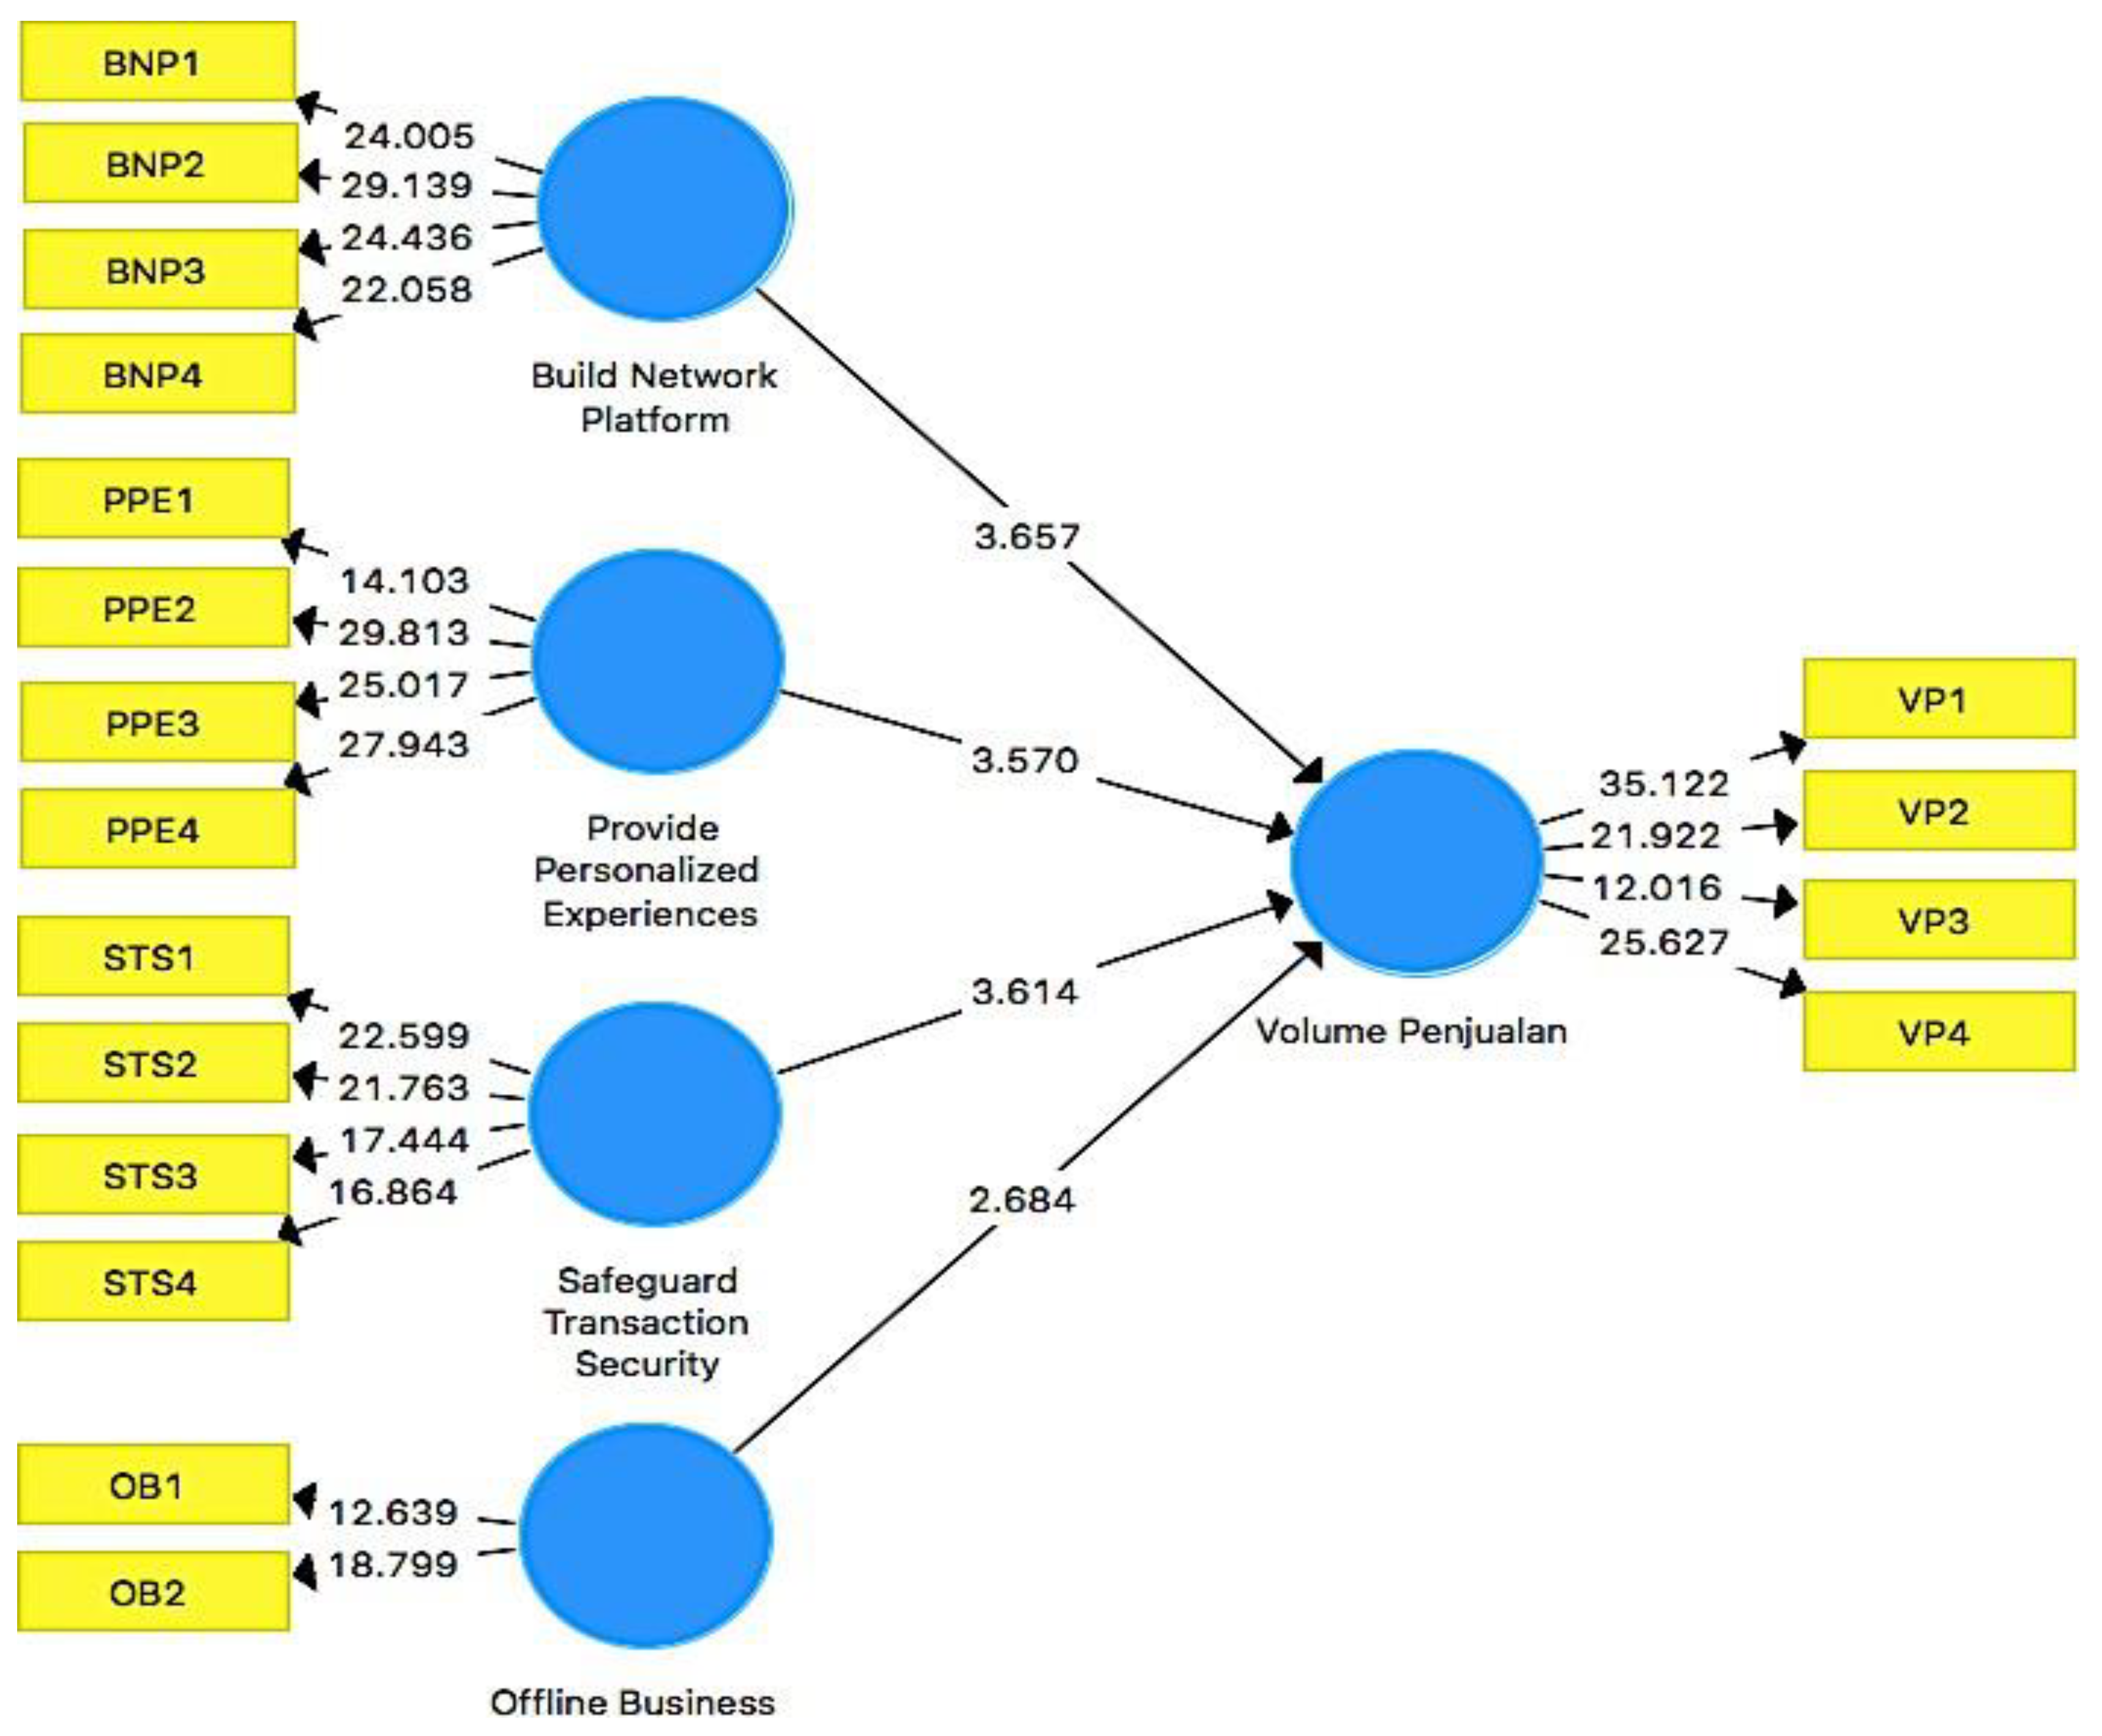
The outcomes of the bootstrapping test from the SmartPLS study are given the following interpretation based on table 5.13 and figure 5.2 above:
- Hypothesis I
Build O2O Network (X1) Has a Positive and Significant Effect on Sales Volume (Y), according to the first hypothesis. According to the SmartPls test results, the Build O2O Network Platform has a positive and significant impact on Sales Volume because the path coefficient value (original sample (O)) is 0.336, the t-statistic value (3.657) is higher than the t-table (1.96) and the p value is 0.000 = 0.05. Consequently, the first hypothesis is true.
- Hypothesis II
According to the first hypothesis, Sales Volume (Y) is positively and significantly impacted by Provide Personalized Experience (X2). Based According to the SmartPls test results, Provide Personalized Experience has a positive and significant impact on Sales Volume because the path coefficient value (original sample (O)) is 0.343, the t-statistic value (3.570) is higher than the t-table (1.96), and the p value is 0.000 = 0.05. The second premise is therefore accepted.
- Hypothesis III
According to the first hypothesis, Sales Volume (Y) is positively and significantly impacted by Safeguard Transaction Security (X3). Based on the results of the tests performed using SmartPls, it can be said that Safeguard Transaction Security has a positive and significant impact. The path coefficient value (original sample (O)) is 0.260, the t-statistic value (3.614) is higher than the t-table (1.96) and the p-value is 0.000 = 0.05. substantial impact on sales volume. Consequently, the third theory is true.
- Hypothesis IV
In accordance with the first hypothesis, Offline Business (X4) has a favorable and considerable impact on Sales Volume (Y). According to the SmartPls test results, Offline Business has a positive and significant impact on Sales Volume because the path coefficient value for the original sample (O) is 0.145, the t-statistic value is greater than the t-table value (1.96) and the p-value is 0.008 = 0.05. As a result, the fourth hypothesis is true.
Discussion
Impact of O2O Network Platform Development on Sales Volume
Build an O2O network platform. In this situation, the company builds an open O2O platform since access to a company and the openness of a platform will be assets in putting the O2O business model into practice. Additionally, it can make it simple for customers to share their own personal experiences, and it can favor drawing them to offline establishments.
The findings of the present study are consistent with the earlier research conducted by (Xing & Zhu, 2014). In their study, Xia Xing and Zhu Junxuan investigated the impact of implementing O2O methods on sales volume for companies. They discovered that businesses that embraced the O2O approach experienced favorable and significant outcomes in terms of increasing their sales volume. This evidence reinforces the notion that the integration of online and offline elements through O2O strategies can have a positive and meaningful effect on a company's sales performance.
Furthermore, the conclusions drawn from (Biemans et al., 2022) are also in line with the current study's findings. Research focused on exploring the influence of the O2O strategy on consumer confidence and its subsequent impact on sales volume. The results of Amban's study demonstrated that O2O implementation positively affected consumer confidence, leading to a favorable impact on sales volume. This is in line with the current study's findings, supporting the idea that O2O strategies have the potential to boost consumer confidence, resulting in increased sales for businesses.
By seamlessly integrating virtual and physical experiences, O2O strategies create a cohesive and satisfying customer journey, thus fostering positive consumer perceptions and confidence in the brand (Yang et al., 2020).
A personalized experience's impact on sales volume
One of the most potent and influential marketing strategies in the modern business landscape revolves around personal recommendations. Leveraging the power of personalized recommendations, companies have found a compelling way to capture consumer interest and drive purchasing behavior (Yao et al., 2022). By offering tailored information and product suggestions based on individual requirements and preferences, organizations can create a highly engaging and customer-centric experience, ultimately leading to increased sales.
(Camilleri, 2018), the essence of personal recommendations lies in understanding and anticipating customer needs. When a company can effectively gather data on customer preferences, purchase history, and behavior, it gains valuable insights into each individual's unique requirements. Armed with this knowledge, the company can then curate personalized product recommendations that align precisely with the customer's preferences and desires.
The impact of personalized recommendations is profound, as it goes beyond traditional marketing approaches that rely solely on mass advertising and promotions. Instead of bombarding consumers with generic messages, personal recommendations cut through the noise and deliver relevant content that resonates with the individual's interests. This targeted approach not only captures the consumer's attention but also instills a sense of value and trust in the brand (Erciş et al., 2012)
The potential benefits for the organization are significant. By guiding customers towards products that cater to their specific needs and preferences, the company is more likely to secure successful sales transactions. When customers receive tailored recommendations that genuinely address their requirements, they are more inclined to make a purchase. Moreover, positive experiences with personalized recommendations can lead to customer satisfaction and loyalty, fostering repeat business and word-of-mouth referrals.
The effectiveness of personal recommendations aligns with the findings of earlier research on O2O strategies. (Xing & Zhu, 2014) conducted a study that explored the impact of O2O methods on sales volume. Their research revealed that businesses employing O2O strategies were able to demonstrate positive and substantial outcomes in terms of increasing sales volume. This correlation between personalized recommendations and O2O strategies underscores the significance of delivering personalized experiences to customers through the seamless integration of online and offline channels.
Effect of Transaction Security Safeguards on Sales Volume
One of the most pressing concerns in the realm of e-commerce is the issue of security in transactions. Ensuring secure trade and fostering consumer trust are paramount in the digital landscape, as they directly impact the success and growth of businesses operating in the online realm (Prakash & Singh, 2021) For Kampoeng Merdeka, addressing the security aspect and ensuring ease of use for customers are of utmost importance. Recognizing the significance of secure transactions and communications, the company places great emphasis on implementing robust security measures. By doing so, Kampoeng Merdeka aims to instill confidence in its customers and build long-lasting relationships with them. This approach underscores the company's commitment to providing a safe and seamless online shopping experience.
Moreover, Kampoeng Merdeka takes proactive steps to offer customers a diverse selection of payment methods. By providing multiple payment options, the company caters to the preferences and needs of a broad customer base. This strategic move not only enhances customer convenience but also contributes to increasing sales volume. By offering a range of payment options, Kampoeng Merdeka ensures that customers can choose the method that best aligns with their preferences, thus fostering a positive shopping experience (Muñoz & Avila, 2019).
Sales volume and offline businesses
are intricately linked, especially in the context of group purchases. The real reactions and experiences that consumers have after using a product or service hold significant weight in determining the overall perception of a group buy. These offline interactions and consumer experiences play a pivotal role in shaping online consumer reviews, which, in turn, influence potential buyers when they read those reviews (Lemon & Verhoef, 2016)
(Sarkar & Das, 2017)when it comes to group purchases, offline consumption carries more weight than online experiences. The quality of the products or services, the level of service delivery, and the overall consumption environment are key factors that impact how a group buy is perceived. Positive offline interactions can lead to glowing reviews, contributing to the success of future group purchases and enhancing the reputation of the business.
The significance of offline experiences in shaping online consumer reviews highlights the importance of delivering exceptional customer experiences in physical stores. Businesses need to prioritize providing top-notch products and services in offline settings to encourage positive reviews and word-of-mouth referrals. Satisfied customers who have positive offline interactions are more likely to share their experiences online, further driving sales volume through the power of word-of-mouth marketing (Yunpeng & Khan, 2023).
Conclusion
Following are the recommendations from this study based on the aforementioned research conclusions:
- Maintaining the Offline to Online (O2O) strategy is crucial for Kampoeng Merdeka, as evidenced by the study's results highlighting the effectiveness of the four O2O dimension elements in boosting sales volume. The findings underscore the significance of integrating offline and online channels to create a seamless and engaging customer experience. By leveraging the O2O approach, Kampoeng Merdeka can capitalize on the benefits of both realms, catering to the diverse preferences of modern consumers. The O2O strategy enables the company to engage with customers before they visit physical stores through online platforms, offering personalized promotions and interactive content that generate anticipation and excitement. This proactive engagement translates into increased foot traffic in physical stores, where the O2O approach continues to enrich the offline shopping experience. Interactive displays, augmented reality features, and virtual try-on options create a harmonious blend of the virtual and physical worlds, fostering customer satisfaction and loyalty.
- For future researchers, conducting comparable investigations in diverse regions is essential to generalize the findings of earlier studies. While the present study's results highlight the positive impact of O2O strategies on sales volume, regional differences and unique market dynamics may influence the effectiveness of O2O methods in other contexts. By conducting research in diverse regions, researchers can gain a broader understanding of the O2O strategy's efficacy and identify potential variations in its impact on sales volume. Factors such as cultural preferences, consumer behavior, and market maturity may play a role in shaping the outcomes of O2O implementations. Comparative studies across regions can provide valuable insights into the adaptability and versatility of O2O strategies in different market environments, informing businesses on how to tailor their approaches to suit specific regional contexts.
- To enhance the data quality, future researchers should focus on qualitatively capturing the intricacies of the research object. While quantitative research provides valuable statistical insights, qualitative approaches delve deeper into the nuances of the subject matter. Through qualitative methods such as interviews, focus groups, and observational studies, researchers can gain a more comprehensive understanding of the factors influencing the effectiveness of O2O strategies. These in-depth insights can shed light on customer perceptions, experiences, and preferences, enriching the analysis and providing a more accurate depiction of the reality of the research object. Additionally, qualitative data can offer valuable context and explanations for quantitative findings, facilitating a holistic interpretation of the research outcomes. By combining both qualitative and quantitative approaches, future researchers can strengthen the validity and reliability of their findings, contributing to a more robust and comprehensive body of knowledge in the field of O2O strategies.
References
- Z., & Leviäkangas, P. (2012). The Size, Structure and Characteristics of Finland’s ITS Industry. Technology and Investment, 03(03), 158–167. [CrossRef]
- Biemans, W., Malshe, A., & Johnson, J. S. (2022). The sales-marketing interface: A systematic literature review and directions for future research. Industrial Marketing Management, 102(June 2021), 324–337. [CrossRef]
- Brunswick, G. J. (2014). A Chronology Of The Definition Of Marketing. Journal of Business & Economics Research (JBER), 12(2), 105. [CrossRef]
- buku metode penelitian pendidikan sugiyono. (n.d.).
- Camilleri, M. A. (2018). Understanding Customer Needs and Wants. Tourism, Hospitality and Event Management, 29–50. [CrossRef]
- Chentao, S., & Yongle, W. (2014). Online to Offline Business Model Comparative Study of Chinese O2O Companies.
- Erciş, A., Ünal, S., Candan, F. B., & Yıldırım, H. (2012). The Effect of Brand Satisfaction, Trust and Brand Commitment on Loyalty and Repurchase Intentions. Procedia - Social and Behavioral Sciences, 58, 1395–1404. [CrossRef]
- Fauziah, U. U., Eldine, A., & Sume, S. A. (2019). Sales Promotion Dan Harga Terhadap Volume Penjualan. Manager : Jurnal Ilmu Manajemen, 2(1), 145. [CrossRef]
- Hughes, D. E., & Ogilvie, J. L. (2020). When Sales Becomes Service: The Evolution of the Professional Selling Role and an Organic Model of Frontline Ambidexterity. Journal of Service Research, 23(1), 22–32. [CrossRef]
- Lemon, K. N., & Verhoef, P. C. (2016). Understanding customer experience throughout the customer journey. Journal of Marketing, 80(6), 69–96. [CrossRef]
- Liang, L., & Sharp, A. (2016). Development of an analytical method for quantitative comparison of the e-waste management systems in Thailand, Laos, and China. Waste Management and Research, 34(11), 1184–1191. [CrossRef]
- Lie, Y., Atmojo, R. N. P., & Muljo, H. H. (2019). The Effectiveness of O2O Strategy on E-Commerce Transactions. The Winners, 20(1), 9. [CrossRef]
- Mossakowski, K. N., & Zhang, W. (2014). Does Social Support Buffer the Stress of Discrimination and Reduce Psychological Distress Among Asian Americans? Social Psychology Quarterly, 77(3), 273–295. [CrossRef]
- Muñoz, L., & Avila, O. (2019). A Model to Assess Customer Alignment Through Customer Experience Concepts. Lecture Notes in Business Information Processing, 373 LNBIP(May 2019), 339–351. [CrossRef]
- Prakash, A., & Singh, A. (2021). Cyber Security: Issues and Challenges in Covid - 19. 10318. [CrossRef]
- Rademakers, M., Scheepstra, S., & Stokes, P. (2019). Organizational Agility and Value Creation. Journal of Creating Value, 5(2), 106–110. [CrossRef]
- Sarkar, R., & Das, S. (2017). Online shopping vs Offline shopping: A comparative study. International Journal of Scientific Research in Science and Technology, 3(1), 424–431. www.ijsrst.com.
- Schaffner, L. G. (2016). The Function of Corporate Security Within Large Organizations : The Les interrelations entre la sécurité de l ’ information et la stratégie (Issue September).
- Siahtiri, V., O’Cass, A., & Ngo, L. V. (2014). Exploring the roles of marketing and selling capabilities in delivering critical customer centric performance and brand performance outcomes for B2B firms. Journal of Strategic Marketing, 22(5), 379–395. [CrossRef]
- Weng, X., & Zhang, L. (2015). Analysis of O2O Model’s Development Problems and Trend. IBusiness, 07(01), 51–57. [CrossRef]
- Xing, X., & Zhu, J. (2014). The Study of O2O Business Model Development Strategy in SMEs. International Journal of Business and Social Science, 5(9), 296–299. www.ijbssnet.com.
- Xu, T., & Zhang, J. (2015). A Development Strategy of O2O Business in China. Proceedings of the 2015 International Conference on Computer Science and Intelligent Communication, 16(Csic), 337–340. [CrossRef]
- Yang, Y., Gong, Y., Land, L. P. W., & Chesney, T. (2020). Understanding the effects of physical experience and information integration on consumer use of online to offline commerce. International Journal of Information Management, 51(December 2019), 102046. [CrossRef]
- Yao, P., Osman, S., Sabri, M. F., & Zainudin, N. (2022). Consumer Behavior in Online-to-Offline (O2O) Commerce: A Thematic Review. Sustainability (Switzerland), 14(13). [CrossRef]
- Yunpeng, S., & Khan, Y. A. (2023). Understanding the effect of online brand experience on customer satisfaction in China: a mediating role of brand familiarity. Current Psychology, 42(5), 3888–3903. [CrossRef]
Disclaimer/Publisher’s Note: The statements, opinions and data contained in all publications are solely those of the individual author(s) and contributor(s) and not of MDPI and/or the editor(s). MDPI and/or the editor(s) disclaim responsibility for any injury to people or property resulting from any ideas, methods, instructions or products referred to in the content. |
© 2023 by the authors. Licensee MDPI, Basel, Switzerland. This article is an open access article distributed under the terms and conditions of the Creative Commons Attribution (CC BY) license (http://creativecommons.org/licenses/by/4.0/).
Copyright: This open access article is published under a Creative Commons CC BY 4.0 license, which permit the free download, distribution, and reuse, provided that the author and preprint are cited in any reuse.


