
Submitted:
19 September 2023
Posted:
21 September 2023
You are already at the latest version
Abstract
The objective of the study was to apply the principles of analytical quality by design (AQbD) to the analytical method for the determination of the radiochemical purity (PQR) of the radiopharmaceutical sodium iodide 131I oral solution, by means of thin layer chromatography (TLC) with a Radio-TLC scanner, the same one that allows to evaluate the quality of the product. For the AQbD, the analytical objective profile (ATP), critical quality attributes (CQA), risk management, the method operable design region (MODR) were defined through the response surface methodology for method optimization using the MINITAB ® software, Control Strategy and the validation of the method where the parameters of selectivity, linearity, precision, robustness, detection limit, quantification limit, range and stability of the sample solution were evaluated. Under the experimental conditions, the conditions of the method were demonstrated by TLC-Scanner and optimization was carried out for an injection volume of 3 µL, radioactive concentration of 10 mCi/mL and carrier volume of 40 µL. It was statistically demonstrated that the method is selective for the 131I iodide band Rf of 0,8 and for the radiochemical impurity IO₃⁻ Rf of 0.6, linearity from 6,0 to 22.0 mCi/mL, intermediate precision with Global RSD of 0,624%, robustness with global RSD 0,101%, detection limit of 0,09 mCi/mL, quantification limit of 0.53 Ci/mL, conforming range, and stability of the sample solution evaluated over time 0, 2 and 20 hours with a global RSD of 0,362%, obtaining consistent results. The development of the method based on AQbD allowed the generation of a design space and an operational space with knowledge of all the characteristics and limitations of the method, likewise in all the operations the conformity of the tests to the acceptance criteria was verified. The validity of our method is concluded under the established conditions, suitable for use in the manufacturing process of sodium iodide 131I and application in nuclear medicine services.
Keywords:
AQbD
; CAA
; MODR
; Radiochemical purity
; TLC-Scanner
; Radiopharmaceutical
; Sodium iodide.
1. Introduction
The pharmaceutical industry has focused over the past decade on product quality, safety, and efficacy. Product quality has been increasing by implementing scientific tools such as QbD (Quality by Design) [1]. The concept of quality by design (QbD) has been introduced to improve manufacturing process manufacturing and product quality. QbD concepts are defined in ICH Q8 (R1), Q9 and Q10. During late 2013 and early 2014, the implementation of the existing QbD concept for method development analysis has been stressed. Several researchers report that similar opportunities exist to apply QbD to the analysis of analytical methods as they are applied to manufacturing processes [2]. ICH Q8 (R1) defines Quality by Design (QbD) as a system of thematic approach to development that begins with precise objectives and emphasizes product and process understanding and process control, based on sound science and quality risk management. Similar ideologies of QbD are applied in the development of analytical methods that are defined in analytical quality by design (AQbD). The AQbD process is an important stage of the quality system control strategy, although Good Manufacturing Practices have been in place for a long time, many companies still experience problems in relation to quality control. The quality assurance area sees it as the best solution to avoid out of specifications (OOS), out of trend (OOT) and minimize the risk of method failure. Analytical techniques are the main part of the control strategy, therefore, the adoption of AQbD is expected to enhance the concept of correct analysis which has an important essence in the development cycle of pharmaceuticals [3].
Radiopharmaceuticals are medicines marked with radioisotopes or radioactive compounds used in the diagnosis and/or treatment of diseases whose application is carried out in Nuclear Medicine Services. The radiopharmaceutical sodium iodide 131I is a solution for oral administration, which contains radioactive iodine processed in the form of sodium iodide from uranium tellurium fission products, has partial uptake and concentration of iodine in the thyroid gland, measures the amount of iodine that is concentrated in the glands to know if their function is within the normal range. Quality control ensures that circulation or sale is not allowed until its quality has been proven satisfactory during physical chemical, biological and nuclear controls. Radiochemical purity control in radiopharmaceuticals, described in USP 43, involves ensuring that the desired chemical form has most of the radioactivity. Impurities can be caused by various factors, such as the deficiency of the radiopharmaceutical, the solvent used, temperature, light, radiolysis or the labeling of an impurity with the same radionuclide [4,5,6,7].
The AQbD approach is an essential step in the development and validation of routine techniques. The implementation of the AQbD concept is justifiable since many variables significantly affect the results of the method [8]. The AQbD involves several steps, which begins with the definition of the objective analytical profile (ATP), determination of critical quality attributes (CQAs), risk assessment, identification of design space (DoE), optimal search through the methodology response surface (MSR), validation of AQbD methods and continuous improvement [9,10]. AQbD method validation focuses on radiochemical purity control through knowledge of DoE and MODR to design method validation according to ICH Q2. With this approach, an alternative analytical method can be developed that is cheap, fast, and simple, for which the performance characteristics of the analytical procedure are evaluated [11].
This study focuses on the implementation of AQbD in the analytical methodology for the determination of radiochemical purity of the radiopharmaceutical Sodium Iodide 131I Oral Solution, to improve quality control and obtain higher quality radiopharmaceuticals for their intended use in nuclear medicine.
2. Results and Discussion
2.1. Analytical Target Profile (ATP)
The identification of the ATP includes the selection of the method requirements (Table 1).
2.2. Critical Quality Attributes (CQA)
The CQAs of the radiochemical purity by TLC-Scanner method for the radiopharmaceutical Sodium Iodide 131I Oral Solution includes attributes and method parameters (Table 2).
2.3. Risk Management (QRM)
2.4. Design of Experiments (DOE)
Analysis of the design of DOE experiments by Box-Behnken response surface (BBD) was performed with 3 continuous critical factors and 15 experimental runs with the statistical program MINITAB ®, with randomized order. For the Counts and Asymmetry response variables. The results for the Response Surface Regression for the response variable Counts, the significant Factors with p-values < 0.05 are Injection Volume and Radioactive Concentration (Figure 2). An R2 value of 99.71% and adjR2 of 99.18% were obtained. The results for the Response Surface Regression for the response variable Asymmetry, the significant Factors with p < 0.05 values are Injection Volume and Carrier Volume (Figure 3). A R2 value of 97.98% and adjR2 of 94.36% were obtained.

Table 4.
Design factors.
| Factor | Name | Low | High |
|---|---|---|---|
| A | Injection volume | 1 | 3 |
| B | Radioactive concentration | 5 | 15 |
| C | Carrier volume | 10 | 40 |
Counts
Response surface regression:
Model Summary
| S | R-quad. |
R-quad. (adjusted) |
R-quad. (pred) |
| 2229.99 | 99.71% | 99.18% | 96.19% |
Asymmetry
Response surface regression:
Model Summary
| S | R-quad. |
R-quad. (adjusted) |
R-quad. (pred) |
| 0.0176392 | 97.98% | 94.36% | 70.19% |
The model is evaluated and adjusted only with those significant factors and interactions in order to adjust the design and recalculate the R2 value. The Response Surface Regression for the response variable Counts gives an R2 value of 99.49% and adjR2 of 99.35% (Figure 4), for the response variable Asymmetry gives an R2 of 96.35% and adjR2 of 92.70% (Figure 5). The residuals fit to a normal distribution, therefore the regression performed is compliant (Figure 6).
Counts
Response surface regression:
Model Summary
| S | R-quad. |
R-quad. (adjusted) |
R-quad. (pred) |
| 1984.49 | 99.49% | 99.35% | 98.91% |
Asymmetry
Response surface regression:
Model Summary
| S | R-quad. |
R-quad. (adjusted) |
R-quad. (pred) |
| 0.0200620 | 96.35% | 92.70% | 76.07% |
Optimal conditions for achieving the optimal region of operation were determined through contour and surface plots for the response variable Counts (Figure 7 and Figure 8) and Asymmetry (Figure 9 and Figure 10).
Counts
Optimal conditions:
Asymmetry
Optimal conditions:
2.5. Determination of Method Operable Design Region (MODR).
In the analysis of the response optimization in the operable method design region (MODR.) for the response variables Counts and Asymmetry. In Figure 11, the optimal values to be configured for the analytical procedure for the determination of the radiochemical purity of 131I Sodium iodide oral solution are shown.
Prediction of multiple response
| Variable | Setting Value |
| Sample Volume | 3 |
| Radioactive concentration | 10 |
| Carrier volume | 40 |
| Response | Adjustment |
EE of adjustment |
95% CI | 95% PI |
| Asymmetry | 0.9019 | 0.0153 | (0.8627; 0.9412) | (0.8420; 0.9619) |
| Counts | 62214 | 1931 | (57249; 67178) | (54631; 69797) |
Solution
| Solution | Sample volume | Radioactive concentration | Carrier Volume | Asymmetry adjustment | Counts Adjustment | Compound desirability |
| 1 | 3 | 10 | 40 | 0.901938 | 62213.8 | 0.727118 |
2.6. Selectivity Determination
The selectivity analysis compared the response of blanks and/or placebos and degraded samples to the sample at room temperature. The method was able to distinguish between all possible chemical species that can be generated (Figure 13). The TLC-Scanner method showed the Rf values in the chromatograms for the 131I iodide band Rf 0.8 and the radiochemical impurity IO3- Rf 0.6 and without any chromatographic peak of the blank and/or placebo, indicating no interference and the Rf values for the pertechnetate band 131I and the radiochemical impurity are different.
2.7. Linearity Determination
The measured values for the 131I solutions are shown in Table 6. Here we can see that there is a clear trend to linearity, because when the radioactive concentration of 131I is increased, counts are increased proportionally. Using these data, we constructed the regression curve for the concentration of 131I (Figure 14).
Table 5.
Total Counts of 131I.
| Levels (mCi/mL) | Area (Counts) Average |
|---|---|
| 6.00 | 39143.333 ± 0.7825 |
| 10.00 | 65067.333 ± 0.6271 |
| 13.00 | 81480.666 ± 3.0296 |
| 17.50 | 113205.33 ± 2.9852 |
| 23.00 | 150009.00 ± 1.1630 |
The results were statistically analyzed by evaluating the radioactive concentrations (mCi/mL) versus the area (Counts) found. The equation of the line is shown in Figure 15, where:
y = 6507,675 x + - 545,389
The values achieved by regression statistics were a Pearson correlation coefficient (r) of 0.998 and a coefficient of determination (r2) of 0.997. The coefficient of determination indicates that there is good linearity and provides greater statistical significance.
Using the t-student test and ANOVA the "t" statistic was found along with a variance test. The regression value = 648.19 demonstrated that the correlation is linear and significant. The p-value = 0.000 indicated that the analysis of variance has a high correlation so it can be inferred that the method is linear.
2.8. Determination of Precision
Instrumental repeatability, method repeatability, and intermediate precision were evaluated in the analysis for the parameter precision. It was observed that the RSD of the instrument repeatability areas is 0.935%. The RSD of the method repeatability was 1.266% with an individual confidence interval of 96.84% to 102.66% conformed and an average confidence interval of 99.75 ± 0.971% conformed. For intermediate precision different equipment and analysts were evaluated, Equipment 1: TLC-Scanner Brand: Scan-Ram Model: SR1A Code: PM05AC. Set 2: Single-channel spectrophotometric chain Brand: Canberra. Pass results were obtained, the overall RSD is 0.624% as shown in Table 6.
Table 6.
Intermediate Precision of 131I.
| Analyst Equipment |
Area Counts |
PRQ (%) |
RSD (%) |
%RSD Overall |
|---|---|---|---|---|
| Analyst 1 | 64930 | 101,05 | 1,1375 | 0,624 |
| Equipment 1 | 65526 | 98,185 | ||
| 66521 | 99,327 | |||
| 63468 | 98,392 | |||
| 65784 | 98,015 | |||
| 63891 | 99,102 | |||
| Analyst 2 | 11235 | 99,902 | 2,6032 | |
| Equipment 2 | 11766 | 99,958 | ||
| 11845 | 99,890 | |||
| 11716 | 99,923 | |||
| 12126 | 99,844 | |||
| 11992 | 99,825 |
2.9. Robustness Determination
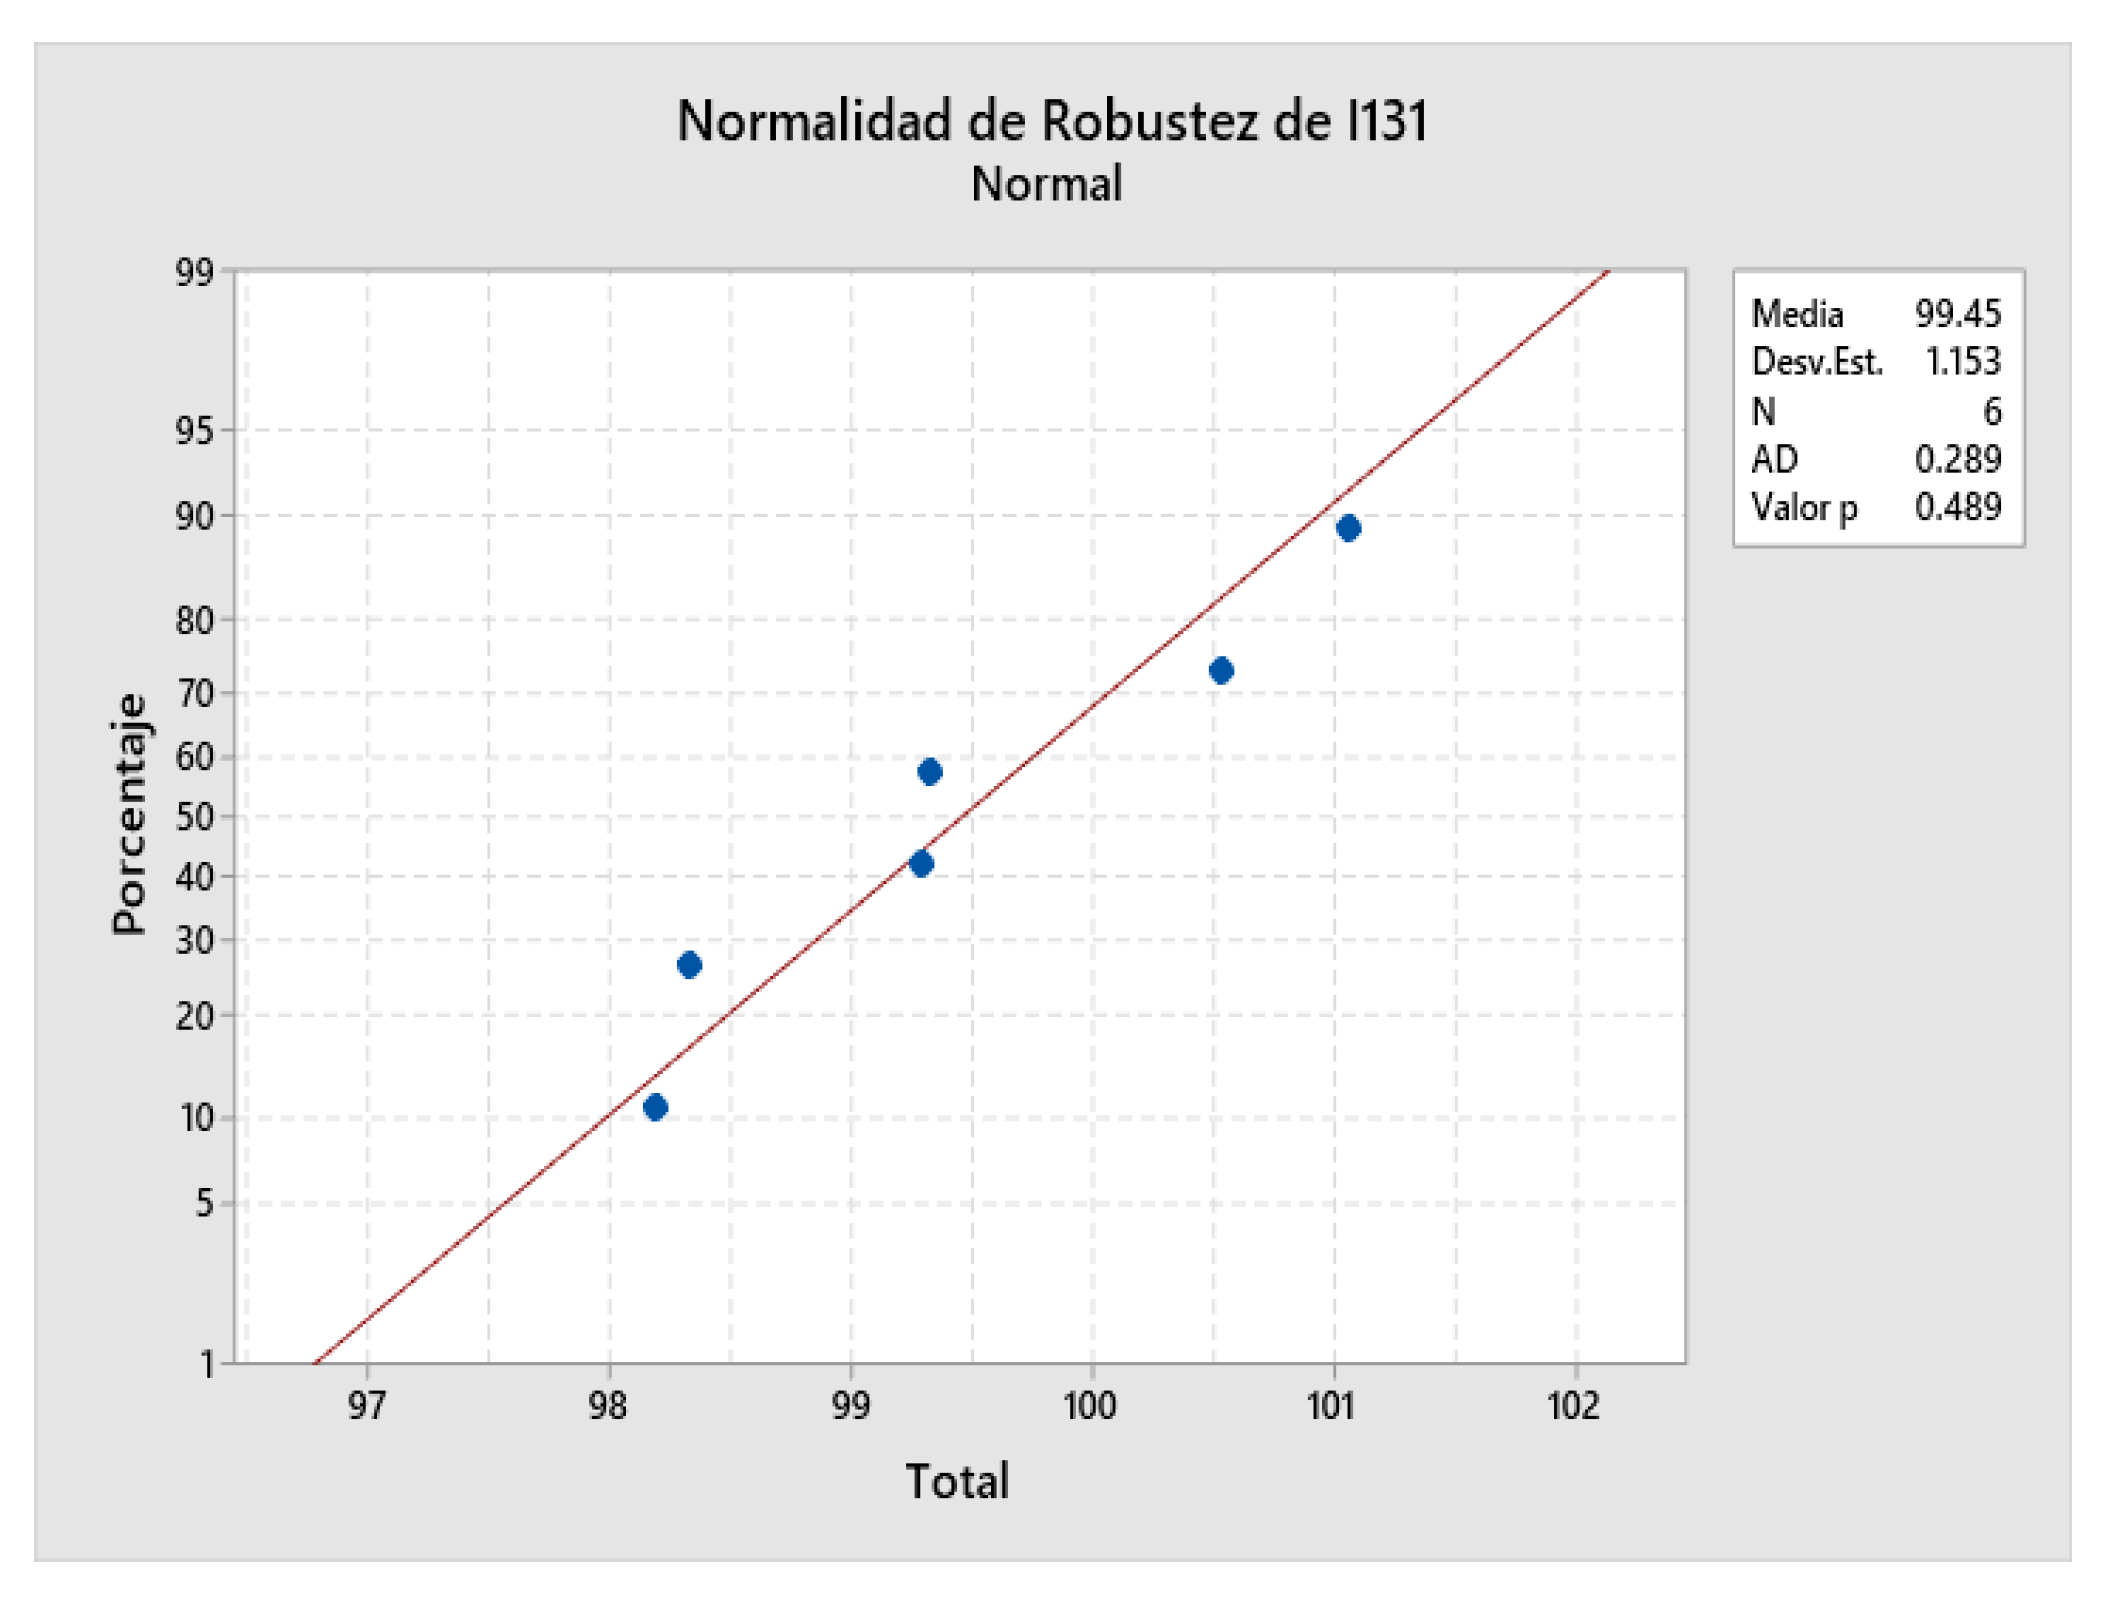
For this parameter the condition of variability was evaluated, for this case: Condition 1: Stationary phase: 70% methanol and for Condition 2: 60% methanol. The overall RSD with all results was 0.101%, the overall normal was 0.654 (Figure 15), the normality 1st condition was 0.563, the normality 2nd condition was 0.601 and the statistical test t was 0.901, compliant results were obtained.
Figure 15.
Normal Robustness 131I.
2.10. Determination of the Limit of Detection and Quantitation
The detection limit is the concentration derived from the smallest response that can be detected with reasonable certainty for a given analytical procedure [10]. It was determined by analyzing samples with known concentrations.
The detection limit was calculated with the formula [10]:
DL= (s x 3.3) / Slope
Where s is the standard deviation of the response.
The limit of quantitation (LOQ) was calculated using the formula [10]:
QL= (s x 10) / Slope
By interpolating the regression equation, the limit of detection value was calculated to obtain a radioactive concentration of 0.09 mCi/mL and the limit of quantitation value to obtain a radioactive concentration of 0.53 mCi/mL, obtaining compliant results.
2.11. Rank Determination
The working range for the validation parameters was established from 6.00 mCi/mL to 22.0 mCi/mL by demonstrating precision and linearity over that range for the validated analytical procedure.
2.12. Sample Solution Stability Determination
The stability parameter of the sample solution was evaluated at 0 hours, 2 hours, and 20 hours time points, and the data distribution was also evaluated. The overall RSD with all 0-, 2-, and 20-hour sample results was 0.362%. The normality of the samples at 0 hours was 0.206, the normality of the samples at 20 hours was 0.733 and the t-statistical test was 0.568, obtaining compliant results and it was determined that prepared samples can be processed up to 20 hours later (Figure 16).
3. Materials and Methods
The analytical quality by design (AQbD) life cycle of the radiochemical purity analytical methodology by TLC-Scanner for the radiopharmaceutical product Sodium Iodide 131I Oral Solution, applies tools such as ATP (Analytical Target Profile), determination of procedure parameters analytical and CQA (critical quality attributes), quality risk management, optimization and method development with DoE and MODR (method operable design region), AQbD method validation, routine use and continuous monitoring. The validation, as it is a non-pharmacopoeial methodology, has been based on the validation parameters indicated in the USP and the ICH Q2 (R2) guidelines, for the parameters selectivity, linearity, precision, robustness, detection limit (DL), limit quantitation (QL), sample stability and range. The results obtained were statistically analyzed for the development of the AQbD.
3.1. Process Description
The implementation of AQbD in the analytical process was developed in the Quality Control Department, Radiochemistry Laboratory I (Laboratory No. 19) of the IPEN Radioisotope Production Plant. The equipment used was a radio-TLC scanner with code: PM05AC, Brand: Scan-RAM, Model: SR1A, Serial: SR1A/0117/380 and a sin-gle-channel gamma spectrometry chain with code: PM03AC, Brand: Canberra.
3.2. Sampling Plan
The samples used were provided by the radiopharmaceutical section of the production department and delivered to the analytical development section of the Quality Control Department.
3.3. Analytical Method
The analytical method used is the test: Radiochemical purity of sodium iodide 131I Oral Solution.
3.3.1. Equipment, Materials and Reagents
Materials:
- Chromatographic paper No. 1 of 10 x 200 mm.
- Chambers or chromatographic tanks.
- Micropipette from 2 to 20 µL Code: TH80AC and micropipette from 20 to 200 µL Code: TH82AC.
Equipment:
- Radio-TLC scanner: Code: PM05AC, Brand: Scan-RAM.
- Single channel gamma spectrometry chain: Code: PM03AC, Brand: Canberra.
- Dose calibrator: Code: CA10AC, Brand: Capintec.
- Radiation Monitor: Code: DP28JP, Brand: Technical Associates.
- 131I radiochemical fume hood.
- Handheld Dosimeter.
- Body dosimeter.
Reagents:
- Methanol ACS, Brand: Merck.
- Potassium iodide ACS, Brand: Merck.
- ACS sodium bicarbonate, Brand: Merck.
- Starch SR, Brand: Merck.
- Potassium Iodate, Brand: J.T.Baker.
- Hydrogen Peroxide, Brand: Merck.
3.3.2. Chromatographic System for Thin Layer Chromatography (TLC)
- Detector: NaI (sodium iodide).
- Mobile phase: 70% methanol
- Stationary phase: Chromatographic Paper No. 1
- Volume: 3 µL.
- Time: 90 minutes approx.
3.4. Analytical Quality by Design
The AQbD approach to the analytical procedure for the determination of radiochemical purity by a thin layer chromatography (TLC) method with a Radio-TLC Scanner system was based on prior knowledge and internal evaluation, quality risk management, DoE and MODR.
3.5. Implementation of the AQbD Approach
- Analytical Target Profile (ATP): A prospective summary of performance characteristics was performed. [eleven].
- Determination of the parameters of the analytical procedure and CQA (Critical Quality Attributes): Critical analytical attributes (CAA) and critical method variables (CMV) were identified.
- Risk Management (QRM): An Ishikawa spine diagram and Failure Mode and Effects Analysis (FMEA) were used.
- Design space (DoE): A response surface (MSR) methodology of the Box-Behnken design (BBD) was generated.
- Method Operable Design Region (MODR): Optimum fit points and combined ranges are defined for two or more variables within which the analytical procedure is shown to be fit for its intended use.
- Control strategy: It was established based on the experimental data collected during the CQA, DoE and MODR stages.
3.6. Validation of the AQbD Method
The AQbD method validation approach establishes the validation strategy of the analytical procedure for the determination of radiochemical purity by means of a thin layer chromatography (TLC) method with a Radio-TLC scanner for method operable design region (MODR) and the control strategy.
3.7. Parameters
- Selectivity: 2 sample solutions, 2 sample solutions with radiochemical impurity IO3-reduced, 2 placebo solutions and 1 diluent sample or mobile phase sample were prepared.
- Linearity/Response function: 5 concentration levels and triplicate analysis were considered for each radioactive concentration of 6,0; 10,0; 13,0; 17,0; 22,0mCi/mL. A regression curve was made in mCi/mL of the reading of the areas (counts) at different radioactive concentrations.
- Precision: 1 sample solution of sodium iodide 131I Oral Solution was prepared. Solutions were prepared at concentrations of 6,0; 10,0; 22,0mCi/mL. 6 tests were carried out with different teams and quality control specialists.
- Robustness: The variability factor contributed by the change of type of mobile phase was evaluated: 60% Methanol.
- Detection limit (DL) and quantitation limit (QL): Analysis was performed in triplicate for each radioactive concentration between 6,00 and 22,0 mCi/mL.
- Range: The parameters of precision, linearity, DL and QL were evaluated.
- Stability of the sample solution: The stability was evaluated at 0 hours up to 20 hours after its preparation.
3.8. Work Solutions
- Solution A: Weigh approximately 100 mg of potassium iodide, 200 mg of potassium iodate, 1 g of sodium bicarbonate to a 100-mL volumetric flask, add 20 mL of distilled water, and dissolve, make up to volume with distilled water, and homogenize.
- Sample solution: Approximate radioactive concentration: 10,0 mCi/mL. Dilute the Sodium Iodide 131I product solution with diluent solution to obtain a concentration of 10,0 mCi/mL.
- Placebo solution: The placebo delivered by the production area was used.
- Blank solution: The diluents used in the procedure were used.
- Mobile phase: Transfer approximately 7 mL of methanol ACS to a 10 mL volumetric flask, make up to volume with distilled water, and mix.
- Acidified hydrogen peroxide solution: Add 6 drops of 1 N hydrochloric acid to 10 mL of hydrogen peroxide solution.
3.9. Procedure
The procedure was performed using nitrile gloves, a metal clamp, a radiochemical hood, a leaded visor, lead shielding, and adequate lighting.
Chromatographic strips No. 1 were placed on a paper towel with the help of a clamp and activated in an oven at 70 °C for 30 minutes; once activated, remove and use immediately or store for 24 hours in a desiccator on activated silica gel.
Then, the activated strip was placed on a towel and placed in the seeding area of the laboratory. A smooth line was marked 1,5 cm from the start, and solution A was placed in the sowing area, 20 mm from the end of the strip, leaving it to dry at room temperature. 3 µL of the 131I sample solution was seeded with a micropipette at one end of the strip; then, it was dried at room temperature for approximately 1 minute.
Subsequently, the strip was placed in the chromatographic tank previously equilibrated in the mobile phase, approximately 1 mm from the surface of the solvent. Care was taken that the solvent came into direct contact with the seeding point and that the edges of the strip did not come into contact with the edge of the tank. The chromatogram was then run until the mobile phase front had traveled 160 mm down the strip, was removed and allowed to air dry.
System adequacy: the sample solution was injected in duplicate. The relative standard deviation for both radiochemical purity runs PRQ1 and PRQ2 should not be greater than 2,0%.
Specification: The radioactivity of the iodide 131I band is not less than 95% of the total radioactivity and its RF value is within a range of ±5% of the value found for sodium iodide, determined under parallel conditions.
Radiochemical purity: ≥ 95% as 131I iodide of total radioactivity.
5. Conclusions
After the detailed evaluation of the AQbD results for the radiochemical purity method (PQR) by TLC-Scanner for the radiopharmaceutical Sodium Iodide 131I Oral solution, the analytical target profile (ATP), the critical quality attributes (CQA), quality risk management (QRM), design of experiments (DoE), method operable design region (MODR), method validation, and continuous monitoring. The critical method variables (CMV) and the critical analytical attributes (CAA) were extracted through prior knowledge and internal evaluation, which are detailed in Table 2. Quality risk management (QRM) indicated the critical parameters of the process (factors or operational steps of the analytical procedure) such as injection volume, radioactive concentration, and carrier volume. The design of experiments (DoE) confirmed the critical variables of the method based on statistical significance, for the response variable Counts with p < 0,05, R2 value of 99,49% and adjR2 of 99,35%, are injection volume and radioactive concentration and for Asymmetry with p < 0.05, R2 value of 96,35% and adjR2 of 92,70% are injection volume and carrier volume. Appropriate optimal ranges for method variables were established. The Method Operable Design Region (MODR) based on method factors and settings establishes the settings for the injection variable of 3 μL, radioactive concentration of 10 mCi/mL, and carrier volume of 40 μL. The validation of the AQbD method using the knowledge of DoE and MODR statistically demonstrated that the method is selective because it allows distinguishing chemical species that are generated without interference for both the iodide 131I band with an Rf of 0,8 and the radiochemical impurity IO3 - with an Rf of 0.6, with a linear response at the five concentration levels from 6.0 to 22.0 mCi/mL with a Pearson correlation coefficient (r) of 0,998 and a coefficient of determination (r2) of 0,997, demonstrating the accuracy of the method with a global RSD of 0,624%, the robustness of different stationary phases with a global RSD of 0,101%, capable of detecting small amounts of radioactive concentrations, obtaining a detection limit of 0,09 mCi/mL, a quantification limit of 0,53 mCi/mL, the range of the parameters conforming and a stability to process the samples evaluated at times 0, 2 and 20 hours with a global RSD of 0,362%.
AQbD parameters such as ATP, CQA, quality risk management, optimization and method development with DoE, MODR, method validation such as selectivity, linearity, precision, robustness, limit of detection, limit of quantification, range, and solution stability demonstrated that the method is robust and produces consistent, reliable and quality data throughout the analytical process [12].
Author Contributions
Conceptualization, M.V.; methodology, M.V. and A.C.-L.; software, M.V.; validation, M.V.; formal analysis, M.V; investigation, M.V.; resources, A.C.-L. and N.J.R.-C.; writing—original draft preparation, M.V., J.S.-V. and D.C.-A.; writing—review and editing, J.S.-V. and D.C.-A.; visualization, D.R.-P. and M.A.-C. All authors have read and agreed to the published version of the manuscript.
Acknowledgments
In this section, you can acknowledge any support given which is not covered by the author contribution or funding sections. This may include administrative and technical support, or donations in kind (e.g., materials used for experiments).
Conflicts of Interest
The authors declare no conflict of interest.
References
- Raman, N.V.V.S.S., Mallu U. R., Bapatu, H. R. Analytical Quality by Design Approach to Test Method Development and Validation in Drug Substance Manufacturing. Journal of Chemistry, 2015, vol. 2015. Article ID435129, 8 pages, 2015. [CrossRef]
- Peraman, R., Bhadraya, K., & Padmanabha Reddy, Y. Analytical Quality by Design: A Tool for Regulatory Flexibility and Robust Analytics. International Journal of Analytical Chemistry, 2015, Vol. 2015. Article ID 868727, 9 pages, 2015. [CrossRef]
- Alhakeem, M. A., Ghica, M. V., Pirvu, C. D., Anuta, V., & Popa, L. Analytical Quality by Design with the Lifecycle Approach: A Modern Epitome for Analytical Method Development. Acta Marisiensis-Serie Medica, 2019; 65(2): 37-44. [CrossRef]
- Programa ARCAL. Manual de protocolos de calidad de radiofármacos. ARCAL XV Producción y control de radiofármacos. Organismo Internacional de Energía Atómica. Viena. Austria. 1999.
- Soriano, B., Mendarte, L. & San Martín, E. Agentes de diagnóstico y radiofarmacia. Farmacia Hospitalaria. Tomo II. Pág. 758 - 759. Universidad de Belgrano. Madrid. España. 2002.
- Chain, C. Y. & Illanes, L. Radiofármacos en medicina nuclear. Fundamentos y aplicación clínica. 1era Edición. Facultad de Ciencias Exactas. Universidad Nacional de la Plata. Buenos Aires. Argentina. 2015.
- USP 43 NF 38 – Farmacopea de los Estados Unidos de América. Monografía Oficial del Ioduro de Sodio I 131 Solución. 2020. p. 2367-2368.
- Priyanka P. Pande, Sadikali F. Sayyad, Machindra J. Chavan, Sanjay R. Chaudhari. Quality by design in analytical method development and validation. Journal of Environment and Life Sciences. 2017. Vol. 2 (2), pp. 39 – 45.
- ICH Harmonised Tripartite Guideline – International Conference on Harmonisation of Technical Requirements for Pharmaceuticals for Human Use. Pharmaceutical Development. Q8 (R2). 2009.
- ICH Harmonised Guideline – International Council for Harmonisation of Technical Requeriments for Pharmaceuticals for Human Use. Analytical Procedure Development (Q14). 2022.
- ICH Harmonised Guideline – International Council for Harmonisation of Technical Requirements for Pharmaceuticals for Human Use. Validation of Analytical Procedures. Q2 (R2). 2022.
- USP 43 NF 38 – Farmacopea de los Estados Unidos de América. Capitulo General Validación de Procedimientos Farmacopéicos <1225>. 2020.
- Bhusnure O. G., Fasmale R. N., Gandge N. V., Gholve S. B., Giram P. S. QbD Approach for Analytical Method Development and Validation of serotonin by Spectroscopic Method. Interntional Journal of Pharmacy & Pharmaceutical Research, 2017, Vol. 10 (1), pp. 98 – 117.
Figure 1.
Ishikawa plot for PQR gamma spectroscopy method.
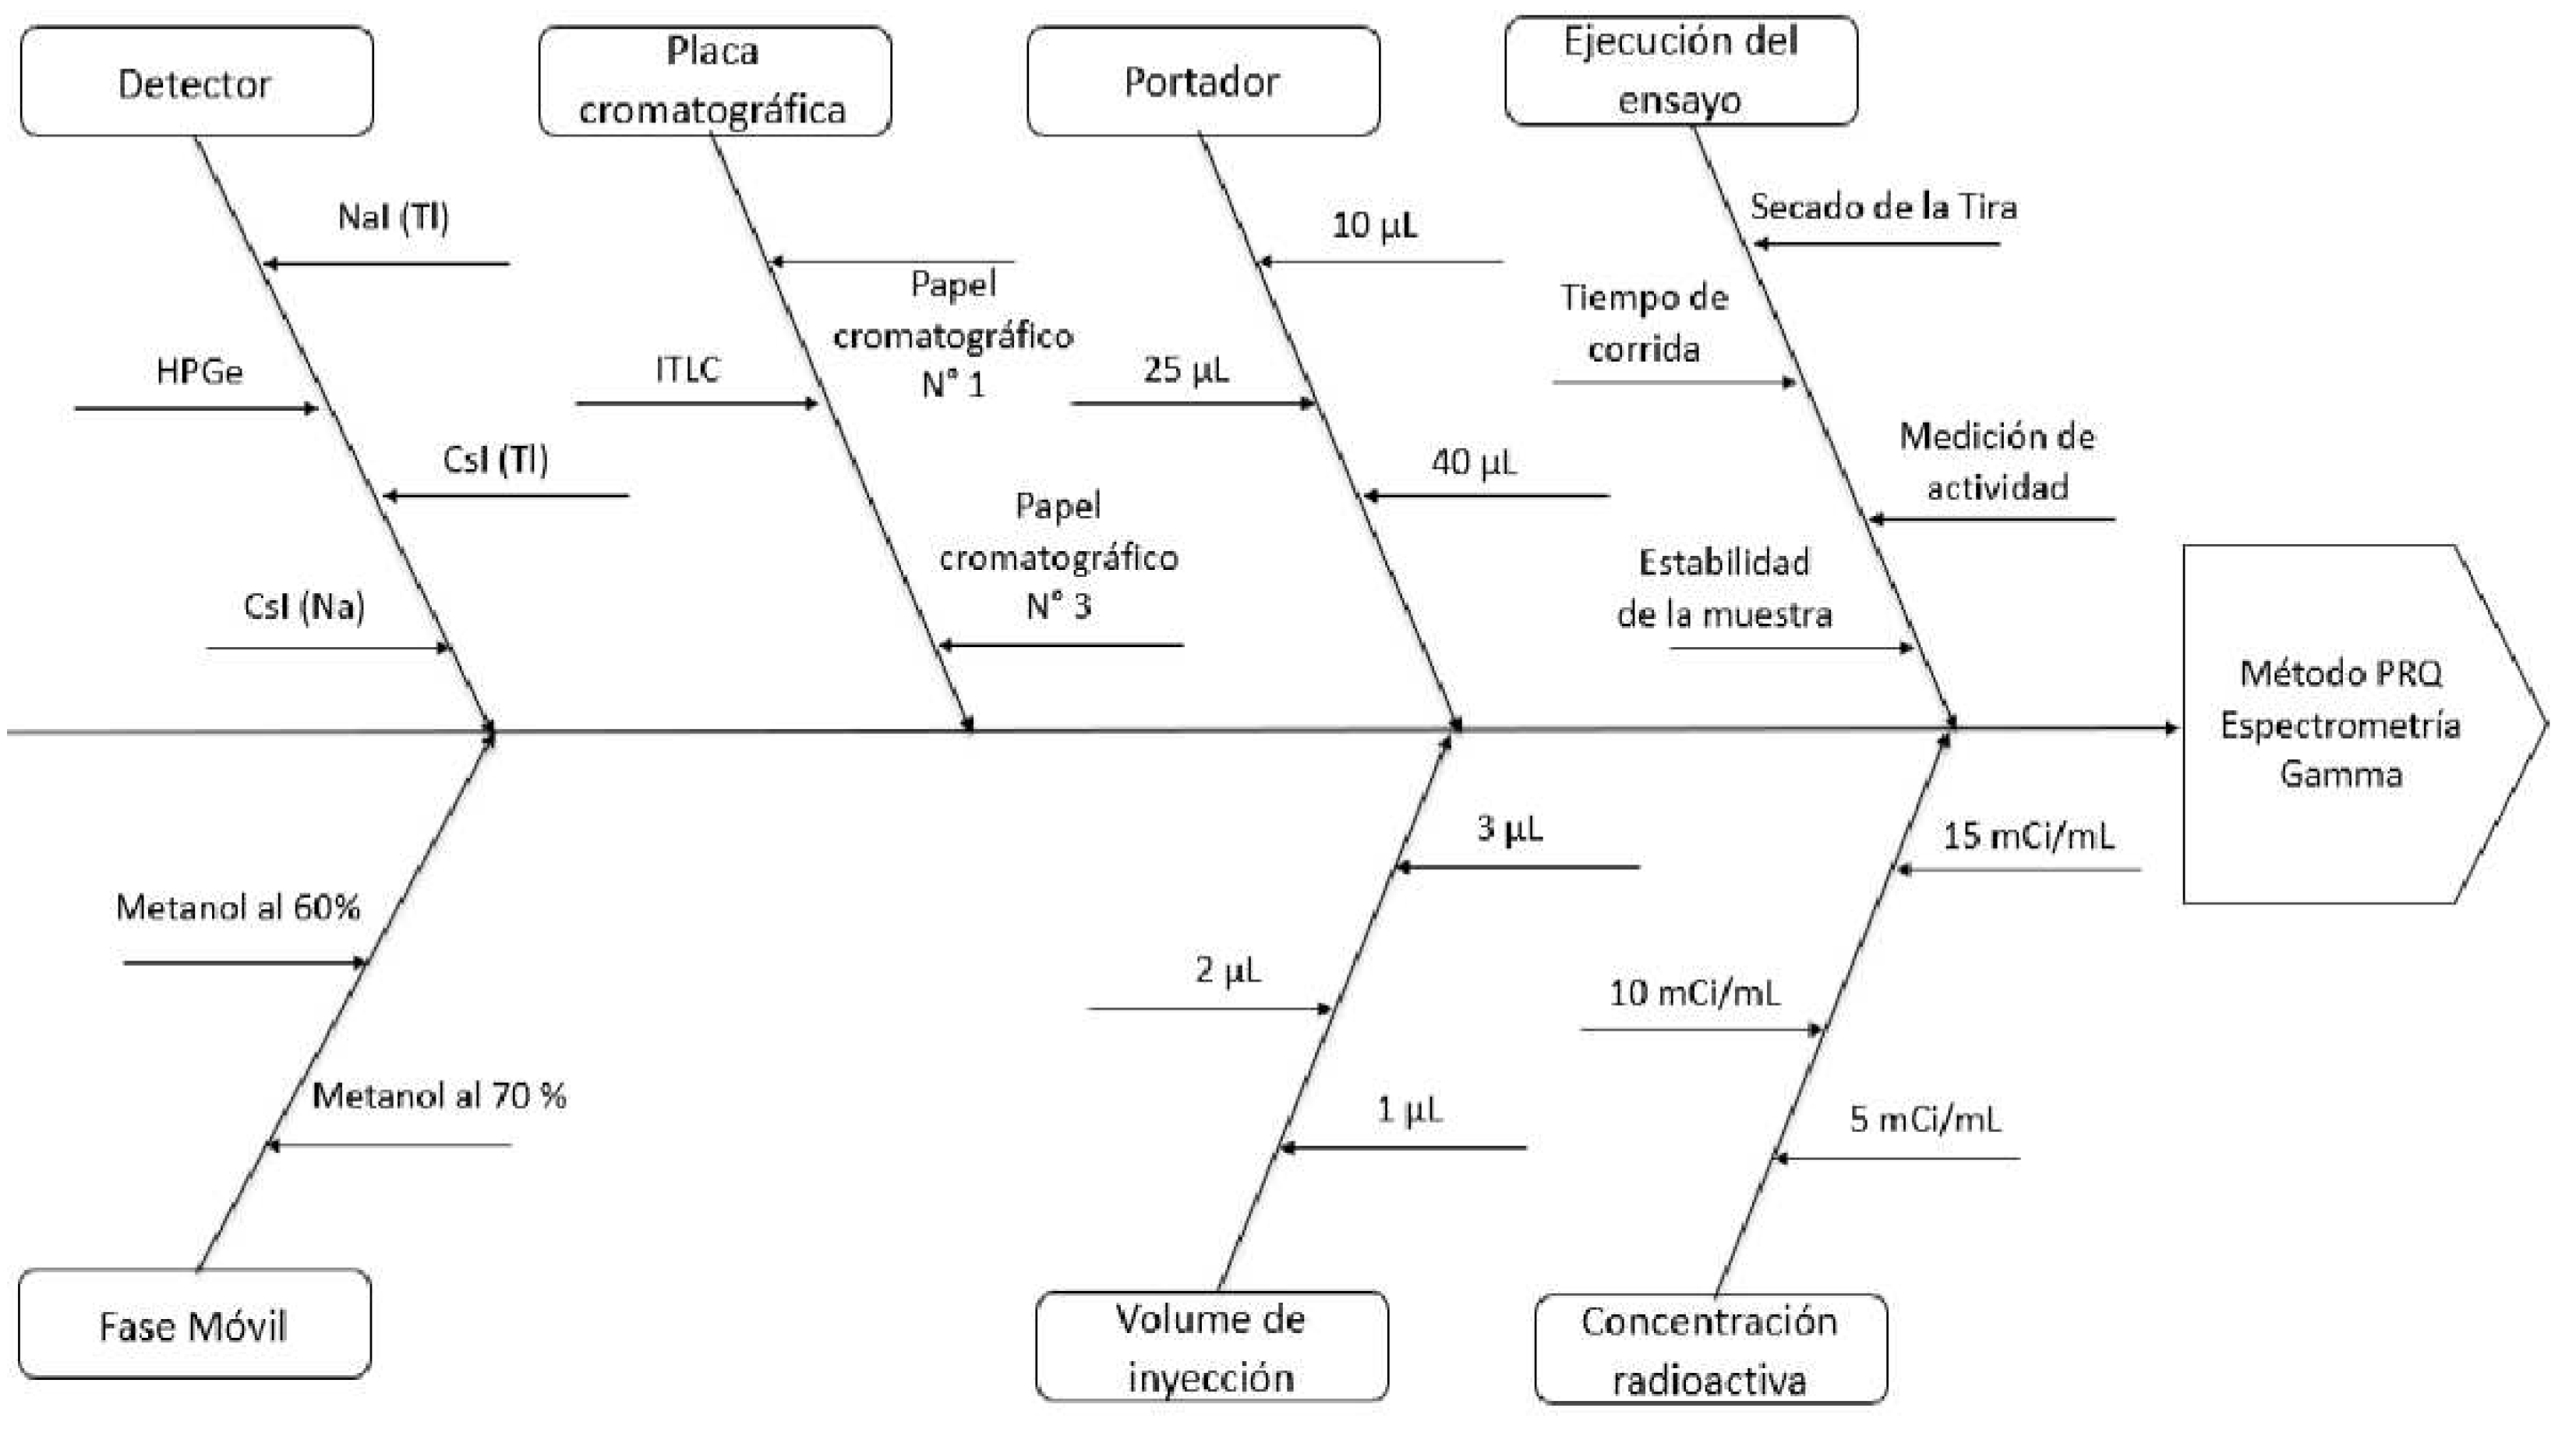
Figure 2.
Pareto plot of significant effects for Counts.
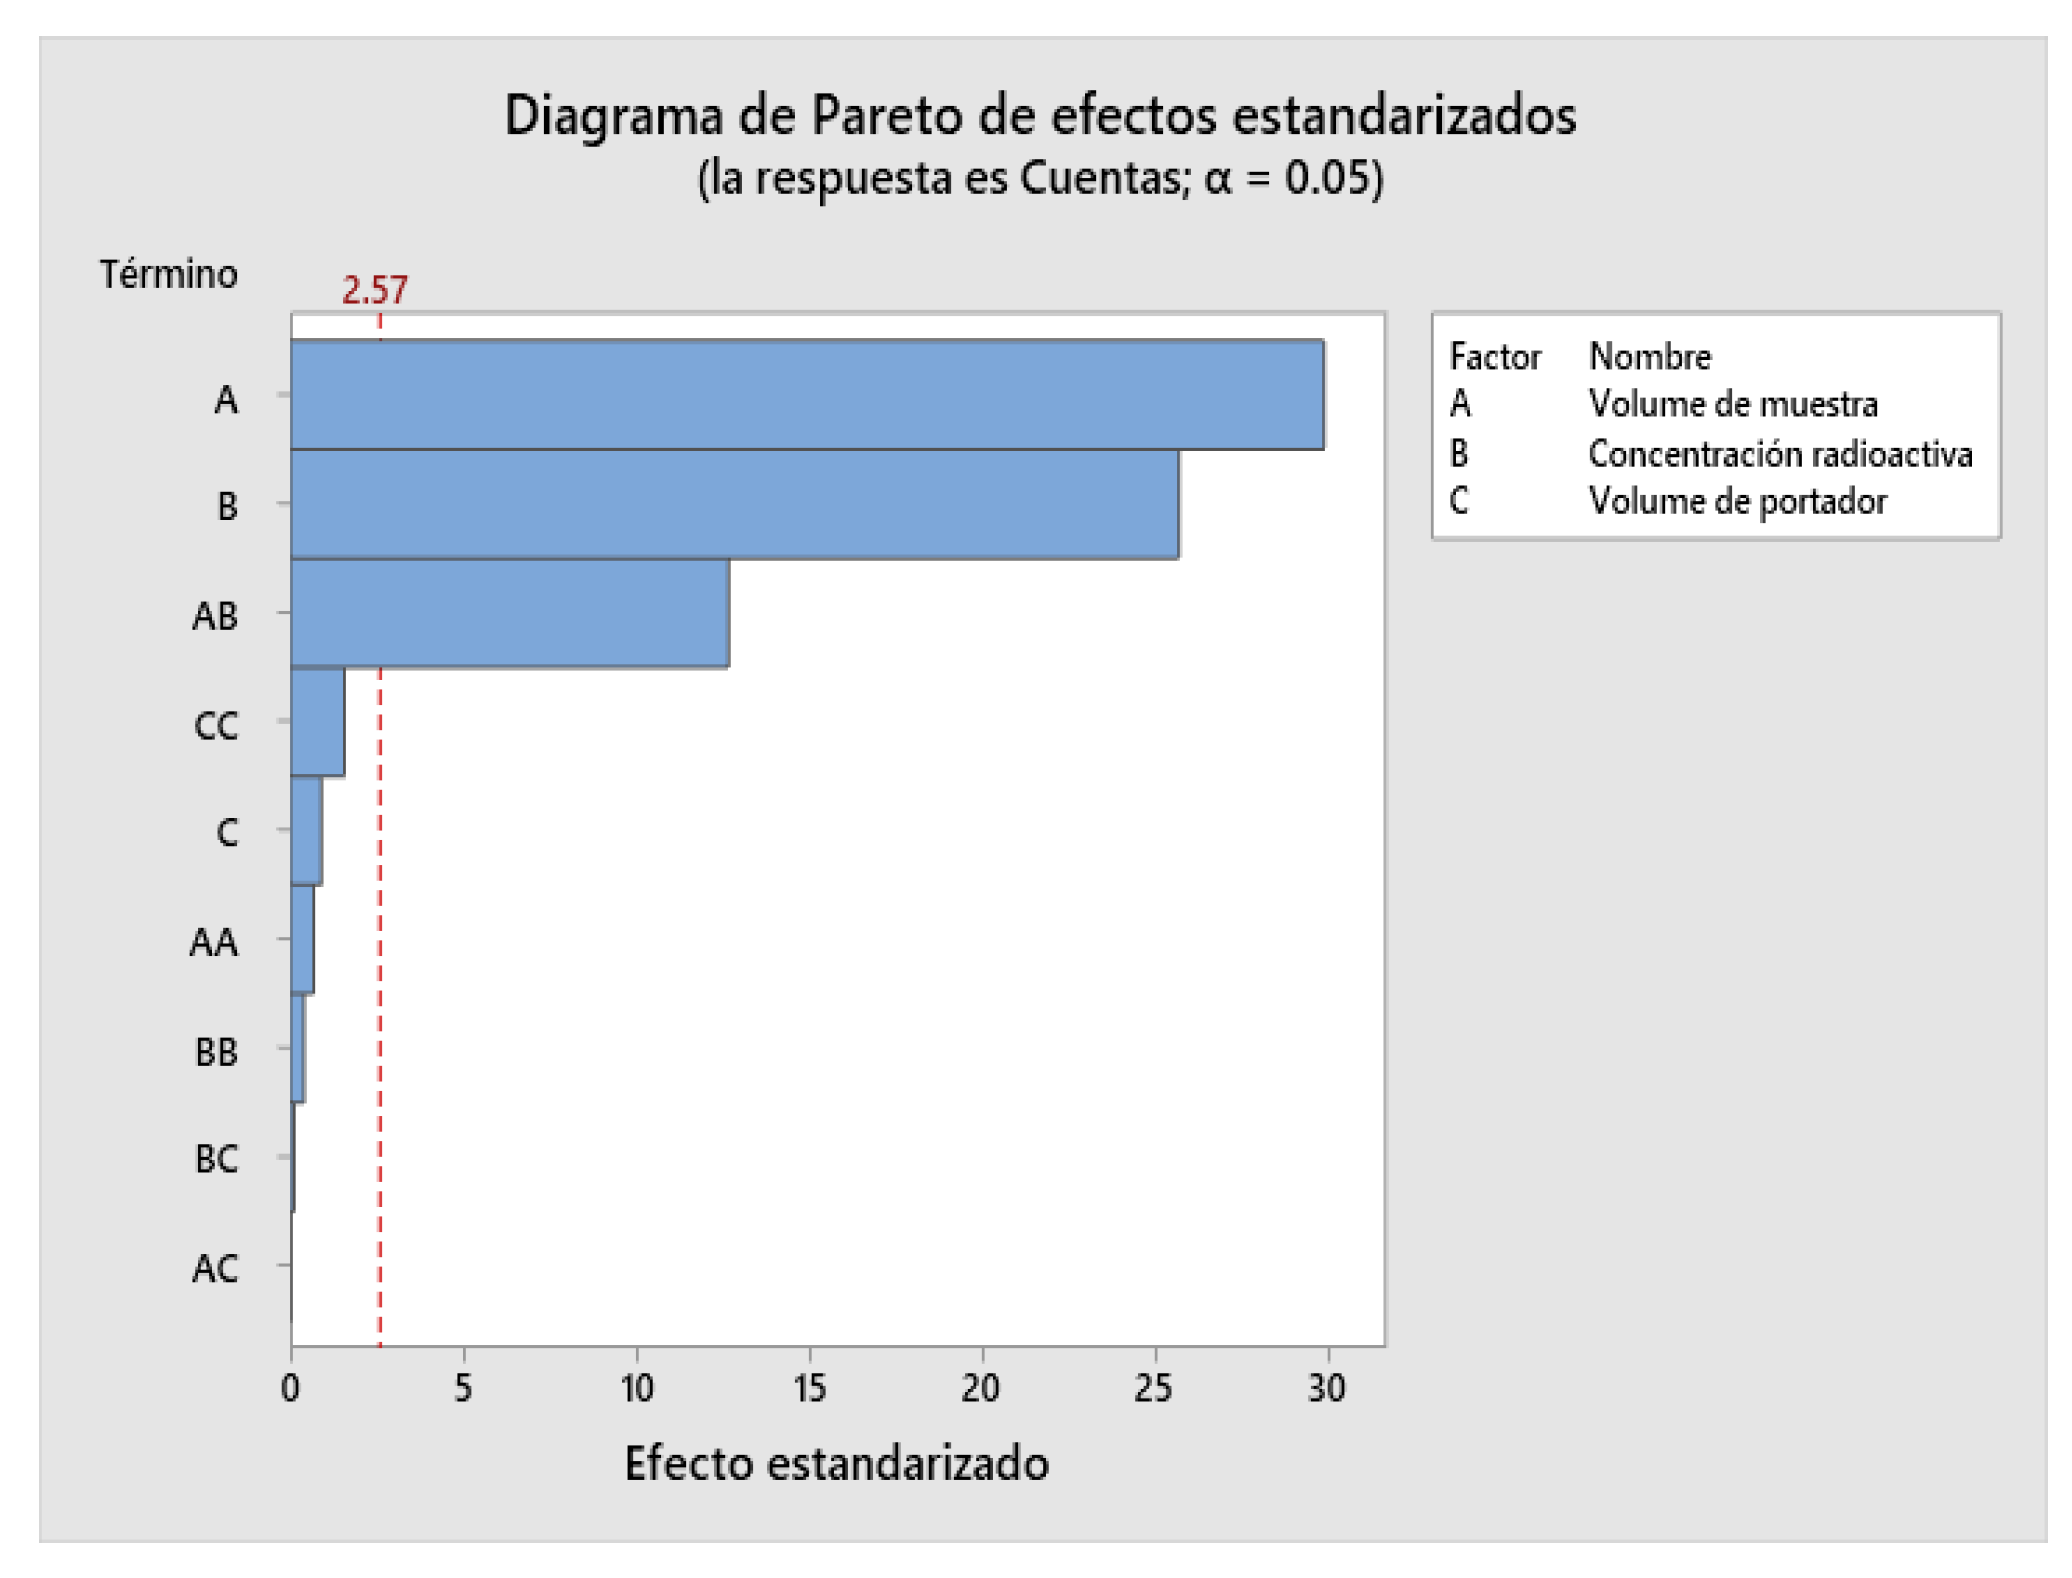
Figure 3.
Pareto plot of significant effects for Asymmetry.
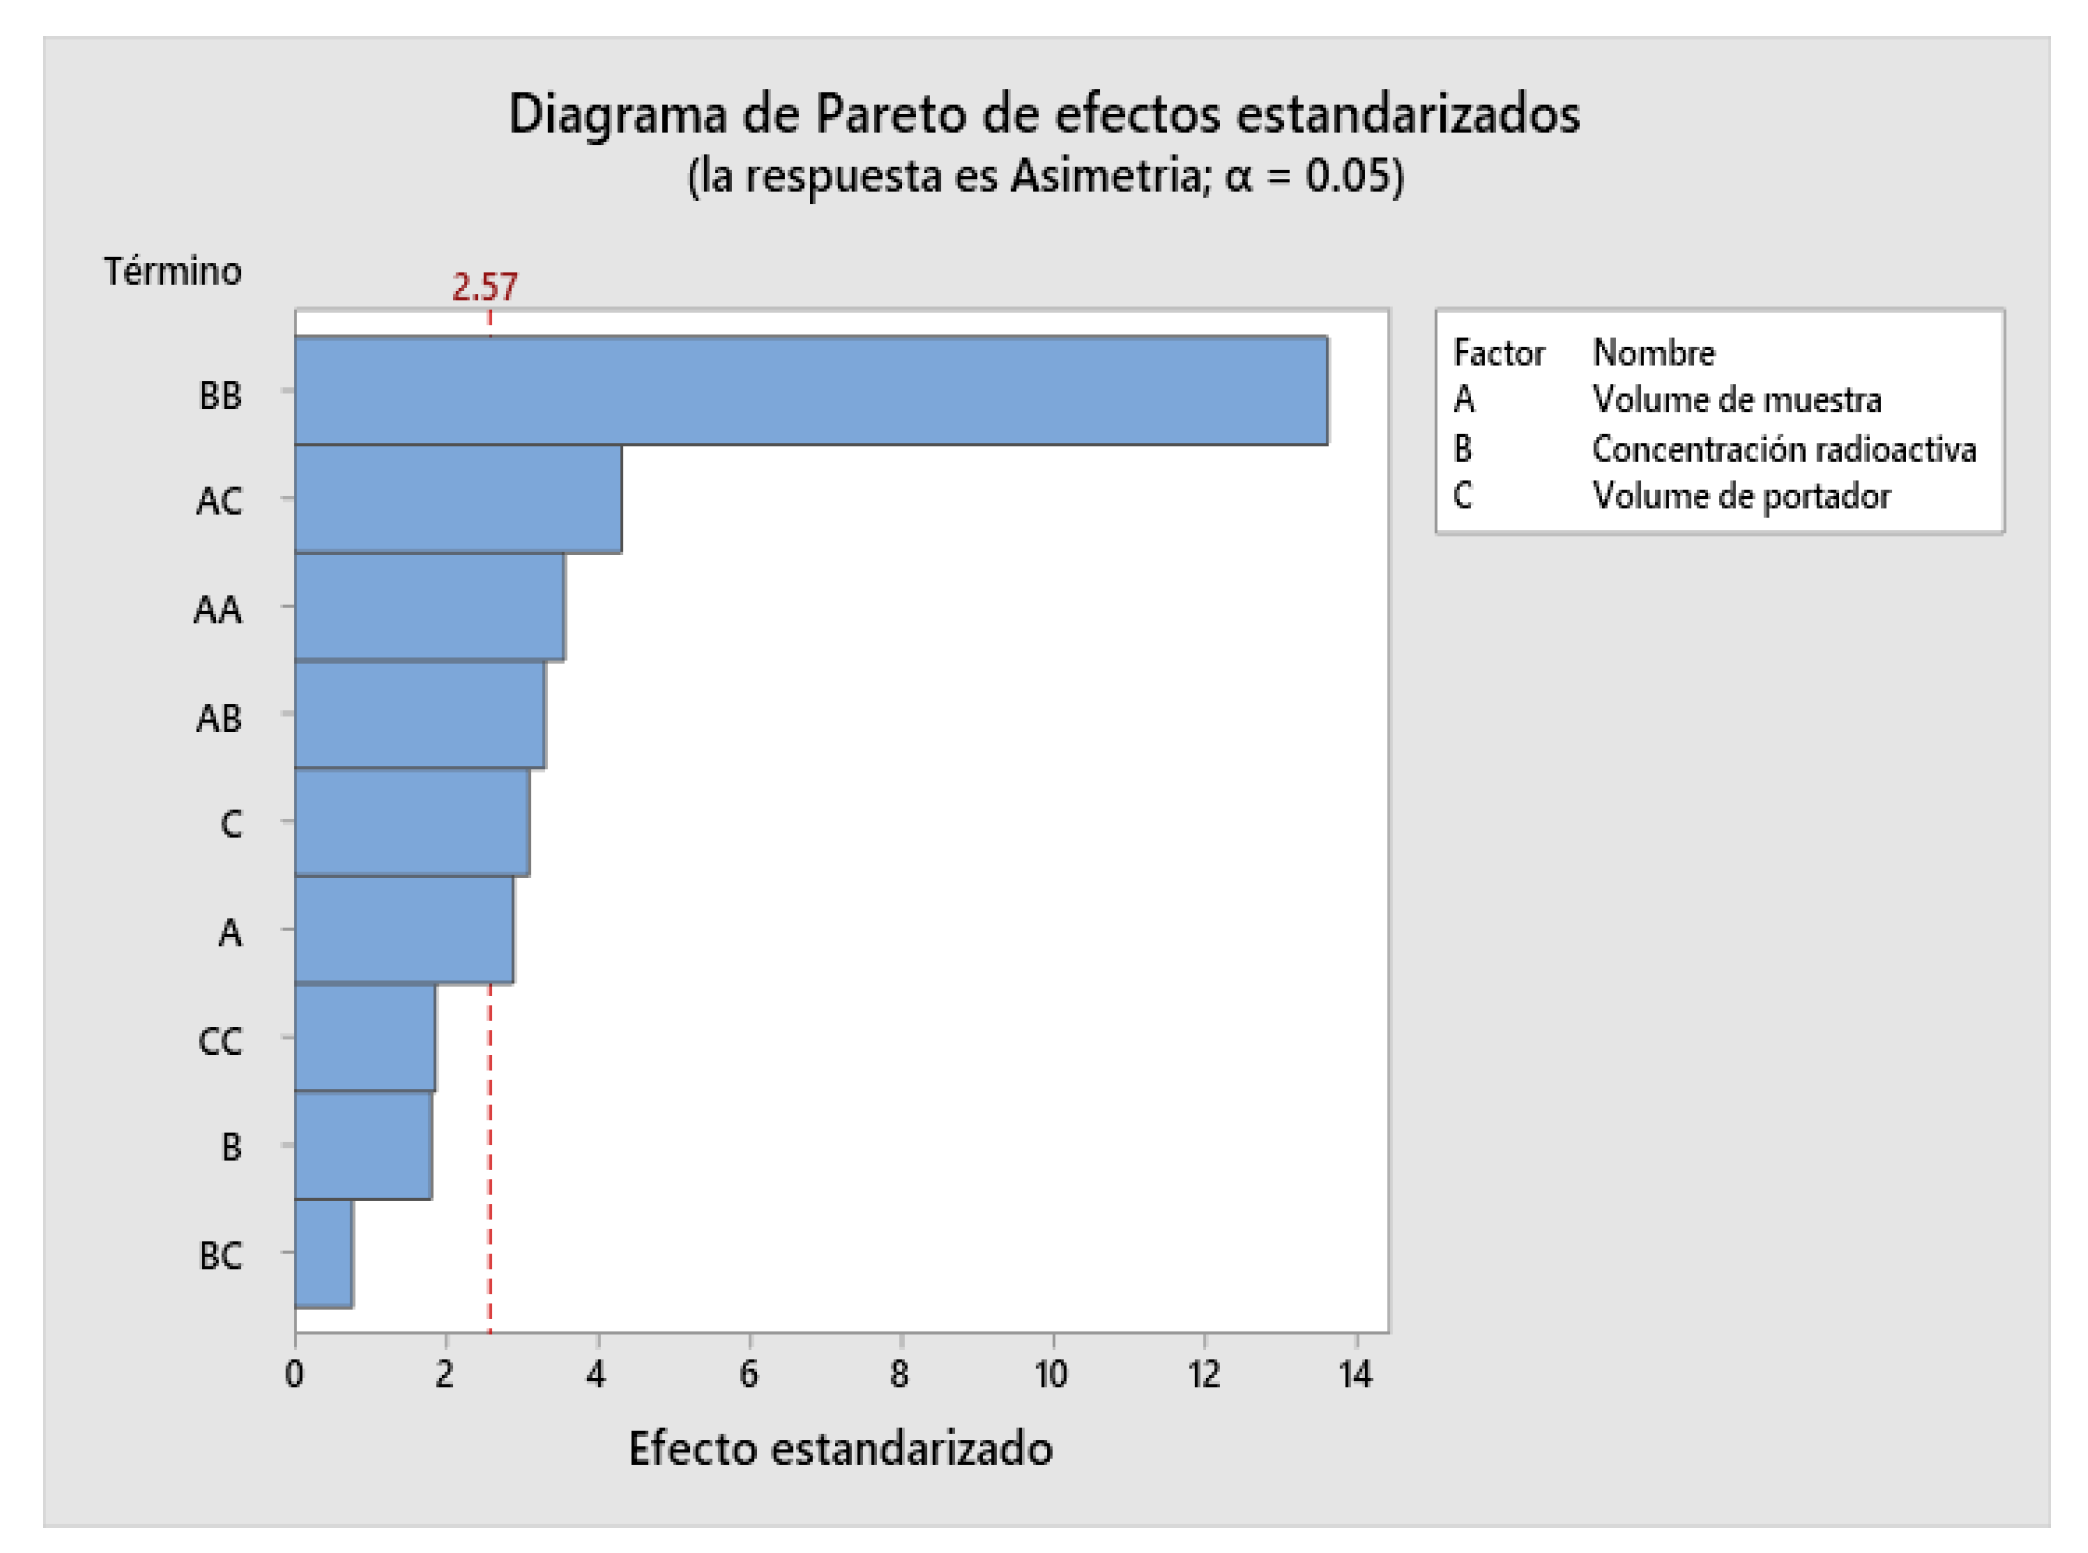
Figure 4.
Fitted plot for standardized effects for Accounts.
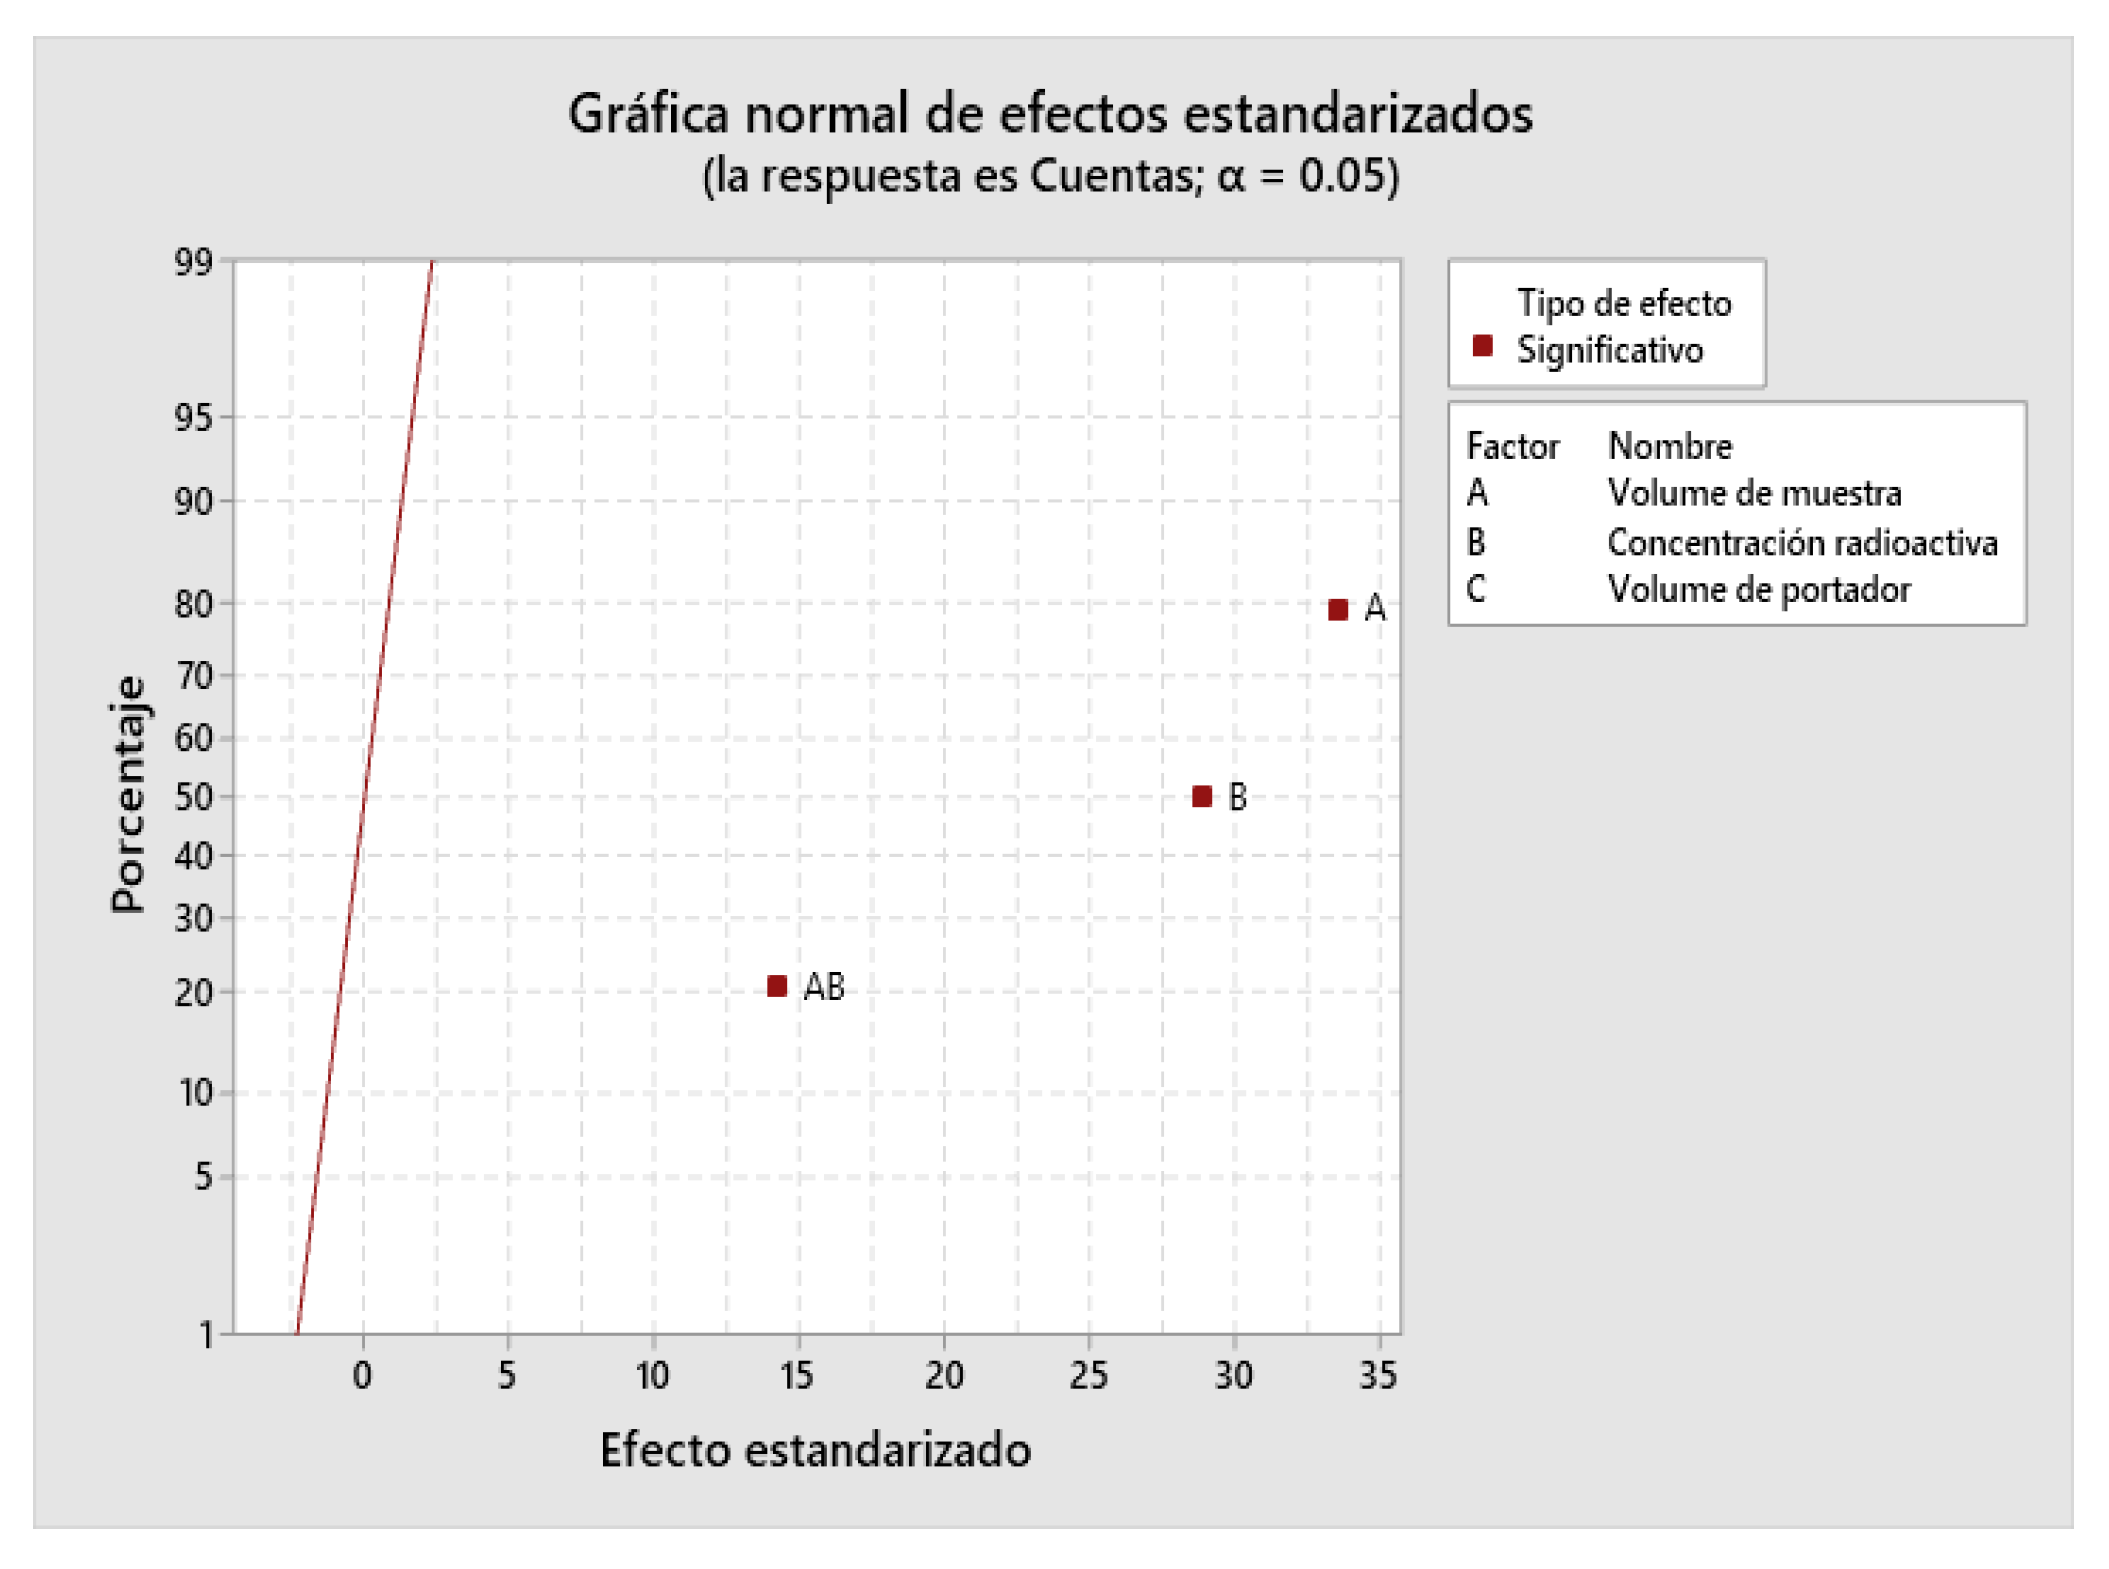
Figure 5.
Adjusted plot for standardized effects for Asymmetry.
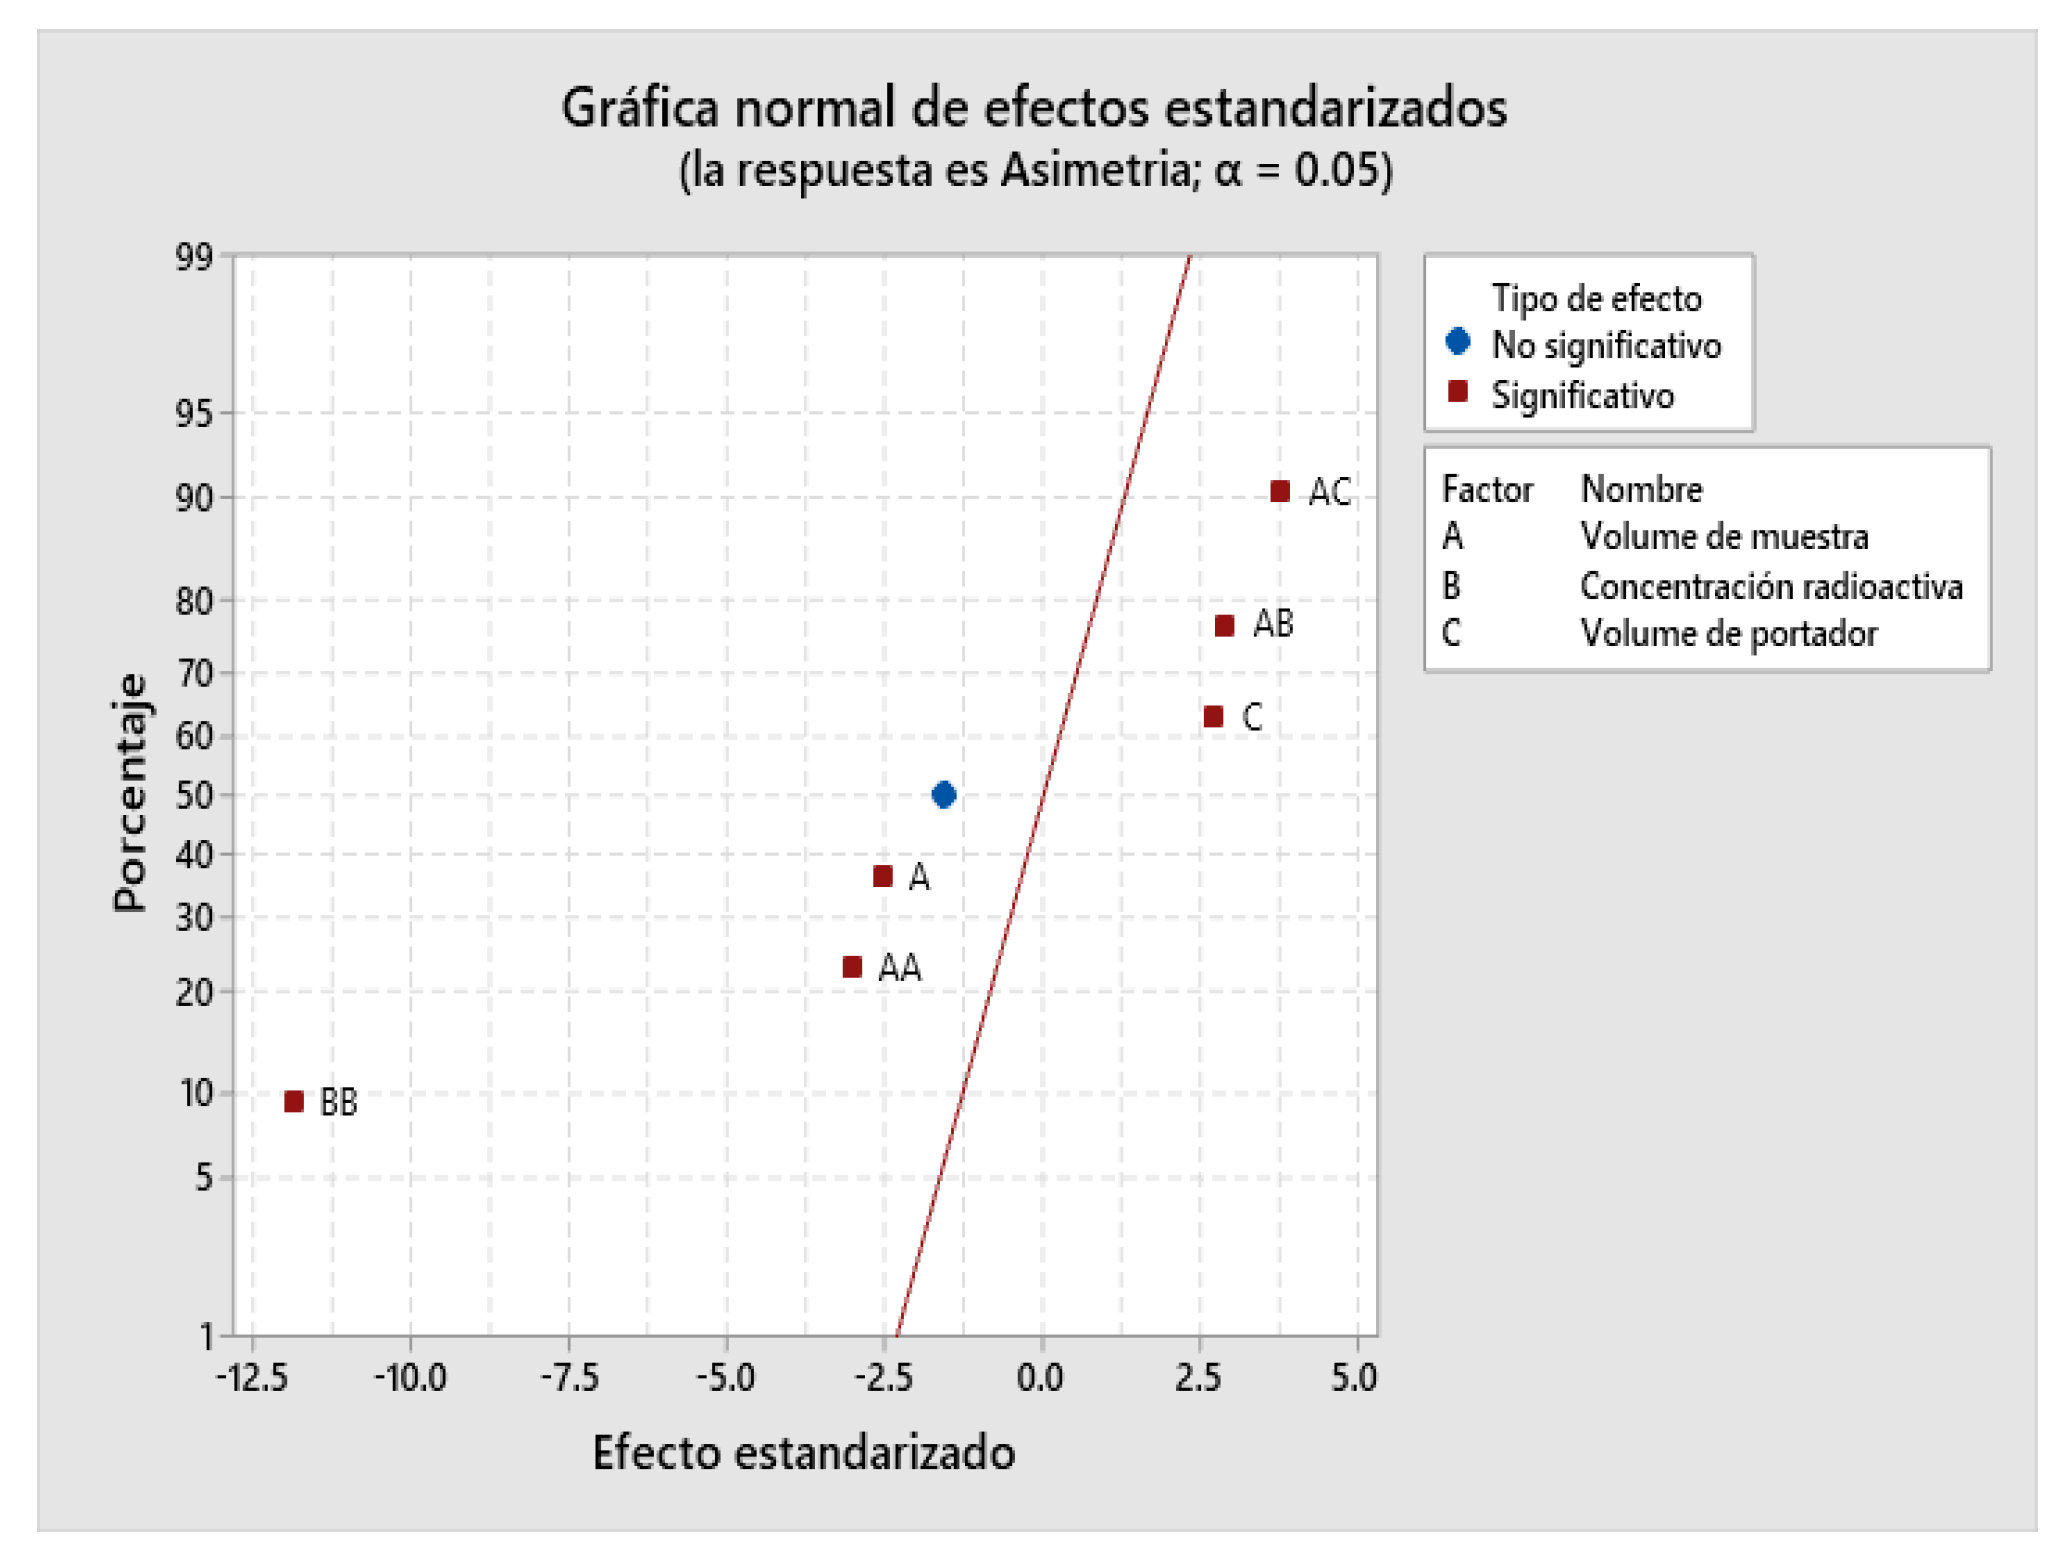
Figure 6.
Residual Plot for Asymmetry.
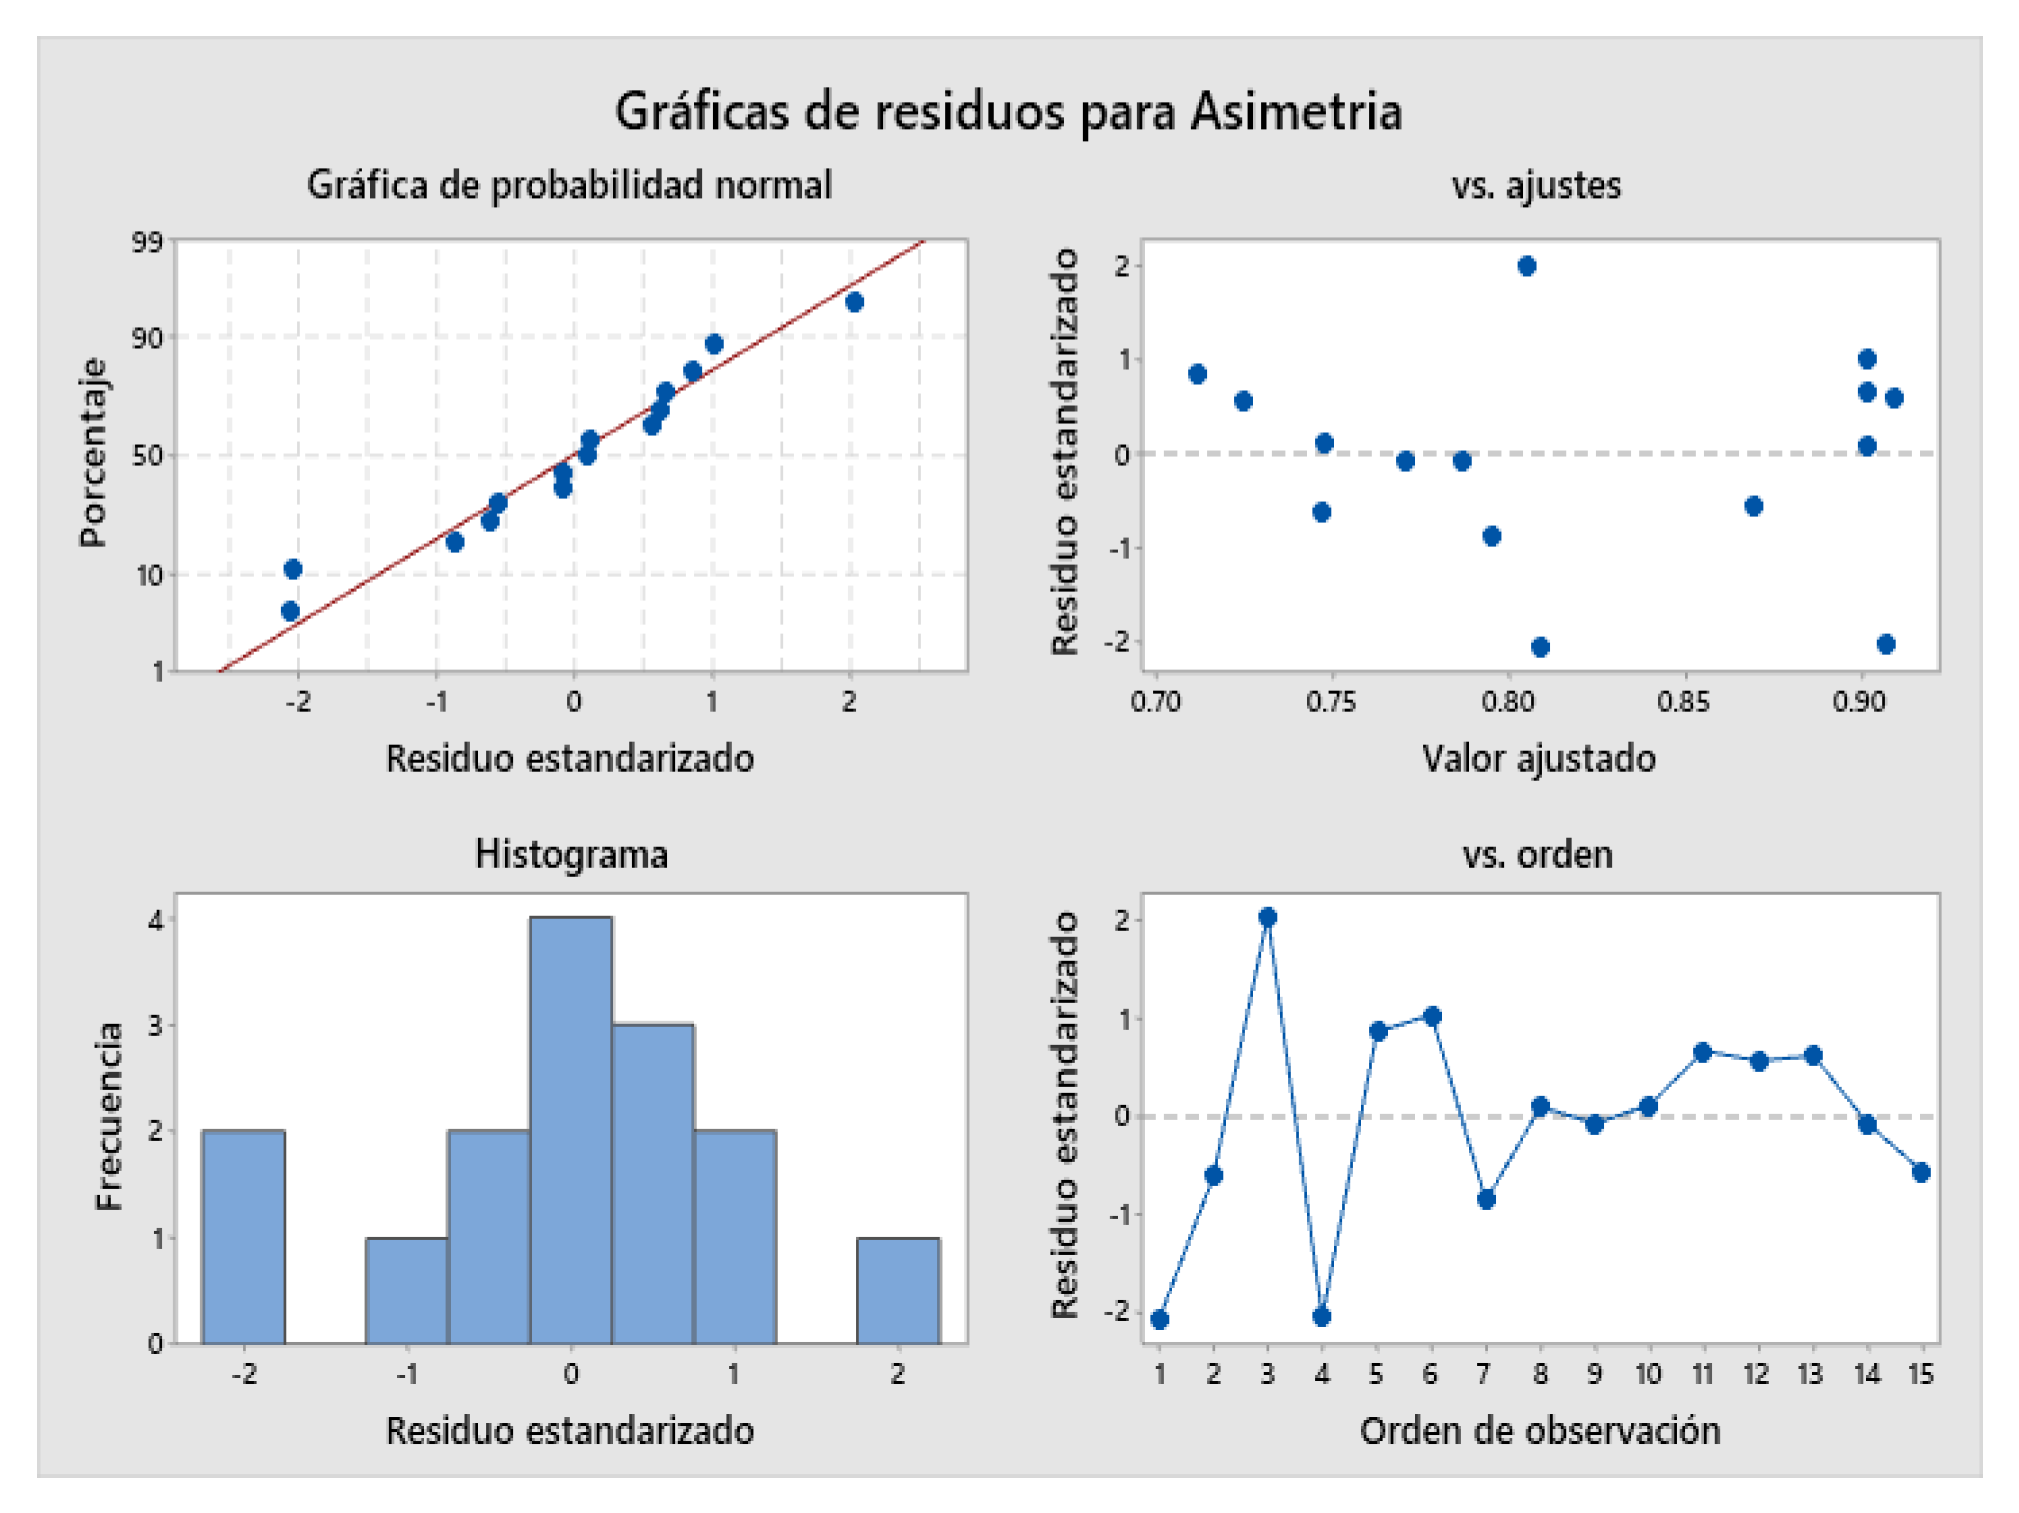
Figure 7.
Contour Plot for Counts.
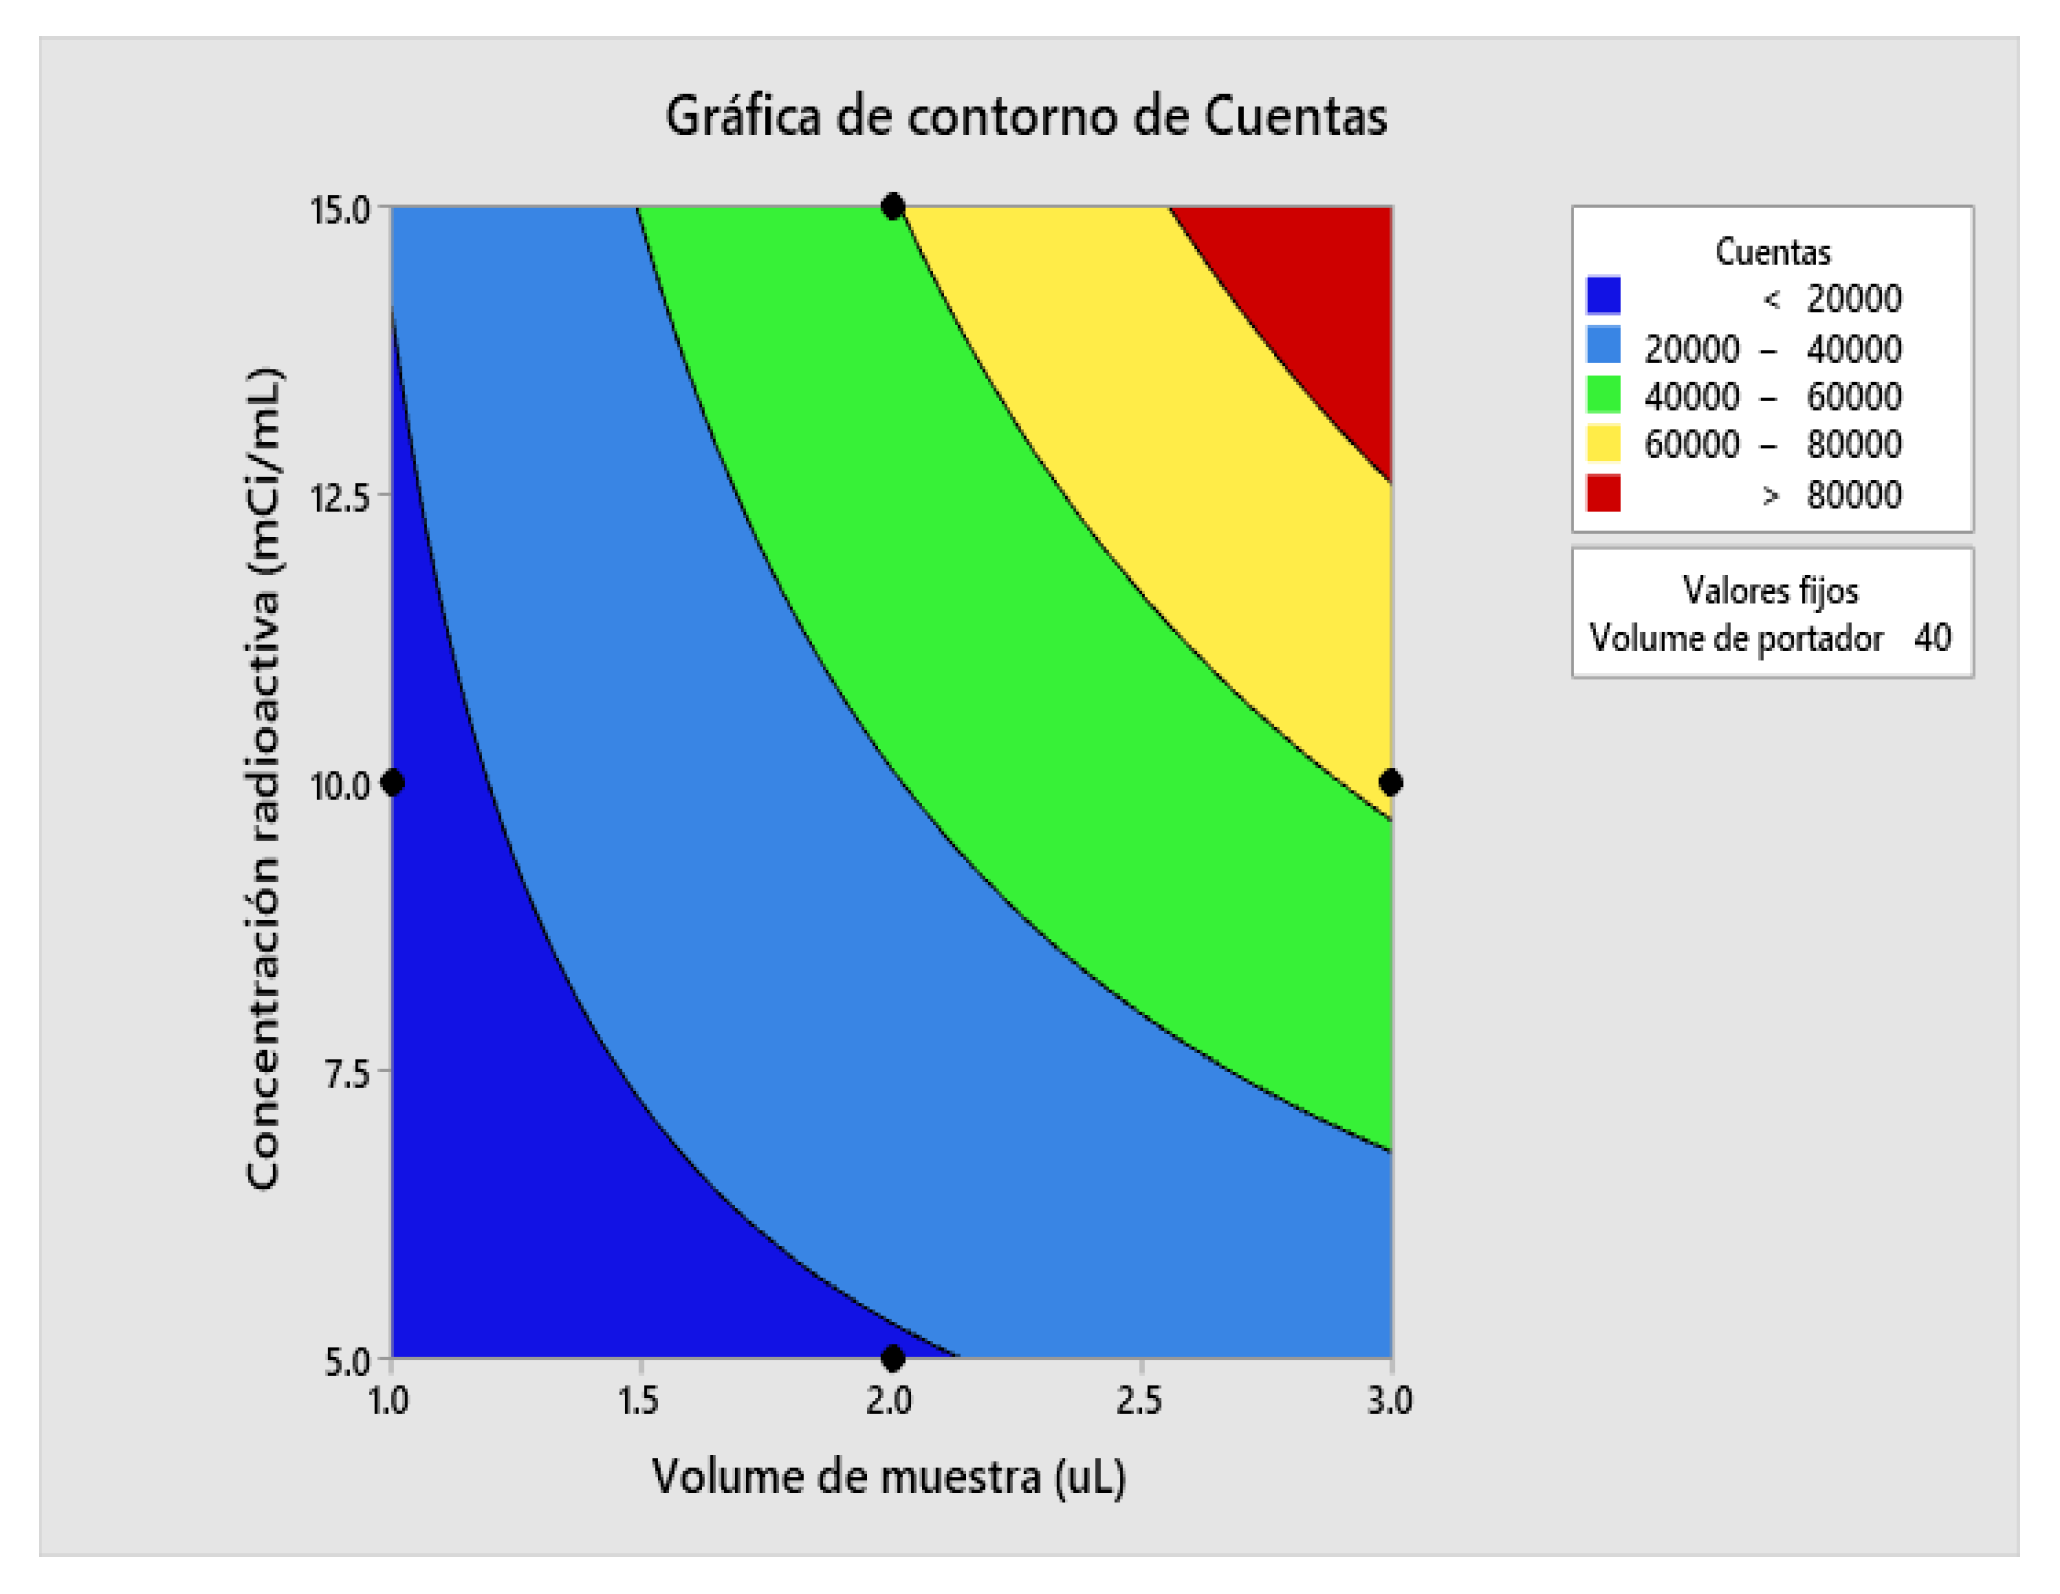
Figure 8.
Surface chart for Counts.
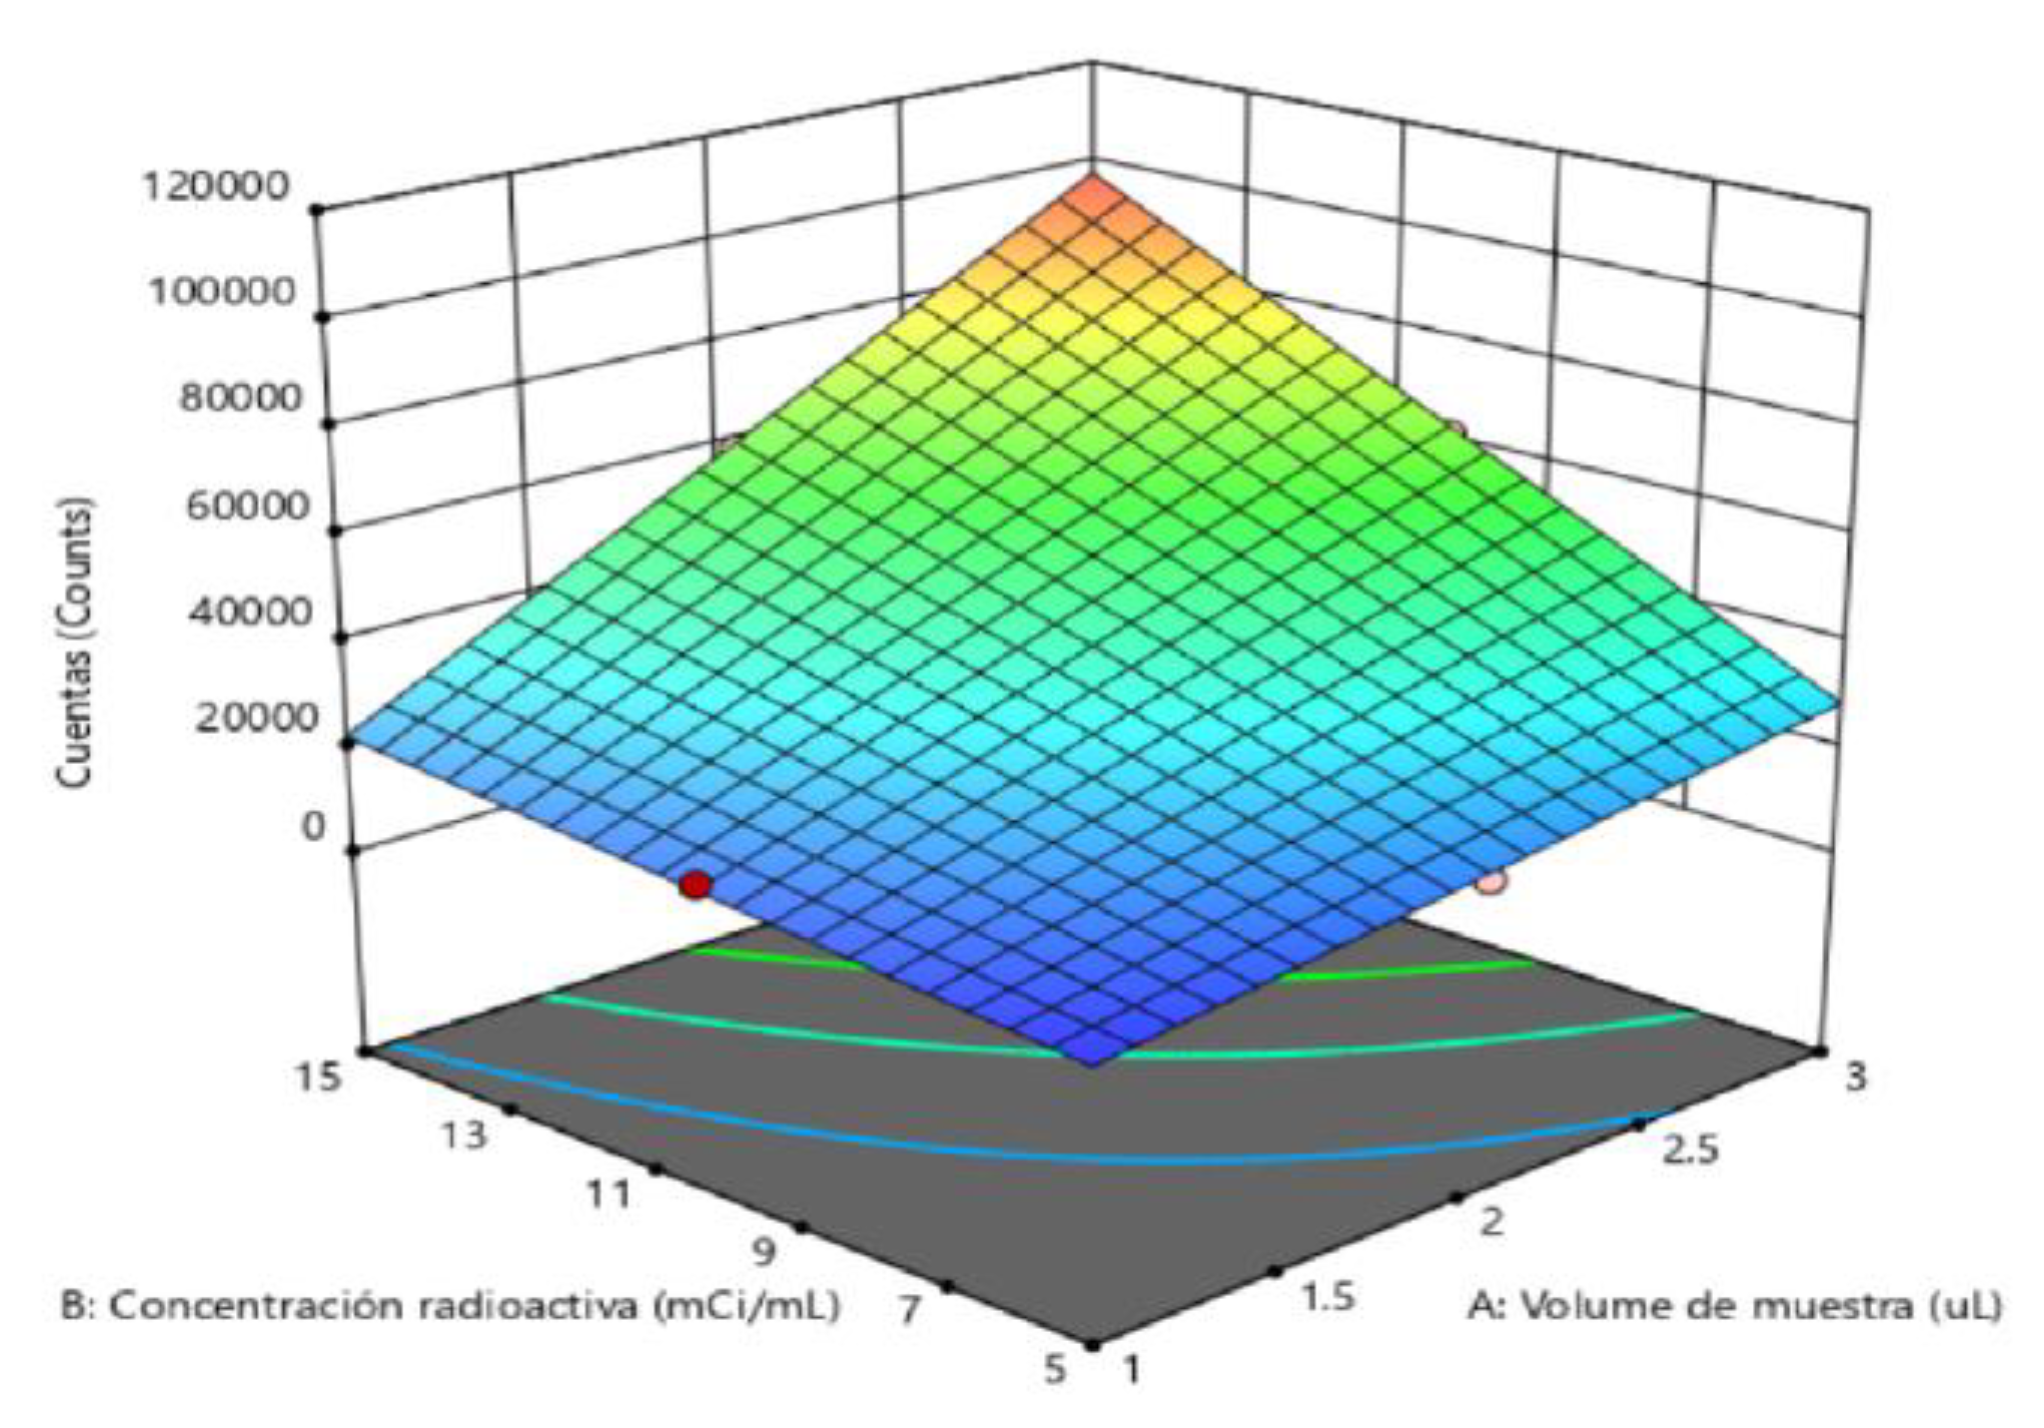
Figure 9.
Contour Plot for Asymmetry.
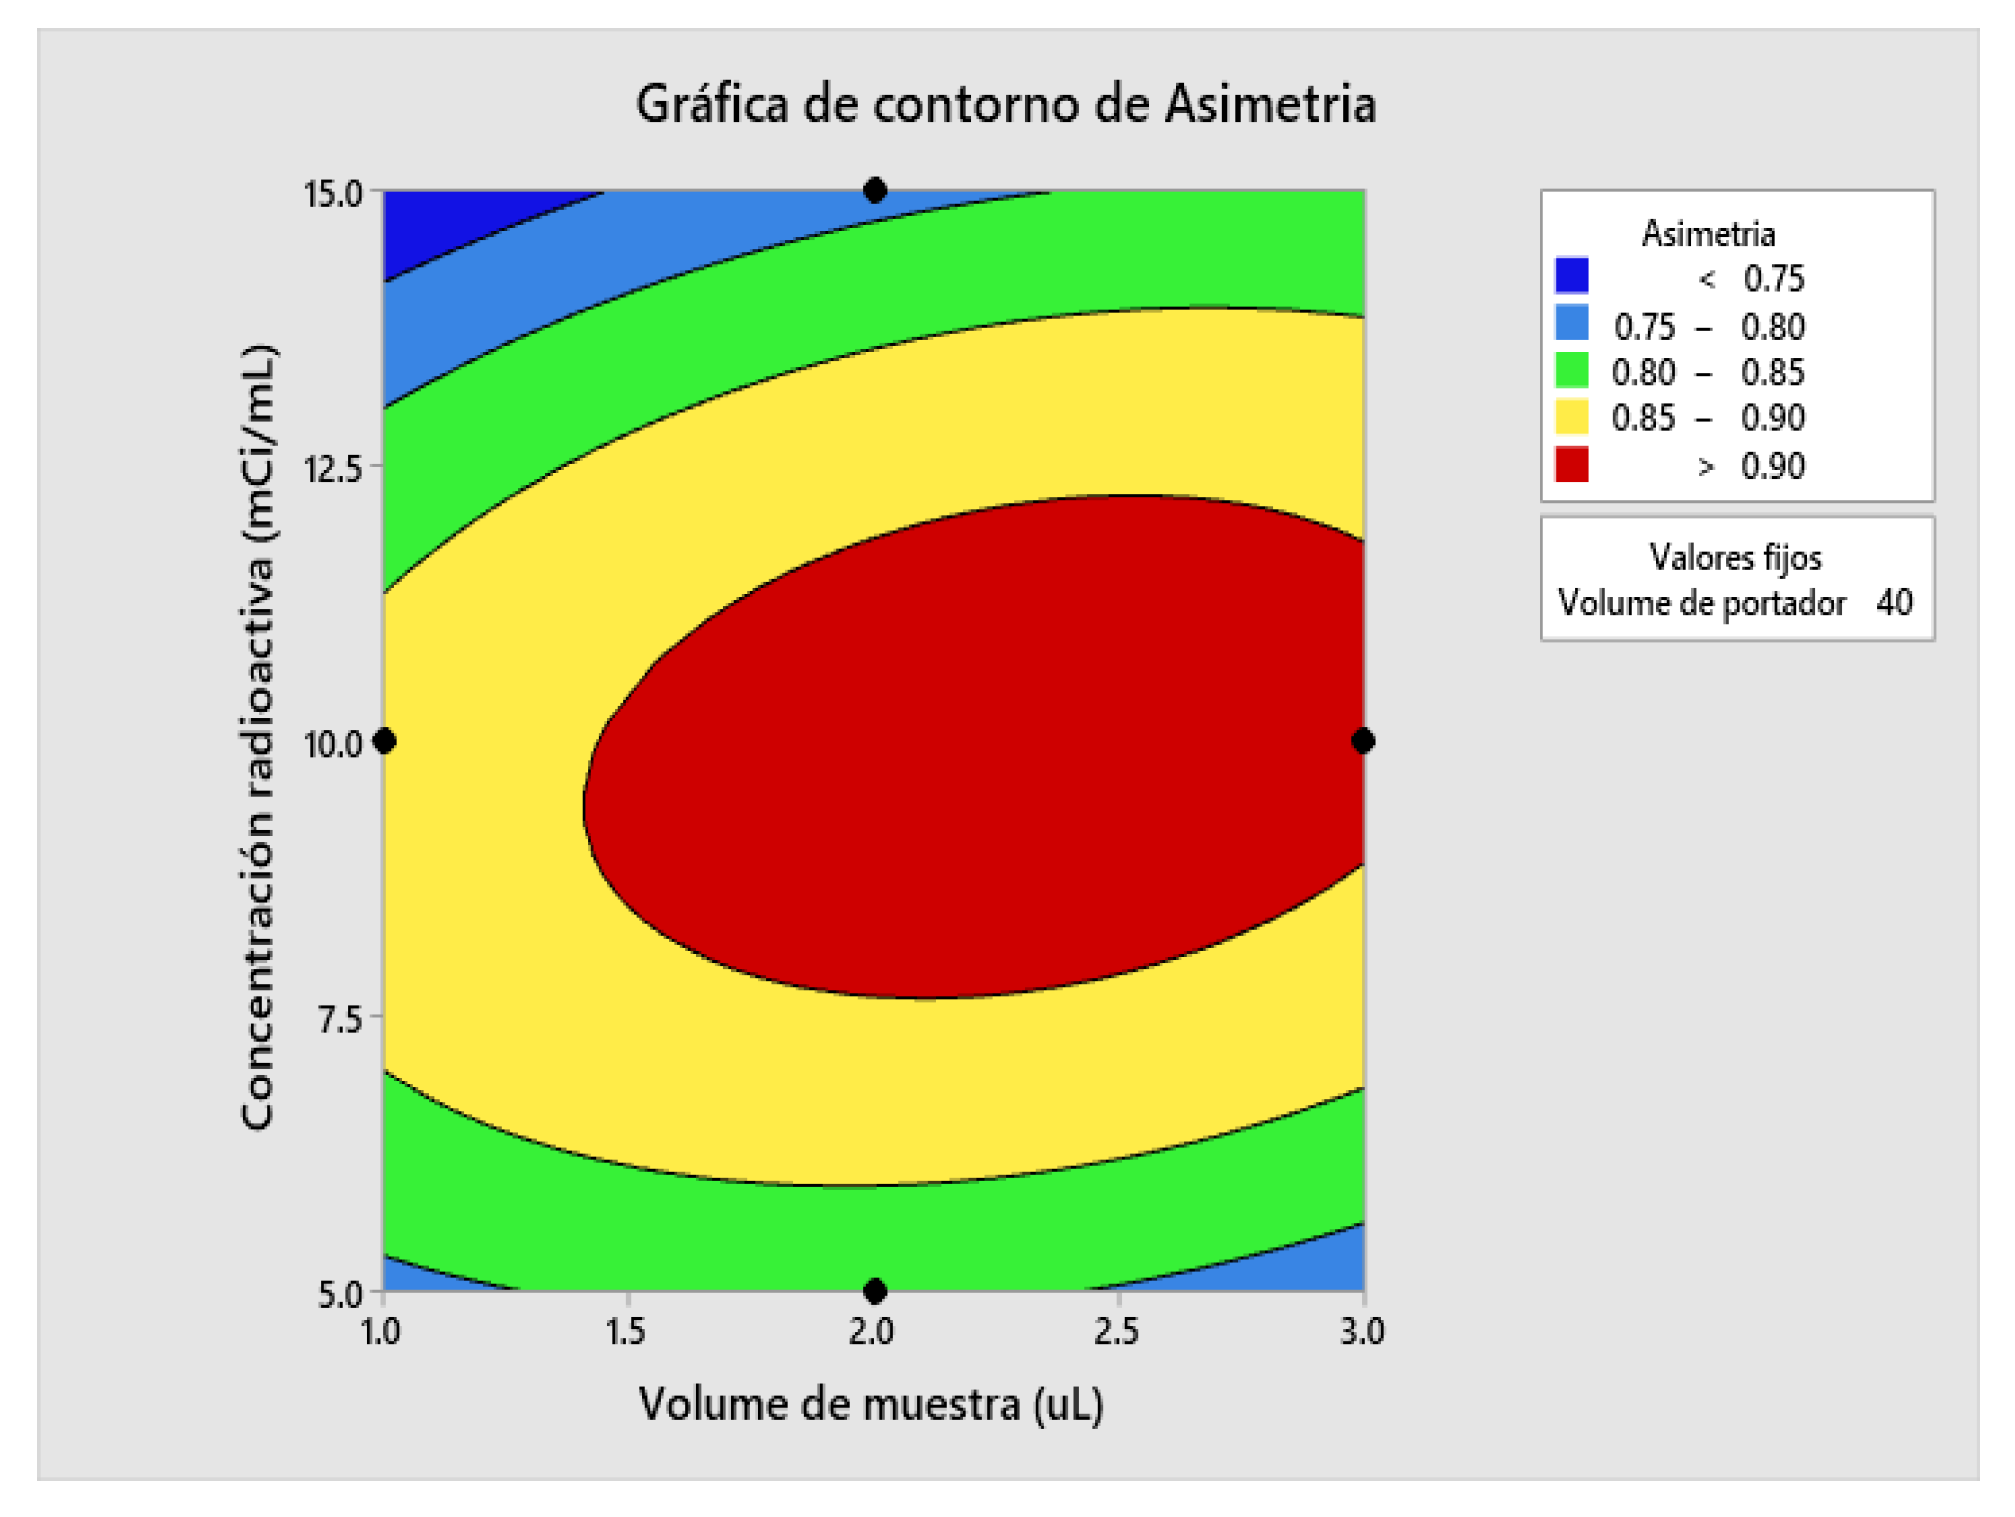
Figure 10.
Surface Plot for Asymmetry.
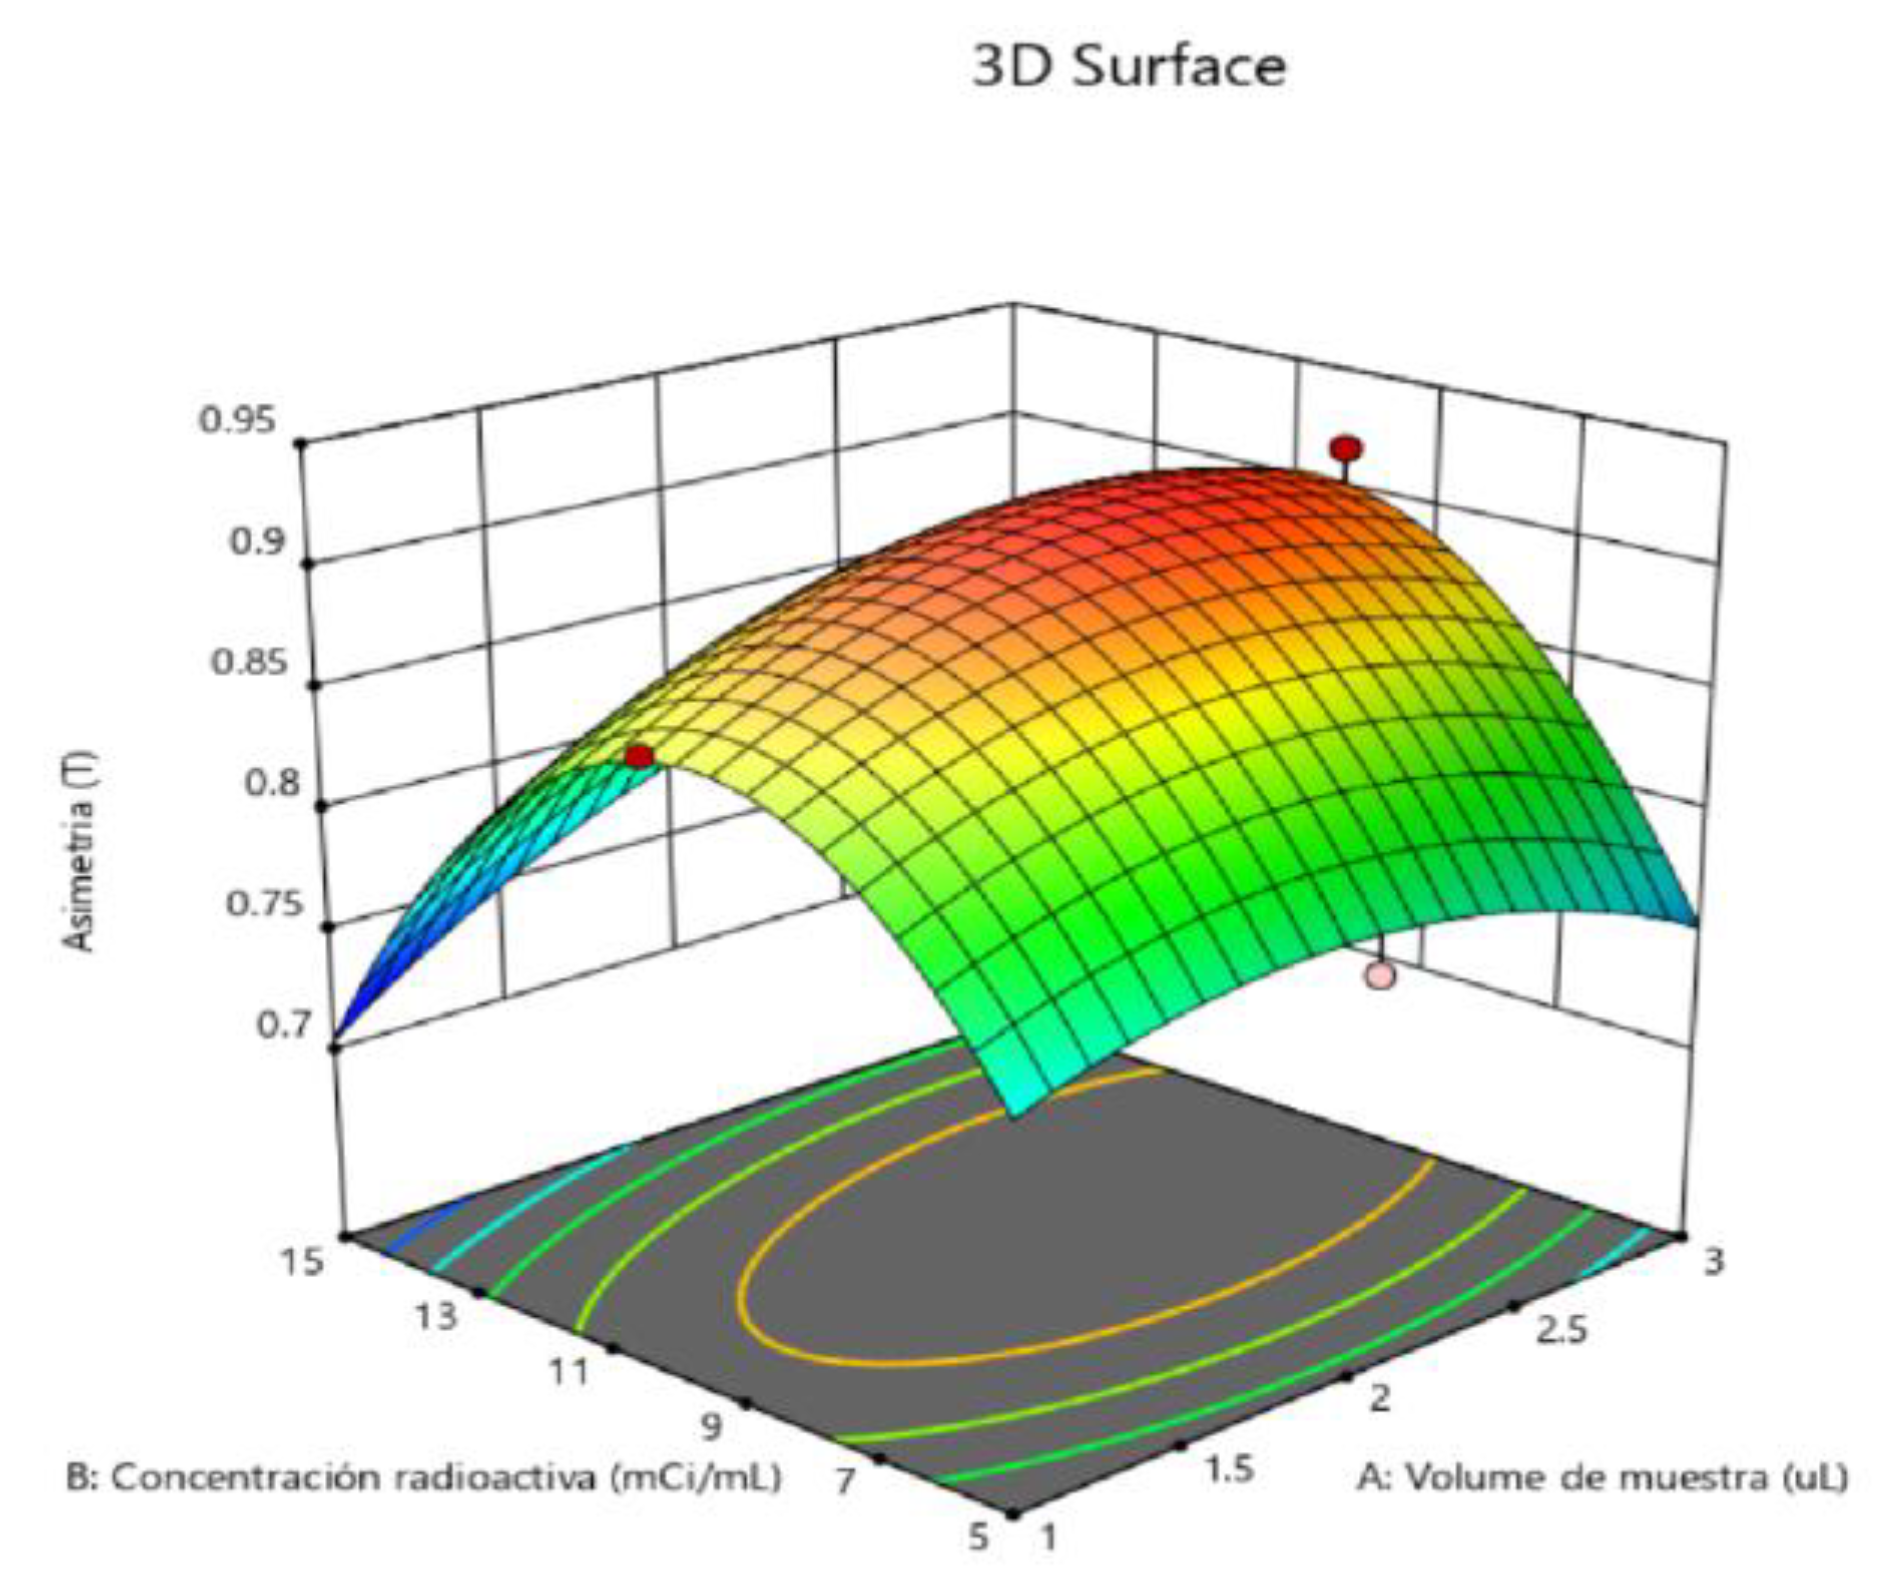
Figure 11.
Response Optimizer 131I.
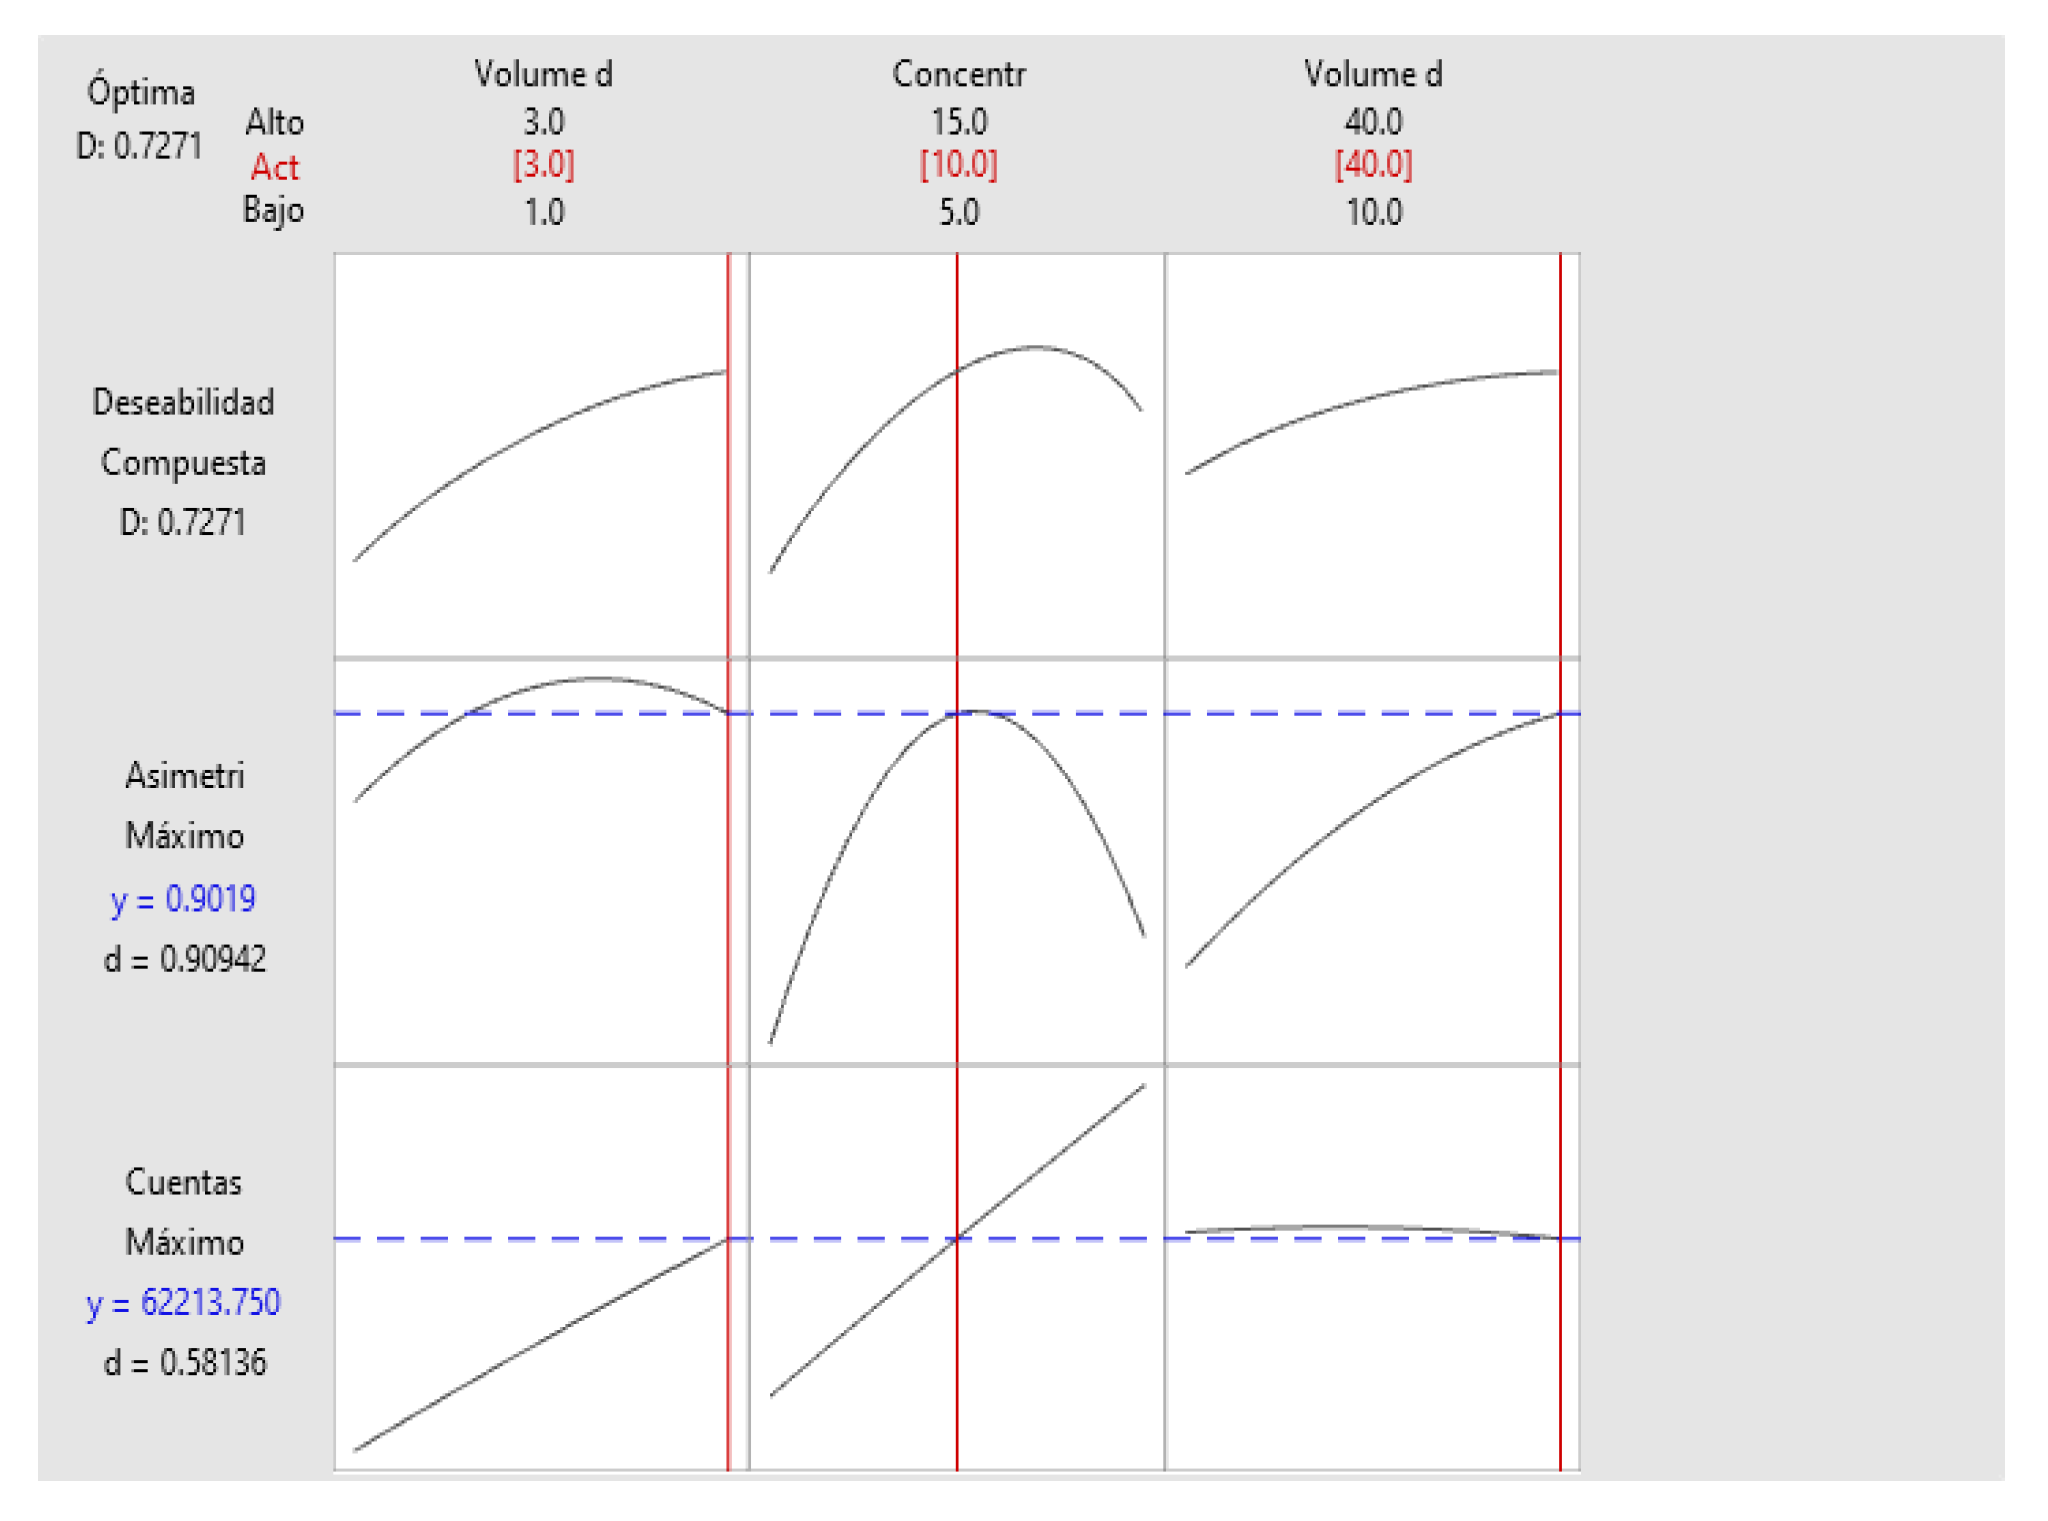
Figure 12.
131I Graphical Optimization.
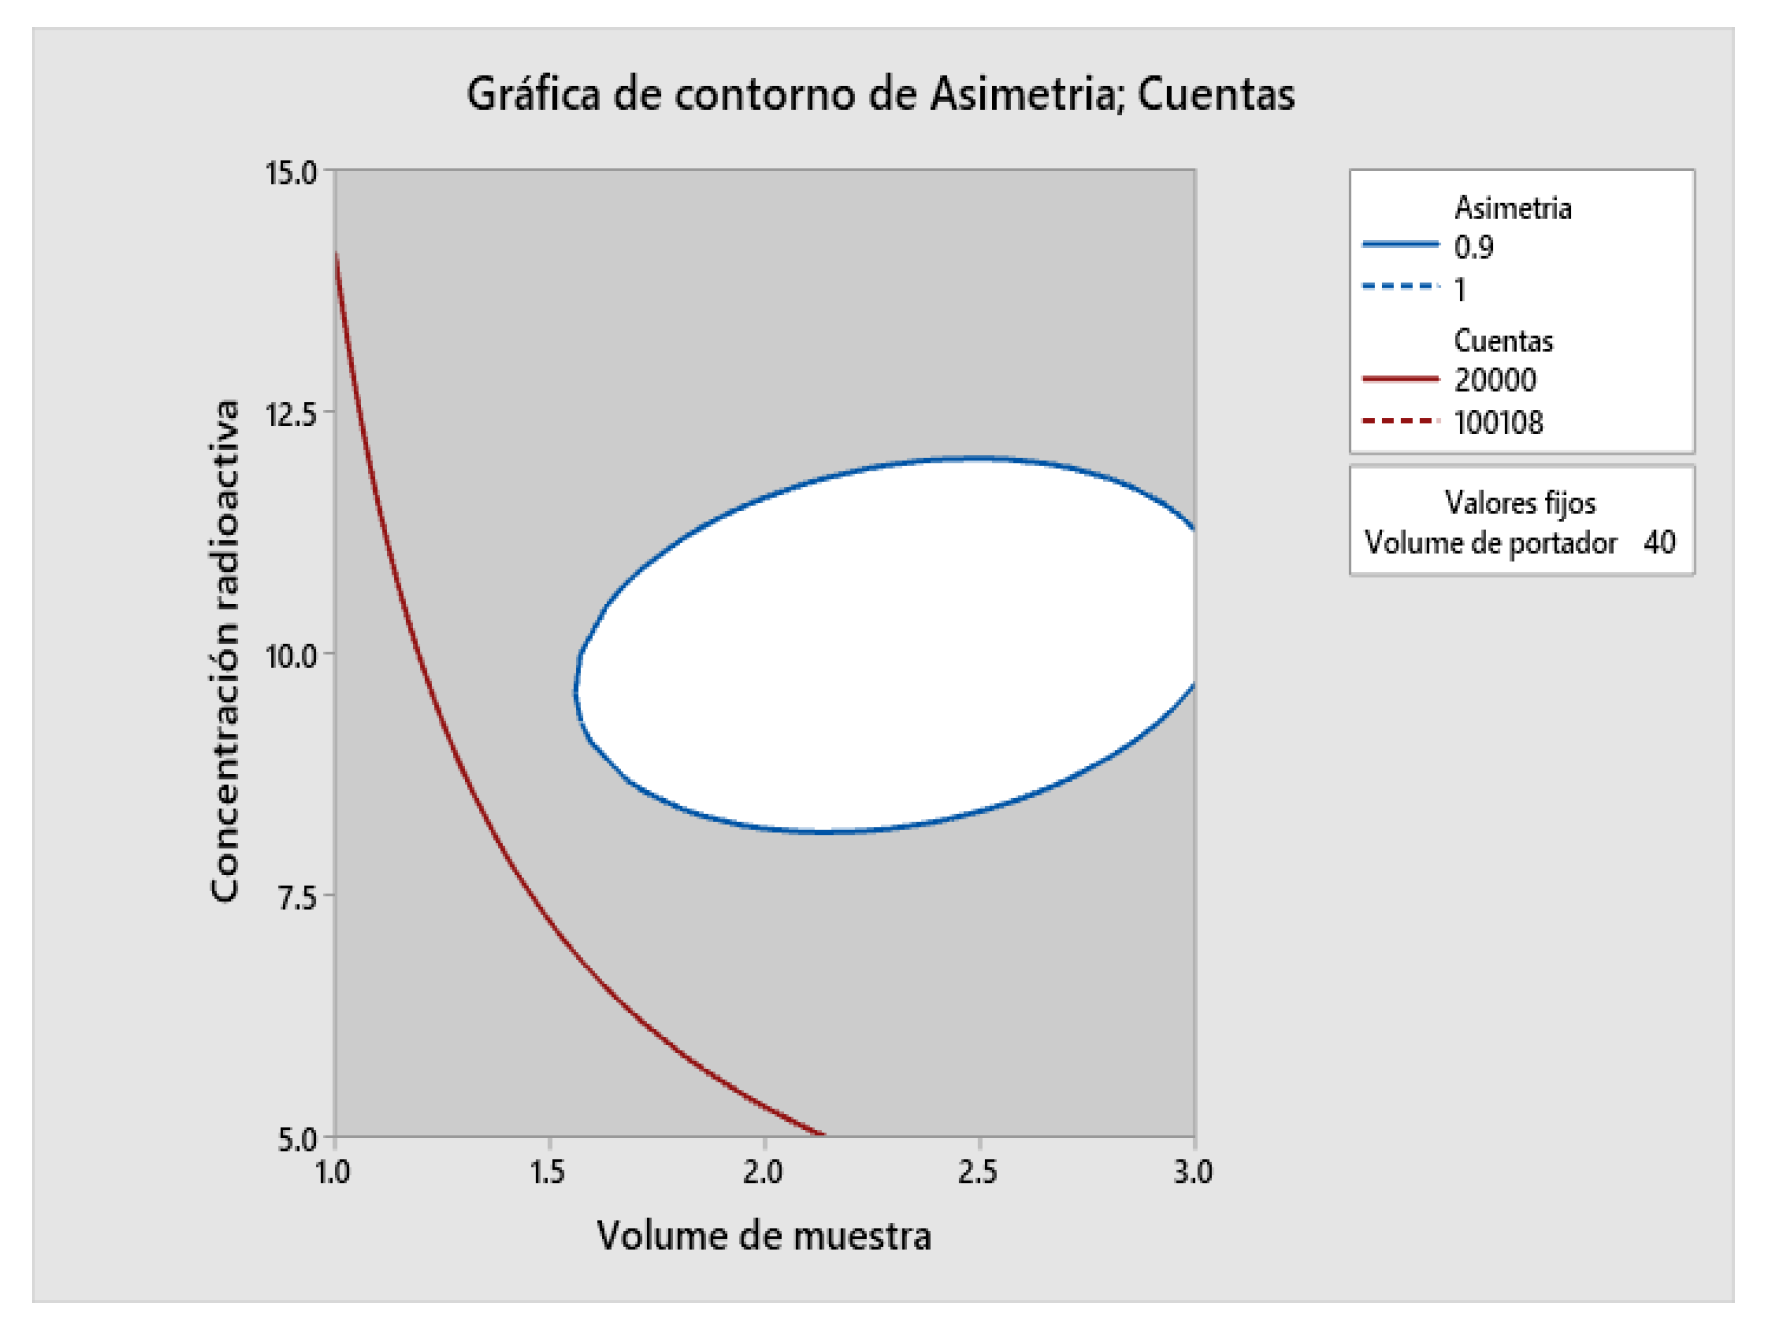
Figure 13.
TLC-Scanner chromatograms: Blank, 131I sample, radiochemical impurity (reduced): IO3-.
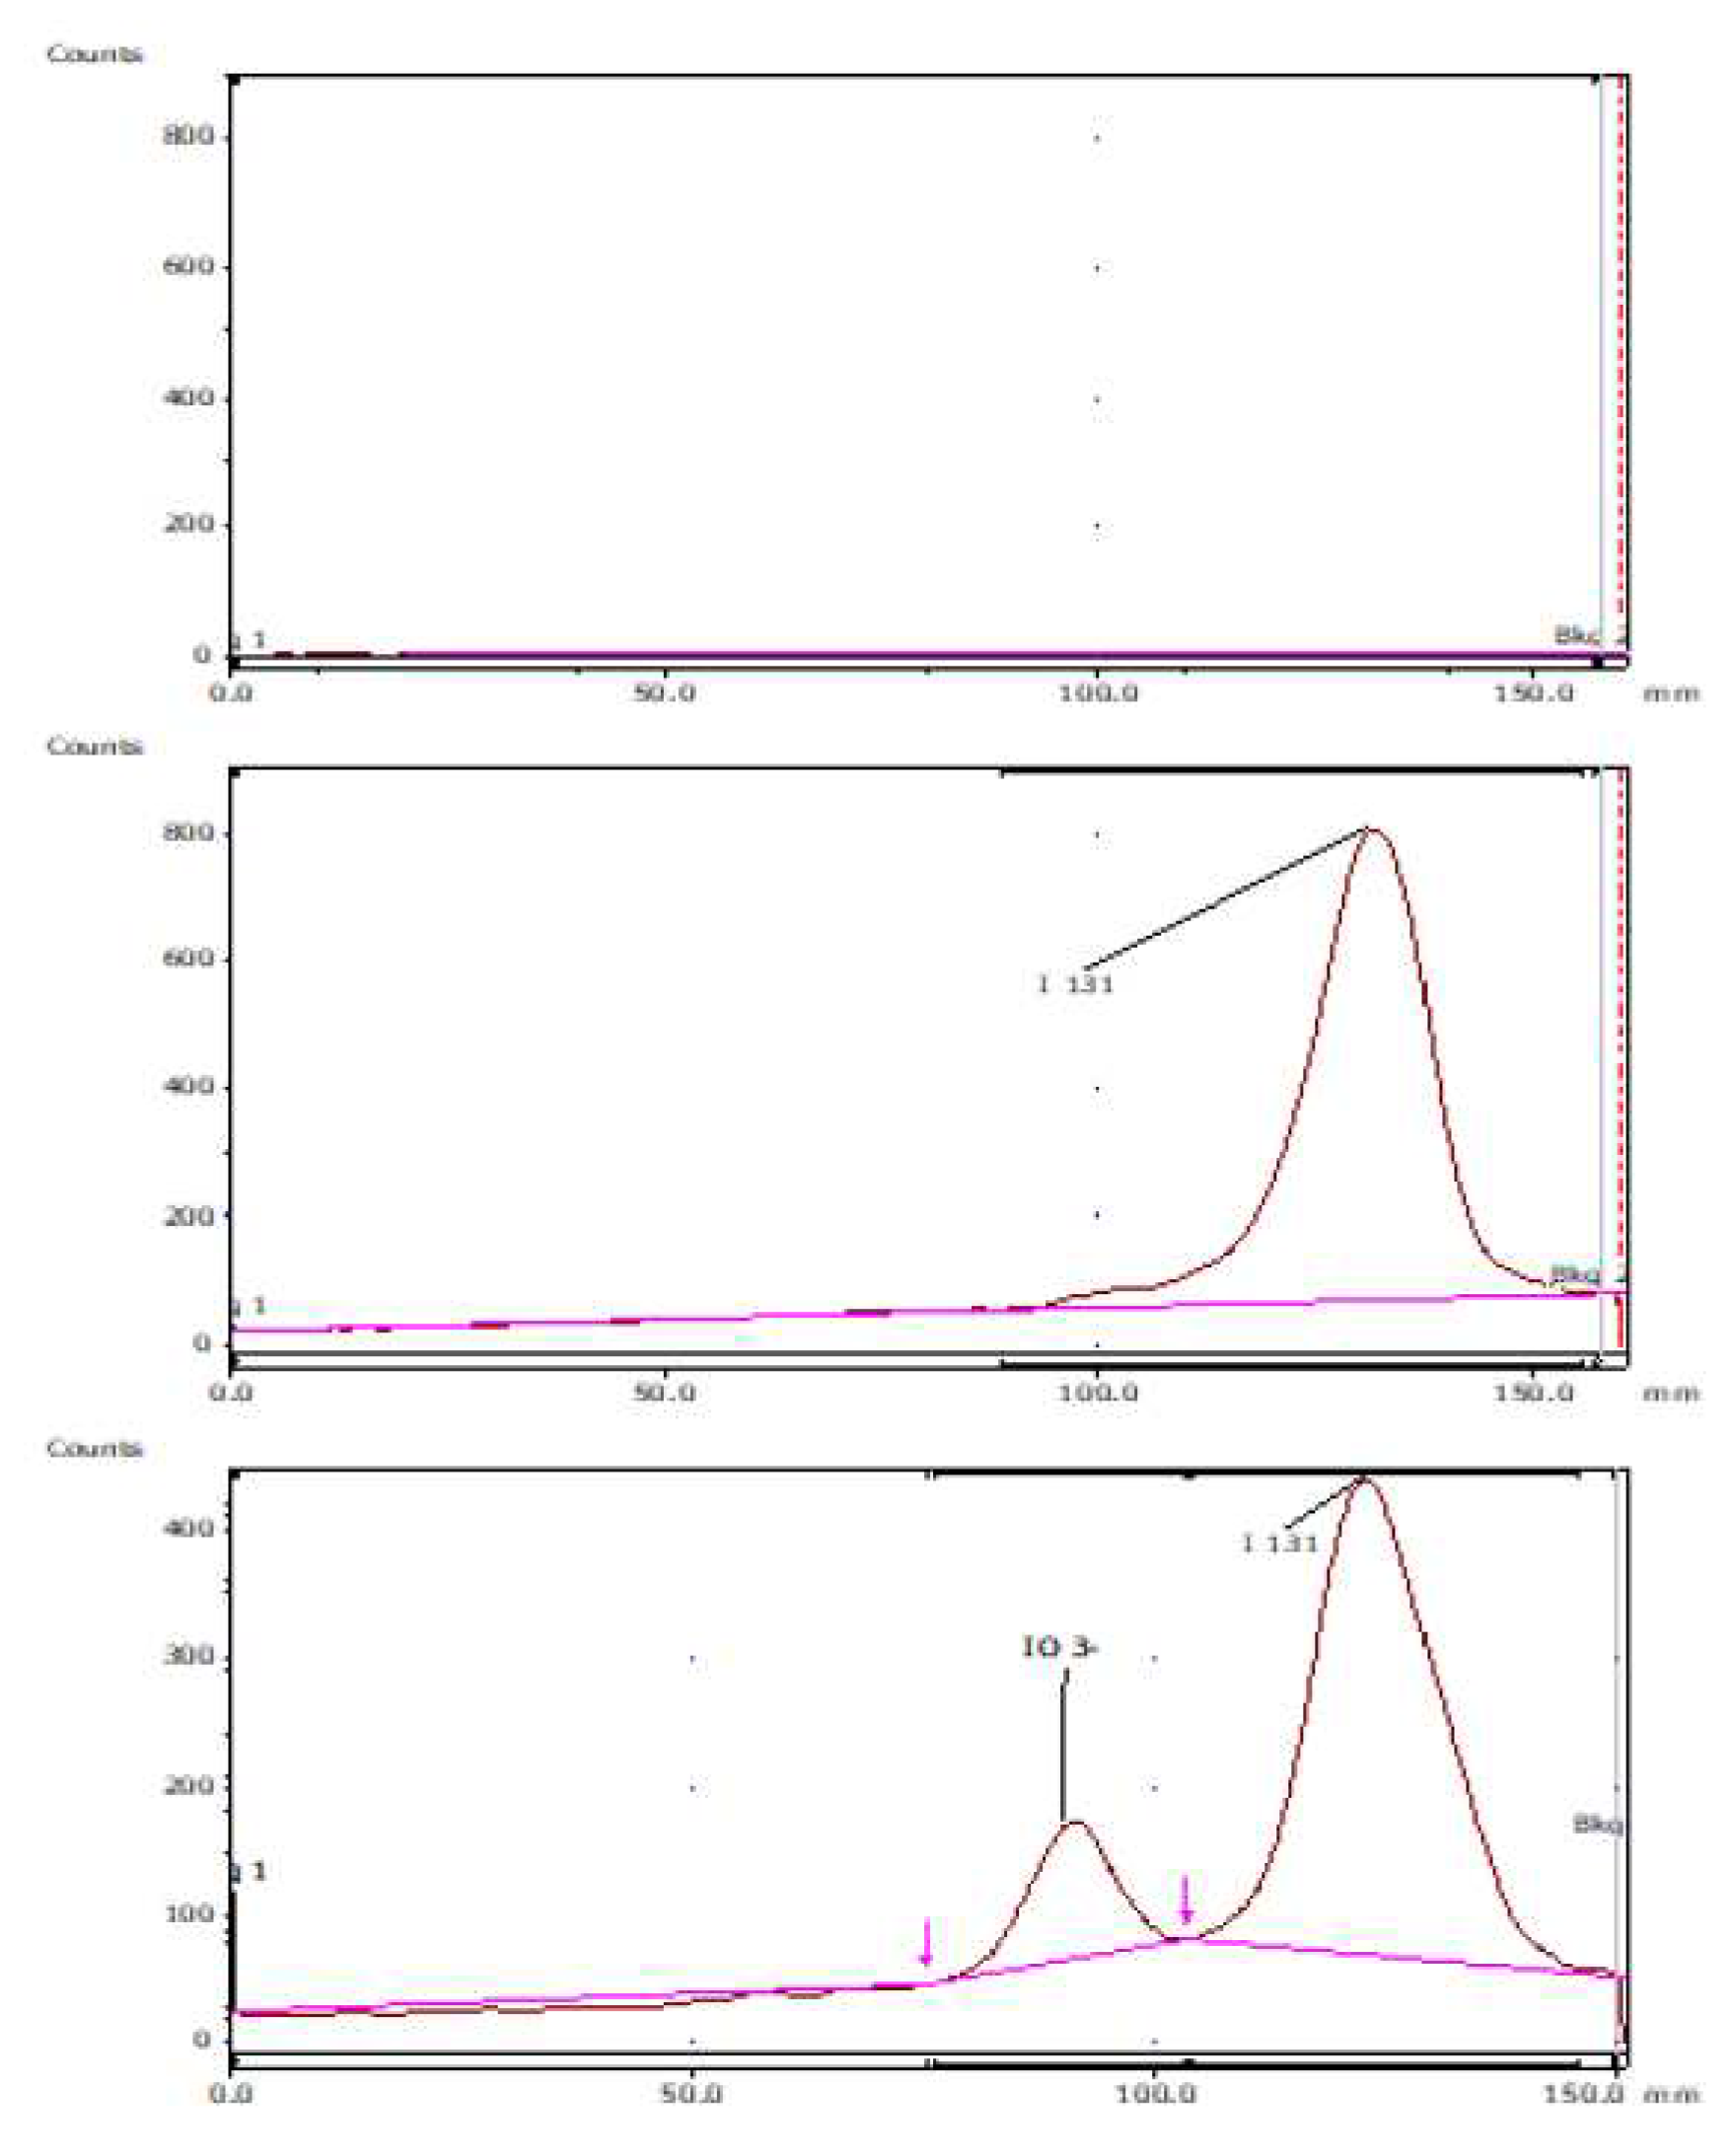
Figure 14.
Linearity 131I.
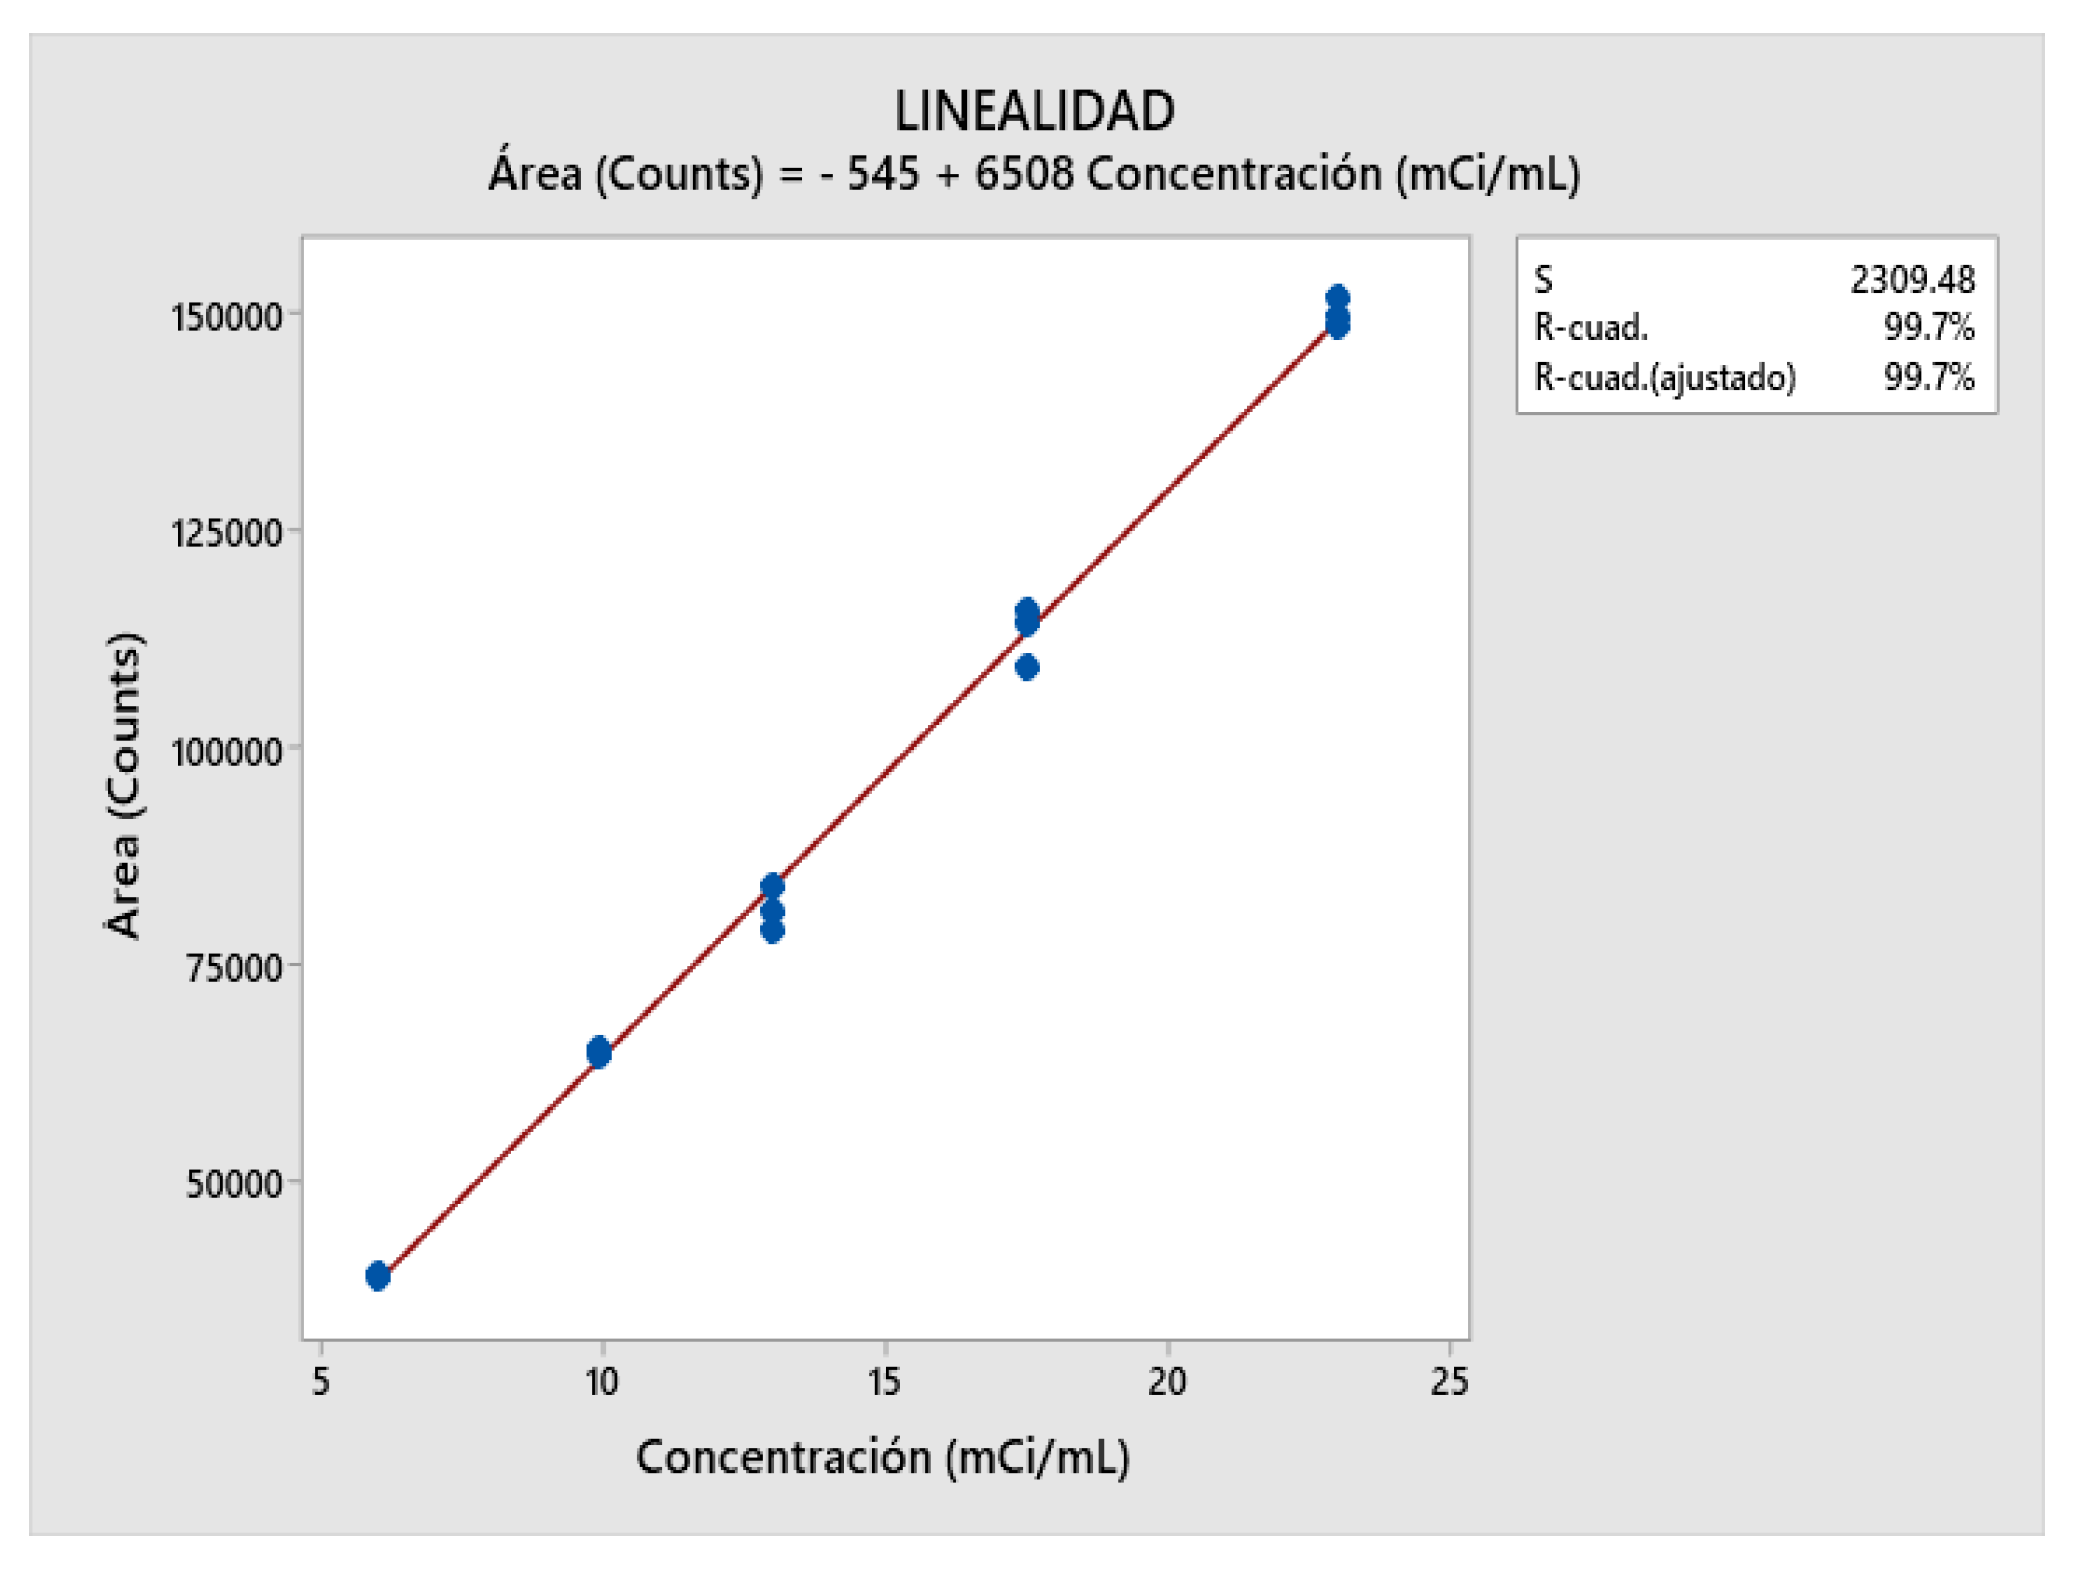
Figure 16.
131I Stability Box Plot.
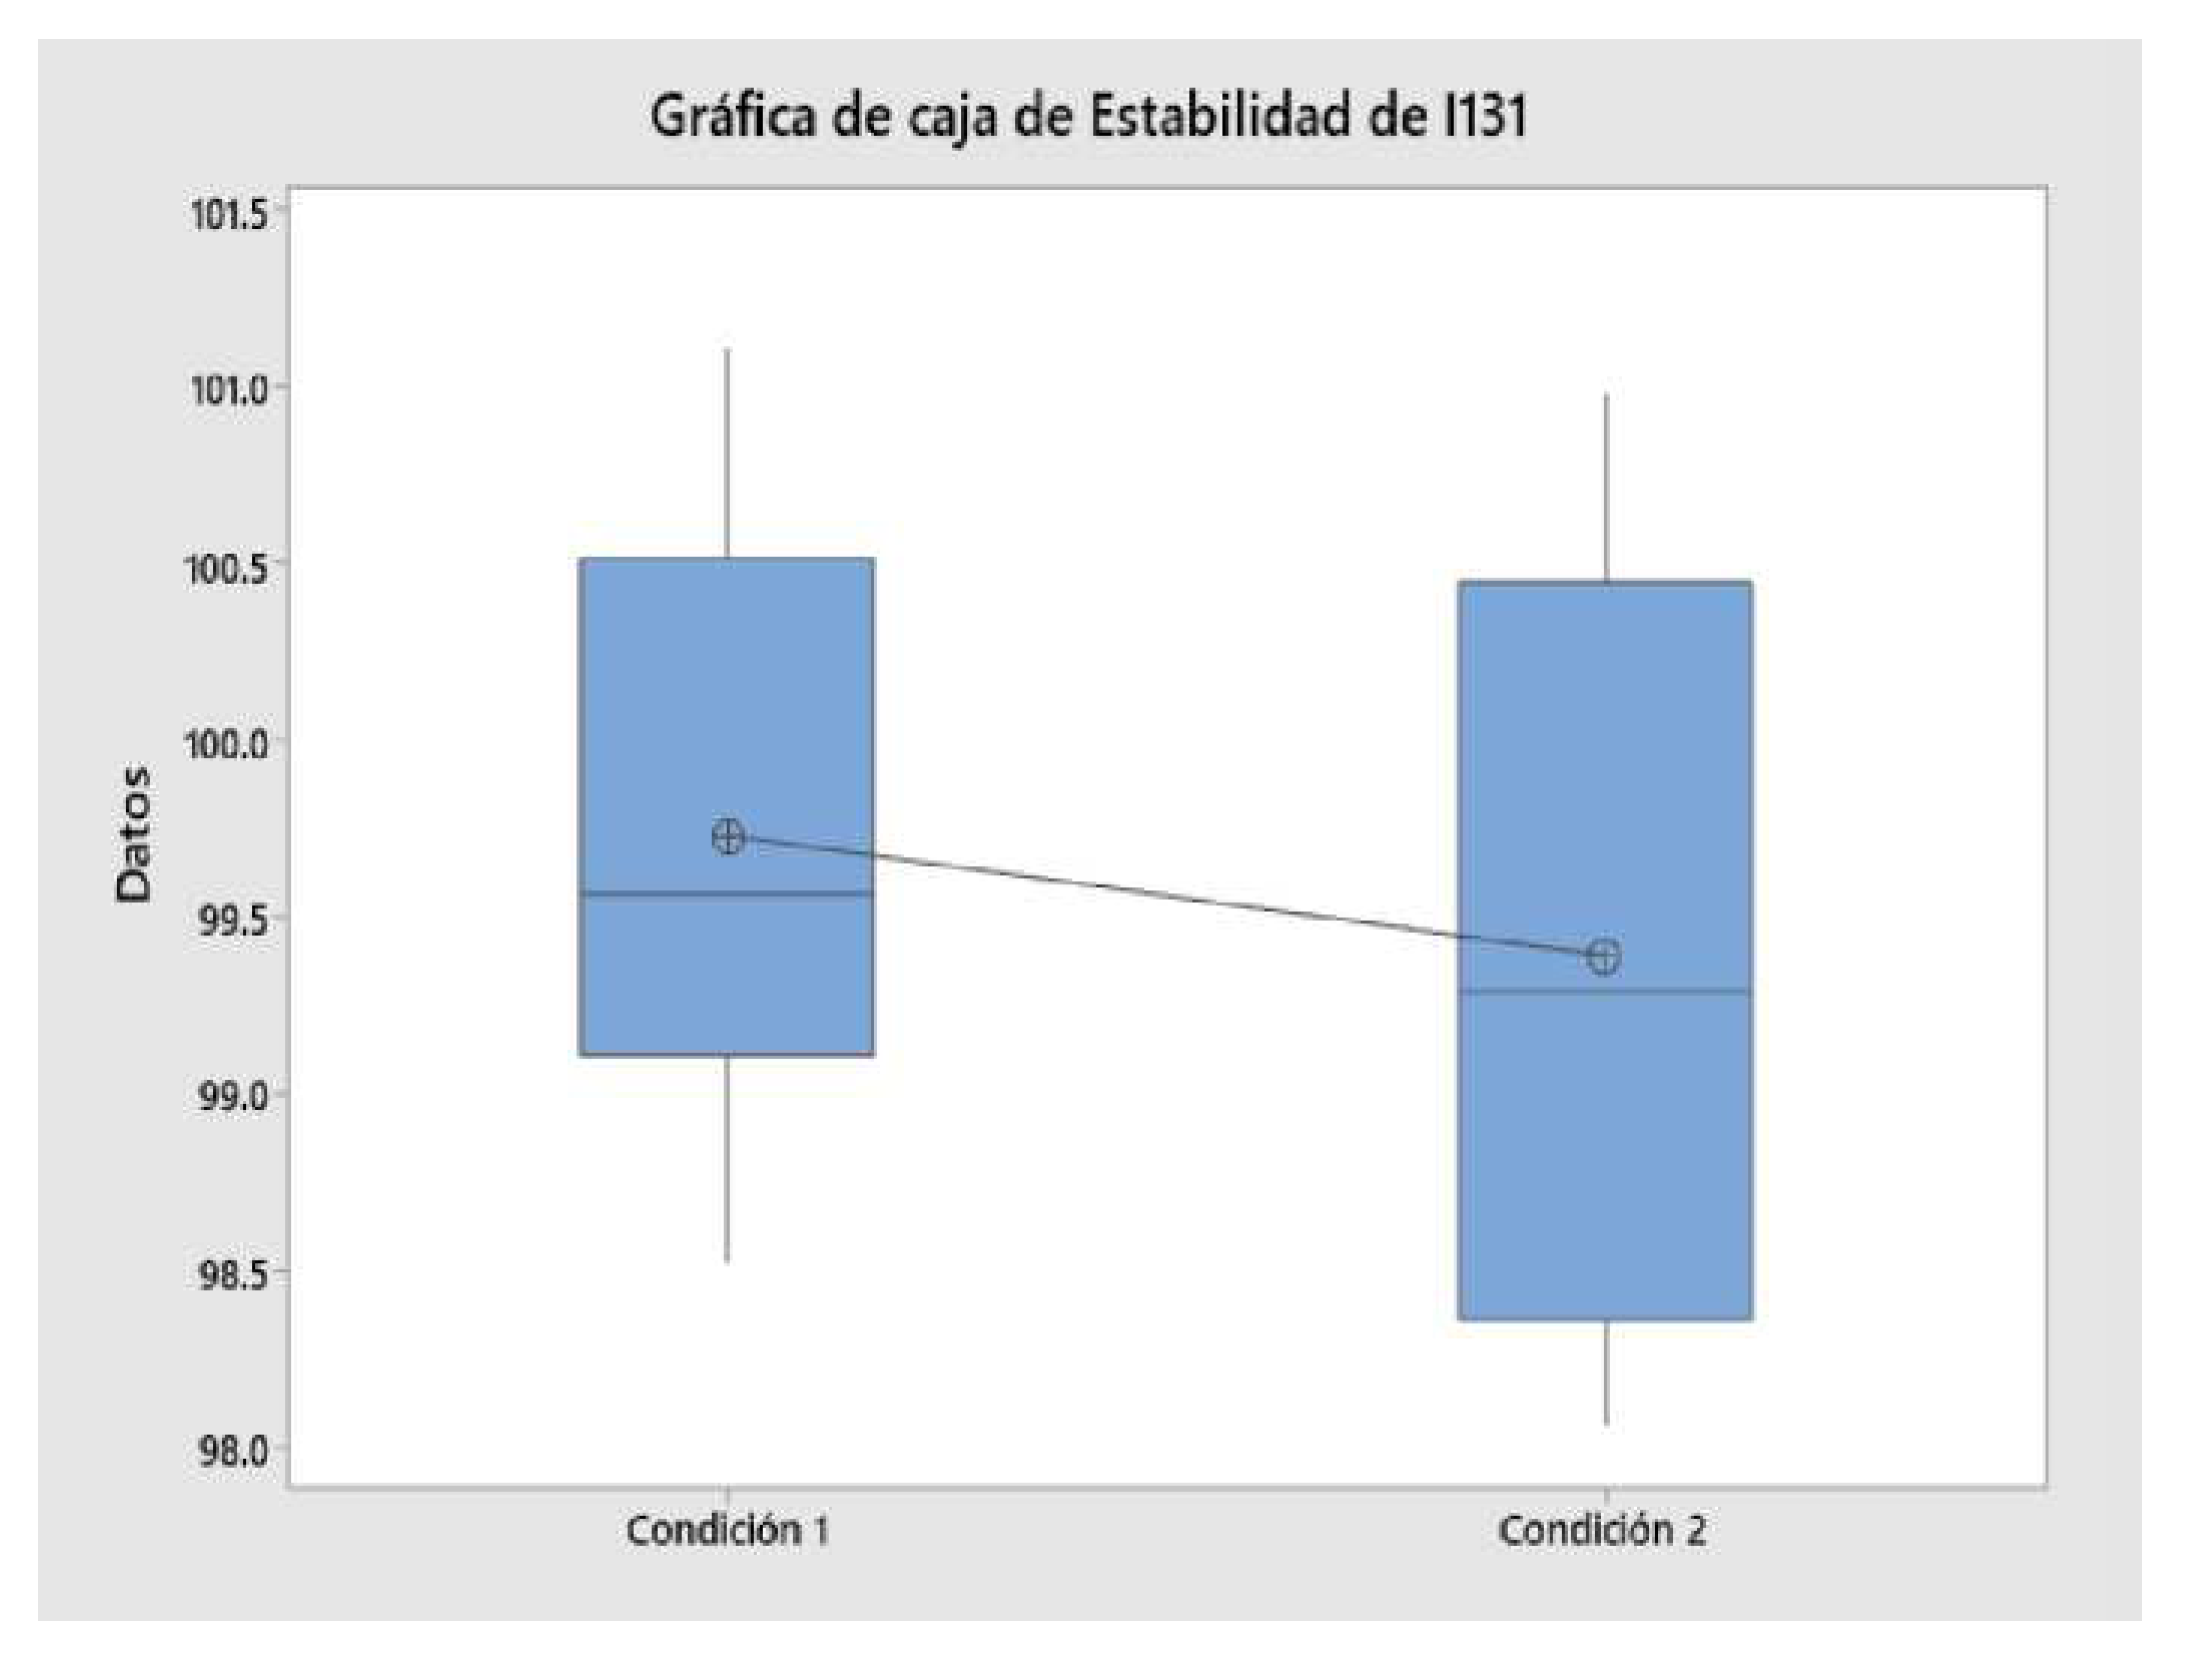
Table 1.
Analytical Target Profile (ATP).
| Analytical Target Profile (ATP) Element | Target / Requirement | Rationale |
|---|---|---|
| Analytical Profile | Determination of the Radiochemical Purity of the Radiopharmaceutical Sodium Iodide I131 Oral Solution Capable of Detecting Radiochemical Impurities and Interferences. | To determine the purity of the radioactive iodide I131 in the radiopharmaceutical Sodium iodide I131 Oral Solution. |
| Instrumentation/ Method Type / Detection Mode / Chromatography | TLC-Scanner, Gamma Spectroscopy, NaI scintillation radiation detector (Tl), thin layer chromatography. | A gamma ray interacts with a scintillator and produces a light pulse that is converted into an electric pulse by a photomultiplier tube (PMT). |
| Specificity | Blank, placebo, and no interference from radiochemical impurities should be observed. | The method must be specific and must be able to distinguish radioactive impurities from radioactive iodide I131. |
| Intermediate Precision / Instrumental and Method Repeatability | The overall RSD with all results below 3%. | ICH Q2 (R2) guideline requirements |
| Linearity | The correlation coefficient and the determination should not be less than 0.99. | Linearity must be obtained at different levels of radioactive concentration. ICH Q2 (R2) guideline requirements. |
| Robustness | The overall RSD with all results below 2%. | The test results should not be affected by small changes in the method parameters. |
| Sample Stability | The overall RSD with all results below 3%. | Test results should not be affected by preparation time when processed. |
| Detection Limit / Quantitation Limit | Minimum quantity that can be detected and can be determined precisely. | ICH Q2 (R2) guideline requirements. |
Table 2.
Critical Quality Attributes (CQAs).
| Critical Method Variables (CMV) | Critical Analytical Attributes (CAA) |
|---|---|
| Injection volume | Counts |
| Sample Concentration | Delay Factor (RF) |
| Carrier | Asymmetry (T) |
| Mobile Phase | |
| Stationary phase Counting Speed Development Time Detection |
Table 3.
Risk Estimate Matrix.
| CAA | Detector | Chromatography Plate | Carrier | Mobile Phase | Injection volume | Radioactive concentration |
|---|---|---|---|---|---|---|
| Counts | High | Low | Medium | Low | High | High |
| Delay Factor | Low | Medium | High | High | Low | Low |
| Asymmetry | Low | Medium | High | Low | Medium | Low |
Disclaimer/Publisher’s Note: The statements, opinions and data contained in all publications are solely those of the individual author(s) and contributor(s) and not of MDPI and/or the editor(s). MDPI and/or the editor(s) disclaim responsibility for any injury to people or property resulting from any ideas, methods, instructions or products referred to in the content. |
© 2023 by the authors. Licensee MDPI, Basel, Switzerland. This article is an open access article distributed under the terms and conditions of the Creative Commons Attribution (CC BY) license (http://creativecommons.org/licenses/by/4.0/).
Copyright: This open access article is published under a Creative Commons CC BY 4.0 license, which permit the free download, distribution, and reuse, provided that the author and preprint are cited in any reuse.


