Submitted:
18 September 2023
Posted:
21 September 2023
You are already at the latest version
Abstract
The resonance spectrum of surface resistance derivative in quasi-two dimensional layered organic conductors has been calculated numerically for the out-of-plane and in-plane magnetic field. Not all but some of the resonances in a given series of transitions are present in the spectra. They are observed at the positions corresponding to the maxima in the surface resistance derivative curve and are in a good agreement with previously calculated magnetic field resonance positions. For tilted magnetic fields, there are more resonances present in the spectrum than in the case of a non-tilted field. Apart from the resonances corresponding to the transitions between the adjacent surface states there also appear resonances involving the transitions between the more distant surface states. This is correlated with the specific topology of Fermi surface of the organic conductors. The presented calculations will allow correct interpretation of the experimental curves for the resonance spectrum, and also to obtain information on the surface properties of these materials for their possible implementation in fabrication of devices based on organic molecular conductors.
Keywords:
organic conductors
; surface resistance derivative
; resonances
; oscillation spectrum
; tilted magnetic field
1. Introduction
Surface effects are important for characterization of the surface properties that are essentially different from those observed in the bulk of the material, and are significant since the materials interact with the environments through their surfaces. In strongly anisotropic systems, the surface effects behave quite differently and are more complex than in isotropic systems. For example, the layered organic materials are characterized with a strong anisotropy due to their reduced dimensionality which makes them interesting for studying the surface phenomena, especially in tilted magnetic fields, since their properties strongly depend on the plane of field rotation. The interest in investigation of rather complex surfaces of such materials is increasing mostly due to their importance for various scientific and industrial applications. The investigation of the surface influence in anisotropic layered materials will allow not only for more accurate determination of characteristic parameters necessary for more precise Fermi surface reconstruction in such materials but also for determining some of the quantities typical for surface electrons. This refers to a wide class of materials such as organic conductors, high-Tc cuprates, dichalcogenides of transition metals and other similar materials with a layered structure. The surface electrons are moving along so called skipping trajectories positioned very closely to the surface itself in the skin layer of the conductor. Their velocity is essentially parallel to the surface thus having an important contribution to the surface currents.
Organic layered conductors, based on charge transfers salts and known for its rich physics and multi-functionalities,[1] represent a large class of materials utilized for building organic electronic devices. Their interest for applications is increasing significantly due to their importance as an active layer in fabrication of the organic bilayer films used for development of flexible electronic sensors. These films are simple and low-cost to fabricate, and are characterized with a high-performing multi-functionality at room temperatures. By far, several charge transfer salts have been confirmed to act as active materials including but not limited to those based on BEDT-TTF[2,3], BEDO-TTF[4,5], MDF-TSF[6] donor molecules with various possible acceptors such as [2,3], [7], [8]. As the size of the devices developed nowadays reduces, the surface-environment interactions become crucial for the device performance. As in that case the surface effects become more prominent, this emphasizes even more the need for studying these effects. Some of them can be beneficial for applying in organic electronic devices which can pave the way for realization of new applications that will create opportunities for development of new technology based on the organic layered compounds. In order to understand and properly exploit the surface transport phenomena in organic bilayer films for achieving better device performance, the behaviour of these effects in the organic material itself which is used as an active layer in fabrication of the bilayer films must be understood well. Indeed, the experimental investigation of photoemission spectra of quasi-1D organic conductors has shown that electronic correlations in the valence band spectra are strongly affected by surface effects and may even be completely obscured [9].
The surface impedance of the material is the proper quantity to measure in order to describe the material’s response to an external electromagnetic microwave/millimeter field. For molecular conductors, such measurements might give further insights in the understanding of the rapid oscillations of the magnetoresistance as well as additional information on the dynamical properties of various ordered states occurring in these materials. For example, some previous works on microwave surface impedance measurements performed in the quasi-1D organic conductor at 16.5 GHz show that the transition from the metallic to the field-induced spin-density-wave state is not as sharp as previously observed in the dc regime (see Ref. [10] and references therein).
In this letter, we investigate the microwave properties of layered organic conductors through the numerical analysis of the surface resistance derivative for both out-of plane and in-plane magnetic field. The differences in surface properties in these materials in correlation to the different planes of rotation of the magnetic field are discussed through the changes in resonance spectra of surface resistance derivative.
2. Theoretical aspects of the surface impedance derivative calculation
The magnetic oscillation spectrum of surface resistance derivative in a non-tilted in-plane magnetic field has been recently studied in detail in Ref. [11]. Here we extend the calculations to the case of a tilted magnetic field in order to examine how the change of the surface-state energies and geometric characteristics of the skipping trajectory affect the appearance of the resonances in the spectrum. The expressions for the surface resistance derivative for two magnetic field geometries, out-of-plane and in-plane field rotations, will be given. The corresponding surface-state energies and wave functions necessary to numerically calculate the oscillation spectrum are taken from Ref. [12,13]. We will first calculate the surface resistance derivative for an out-of-plane magnetic field as this configuration involves more steps to determine the matrix elements of the electric field due to their dependence on the electron momentum projection on the magnetic field .[12] This dependence significantly affects both the shape and amplitude of the resonances in the spectrum. The corresponding expression in case of a tilted in-plane magnetic field is similar to that obtained for a non-tilted in-plane field[11] due to negligibly small dependence of matrix elements on . The angular dependence of matrix elements is determined only by the angular dependence of the surface wave functions at a given plane of rotation of the magnetic field [12,13].
The surface impedance derivative for an electric field polarized in the x direction and propagating along the normal to the plane of the layers in an organic conductor, , is calculated using the formula[14,15,16,17,18]
Here is the non-resonant part of surface impedance where , are the electric field strength and its derivative at the surface, is the vacuum permeability. is the Fermi momentum. The term takes into account the effect of finite lifetime on the surface states due to phonon scattering.[18] In that regard, is the mean-free time between successive phonon scattering events. and are the frequency of the incident electric field and the difference frequency of two surface states with quantum numbers m and n. The sum over m and n takes into account the contribution from all pairs of surface states involved in the formation of the resonance spectrum. are the matrix elements of the electric field that depend on the form of the electric field and surface wave functions which are in general functions of the distance from the surface z, the magnetic field magnitude B and the tilt angle between the magnetic field and conductor’s surface , ,
In addition to the above equations, the complete system of equations necessary to obtain the expression for the surface resistance derivative consists of the equation for the electric field, the Boltzmann’s transport equation[19] and the equation for the current density
where is a coordinate in momentum space, which indicates the position of a charge on its trajectory in a magnetic field in accordance with the equations of motion and is the non-equilibrium correction to the equilibrium Fermi distribution function [19].
We consider an electric field propagating along the normal to the surface of a conductor in the half-space . Using the Fourier method, we continue the electric field evenly to the region of negative values of z and obtain the following relation for the Fourier component
The Fourier component of the in-plane electrical conductivity can be obtained by using the Fourier component of the transport equation solution (Eq. 4)
where .
The corresponding expression that determines the in-plane electrical conductivity is then written as
To further proceed with the calculations, it is convenient to transfer to new variables, i.e., from and to those that describe electron’s motion in the presence of an external magnetic field such as the energy , electron momentum projection on the magnetic field direction and time t. This is correlated with the specific form of the energy spectrum of quasi-two dimensional organic conductors in the form
as obtained by using the tight-binding approximation [1]. The introduction of the new variables is indeed convenient, as in a tilted magnetic field the closed orbits on Fermi surface are obtained as cross-sections on the Fermi surface by the plane , const. In the above equation, and are the electron momenta components in the plane of the layers, and is the momentum component along the least conductive axis of the conductor that is normal to the plane of the layers. is the electron effective mass in the plane of the layers, is the hopping transfer integral in the interlayer direction, c is the interlayer distance and ℏ is the Planck constant divided by .
The change of variables yields the term in the expression for thus transforming Eq. 8 into the following one
where is the electron cyclotron frequency and . The integration over yields -1 since where is the chemical potential. In addition, since , , and one can calculate the integrals over and t and arrive to the following relation for
where
and
Here , where is the Fermi velocity.
In order to calculate the matrix elements , the form of the electric field
appropriate for the moderate anomalous skin-effect regime () is required. This is because, in organic conductors, the electronic surface states are in general confined in the thin layer of a width near the surface. Their wave functions are attenuated at a distance smaller than [12,13,20] signifying that the condition is satisfied, in general, but constrained only to the small region close to the surface. This allows to keep only the term in the square root and the terms up to in the power series expansion of the function in . Considering a specular reflection of the electrons from the surface, the expression for the Fourier component of electrical conductivity, , is obtained as follows
where .
Using Eqs. (2), (14) and (15) and making the corresponding substitution into Eq. (1), the following relation for the surface impedance derivative in the case of an out-of-plane magnetic field is obtained
where , , and .
A similar procedure is also applied to obtain the formula for the surface impedance derivative in case of an in-plane magnetic field rotation at angle , . The difference is that, in this case the corresponding matrix elements , do not depended on the momentum projection on the magnetic field (since ). The corresponding formula is simpler for numerical calculations, it is similar to the one obtained for a non-tilted in-plane magnetic field[11] and reads as
3. Results and Discussion
In the following, the magnetic resonance spectra of surface resistance derivative (real parts of the Eq. 16 and 17) are calculated numerically for the two magnetic field geometries. The general features of the calculated curves are analyzed and then compared in order to obtain a perspective on how the rotation of the field in different planes affects the appearance of the resonances in the spectrum. The numerical analysis of the theoretical formulas might give insights of what is expected to be observed in the experimental curves for the surface resistance derivative once they would be obtained. The experimental data are very much desirable since they will allow the values of parameters that characterize the electrons moving in the very small region near the surface to be derived. The frequency of the external electric field can be changed but is fixed in order to obtain the resonance fields for all the transitions from the six series. For obtaining the resonance spectra in this work we use GHz and GHz in order for more resonances from the six series to be visible in the spectrum. For a given tilt angle, the resonances take place by varying the magnetic field because the magnetic field dependence of matrix elements is mainly determined by the field dependence of surface wave functions .
3.1. Oscillations of the surface resistance derivative in an out-of-plane magnetic field
In Figure 1 numerically calculated curves for the surface resistance derivative are shown, as a sum of six series of transitions between the surface quantum states and for magnetic field orientations and . The corresponding surface-state energies and wave functions used to obtain the resonances are given in Ref. [12]. The resonance curves are obtained for a field resolution of T. The numerically determined positions of some of the representative resonances in the spectrum, which correspond to the maxima in the curve, are in a good agreement with the calculated resonance positions for the out-of-plane magnetic field geometry (Table 2 in Ref. [12]).
We find that, the number of resonances appearing in the spectrum for higher tilt angle is reduced compared to that for smaller angles when the magnetic field is close to the surface. The amplitude of the resonances is also decreasing with increasing the tilt angle. This is expected as the electrons responsible for the transitions between the surface states are moving along skipping trajectories located very closely to the surface. These comprise from elliptical parts that are tilted in the direction of the field and become more elongated as the field is rotated away from the surface (see Fig. 1c in Ref. [12]). In that case, the trajectories have larger dimensions (compared to those for a non-tilted and a tilted in-plane magnetic field) especially those of the higher-lying states, and thus are positioned at larger distance from the surface. Hence, the electrons spend more time in the conductor’s skin layer than in the case of smaller tilt angles before reaching the surface again where they are specularly reflected several times. While spending more time in the skin layer, the electrons are more prone to the phonon scattering and scattering from the bulk electrons situated in the vicinity to the thin skin layer. This decreases their effective interaction with the incident electric field leading to a reduced number of possible transitions between the states and therefore less resonances are visible in the oscillation spectrum.
The increased scattering can be one of the reasons for a reduced amplitude and increased width of the observed peaks although the dependence of the matrix element on the electron projection on the magnetic field direction has also a significant role in the observed behaviour. As evident from Figure 1a,b the scattering mostly affects the peaks corresponding to transitions between the lower-lying states, as some of the transitions are completely absent at higher tilt angles although they are dominant at smaller angles. This is correlated to the fact that the skipping trajectories for these states are the closest to the surface and the electrons responsible for the transitions between these states are more prone to the scattering from the surface phonons.
Another aspect to emphasize is that while the spectrum obtained at smaller tilt angles is characterized with a plethora of peaks nevertheless the dominant transitions are mainly those between the adjacent lower-lying states for which the corresponding matrix elements are the largest. On the contrary, at higher angles one can say that dominant transitions are those between the higher-lying states. Moreover, there is an unusual change in the peak height observed in Figure 1b. Indeed, the peak 6→4 is much higher than the peaks 4→3 and 2→1, which contradicts the general trend that the transitions between adjacent surface levels are expected to be the dominant ones in the resonance spectrum. The rather unusual peak heights seen in Figure 1b might be due to a number of reasons. First, the non-monotonic dependence of the peak height on the field might indicate that it depends principally on the probability of the transitions between levels, determined by the density of the states and their population. Second, the interference between the series also significantly affects the appearance of the peaks in the sum curve in a sense of their width, shape and amplitude. Third, the matrix elements depend on the range of penetration of the electric field, i.e., on the skin depth which influences largely the relative amplitude of different peaks in the sum oscillatory curve. Fourth, the apparent larger amplitude of the peak might be due to the decrease in the amplitude of neighbouring resonances on the low-field side (such is the significant reduction of the amplitude of resonance).
3.2. Surface resistance derivative oscillations in an in-plane magnetic field
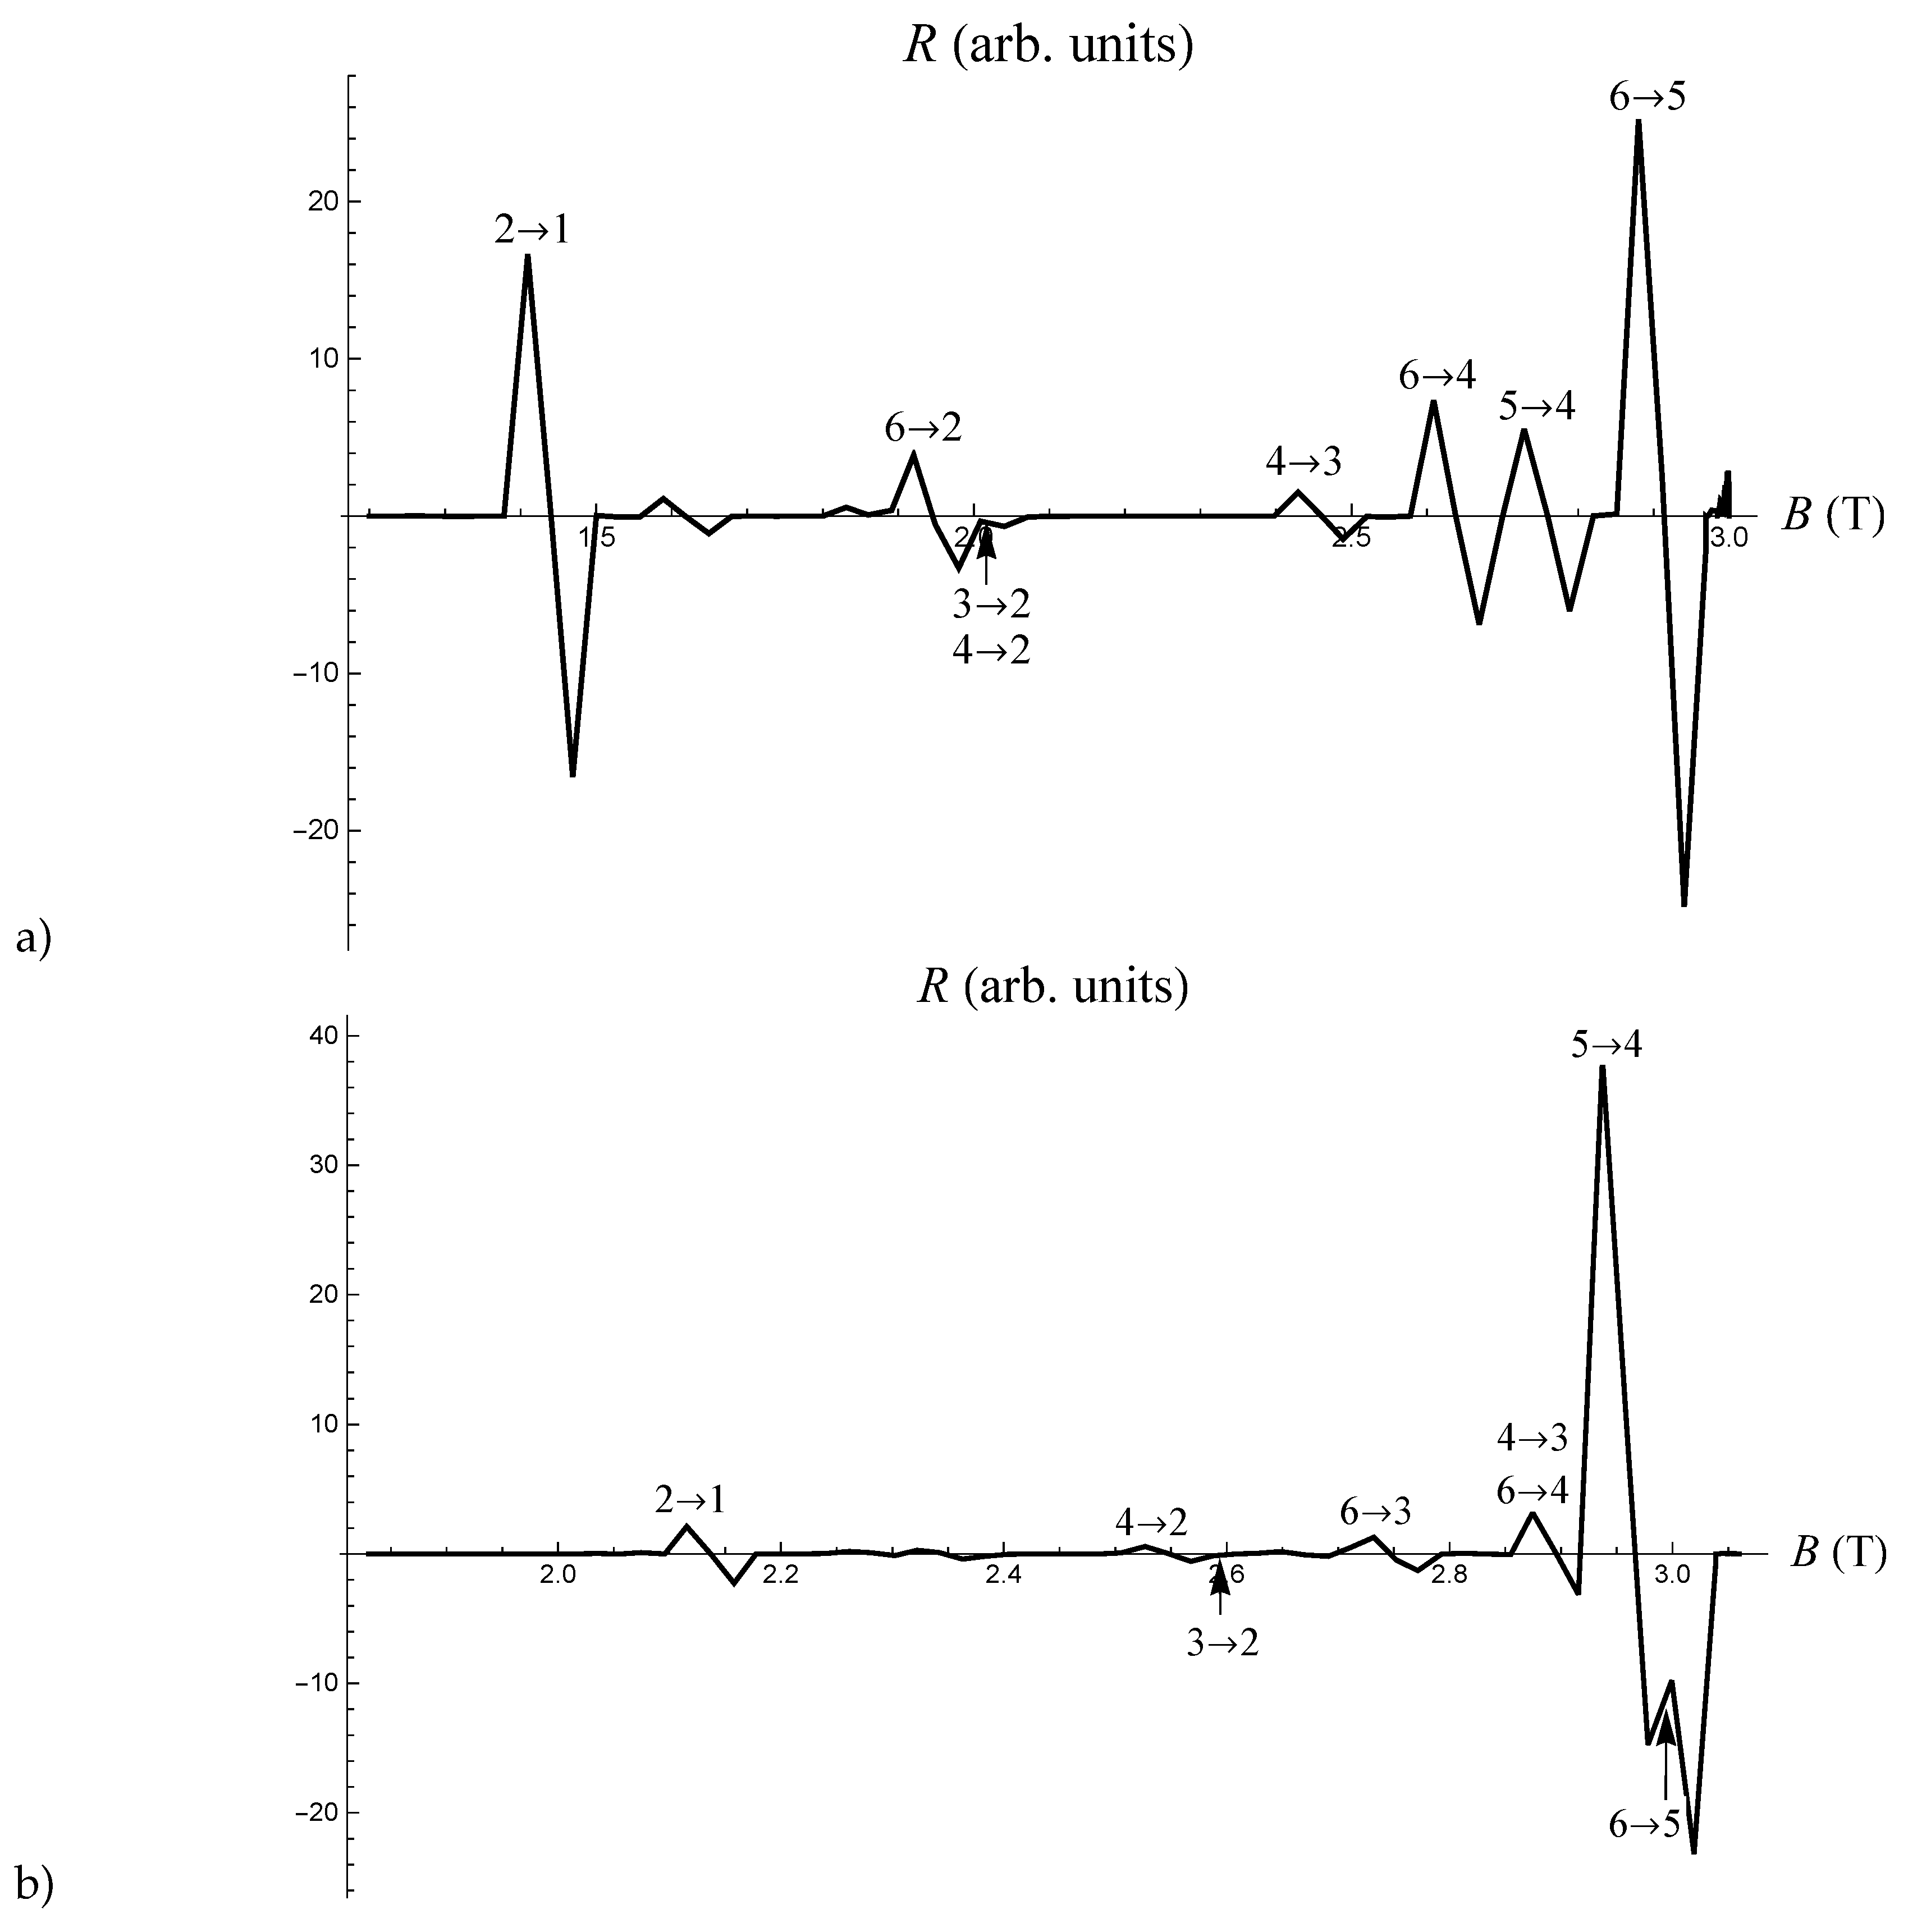
We present in Figure 2 the calculated sum curve of surface resistance derivative of six series and in-plane magnetic field orientations and . Not all but some of the transitions within a given series with a quantum number n are present in the curve. The field resolution used to numerically calculate the curves is T. The position of the resonances observed in the spectrum are in a very good agreement with the previously obtained values for the resonance fields for this field geometry (Table 3 in Ref. [13]).
The general feature of the oscillation spectra for the in-plane field rotation is that resonances corresponding to the transitions between the adjacent surface states are those that are mainly present in the sum spectrum. However, similar to the case of out-of-plane magnetic field, the resonances corresponding to the transitions between more distant states are also present in the spectra for the given magnetic field directions. Interestingly, we find that, independently on the plane of magnetic field rotation, similar transitions in a given series with a quantum number n are present in the sum spectra, as evident form Figure 1 and Figure 2.
In further comparing the numerical aspects of the spectra for different planes of field rotation, we notice that there is a difference in the width of the observed resonances. This characteristic differentiates the spectra for which is strongly dependent on the momentum projection from those where is almost independent on . Additionally, the unusual peak heights is also evident in the resonance spectra for the in-plane magnetic field, moreover, here it is more pronounced than in the case of out-of-plane field rotations. Indeed, instead observing the highest peak heights for the resonances between the lowest-lying states, the opposite is seen as those corresponding to the transitions between the highest-lying states are dominant in the spectra. Aside for the possible above mentioned reasons for this scenario, we also would like to note that the strong anisotropy in q2D organic conductors with regard to the crystal planes as a source for observing the different behaviour also cannot be neglected. Indeed, in both cases of field rotations there is a strong dependence of the distance between the surface levels on the angle of magnetic field rotation. By considering the schematic representation of the surface levels at different tilt angles for out-of-plane[12] and in-plane[13] rotations one can see that some of the higher lying states are closer to each other than the lower lying ones. This means that the distance between the higher lying surface states can be smaller, for a given tilt angle and frequency of the incident electric field, which increases the probability for the transitions between these states to occur. Moreover, some of these transitions appear to be dominant over those occurring between the lower states although the opposite is expected. Obviously, the non-equidistant distribution of the surface levels is even more prominent when there is a significant dependence of on the momentum projection . Therefore, apart from the interference effects between the surface states on the appearance of the sum spectrum, the strong angular dependence of the surface levels distribution in a magnetic field has also an important contribution in the outlook of spectra.
Another observation for the in-plane field rotation is that, some peaks in the final curve may occur very closely to each other because of a possible overlap of the wave functions of the corresponding surface states with the electric field in the skin layer. This will also affect the amplitude and shape of the resonances. In q2D organic conductors, this is much more possible than in ordinary metals because the closed electron orbits, responsible for the observed transitions, are located in the belly part of the Fermi surface (Fig. 1a in Ref. [13]) and are not only small but also very close to each other. Thus transitions with different quantum numbers, n and m, might have very close resonance positions . Such are the , transitions occurring at T, T (for ) and , transitions occurring at T, T (for ). This is because, the closed orbits on Fermi surface, involved in the transitions between the states for larger tilt angles have similar area. These orbits are located in the more inner part of the belly of the corrugated Fermi cylinder. Therefore, the resonances in the spectrum corresponding to these transitions appear with similar amplitude for the given numerical resolution.
4. Conclusions
With the development of organic bilayer films of molecular conductors for building various efficient and eco-friendly devices, the surface properties of molecular conductors are becoming more important for obtaining devices with improved performances for their utilization in various sensing applications. By far, several molecular conductors with a quasi-2D energy spectrum have been used for this purpose. We investigate the behaviour of the surface resistance oscillations in such conductors in order to obtain information on the important processes occurring in the region close to the surface. In a presence of a magnetic field, the transitions between the quantum surface states appear as resonances in the surface resistance derivative spectrum. The resonance spectra of six series of transitions have been obtained numerically for rotations of the magnetic field in different planes with respect to the surface, i.e., for field rotations away from the surface and rotations in the plane of the surface. We find that in a tilted magnetic field, the resonance spectra consist of more resonances than in the case of a non-tilted magnetic field. Although all of the resonances corresponding to the transitions in the six series are not visible in the spectra, the presence of those arising as a result of transitions between more distant states, in addition to those between the adjacent surface states, is evident. We suggest that the observed behaviour is mainly due to interference effects and angular dependence of the surface levels distribution. The former is expected when more series are represented together in a spectrum and the latter arises from the specific topology of the Fermi surface of organic conductors in a form of a weakly corrugated cylinder which is reflected in the different shape of the skipping orbits near the surface for magnetic field rotations in different crystal planes.
References
- T. Ishiguro, K. Yamaji, Organic Superconductors (Springer Berlin, Heidelberg, 1990).
- J. K. Jeszka, A. Tracz, Polym. Adv. Technol. 3 (1992) 139.
- E. Laukhina, C. Rovira, J. Ulanski, Synth. Met. 21 (2001) 1407.
- H. Yamochi, T. Haneda, A. Tracz, G. Saito, Synth. Met. 249 (2014) 1012.
- D. Suarez, E. Steven, E. Laukhina, A. Gomez, A. Crespi, N. Mestres, C. Rovira, E. S. Choi, J. Veciana, npj Flex Electron 2 (2018) 29.
- A. Tracz, A. Mierczyńska, K. Takimiya, T. Otsubo, N. Niihara, J. K. Jeszka, Materials Science- Poland 24 (2006) 517.
- E. Laukhina, V. Tkacheva, I. Chuev, E. Yagubskii, J. Vidal-Gancedo, M. Mas-Torrent, C. Rovira, J. Veciana, S. Khasanov, R. Wojciechowski, J. Ulanski, J. Phys. Chem. B 105 (2001) 11089.
- V. Lebedev, E. Laukhina, V. Laukhin, A. Somov, A. M. Baranov, C. Rovira, J. Veciana, Organic Electronics 42 (2017) 146.
- R. Claessena, U. Schwingenschlögl, M. Sing, C.S. Jacobsen, M. Dressel, Physica B 312-313 (2002) 660.
- P. Fertey, M. Poirier, H. Müller, Phys. Rev. B 57 (1998) 14357.
- D. Krstovska, A. Skeparovski, Phys. Scr. 98 (2023) 035816.
- D. Krstovska, A. Skeparovski, M. Gjorgjevski, Int. J. Mod. Phys. B 36 (2022) 2250225.
- D. Krstovska, A. Skeparovski, Z. Naturforsch. A 76 (2021) 711.
- R. E. Prange, T. W. Nee, Phys. Rev. 168 (1968) 779.
- T. W. Nee, J. F. Koch, R. E. Prange, Phys. Rev., 174 (1968) 758.
- H. J. Fischbeck, J. Mertsching, Phys. stat. sol., 27 (1968) 345.
- J. F. Koch, J. D. Jensen, Phys. Rev., 184 (1969) 643.
- J. F. Koch, Phys. kondens. Materie, 9 (1969) 146.
- A. A. Abrikosov, Fundamentals of The Theory of Metals (North Holland, 1988).
- D. Krstovska, A. Skeparovski, Z. Naturforsch. A 75 (2020) 987.
Figure 1.
Magnetic oscillations of the surface resistance derivative for the sum of six series and magnetic field rotated from the surface at a) and b) . The resonances that appear in the oscillation spectrum, representing the possible transitions for the out-of-plane magnetic field, are indicated on the calculated curve. The change in the shape, width and the number of resonances with increasing the tilt angle from the surface is evident.
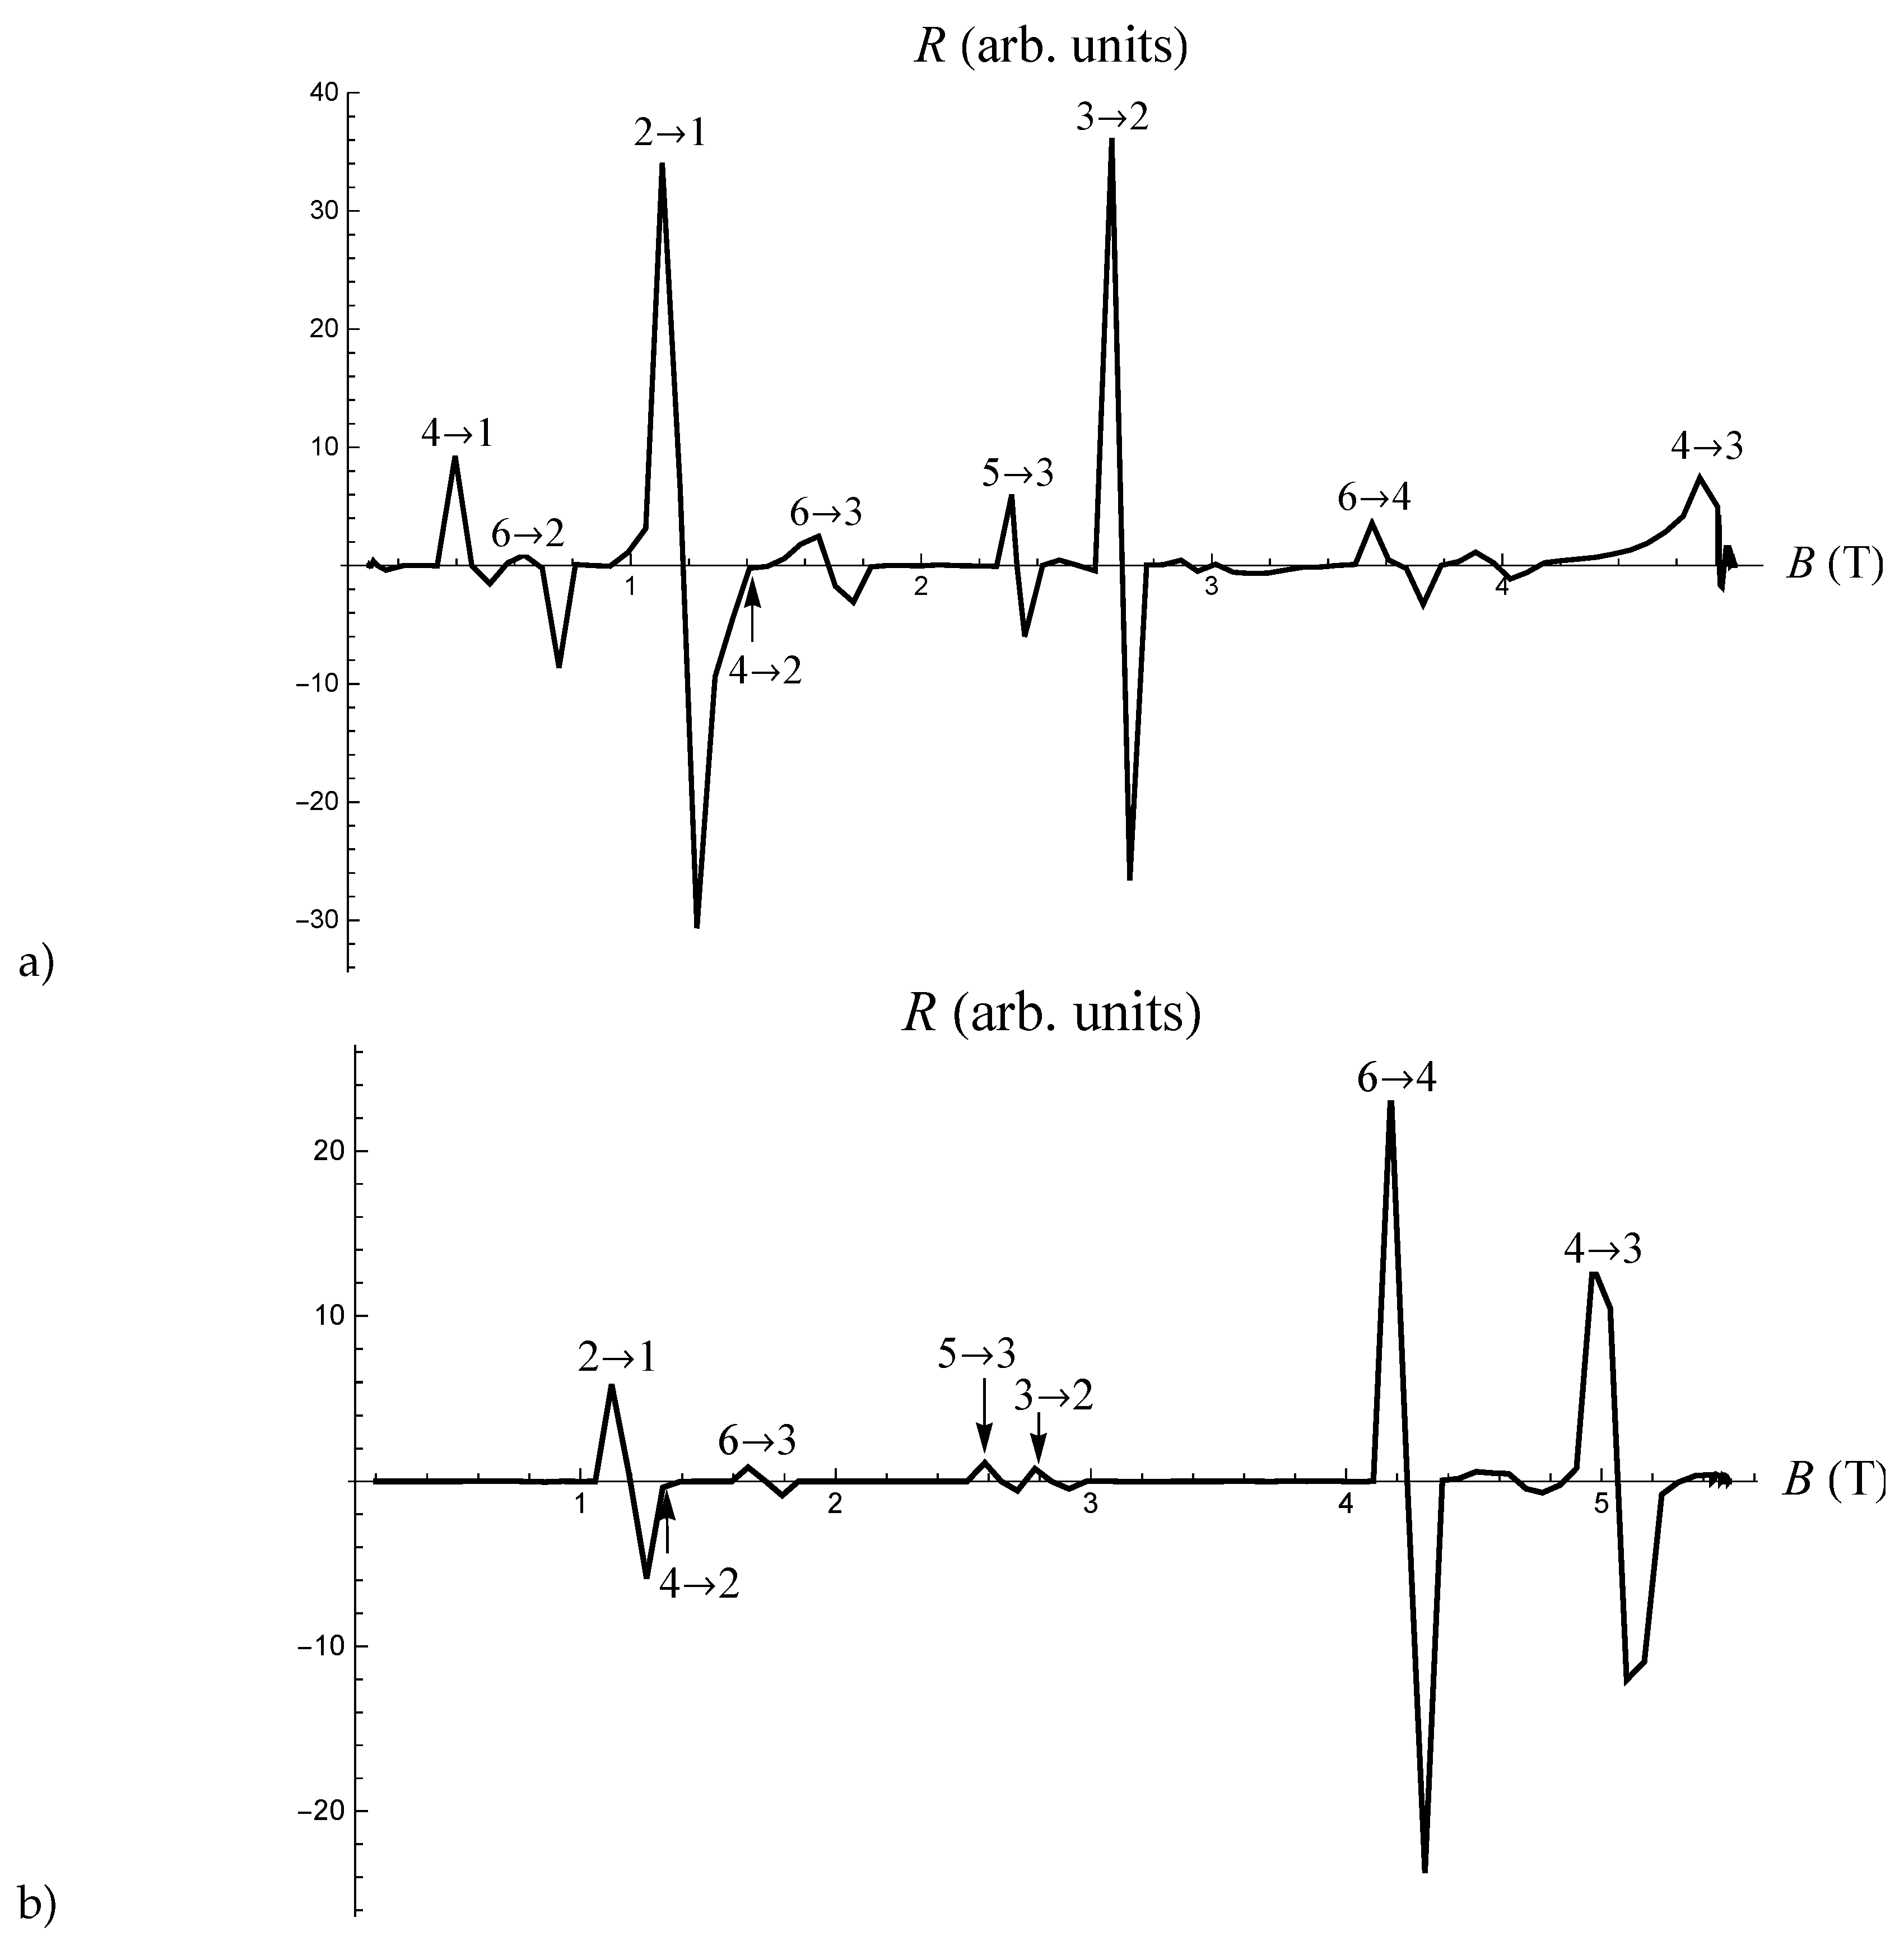
Figure 2.
Magnetic oscillations of the surface resistance derivative for the sum of six series and magnetic field rotated in the plane of the surface at a) and b) . The resonances that appear in the sum spectrum, representing the possible transitions between the surface states in organic conductors for an in-plane magnetic field, are indicated on the calculated curve.
Disclaimer/Publisher’s Note: The statements, opinions and data contained in all publications are solely those of the individual author(s) and contributor(s) and not of MDPI and/or the editor(s). MDPI and/or the editor(s) disclaim responsibility for any injury to people or property resulting from any ideas, methods, instructions or products referred to in the content. |
© 2023 by the authors. Licensee MDPI, Basel, Switzerland. This article is an open access article distributed under the terms and conditions of the Creative Commons Attribution (CC BY) license (http://creativecommons.org/licenses/by/4.0/).
Copyright: This open access article is published under a Creative Commons CC BY 4.0 license, which permit the free download, distribution, and reuse, provided that the author and preprint are cited in any reuse.


