Submitted:
18 September 2023
Posted:
20 September 2023
You are already at the latest version
Abstract
Cannabis (Cannabis sativa L.) stands as a historically significant and culturally important plant, embodying economic, social, and medicinal relevance for human societies. However, years of prohibition and stigmatization have hindered the cannabis research community, which is hugely undersized and suffers from a scarcity of understanding of cannabis genetics and how key traits are expressed or inherited. In this study, we conducted a comprehensive phenotypic characteriza-tion of 176 drug-type cannabis accessions, representative of Canada's legal market. We assessed germination methods, evaluated various traits including agronomic, morphological, and canna-binoid profiles, and uncovered significant variation within this population. Notably, yield dis-played a negative correlations with maturity-related traits but positive correlation with fresh biomass. Additionally, the potential THC content showed positive correlation with maturi-ty-related traits but negative correlation with yield. Significant different were observed between plants derived from regular female seeds and feminized seeds, as well as between plants derived from cuttings and seeds for different traits. This study advances our understanding of cannabis cultivation, offering insights into germination practices, agronomic traits, morphological charac-teristics, and biochemical diversity. These findings establish a foundation for precise breeding and cultivar development, enhancing cannabis's potential in the legal market.
Keywords:
cannabis
; breeding
; phenotype
; correlations
1. Introduction
Cannabis (Cannabis sativa L.) is one of the first domesticated plants [1] with a rich and dynamic history closely linked to the economic, social, and cultural progress of human societies [2]. Cannabis, belonging to the Cannabaceae family, is an annual herbaceous plant [3,4,5,6]. Generally, it is dioecious (2n = 20), characterized by nine autosomes and one pair of sex chromosomes. However, the process of sex determination in cannabis is rather intricate; most drug-type cannabis plants are dioecious, exclusively producing either male (XY) or female (XX) flowers [7,8,9]. On the other hand, some plants, primarily hemp, exhibit monoecious characteristics, with both male and female flowers growing on the same plant [10]. Under specific conditions, dioecious plants may revert to a monoecious-like state, known as hermaphroditism [7,11,12]. In cannabis, sex holds a great importance: unpollinated female flowers produce and store considerably more cannabinoids than male flowers [7,8,13].
Cannabis was a versatile resource, providing fibers for ropes and nets, food, and oil from its seeds for millennia, while the only direct evidence supporting the medicinal use of cannabis dates back to ~400 A.D. based on the discovery of Δ6-tetrahydrocannabinol (Δ6-THC) in ashes [14]. In Canada, similar to the U.S.A. and the E.U., cannabis is divided and regulated based on the level of psychoactive cannabinoid Δ9-THC produced in the plant (plants with below 0.3% are regulated as hemp and 0.3% or greater as drug-type) [15]. While hemp has been legal for commercial cultivation in Canada since 1998, drug-type cannabis was only legalized for commercial production in 2014 for medicinal and 2018 for recreational use [16]. The global legal cannabis market is experiencing exponential growth, projected to reach a staggering $102 billion by 2028, up from the current value of $51 billion [17], making it one of the most economically significant crops worldwide. However, despite this rapid commercial expansion, the biology of cannabis remains shrouded in mystery, largely due to its prolonged history of prohibition. The scarcity of empirically based best practices and optimized protocols across the entire cannabis industry is undeniable. From breeding and genetics to cultivation, processing, and postharvest practices, there exists a dearth of comprehensive knowledge and understanding. The legacy of prohibition has hindered scientific exploration and research, leaving us with a vast realm of untapped potential and untamed possibilities.
Cannabis is known to produce over 545 potentially bioactive secondary metabolites, including more than 120 cannabinoids, various flavonoids, and a plethora of terpenes [18,19,20]. While clinical studies are typically conducted with purified cannabinoids (Δ9-THC and/or cannabidiol (CBD)), or with products standardized with only these two compounds (i.e., marker compounds), many patients and recreational users (more than 80%) consume raw plant products or whole-plant extracts and anecdotal reports have long claimed that the effects vary based on the broader chemical profile [21]. What makes whole-plant extracts more challenging is that they are not just chemically complex, but also chemically variable such that two products with identical levels of marker compounds can be chemically quite different and produce dramatically different medical outcomes [22]. This variation is due to a combination of the genetic background of the plant, as well as the environment in which it is grown, referred to as genotype by environment (GxE) interactions [23,24]. To achieve consistently reproducible extracts, it is imperative that they originate from genetically stable plants, such as inbred lines, cultivated under highly uniform conditions. Indeed, utilizing stabilized cultivars obtained through the inbreeding process, such as cyclic improvement [25] represent a unique opportunity for cannabis growers. This approach not only enables the production of uniform and consistent cannabis products but also allows for the exploration of novel combinations of cannabis genetics. By leveraging stabilized cultivars, growers can develop varieties with enhanced disease resistance, novel flavors, and aromas, as well as tailored cannabinoid levels to meet specific market demands. Additionally, this method empowers growers to optimize total yields, further enhancing the economic potential of cannabis cultivation.
In the realm of agriculture, cultivar development is advancing into a new era through the integration of modern breeding techniques, genomic tools, and genome editing [26]. The first and main step taken in most plant breeding platforms is inbreeding to fix desired traits. This is a challenge in cannabis as cannabis plants are predominantly dioecious and highly heterozygous, exhibiting substantial variation within its population and final product [27]. Although cannabis is an outcrossing species with exceptionally high levels of within population variability, clonal propagation methods are relatively easy and are used to mass produce uniform populations [12]. As a result, clonal propagation methods have become the main approach for large-scale production. This method involves taking cuttings from mother plants with desirable characteristics to multiply and produce genetically identical offspring (clones). However, traditional clonal propagation poses challenges, such as occupying significant grow space, often more than 15%, limiting mass production capacity, and making growers vulnerable to pests and pathogens that transmit from mother plants to cuttings [28]. Moreover, in a recent study, a significant genetic diversity within an individual cannabis mother plant was discovered, demonstrating the ubiquity of somatic mutations in cannabis plants [29]. This finding aligned with anecdotal reports from cannabis producers indicating that clones deteriorated over time. Micropropagation, a promising alternative, offers a controlled and sterile environment using tissue culture techniques to produce genetically uniform clones free from pests and diseases. It allows the preservation of valuable genetic material, facilitates genetic modification for improved traits, and offers disease-free plant production [11]. Yet, micropropagation also requires addressing challenges, such as maintaining a sterile environment and potential somaclonal variations leading to mutations [30].
Development of cannabis inbred lines is a pivotal endeavor geared towards achieving genetic stability, predictability, and superior traits in the offspring. A stellar example of the potential of inbreeding and hybrid vigor lies in maize, where hybrids resulting from crossing two inbred lines exhibited significant heterosis, surpassing their counterparts in productivity and uniformity [31]. This groundbreaking practice led to a significant surge in maize yields over time, with nearly half of this progress credited to improved genetics, particularly the shift from open-pollinated cultivars to F1 hybrids derived from inbred lines [32]. A fundamental prerequisite for unleashing the potential of plant breeding is genetic variation, acting as a vital catalyst in the utilization of germplasm, which forms the genetic foundation for developing new and improved plant varieties [33]. As such, the initial and paramount step in this journey lies in the phenotyping of plant materials, a process that stands as a cornerstone of plant breeding. While the realm of genetics has witnessed remarkable advancements and the integration of cutting-edge molecular technologies in crop research, the art of crop breeding continues to rely extensively on the expression of agronomically important traits [34]. These traits not only govern the selection process, but they also dictate the defining features of commercial products. Phenotyping, with its deep-rooted emphasis on identifying and characterizing these vital traits, remains an indispensable tool in the hands of plant breeders. It provides invaluable insights into the intricate tapestry of genetic variation that lays the groundwork for the cultivation of superior crops and the emergence of robust agricultural systems [35]. By unraveling the phenotypic landscape, plant breeders navigate the intricacies of selecting and honing traits that confer resilience, productivity, and quality, all essential attributes for developing new and improved varieties.
Given the multifarious factors that impact cannabis breeding and the necessity to discern observable distinctions within this species, our objective was to characterize a diverse panel of 210 cannabis accessions, which represents the Canadian legal market. This characterization took place under highly controlled conditions, enabling the measurement of both phenotypic traits (e.g., plant height, days to maturity, yield, etc.) and biochemical traits (e.g., cannabinoids profiles). This comprehensive endeavor lays the groundwork for a drug-type cannabis breeding program, facilitating the development of novel and improved cannabis varieties with desired characteristics.
2. Results
2.1. Germination test
Here, our focus was to find the optimal sowing method for cannabis seeds, achieved through exhaustive exploration of 13 distinct treatments aimed at enhancing seed germination rates. Each treatment consisted of 10 seeds per replicate, with three replicates per treatment. The germination rates were monitored over a three-day period, and the average germination rate (GR) on the third day was used for data analysis (Supplementary Table S6). Upon subjecting the data to analysis of variance (ANOVA), intriguingly, we observed no statistically significant differences in germination rates among the treatments (p = 0.08). However, despite not being significantly different, the direct sowing method (SD) displayed the highest germination rate (Figure 1). Therefore, this led us to opt for the direct sowing method for the phenotypic characterization trials, as it showed a better and more uniform germination rate compared to other methods that involved pretreatments of seeds.
2.2. Characterization of the agronomic traits
We conducted a comprehensive characterization of six pivotal agronomic traits; days to sexual maturity (dtsm), days to first flower (dtf), days to maturity from cuttings/sowing (dtmp), days to maturity from flower initiation (dtmf), yield, and fresh biomass (fb). Prior to embarking on statistical analyses, a preliminary step of assessing the normality of phenotypic data was conducted using Shapiro-Wilk tests applied to the studentized residuals. We found only yield within the contours of normal distribution, whereas the remaining traits exhibited non-normal distributions. Data meeting the criterion of normality tests were subjected to analysis of ANOVA, while traits deviating from a normal distribution underwent PERMANOVA (Figure 2 and Supplementary Table S7). Key agronomic traits for breeding program, including dtms, dtmf, and yield exhibited notable variation. For instance, the days to maturity from sowing or cutting initiation ranged from 70 to 133 days, while the days to maturity from flower initiation displayed a variation spanning 38 to 123 days. In a similar vein, the yield demonstrated a tapestry of remarkable diversity, stretching from a minimum of 6.02 g to an impressive pinnacle of 177.03 g (Figure 2).
In order to thoroughly assess the relationships among diverse agronomic traits, an analysis of correlation was conducted. As can be seen in Figure 2, significant positive correlations were found for key selection traits such as dtm and dtsm (r = 0.81), indicating a compelling interconnectedness. Conversely, for the yield, a distinct and significant negative correlation was found with dtsm (r = -0.55) and dtmp (r = -0.45), highlighting an intriguing relationship where certain traits influence yield. In addition, the fresh biomass exhibited a highly significant and positive correlation with yield (r = 0.81). The revelation of these correlations enriches our understanding of the complex web of interactions within the realm of cannabis agronomy, paving the way for more informed decision-making and strategic interventions in our selection program.
2.3. Characterization of the morphological traits
In this study, we performed an in-depth characterization for seven morphological traits: including plant height at harvest (hh), growth index of height (gih), stem diameter at harvest (sdah), growth index of stem diameter (gisd), canopy diameter at harvest (cdh), growth index of canopy diameter (gicd), number of nodes at harvest (nodeNH), and growth index of internode length (giinl). As mentioned above, for each trait, a normality test was performed. Our findings revealed that hh, gicd, and giinl data followed a normal distribution pattern, while the other traits displayed distributions that deviated from normality (Figure 3 and Supplementary Table S7). Significant differences were observed among the morphological traits of interest for selection. For instance, gih ranged from 1 inch to 36.50, gicd varied from 0 inches to 22 inches, and the nodeNH ranged from a minimum of 18 to a maximum of 44 nodes. As depicted in Figure 3, notable and consistent positive correlations were identified across all morphological traits. Particularly noteworthy correlations emerged, such as those between giinl and gih (r = 0.822), gih and nodeNH (r = 0.769), and giinl and nodeNH (r = 0.674) and sdah and gisd (r = 0.599) demonstrating a significant interplay among these various morphological traits. Across the 176 accessions studied, we observed a striking morphological diversity in various aspects, such as inflorescence morphology and leaf characteristics. The wide-ranging array of inflorescence structures shown in Supplementary Figure S5 illustrating the immense variability that exists within this cannabis population.
2.4. Characterization of the biochemical traits
Following to the procedures of drying and trimming of the harvested flowers, a series of representative samples, were prepared for biochemical analysis. This comprehensive analysis was focused on the quantification of 11 distinct cannabinoids: tetrahydrocannabinolic acid (THCA), delta-9-Tetrahydrocannabinol (D9THC), cannabidiolic acid (CBDA), cannabidiol (CBD), cannabigerolic acid (CBGA), cannabigerol (CBG), cannabichromene (CBC), cannabinol (CBN), tetrahydrocannabivarin (THCV), cannabidivarin (CBDV), and delta-8-Tetrahydrocannabinol (D8THC), in addition to potential THC (THCp) and CBD (CBDp) content. To ensure the robustness of the analytical method, a validation trial was conducted. This trial served to assess the accuracy, reproducibility, and overall consistency of the acquired data. The validation test was undertaken on an entirely random subset, comprising eight samples. Each individual sample was subjected to the scrutiny of three replicates, each involving distinct extractions and analyses. Within this framework, three samples were selectively subjected to triple injections from the same origin, aiming to comprehensively assess the efficacy of the technology. The outcomes of this intricate validation test have yielded remarkably promising results. A compelling narrative of minimal variation, not statistically significant, has been etched, with the standard deviation (SD) encompassing a range of 3% to 8% across different metabolites within the replicates (Supplementary Table S5). We were able to obtain concentrations exceeding the minimal detectable quantity for seven cannabinoids: tetrahydrocannabinolic acid (THCA), delta-9-tetrahydrocannabinol (D9THC), cannabidiolic acid CBDA), cannabidiol (CBD), cannabigerolic acid (CBGA), cannabigerol (CBG), and cannabichromene (CBC). For cannabinol (CBN), tetrahydrocannabivarin (THCV), cannabidivarin (CBDV), and delta-8-tetrahydrocannabinol (Delta-8-THC) a qualitative assessment was provided with presence and absence data. As a result, these four cannabinoids were not included in our statistical analysis.Following a rigorous validation process, the entire population comprising 176 samples underwent a comprehensive analysis of their cannabinoid profiles. Similar normality tests (Shapiro-Wilk and Kolmogorov-Smirnov tests on studentized residuals) and analysis of variance (ANOVA and PERMANOVA) were conducted (Supplementary Figure S7). Remarkably, significant variations in the major cannabinoids, specifically THC and CBD, were observed. The potential THC content oscillated within a striking range of 0.29% to 32.62%, while potential CBD exhibited a span of 0.01% to 18.1%. As anticipated, strong positive correlations were observed between THCp-THCA, CBDp-CBDA, and CBD-CBDp (r = 0.97, r = 1, and r = 0.96, respectively) as depicted in Figure 4. Similarly, the interplay between CBC-CBDA bore a substantial positive correlation of 0.88. On the contrary, moderate negative correlations were also detected, underscoring the dynamics of the cannabinoid landscape. Specifically, CBDp-THCA (r = -0.61), THCp-CBDA (r = -0.63), THCp-CBD (r = -0.65), CBC-THCP (r = -0.59), and THCp-CBDp (r = -0.63) exhibited discernible negative linear relationships. These findings deepen our understanding of cannabinoid interactions and pave the way for advanced research in cannabis chemistry.
2.5. Influence of agronomic and morphological characteristics on major cannabinoids
Positive correlations were identified in this study, with a correlation coefficient (r) of 0.27 between THCp and the giinl (See Supplementary Table S8). Additionally, an intriguing positive correlation (r = 0.644) emerged between hh and both yield and fb, mirroring a similar trend for cdh with coefficients of 0.42 and 0.528 respectively (Supplementary Table S8). Notably, positive correlations were found between dtsm, dtf, dtmp, and the THCp. Conversely, a negative correlation of -0.24 was observed between yield and the THCp. Notably, no significant correlations were detected between agronomic and morphological characteristics and the CBDp (Supplementary Table S8).
2.6. Impact of the origin of the cannabis on agronomic, morphological, and biochemical traits
2.6.1. Regular female vs. feminized seeds
We found statistically significant differences between the plants derived from regular female (reg) seeds and feminized (fem) seeds, particularly in dtmp, THCA, and THCp (p-values 2.20E-16, 1.72E-07 and 1.34E-07, respectively) (Supplementary Table S7). The dtf and gin also exhibited significant differences, albeit with slightly higher p-values (2.20E-16 and 6.45E-05, respectively) between the female and feminized plants. Intriguingly, on average plants originating from regular seeds exhibited a higher THCp content (20.07%) compared to those from feminized seeds (15.94%). A similar pattern is evident in THCA content, reflecting a notable 4.74% rise in plants sourced from regular seeds as opposed to feminized seeds. Regarding the agronomic trait, dtmp, plants from regular seeds took longer to mature (109 days) than those from feminized seeds (104 days). Finally, the principal component analysis across the 13 traits over our 176 individuals, when organizing the data by their sex origin, showed no distinct clustering within the population, suggesting a nuanced interplay between the two seed types (Figure 7a).
2.6.2. Cuttings vs. seeds
The PERMANOVA analysis revealed notable distinctions between the type of germplasm sources, cuttings and seeds. These differences were particularly pronounced and statistically significant for certain traits, specifically the nodeNh (W = 0.94) and dtsm (W = 0.88), accompanied with an a very low p-value of 1.65E-10. This unequivocal result underscores the substantial dissimilarity between the two designated source types (Supplementary Table S7). Importantly, the origin of the plants, whether derived from cuttings or seeds, exerts an influence over other traits. CBDA, CBD, gih, CBC, and CBDp, all stand out, exhibiting remarkable statistical significance with p-values falling below the threshold of 0.05. Plants cultivated from seeds demonstrated notably greater height growth, with growth indices of 17.86 inches compared to 7.91 inches for plants grown from cuttings. This trend is consistent for the nodeNH as well, with seed-grown plants averaging 34 nodes while cutting-grown plants averaged 24 nodes. Additionally, seed-grown plants took an average of 27 days longer to achieve sexual maturity (dtsm), although no significant distinction between the two source types was observed regarding maturity attainment from the initiation of flowering. On a biochemical level, plants from cuttings exhibited markedly higher levels of CBDA, CBD, CBC, and CBD potential compared to their seed counterparts. Furthermore, the principal component analysis demonstrated a distinct clustering pattern, effectively categorizing plants into two distinct groups: those derived from cuttings and those from seeds (Figure 7b). This collective insight emphasizes the far-reaching impact of germplasm source on diverse traits within the cannabis accessions.
3. Discussion
Since its legalization, the cannabis industry has made a remarkable contribution to the gross domestic product (GDP), totaling 43.5 billion dollars, and sustaining over 151,000 jobs in Canada [50]. As the cannabis production modernizes and the demand for reliable and scientifically based cultivation rises, the necessity for informed genetic improvement to create pure and stabilized cultivars for therapeutic and commercial purposes becomes paramount [25]. As for any breeding program, target traits can be harnessed from the inherent diversity found within the species, employing well-phenotyped and characterized accessions as valuable resources. However, this is challenging in cannabis as it is predominantly dioecious and highly heterozygous, exhibiting substantial variation within population [6,11,27]. Yet another obstacle lies in the availability of cannabis seeds, with the absence of a public gene bank for breeders and the considerable expenses linked to seed procurement [15]. Compounded by the restricted quantity of seeds (ranging from 1 to 10 seeds per accession), ensuring optimal germination processes became imperative for our endeavors. Despite its significance, a scientifically established method for cannabis seed germination has yet to be developed [51]. Hence, we undertook comprehensive testing of every treatment available in both the legacy market and analogous species. Interestingly, direct sowing of cannabis seeds demonstrated the highest level of uniformity and a superior germination rate. This pattern differed from available studies where seed treatments generally yielded higher germination rates than the control group [36,37,38,39,40,41,51]. Notably, none of the aforementioned studies provided a comparison involving direct seeding in a growth substrate. It is also important to mention that most studies focused on sterilization treatment methods within an in vitro culture context instead of a greenhouse context [37,40,51].
In this study, we conducted a comprehensive assessment of six key agronomic traits, revealing substantial diversity and correlations between the 176 accessions. As demonstrated, a strong correlation between the fresh biomass and the yield was found, meaning that plants with a higher fresh biomass tend to also exhibit a higher yield of dried flowers, consistent with a prior study [52]. This correlation further underscores the importance of considering the overall size and growth of plants when aiming to optimize yield in cannabis cultivation, as previously demonstrated [53]. We also found a significant positive correlation between the days to maturity and days to sexual maturity indicating that the longer a plant takes to exhibit signs of sexual maturity—characterized in the industry by the emergence of floral structures during the vegetative phase along the main stem nodes—the later it will reach harvest maturity. Similar to Naim-Feil et al. (2021), our findings revealed a significant negative correlation between some of agronomical traits (dtsm and dtmp) and yield. In their paper a non-significant correlation of -0.12 was found between the days to maturity and the dried bud weight, suggesting that plants that take longer to reach sexual maturity and harvest maturity tend to yield less when it comes to the weight of the harvested dried flowers. These findings lay the groundwork for future breeding endeavors to consider these intricate relationships.
Characterization of five morphological traits further unveiled significant variations among cannabis plants. A strong positive correlation between growth index of internode length and growth index of height was documented. As expected, it indicates that as the internode lengths increase, the overall plant height also tends to increase [55]. Similarly, a significant positive correlation observed between growth index of height and the number of nodes at harvest implies that taller plants are associated with a greater number of nodes, as previously reported [56]. Additionally, the positive correlation between growth index of internode length and the number of nodes at harvest suggests that plants with longer internodes might also exhibit a higher node count, potentially indicating a combined effect of internode elongation and increased branching on overall plant structure. The overarching architecture of the cannabis plant holds significant importance, influencing both yield and serving as a constraint in indoor production systems. The insights from this study illuminate the interplay of diverse traits and offer valuable insights for potential exploitation.
A comprehensive analysis of 11 distinct cannabinoids and the potential THC and CBD content in our population revealed substantial variations in cannabinoid profile [57]. Significant positive and negative correlations among these compounds provided insights into their interactions and complexities and is consistent with previous studies [58,59,60,61]. The strong positive correlations observed between THCp-THCA, CBDp-CBDA, and CBD-CBDp suggest a consistent and coordinated relationship between these cannabinoid pairs as expected. THCA and CBDA being precursors of the potential THC and CBD, this strong correlation was anticipated and well-documented in the literature [18,21,52,56,62,63]. The negative correlations observe between CBDp-THCA, THCp-CBDA, THCp-CBDp, THCp-CBD, CBC-THCp were also expected as THC and CBD share the same precursor CBGA [56,61,64]. The influence of morphological and agronomic traits on major cannabinoids (THCp and CBDp) play a key role in cannabis breeding programs. Positive correlations were found between THCp and certain traits, shedding light on potential links between plant morphology and cannabinoid production. In contrast to previous studies ([56,61] we found a slight correlation (r = 0.27) between THCp and the growth index of internode length which suggests that there is a slight tendency for plants with higher THCp to also have slightly longer internodes. The positive correlations between plant height at harvest and both yield and fresh biomass suggest that taller cannabis plants tend to have higher yields and greater fresh biomass. The similar trend observed for canopy diameter at harvest further reinforces the notion that larger plant dimensions contribute to improved yield and biomass production. These findings underline the importance of plant size and growth characteristics in optimizing cannabis cultivation for higher productivity.
Similarly, we found positive relationships between certain agronomic traits, such as days to sexual maturity (dtsm), days to first flowers (dtf), and days to maturity from sowing/cutting (dtmp), and the THCp. These correlations suggest that there might be some influence of the plant’s growth timeline on its THCp, although the relationships are not extremely strong and could be influenced by other factors as well, as corroborated by Stack et al. (2021). In contrast to the findings of Naim et al. (2023), who suggested that breeding for high-yielding plants might not be confined to a specific chemotypic composition, our study reveals an intriguing dynamic between cannabinoid content and yield in cannabis. Specifically, we observed a significant negative correlation between THCp and yield, implying that there might be a trade-off between maximizing THC levels and achieving higher yields. Our findings emphasize the necessity for nuanced breeding strategies that account for the intricate relationships between cannabinoid profiles and yield. Feminized seeds and regular seeds are two types of cannabis seeds that differ primarily in their genetic makeup and reproductive characteristics [8]. Regular seeds are of high importance for breeders and growers to develop new varieties. Regular seeds exhibit a roughly 25% likelihood of producing male plants, which can pose challenges as non-fertilized female plants are preferred due to their higher cannabinoid production. In contrast, cannabis flexible sexuality has led to the development of an intelligent approach to masculinize female plants, using foliar sprays of specific plant growth regulators or inhibitors (e.g., silver thiosulfate)[8], to produce female seeds, so-called feminized seeds. Significant differences between plants derived from regular female seeds and feminized seeds were found in this study. The comparison yielded noteworthy and statistically significant differences, particularly evident in key traits such as days to maturity from sowing/cutting (dtmp), THCA content, and THCp. All means for these traits were notably higher in the case of plants from regular female seeds. This pattern suggests that plants from regular female seeds tended to exhibit extended maturity periods from sowing/cutting, higher concentrations of THCA, and greater THCp compared to their feminized seed counterparts. However, no differences were found between the two sex type for traits such as yield, CBDp, fresh biomass, gih, etc. These findings highlight a new substantial impact of source type on these specific traits and underscore the potential implications for cannabis cultivation and breeding strategies.
Moreover, we found significant differences between the use of cuttings and seeds as sources of germplasm. Notably, traits such as nodeNH and dtsm displayed considerable differences. These differences suggest potential advantages in terms of plant size and developmental timing for seed-derived plants. Interestingly, no significant distinctions were observed between the two source types in terms of days to maturity from sowing/cutting, days to maturity from flower initiation, fresh biomass, yield, and THCp. These findings indicate that while certain morphological and agronomical traits may exhibit variability based on the source of germplasm, key traits for the industry and breeding such as yield and days to maturity remain consistent between plants derived from seeds and cuttings. However, the observed distinction between plants derived from cuttings and those from seeds had a notable impact on the cannabinoid profile. Specifically, the concentrations of CBDA, CBD, CBC, and CBDp exhibited statistically significant differences, with higher mean concentrations observed in plants derived from cuttings. The significant differences in cannabinoid concentrations suggest that the genetic makeup of the plants, influenced by the source of germplasm, plays a crucial role in determining the resulting cannabinoid content. This tendency was also observed in another study [66] where the authors found higher CBD and THC content for vegetative cutting plants than from seed derived plants. While it is important to note that there is a possibility that the observed cannabinoid profile differences in cutting-derived plants might be influenced by the specific accessions chosen for the trial, further investigation is needed to determine any potential role of genotype in contributing to these differences. As cannabis cultivation becomes more scientific and demand-driven, strategic genetic enhancement becomes crucial. Our study aimed to establish foundational populations with quantified traits to guide breeding efforts. Overall, this study contributes to the intricate science of cannabis cultivation, offering a roadmap for informed breeding strategies and recognizing the nuanced interplay between genetics, growth, and chemical composition. Further research is warranted to refine these findings and advance cannabis cultivation practices.
4. Materials and Methods
4.1. Germination test
To optimize the germination process of cannabis seeds and minimize external influences, this study focused on identifying effective pre-treatment methods. Extensive research was conducted through a literature review and consultation with industry professionals to gather insights on germination techniques [36,37,38,39,40,41,42]. From the available information, seven pre-treatment methods were carefully selected, comprising five chemical and two physical approaches, (see Supplementary Table S1 for detailed descriptions) representing a total of 13 treatments: soaking in water for 18 or 24 hours (W-18, W-24), , soaking in 1 and 3% hydrogen peroxide (HP-1, HP-3), soaking in gibberellic acid solution 500 and 800 mg/L (GA-500, GA-800), , soaking in 1% bleach solution for 2 and 24 hours (NACL-2, NACL-24), soaking in potassium nitrate 1.5 and 3%: (KN-1.5, KN-3), knife scarification and soaking in water (K+W), sandpaper scarification and soaking in water (S+W) and direct sowing (SD).
Considering the challenges associated with procuring a sufficient quantity of homogenous drug-type cannabis seeds, an alternative approach was adopted. The germination tests were performed using inbred hemp-typed cannabis cv. Vega seeds, which contain 0.2% THC and 1.6% CBD [43]. The seeds were freshly produced in 2022 and obtained from Céréla Inc. in Quebec, Canada. Each pre-treatment method was applied to three replicates, each consisting of 10 seeds, ensuring a robust experimental design. The experimental setup took place in the high-performance greenhouse complex at Université Laval, offering precise control over environmental conditions to provide optimal growing conditions. The greenhouse maintained an 18-hour light and 6-hour dark cycle, with temperatures set at a constant 26°C, and a relative humidity of approximately 50%, creating an ideal atmosphere for seed germination. To execute the pre-treatment methods, the seeds were treated with the respective solutions and subsequently germinated in sterile Petri dishes (Fisherbrand™ Petri Dishes with Clear Lid, Thermo Fisher Scientific). The pre-treatments involved soaking the seeds in 15 ml of solution for different durations, depending on the specific treatment. After soaking, the seeds were rinsed with distilled water and then germinated for three days in Petri dishes with Whatman filter paper moistened with distilled water. Throughout the entire germination period, the Petri dishes were kept in darkness, and the germination rate was recorded daily for each treatment.
4.2. Plant materials
Under our cannabis research license (LIC-QX0ZJC7SIP-2021) and in full compliance with Health Canada’s regulations, the seeds and cuttings used in this study were legally procured and imported from different sources. Overall, a population of 210 cannabis accessions, representing the cannabis drug-type legal market, was assembled for this study (refer to Supplementary Table S2 for details). Out of the 210 accessions, 62 accessions were obtained as 10-day-old cuttings from our research partner, Fuga Group Inc., Quebec, Canada, as we encountered challenges in finding a reliable seed source. For the remaining accessions, both feminized and regular seeds were cultivated. In the case of regular seeds, multiple seeds were germinated, and a PCR-based sex-determination test (see full description in the following section 1.4) was conducted to selectively retain only the female plants. Due to various factors such as seed germination failures and the absence of female plants in certain accessions, the full phenotyping was carried out on 176 accessions (See supplementary Table S2). These accessions underwent comprehensive phenotypic analysis to gather valuable data for this study.
4.3. Growing conditions
The cannabis plants were cultivated in two separate 50 m2 fully blacked-out compartments within high-performance greenhouses at Université Laval. One compartment was dedicated to the vegetative stage, while the other was used for the flowering stage ( Supplementary Figure S1). The cultivation took place at three different time-points, spanning from July 2022 to May 2023. Throughout the growth period, the plants were illuminated by high-performance FloraQueen LED lights (Futur-Vert Inc., Quebec, Canada) positioned 2 feet above the plants. The light intensity was adjusted to maintain a maximum intensity of approximately 1000 μmol s-1 with an average light intensity 550 μmol s-1. For the beginning of the vegetative stage, which includes germination, the plants were placed under HPS lights. These lights provided a maximum intensity of approximately 600 watts in the vegetative compartment (Supplementary Figure S1). During flowering, the light intensity was measured daily using HOBO USB Micro Station Data Logger (H21-USB) and Solar Radiation (Silicon Pyranometer) (S-LIB-M003) and Photosynthetic Light (PAR) (S-LIA-M003) sensors installed in the greenhouse. During the vegetative stage, the temperature was set at 26 °C during the day and 22 °C during the night, with a relative humidity of 60% during the day and 55% during the night. In the flowering stage, the temperature was adjusted to 25 °C during the day and 21 °C during the night, with a relative humidity of 72% during the day and 70% during the night (Supplementary Table S3).
A conventional cannabis cultivation method was employed in this study. Briefly, at first, the seeds were germinated in multicellular trays using PROMIX-BX soil mix (Promix). Subsequently, the seedlings were transplanted into 4-inch, 1-gallon, and 5-gallon pots (Gérard Bourbeau & Fils), utilizing organic Lambert EPM soil mix (Lambert) for the remainder of their growth (Supplementary Figure S2). The plants underwent a vegetative phase for 5-7 weeks, starting from the sowing date or the reception of cuttings, depending on their height. Afterward, the plants were transitioned to the flowering phase under a 12-hour photoperiod. The duration of the flowering phase ranged from 8 to 10 weeks, depending on the maturity progression.
Nutritional requirements were closely monitored and adjusted accordingly throughout the cultivation period, following a fertilization program designed by Marie-Odile Belley (a cannabis agronomist at Plant Products Inc., Quebec, Canada). The plants received daily fertigation with a nutrient solution consisting of various components, including PP-Optimum (12-2-14), PP-MJ Boost (15-30-15), chelated micronutrients from PP, potassium sulfate, ACTIV (0-0-5), and EZGro Armour (0-0-15) (Plant Products Inc., Quebec, Canada). Soil pH and electrical conductivity (EC) were regularly monitored on a weekly basis, utilizing soil analyses performed by Plant Products Inc., Quebec, Canada. The target soil pH range was maintained between 6 and 6.5, while the optimal EC levels were adjusted based on the growth stage (see details in the Supplementary Table S4). To provide support and prevent plant breakage, 42" tall metal cages were installed in the pots at the onset of the first flowering week. No physical modifications or alterations (such as pruning and topping) were made to the plants to avoid interfering with the expression of their natural phenotype. However, dead, damaged, or yellowing leaves, as well as those obstructing the inflorescences, were selectively removed at various stages of cultivation. Pest management strategies involved the introduction of predatory insects (Amblyseius swirskii ((by Anatis and Biobest)) and the application of Zerotol (BioSafe Systems) to prevent botrytis infection during the initial experiment.
4.4. DNA extraction and sex determination
4.4.1. Sample collection and preparation
For each accession, approximately 50 mg of young leaf tissues were collected for DNA extraction. Collected leaf tissues were dried for 4 days using a desiccating agent (Drierite; Xenia, OH, USA) and then ground with metallic beads in a RETSCH MM 400 mixer mill (Fisher Scientific, MA, USA). DNA extraction was performed using the CTAB-chloroform protocol. In brief, the powdered tissue was treated with a CTAB buffer solution, followed by phenol-chloroform extraction. The resulting DNA pellet was washed with ethanol and re-suspended in water. DNA quantification was done with a Qubit fluorometer using the dsDNA HS assay kit (Thermo Fisher Scientific, MA, USA) and subsequently adjusted to 10 ng/µl for each sample.
4.4.2. Polymerase Chain Reaction (PCR) for Sex Determination
Sex of cannabis individuals was predicted at the seedling stage using a PCR-based assay described by [44,45] with the following oligos: SCAR119_F:5′-TCAAACAACAACAAACCG-3′ and SCAR119_R: 5′-GAGGCCGATAATTGACTG-3′. DNA fragment analysis was performed on 1.5% agarose gel electrophoresed for 30 min (10V/cm) in TAE buffer (0.4 M Tris acetate pH 8.3, 0.01 M EDTA). The gel was stained with SYBR safe DNA gel (Invitrogen, MA, USA) and revealed with a gel imaging fluorescence system. Male cannabis individuals were identified by the occurrence of a 119 bp DNA fragment.
4.5. Phenotype characterization
4.5.1. Agronomic and morphological traits
Data on various agronomic traits were collected throughout the growth stages of the cannabis plants. In the vegetative stage, measurements were taken for plant height (H-v), stem diameter (SD-v) at three locations on the main branch using a Fisherbrand digital caliper and measuring tape, leaf count (LC), date of sexual maturity (DSM), number of nodes (NN-v), and canopy diameter (CD-v). During the flowering stage, measurements included plant height (H-f), stem diameter (SD-f), presence of visible axillary stems (AS), number of nodes (NN-f), date of the appearance of the first flowers (DTF), canopy diameter (CD-f), date of trichome appearance (DT), trichome coloration (TC), pistil coloration (PC), and flower maturity date (FMD). For the statistic analysis, plant height at harvest (hh), stem diameter at harvest (sdah) and canopy diameter at harvest (cdh) we’re used. Additionally, qualitative characteristics related to plant and flower appearance such as leaf shape, similarity between axillary branch and main branch, leaf, trichomes and pistil coloration, maturity data, disease susceptibility were recorded. In order to assess various growth parameters, growth indexes were generated for plant height (gih), canopy diameter (gicd), stem diameter (gisd), number of nodes (gin), and internode length (giinl). This was achieved by calculating the difference between the data recorded during the first week of flowering and the data obtained at harvest.
Harvesting was conducted when the plants reached approximately 8-10 weeks based on their maturity criteria. This included plants with 60-70% of trichomes displaying a milky coloration and 5-10% of trichomes showing an amber coloration (Supplementary Figure S3), in addition to other visual elements such as leaf and pistil coloration and the shape and density of flowers ( Supplementary Figure S4). The fresh biomass of the plants was also recorded during harvest. After harvesting, the plants were pruned to keep only the stems with flowers and then dried in the dark for 10 days at a temperature of 16°C and a relative humidity of 58%. Vertical drying racks were utilized to facilitate proper airflow and drying efficiency. Finally, the plants were manually trimmed using pruning shears, and yield data was collected, corresponding to the weight of the trimmed and dried flowers.
4.5.2 Chemical analysis
Samples of trimmed and dried flowers, weighing 5 grams each (representative of whole plant), were analyzed for cannabinoid content at the Metabolomics Platform in the Institute of Nutrition and Functional Foods (INAF), Université Laval, QC, Canada, following a modified method described by Mudge et al. (2018). Samples were ground to a mesh size less than 1 mm using a mortar and pestle. A representative sample of 200 mg was then extracted in 25 mL of 80% methanol through sonication for 15 minutes. The extract was subsequently centrifuged for 5 minutes at 4500 g, and the resulting supernatant was filtered using a 0.22 µm nylon filter and then diluted by factors of 2 and 20. The analysis of cannabinoids was carried out using a UPLC Acquity I-Class system (Waters Corporation, MA, USA) with a PDA UV detector. The compounds were separated on a Cortecs 1.6 µm, 2.1 mm X 150 mm column (Waters Corporation, MA, USA) maintained at 30°C. The mobile phase consisted of ammonium formate 20mM pH 2.92 (A) and acetonitrile 100% (B). The gradient program was set as follows: 0-6.4 minutes, 76% B; 6.5-8 minutes, 99% B. From 8.1 to 10 minutes, the conditions were reinitialized at 76% B. The flow rate was 0.45 mL/min, and the injection volume was 1 µL. Detection was performed at a wavelength of 228 nm. To quantify cannabinoids, 5-points calibration curves were used in the range of 1-100 mg/L for all standards.
To ensure the reliability and consistency of the results provided by the method of cannabinoid extraction and analysis, a rigorous standardization approach was employed. A validation test was conducted on eight samples to assess the accuracy and consistency of the data obtained. Each sample underwent three replicates, each comprising three separate extractions and analyses. Additionally, three samples out of the eight were selected to undergo three injections per sample, thus evaluating the method’s efficiency (Supplementary Table S5).
4.6. Statistical Analysis
Data preprocessing steps were undertaken, including data cleaning, outlier removal, and handling of missing values. Normality assumptions were assessed using Shapiro-Wilk normality test based on the distribution of the data [46]. The distribution of data for each trait was computed to determine if it followed a normal distribution. For datasets that exhibited a normal distribution, we conducted Analysis of Variance (ANOVA), while, for datasets that deviated from a normal distribution, a Permutational Analysis of Variance (PERMANOVA) was performed [47]. To evaluate the relationship between variables, correlation analyses were performed with the PerformanceAnalytics [48] and corrplot packages [49] in R Regarding the biochemical traits, where the data fell below the minimum detectable threshold, these values were substituted with zeros.
5. Conclusions
In conclusion, this study delves into the complexities of cannabis breeding within the Canadian legal market. By closely examining 176 cannabis accessions under controlled conditions, we have gained crucial insights into their agronomic, morphologic, and biochemical traits. Our germination assay and detailed trait analysis have revealed valuable information for precision breeding and cultivar development. We have uncovered how traits related to maturity time, yield, and biomass are linked, and we have untangled the intricate relationships within physical attributes. Exploring cannabinoid profiles has unveiled diversity in major cannabinoids like THC and CBD, and their interactions. A key finding is that the plant’s origin, regular female seeds or feminized seeds, and the choice of using cuttings or seeds significantly affect traits like maturity time and cannabinoid profile. This research lays the groundwork for future breeding efforts, aiming to develop optimized and genetically stabilized cannabis varieties. With the cannabis industry evolving and contributing greatly to the Canadian and the world’s economy, these insights will shape genetics and breeding practices for the development of medicinal and commercial varieties. These insights will allow further exploration and refinement of this plant and shape the future of cannabis cultivation and breeding.
Supplementary Materials
The following supporting information can be downloaded at the website of this paper posted on Preprints.org, Supplementary Figure S1. Greenhouses compartments at Laval University, Quebec, Canada used for the phenotyping trials. A) The vegetative compartment B) The flowering compartment. Supplementary Figure S2. Types of growth containers for plant development. A) 72 multicellular trays, B) 4-inches pot, C) 1-gallon pots, D) 5-gallons pots used from week 5 of vegetative through harvest. Supplementary Figure S3. The trichome coloration at different growth stages. A) Displays clear trichomes, characterized by their transparent appearance. B) Milky trichomes are depicted, displaying a cloudy and opaque coloration. C) A mixture of amber and milky trichomes, representing a combination of golden hues and opaque shades. SSupplementary Figure S4. A visual comparison of cannabis flower maturity. A) A mature flower of cannabis plant cv. AN-14, displaying clear visual cues (e.g., color change of the leaf, darkening of the pistils, and compact flower shape) indicating maturity. B) An immature flower of cannabis plant cv. AO-84, lacking evident visual indicators of maturity. Supplementary Figure S5. Visual representation of the phenotypic diversity in inflorescences of 175 Cannabis sativa L. drug-type varieties used in this study. Supplementary Table S1. Detailed description of pre-treatments used for Cannabis sativa seed germination experiment. Supplementary Table S2. List and description of cannabis accessions used in this study. Supplementary Table S3. Growth conditions for the greenhouse experiments. Supplementary Table S4. Optimum nutrition scale for C. sativa developped by agronomist M. Belley. Supplementary Table S5. Validation test to assess accuracy, reproducibility and overall consistency of cannabinoid profiling. Supplementary Table S6. A detailed description of the cannabis seed germination rate using 13 different treatments. Supplementary Table S7. ANOVA and PERMANOVA results for all traits in the 176 C. sativa population. Supplementary Table S8. Pearson correlation coefficients for seven morphological traits, five agronomical traits and two major cannabinoids (X & Y) for the 176 C. sativa population.
Author Contributions
DT, and EL conceived the project. EL and RB carried out the phenotyping. MdR performed PCR test and statistical analysis. EL and DT contributed to writing the manuscript. All authors have reviewed and approved the manuscript.
Acknowledgments
This work was conducted as part of a collaborative research project funded by Fuga Group Inc. and NSERC Alliance [#ALLRP 568653 – 21 to D.T.]. The authors wish to thank Fuga Group Inc. for supporting this project. The authors also wish to thank Ms. Justine Richard-Giroux, from Fuga Group Inc., for providing guidance on producing cannabis plants. The authors also extend their sincere appreciation to Sean Kyne for his invaluable contributions and assistance in this work.
Conflicts of Interest
The authors declare that they have no competing interests.
References
- Lapierre, É.; Monthony, A.S.; Torkamaneh, D. Genomics-Based Taxonomy to Clarify Cannabis Classification. Genome 2023. [Google Scholar] [CrossRef] [PubMed]
- Bonini, S.A.; Premoli, M.; Tambaro, S.; Kumar, A.; Maccarinelli, G.; Memo, M.; Mastinu, A. Cannabis Sativa: A Comprehensive Ethnopharmacological Review of a Medicinal Plant with a Long History. J Ethnopharmacol 2018, 227, 300–315. [Google Scholar] [CrossRef] [PubMed]
- Frère Marie Victorin. Flore Laurentienne, 3rd ed.; Gaëtan, Morin, Ed.; Montréal, 1935; Vol. 1. [Google Scholar]
- Small, E. Cannabis 2017.
- Hesami, M.; Pepe, M.; Alizadeh, M.; Rakei, A.; Baiton, A.; Maxwell, A.; Jones, P. Recent Advances in Cannabis Biotechnology. 2020. [Google Scholar] [CrossRef]
- Zheng, Y. Handbook of Cannabis Production in Controlled Environments. Handbook of Cannabis Production in Controlled Environments 2022. [Google Scholar] [CrossRef]
- Clarke, R.C.; Merlin, M.D. Cannabis. Evolution and Ethnobotany, University of Cali 2013.
- Monthony, A.S.; Ronne, M. de; Torkamaneh, D. Exploring Ethylene-Related Genes in Cannabis Sativa: Implications for Sexual Plasticity. bioRxiv 2023, 2023.04.28.538750. [Google Scholar] [CrossRef]
- Small, E.; Cronquist, A. A PRACTICAL AND NATURAL TAXONOMY FOR CANNABIS. Taxon 1976, 25, 405–435. [Google Scholar] [CrossRef]
- Petit, J.; Salentijn, E.M.J.; Paulo, M.J.; Thouminot, C.; van Dinter, B.J.; Magagnini, G.; Gusovius, H.J.; Tang, K.; Amaducci, S.; Wang, S.; et al. Genetic Variability of Morphological, Flowering, and Biomass Quality Traits in Hemp (Cannabis Sativa L.). Front Plant Sci 2020, 11, 497381. [Google Scholar] [CrossRef]
- Monthony, A.; Page, S.; Hesami, M.; Jones, A. The Past, Present and Future of Cannabis Sativa Tissue Culture; 2020. [Google Scholar]
- Hesami, M.; Baiton, A.; Alizadeh, M.; Pepe, M.; Torkamaneh, D.; Jones, A.M.P. Advances and Perspectives in Tissue Culture and Genetic Engineering of Cannabis. International Journal of Molecular Sciences 2021, Vol. 22, Page 5671 2021, 22, 5671. [Google Scholar] [CrossRef]
- McPartland, J.M.; Clarke, R.C.; Watson, D.P. Hemp Diseases and Pests. Integr Environ Assess Manag 2000, 11, 276. [Google Scholar]
- Zlas, J.; Stark, H.; Seligman, J.; Levy, R.; Werker, E.; Breuer, A.; Mechoulam, R. Early Medical Use of Cannabis. Nature 1993, 363, 215. [Google Scholar] [CrossRef]
- Torkamaneh, D.; Jones, A.M.P. Cannabis, the Multibillion Dollar Plant That No Genebank Wanted. Genome 2021, 65, 1–5. [Google Scholar] [CrossRef] [PubMed]
- Crépault, J.F. Cannabis Legalization in Canada: Reflections on Public Health and the Governance of Legal Psychoactive Substances. Front Public Health 2018, 6. [Google Scholar] [CrossRef] [PubMed]
- Cannabis - Worldwide | Statista Market Forecast. Available online: https://www.statista.com/outlook/hmo/cannabis/worldwide (accessed on 3 September 2023).
- Martínez, V.; Iriondo De-Hond, A.; Borrelli, F.; Capasso, R.; Del Castillo, M.D.; Abalo, R. Cannabidiol and Other Non-Psychoactive Cannabinoids for Prevention and Treatment of Gastrointestinal Disorders: Useful Nutraceuticals? International Journal of Molecular Sciences 2020, Vol. 21, Page 3067 2020, 21, 3067. [Google Scholar] [CrossRef]
- Hammond, D.; Goodman, S. Knowledge of Tetrahydrocannabinol and Cannabidiol Levels Among Cannabis Consumers in the United States and Canada. Cannabis Cannabinoid Res 2022, 7, 345–354. [Google Scholar] [CrossRef] [PubMed]
- Mudge, E.M.; Murch, S.J.; Brown, P.N. Chemometric Analysis of Cannabinoids: Chemotaxonomy and Domestication Syndrome. Sci Rep 2018, 8, 13090. [Google Scholar] [CrossRef]
- Russo, E.B. Taming THC: Potential Cannabis Synergy and Phytocannabinoid-Terpenoid Entourage Effects. Br J Pharmacol 2011, 163, 1344–1364. [Google Scholar] [CrossRef] [PubMed]
- Scholey, A.; Kennedy, D.; Wesnes, K.; Persson, J.; Bringlov, E.; Nilsson, L.G.; Nyberg, L.; Solomon, P. The Psychopharmacology of Herbal Extracts: Issues and Challenges (Multiple Letters). Psychopharmacology (Berl) 2005, 179, 705–707. [Google Scholar] [CrossRef]
- Via, S.; Lande, R. GENOTYPE-ENVIRONMENT INTERACTION AND THE EVOLUTION OF PHENOTYPIC PLASTICITY. Evolution (N Y) 1985, 39, 505–522. [Google Scholar] [CrossRef]
- Schlichting, C.D. THE EVOLUTION OF PHENOTYPIC PLASTICITY IN PLANTS. Annual Review of Ecology and Systematics 2003, 17, 667–693. [Google Scholar] [CrossRef]
- Barcaccia, G.; Palumbo, F.; Scariolo, F.; Vannozzi, A.; Borin, M.; Bona, S. Potentials and Challenges of Genomics for Breeding Cannabis Cultivars. Front Plant Sci 2020, 11. [Google Scholar] [CrossRef]
- Kim, J. Il; Kim, J.Y. New Era of Precision Plant Breeding Using Genome Editing. Plant Biotechnol Rep 2019, 13, 419–421. [Google Scholar] [CrossRef]
- Holland, J. The Pot Book : A Complete Guide to Cannabis : Its Role in Medicine, Politics, Science, and Culture. 2010, 551.
- Jones, M.; Monthony, A.S. Cannabis Propagation. Handbook of Cannabis Production in Controlled Environments 2022, 91–121. [Google Scholar] [CrossRef]
- Adamek, K.; Jones, A.M.P.; Torkamaneh, D. Accumulation of Somatic Mutations Leads to Genetic Mosaicism in Cannabis. Plant Genome 2022, 15. [Google Scholar] [CrossRef]
- Krishna, H.; Alizadeh, M.; Singh, D.; Singh, U.; Chauhan, N.; Eftekhari, M.; Sadh, R.K. Somaclonal Variations and Their Applications in Horticultural Crops Improvement. 3 Biotech 2016, 6, 1–18. [Google Scholar] [CrossRef]
- Duvick, D.N. Biotechnology in the 1930s: The Development of Hybrid Maize. Nature Reviews Genetics 2001 2:1 2001, 2, 69–74. [Google Scholar] [CrossRef] [PubMed]
- Curry, H.A. Hybrid Seeds in History and Historiography. Isis 2022, 113, 610–617. [Google Scholar] [CrossRef] [PubMed]
- Breseghello, F. Traditional and Modern Plant Breeding Methods with Examples in Rice (Oryza Sativa L.) Alexandre Siqueira Guedes Coelho. 2013. [Google Scholar] [CrossRef]
- Cobb, J.N.; DeClerck, G.; Greenberg, A.; Clark, R.; McCouch, S. Next-Generation Phenotyping: Requirements and Strategies for Enhancing Our Understanding of Genotype–Phenotype Relationships and Its Relevance to Crop Improvement. Theoretical and Applied Genetics 2013 126:4 2013, 126, 867–887. [Google Scholar] [CrossRef]
- Priyadarshan, P.M. PLANT BREEDING: Classical to Modern. Plant Breeding: Classical to Modern 2019, 1–570. [Google Scholar] [CrossRef]
- Conner, P.J. Effects of Stratification, Germination Temperature, and Pretreatment with Gibberellic Acid and Hydrogen Peroxide on Germination of ‘Fry’ Muscadine (Vitis Rotundifolia) Seed. HortScience 2008, 43, 853–856. [Google Scholar] [CrossRef]
- Jovicic, D.; Nikolic, Z.; Sikora, V.; Tamindžic, G.; Petrovic, G.; Ignjatov, M.; Miloševic, D. Comparison of Methods for Germination Testing of Cannabis Sativa Seed. Ratarstvo i povrtarstvo 2019, 56, 71–75. [Google Scholar] [CrossRef]
- Moon, Y.H.; Cha, Y.L.; Lee, J.E.; Kim, K.S.; Kwon, D.E.; Kang, Y.K. Investigation of Suitable Seed Sizes, Segregation of Ripe Seeds, and Improved Germination Rate for the Commercial Production of Hemp Sprouts (Cannabis Sativa L.). J Sci Food Agric 2020, 100, 2819–2827. [Google Scholar] [CrossRef] [PubMed]
- Ruttanaruangboworn, A.; Chanprasert, W.; Tobunluepop, P.; Onwimol, D. Effect of Seed Priming with Different Concentrations of Potassium Nitrate on the Pattern of Seed Imbibition and Germination of Rice (Oryza Sativa L.). J Integr Agric 2017, 16, 605–613. [Google Scholar] [CrossRef]
- Sorokin, A.; Singh Yadav, N.; Gaudet, D.; Kovalchuk, I. Development and Standardization of Rapid and Efficient Seed Germination Protocol for Cannabis Sativa. 2021. [Google Scholar] [CrossRef] [PubMed]
- Wahid, A.; Sehar, S.; Perveen, M.; Gelani, S.; Basra, S.M.A.; Farooq, M. Seed Pretreatment with Hydrogen Peroxide Improves Heat Tolerance in Maize at Germination and Seedling Growth Stages. Seed Science and Technology 2008, 36, 633–645. [Google Scholar] [CrossRef]
- Islam, M.M.; Rengel, Z.; Storer, P.; Siddique, K.H.M.; Solaiman, Z.M. Industrial Hemp (Cannabis Sativa L.) Varieties and Seed Pre-Treatments Affect Seed Germination and Early Growth of Seedlings. Agronomy 2022, Vol. 12, Page 6 2021, 12, 6. [Google Scholar] [CrossRef]
- Grain Cultivars - UniSeeds Inc. Available online: https://www.uniseeds.ca/en/varieties/grain-cultivars/ (accessed on 3 September 2023).
- Törjék, O.; Bucherna, N.; Kiss, E.; Homoki, H.; Finta-Korpelová, Z.; Bócsa, I.; Nagy, I.; Heszky, L.E. Novel Male-Specific Molecular Markers (MADC5, MADC6) in Hemp. Euphytica 2002, 127, 209–218. [Google Scholar] [CrossRef]
- Borin, M.; Palumbo, F.; Vannozzi, A.; Scariolo, F.; Sacilotto, G.B.; Gazzola, M.; Barcaccia, G. Developing and Testing Molecular Markers in Cannabis Sativa (Hemp) for Their Use in Variety and Dioecy Assessments. Plants 2021, 10, 2174. [Google Scholar] [CrossRef]
- R: The R Project for Statistical Computing. Available online: https://www.r-project.org/ (accessed on 27 August 2023).
- Vicente-Gonzalez, L.; Luis, J.; Maintainer, V.-V. Package “PERMANOVA” Type Package Title Multivariate Analysis of Variance Based on Distances and Permutations Version 0. 2.0. 2022. [Google Scholar]
- Peterson, B.G.“Zenith” and S.J.M.; Carl, P.; Boudt, K.,; Bennett, R.; Ulrich, J.; Zivot, E.; Cornilly, D.; Hung, E.; Lestel, M.; Balkissoon, K.; et al. Econometric Tools for 45 Performance and Risk Analysis. Available online: https://github.com/braverock/PerformanceAnalytics (accessed on 28 August 2023).
- Wei, T.; Simko, V.; Levy, M.; Xie, Y.; Jin, Y.; Zemla, J. Visualization of a Correlation Matrix [R Package Corrplot Version 0.92]. 2021.
- An Industry Makes Its Mark | Deloitte Canada. Available online: https://www2.deloitte.com/ca/en/pages/consumer-business/articles/an-industry-makes-its-mark.html (accessed on 28 July 2023).
- Pepe, M.; Hesami, M.; Jones, A.M.P. Machine Learning-Mediated Development and Optimization of Disinfection Protocol and Scarification Method for Improved In Vitro Germination of Cannabis Seeds. Plants 2021, Vol. 10, Page 2397 2021, 10, 2397. [Google Scholar] [CrossRef]
- Carlson, C.H.; Stack, G.M.; Jiang, Y.; Taşklran, B.; Cala, A.R.; Toth, J.A.; Philippe, G.; Rose, J.K.C.; Smart, C.D.; Smart, L.B. Morphometric Relationships and Their Contribution to Biomass and Cannabinoid Yield in Hybrids of Hemp (Cannabis Sativa). J Exp Bot 2021, 72, 7694–7709. [Google Scholar] [CrossRef] [PubMed]
- Backer, R.; Schwinghamer, T.; Rosenbaum, P.; McCarty, V.; Eichhorn Bilodeau, S.; Lyu, D.; Ahmed, M.B.; Robinson, G.; Lefsrud, M.; Wilkins, O.; et al. Closing the Yield Gap for Cannabis: A Meta-Analysis of Factors Determining Cannabis Yield. Front Plant Sci 2019, 10, 434233. [Google Scholar] [CrossRef]
- Naim-Feil, E.; Pembleton, L.W.; Spooner, L.E.; Malthouse, A.L.; Miner, A.; Quinn, M.; Polotnianka, R.M.; Baillie, R.C.; Spangenberg, G.C.; Cogan, N.O.I. The Characterization of Key Physiological Traits of Medicinal Cannabis (Cannabis Sativa L.) as a Tool for Precision Breeding. BMC Plant Biol 2021, 21, 294. [Google Scholar] [CrossRef] [PubMed]
- Liu, Z.; Li, X.; Wang, Z.; Sun, Q. Contrasting Strategies of Alfalfa Stem Elongation in Response to Fall Dormancy in Early Growth Stage: The Tradeoff between Internode Length and Internode Number. PLoS One 2015, 10, e0135934. [Google Scholar] [CrossRef] [PubMed]
- Vergara, D.; Feathers, C.; Huscher, E.L.; Holmes, B.; Haas, J.A.; Kane, N.C. Widely Assumed Phenotypic Associations in Cannabis Sativa Lack a Shared Genetic Basis. PeerJ 2021, 9, e10672. [Google Scholar] [CrossRef]
- Gorelick, J.; Bernstein, N. Chemical and Physical Elicitation for Enhanced Cannabinoid Production in Cannabis. Cannabis sativa L. - Botany and Biotechnology 2017, 439–456. [Google Scholar] [CrossRef]
- Andre, C.M.; Hausman, J.F.; Guerriero, G. Cannabis Sativa: The Plant of the Thousand and One Molecules. Front Plant Sci 2016, 7, 174167. [Google Scholar] [CrossRef]
- Hazekamp, A.; Fischedick, J.T. Cannabis - from Cultivar to Chemovar. Drug Test Anal 2012, 4, 660–667. [Google Scholar] [CrossRef]
- van Bakel, H.; Stout, J.M.; Cote, A.G.; Tallon, C.M.; Sharpe, A.G.; Hughes, T.R.; Page, J.E. The Draft Genome and Transcriptome of Cannabis Sativa. Genome Biol 2011, 12, R102. [Google Scholar] [CrossRef]
- Naim-Feil, E.; Elkins, A.C.; Malmberg, M.M.; Ram, D.; Tran, J.; Spangenberg, G.C.; Rochfort, S.J.; Cogan, N.O.I. The Cannabis Plant as a Complex System: Interrelationships between Cannabinoid Compositions, Morphological, Physiological and Phenological Traits. Plants 2023, 12, 493. [Google Scholar] [CrossRef]
- Laverty, K.U.; Stout, J.M.; Sullivan, M.J.; Shah, H.; Gill, N.; Holbrook, L.; Deikus, G.; Sebra, R.; Hughes, T.R.; Page, J.E.; et al. A Physical and Genetic Map of Cannabis Sativa Identifies Extensive Rearrangements at the THC/CBD Acid Synthase Loci. Genome Res 2019, 29, 146–156. [Google Scholar] [CrossRef] [PubMed]
- Kim, J.; Choi, P.; Park, Y.T.; Kim, T.; Ham, J.; Kim, J.C. The Cannabinoids, CBDA and THCA, Rescue Memory Deficits and Reduce Amyloid-Beta and Tau Pathology in an Alzheimer’s Disease-like Mouse Model. International Journal of Molecular Sciences 2023, Vol. 24, Page 6827 2023, 24, 6827. [Google Scholar] [CrossRef] [PubMed]
- Aizpurua-Olaizola, O.; Soydaner, U.; Öztürk, E.; Schibano, D.; Simsir, Y.; Navarro, P.; Etxebarria, N.; Usobiaga, A. Evolution of the Cannabinoid and Terpene Content during the Growth of Cannabis Sativa Plants from Different Chemotypes. J Nat Prod 2016, 79, 324–331. [Google Scholar] [CrossRef]
- Stack, G.M.; Toth, J.A.; Carlson, C.H.; Cala, A.R.; Marrero-González, M.I.; Wilk, R.L.; Gentner, D.R.; Crawford, J.L.; Philippe, G.; Rose, J.K.C.; et al. Season-Long Characterization of High-Cannabinoid Hemp (Cannabis Sativa L.) Reveals Variation in Cannabinoid Accumulation, Flowering Time, and Disease Resistance. GCB Bioenergy 2021, 13, 546–561. [Google Scholar] [CrossRef]
- Coffman, C.B.; Gentner, W.A. Greenhouse Propagation of Cannabis Sativa L. by Vegetative Cuttings. Econ Bot 1979, 33, 124–127. [Google Scholar] [CrossRef]
Figure 1.
The results of cannabis seed germination test using 13 different treatments. These treatments include water soaking for 18 or 24 hours (W-18, W-24), peroxide soaking at concentrations of 1% and 3% (HP-1, HP-3), soaking in gibberellic acid solutions at concentrations of 500 mg/L and 800 mg/L (GA-500, GA-800), as well as soaking in 1% bleach solutions for 2 and 24 hours (NaCl-2, NaCl-24), and 1.5% and 3% potassium nitrate solutions (KN-1.5, KN-3). Additionally, two scarification methods were tested, knife scarification followed by water soaking (K+W), and sandpaper scarification followed by water soaking (S+W). A control group with direct sowing (SD) was also included.
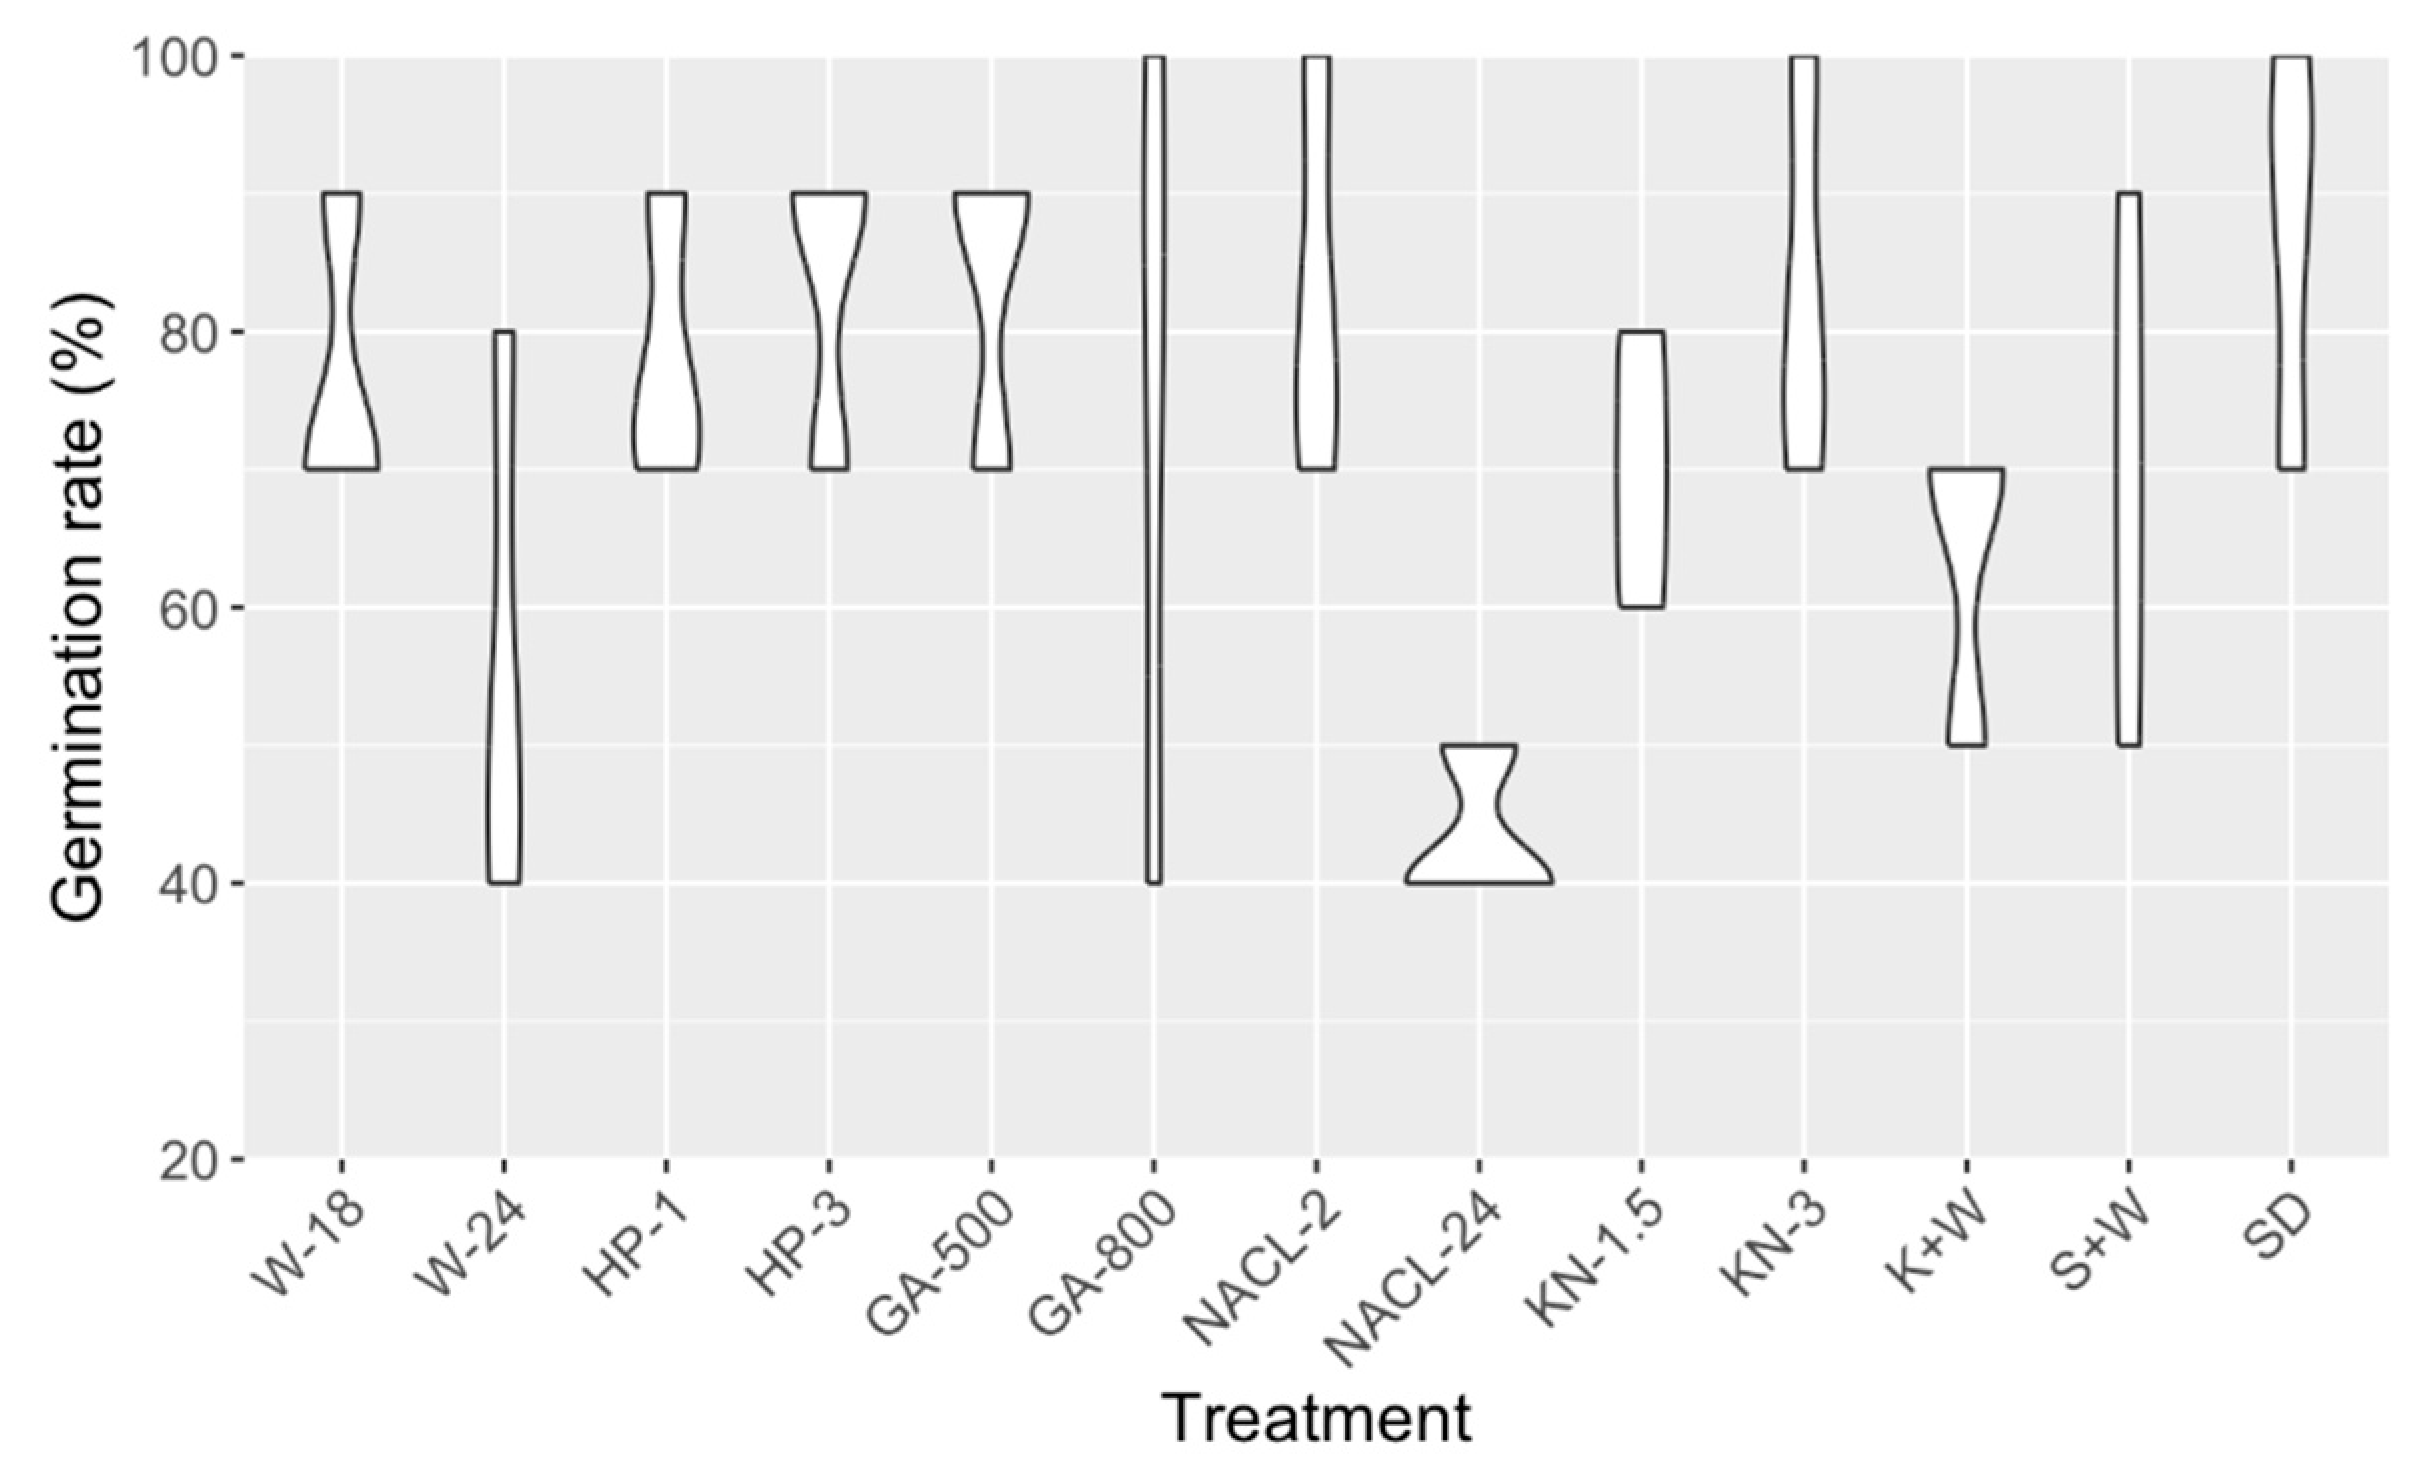
Figure 2.
A visual insight into agronomic traits. Scatter plot matrix, distribution, and correlation of coefficients for six agronomical traits; days to sexual maturity (dtsm), days to first flower (dtf), days to maturity from cuttings/sowing (dtmp), days to maturity from flower initiation (dtmf), yield, and fresh biomass (fb). The stars indicate significance levels, ranging from zero to three, where higher star counts signify greater significance.

Figure 3.
A visual insight into morphological traits. Scatter plot matrix, distribution, and correlation of coefficients for seven morphological traits; plant height at harvest (hh). growth index height (gih), stem diameter at harvest (sdah), growth index stem diameter (gisd), canopy diameter at harvest (cdh), canopy diameter growth index (gicd), number of nodes at harvest (nodeNH), growth index internode length (giinl). The stars indicate significance levels, ranging from zero to three, where higher star counts signify greater significance.

Figure 4.
A visual insight into biochemical traits. Scatter plot matrix, distribution, and correlation of coefficients for nine biochemical traits; tetrahydrocannabinolic acid (THCA), delta-9-tetrahydrocannabinol (D9THC), cannabidiolic acid (CBDA), cannabidiol (CBD), cannabigerolic acid (CBGA), cannabigerol (CBG), cannabichromene (CBC), potential THC (THCP) and potential CBD (CBDP). The stars indicate significance levels, ranging from zero to three, where higher star counts signify greater significance.
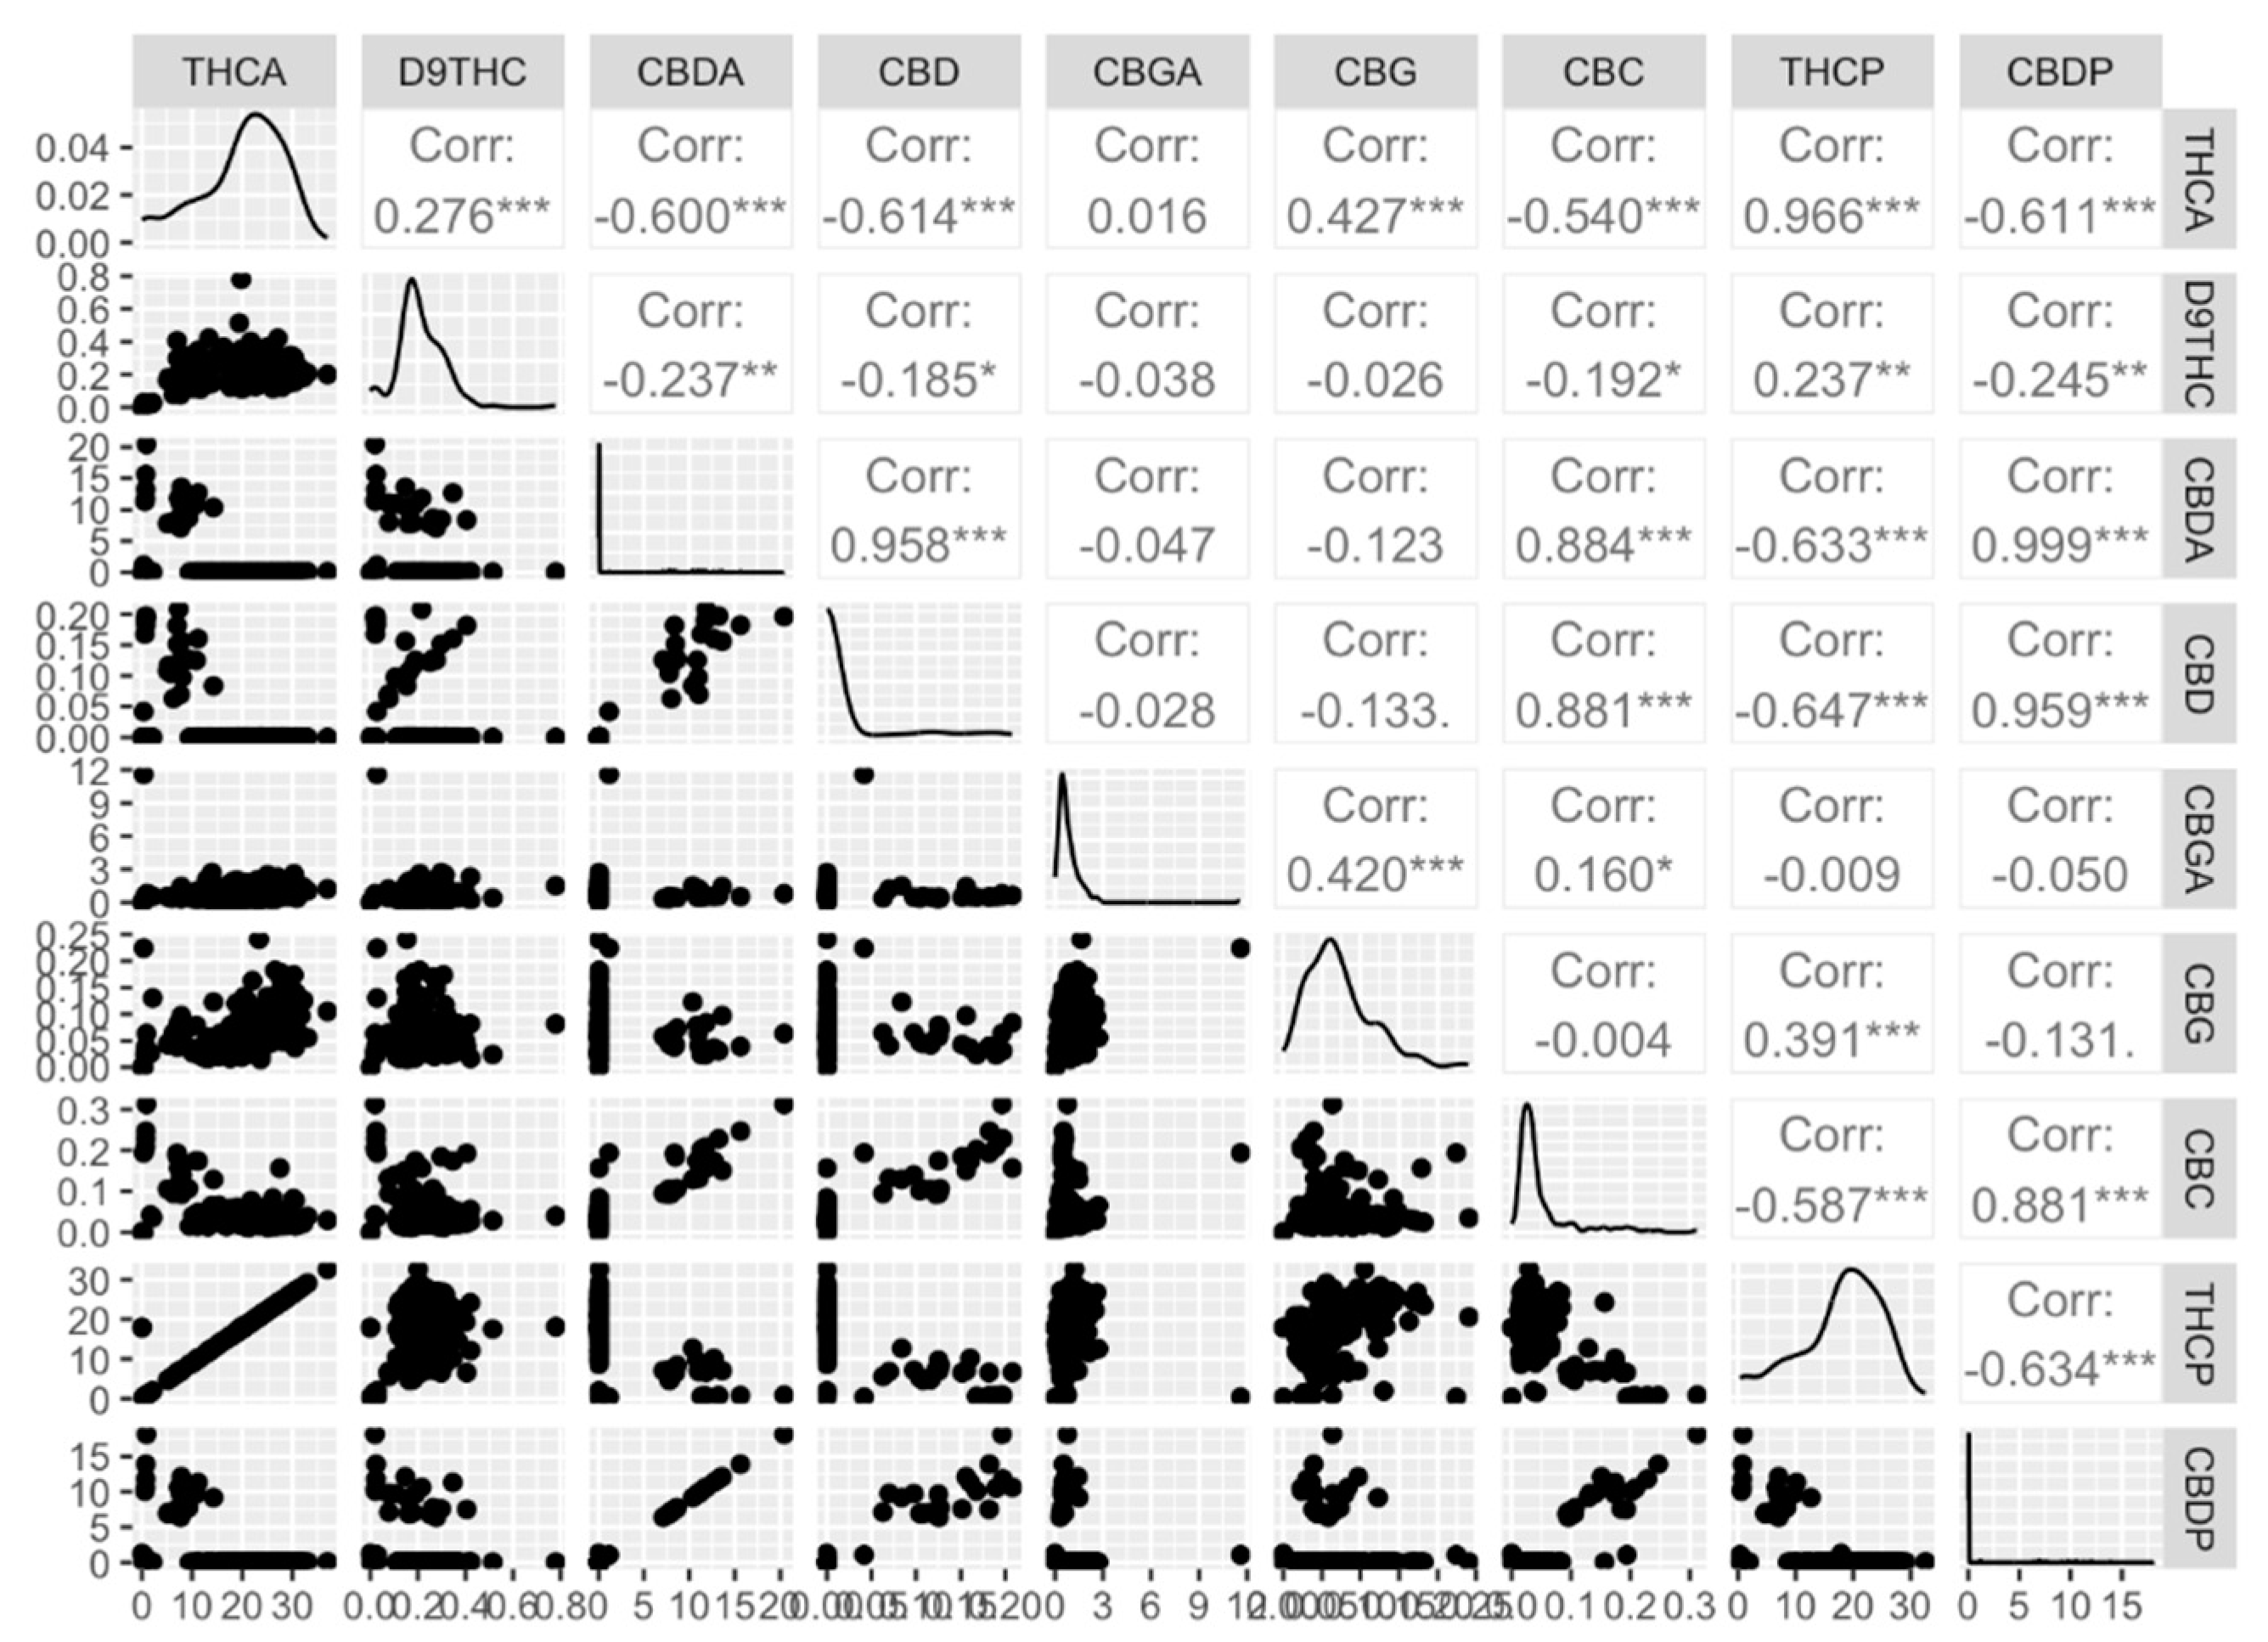
Figure 5.
Biplot clustering of cannabis plants based on their origin, regular female seeds vs. feminized seeds (A) and their source, cuttings vs. seeds (B).
Figure 5.
Biplot clustering of cannabis plants based on their origin, regular female seeds vs. feminized seeds (A) and their source, cuttings vs. seeds (B).

Disclaimer/Publisher’s Note: The statements, opinions and data contained in all publications are solely those of the individual author(s) and contributor(s) and not of MDPI and/or the editor(s). MDPI and/or the editor(s) disclaim responsibility for any injury to people or property resulting from any ideas, methods, instructions or products referred to in the content. |
© 2023 by the authors. Licensee MDPI, Basel, Switzerland. This article is an open access article distributed under the terms and conditions of the Creative Commons Attribution (CC BY) license (http://creativecommons.org/licenses/by/4.0/).
Copyright: This open access article is published under a Creative Commons CC BY 4.0 license, which permit the free download, distribution, and reuse, provided that the author and preprint are cited in any reuse.


