
Submitted:
12 September 2023
Posted:
15 September 2023
You are already at the latest version
Abstract
TiC particles were prepared from Ti and C powders, and TiC-reinforced Cu-based composites were prepared by powder metallurgy with SPS sintering. The effects of SPS sintering temperature and TiC particle reinforcement phase content on the electrical and mechanical properties of Cu-based composites were investigated. The reinforcement of TiC particles by thermal mismatching at increasing sintering temperature has a significant strengthening effect on the composites, but the high temperature causes softening of the Cu matrix and the growth of grains reduces the properties of the composites. In this study, the effects of porosity and density on the composite properties were not significant.
Keywords:
Cu-based composites
; TiC particles
; powder metallurgy
1. Introduction
Copper materials are suitable for electronic and manufacturing applications due to their high electrical and thermal conductivity1. However, the low mechanical and mechanical properties limit the application of pure copper materials in these fields. Therefore, in recent decades, the development of methods to enhance the mechanical and mechanical properties of copper has become a hot research topic. It has been shown that the introduction of a second phase in copper or copper alloys can effectively enhance the mechanical properties of copper matrix composites2. The secondary phase particles such as ceramic particles and oxides of rare earths can optimize the high temperature properties of copper composites during the sintering process3. The ceramic particles include oxides (Al2O3, La2O3), carbides (TiC, SiC, NbC, WC), borides (TiB2, ZrB2) and sulfides (WS2, MoS2)4. As a hard ceramic material, TiC has excellent refractory and high temperature resistance with a melting point of about 3160℃. In addition, TiC has good mechanical and impact resistance properties56. Thus, it seems that the use of TiC-reinforced Cu-based composites to compound the above application requirements7.
The use of liquid metallurgy in the production of metal composites often leads to various problems, such as the use of stir casting and extrusion casting, which causes the reinforcing particles to float on the surface of the metal matrix, so that the surface of the particle reinforcing phase is not completely infiltrated, leading to rejection, and the high temperature of the molten state may also lead to unwanted reactions and chemical decomposition7. The traditional powder metallurgy (PM) method is not affected by the density gradient and avoids unnecessary interfacial reactions in composites, so the PM method is still an excellent method for preparing metal composites8.
Researchers have studied various ceramic particle-reinforced metal composites using powder metallurgy methods and analyzed the effects of reinforcing phase content9, synthesis methods10, interfacial deformation mechanisms and particle morphology10 on the properties of metal composites. However, the study of TiC particle-reinforced Cu-based composites and the effects of sintering temperature and TiC particle content on the composites during powder metallurgy are less studied at present.
Considering that the reaction of Ti and C to form TiC satisfies the thermodynamic condition of chemical reaction, i.e., ΔrG<0. In this study, we decided to synthesize TiC particles from Ti and C powders by using ball milling and sintering process, and prepare TiC/Cu composites by using powder metallurgy method and using discharge plasma spark sintering to investigate the effect of sintering temperature on the properties of TiC/Cu composites, and then investigate the effect of TiC content on the composites at the optimal sintering The effect of TiC content on the composites was investigated at the optimum sintering temperature.
2. Materials and Methods
2.1. Experimental materials
Titanium powder (Ti, purity: 99.90%), graphite powder (C, purity: 99.90%) and copper powder (Cu, purity: 99.99%)
2.2. Experimental method
The process flow diagram for preparing TiC/Cu composites is shown in Figure 1. Ti powder and C powder are mixed at a molar ratio of 1:1.1, and then the first high-energy ball milling is carried out with a ball-to-material ratio of 1:1 and a ball milling speed of 400 r/min. after 80 h of ball milling, the particles are calcined at 800°C for 1 h to form TiC particles and then the second ball milling is carried out with a ball milling time of 2 h. After the TiC particles powder mixed with Cu powder and then the third ball milling was carried out at 400r/min for 10 hours. Finally, TiC/Cu composites were formed by the SPS sintering method using a graphite grinding tool with a diameter of 30 mm with a holding time of 10 min and a uniaxial pressure of 40 MPa.
In this study, 5 wt.% TiC/Cu composites were prepared by SPS sintering process at 850 ºC, 900 ºC, 950 ºC and 1000 ºC, respectively. The sintered samples were sequentially labeled as T850TiC/Cu, T900TiC/Cu, T950TiC/Cu and T1000TiC/Cu. Based on the comprehensive performance of TiC/Cu composites, 900 °C was determined as the optimum sintering temperature. The above TiC/Cu composite powders with different contents after ball milling were subjected to SPS sintering with a sintering time of 10 min, a uniaxial pressure of 40 Mpa and a sintering temperature of 900 ℃. The sintered samples were taken out and labeled as 10 wt.% TiC/Cu, 15 wt.% TiC/Cu, 20 wt.% TiC/Cu and 25 wt.% TiC/Cu, respectively. samples were prepared for testing and characterization using a wire cutter and polishing machine.
3. Result and analyse
3.1. Microstructural characterization of 5 wt.% TiC/Cu composites with different sintering temperatures
Figure 2 and Figure 3 show the X-ray diffraction patterns of TiC/Cu powders with different TiC contents and TiC/Cu composites with different sintering temperatures, respectively. Figure 1 contains diffraction peaks of only two substances, Cu and TiC, and no other spurious peaks appear, which indicates that Ti and C reacted successfully to produce TiC particle reinforced phase during the ball milling and sintering process, and the high-energy ball milling process charged with The argon gas charged during the high-energy ball milling process protects the composite powder from oxidation. In addition, it can be seen from Figure 2 and Figure 3 that the intensity of TiC diffraction peak increases with the increase of TiC mass fraction. With the increase of TiC content, no movement of Cu (111) diffraction peaks on the crystalline plane was found, indicating that both high-energy ball milling and high-temperature diffusion did not dissolve Ti into the Cu lattice to increase the lattice constant of Cu, which may be related to the fact that Ti was not directly mixed with Cu for ball milling9, and the reason for the absence of a single Ti peak at this time is that Ti completely reacted with C to produce TiC or the remaining amount of Ti was low less.
Figure 4 shows the SEM images of 5 wt.% TiC/Cu composites at different SPS sintering temperatures. the TiC is mostly irregular in shape and varies in size and action in the Cu matrix, but is uniformly distributed, as shown in the figures 19 TiC particle samples were selected, and their average particle size is about 3.5 um. the density of pure Cu is 8.96 g·cm-3, and the density of TiC is The actual density of TiC/Cu composites shown in Table 1 is always lower than the theoretical density because of the poor interfacial bonding of TiC and Cu matrix, which leads to the increase of porosity of the composites. However, with the increase of the sintering temperature, the porosity of the composites gradually decreases and the relative density shows an increasing trend, which may be due to the fact that the TiC particles grow with the increase of temperature and the lattice of the Cu matrix also has the tendency to expand, which leads to the increase of the interfacial bonding between TiC and Cu matrix and the decrease of the porosity and the increase of the density.
Figure 5 shows the elemental distribution of the T900TiC/Cu composites, demonstrating the distribution of elemental C and Ti in Cu. Figure 5 further shows the uniform distribution of TiC particles in the Cu matrix, which is a prerequisite for enhancing the mechanical properties of the composite [12]. Also the elemental distribution map does not provide strong evidence that Ti atoms enter the Cu lattice, while the diffuse distribution of Ti and C elements indicates that TiC strengthens Cu in a diffuse manner.
3.2. Conductive and mechanical properties of 5 wt.% TiC/Cu composites at different sintering temperatures
Figure 6 shows the conductivity of 5 wt.% TiC/Cu composites at different SPS sintering temperatures, with the increase of sintering temperature, the conductivity of the composites decreases from 11.8 MS-m-1 to 10.13-m-1, which is a decrease of 7.3%, and the factors affecting the conductivity are grain boundaries, phase boundaries, and dislocations, and the decrease in the conductivity of the composites here is mainly attributed to the increase of the temperature with the increase of the lattice of the Cu matrix strain energy increases13, the scattering effect of phonons on electrons is enhanced, as well as the high temperature enhances the fluidity of the copper matrix, which makes the shape of some pores irregular and thus enhances the scattering of electrons18.
The Vickers hardness of the 5 wt.% TiC/Cu composites is shown in Figure 7, and the Vickers hardness of the T850TiC/Cu, T900TiC/Cu, T950TiC/Cu and T1000TiC/Cu composites are 123.2 HV, 103.48 HV, 102.08 HV and 101.4 HV, respectively.The hardness of the composites with sintering temperature shows This is the opposite of the trend of density shown in Table I. Therefore, the reason for the decrease of Vickers hardness of the composites is not the porosity, but the significant growth of grains that occurs when the sintering temperature is too high, which lengthens the recrystallization time of the copper matrix. According to the Hall-Petch equation14:
where K is a constant of about 0.14 MPa/m1/2 ; and are the average grain sizes of the prepared Cu-based composites and the matrix Cu, respectively. The larger the grain size, the lower its strength, and for Cu-based composites, usually the lower the strength, the lower its hardness14.
Figure 8 shows the compressive stress-strain diagram of 5 wt.% TiC/Cu composites at different SPS sintering temperatures. The yield strength and compressive strength tend to increase first and then decrease. The yield strengths at sintering temperatures of 850 ℃, 900 ℃, 950 ℃ and 1000 ℃ were 249 Mpa, 263 Mpa, 257 Mpa and 242 Mpa, respectively.
The compressive strength reaches the maximum value of 785 Mpa at the sintering temperature of 900 ℃, and the compressive strain is 40.97 %. The highest value at 900 ℃ is due to the thermal mismatch strengthening of TiC particles and Cu matrix caused by high temperature, and the lattice expansion of the reinforcing phase and Cu matrix increases the strain energy. The decrease in the composite properties at the sintering temperatures of 950 °C and 1000 °C may be due to the over-sintering or molten state of the material due to the high temperature, which results in coarse grains and reduced strength. The effect of grain size on the mechanical properties of the composites can be expressed in Eq. (1), and the thermal mismatch strengthening effect induced by the SPS sintering temperature can be expressed using Eq.14 (2):
A is a constant, about 1.25; is the shear modulus of Cu, about 42.1 GPa; b is the Brønsted vector of Cu, about 0.256 nm; is the differenc between the compression temperature and the test temperature; is the difference between the thermal expansion coefficients of Cu and TiC particles;is the volume fraction of TiC in the composite;is the diameter of TiC particles.
3.3. Microstructure of T900TiC/Cu composites with different TiC contents
By characterizing and testing the microstructure and properties of TiC/Cu composites with different sintering temperatures of 5 wt.%, 900 °C was determined as the optimum sintering temperature for this study. Then the microstructure and properties of TiC/Cu composites with different TiC contents were further investigated at a sintering temperature of 900°C.
Figure 9 shows the physical phase structure of the composites with different TiC contents. The Figure contains only the diffraction peaks of Cu and TiC without other impurities and oxides, and the intensity of the diffraction peaks of TiC strengthens with the increase of TiC content, and the intensity of the diffraction peaks of Cu decreases with the increase of TiC content. And with the increase of TiC mass fraction, also no oxidation peak of Ti is observed and the angle of diffraction peak of Cu is not shifted.
Figure 10 shows the SEM images of T900TiC/Cu composites with different TiC contents, demonstrating the microscopic morphology of the composites. There are no craters similar to the particle shape on the surface of the picture, which indicates that the reinforcing phase was not destroyed during the preparation of the composites. The distribution of the particles in the matrix is the key to the mechanical properties of the composites, and the TiC, which is of micron size and diffusely distributed in the Cu collective, is able to enhance the mechanical properties of the composites well (diffusion strengthening mechanism). From Figure 10, it can be seen that the TiC mass fraction is most uniformly distributed at 10%, because agglomeration occurs when the reinforcing phase content is too much. The agglomeration of TiC particles will break the interfacial bonding between Ti and Cu matrix on the one hand, and will concentrate at the grain boundaries to prevent the gas exclusion on the other hand. The porosity of the composites was 8.61%, 12.96%, 12.91% and 19.93% for TiC mass fraction of 10%, 15%, 20% and 25%, respectively.
3.4. Conductive and mechanical properties of T900TiC/Cu composites with different TiC contents
The electrical conductivity of T900TiC/Cu composites with different TiC content is shown in Figure 11. The electrical properties of the composites are negatively correlated with the mass fraction of TiC, and the composites with 25% TiC mass fraction have 64% lower electrical conductivity compared to those with 10% TiC content. Grain boundaries, phase boundaries, dislocations and vacancies are all factors affecting the electrical conductivity of the composites, and only the changes in electrical conductivity caused by the TiC particle content are discussed here. On the one hand, TiC particles act as scattering centers for electrons, and as the mass fraction increases, the increase of itself and its caused pores increases the probability of electrons being scattered in the composites, and TiC particles are distributed at the grain boundaries of Cu, and the increased phase boundaries in turn increase the dislocation density of the composites.
Figure 12 depicts the Vickers hardness of the composites with different TiC contents. According to Yang13 et al. reported that the Vickers hardness of Cu-based composites showed a positive trend with relative density, and porosity was the key factor affecting the hardness of the composites. However, the Vickers hardness of the TiC/Cu composites prepared in this study decreased with increasing TiC content, and combined with Table 2, the Vickers hardness did not decrease with increasing porosity. This indicates that the mechanical properties of the Cu-based composites prepared in this study are not greatly affected by the porosity, and the main influencing factor is the increase of dislocation density and load transfer caused by the reinforcing phase. In the hardness test, the negative effect caused by TiC agglomeration breaking the bond surface was not obvious, so the hardness change was positively correlated with the TiC content. The classical prismatic dislocation punching model is referred here to evaluate the dislocation density in hot pressed samples10:
where is the Berg vector 0.255 nm, andis the volume fraction of the reinforcement. (= 1, 2, 3) corresponds to the dimensions of the reinforcing phases in the three vertical directions. is the thermal mismatch strain and is equal to the product of the difference between the and the difference between the maximum and minimum processing temperatures, .
A generalized shear hysteresis model was used to evaluate the contribution of load transfer to the mechanical properties of the composite17:
is the yield strength; substrates , , and represent the composite, matrix, and TiC, respectively;, l, and are the volume fraction, average length, and critical length of TiC, respectively.
As shown in Figure 13, the yield strength of TiC/Cu composites when compression property tests were performed had the maximum yield strength of 447 Mpa at 20% TiC content, showing an increasing and then decreasing trend. The increase in the yield strength when the TiC content was increased from 10% to 20% was due to the increased hindrance of dislocation motion by TiC particles and the transfer of more load to the TiC reinforced phase.
The contribution of the Orowan strengthening mechanism, which impedes dislocation motion, to the yield strength can be described by the following equation15:
is the yield strength; is the shear modulus, which is generally taken as 46 Gpa in Cu matrix composites; is the spacing of the added second-phase particles; is the average size of the second-phase particles; is the Brønsted vector, which is generally taken as 0.26 nm in in Cu matrix composites. it can be obtained that the first yield strength of diffusion-reinforced Cu matrix composites depends on the size of the second-phase particles r and the spacing between the particles for Cu matrix composites, the finer the size of the second phase particles in the matrix, the more obvious the enhancement of the Cu matrix
And the agglomeration phenomenon becomes more obvious when the TiC content increases to 25%, and the agglomerated TiC particles destroy the interfacial bond between the two phases, and a good interfacial bond is a prerequisite for effective load transfer, so the yield strength decreases when the TiC content reaches 25%14.
4. Conclusion
(1) The XRD images of the prepared TiC/Cu composite powders and composites contained only diffraction peaks of TiC and Cu, indicating that no other impurities appeared during the preparation process, and the TiC particle-reinforced Cu-based composites were successfully prepared, and the TiC particles were diffusely distributed in the Cu collective. The best enhancement solution was confirmed to be sintering at 900°C with TiC content of 20 wt.%.
(2) The electrical conductivity of TiC/Cu composites decreases with the increase of sintering temperature and TiC content. The effect of TiC content on the electrical properties of the composites is greater than that of sintering temperature, and the scattering effect of TiC particles on electrons is the most obvious.
(3) The effect of porosity on the mechanical properties of TiC/Cu composites was not significant in this study. The main effects of sintering temperature on the mechanical properties are thermal mismatch strengthening caused by increasing temperature and matrix softening caused by over-sintering. the negative effects of TiC content on the composites are mainly the strengthening mechanism of TiC reinforcing phase and the agglomeration phenomenon when the content increases, which is also a problem to be solved in the subsequent work.
Author Contributions
Author contributions: "Concept, Cong Chen and Zhenjie Zhai; Methods, Denghui Li; Software, Steven Chen; Validation, Changfei Sun; Formal analysis, Zhenjie Zhai; Investigation, Cong Chen; Resources, Cong Chen; Data organization, Steven Chen; Writing-original draft preparation, Zhenjie Zhai; Writing-review and editing, Denghui Li; Visualization, Steven Chen; Supervision, Cong Chen; Project management, Changfei Sun; Funding acquisition, Cong Chen. All authors have read and agreed to the published version of the manuscript.
Funding
This study was supported by the Natural Science Foundation of Qinghai Provincial Science and Technology Department under Grant No. 2021-ZJ-706.
Conflicts of Interest
The authors declare no conflict of interest. The funders had no role in the design of the study, the collection, analysis or interpretation of data, the writing of the manuscript, or the decision to publish the results.
References
- Norouzifard V, Naeinzadeh H, Talebi A. Fabrication and investigation of mechanical properties of copper matrix nanocomposite reinforced by steel particle[J]. Journal of Alloys and Compounds, 2021, 887: 161434.
- Huang K, Marthinsen K, Zhao Q, et al. The double-edge effect of second-phase particles on the recrystallization behaviour and associated mechanical properties of metallic materials[J]. Progress in Materials Science, 2018, 92: 284-359.
- L. Han, J. Wang, Y.Y. Chen, Y. Huang, Y.C. Liu, Z.M. Wang, Fabrication and mechanical properties of WC nanoparticle dispersion-strengthened copper, Mater. Sci. Eng. A 817 (2021), 141274. [CrossRef]
- Wang Z, Bian Y, Ni J, et al. Tribological and electrochemical corrosion behaviors of Cu-based powder metallurgy composites reinforced by in-situ WC with different morphology[J]. Journal of Materials Research and Technology, 2022, 21: 4067-4078.
- Frage N, Froumin N, Rubinovich L, et al. Infiltrated TiC/Cu composites[J]. 2001.
- Nemati N, Khosroshahi R, Emamy M, et al. Investigation of microstructure, hardness and wear properties of Al–4.5 wt.% Cu–TiC nanocomposites produced by mechanical milling[J]. Materials & Design, 2011, 32(7): 3718-3729.
- Dinaharan I, Albert T. Effect of reinforcement type on microstructural evolution and wear performance of copper matrix composites via powder metallurgy[J]. Materials Today Communications, 2023, 34: 105250.
- Zhu J M, Li J W, Liu T, et al. Differences in mechanical behaviors and characteristics between natural graphite/copper composites and carbon-coated graphite/copper composites[J]. Materials Characterization, 2020, 162: 110195.
- Bagheri G H, A. The effect of reinforcement percentages on properties of copper matrix composites reinforced with TiC particles[J]. Journal of Alloys and Compounds, 2016, 676: 120-126.
- Fan Shaozhong, Zhong Lisheng, Cheng Shili, Li Nan, Lai Yujun. Current status of research on in situ preparation of titanium carbide particle-reinforced steel matrix composites[J]. Thermal Processing Technology,2015,44(10):16-19. [CrossRef]
- Zhang X, Zhao D, Shi R, et al. Investigations on the interface-dominated deformation mechanisms of two-dimensional MAX-phase Ti3Al (Cu) C2 nanoflakes reinforced copper matrix composites[J]. Acta Materialia, 2022, 240: 118363.
- C, V. Mohanavel, M. Ravichandran. T. Sathish, S. Suresh Kumar, M.M. Ravikumar, S. Mahendiran, L. Yeshwanth Nathan, J. Balkan Tribol. Assoc. 25 (2019) 342–352.
- Wang Jing, Chang Yan. Electrical properties analysis of Copper matrix composites [J]. Mining and Metallur-gy,2019,28(02):61-64 (in Chinese).
- WANG Jing,LIU Jinping,SUN Ke,WANG Zejin,LENG Xiang. Effect of sintering temperature on the microstructure and properties of graphite/copper composites[J]. Nonferrous Metal Science and Engi-neer-ing,2020,11(01):51-59. [CrossRef]
- Wang, Z. , Wang X. Progress in the preparation and strengthening mechanism of graphene copper matrix composites[J]. Inorganic Salt Industry,2022,54(12):1-9. [CrossRef]
- Y. J. Yang, Z. J. Y. J. Yang, Z. J. Li, W. M. Zhao, R. Bao, and J. H. Yi. Effect of sintering temperature on the microstructure and properties of carbon polymer dot/copper composites[J]. Powder Metallurgy Materials Science and Engineering,2021,26(06):537-546.
- V.C. Nardone, K.M. Prewo, On the strength of discontinuous silicon carbide reinforced aluminum composites, Scripta Metall. 20 (1986) 43–48. [CrossRef]
- Klueh R, Shingledecker J, Swindeman R, et al. Oxide dispersion-strengthened steels: A comparison of some commercial and experimental alloys[J]. Journal of Nuclear Materials, 2005, 341(2-3): 103-114.
Figure 1.
Flowchart of the preparation process of TiC/Cu composites.
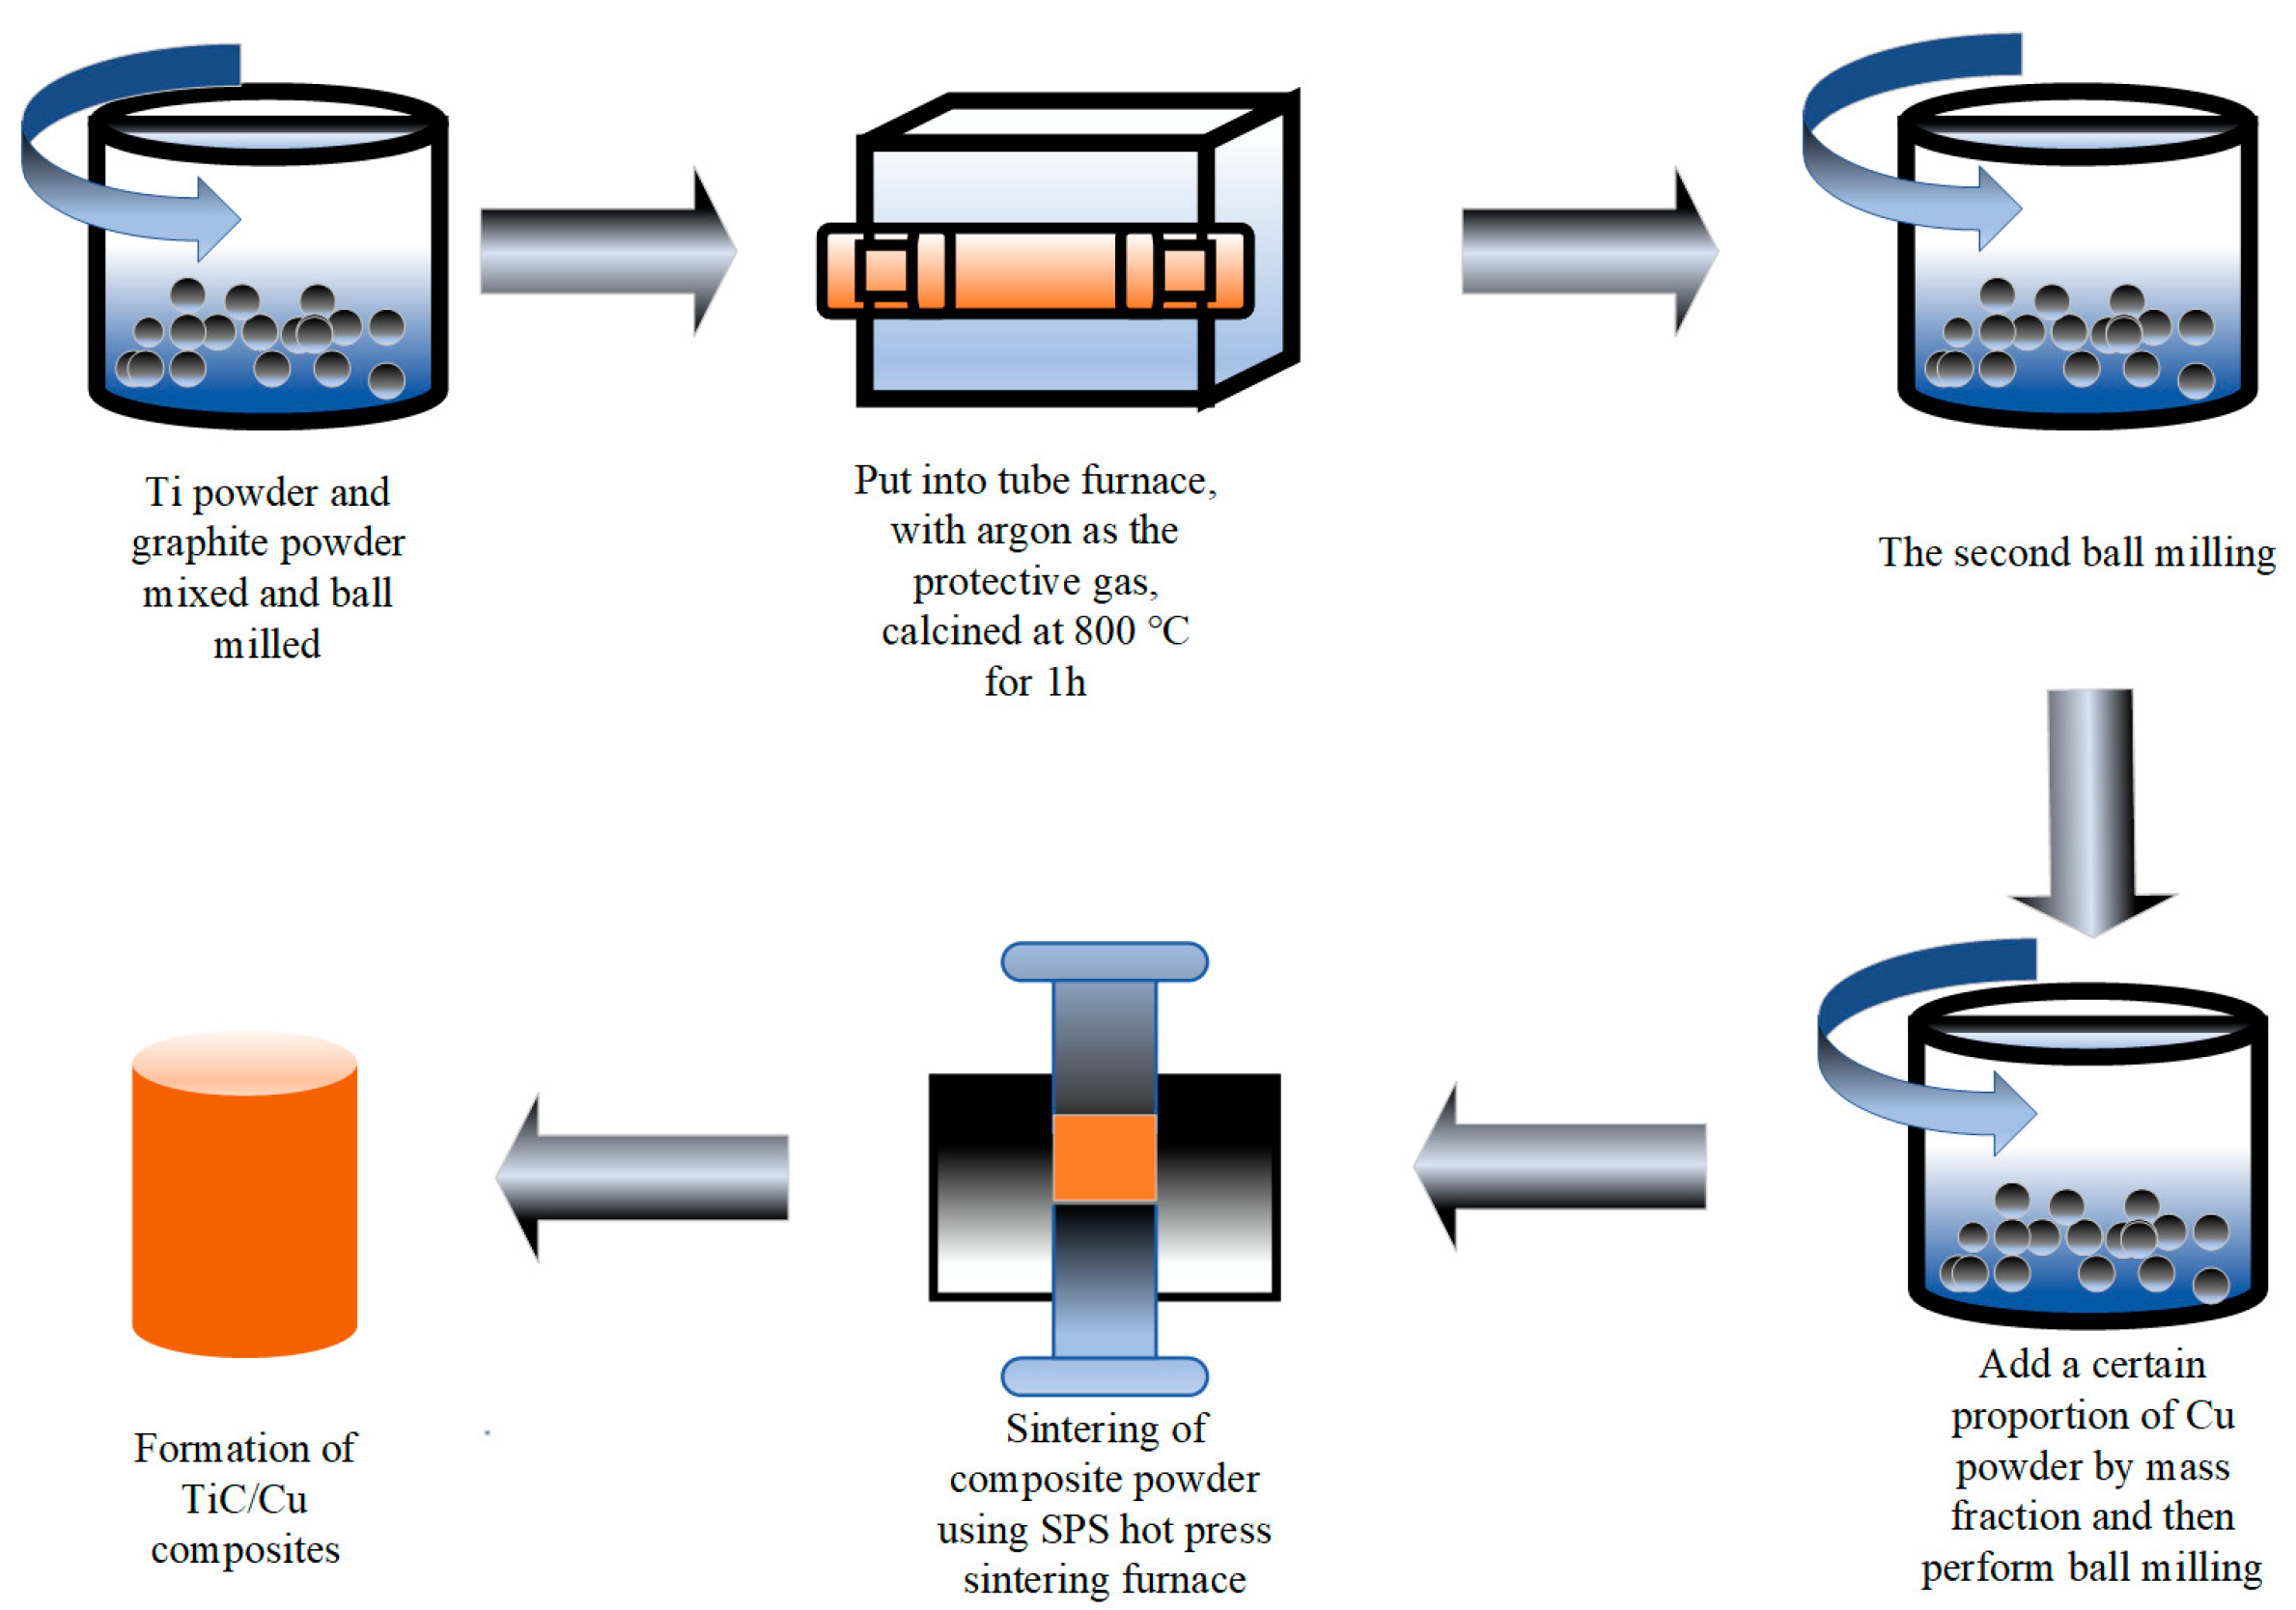
Figure 2.
XRD pattern of TiC/Cu composite powder prepared by high-energy ball milling:[(a) 5 wt.%TiC/Cu; (b) 10 wt.%TiC/Cu;(c) 15 wt.%TiC/Cu; (d) 20 wt.%TiC/Cu; (e) 25 wt.%TiC/Cu].
Figure 2.
XRD pattern of TiC/Cu composite powder prepared by high-energy ball milling:[(a) 5 wt.%TiC/Cu; (b) 10 wt.%TiC/Cu;(c) 15 wt.%TiC/Cu; (d) 20 wt.%TiC/Cu; (e) 25 wt.%TiC/Cu].
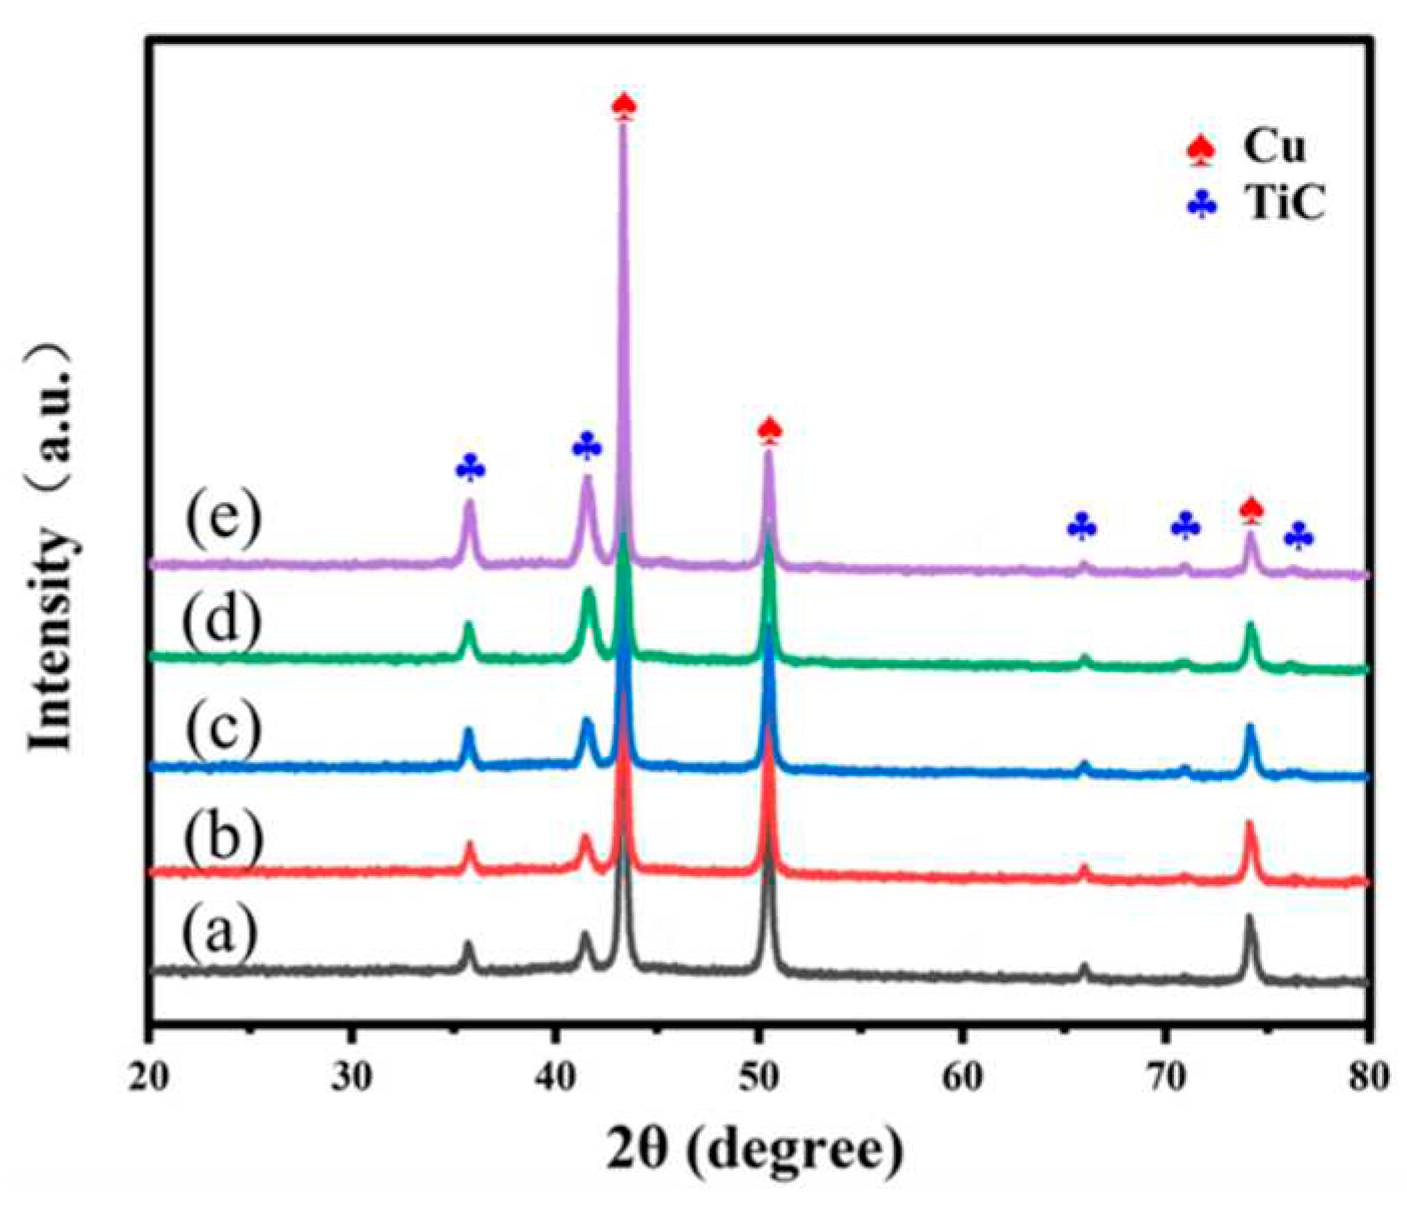
Figure 3.
XRD of 5 wt.%TiC/Cu composites at different SPS sintering temperatures: [(a) T850TiC/Cu; (b) T900TiC/Cu; (c) T950TiC/Cu; (d) T1000TiC/Cu].
Figure 3.
XRD of 5 wt.%TiC/Cu composites at different SPS sintering temperatures: [(a) T850TiC/Cu; (b) T900TiC/Cu; (c) T950TiC/Cu; (d) T1000TiC/Cu].
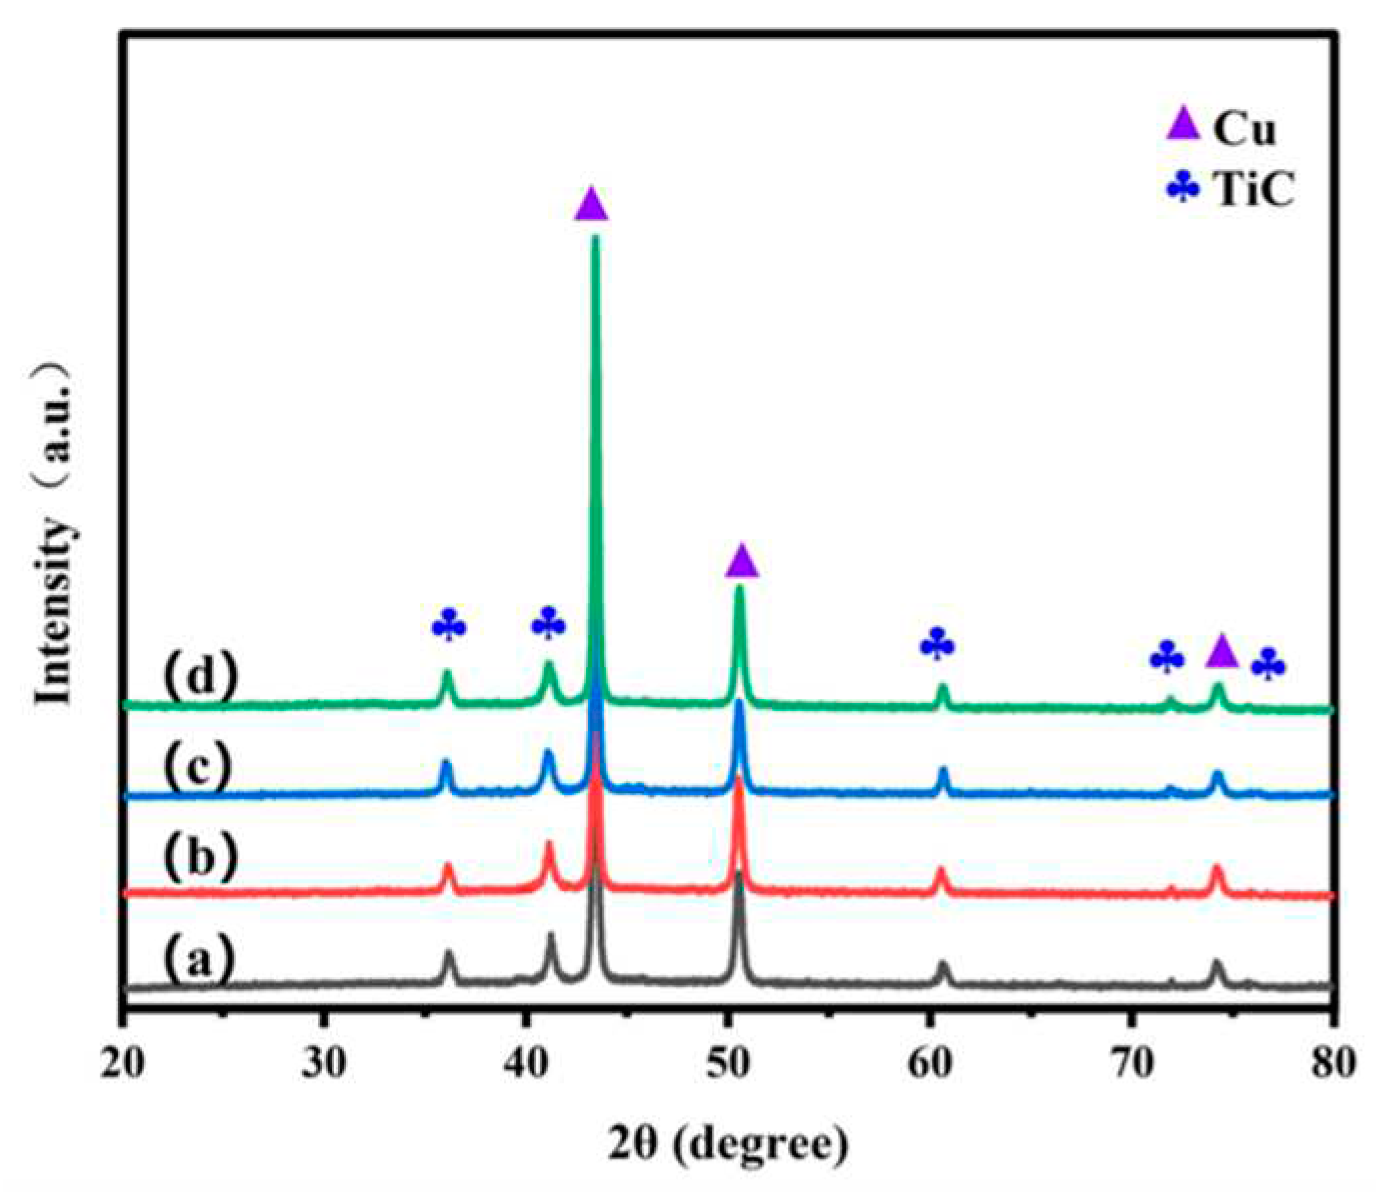
Figure 4.
SEM of 5 wt.%TiC/Cu composites at different SPS sintering temperatures:[(a)T850TiC/Cu;(b)T900TiC/Cu;(c)T950TiC/Cu;(d)T1000TiC/Cu].
Figure 4.
SEM of 5 wt.%TiC/Cu composites at different SPS sintering temperatures:[(a)T850TiC/Cu;(b)T900TiC/Cu;(c)T950TiC/Cu;(d)T1000TiC/Cu].
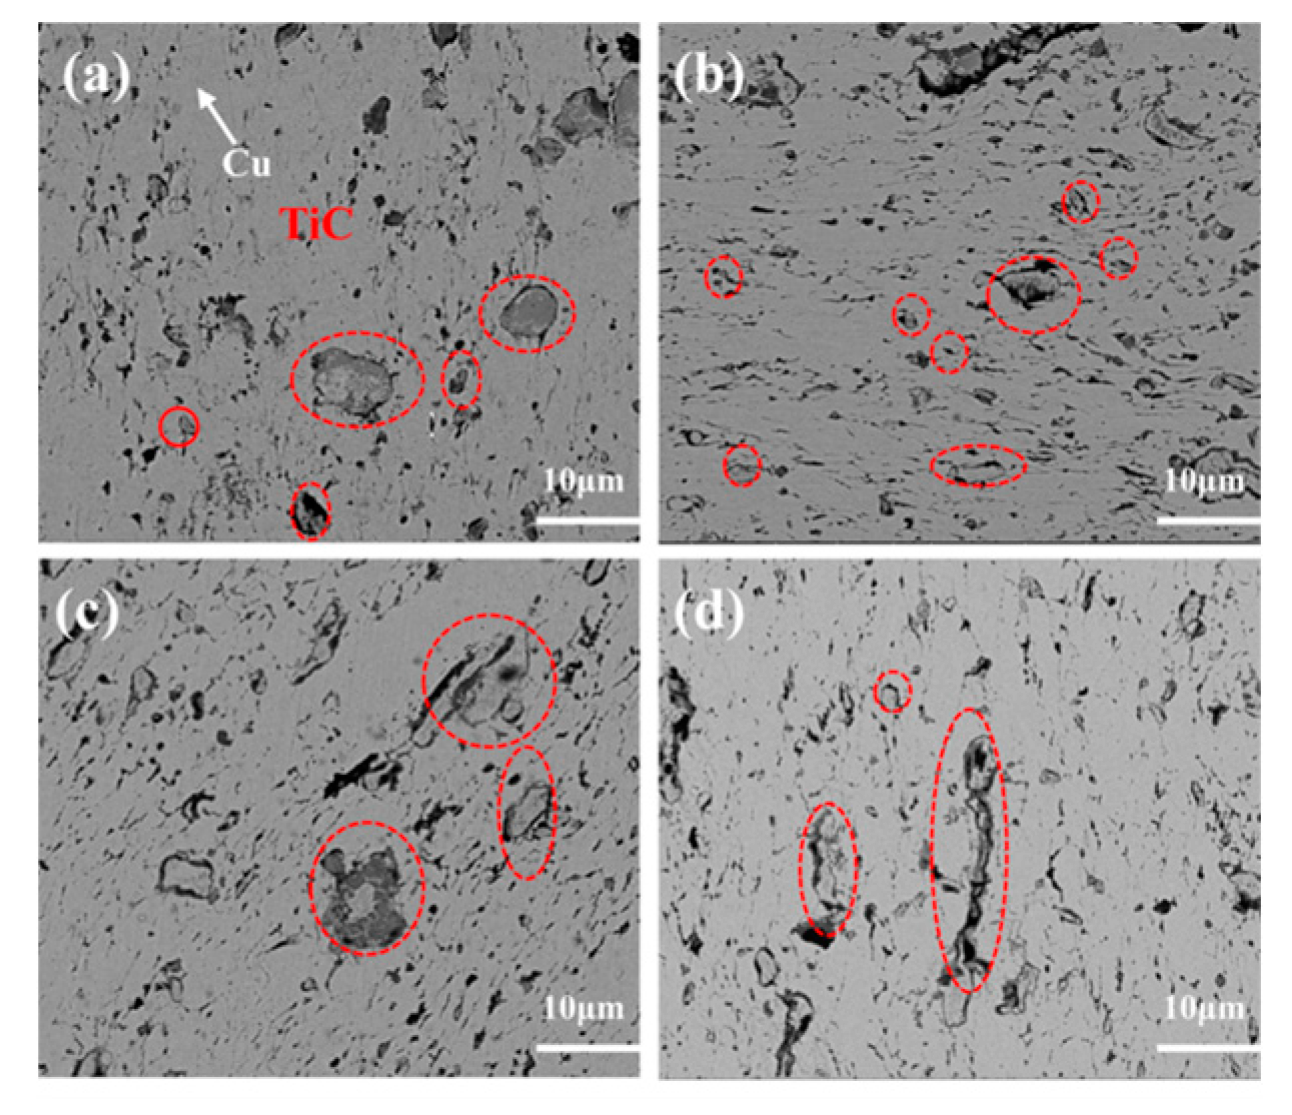
Figure 5.
Distribution of elements in T900TiC/Cu composites: [(a) TiC;(b) Ti;(c) Cu;(d )C].
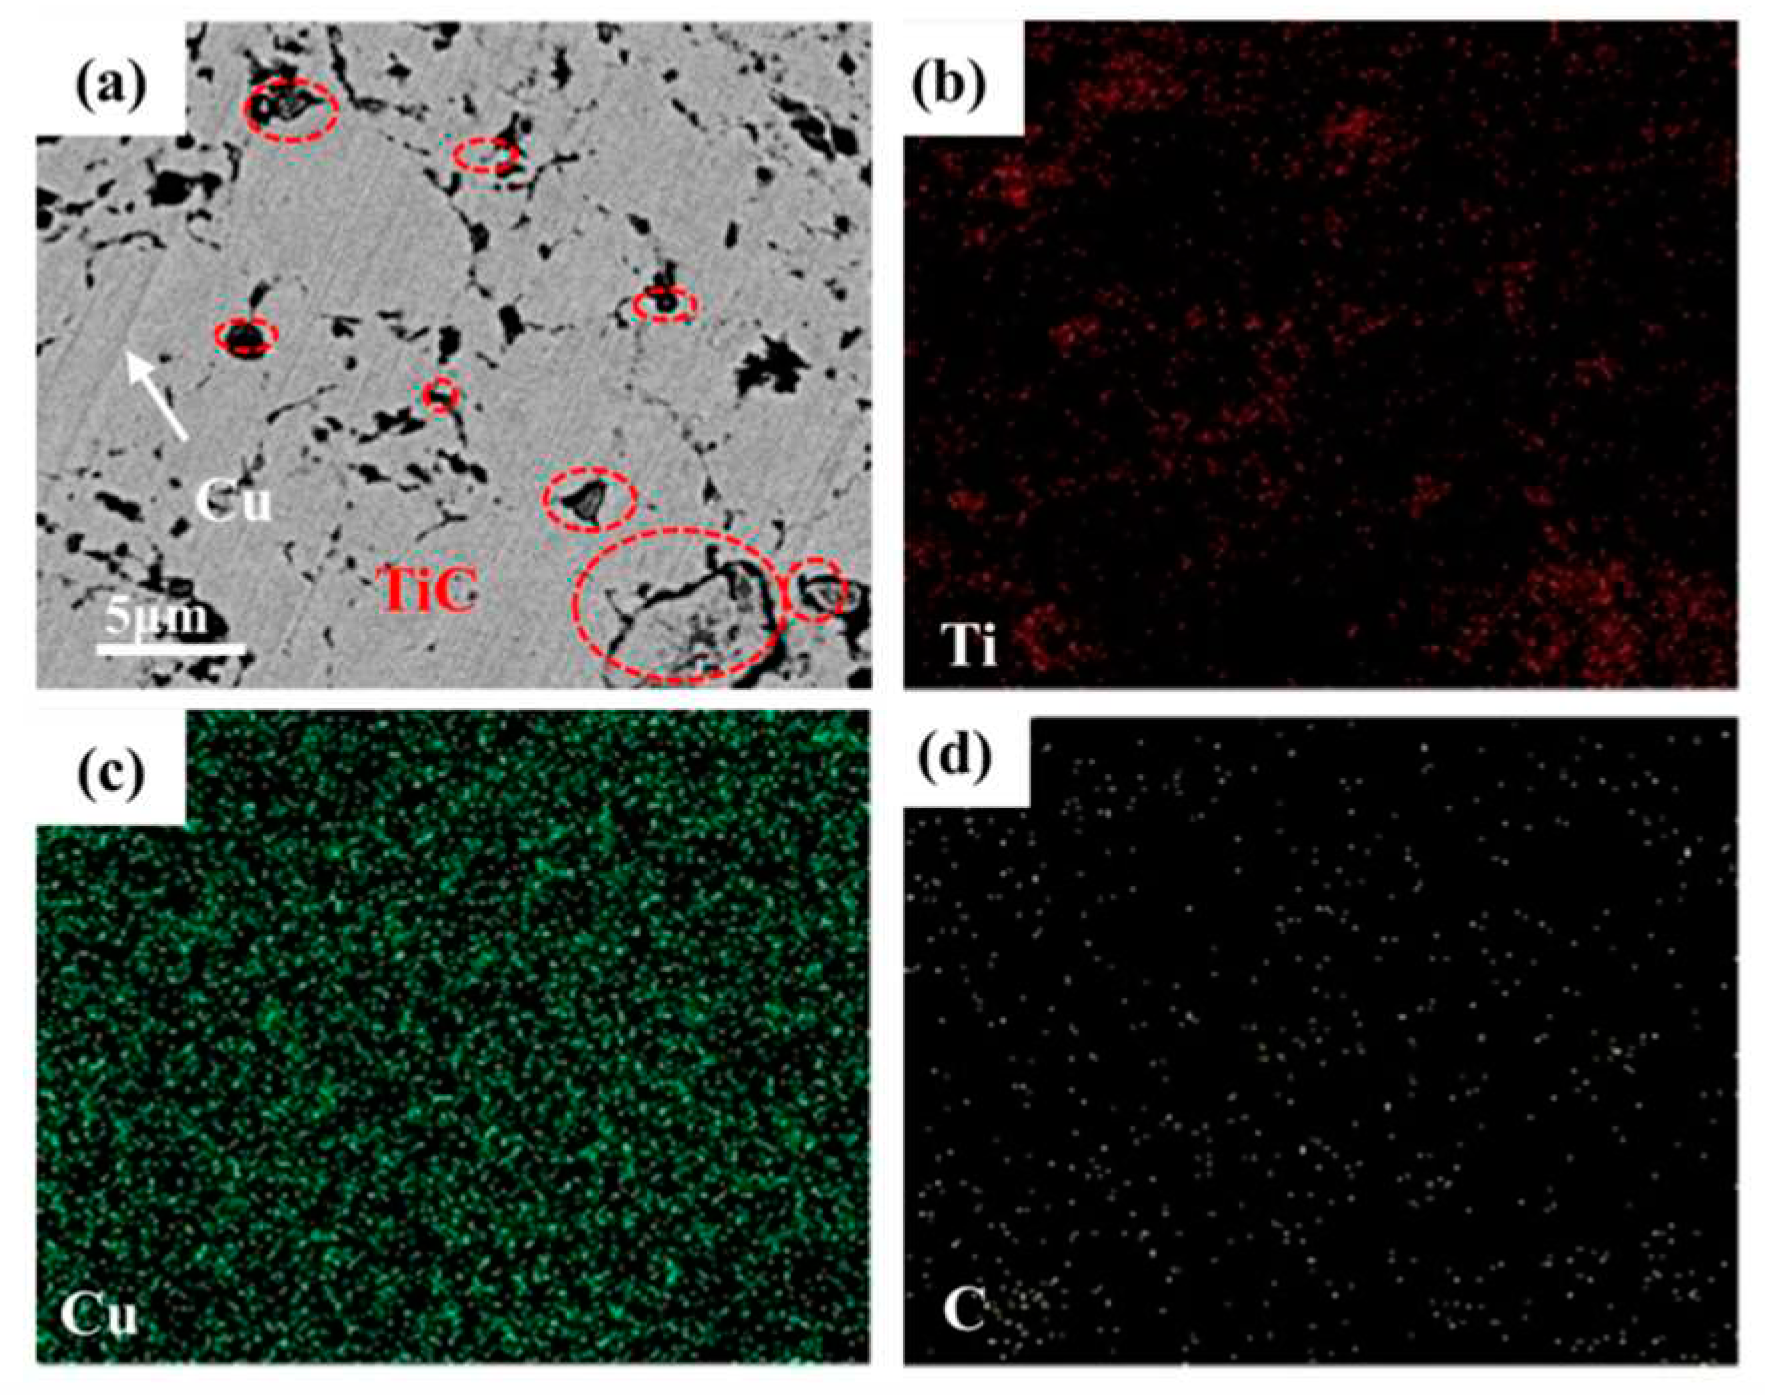
Figure 6.
Electrical conductivity of 5 wt.%TiC/Cu composites at different SPS sintering temperatures.
Figure 6.
Electrical conductivity of 5 wt.%TiC/Cu composites at different SPS sintering temperatures.
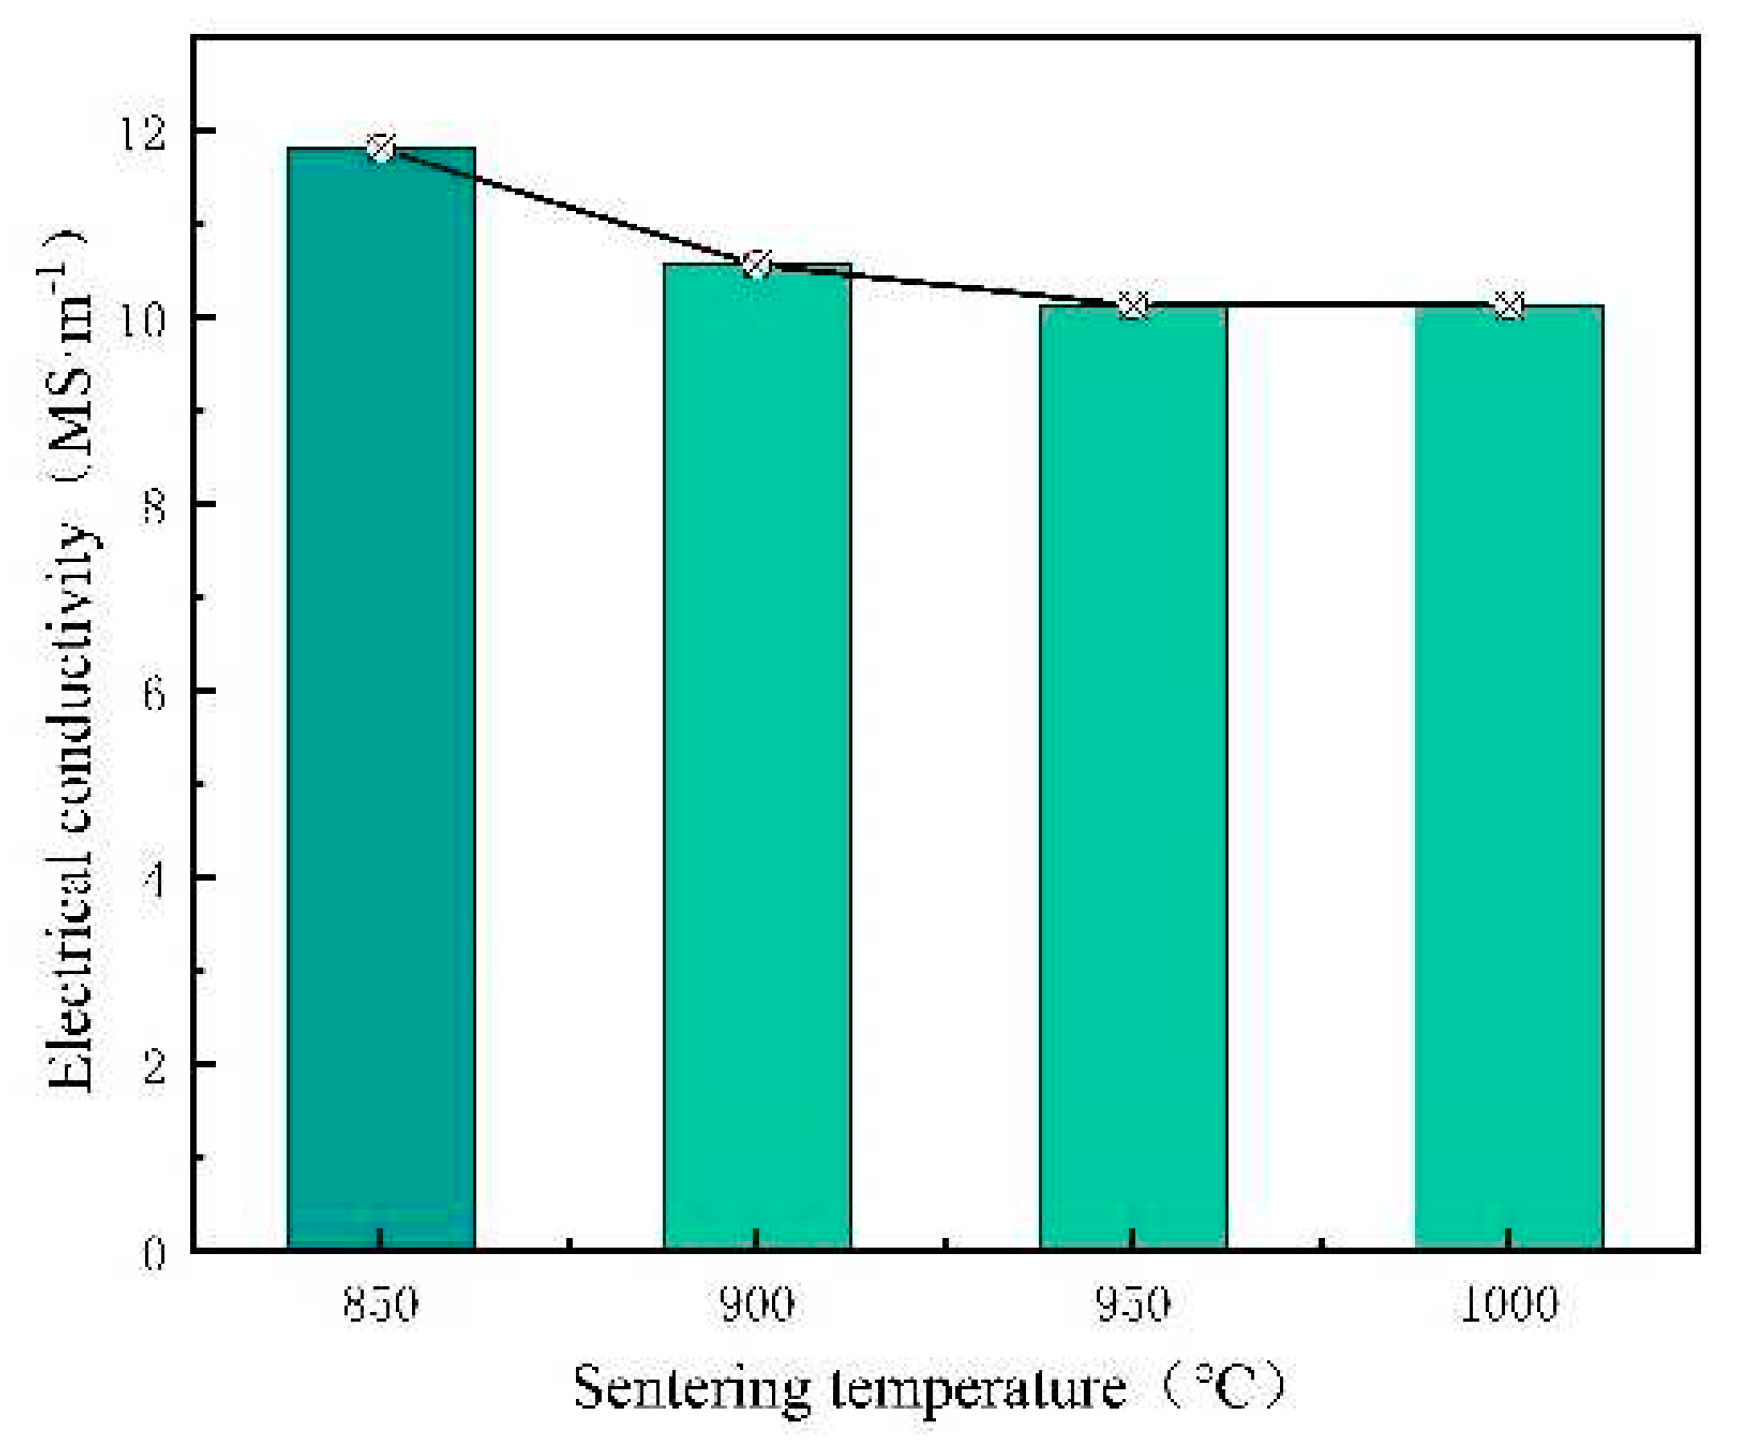
Figure 7.
Vickers hardness of 5 wt.%TiC/Cu composites at different SPS sintering temperatures.
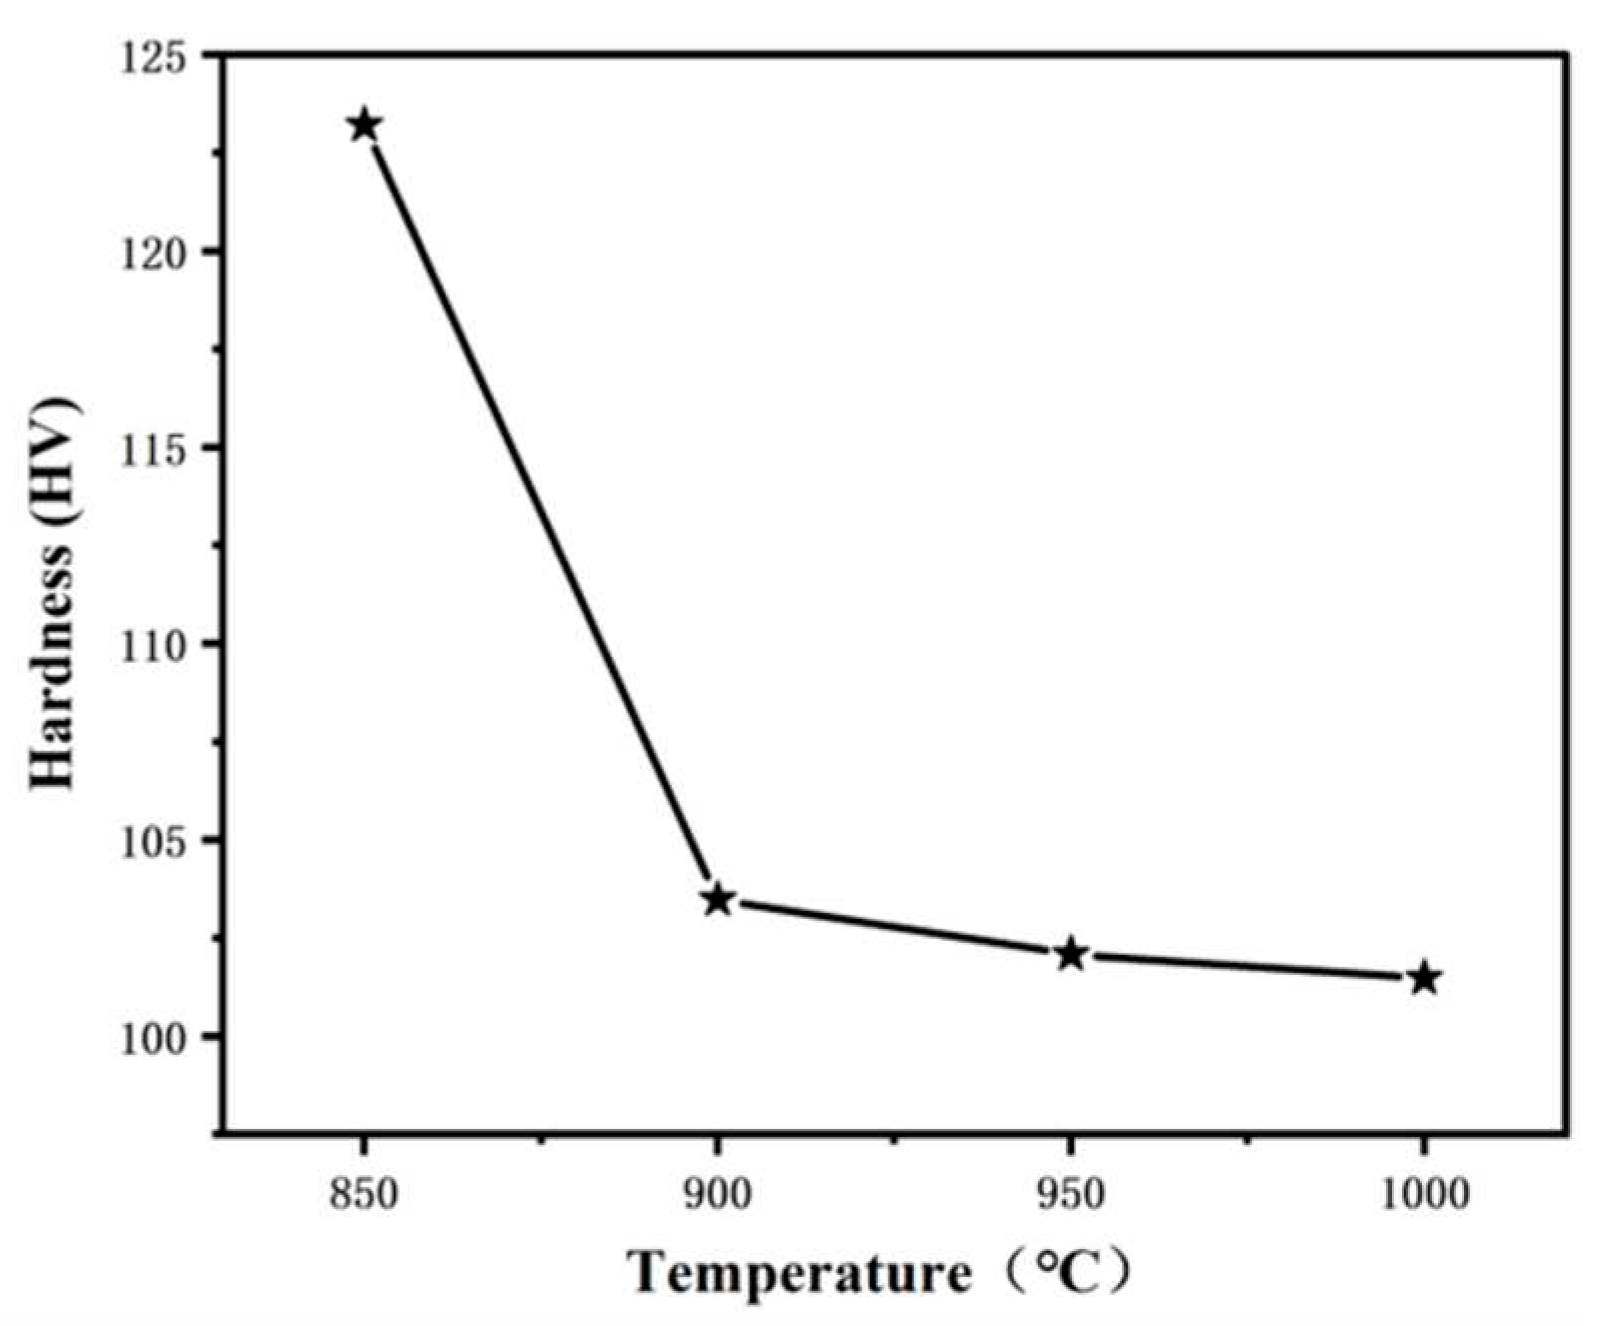
Figure 8.
Compressive stress-strain diagram of 5 wt.%TiC/Cu at different SPS sintering temperatures: [(a) T850TiC/Cu; (b) T900TiC/Cu;(c) T950TiC/Cu; (d) T1000TiC/Cu].
Figure 8.
Compressive stress-strain diagram of 5 wt.%TiC/Cu at different SPS sintering temperatures: [(a) T850TiC/Cu; (b) T900TiC/Cu;(c) T950TiC/Cu; (d) T1000TiC/Cu].
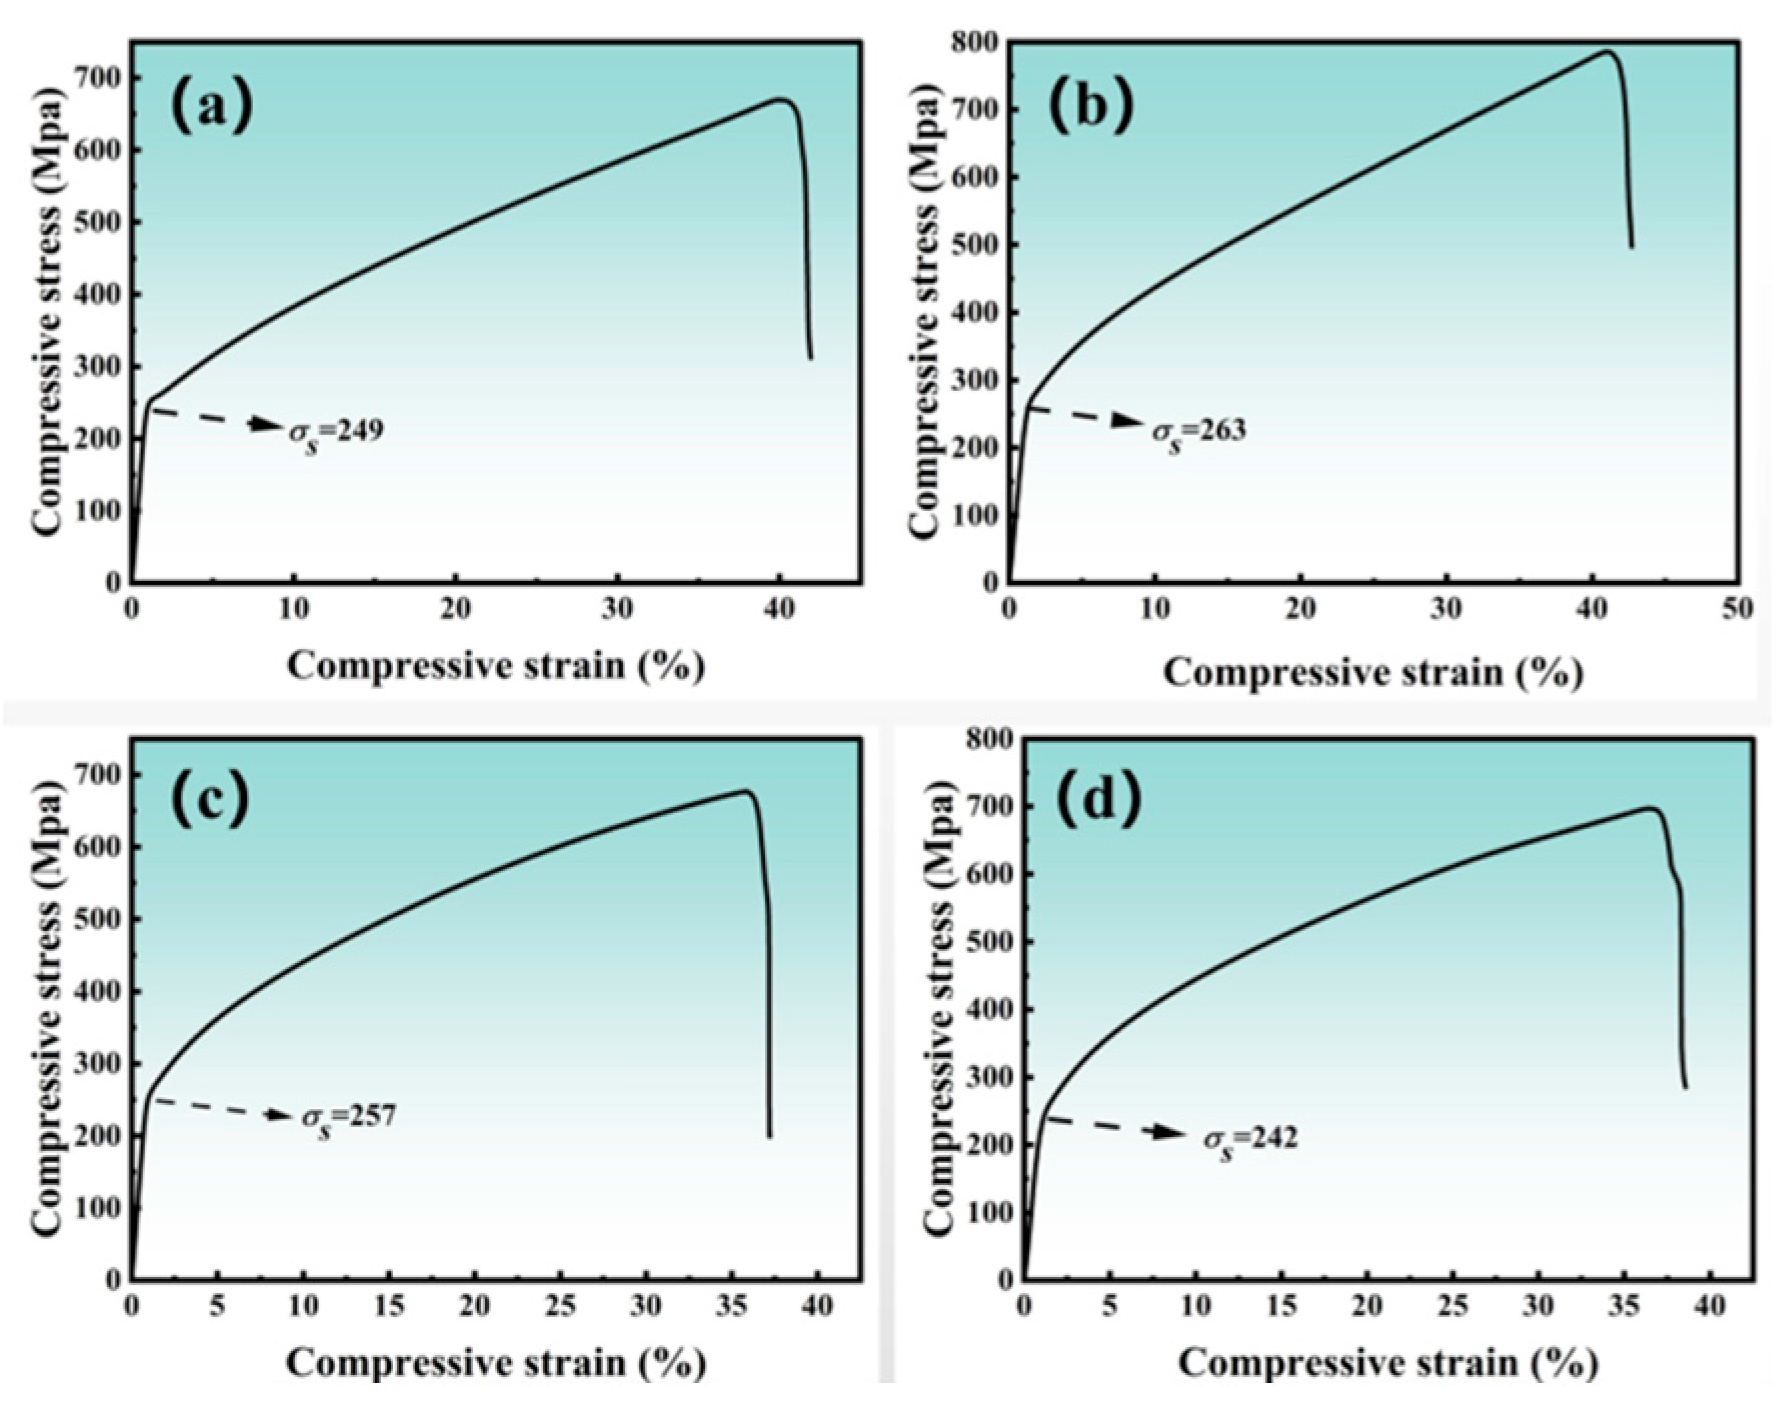
Figure 9.
XRD patterns of T900TiC/Cu composites with different TiC contents:[(a) 10 wt.%TiC/Cu; (b) 15 wt.%TiC/Cu; (c) 20 wt.%TiC/Cu; (d) 25 wt.%TiC/Cu].
Figure 9.
XRD patterns of T900TiC/Cu composites with different TiC contents:[(a) 10 wt.%TiC/Cu; (b) 15 wt.%TiC/Cu; (c) 20 wt.%TiC/Cu; (d) 25 wt.%TiC/Cu].
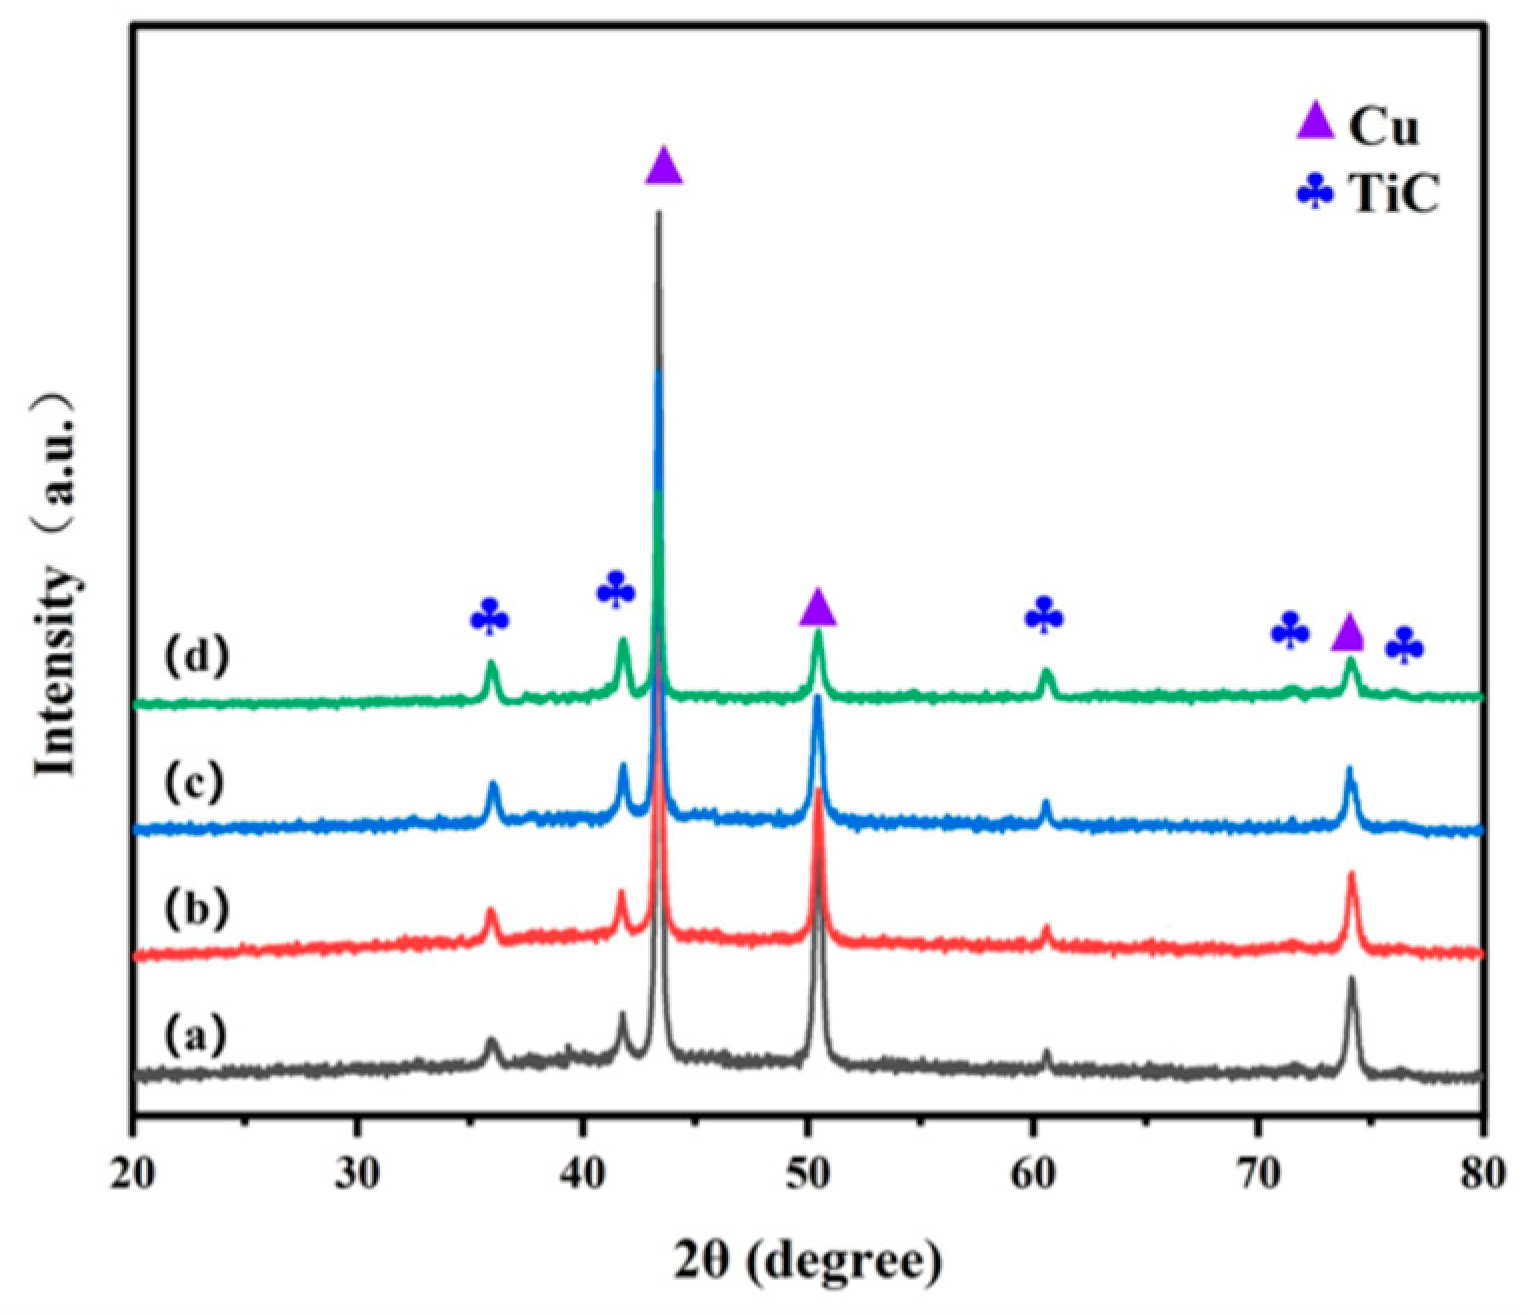
Figure 10.
SEM images of TiC/Cu composites with different TiC contents:[(a) 10 wt.%TiC/Cu; (b) 15 wt.%TiC/Cu; (c) 20 wt.%TiC/Cu; (d) 25 wt.%TiC/Cu].
Figure 10.
SEM images of TiC/Cu composites with different TiC contents:[(a) 10 wt.%TiC/Cu; (b) 15 wt.%TiC/Cu; (c) 20 wt.%TiC/Cu; (d) 25 wt.%TiC/Cu].
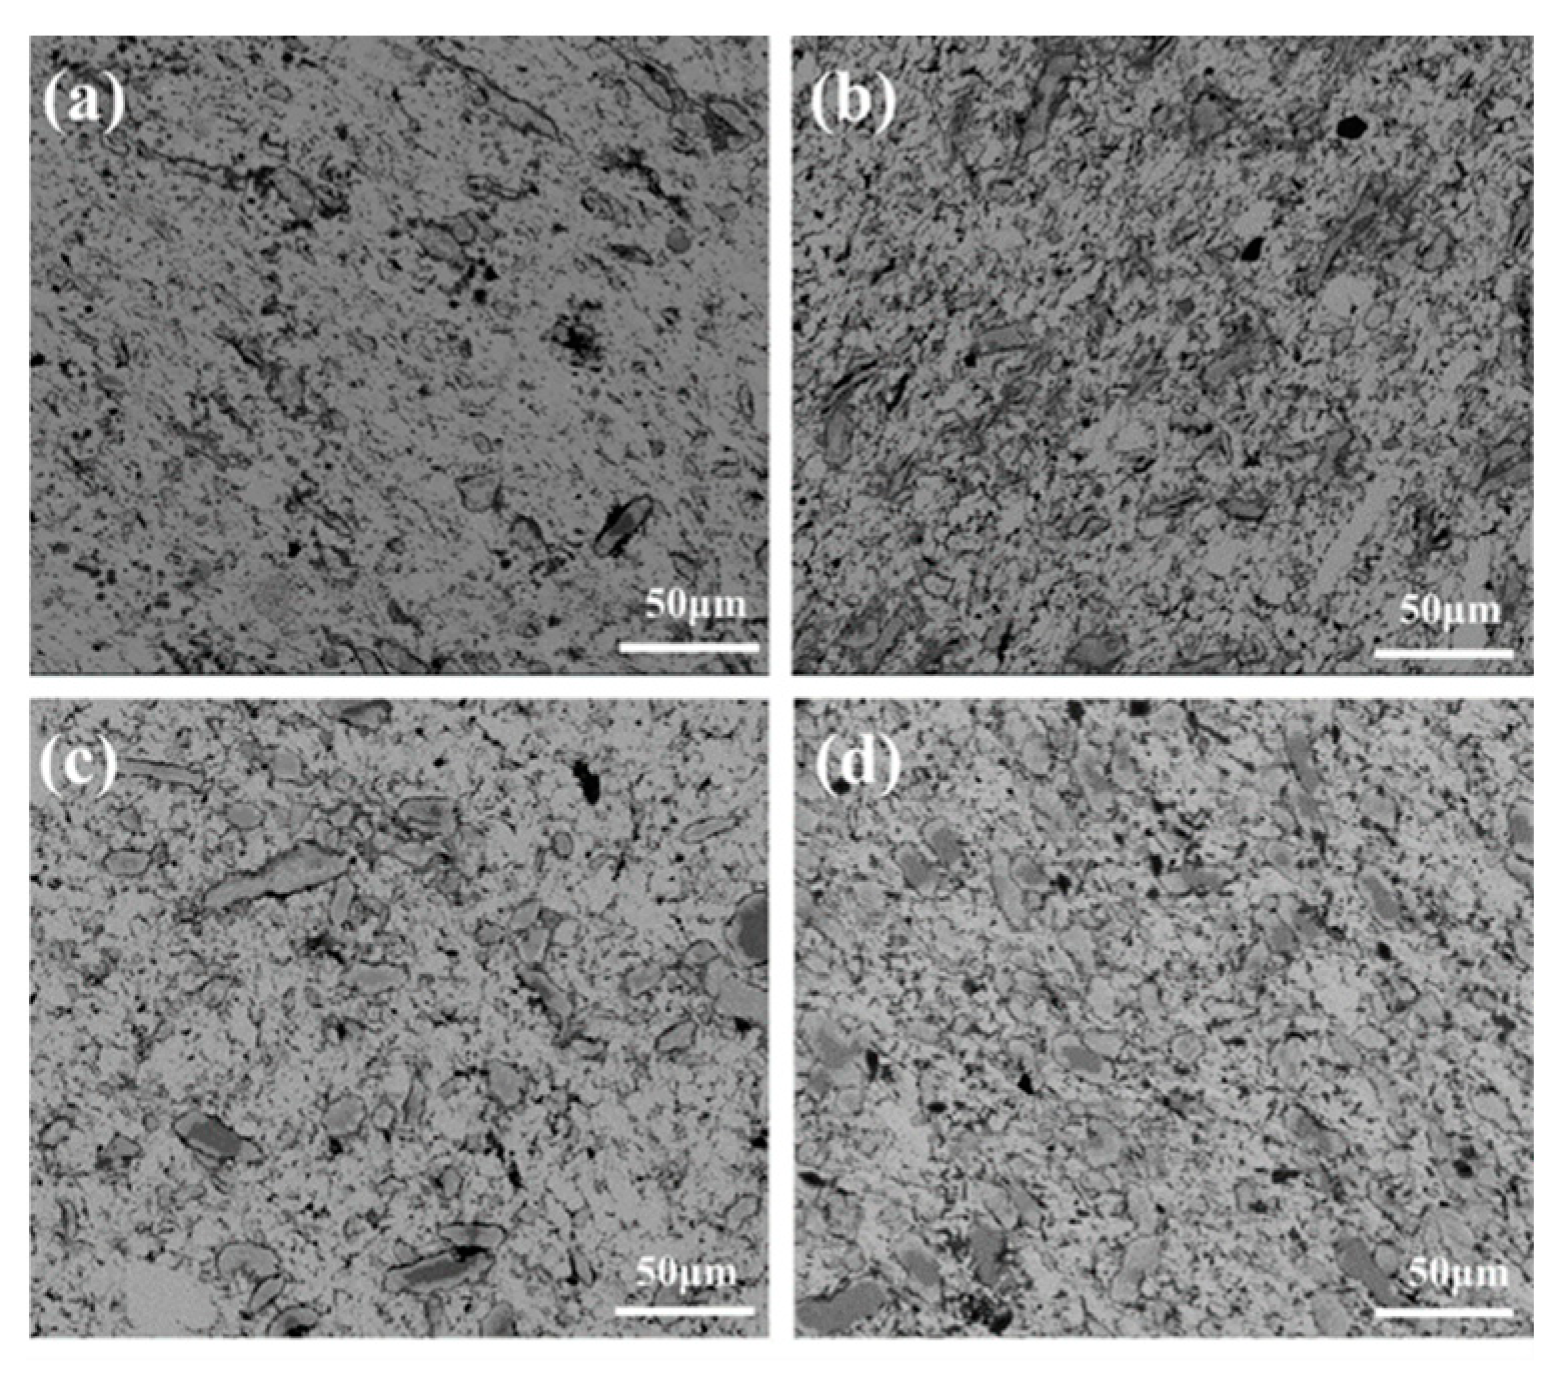
Figure 11.
Conductivity of T900TiC/Cu composites with different TiC contents.
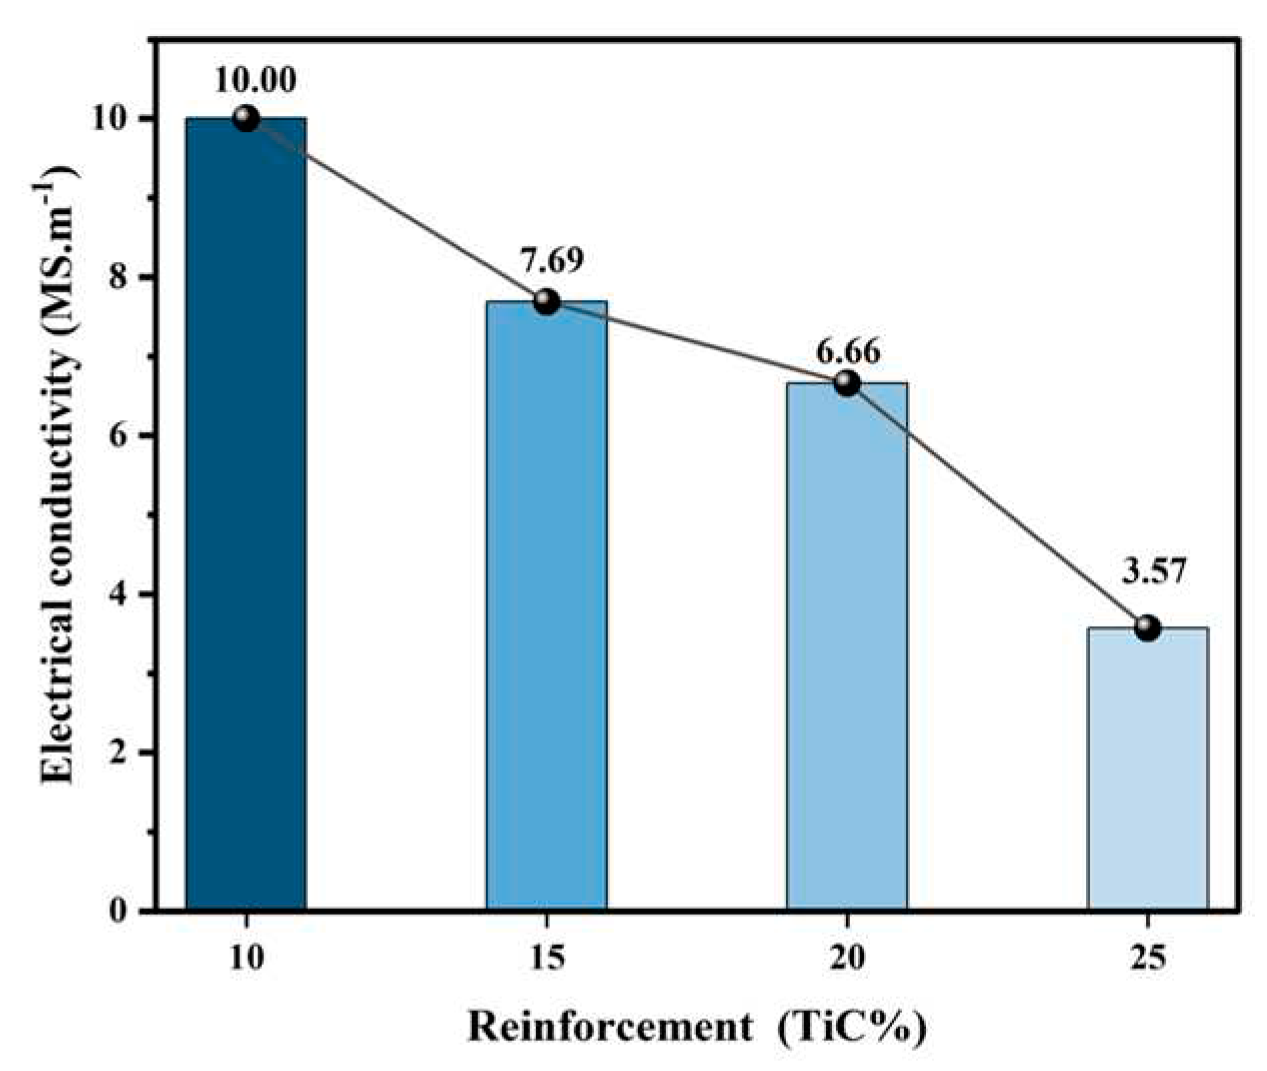
Figure 12.
Vickers hardness of T900TiC/Cu composites with different TiC content.
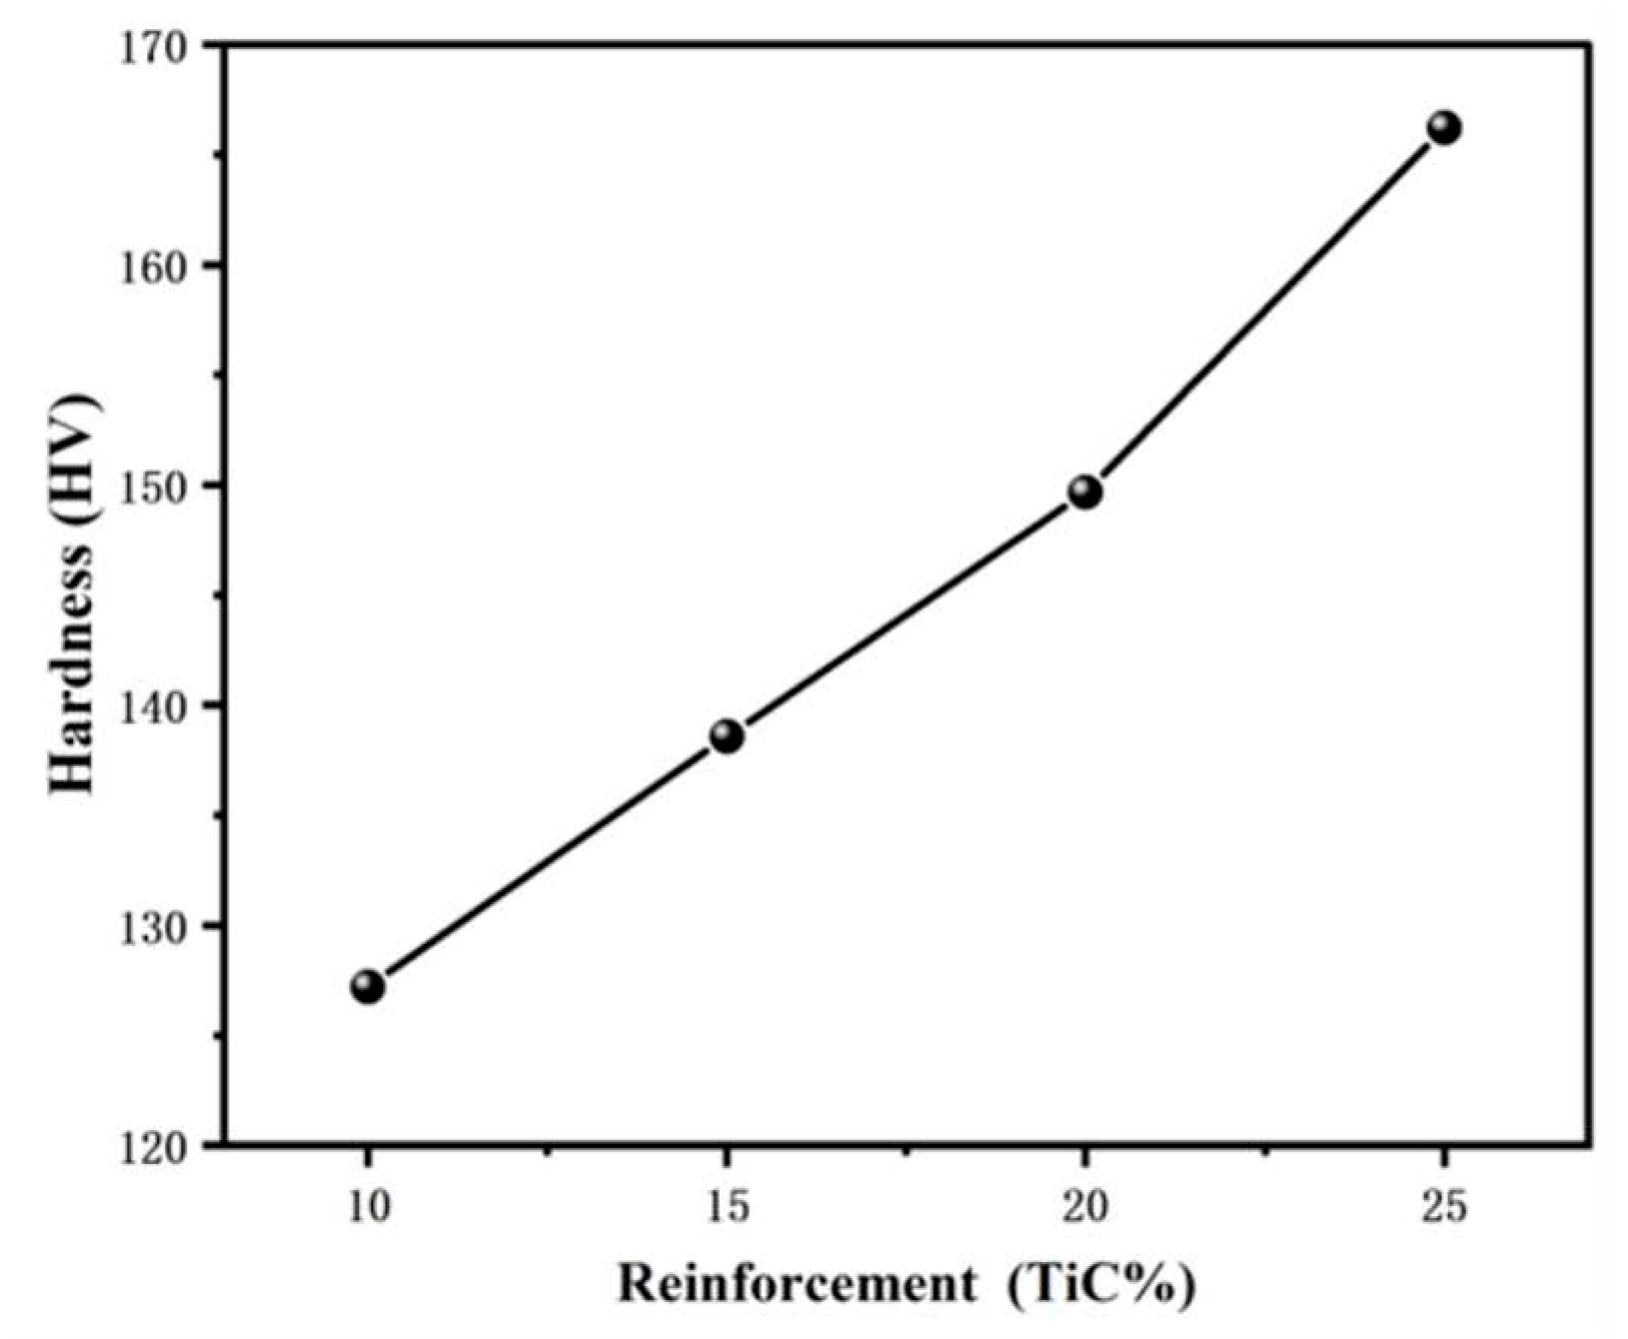
Figure 13.
Compressive stress strain diagrams of T900TiC/Cu composites with different TiC contents: [(a) 10 wt.%TiC/Cu;(b) 15 wt.%TiC/Cu; (c) 20 wt.%TiC/Cu; (d) 25 wt.%TiC/Cu].
Figure 13.
Compressive stress strain diagrams of T900TiC/Cu composites with different TiC contents: [(a) 10 wt.%TiC/Cu;(b) 15 wt.%TiC/Cu; (c) 20 wt.%TiC/Cu; (d) 25 wt.%TiC/Cu].
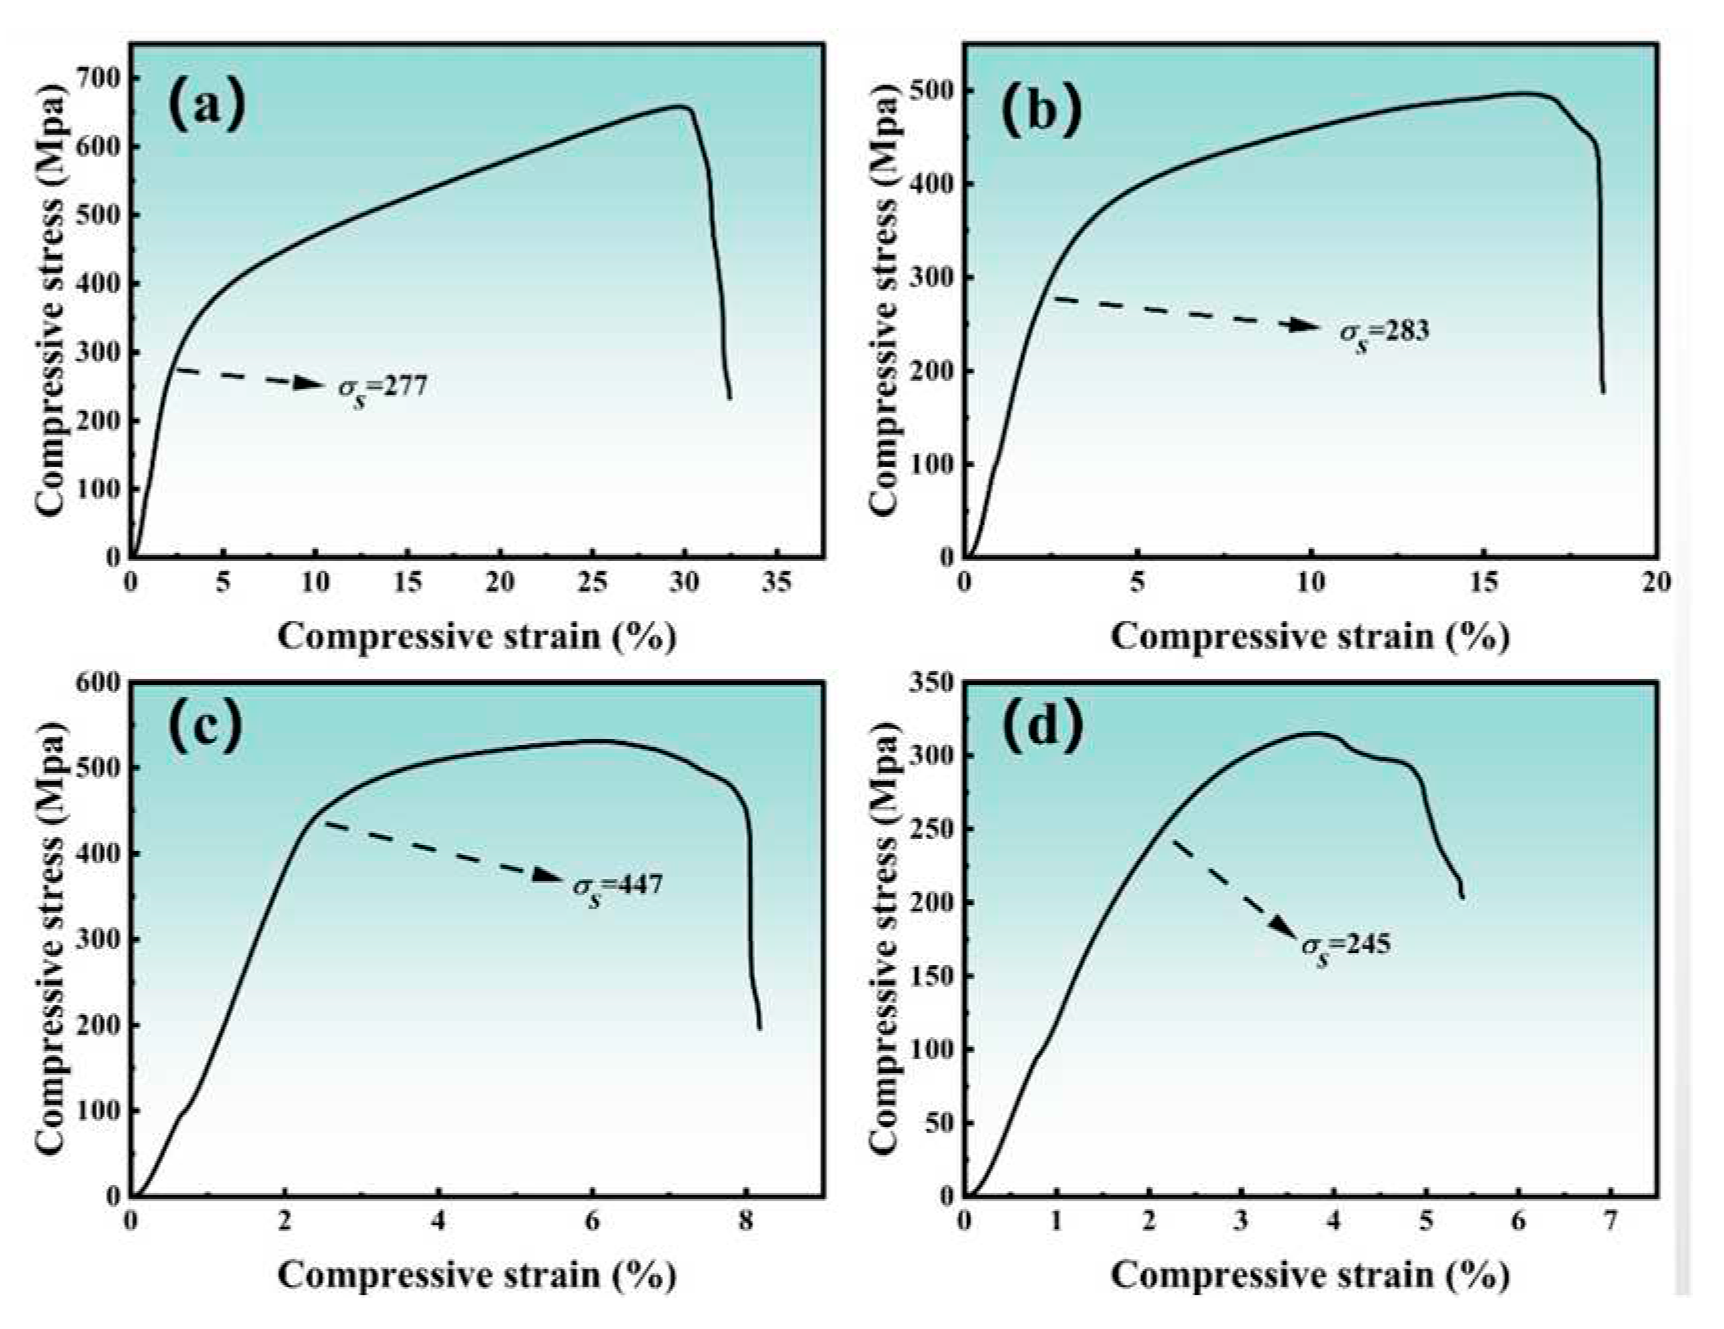

Table 1.
Theoretical density, actual density, relative density and porosity of 5 wt.%TiC/Cu composites at different SPS sintering temperatures.
Table 1.
Theoretical density, actual density, relative density and porosity of 5 wt.%TiC/Cu composites at different SPS sintering temperatures.
| Composites | Theoretical Density (g·cm-3) |
Actual density(g·cm–3) | Relative Density(%) | Stomatal rate(%) |
|---|---|---|---|---|
| T850TiC/Cu | 8.57 | 8.15 | 95.07 | 4.93 |
| T900TiC/Cu | 8.57 | 8.19 | 95.53 | 4.47 |
| T950TiC/Cu | 8.57 | 8.21 | 95.76 | 4.24 |
| T1000TiC/Cu | 8.57 | 8.31 | 96.93 | 3.07 |
Table 2.
Theoretical density, actual density, relative density and porosity of T900TiC/Cu composites with different TiC contents.
Table 2.
Theoretical density, actual density, relative density and porosity of T900TiC/Cu composites with different TiC contents.
| Composites | Theoretical Density (g·cm-3) |
Actual density(g·cm–3) | Relative Density (%) | Stomatal rate (%) |
|---|---|---|---|---|
| 10wt.%TiC/Cu | 8.25 | 7.54 | 91.39 | 8.61 |
| 15wt.%TiC/Cu | 7.95 | 6.92 | 87.04 | 12.96 |
| 20wt.%TiC/Cu | 7.67 | 6.68 | 87.09 | 12.91 |
| 25wt.%TiC/Cu | 7.41 | 5.94 | 80.07 | 19.93 |
Disclaimer/Publisher’s Note: The statements, opinions and data contained in all publications are solely those of the individual author(s) and contributor(s) and not of MDPI and/or the editor(s). MDPI and/or the editor(s) disclaim responsibility for any injury to people or property resulting from any ideas, methods, instructions or products referred to in the content. |
© 2023 by the authors. Licensee MDPI, Basel, Switzerland. This article is an open access article distributed under the terms and conditions of the Creative Commons Attribution (CC BY) license (http://creativecommons.org/licenses/by/4.0/).
Copyright: This open access article is published under a Creative Commons CC BY 4.0 license, which permit the free download, distribution, and reuse, provided that the author and preprint are cited in any reuse.


