Submitted:
11 September 2023
Posted:
13 September 2023
You are already at the latest version
Abstract
The current study presents a computational fluid dynamics model designed to simulate the isolation of 2D graphene components from their dispersion using a microfiltration hollow fiber membrane unit. The model utilizes Navier-Stokes and mass conservation equations to predict the flow and concentration behaviors in the system, and it employs the resistance-in-series approach to couple the fouling of the non-exfoliated graphites in the dispersion to the model. Specifically, the model accounts for the effects of the concentration polarization and cake formation of the fouling component, resulting in the increment of the transmembrane pressure (TMP) of the system. Additionally, we assumed the wettability of polymeric membrane’s inner wall enhances upon fouling by the flat layered structure material, leading to the reduction of the transmemrabe pressure. This approach demosntrates accurate reproduction of the exceptional experimental TMP behavior corresponding to the fouling of the graphite.
Keywords:
computational fluid dynamics
; hollow fiber membrane
; 2D materials
; membrane partition coefficient
1. Introduction
Membrane technology has attained promising ubiquity throughout various research areas and industries, e.g., water treatment [1,2,3] , gas separation [4,5] , food processing [6,7,8,9] , pharmaceutical industry [10,11] , etc., due to its substantial advantages over other filtration techniques. The merits of membranes over other conventional filtration technologies are but are not limited to cost and energy efficiency, selectivity, environmental friendliness, and so forth [12]. In addition, the membranes could be tailored for the filtration of specific components by adjustment of their pore size. Despite their significant benefits over other filtration methods, the expansive utilization of membranes is limited by several obstacles. A major impediment in the efficient operation of membranes is the fouling phenomenon caused by the deposition and the accumulation of colloids, salts, macromolecules, etc., on the membrane’s inner wall [13,14,15,16]. The fouling leads to a reduction of the permeate flux, which reduces the efficiency of the membrane performance and significantly increases the maintenance and operating costs, and shortens the membrane lifespan.
The energy efficiency and the environmental friendliness of membrane filtration have enabled them to penetrate into the growing areas of green and sustainable manufacturing, such as the treatment of wastewater effluent in the food industry [17] , recovery of the bio-sourced precursor (succinic acid) of bio-molecules [18] , recovery of the lignin which is the among the most essential bio-fuel compounds [19] , and so forth. Recently, Downing et al. [20] extended the applications of microfiltration membranes to the isolation of 2D materials (graphene) through cross-flow filtration (CFF). Their study revealed that the separation of the graphene flakes from their polydisperse solution, containing graphene flakes and incomplete-exfoliated graphites, significantly improved the energy and cost-efficiency of graphene production compared to other conventional methods. Moreover, as the isolated graphene flakes were collected from the permeate stream, this CFF demonstration avoids the waste of the permeate flow, which is typically discarded in CFF applications. Although the integration of microfiltration technique for the production of 2D materials might be a promising pathway for the advancement of sustainable manufacturing, due to the nascency of this topic, there is a lack of sufficient understanding of the physics of fouling of layered structure materials, e.g., graphite, optimization of the experimental setup, appropriate membrane materials, etc. This lack of knowledge necessitates the development of reliable models to predict the fouling, and its impacts on the CFF performance for the further advancement of microfiltration of 2D materials.
In general, due to the detrimental effects of fouling on the membrane characteristics, modeling the membrane filtration processes to optimize the membrane operation and minimize the adverse fouling effects has become an integral part of membrane studies. Various models have been proposed to simulate the fouling on the membrane, e.g., film theory, shear-induced model, resistance-in-series, Deryaguin-Landau-Verwey-Overbeek (DLVO) theory, etc [21,22]. Among these, the resistance-in-series has received the most notable attention due to its capacity to accommodate different fouling physics, where the transmembrane pressure (TMP) relates to the combination of the resistances posed by the particles deposition and accumulations on the membrane surface through the Darcy relation. For example, different combinations of concentration polarization of the foulants, gel layer formation, pore blockage, cake formation, etc. [23,24,25,26,27] , have been attributed to the fouling physics in the membrane and have been integrated into the computational fluid dynamics (CFD) modeling of microfiltration. However, to the best of our knowledge, no CFD model attempted to simulate the fouling of layered structure materials such as graphite and relate the concentration of 2D solutes in the permeate flow to the fouling behavior.
The fouling of graphite demonstrated different effects on the performance of the membrane compared to fouling of other macromolecules in conventional microfiltration applications, e.g., spherical colloids, proteins, polysaccharides, microorganisms, etc. In the conventional cases, fouling often leads to an increase in the transmembrane pressure (TMP) to maintain the desired permeate flux [28,29,30,31,32]. In contrast, the fouling of graphite was demonstrated to lead to a slight decrement of TMP in some stages of fouling (please refer to Figure S2 of the reference [20]). Moreover, the solute concentration in the permeate stream which is often neglected, is crucial for examining the filtration performance. To fill this gap and set the stage for optimizing filtration performance, we laid the initial step to simulate the filtration of exfoliated graphenes from the graphite-graphene dispersion. This manuscript is structured as follows: 1 - In the methods section, we describe our assumptions and mathematical expressions. 2 - The Results and Discussion section presents the reproduction of experimental results and the impact of key simulation parameters. 3 - The conclusion section outlines the fundamental findings of the paper.
2. Methods
In this study, we employed a 2-dimensional domain to model a hollow fiber membrane. The domain, which represents the membrane’s lumen side, consists of four edges corresponding to the inlet, outlet, symmetric axis, and inner wall of the membrane (Figure 1). The membrane characteristics and the experimental setup parameters are obtained from Table S1 and Table S2 of Downing’s report [20]. We assumed a uniform distribution of the inlet flow to each individual fiber inside the cartridge, resulting in an inlet average velocity () of 0.65 m/s, calculated using the equation = /(N), where is the inlet flow rate, N is the number of fibers, and is the diameter of the fiber. Furthermore, we assumed that each fiber contributes equally to the permeate flux, leading to a permeate velocity () of 5.5×10 m/s quantified by the /() relation, where is the experimentally set permeate flow rate, and is the length of the fiber. The numerical simulations were performed using COMSOL Multiphysics, version 5.5, to solve the governing equations in the axis-symmetric cylindrical (r, z) coordinate system.
2.1. Governing equations
The velocity and pressure profiles throughout the simulation time are obtained by the numerically solving of continuity equation (Equation (1)), Navier-stokes in the radial direction (Equation (2)), and z-direction (Equation (3)).
The equations of mass conservation for the permeating (exfoliated graphene) and fouling (non-exfoliated graphite) components were coupled with the Navier-Stokes equation to determine the concentration profile of each material. The subscript i is used to denote either the permeating or fouling material.
The continuity and Navier-Stokes equations were subjected to the following boundary conditions. At the inlet, the flow was assumed to be fully developed.
At the outlet, the atmospheric pressure assumption was applied.
The symmetric condition was set at the centerline of the fiber.
And, at the surface of the membrane, the no-slip condition was set, and the radial velocity was fixed to the permeate velocity ()
In addition, for both the permeating (graphene) and fouling (non-exfoliated graphite) components, the feed concentration was set to the inlet, a non-diffusive flux condition was assumed at the outlet, and the symmetric condition was applied to the centerline of the fiber.
We assumed all the fouling particles are completely rejected at the membrane wall.
In contrast, we set the mass flux continuity boundary condition for permeating particles.
We established a relationship between the permeating solute concentration at the permeate side () and the concentration on the lumen side () through the definition of the membrane partition coefficient () for the permeating material.
However, we postulated that the selective partitioning of permeating particles across the membrane vary in the presence of fouling. To account for this, we developed an equation for the membrane partition coefficient () that takes into consideration the fouling effects. The details of this fouling-dependent equation will be elaborated in the subsequent sections.
2.2. Resistance parameters
In the constant permeate flux setup of cross-flow filtrations of macromolecules, fouling often results in an increase in transmembrane pressure (TMP). This increment of TMP is necessary to overcome the growing resistances caused by fouling. However, the fouling of graphite led to a different TMP behavior. By the visual inspection of the TMP profile over time for the filtration of graphene from the non-exfoliated graphite (Figure S2.d of reference [20]), we detected three distinct regimes: an initial rise in TMP, a slight decline in TMP, and a stabilization of TMP. We hypothesize the initial abrupt increment in the TMP corresponds to the formation of the polarization layer, and the final stage corresponds to pore blockage and cake formation, which are related to the TMP through Darcy relation (Equation (16)) in our formulation.
To characterize these two regimes, we adopted the the formulations developed by Marcos et al. [24] to represent the resistances associated with polarization (), and cake formation ().
The parameter corresponds to the steady state value of polarization resistance, indicating the onset of the pore blockage and cake formation regime. The is the polarization time constant and relates to the concentration of the foulants on the inner wall of the membrane through the following equation.
For the sake of more clarity, the term in the Marcos et al. [24] report, which is the combined effects of pore blockage and cake formation resistances, is denoted as in this work. The accounts for shear stress in the flow, which helps wash away foulants and decrease the fouling resistance, and corresponds to the initial adsorption of the foulants to the inner wall membrane and blockage of the pores.
However, the observed slight reduction in TMP during the filtration of 2D graphenes from the ethanol dispersion [20] is unique to the fouling of graphitic layered structures and has not been extensively studied before. To gain insights into this behavior, we turned to studies on graphene-coated membranes [33,34,35,36,37,38,39] , which have yielded enhanced filtraton performance. For example, the coating of the polyamide [37] and polysulfone [38] membranes with graphene oxide (GO) and modification of the polyvinylidene fluoride membrane [39] with sulfonated graphene oxide (SGO) has been reported to increase the flux rate of the permeating water. The higher flux rate of water for the coated membrane cases has been attributed to the greater hydrophilicity of GO and SGO compared to the polymeric surfaces, which leads to better spreading of the water droplets on the membrane surface, and accordingly higher permeation rate of water molecules through the membrane pores. Moreover, it has also been reported that ethanol-containing droplets spread on the surface of pristine graphene flakes [40], and the wettability of the surface increases (contact angle decreases) with higher ethanol content [41] . Therefore, we speculate when the graphite compounds foul on the inner wall of the membrane, smoother and more wettable surfaces are provided for the ethanol flow. This leads to a decrease in the contact angle between the ethanol droplets and the membrane surface, and they spread on the surface, promoting the rate of permeation of ethanol molecules through the pores. Therefore, to maintain the desired permeate flux in the constant permeate flux setup, the driving force (TMP) decreases slightly until the cake formation regime becomes dominant, at which point the TMP levels off. Thereby, to capture the effects of increased wettability of membrane surface upon fouling on the TMP behavior, we defined another resistance term, as below:
As this resistance parameter operates in an opposite direction of the previously defined resistances, that is it explains the reduction of the TMP, we used the prime symbol (’) to differentiate it from the other terms. The is the limit of fouling effect on the enhanced wettability before the cake formation regime takes over the control of the TMP behavior. Also, as the wettability resistance term depends on the concentration of the foulents on the membrane, we used a foulant’s concentration-dependent formulation for the time constant of the wettability effects.
The total resistances used in the Darcy relation (16) to calculate the TMP is expressed in Equation (24). The term represents the clean membrane resistance, which is intrinsic to the membrane’s characteristics. Since the term reduces the magnitude of the resistances in our formulations, it is associated with a negative sign in Equation (24).
This equation represents the local resistance of the membrane along the z-direction, which gives rise to local TMP values according to Equation (16). However, the experimentally obtained TMP values are determined by the following equation.
2.3. Permeate flux concentration
To determine the permeate concentration of the permeating solute (exfoliated graphene), we utilized a partition coefficient (Equation (15)). This coefficient depends on various factors, including membrane properties, solute characteristics, and thermodynamic conditions. However, in our case, the inner surface of the membrane undergoes changes during operation and fouling. As a result, we developed a fouling-dependent expression for the partition coefficient (Equation (26)), which satisfies three conditions:
a) Accounting for the size of the permeating particles. b) Maintaining a constant partition coefficient for very small solute particles molecules, such as ions. c) Reflecting a significant decline in the partition coefficient for large particles that are completely rejected with partial pore blockage.
The formulation introduces two parameters, and , which represent the ratios of rejected permeating particles to rejected ethanol molecules in the polarization and cake formation stages, respectively. When dealing with small particles like ions where = = 0 (Figure 2.a), the partition coefficient remains uniform, resembling the bulk concentration. Conversely, for larger molecules with , 0 (Figure 2.b), as the solvent flows towards the membrane, the particles may be rejected by the foulants during the concentration polarization or cake formation regimes, leading to a decrease in the partition coefficient. Therefore, the fouling-dependent partition coefficient formulation (Equation (26)) accounts for changes in the membrane’s inner surface, differentiates between solute sizes, and ensures the accurate calculation of the permeate concentration.
3. Results
We carried out the optimization of model parameters through two consecutive steps. First, the resistance parameters were determined by fitting the calculated TMP values (Equation (16)) to the experimental data. Then, the and parameters were obtained by fitting the calculated permeate concentration against experimental results. The experimental permeate concentration and TMP values were inherited from Figure S2.c and S2.d of the reference [20].
3.1. TMP dynamics
Table 1 summarizes the resistance parameters used to reproduce experimental TMP data. The value was estimated based on the previously measured hydraulic resistances for the microfiltration hollow fiber membranes (with pore sizes greater than 0.1 m) [42,43,44]. These hydraulic resistance values consistently fall around the scale of . The value was deduced from the TMP value measured at the initial time step. Furthermore, we designated a value of 2 × 10 Pa·s for the feed viscosity to position it between the viscosity of pure ethanol (1.1 × 10 Pa·s) [45] and the measured viscosity of the thickened permeate stream (approximately 2.5 × 10 Pa·s) [20]. To ensure the consistency of the experimental and simulation data, we excluded the initial 3 minutes of the experiment and set t = 3 min as the initial time step. By optimizing the remaining resistance parameters, we successfully captured the three stages of fouling. The optimized parameters yielded a TMP profile that closely matched the experimental results (Figure 3), with a Mean Absolute Error (MAE) of 0.007 psi (Figure 3).
The TMP variation with time reflects the fouling of the foulant particles (non-exfoliated graphites) near the membrane’s inner wall as depicted in Figure 4. The higher concentration of foulants in the proximity of the inner wall (≃ 1 ) indicates the reduction of permeating area for the permeating particles (exfolaited graphene flakes) and, thereby, reduced membrane partition coefficient for them. The effects of different stages of fouling on the filtration of the permeating particles are coupled to and parameters, which will be elaborated in the following section.
3.2. Permeating particle dynamics
Analyzing Figure 3 reveals an initial abrupt increment of the TMP value until it reaches its maximum at t = 500 s, indicating the concentration polarization regime. Subsequently, the fouling particles reduce the pore size and form a cake layer, which begins to dominate the TMP behavior at the end of the membrane operation (t > 6000 s). The effects of the polarization stage on the rejection of permeating solute are encapsulated in the parameter, while the parameter represents the influence of the cake layer growth on the disruption of the solute isolation. To investigate our model’s capability to capture the effects of and parameters on the behavior of the permeating solute at the end of the polarization regime, we examined the concentration gradient in the neighborhood of the inner wall of the membrane, i.e., ≃ 1 (Figure 5), at t = 500 s. As Figure 5.a displays, for the very small solute particles ( = = 0), the uniformity of the inlet concentration (0.075 g/L) is preserved across the domain. For the particles with larger and values, i.e., = 10, = 10 (Figure 5.b), partial rejection of the particles by the foulant compounds occurs, leading to the build-up of the permeating solute particles and elevation of the average concentration value to 0.21 g/L on the membrane wall. Further increment of the value ( = 100, = 10) leads to broader concentration gradient and promotes the average concentration on the wall to 0.32 g/L (Figure 5.c). However, we detected minimal impact by increasing the value, i.e., = 10, = 100, (comparing Figure 5.d and Figure 5.b) on the behavior of permeating solute rejection. Hence, during the concentration polarization stage, solute filtration is primarily controlled by the parameter, with negligible influence from values.
The effects of variation in and parameters on the rejection behavior of permeating solute after more than 2 hours, i.e., t = 7500 s, where the cake formation contribution dominates, are displayed in Figure 6. For the small particles ( = = 0), the solute distribution remains uniform until the end of the simulation (Figure 6.a). With = 10, and = 10, there is an insignificant increment of the wall concentration of permeating solute from 0.21 g/L at t = 500 s (Figure 5.a) to 0.23 g/L at t = 7500 s (Figure 6.b). Increasing the value to 100 yields identical concentration gradient profile of permeating solute near the wall at both t = 500 s (Figure 5.c), and t = 7500 s (Figure 6.c). The slow dynamics of the permeating solute behavior near the wall can be attributed to the fact that for the large values, the membrane partition coefficient converges to its lowest values at the end of the concentration polarization regime, maximizing the solute rejection. Therefore, a stable concentration boundary layer of the permeating solute is formed after the initial stage. Finally, in contrast to minimal effects of values on the average value of permeating solute concentration on the membrane wall at t = 500 s (comparing Figure 5.d and Figure 5.b), raising the value to 100 promoted the wall concentration of permeating solute to 0.27 g/L (Figure 6.d) compared to the 0.21 g/L obtained for the = 10 case at the end of the simulation (Figure 6.b). Therefore, our results suggest that the parameter determines the level of permeating solute rejection during the concentration polarization regime, while the values control the rejection during the cake formation stage.
To further understand the effects of the and parameters on membrane characteristics, we examined the variation of the relative membrane partition coefficient () over time (Figure 7.a), where is the initial partition coefficient. As mentioned earlier, the particles with = = 0 impose no impacts on the membrane characteristics, resulting in a constant partition coefficient (red plot). For the case with the highest value ( = 100), the non-dimensional partition coefficient mitigates to 0.024 after 500 s and remains nearly constant (green plot). The two simulations for the = 10 case initially exhibited identical partition coefficient behaviors (until t = 500 s), but diverged over time, with a slight decline in the case with = 10 (blue plot) and a steeper descent in the case with = 100 (purple plot).
The permeating solute concentration profile at the permeate stream is driven from the membrane partition coefficient and the wall concentration of the permeating solute (on the lumen side) using Equation (15). Figure 7.b demonstrates that the non-dimensional permeate concentration () profile follows a similar pattern to the membrane partition coefficient. However, except for the = = 0 case, where the non-dimensional permeate concentration remains unity throughout the operation time, the permeate concentration is shifted upward compared to the membrane partition coefficient. This difference can stem from two factors. First, as the membrane partition coefficient decreases, a denser build-up of the solute particles is formed near the wall, leading to an increase in in the denominator of Equation (15), providing more solute to permeate through the remaining pores. In addition, the permeating solute concentration on the inner wall () is not uniformly distributed through the z-dimension of the membrane, and therefore, the permeate concentration at the permeate side does not exactly resemble the membrane partition coefficient behavior.
Ultimately, to assess the predictive capability of our model for the permeate concentration profile, we conducted the optimization of and parameters to fit the calculated permeate concentration profile to the experimental data obtained for three different inlet concentrations. The experimental data were drawn from the Figure S2 of reference [20] , where C denotes the combined graphene and non-exfoliated graphite content of the feed. In our simulations, we assumed the graphene compounds and non-exfoliated graphites accounted for 25 wt% and 75 wt% of the C, respectively. As displayed in Figure 8, the simulation yielded a satisfactory correlation with the simulations with a MAE of 0.0002, 0.0003, and 0.0022 g/L for C values of 0.05, 0.1, and 0.3 g/L, respectively. Additionally, we compared the total amount of filtered permeating solute predicted by our model to the experimental data. The comparison revealed strong agreement, with absolute error values of 0.0003, 0.0005, and 0.0003 g/L for C values of 0.05, 0.1, and 0.3 g/L, respectively.
As elaborated in the Methods section, the and parameters represent the relative number of rejected solute particles compared to the rejected solvent molecules. Therefore, these parameters are inherently size and concentration-dependent. We speculate both the and values ascend with increasing concentration. However, the optimized parameters for different concentrations failed to exhibit a meaningful correlation (Table 2). This lack of pattern may be attributed to our approach to obtain the and parameters. As Equation (15) suggests, the partition coefficient is impacted by the interplay between the resistance parameters and the and parameters. For the three different feed concentration studied systems, we adopted similar values for the resistance parameters, such as R, k, R, etc., while these fouling-dependent parameters might vary upon change of the foulant content of the system. Therefore, although our model demonstrated the capability to accurately predict the permeate concentration profile of 2D materials, in order to determine concentration-dependent and parameters, it is essential to target multiple experimental TMP and permeate concentration profiles over time. These profiles will serve as the basis for deriving the relationship between solute rejection behavior and varying concentrations. This approach can be explored in future studies to enhance our understanding of the concentration-dependent effects on fouling parameters.
4. Conclusion
In this study, we presented a CFD model for the filtration of 2D materials using hollow fiber membrane filtration. Navier-stokes and mass conservation equations have been integrated into the model to numerically solve the flow and concentration behaviors in the system. The fouling phenomena were coupled to the model through the Darcy relation and utilization of the resistance-in-series technique. The resistance contributions were assumed to arise from concentration polarization and combined effects of pore reduction and cake formation on the inner surface of the membrane. Additionally, we proposed that fouling of graphitic layered structures enhances the membrane surface wettability, leading to an increment in solvent permeation through the pores. The wettability effect was incorporated into the model by defining the term and combined with the other resistance terms used in the Darcy relation. The model yielded an excellent fit with the experimental transmembrane pressure (TMP) data with the Mean Absolute Error of 0.007 psi.
Furthuremore, the model was also armed with a fouling-dependent membrane partition coefficient for the permeating solute, which formulated the effects of fouling regimes on the rejection of the solute by the definition of and parameters. Our results revealed that the parameter determines the level of the rejection during the concentration polarization regime, while the parameter controls the rejection of the permeating solute during the cake formation stage. The optimized and parameters enabled the model to predict the experimental permeate concentration profile with Mean Absolute Error of 0.0002, 0.0003, and 0.0022 g/L for three different feed concentrations () of 0.05, 0.1, and 0.3 g/L, respectively. The current model initiates the modeling of isolation of 2D materials using hollow fiber membranes, paving the way for further advancements in the eco-friendly production of 2D materials through filtration technique.
Acknowledgments
We acknowledge with gratitude the financial support National Science Foundation (NSF) through the Future Manufacturing MADE-PUBLIC program (grant number 2037026) provided for this work.
References
- Zhao, S.; Zou, L.; Tang, C.Y.; Mulcahy, D. Recent developments in forward osmosis: Opportunities and challenges. Journal of Membrane Science 2012, 396, 1–21. [Google Scholar] [CrossRef]
- Wang, P.; Chung, T.S. Recent advances in membrane distillation processes: Membrane development, configuration design and application exploring. Journal of Membrane Science 2015, 474, 39–56. [Google Scholar] [CrossRef]
- Bera, S.P.; Godhaniya, M.; Kothari, C. Emerging and advanced membrane technology for wastewater treatment: A review. Journal of Basic Microbiology 2022, 62, 245–259. [Google Scholar] [CrossRef]
- Lasseuguette, E.; Comesaña-Gándara, B. Polymer Membranes for Gas Separation. Membranes 2022, 12. [Google Scholar] [CrossRef]
- Dai, Y.; Niu, Z.; Luo, W.; Wang, Y.; Mu, P.; Li, J. A review on the recent advances in composite membranes for CO2 capture processes. Separation and Purification Technology 2023, 307. [Google Scholar] [CrossRef]
- Nazir, A.; Khan, K.; Maan, A.; Zia, R.; Giorno, L.; Schroën, K. Membrane separation technology for the recovery of nutraceuticals from food industrial streams. Trends in Food Science and Technology 2019, 86, 426–438. [Google Scholar] [CrossRef]
- Conidi, C.; Castro-Muñoz, R.; Cassano, A. Membrane-based operations in the fruit juice processing industry: A review. Beverages 2020, 6, 1–39. [Google Scholar] [CrossRef]
- Reig, M.; Vecino, X.; Cortina, J.L. Use of membrane technologies in dairy industry: An overview. Foods 2021, 10. [Google Scholar] [CrossRef]
- Hooshyar, S.; Yoshikawa, H.N.; Mirbod, P. The impact of imposed Couette flow on the stability of pressure-driven flows over porous surfaces. Journal of Engineering Mathematics 2022, 132. [Google Scholar] [CrossRef]
- Lin, H.; Gao, W.; Meng, F.; Liao, B.Q.; Leung, K.T.; Zhao, L.; Chen, J.; Hong, H. Membrane bioreactors for industrial wastewater treatment: A critical review. Critical Reviews in Environmental Science and Technology 2012, 42, 677–740. [Google Scholar] [CrossRef]
- Vanneste, J.; Ormerod, D.; Theys, G.; Gool, D.V.; Camp, B.V.; Darvishmanesh, S.; der Bruggen, B.V. Towards high resolution membrane-based pharmaceutical separations. Journal of Chemical Technology and Biotechnology 2013, 88, 98–108. [Google Scholar] [CrossRef]
- Bera, S.P.; Godhaniya, M.; Kothari, C. Emerging and advanced membrane technology for wastewater treatment: A review. Journal of Basic Microbiology 2022, 62, 245–259. [Google Scholar] [CrossRef] [PubMed]
- Rana, D.; Matsuura, T. Surface modifications for antifouling membranes. Chemical Reviews 2010, 110, 2448–2471. [Google Scholar] [CrossRef] [PubMed]
- Wang, Y.N.; Tang, C.Y. Nanofiltration membrane fouling by oppositely charged macromolecules: Investigation on flux behavior, foulant mass deposition, and solute rejection. Environmental Science and Technology 2011, 45, 8941–8947. [Google Scholar] [CrossRef] [PubMed]
- Nthunya, L.N.; Bopape, M.F.; Mahlangu, O.T.; Mamba, B.B.; der Bruggen, B.V.; Quist-Jensen, C.A.; Richards, H. Fouling, performance and cost analysis of membrane-based water desalination technologies: A critical review. Journal of Environmental Management 2022, 301. [Google Scholar] [CrossRef] [PubMed]
- Kovacs, D.J.; Li, Z.; Baetz, B.W.; Hong, Y.; Donnaz, S.; Zhao, X.; Zhou, P.; Ding, H.; Dong, Q. Membrane fouling prediction and uncertainty analysis using machine learning: A wastewater treatment plant case study. Journal of Membrane Science 2022, 660. [Google Scholar] [CrossRef]
- Pervez, M.N.; Mishu, M.R.; Stylios, G.K.; Hasan, S.W.; Zhao, Y.; Cai, Y.; Zarra, T.; Belgiorno, V.; Naddeo, V. Sustainable treatment of food industry wastewater using membrane technology: A short review. Water (Switzerland) 2021, 13. [Google Scholar] [CrossRef]
- Zaman, N.K.; Rohani, R.; Mohammad, A.W.; Isloor, A.M.; Jahim, J.M. Investigation of succinic acid recovery from aqueous solution and fermentation broth using polyimide nanofiltration membrane. Journal of Environmental Chemical Engineering 2020, 8. [Google Scholar] [CrossRef]
- He, Y.; Bagley, D.M.; Leung, K.T.; Liss, S.N.; Liao, B.Q. Recent advances in membrane technologies for biorefining and bioenergy production. Biotechnology Advances 2012, 30, 817–858. [Google Scholar] [CrossRef]
- Downing, J.R.; Diaz-Arauzo, S.; Chaney, L.E.; Tsai, D.; Hui, J.; Seo, J.W.T.; Cohen, D.R.; Dango, M.; Zhang, J.; Williams, N.X.; Qian, J.H.; Dunn, J.B.; Hersam, M.C. Centrifuge-Free Separation of Solution-Exfoliated 2D Nanosheets via Cross-Flow Filtration. Advanced Materials 2023. [Google Scholar] [CrossRef]
- Rajabzadeh, A.R. Membrane Fouling During Hollow Fiber Ultrafiltration of Protein Solutions: Computational Fluid Modeling and Physicochemical Properties 2010.
- Quezada, C.; Estay, H.; Cassano, A.; Troncoso, E.; Ruby-Figueroa, R. Prediction of permeate flux in ultrafiltration processes: A review of modeling approaches. Membranes 2021, 11. [Google Scholar] [CrossRef] [PubMed]
- Kumar, N.S.K.; Yea, M.K.; Cheryan, M. Ultrafiltration of soy protein concentrate: Performance and modelling of spiral and tubular polymeric modules. Journal of Membrane Science 2004, 244, 235–242. [Google Scholar] [CrossRef]
- Marcos, B.; Moresoli, C.; Skorepova, J.; Vaughan, B. CFD modeling of a transient hollow fiber ultrafiltration system for protein concentration. Journal of Membrane Science 2009, 337, 136–144. [Google Scholar] [CrossRef]
- Das, B.; Bhattacharjee, S.; Bhattacharjee, C. Recovery of Whey Proteins and Enzymatic Hydrolysis of Lactose Derived from Casein Whey Using a Tangential Flow Ultrafiltration Module. Journal of The Institution of Engineers (India): Series E 2013, 94, 79–84. [Google Scholar] [CrossRef]
- Mondal, M.; De, S. Purification of Polyphenols from Green Tea Leaves and Performance Prediction Using the Blend Hollow Fiber Ultrafiltration Membrane. Food and Bioprocess Technology 2019. [Google Scholar] [CrossRef]
- Hosseini, M.K.; Liu, L.; Hosseini, P.K.; Lee, K.; Miao, J. Performance evaluation of a pilot-scale membrane filtration system for oily wastewater treatment: CFD modeling and scale-up design. Journal of Water Process Engineering 2023, 52, 103570. [Google Scholar] [CrossRef]
- Field, R.W.; Wu, D.; Howell, J.A.; Gupta, B.B. Critical flux concept for microfiltration fouling. Journal of Membrane Science 1995, 100, 259–272. [Google Scholar] [CrossRef]
- Ho, C.C.; Zydney, A.L. Transmembrane pressure profiles during constant flux microfiltration of bovine serum albumin. Journal of Membrane Science 2002, 209, 363–377. [Google Scholar] [CrossRef]
- Field, R.W.; Pearce, G.K. Critical, sustainable and threshold fluxes for membrane filtration with water industry applications. Advances in Colloid and Interface Science 2011, 164, 38–44. [Google Scholar] [CrossRef]
- Kirschner, A.Y.; Cheng, Y.H.; Paul, D.R.; Field, R.W.; Freeman, B.D. Fouling mechanisms in constant flux crossflow ultrafiltration. Journal of Membrane Science 2019, 574, 65–75. [Google Scholar] [CrossRef]
- Hube, S.; Hauser, F.; Burkhardt, M.; Brynjólfsson, S.; Wu, B. Ultrasonication-assisted fouling control during ceramic membrane filtration of primary wastewater under gravity-driven and constant flux conditions. Separation and Purification Technology 2023, 310. [Google Scholar] [CrossRef]
- Straub, A.P.; Bergsman, D.S.; Getachew, B.A.; Leahy, L.M.; Patil, J.J.; Ferralis, N.; Grossman, J.C. Highly Conductive and Permeable Nanocomposite Ultrafiltration Membranes Using Laser-Reduced Graphene Oxide. Nano Letters 2021, 21, 2429–2435. [Google Scholar] [CrossRef] [PubMed]
- Ding, A.; Ren, Z.; Zhang, Y.; Ma, J.; Bai, L.; Wang, B.; Cheng, X. Evaluations of holey graphene oxide modified ultrafiltration membrane and the performance for water purification. Chemosphere 2021, 285. [Google Scholar] [CrossRef]
- Kumar, M.; Sreedhar, N.; Thomas, N.; Mavukkandy, M.; Ismail, R.A.; Aminabhavi, T.M.; Arafat, H.A. Polydopamine-coated graphene oxide nanosheets embedded in sulfonated poly(ether sulfone) hybrid UF membranes with superior antifouling properties for water treatment. Chemical Engineering Journal 2022, 433. [Google Scholar] [CrossRef]
- Likhi, F.H.; Singh, M.; Chavan, S.V.; Cao, T.; Shanbedi, M.; Karim, A. Effects of Film Confinement on Dielectric and Electrical Properties of Graphene Oxide and Reduced Graphene Oxide-Based Polymer Nanocomposites: Implications for Energy Storage. ACS Applied Nano Materials 2023. [Google Scholar] [CrossRef]
- Choi, W.; Choi, J.; Bang, J.; Lee, J.H. Layer-by-layer assembly of graphene oxide nanosheets on polyamide membranes for durable reverse-osmosis applications. ACS Applied Materials and Interfaces 2013, 5, 12510–12519. [Google Scholar] [CrossRef]
- Lee, J.; Chae, H.R.; Won, Y.J.; Lee, K.; Lee, C.H.; Lee, H.H.; Kim, I.C.; min Lee, J. Graphene oxide nanoplatelets composite membrane with hydrophilic and antifouling properties for wastewater treatment. Journal of Membrane Science 2013, 448, 223–230. [Google Scholar] [CrossRef]
- Miao, W.; Li, Z.K.; Yan, X.; Guo, Y.J.; Lang, W.Z. Improved ultrafiltration performance and chlorine resistance of PVDF hollow fiber membranes via doping with sulfonated graphene oxide. Chemical Engineering Journal 2017, 317, 901–912. [Google Scholar] [CrossRef]
- Lundgren, M.; Allan, N.L.; Cosgrove, T.; George, N. Wetting of water and water/ethanol droplets on a non-polar surface: A molecular dynamics study. Langmuir 2002, 18, 10462–10466. [Google Scholar] [CrossRef]
- Metya, A.K.; Khan, S.; Singh, J.K. Wetting transition of the ethanol-water droplet on smooth and textured surfaces. Journal of Physical Chemistry C 2014, 118, 4113–4121. [Google Scholar] [CrossRef]
- Fang, H.H.; Shi, X. Pore fouling of microfiltration membranes by activated sludge. Journal of Membrane Science 2005, 264, 161–166. [Google Scholar] [CrossRef]
- Yi, Z.; Zhu, L.P.; Xu, Y.Y.; Zhao, Y.F.; Ma, X.T.; Zhu, B.K. Polysulfone-based amphiphilic polymer for hydrophilicity and fouling-resistant modification of polyethersulfone membranes. Journal of Membrane Science 2010, 365, 25–33. [Google Scholar] [CrossRef]
- Li, X.; Li, J.; Wang, J.; Wang, H.; He, B.; Zhang, H.; Guo, W.; Ngo, H.H. Experimental investigation of local flux distribution and fouling behavior in double-end and dead-end submerged hollow fiber membrane modules. Journal of Membrane Science 2014, 453, 18–26. [Google Scholar] [CrossRef]
- Gonalves, F.A.; Trindade, A.R.; Costa, C.S.; Bernardo, J.C.; Johnson, I.; Fonseca, I.M.; Ferreira, A.G. PVT, viscosity, and surface tension of ethanol: New measurements and literature data evaluation. Journal of Chemical Thermodynamics 2010, 42, 1039–1049. [Google Scholar] [CrossRef]
Figure 1.
Schematic representation of the 2D domain for the simulation of the cylindrical hollow fiber membrane.
Figure 1.
Schematic representation of the 2D domain for the simulation of the cylindrical hollow fiber membrane.
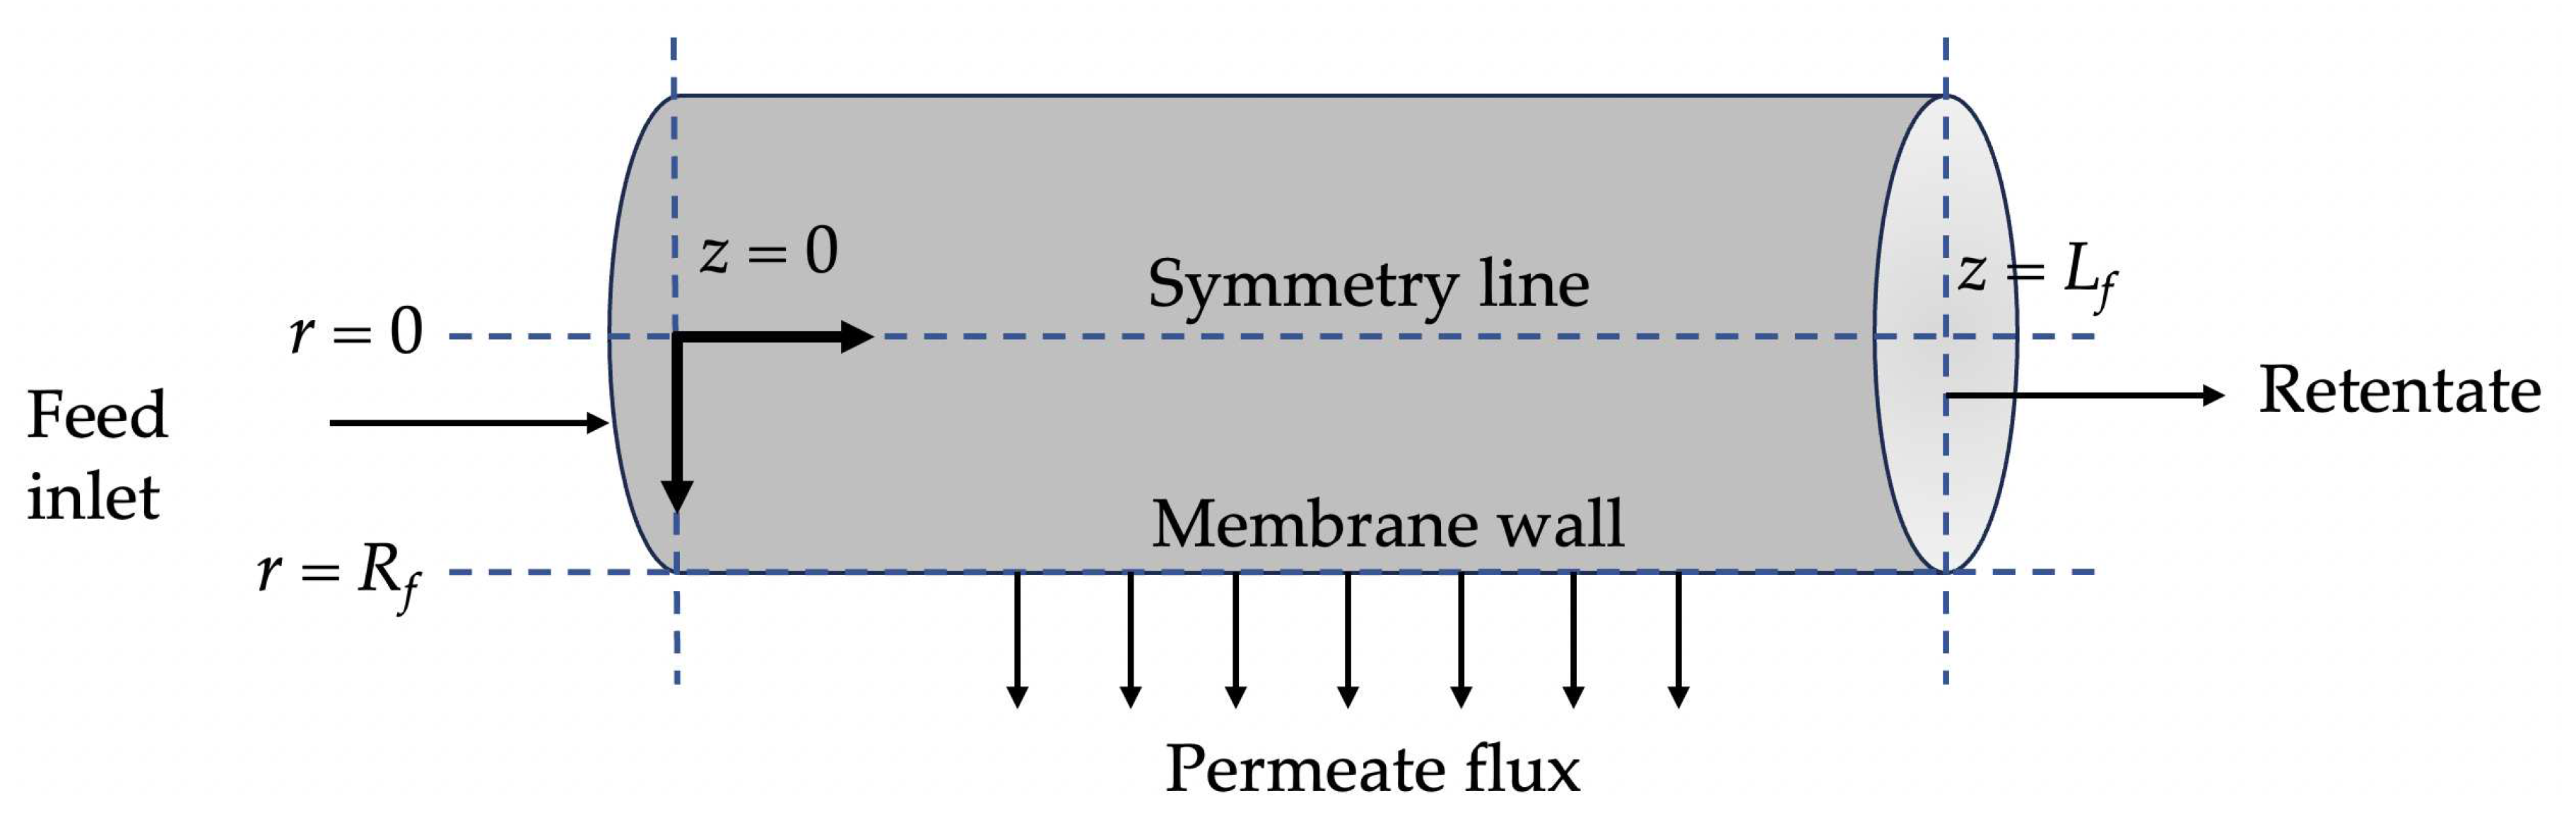
Figure 2.
Effect of fouling on the permeate behavior of permeating particles. (a) Small particles ( = = 0) permeate through the pores with the solvent flow. (b) Large particles ( , 0) are rejected by the reduced pore size due to the fouling, justifying the varying membrane partition coefficient for these particles.
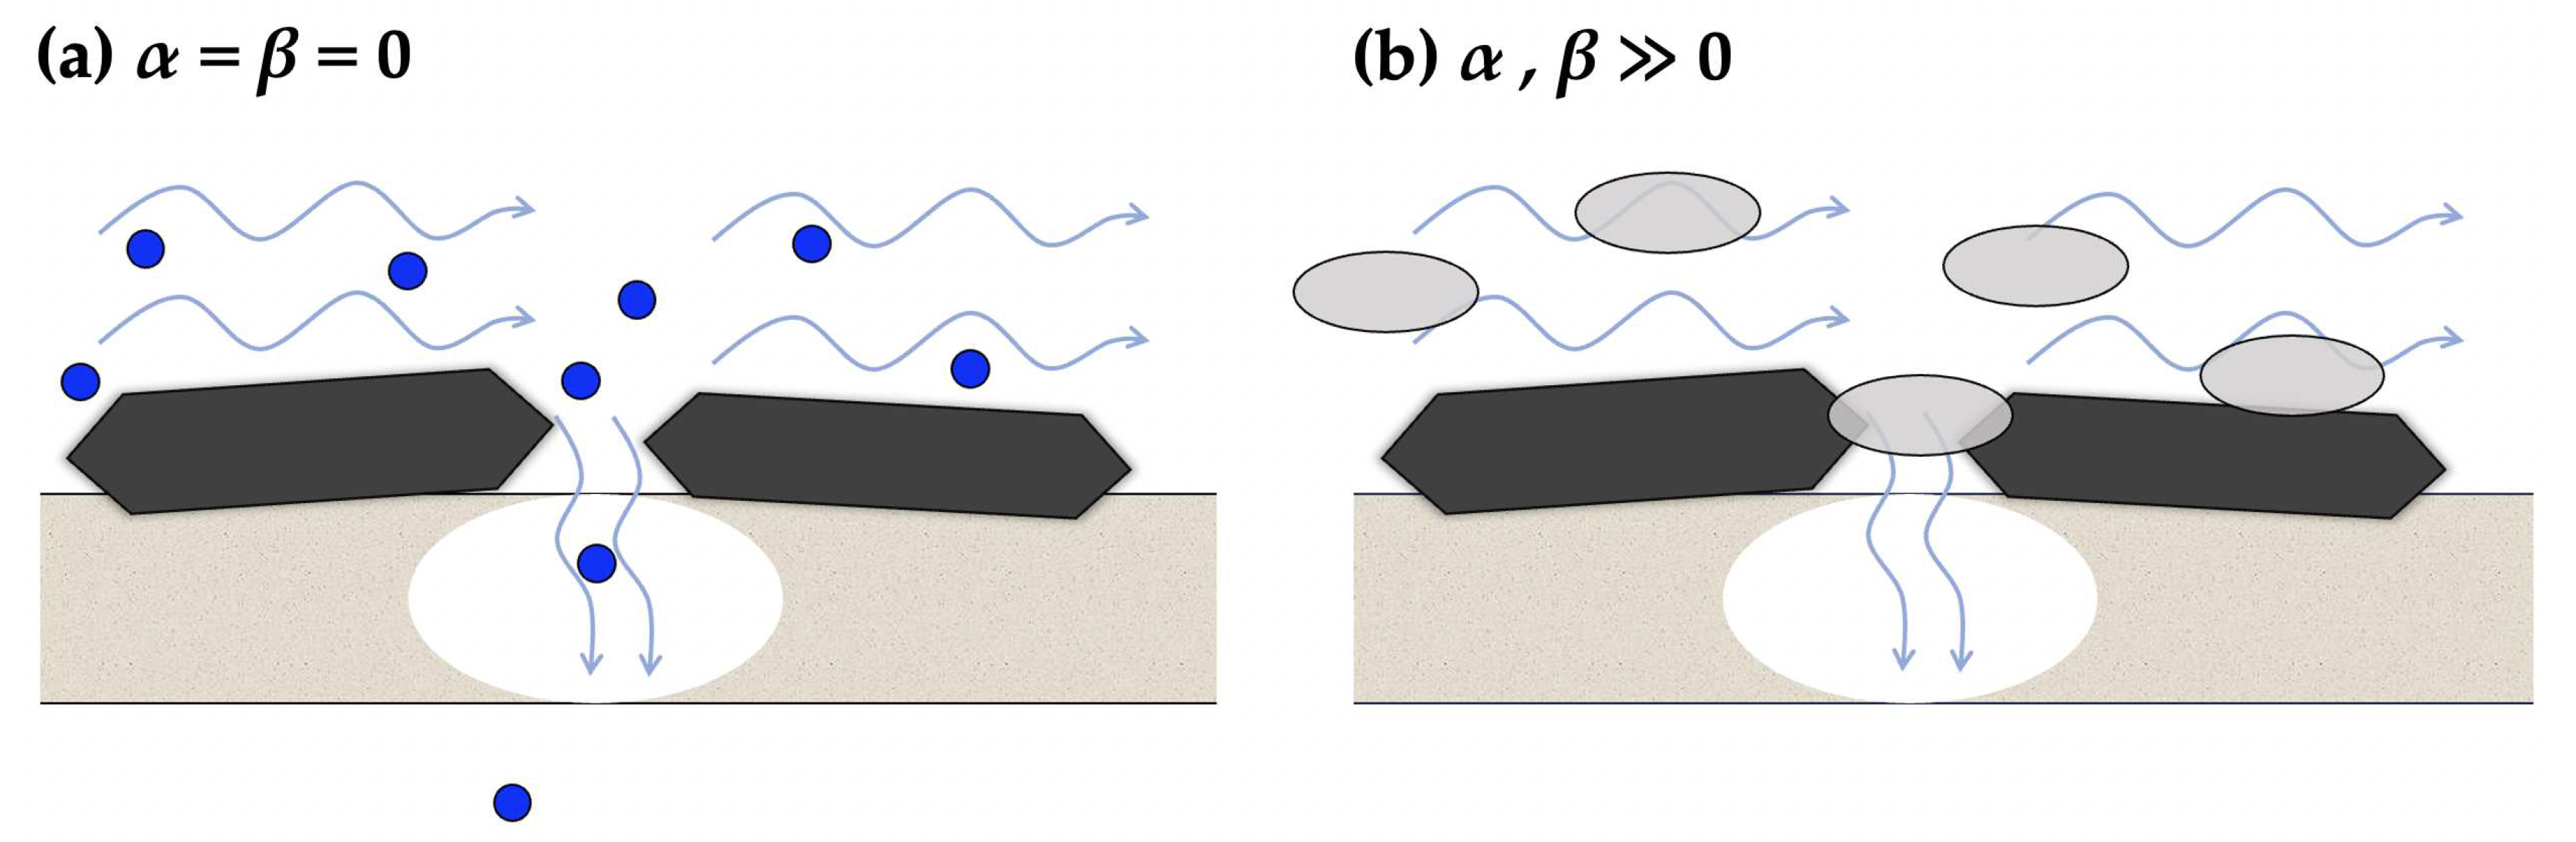
Figure 3.
Variation of TMP over time obtained from experiments and simulations using optimized parameters.
Figure 3.
Variation of TMP over time obtained from experiments and simulations using optimized parameters.
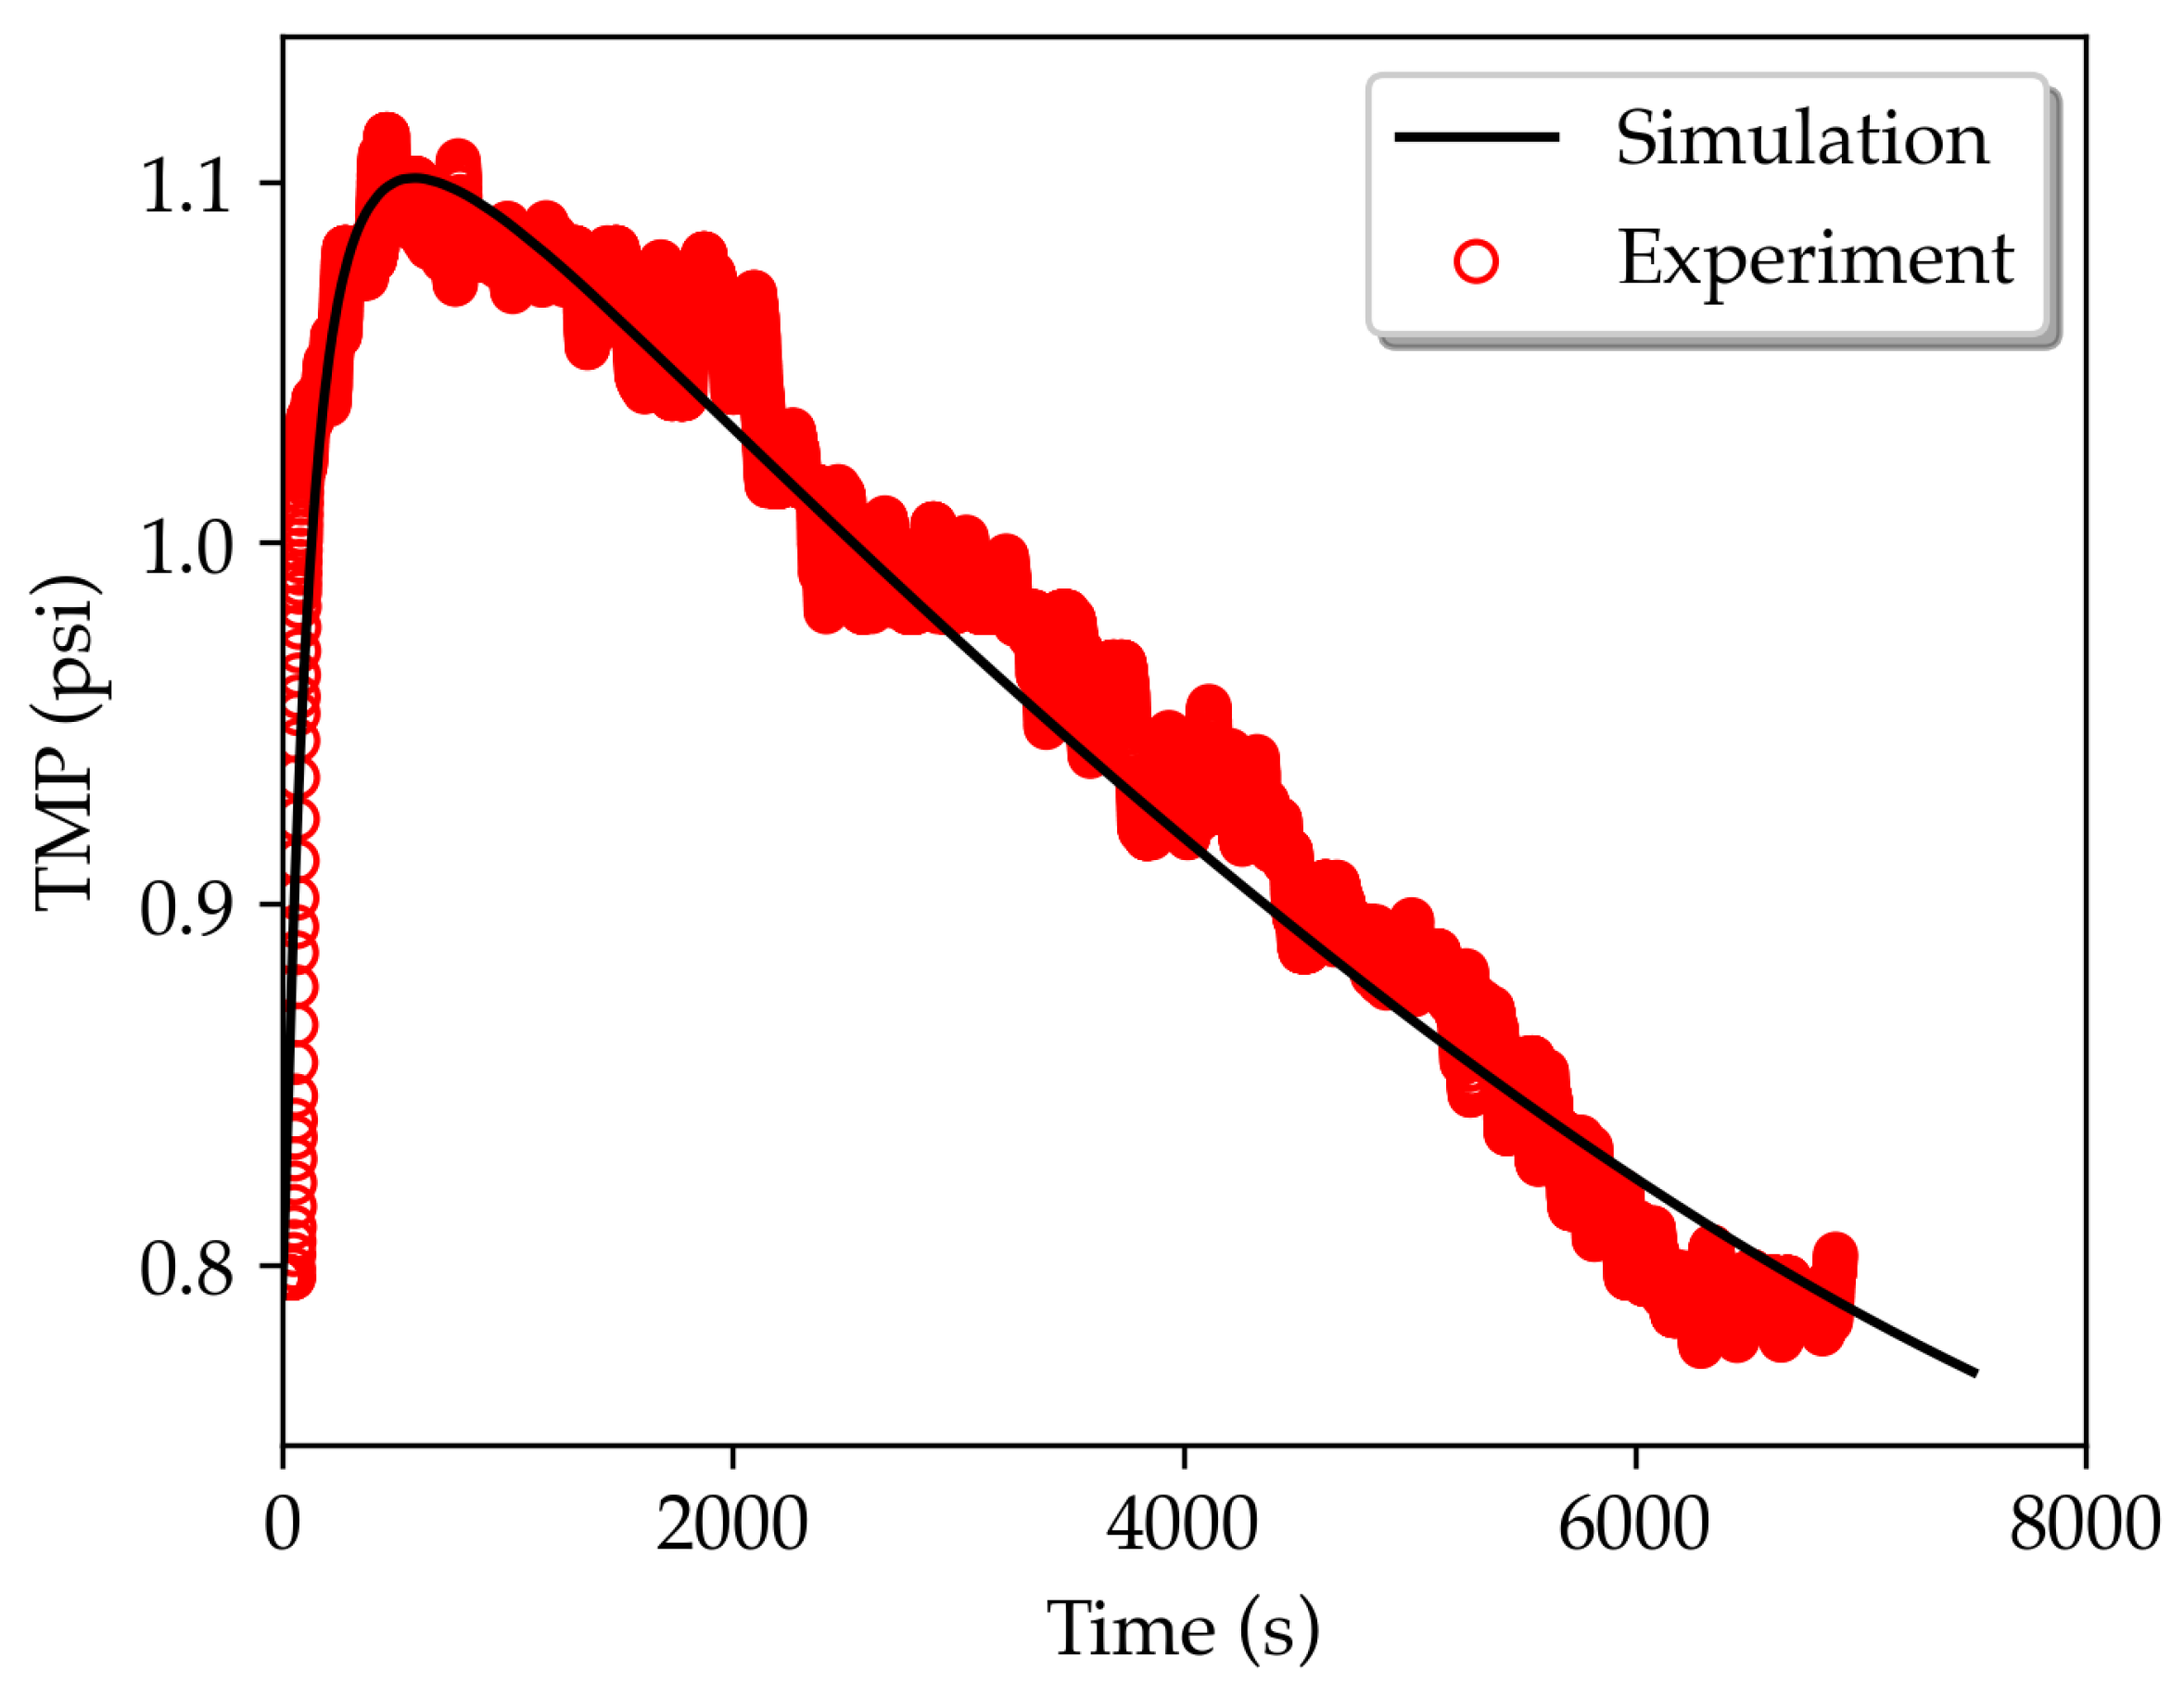
Figure 4.
Concentration gradient of the fouling particle near inner the wall of membrane.
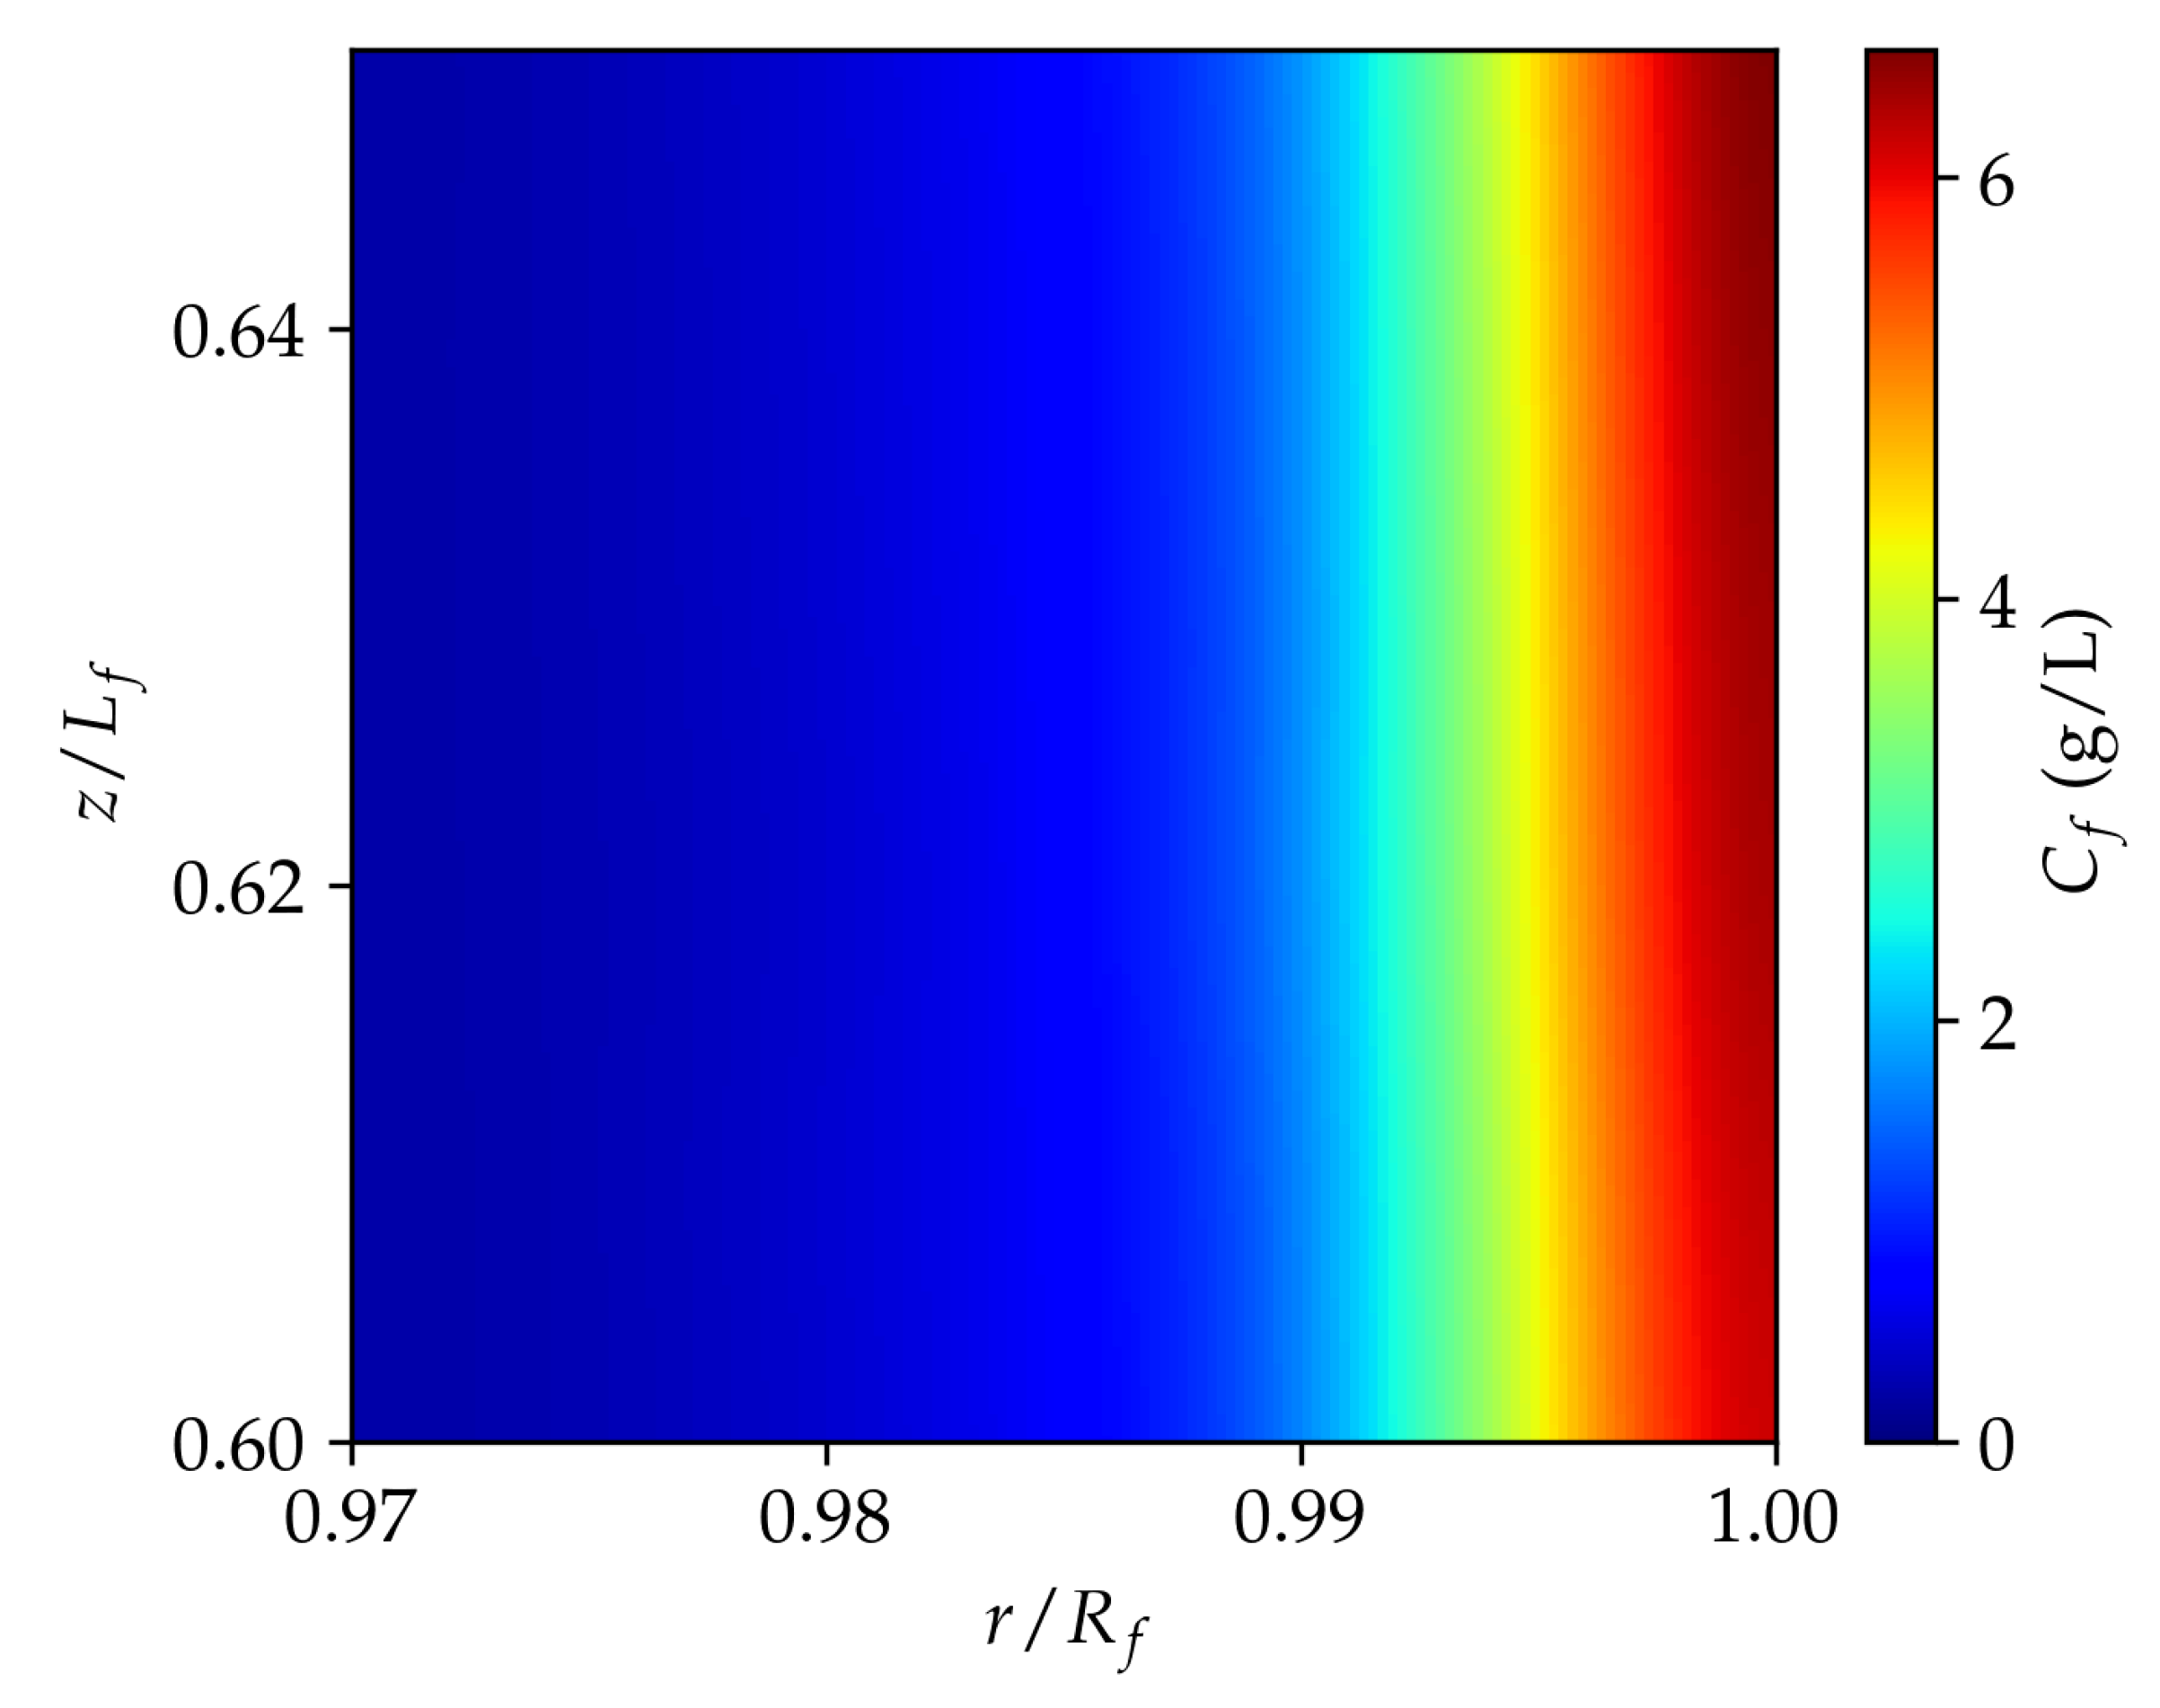
Figure 5.
Concentration gradient of permeating solute at t = 500 s for (a) = = 0, (b) = 10, = 10, (c) = 100, = 10, (d) = 10, = 100.
Figure 5.
Concentration gradient of permeating solute at t = 500 s for (a) = = 0, (b) = 10, = 10, (c) = 100, = 10, (d) = 10, = 100.
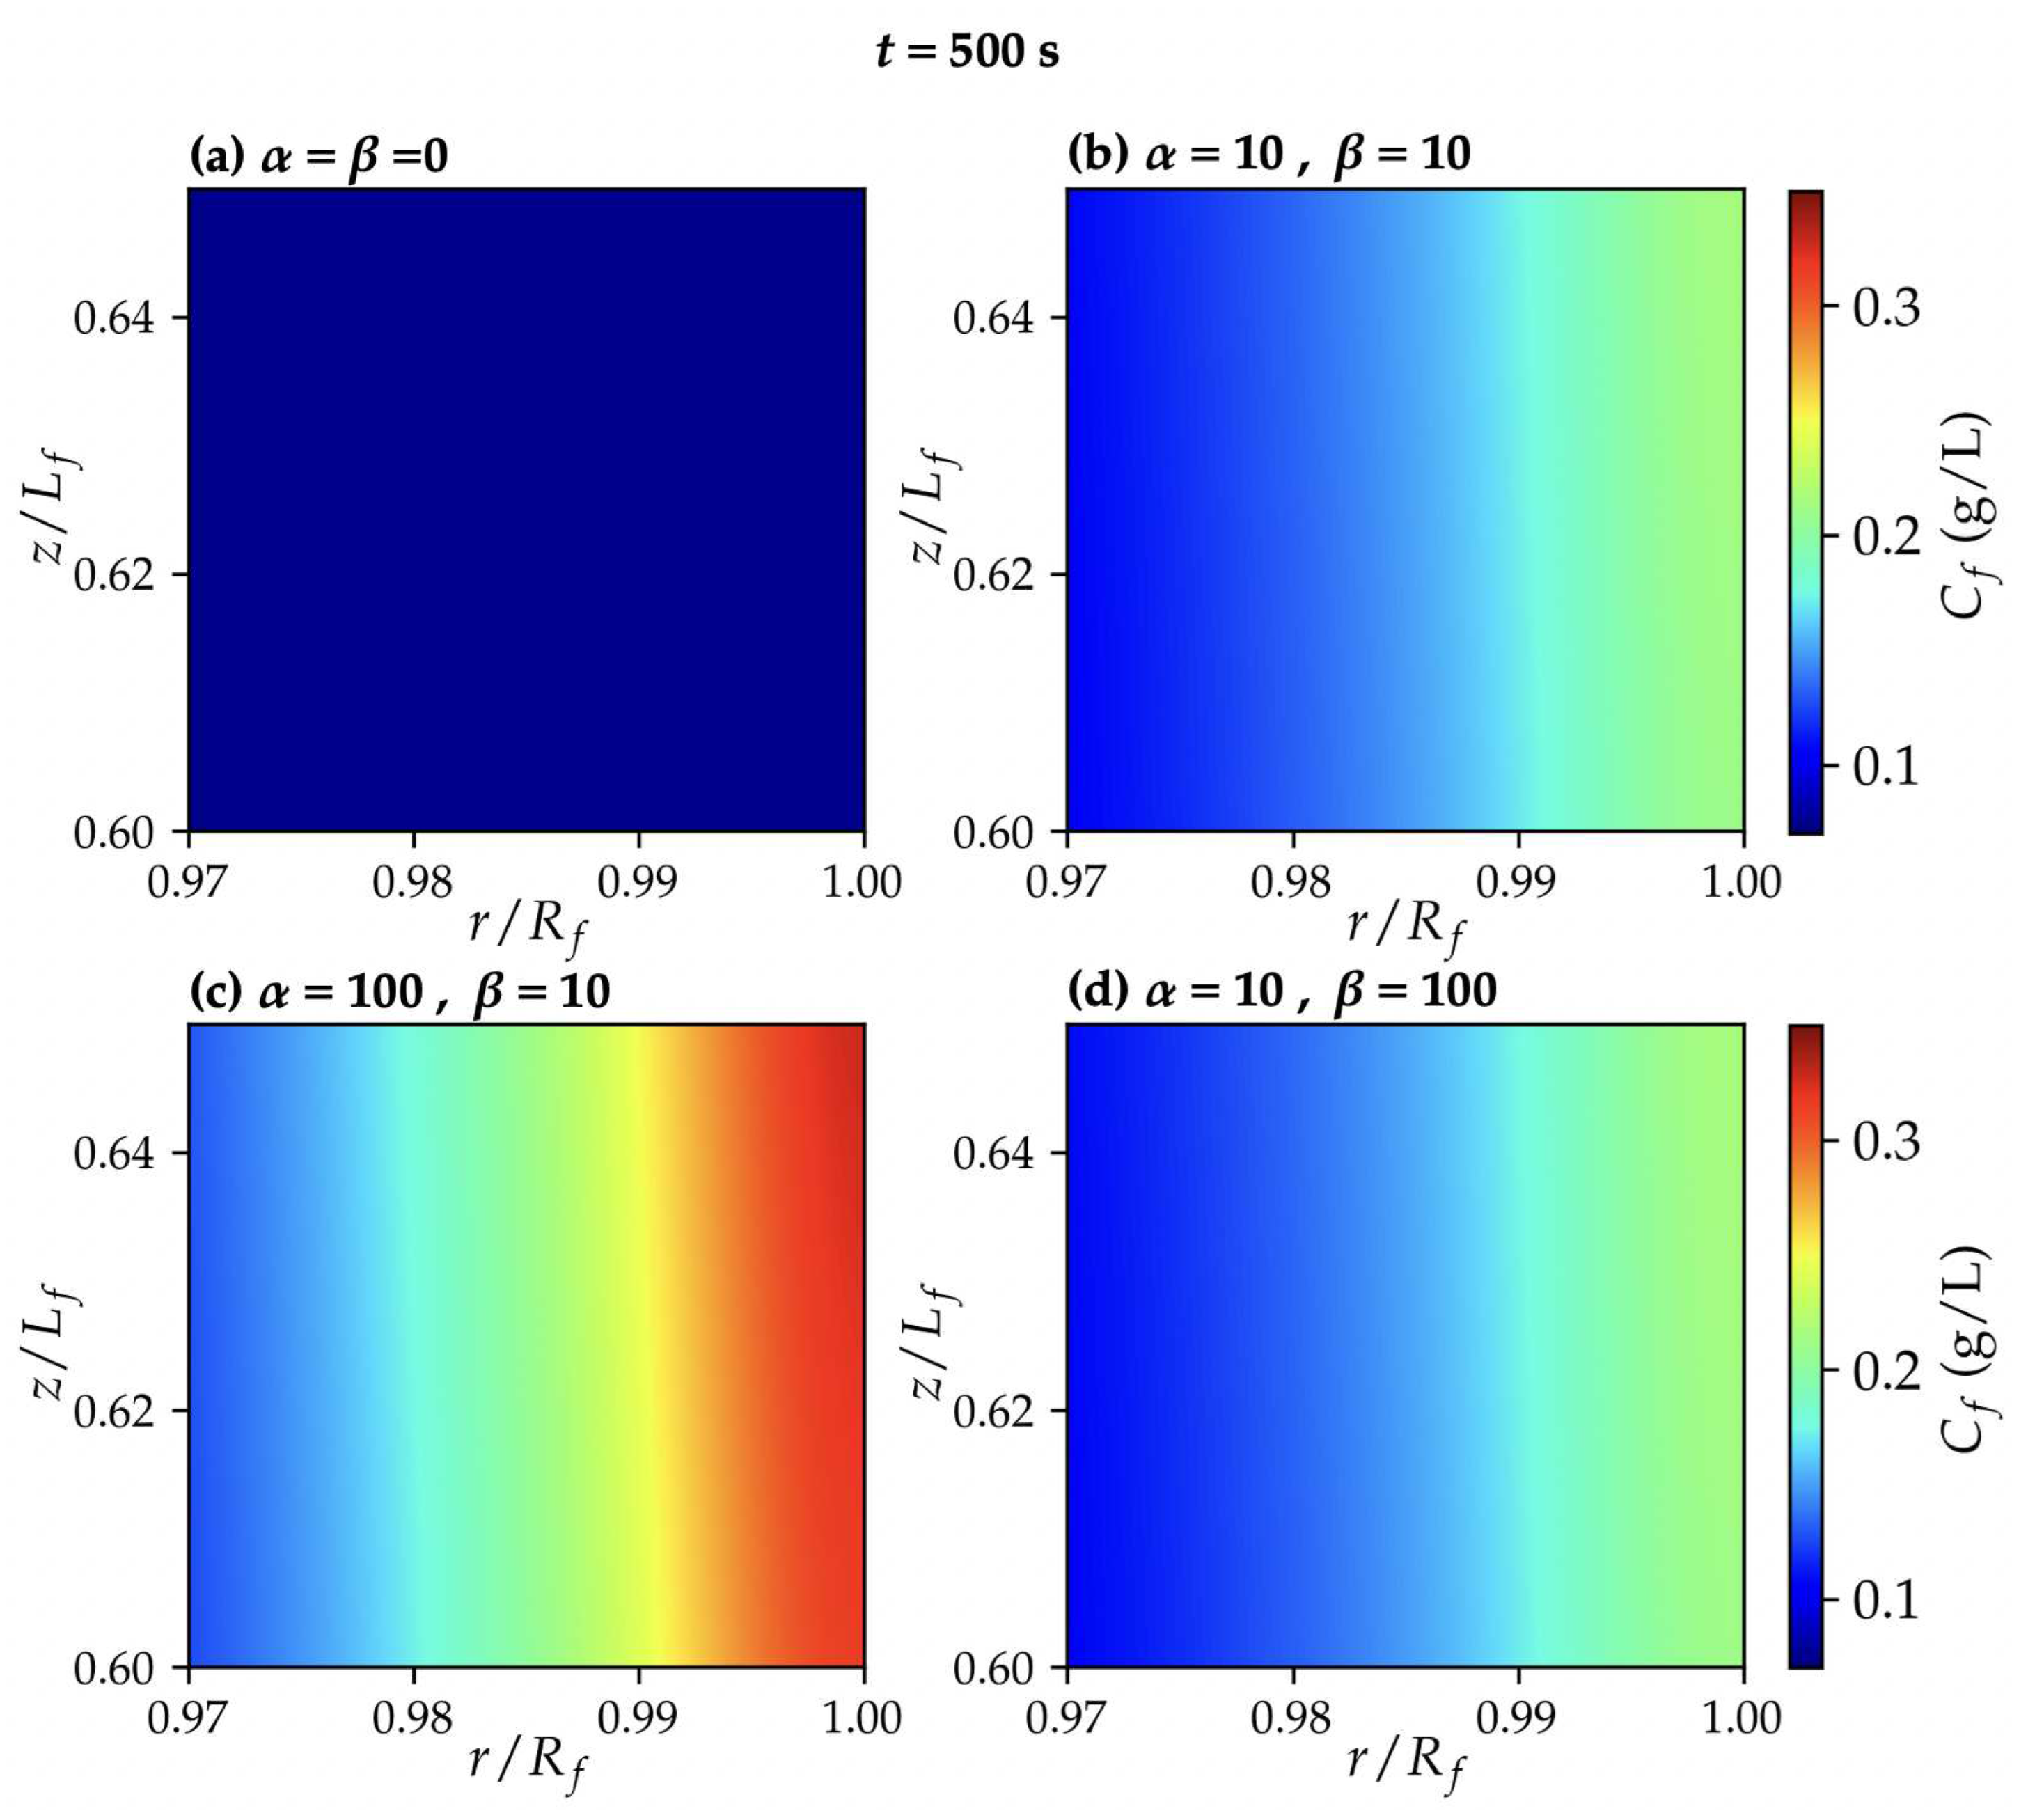
Figure 6.
Concentration gradient of permeating solute at t = 7500 s for (a) = = 0, (b) = 10, = 10, (c) = 100, = 10, (d) = 10, = 100.
Figure 6.
Concentration gradient of permeating solute at t = 7500 s for (a) = = 0, (b) = 10, = 10, (c) = 100, = 10, (d) = 10, = 100.
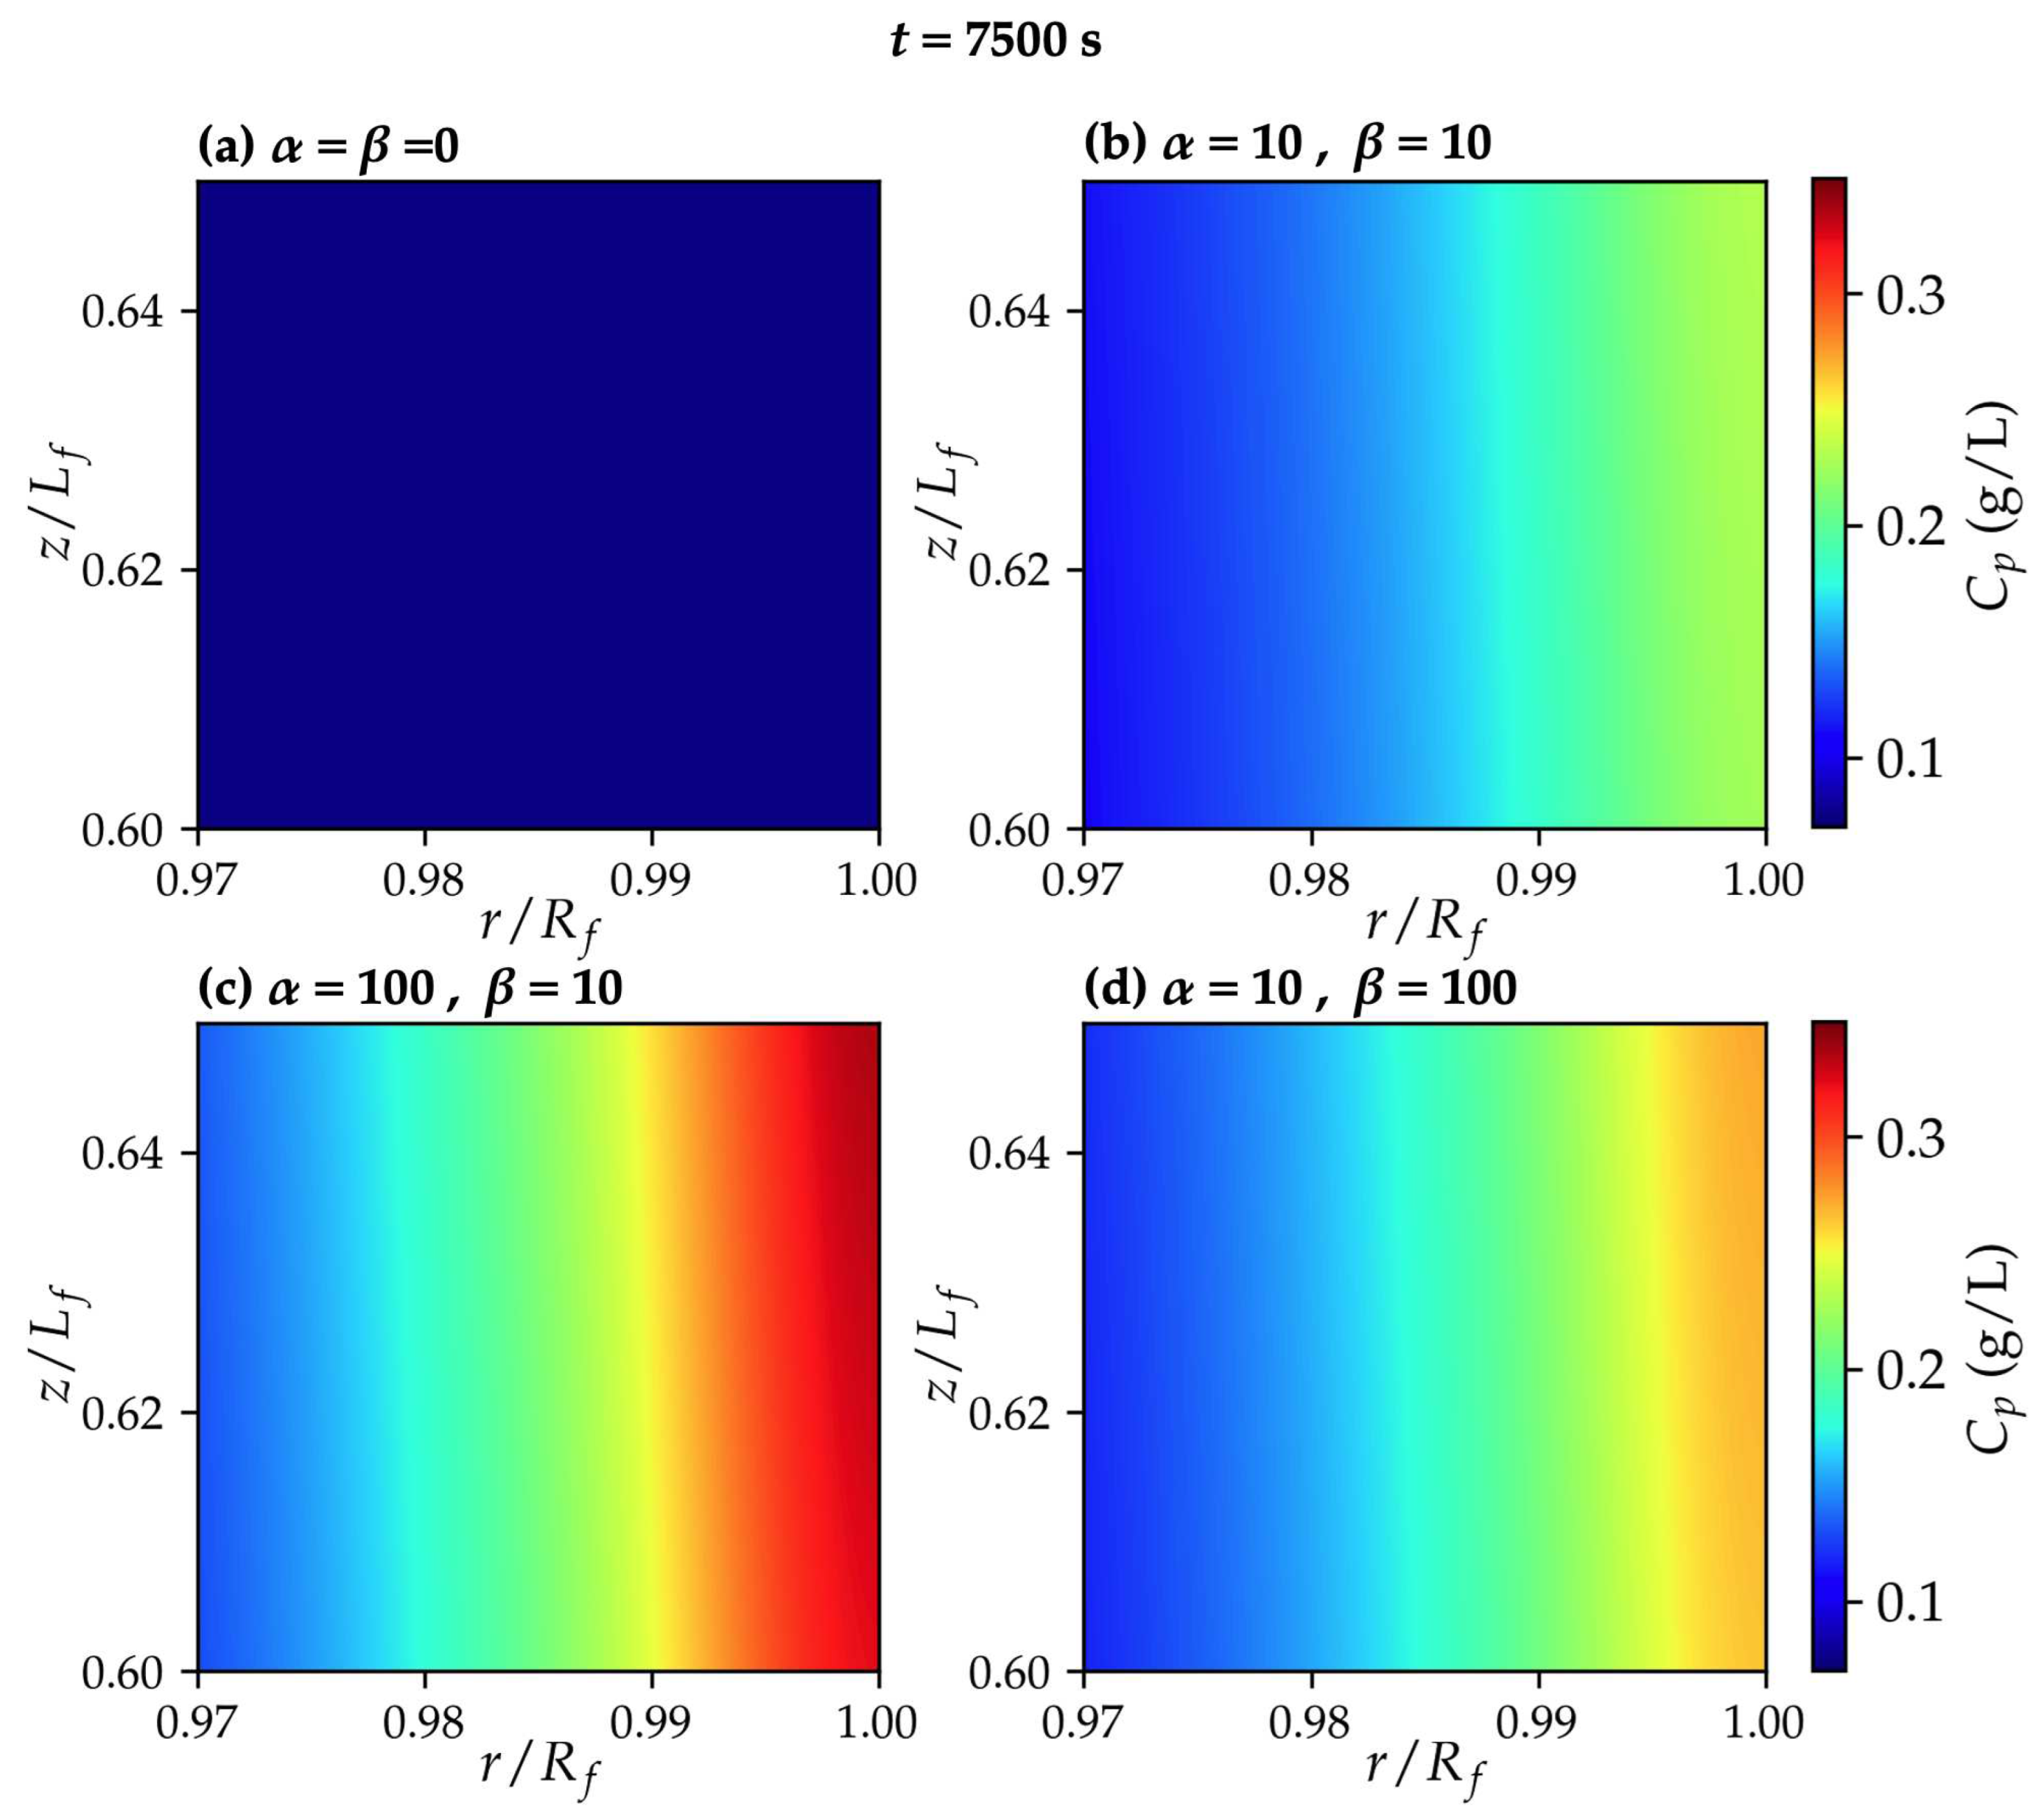
Figure 7.
Variation of (a) and (b) over time. and are membrane partition coefficient and the permeate concentration obtained at the initial time step, respectively.
Figure 7.
Variation of (a) and (b) over time. and are membrane partition coefficient and the permeate concentration obtained at the initial time step, respectively.
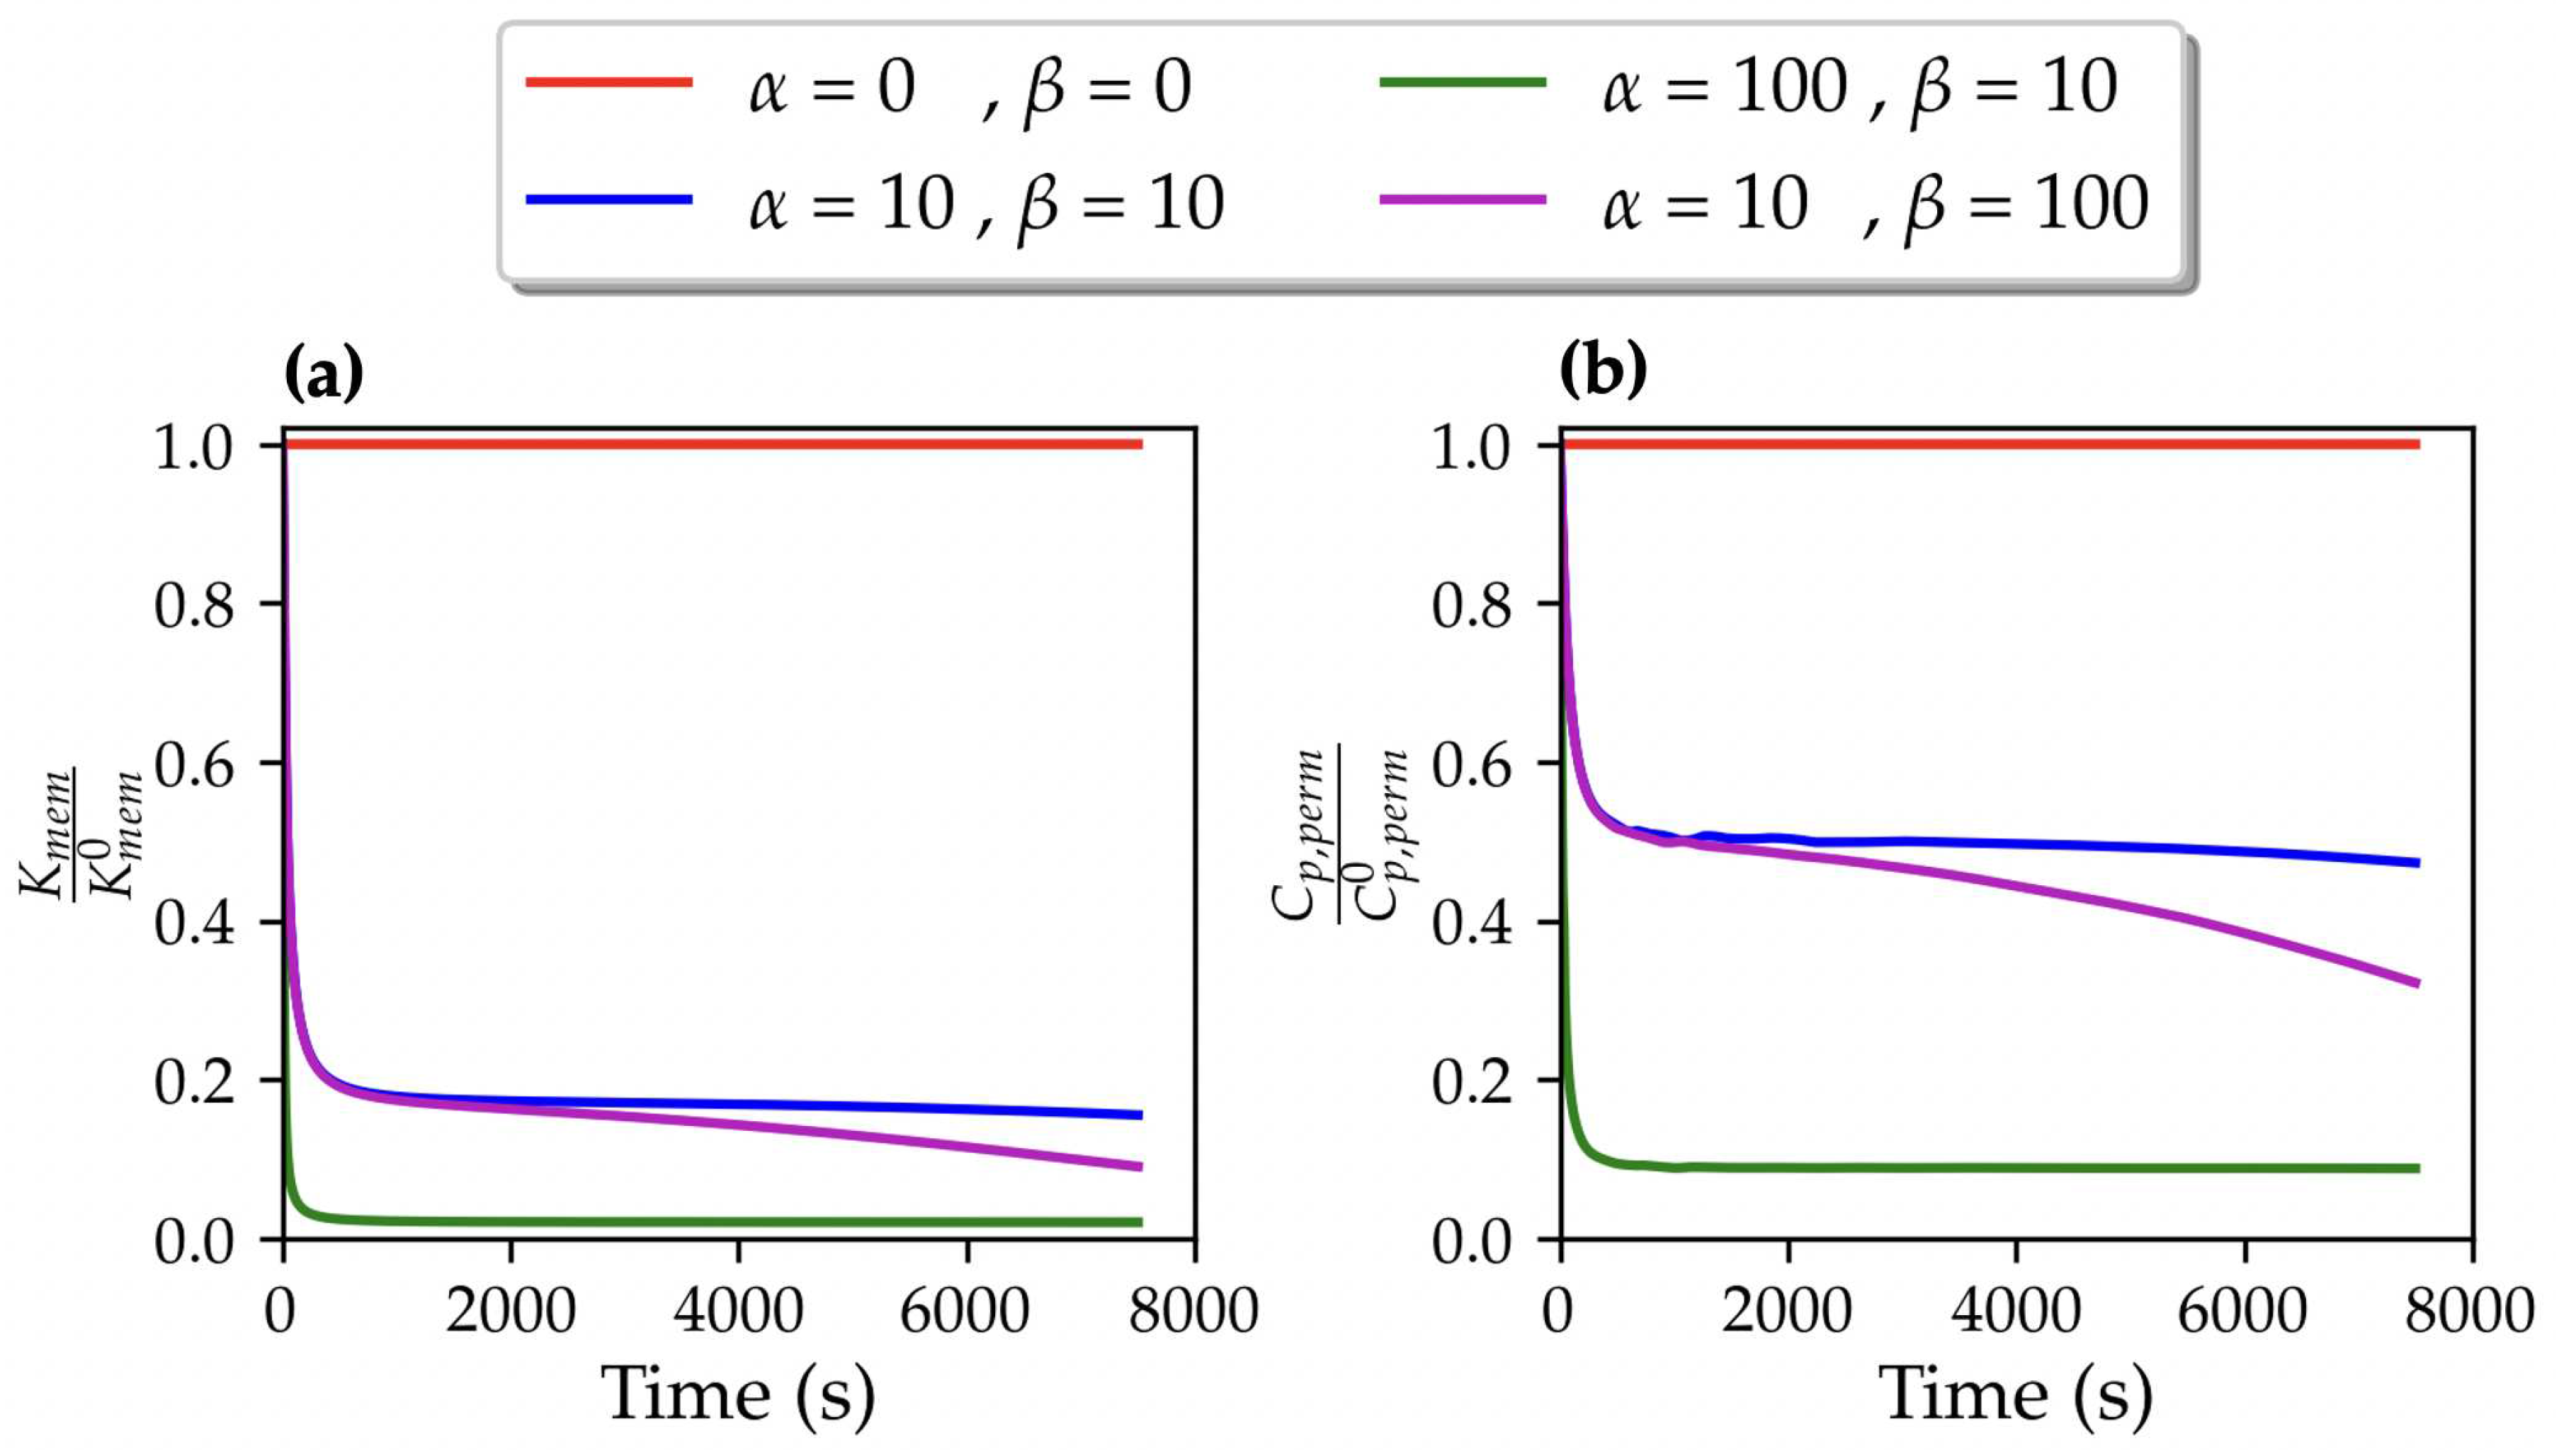
Figure 8.
Variation of permeate concentration over time obtained from experiments and simulations using optimized and parameters for different inlet concentrations, e.g., 0.3, 0.1, and 0.05 g/L. The circles and lines highlight the experimental and simulation results, respectively.
Figure 8.
Variation of permeate concentration over time obtained from experiments and simulations using optimized and parameters for different inlet concentrations, e.g., 0.3, 0.1, and 0.05 g/L. The circles and lines highlight the experimental and simulation results, respectively.
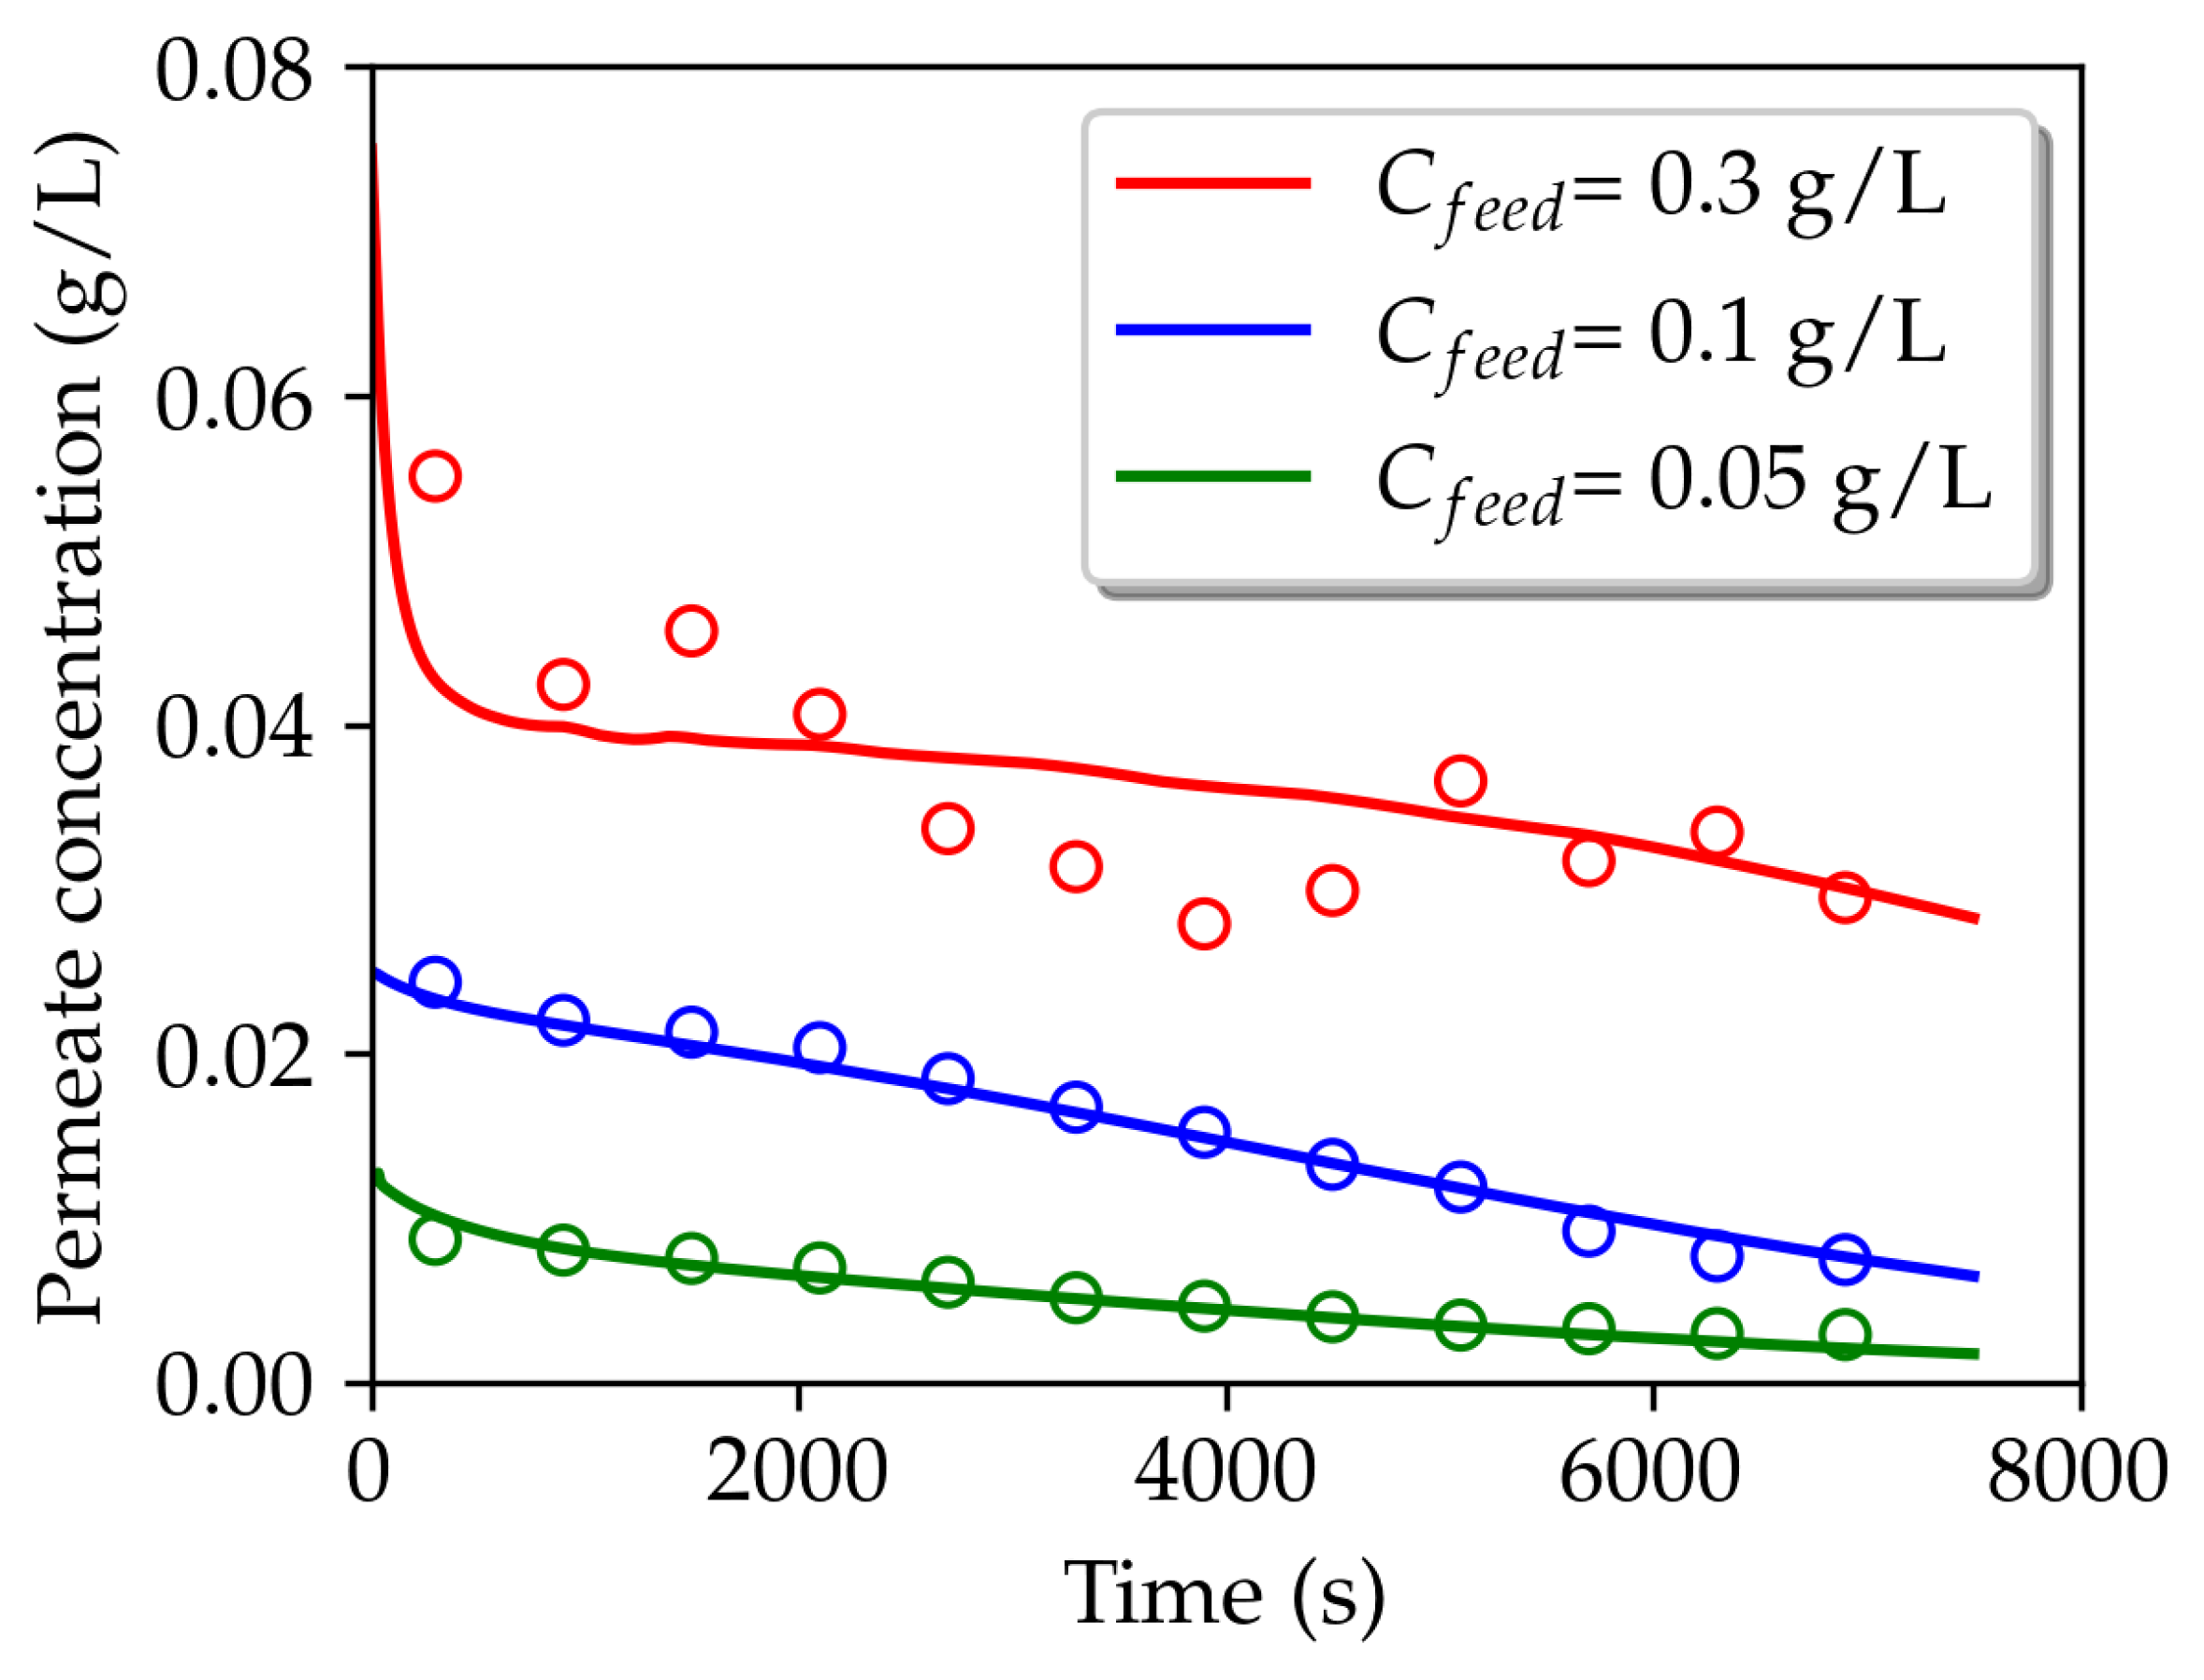

Table 1.
Model parameters.
| System parameters | Value | |
|---|---|---|
| Membrane properties | (mm) | 0.75 |
| (cm) | 33.7 | |
| 20 | ||
| Operating conditions | (mL/min) | 343 |
| (mL/min) | 5 | |
| (m/s) | 0.65 | |
| (m/s) | 5.5×10 | |
| Solute and Solvent properties | (g/L) | 0.3 |
| (Pa·s) | 2 × 10 | |
| (kg/m) | 789 | |
| Resistance parameters | ||
| (s g/L) | 1000 | |
| (s g/L) | ||
| (s) | 2825 | |
Table 2.
Comparison of the total permeate concentration obtained from the simulations and experiments.
Table 2.
Comparison of the total permeate concentration obtained from the simulations and experiments.
| (g/L) | Total permeate concentration (g/L) | |||
|---|---|---|---|---|
| Simulation | Experiment [20] | |||
| 0.05 | 6 | 400 | 0.0050 | 0.0053 |
| 0.1 | 1 | 250 | 0.0151 | 0.0156 |
| 0.3 | 9 | 70 | 0.0363 | 0.0360 |
Disclaimer/Publisher’s Note: The statements, opinions and data contained in all publications are solely those of the individual author(s) and contributor(s) and not of MDPI and/or the editor(s). MDPI and/or the editor(s) disclaim responsibility for any injury to people or property resulting from any ideas, methods, instructions or products referred to in the content. |
© 2023 by the authors. Licensee MDPI, Basel, Switzerland. This article is an open access article distributed under the terms and conditions of the Creative Commons Attribution (CC BY) license (http://creativecommons.org/licenses/by/4.0/).
Copyright: This open access article is published under a Creative Commons CC BY 4.0 license, which permit the free download, distribution, and reuse, provided that the author and preprint are cited in any reuse.


