
Submitted:
11 September 2023
Posted:
13 September 2023
You are already at the latest version
Abstract
The quasi-beta processing was considered as a promising processing technology to obtain a component with an excellent mechanical properties. To achieve an optimized quasi-beta processing parameter of TC21 alloy, the hot deformation behavior in near β phase region for the alloy with a forged structure was investigated by the thermal compression test and finite element (FEM) simulation. The obtained results indicated that the flow behavior of the samples was significantly influenced by the hot deformation parameters and it exhibited a flow hardening behavior at the start stage of deformation. Based on the experimental data, the constitutive equation and processing maps were obtained. The optimum hot processing parameters was 986℃/10^-3s^-1. Based on the FEM simulation results, the evolution of temperature field, strain field and stress field in the deformed samples at different strains exhibited a similar trend in the unstable region, which distributed symmetrically along the center line of the samples, and the center area of the samples was the highest and the center area of the section was the lowest.
Keywords:
TC21 alloy
; Hot compression
; FEM simulation
; Flow behavior
; Processing map
1. Introduction
TC21 alloys with excellent strength, fracture toughness, high damage tolerance and low crack growth rate have been widely applied to manufacture the key components in the engine and airframe of aircraft [1-4]. The components of TC21 alloy were usually processed by hot working technology [5-7]. The mechanical property of the parts is depended on the deformed microstructure during hot processing, which is mainly associated with hot deformation parameters. To achieve the parts with high performance, it is extremely critical to deeply comprehend the hot deformation characteristics of TC21 alloy so as to govern the final deformed microstructure of the alloy subjected to hot working.
Numerous studies have been reported to reveal the hot deformation characteristics of TC21 alloy [8-11]. Zhao et al. [8] reported the hot working characteristics of TC21 alloy with a cluster of α block structure in the α+β field. The results show that α block structure disappeared during hot deformation and two stable domains with peak efficiencies of power dissipation were obtained to be 880-900◦C/1-10 s−1 and 925-950◦C/0.32-10 s−1, respectively. This suggests that a high strain rate is beneficial to the hot working of TC21 alloy with a cluster of α block structure in the α+β region. Zhu et al. [5,9] investigated the hot deformation characteristics of as-cast TC21 alloy with lamellar α colonies in the β area, and found that two regions of peak efficiency were observed to be 1000◦C/0.01 s−1 and 1150◦C/0.01 s−1, respectively. The deformation mechanism is related to dynamic recrystallization of β phase. For the TC21 alloy with a bimodal microstructure, the optimal processing domain is in temperature of 880-900◦C /0.001-0.03 s−1, which reveals that a low strain rate is advantageous to the hot processing of the alloy [10]. For the TC21 alloy with a widmanstätten structure, Wang et al. [11] found that lamellar α was crushed into the short bar-like α phase during hot working in the α+β field. These results show that the differences in the initial microstructure and processing region can result in a significant difference in the optimal processing region and microstructure evolution.
Recently, Shi et al. [12] found that three state microstructures composed of equiaxed α phase, lamellar α phase and transformed β matrix can be obtained for TC21 alloy forged by quasi-β forging method (Tβ+10-30oC), which could give rise to a more excellent mechanical properties compared with that of TC21 alloy forged by α+β/β forging method. However, there is no information on the hot deformation characteristics and microstructure evolution of TC21 alloy forged during quasi-β forging (Tβ+10-30oC). To obtain an optimized quasi-beta processing parameter and govern the final microstructure of TC21 alloy after quasi-β forging, TC21 alloy with equiaxed α structure was hot-compressed in range of 966-986oC and 0.001-10 s-1 in this work, and the optimization processing parameters of the alloy during quasi-β forging was achieved by FEM method and experimental investigation.
2. Materials and experimental procedures
The samples used in this study was a forged TC21 alloy with a diameter of 80 mm and the temperature of β→α+β was determined to be 961℃ based on the optical metallography [13]. The chemical composition of TC21 alloy is depicted in Table 1. The microstructure of the as-received samples consisted of equiaxed α, lamellar α and retained β phase, as exhibited in Figure 1.
The samples for the hot compression were processed from the forged bars, and the size of the sample was ø8 mm×12 mm. Gleeble-3500 thermo-mechanical simulator was used to operate the isothermal compression tests. For purpose of addressing the flow behavior and microstructure evolution of TC21 alloy after quasi-β forging, three deformation temperatures of 966℃, 976℃ and 986℃ were adapted and the strain rate was set as 0.001s-1-10 s-1. The true stain was set as 1.2. The samples were heated to a designed temperature, and held 5 minutes to keep the temperature homogeneous before hot compression. All deformed samples were rapidly water-cold after hot deformation to keep the microstructure under high temperature. The sketch diagram of hot deformation tests is demonstrated in Figure 2.
All the experiment samples were sectioned parallel to the compression axis to observe the microstructure on optical microscope (OM). For optical examination, the samples were grinded, mechanically polished and chemically etched with a Kroll reagent, whose ingredient is 5 (vol.%) HF+25 (vol.%) HNO3+70 (vol.%) H2O. Based on the results obtained from the experiment, the temperature, strain and stress field of TC21 alloy with a forged microstructure deformed at different processing parameters were simulated by FEM method.
3. Results and discussion
3.1. True stress-strain curves
The true stress-strain curves gained from the hot compression tests of a forged TC21 alloy are exhibited in Figure 3. It can be found that the curves exhibited a flow hardening behavior, and the flow stress increased with the increase of strain. At a given deformation temperature, higher strain rates can lead to a higher flow stress. It is noted that when the strain rate was 1s-1, the flow stress exhibited a small decrease at the beginning of the flow curve. This phenomenon can be explained by the dynamic theory [14], which suggests that the mobile dislocations rapidly formed from grain boundary sources at the beginning of hot deformation can quickly move from the grain boundary to the interior of the grain, and then result in a decrease in the flow stress [14,15].
3.2. Constitutive parameters
There are a lot of literature indicated that the working parameters can significantly affect the hot working behavior of the alloys [16-18]. Figure 4 and Figure 5 showed the dependence of the peak stress on hot working parameters for the forged TC21 alloy, respectively. It is obvious that the increasing peak stress was observed with the augment of the strain rate and the reduce of the temperature.
Owing to the Arrhenius type equation can primarily predict the constitutive behavior of most alloys in the hot deformation processing, we used it to construct the relationship between hot processing parameters and flow stress [19]. The mathematical expression is as follows [20]:
Where is the peak stress, A and α are material constants, n is the stress exponent, Q is the activation energy, R is the universal gas constant, is the strain rate, and T is the deformation temperature in Kelvin.
Logarithm of both sides of Eq. (1), we can express:
The values of α, A, n and Q were calculated according to Ref. [21]. The value of α was evaluated from the minimum residual sum of squares to be 0.01875MPa-1. The values of A, n and Q were stemmed from the peak stress to be 1.13×10¹¹ s-1, 2.11 and 281.8 kJ/mol, respectively.
Therefore, the Eq. (1) can be expressed as:
To determine the model, a figure of ln(Z) was obtained versus ln(sinh(ασp)) (Figure 6). It can be observed that the peak stress raised with the increase of the Z parameter (Zener-Hollomon) and they appeared a good linear relationship. Therefore, the established constitutive equation was valid for the forged samples.
3.3. Processing maps
Processing map is an efficient method to reveal the mechanism of hot deformation and optimize the parameters of hot processing, which was composed of the superposition of energy dissipation diagram and instability diagram [22,23]. The power dissipation efficiency (η) changes with changing the hot processing parameters, and it can be described as follows [24,25]:
where m is the strain-rate sensitivity index. Instability diagram consists of the instability criterion (ξ), which can be defined by Eq. (5) [26]:
when the ξ is negative, the flow instabilities most commonly take place as localizations in the flow curve. Based on the principles of dynamics materials model (DMM) [27,28], the processing maps were proposed at different strains to obtain the optimum hot compression parameters for the samples with a forged structure, as shown in Figure 7. The red shaded regions represented the instability regions and the contour number indicated the efficiency of power dissipation.
When the strain rate was higher than about 0.5s-1 and the temperatures range was 966-987℃, it can observe the flow instability phenomenon at the strain of 0.2. The domain with a peak value of η took place in the region of 966-979℃ and 6.59×10⁻²-10-3s-1, and the peak value of η was about 0.54. With the increase of strain from 0.2 to 0.8, the area of flow instability expanded and the region with peak efficiency of power dissipation changed, which gradually moved to the domain with a high temperature and low strain rate. On the basis of above analysis, it can draw a conclusion that the optimum hot processing parameters was 986℃/10-3s-1.
3.4. Microstructure after hot deformation
In order to determine the deformation mechanism of the forged TC21 alloy at different hot deformation conditions, the microstructures after hot compression were characterized, as exhibited in Figure 8. At the strain rate of 1s-1, the grains were obviously elongated along the radial direction and the grain size increased with rising the temperature. It was also found that there were some fine recrystallized grains of β phase along the strip grains, indicating that the dynamics recrystallization was occurred for the β phase grains. At the deformation temperature of 966℃, a full dynamic recrystallization took place in the deformed alloys at the strain rate of 0.01 s-1 and the grains were significantly refined. With increasing the temperature from 966 to 986℃ with a strain rate of 0.001s-1, the recrystallized grains were obviously coarsened due to a high recrystallization drive at high deformed temperature and sufficient deformation time.
3.5. Finite element simulation of the samples deformed at different parameters
In order to deeply understand the evolution of temperature field and strain field of TC21 alloy in hot compression processing, this study used the Deform-3D finite element simulation software to simulate the hot compression process of forged TC21 alloy. The cylindrical model was built by the SolidWorks software and the size of the model is the same as the size of the experimental samples. Then the model was imported into the Deform-3D software and was divided into 32000 grids. The work-piece was set as a plastic body and the dies were set as rigid body because the elastic deformation was usually ignored during the plastic deformation of the work-piece at high temperature [29,30]. During the simulation, the top die moved along the central axis of the cylindrical samples and the lower die does not move. To ensure the precision of the FE simulation, the temperature of the work-piece was set as the temperature the same as the experimental temperature. Moreover, the shear friction factor between the cylindrical work-piece and the tools was set as 0.3, and the heat transfer coefficient was set to be 5 N/S/mm/℃. To analyze the evolution in temperature and strain of the entire samples, the three positions shown in Figure 9 were selected for analysis.
3.5.1. Temperature field simulation
The optimal hot working parameters and unstable hot deformation parameters of TC21 alloy were obtained from the hot processing maps, which were 986℃/0.001s-1 and 976℃/10s-1, respectively. In order to study the evolution of temperature field of the samples during hot compression in stable and unstable region, the simulation of temperature field in stable and unstable region was illustrated in Figure 10 and Figure 11.
It can be found that the temperature of the sample dropped at first and then rose slightly at the deformation condition of 986℃/0.001s-1. This is associated with a fact that the heat exchange occurs between the mold and the deformed sample, which results in a decrease in the temperature of the deformed samples at the initial stage of deformation. The temperature evolution situation of the three positions was similar, and the temperature difference was not large, which was not more than 30℃. With increasing the true strain, the temperature of the sample increased slightly and the temperature difference decreased gradually. This is mainly attribute to the strain rate was low, resulting in sufficient heat transfer, good thermal diffusivity, stable microstructure after compression and uniform overall performance of the sample.
When the deformation condition was 976℃/10s-1, the temperature at P1 (easily deformation region) and P3 (intermediate deformation region) rose rapidly with the progress of compression, and the temperature at P2 (difficult deformation region) was almost constant. Moreover, at the end of compression, the temperature at P1 was the highest and the temperature at P2 was the lowest. With increasing the strain, the temperature of P2 was almost constant, but the temperature at P1 was obviously increased, and the temperature difference became larger. This is mainly because the strain rate was too large and the equivalent strain rate in different regions of the samples was different, the instability phenomenon occurred, which made the internal homogeneity of the samples was poor during compression.
3.5.2. Effective strain field simulation
Figure 12 exhibits the simulation results of the effective strain field under thermal deformation condition of 986℃/0.001s-1, it can be seen that the effective strain of the samples did not change during the whole compression process under any strain condition. It can be considered that the strain rate was too low, so the sample obtained stable structure and good homogeneity after compression. Figure 13 depicts an effective strain field simulation of thermal compression at 976℃/10s-1. It was clear that with the progress of compression, the effective strain at three positions was significantly increased, and P1>P3>P2, which corresponded to the deformation degree of each region. Besides, with the increase of strain, the effective strain increased.
3.5.3. Effective strain rate field simulation
When the thermal deformation condition is 986℃/0.001s-1, the effective strain rate field of hot compression was simulated as shown in Figure 14, it can be seen that with the progress of compression, the effective strain rate rose rapidly firstly, and then slowly rose, which may be due to softening behavior. The effective strain rate was P1>P3>P2 after compression. With the increase of strain, the effective strain rate also increased, and the difference of the effective strain rate at the three positions was always within 0.0009s-1, which indicates that the flow inside the sample was uniform. And the effective strain rate of each part was also uniform.
Figure 15 was a simulation of the effective strain rate field when the hot compression condition was 976℃/10s-1, it can draw a conclusion that the effective strain rate of P1 rose rapidly at first and then slowly, P2 tended to be gentle after the rapid increase, and P3 decreased slightly after the rapid increase to the peak. It remained P1>P3>P2 after the end of compression. With increasing the strain, the effective strain rate increased gradually. When the strain reached 0.8, the effective strain rate of P2 increased suddenly after becoming stable, but it was still lower than P3 and P1, this may because the strain was too large, affecting the stability of the samples.
3.5.4. Effective stress field simulation
Figure 16 was the simulation of thermal compression effective stress field under deformation condition of 986℃/0.001s-1. It can be found that the evolution of effective stress of the sample was similar to the evolution of effective strain rate: slowly rose after rapidly rose, and P1>P3>P2 after compression. With the increase of strain, the effective stress increased slightly, and the difference of the effective stress between the easily deformation region and the hard deformation region is not large, indicating that the samples had good stability and uniform flow during compression under this deformation condition.
For the effective stress field simulation with deformation condition of 976℃/10s-1, as shown in Figure 17, the effective stress in each region increased rapidly and then tended to be gentle or slightly decreased, which may be due to the fact that as the compression progressed to a certain degree, the softening behavior appeared in the sample, and the softening effective was equivalent to the hardening effective, reaching the dynamic equilibrium. With increasing the strain, the effective stress of easily deformation region and intermediate deformation region decreased slightly, but the effective stress of difficult deformation region increased. Moreover, the effective stress of P2 started to rise after it became flat. This may because the strain rate was too large, resulting in a short deformation time, and the deformation of the difficult deformation region was not obvious, which results in a larger deformation resistance, so its effective stress increased.
4. Conclusions
By using the optical microscope and FE simulation method, the hot deformation behavior in near β phase region of forged TC21 alloy has been studied in this work. The main conclusions are as follows:
(1) The flow behavior of TC21 alloy is significantly affected by the hot deformation parameters. The flow curves of the samples exhibited a flow hardening behavior. With the increase of strain, the flow stress increased.
(2) Based on the flow curves and Arrhenius type equation, the constitutive equation of TC21 alloy with a forged structure was constructed as follows:
The processing maps at different strains were established on the basis of dynamics materials model. A region with peak efficiency of power dissipation was presented in processing map, and the optimum hot working parameters were obtained to be 986℃/10-3s-1.
(4) In term of the flow curves gained from hot compression tests and the hot processing maps of TC21 alloy with a forged structure, the isothermal forging processing of the samples was simulated by the Deform-3D software. In the unstable region, the evolution of temperature field, strain field and stress field in the deformed samples at different strains exhibited a similar trend: distributed symmetrically along the center line of the samples, and the center area of the samples was the highest and the center area of the section was the lowest.
Acknowledgments
This work was supported by the The Science and Technology Projects of Guizhou Province (Grant Nos. [2021]310, YQK[2023]009 and [2022]050).
References
- Shao, H.; Shan, D.; Zhao, Y.Q.; Ge, P.; Zeng, W.D. Accordance between fracture toughness and strength difference in TC21 alloy with equiaxed microstructure. Mater. Sci. Eng. A 2016, 664, 10–16. [Google Scholar] [CrossRef]
- Tan, C.S.; Sun, Q.Y.; Zhang, G.J.; Zhao, Y.Q. Remarkable increase in high-cycle fatigue resistance in a titanium alloy with a fully lamellar microstructure. Int. J. Fatig. 2020, 138, 105724. [Google Scholar] [CrossRef]
- Elshaer, R.N.; Ibrahim, K.M. Effect of cold deformation and heat treatment on microstructure and mechanical properties of TC21 Ti alloy. Trans. Nonferr. Metal. Soc. China 2020, 30, 1290–1299. [Google Scholar] [CrossRef]
- Wang, Y.S.; Yang, G.; Zhang, S.N.; Xiu, S.C. Effect of crystal orientation on micro-stress distribution in a damage-tolerant titanium alloy TC21. J. Alloy. Compd. 2022, 924, 166637. [Google Scholar] [CrossRef]
- Zhu, Y.C.; Zeng, W.D.; Feng, F.; Sun, Y.; Han, Y.F.; Zhou, Y.G. Characterization of hot deformation behavior of as-cast TC21 alloy using processing map. Mater. Sci. Eng. A 2011, 528, 1757–1763. [Google Scholar] [CrossRef]
- Wang, K.; Wu, M.Y.; Yan, Z.B.; Li, D.R.; Xin, R.L.; Liu, Q. Dynamic restoration and deformation heterogeneity during hot deformation of a duplex-structure TC21 alloy. Mater. Sci. Eng. A 2018, 712, 440–452. [Google Scholar] [CrossRef]
- Wang, K.; Wu, M.Y.; Ren, Z.; Zhang, Y.; Xin, R.L.; Liu, Q. Static globularization and grain morphology evolution of α and β phases during annealing of hot-rolled TC21 alloy. Trans. Nonferr. Metal. Soc. China. 2021, 31, 2664–2676. [Google Scholar] [CrossRef]
- Zhao, Y.L.; Li, B.L.; Zhu, Z.S.; Nie, Z.R. The high temperature deformation behavior and microstructure of TC21 alloy. Mater. Sci. Eng. A 2010, 527, 5360–5367. [Google Scholar] [CrossRef]
- Zhu, Y.C.; Zeng, W.D.; Liu, J.L.; Zhao, Y.Q.; Zhou, Y.G.; Yu, H.Q. Effect of processing parameters on the hot deformation behavior of as-cast TC21 alloy. Mater. Des. 2012, 33, 264–272. [Google Scholar] [CrossRef]
- Wang, Y.S.; Xiu, S.C.; Zhang, S.N.; Jiang, C.Y. Effect of grinding parameters on microstructure evolution of TC21 alloy with bimodal starting microstructure. J. Alloy. Compd. 2020, 831, 154882. [Google Scholar] [CrossRef]
- Zheng, X.Y.; Wang, K.; Zhang, C.; Xin, R.L.; Liu, Q. Evolution mechanism of lamellar α and interlayered β during hot compression of TC21 alloy with a widmanstätten structure. Chinese J. Aeronaut. 2022, 35, 475–483. [Google Scholar] [CrossRef]
- Shi, Z.F.; Guo, H.Z.; Liu, R.; Wang, X.C.; Yao, Z.K. Microstructure and mechanical properties of TC21 alloy by near-isothermal forging. Trans. Nonferr. Metal. Soc. China 2015, 25, 72–79. [Google Scholar] [CrossRef]
- Li, H.H.; Wang, K.; Xin, L.P.; Xin, R.L.; Liu, Q. Effect of hot rolling and annealing on phase component, recrystallization, and mechanical properties of TC21 alloy. J. Mater. Eng. Perform. 2022, 31, 2496–2508. [Google Scholar] [CrossRef]
- Philippart, I.; Rack, H.J. High temperature dynamic yielding in metastable Ti-6.8Mo- 4.5Fe-1.5Al alloy. Mater. Sci. Eng. A 1998, 243, 196–200. [Google Scholar] [CrossRef]
- Tan, Y.B.; Liu, W.C.; Yuan, H.; Liu, R.P.; Zhang, X.Y. On the phenomenon of stress drop during hot deformation of ZrTiAlV alloy. Metall. Mater. Trans. A 2013, 44, 5284–5288. [Google Scholar] [CrossRef]
- Wang, L.; Li, W.; Luan, S.Y.; Jin, P.P; Wang, J.H.; Ren, Q.L.; Zhu, L. Study on hot deformation behavior of as-cast Ti-5Al-5Mo-5V-1Cr-1Fe titanium alloy in (α+β) phase region. Mater. Today Commun. 2023, 35, 105797. [Google Scholar] [CrossRef]
- Tan, Y.B.; Ji, L.Y.; Duan, J.L.; Liu, W.C.; Zhang, J.W.; Liu, R.P. A Study on the Hot Deformation Behavior of 47Zr-45Ti-5Al-3V Alloy with Initial Lamellar α Structure. Metall. Mater. Trans. A 2016, 47, 5974–5984. [Google Scholar] [CrossRef]
- Niu, Y.X.; Hou, J.; Ning, F.K.; Chen, X.R.; Jia, Y.H.; Le, Q.C. Hot deformation behavior and processing man of Mg-2Zn-1Al-0.2RE alloy. J. Rare Earth. 2020, 38, 665–675. [Google Scholar] [CrossRef]
- Liu, J.J.; Wang, K.L.; Lu, S.Q.; Gao, X.Y.; Li, X.; Zhou, F. Hot deformation behavior and processing map of Zr-4 alloy. J. Nucl. Mater. 2020, 531, 151993. [Google Scholar] [CrossRef]
- Lu, H.T.; Li, D.Z.; Li, S.Y.; Chen, Y.A. Hot deformation behavior of Fe-27.34Mn-8.63Al-1.03C lightweight steel. International Journal of Minerals Metall. Mater. 2023, 30, 734–743. [Google Scholar] [CrossRef]
- Tan, Y.B.; Yang, L.H.; Duan, J.L.; Liu, W.C.; Zhang, J.W.; Liu, R.P. Effect of initial grain size on the hot deformation behavior of 47Zr-45Ti-5Al-3V alloy. J. Nucl. Mater. 2014, 454, 413–420. [Google Scholar] [CrossRef]
- Li, C.M.; Huang, L.; Zhao, M.J.; Guo, S.Q.; Li, J.J. Hot deformation behavior and mechanism of a new metastable β titanium alloy Ti-6Cr-5Mo-5V-4Al in single phase region. Mater. Sci. Eng. A 2021, 814, 141231. [Google Scholar] [CrossRef]
- Luo, J.; Ye, P.; Li, M.Q.; Liu, L.Y. Effect of the alpha grain size on the deformation behavior during isothermal compression of Ti-6Al-4V alloy. Mater. Des. 2015, 88, 32–40. [Google Scholar] [CrossRef]
- Ebrahimpourghandi, B.; Mahmudi, R. Hot deformation constitutive analysis and processing maps of the as-cast and wrought Mg-2.5Gd-0.5Zr alloy. J. Alloy. Compd. 2023, 942, 169132. [Google Scholar] [CrossRef]
- Liu, P.; Zhang, R.; Yuan, Y.; Cui, C.Y.; Zhou, Y.Z.; Sun, X.F. Hot deformation behavior and workability of a Ni-Co based superalloy. J. Alloy. Compd. 2020, 831, 154618. [Google Scholar] [CrossRef]
- Tan, Y.B.; Ma, Y.H.; Zhao, F. Hot deformation behavior and constitutive modeling of fine grained Inconel 718 superalloy. J. Alloy. Compd. 2018, 741, 85–96. [Google Scholar] [CrossRef]
- Jiang, H.T.; Tian, S.W.; Guo, W.Q.; Zhang, G.H.; Zeng, S.W. Hot deformation behavior and deformation mechanism of two TiAl-Mo alloys during hot compression. Mater. Sci. Eng. A 2018, 719, 104–111. [Google Scholar] [CrossRef]
- Liu, F.; Ma, J.M.; Peng, L.J.; Huang, G.J.; Zhang, W.J.; Xie, H.F.; Mi, X.J. Hot deformation behavior and microstructure evolution of Cu-Ni-Co-Si alloys. Mater. 2020, 13, 2042. [Google Scholar] [CrossRef]
- Wu, H.; Liu, M.X.; Wang, Y.; Huang, Z.Q.; Tan, G.; Yang, L. Experimental study and numerical simulation of dynamic recrystallization for a FGH96 superalloy during isothermal compression. J. Mater. Res. Technol. 2020, 9, 5090–5104. [Google Scholar] [CrossRef]
- Singh, G.; Souza, P.M. Hot deformation behavior of a novel alpha + beta titanium alloy TIMETAL®407. J. Alloy. Compd. 2023, 935, 167970. [Google Scholar] [CrossRef]
Figure 1.
Microstructure of the TC21 alloy with a forged microstructure.
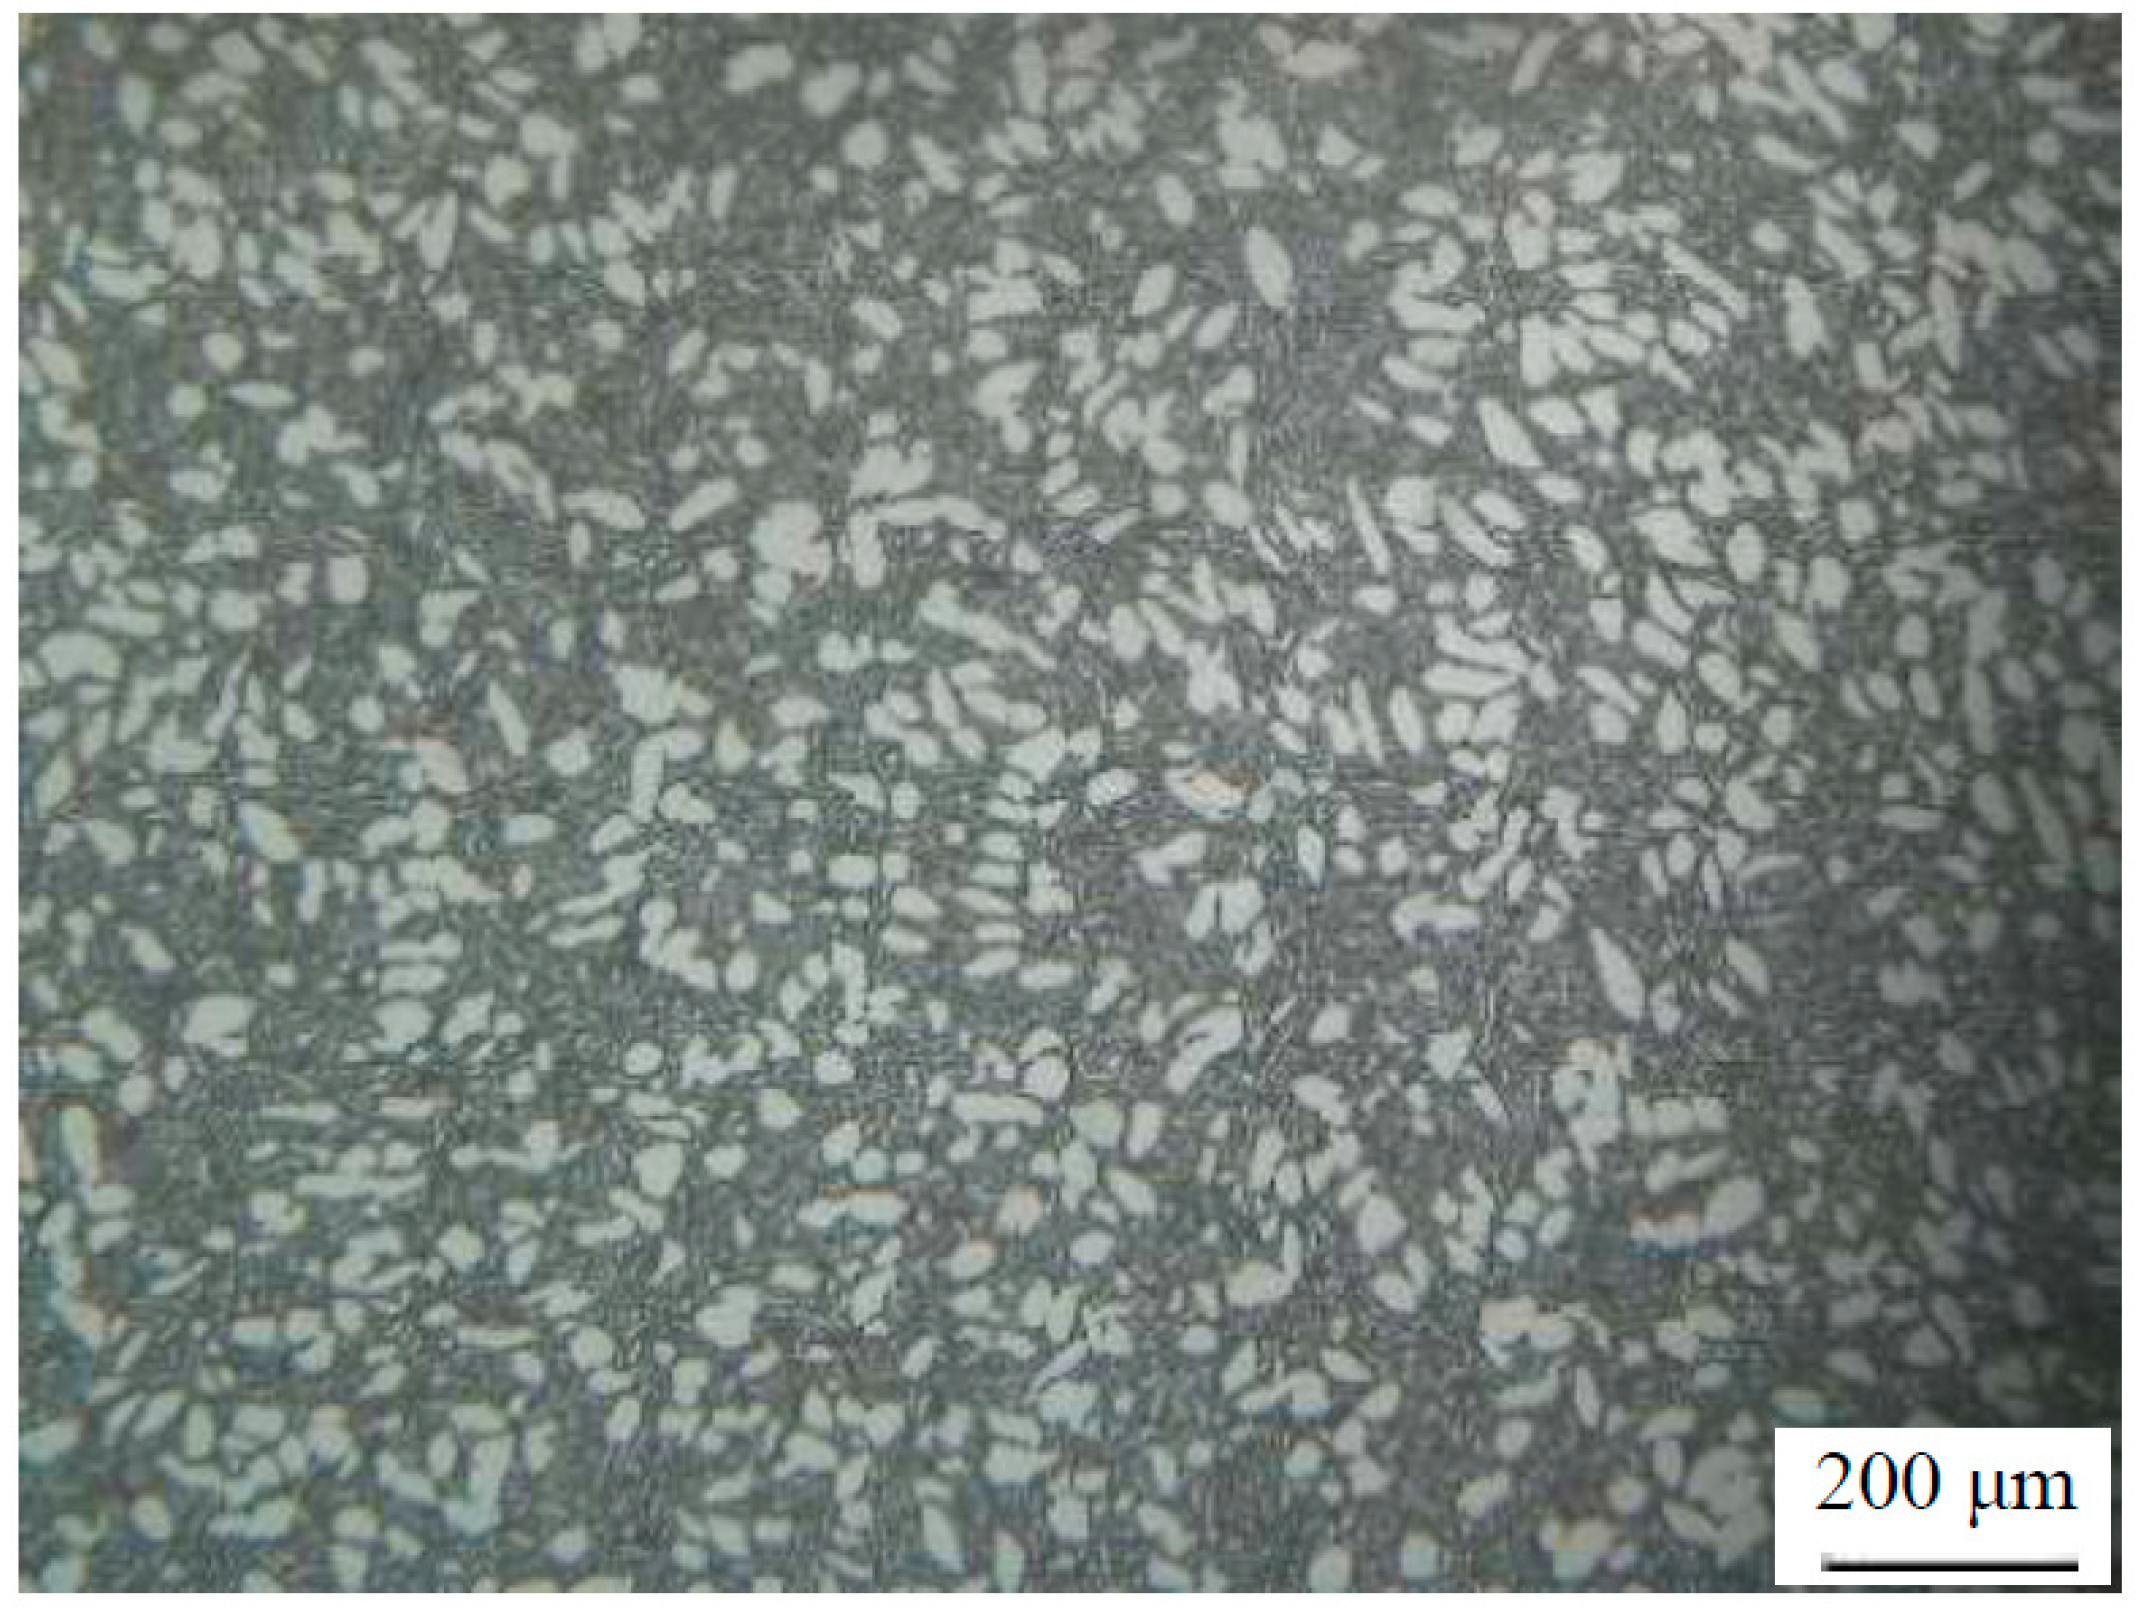
Figure 2.
Sketch diagram of hot deformation tests.
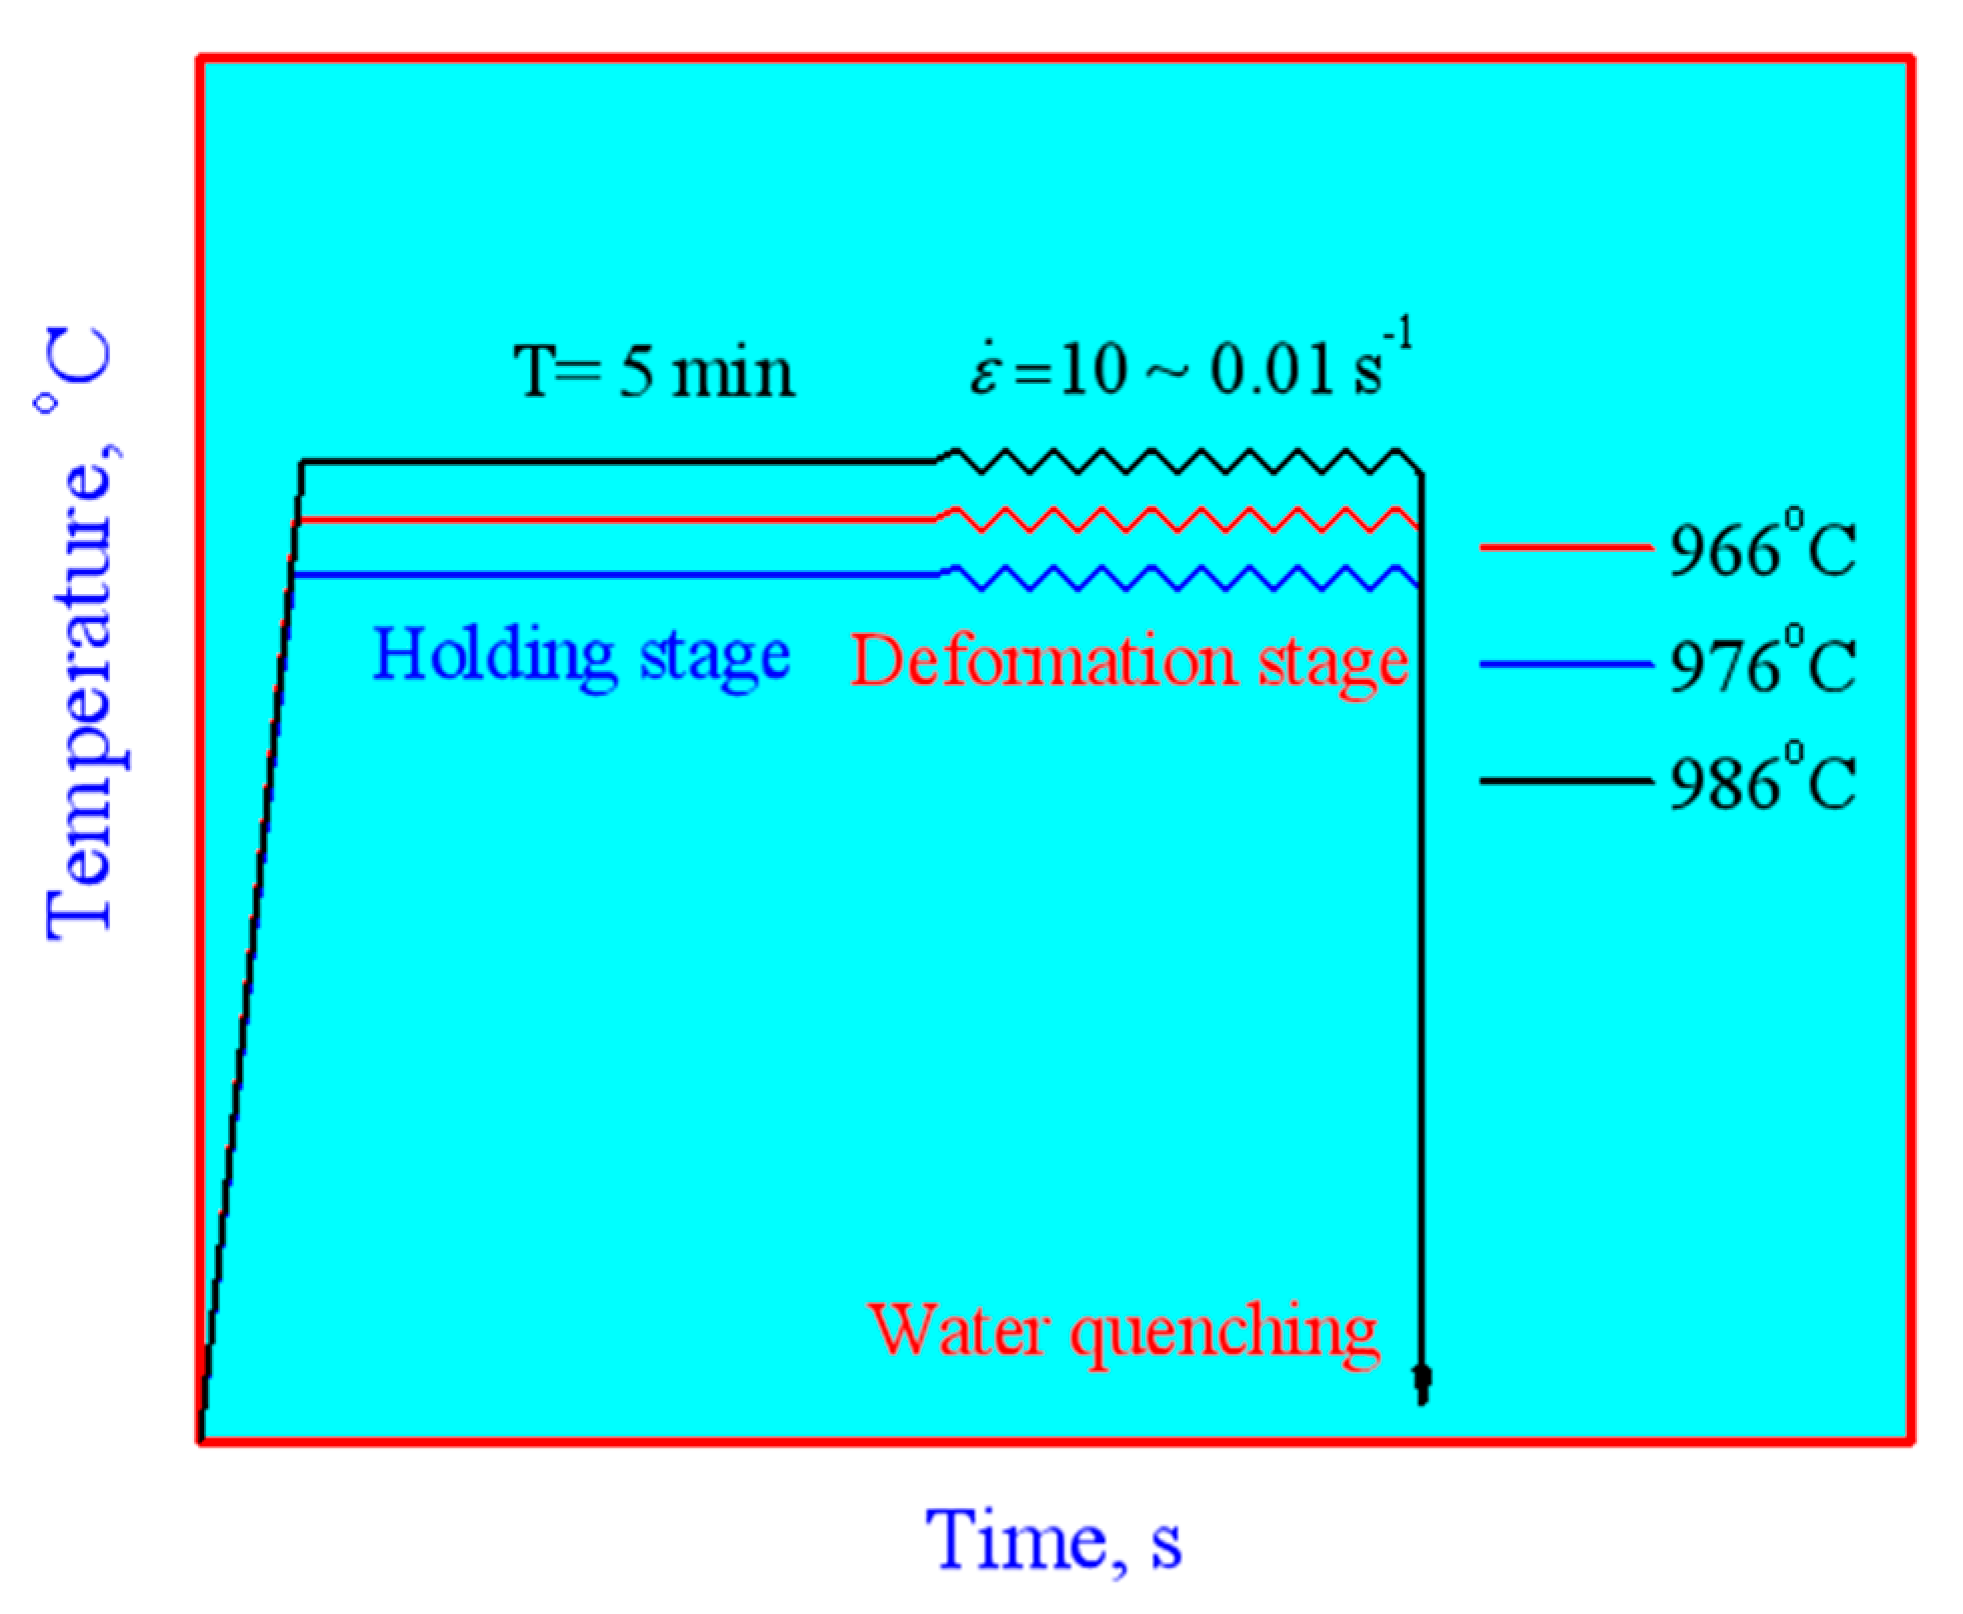
Figure 3.
True stress-strain curves for the samples at deformation temperatures of (a) 966℃, (b) 976℃ and (c) 986℃.
Figure 3.
True stress-strain curves for the samples at deformation temperatures of (a) 966℃, (b) 976℃ and (c) 986℃.
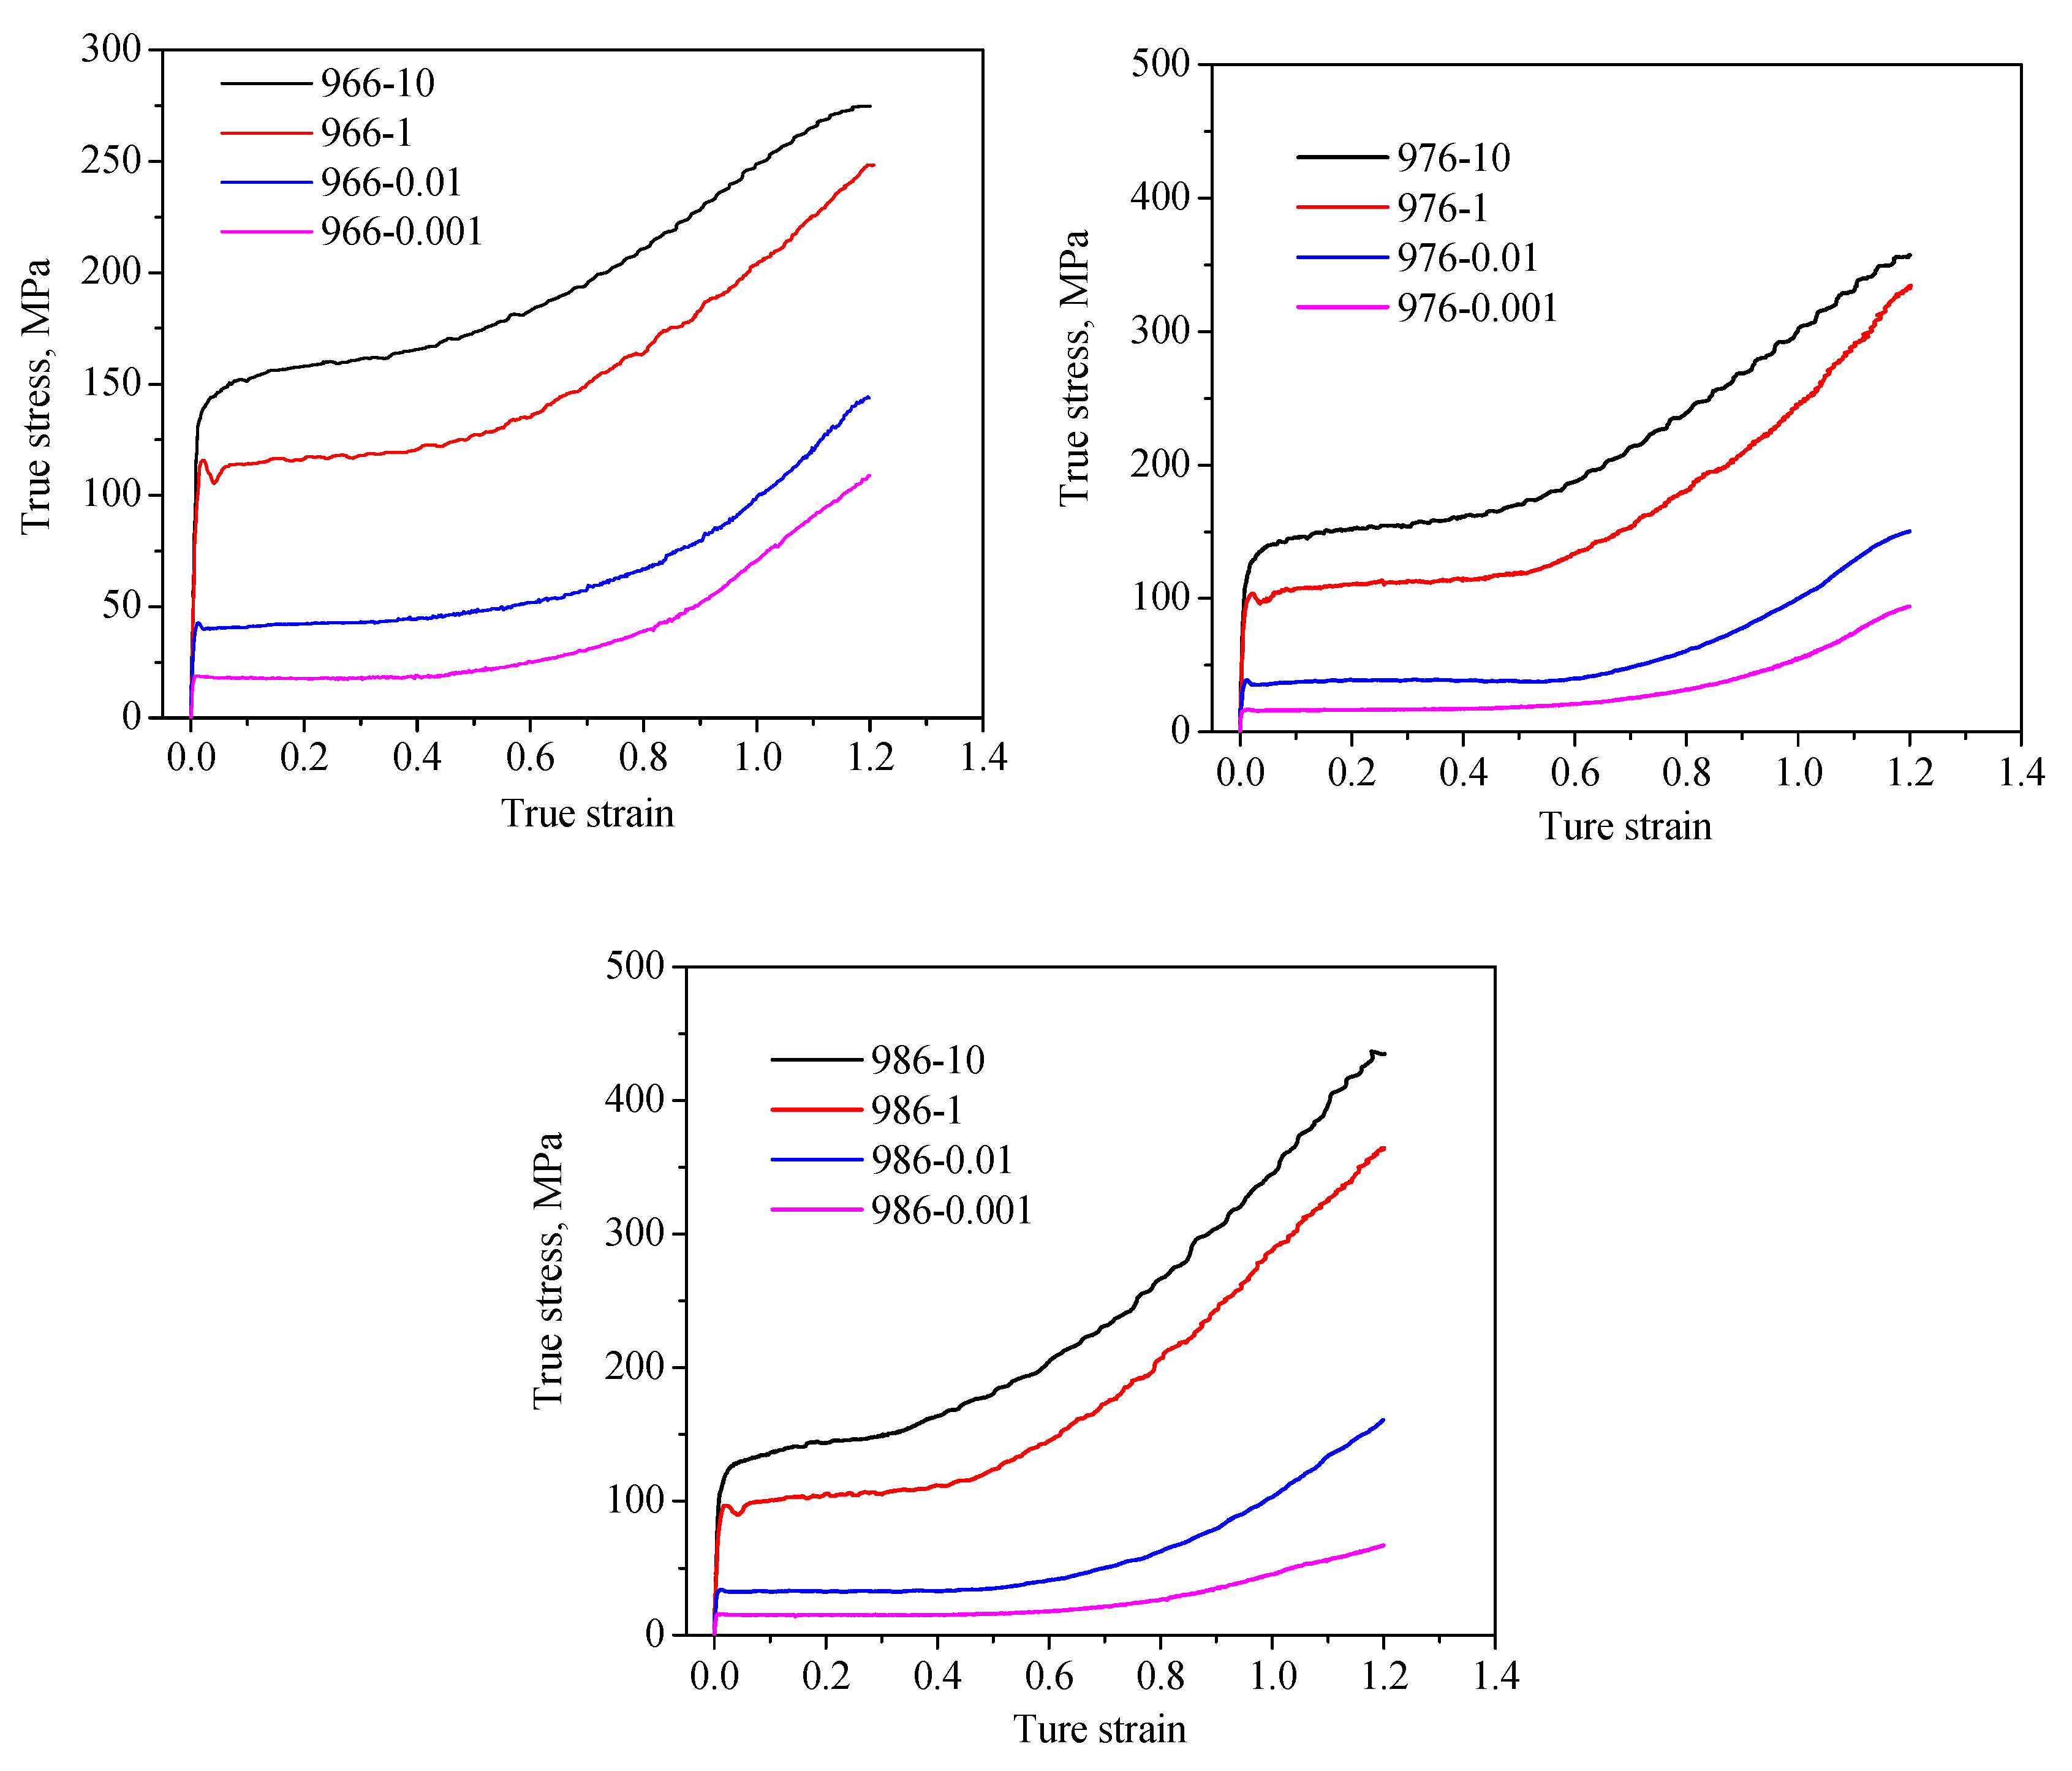
Figure 4.
Relationship between the peak-stress and strain rate.
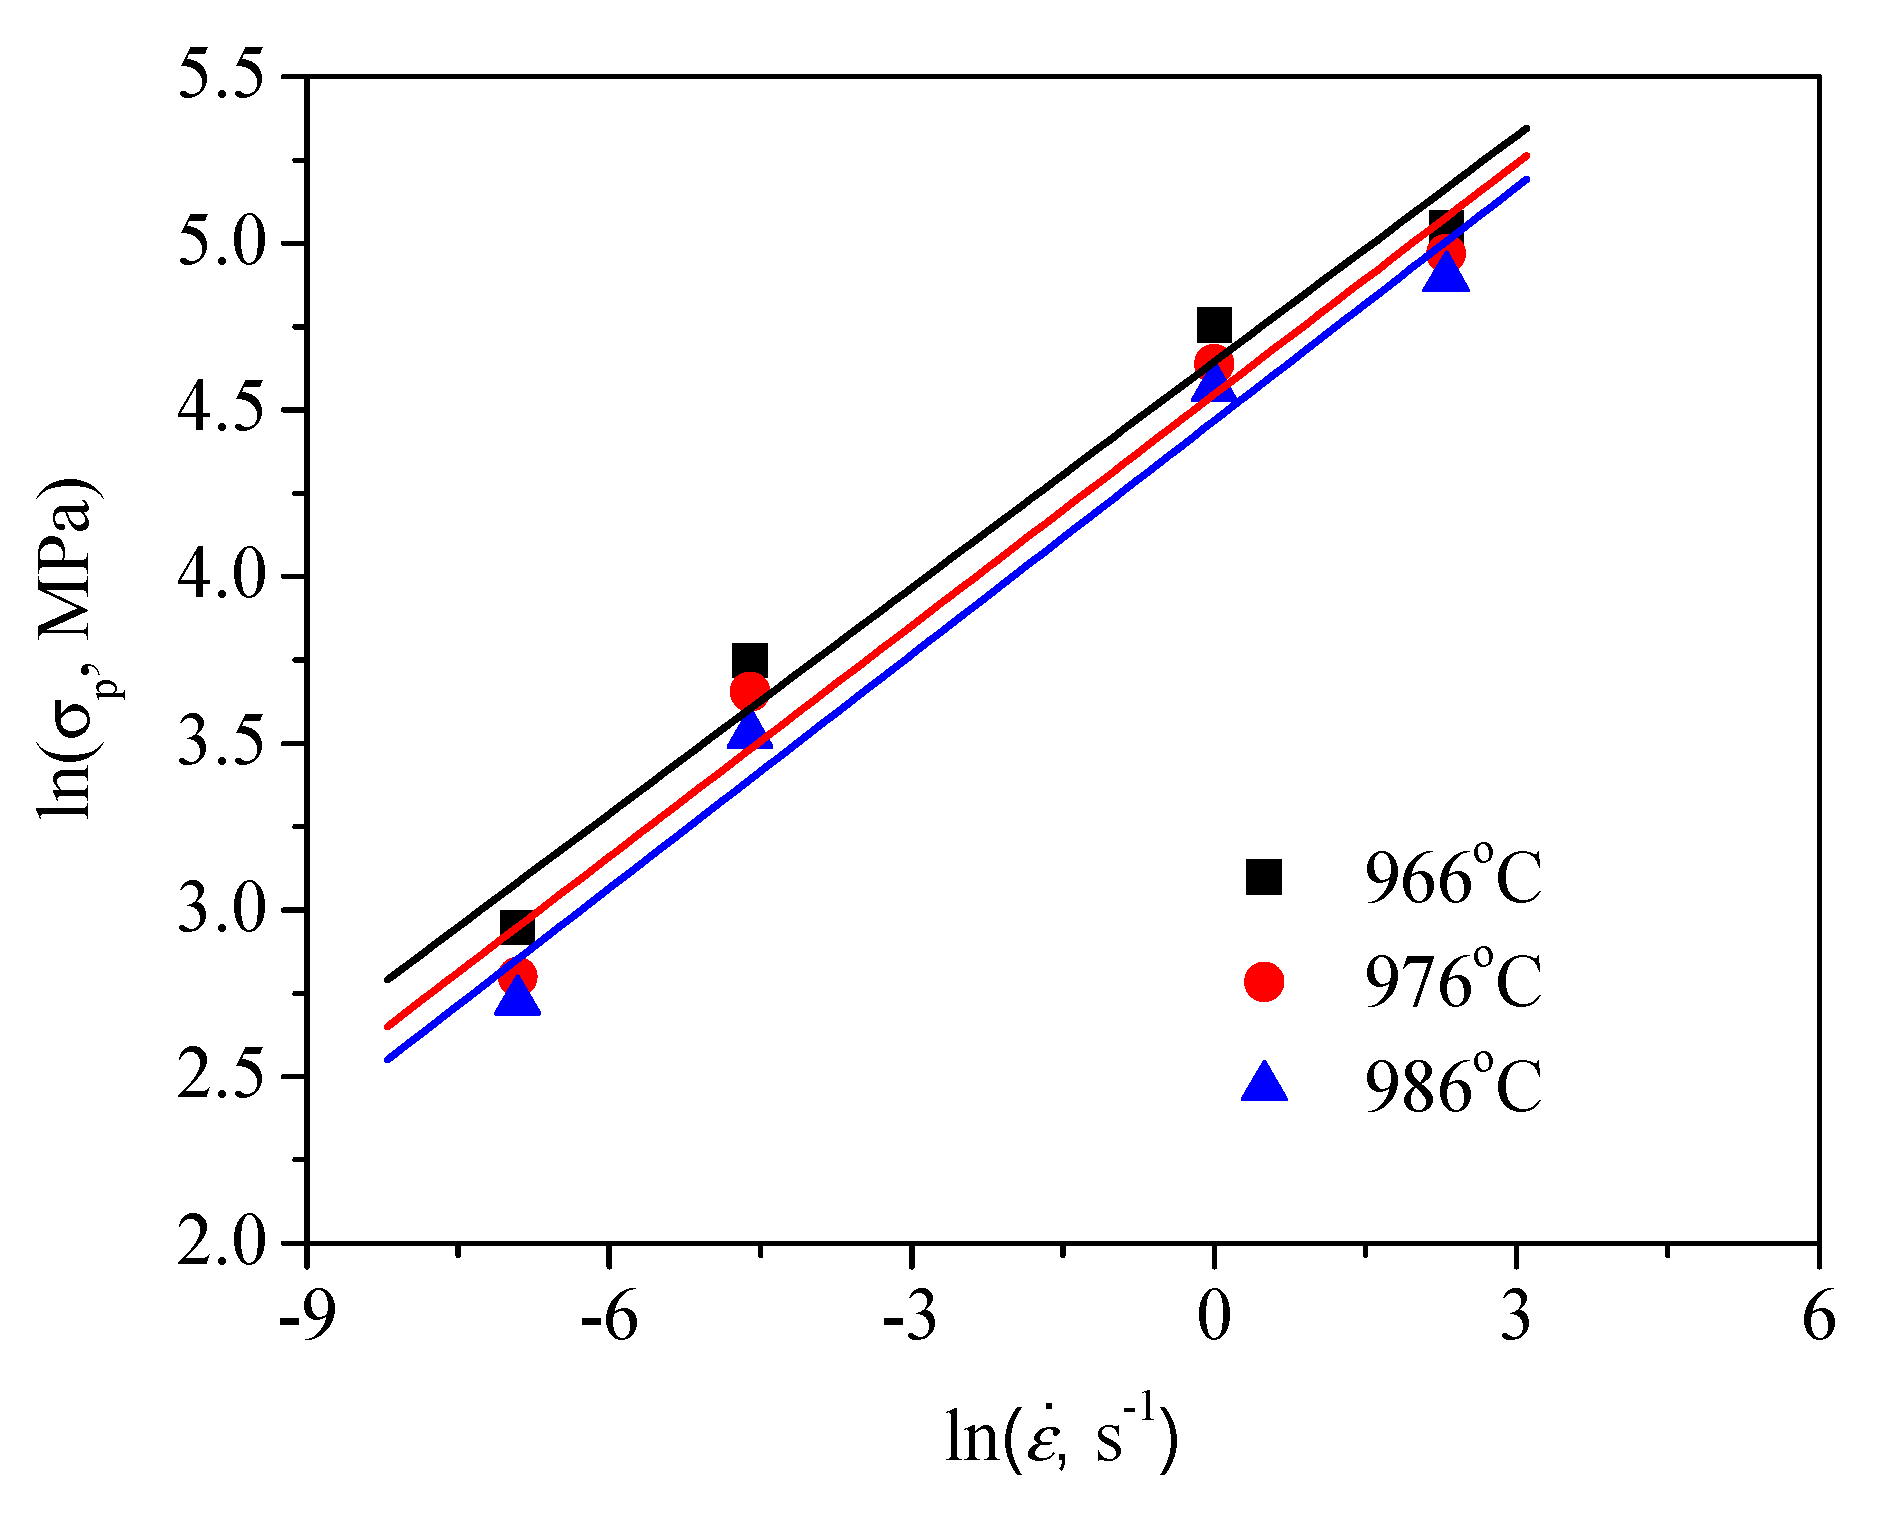
Figure 5.
Relationship between the peak-stress and deformation temperature.
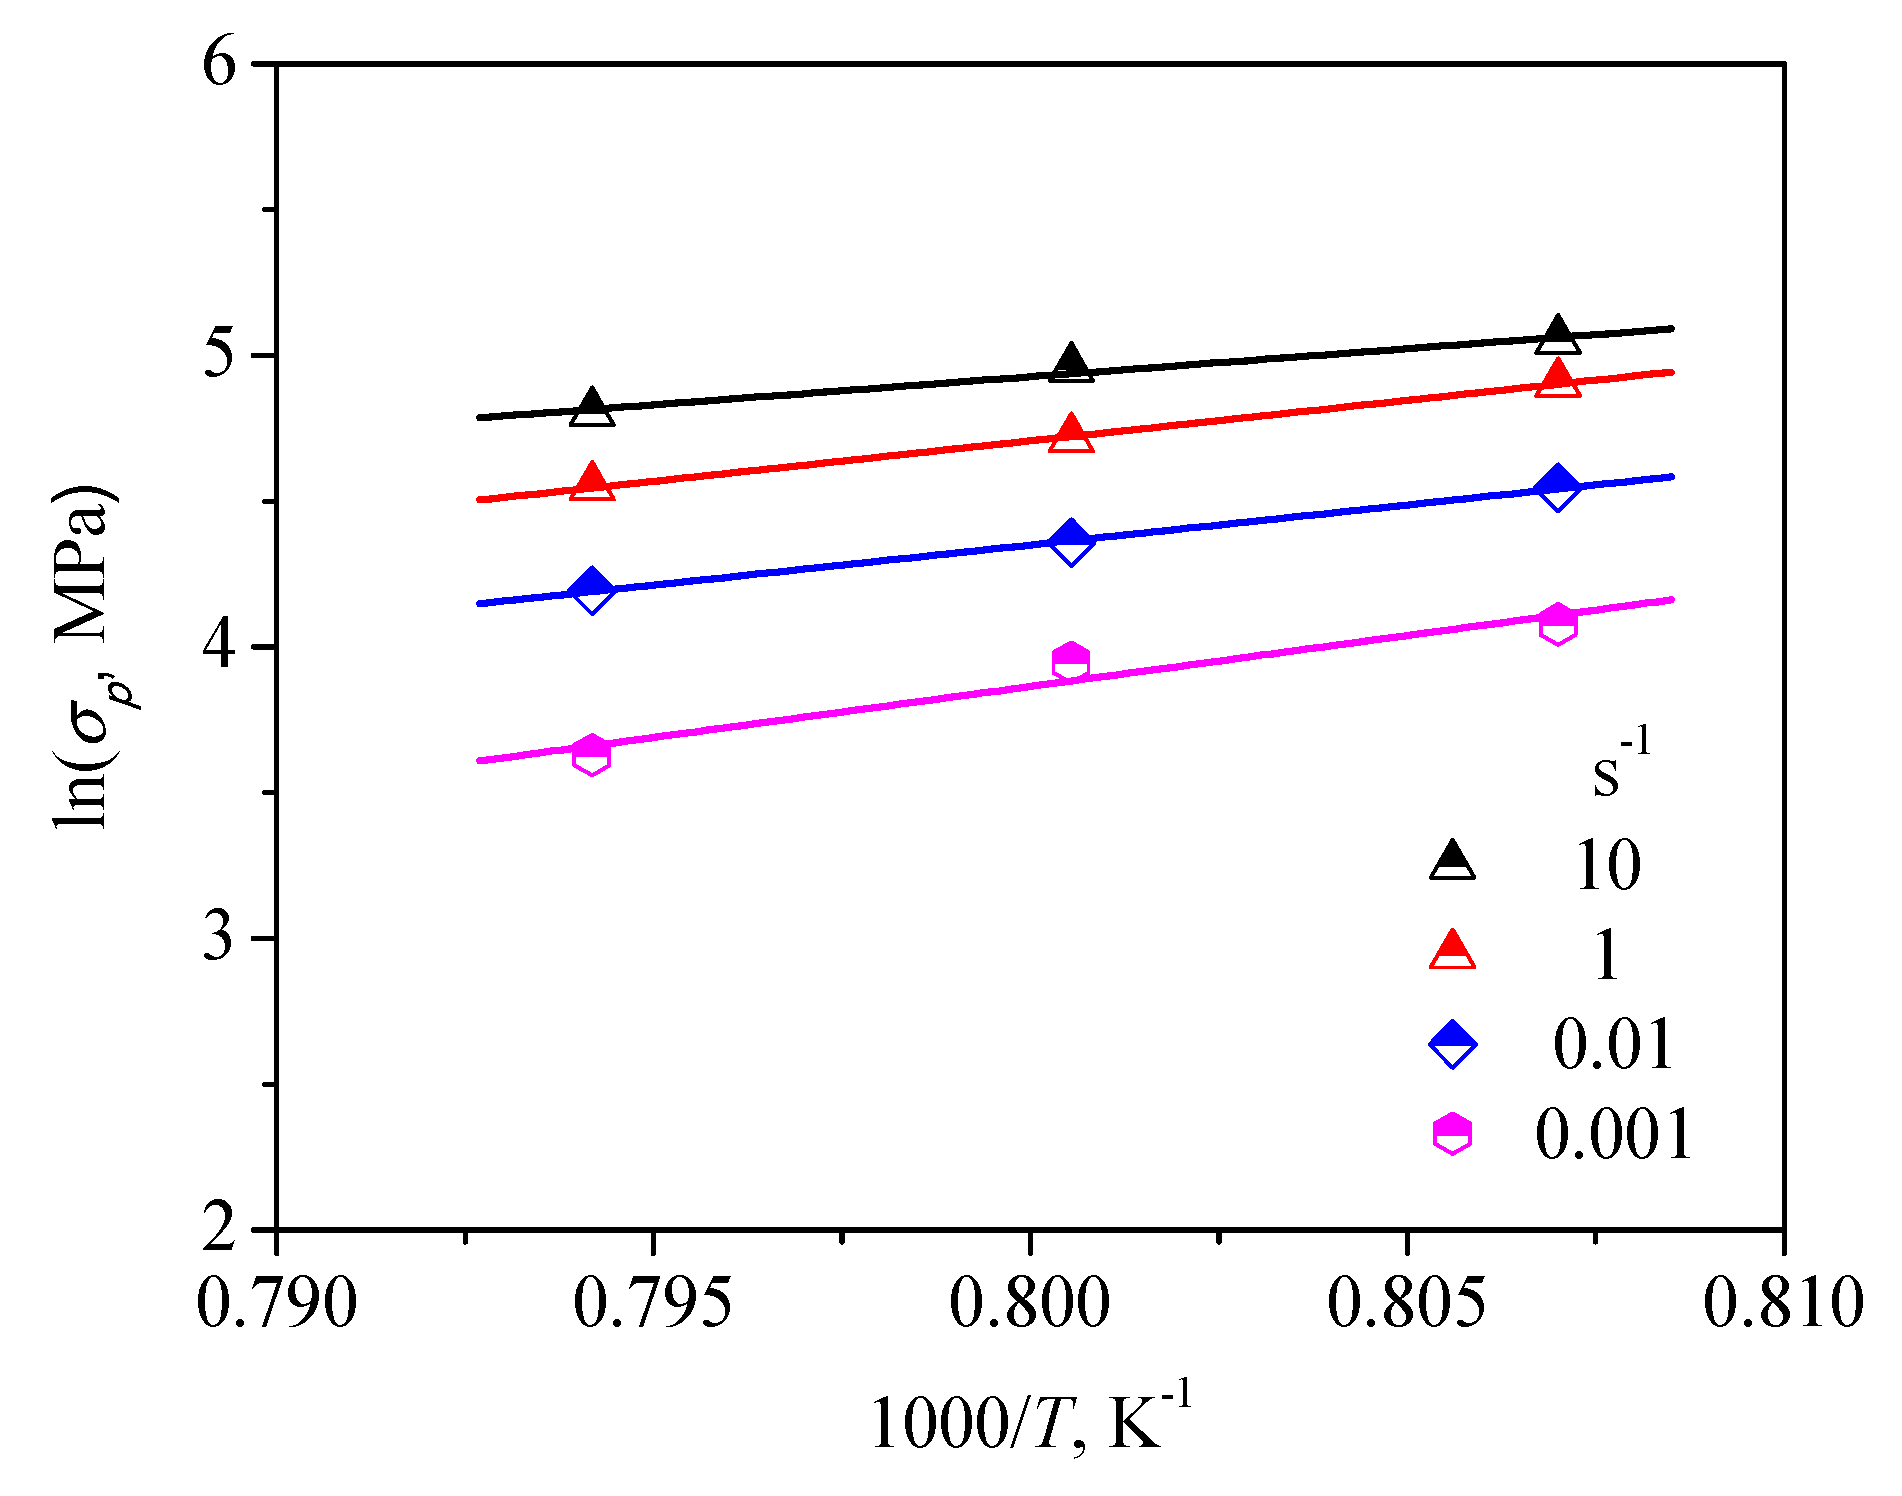
Figure 6.
Relationship between the peak-stress () and the Z parameter
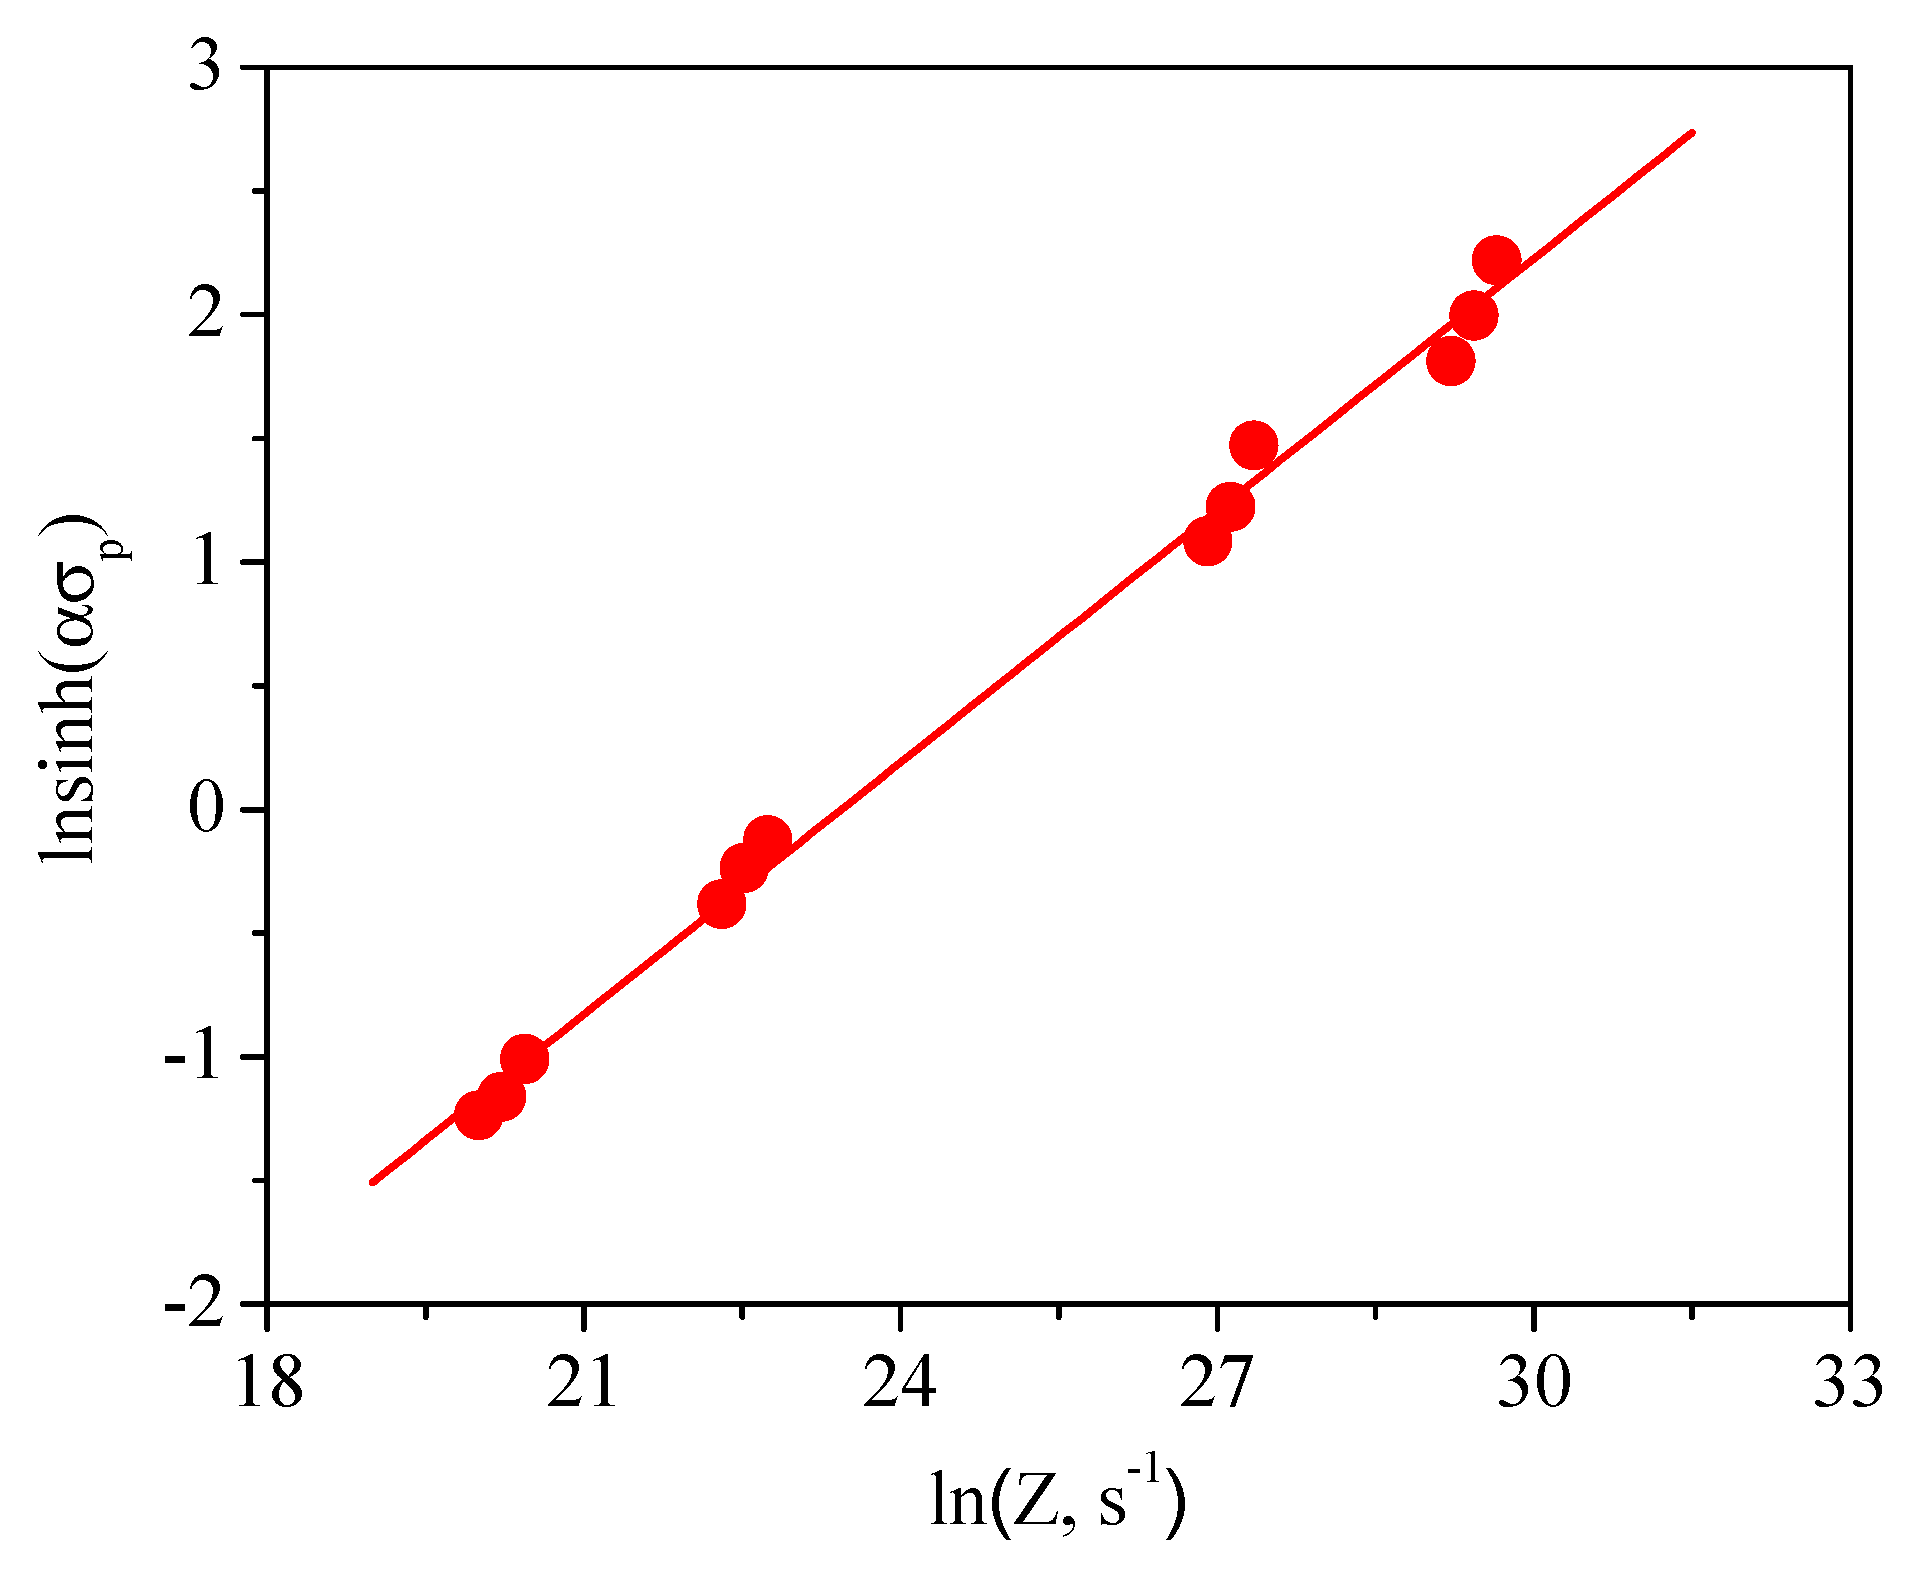
Figure 7.
Processing maps for the deformed samples at the true strains of (a) 0.2, (b) 0.3, (c) 0.4, (d) 0.5, (e) 0.6 and (f) 0.8.
Figure 7.
Processing maps for the deformed samples at the true strains of (a) 0.2, (b) 0.3, (c) 0.4, (d) 0.5, (e) 0.6 and (f) 0.8.
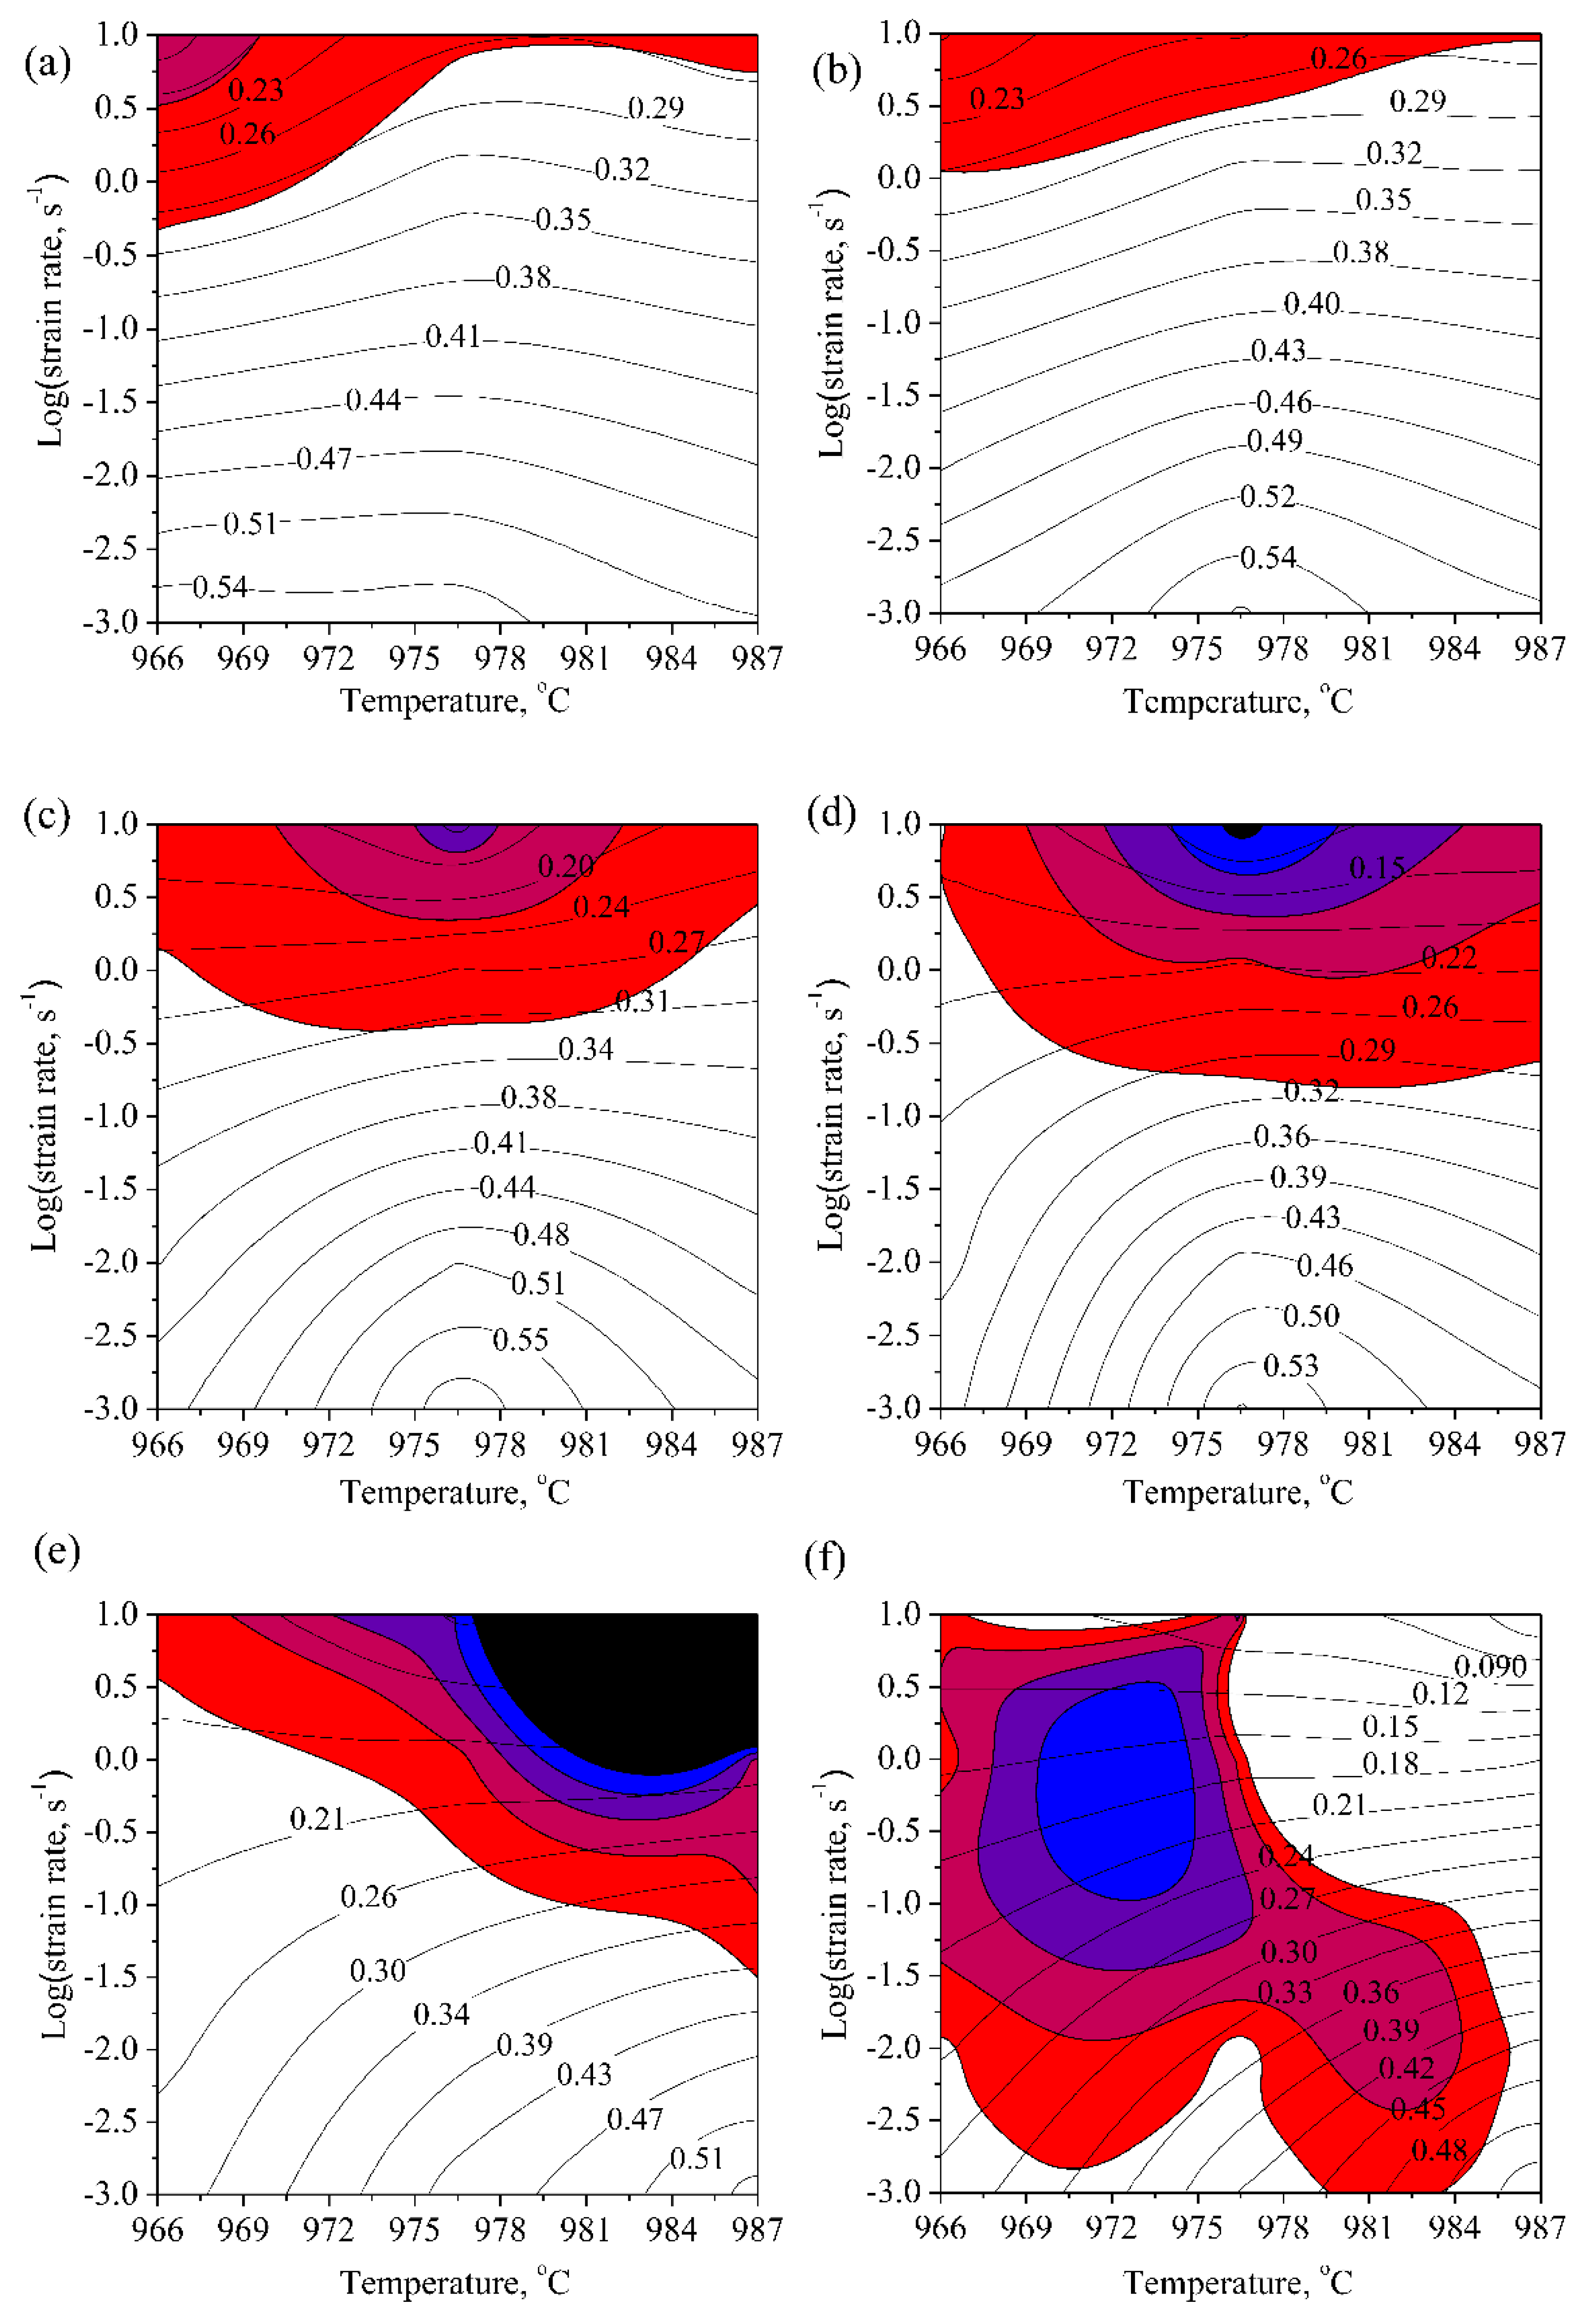
Figure 8.
Optical microstructures of the alloys with a true strain of 1.2 at different conditions: (a) 976℃/1s-1, (b) 986℃/1s-1, (c) 966℃/0.01s-1, (d) 966℃/0.001s-1, (e) 976℃/0.001s-1 and (f) 986℃/0.001s-1.
Figure 8.
Optical microstructures of the alloys with a true strain of 1.2 at different conditions: (a) 976℃/1s-1, (b) 986℃/1s-1, (c) 966℃/0.01s-1, (d) 966℃/0.001s-1, (e) 976℃/0.001s-1 and (f) 986℃/0.001s-1.
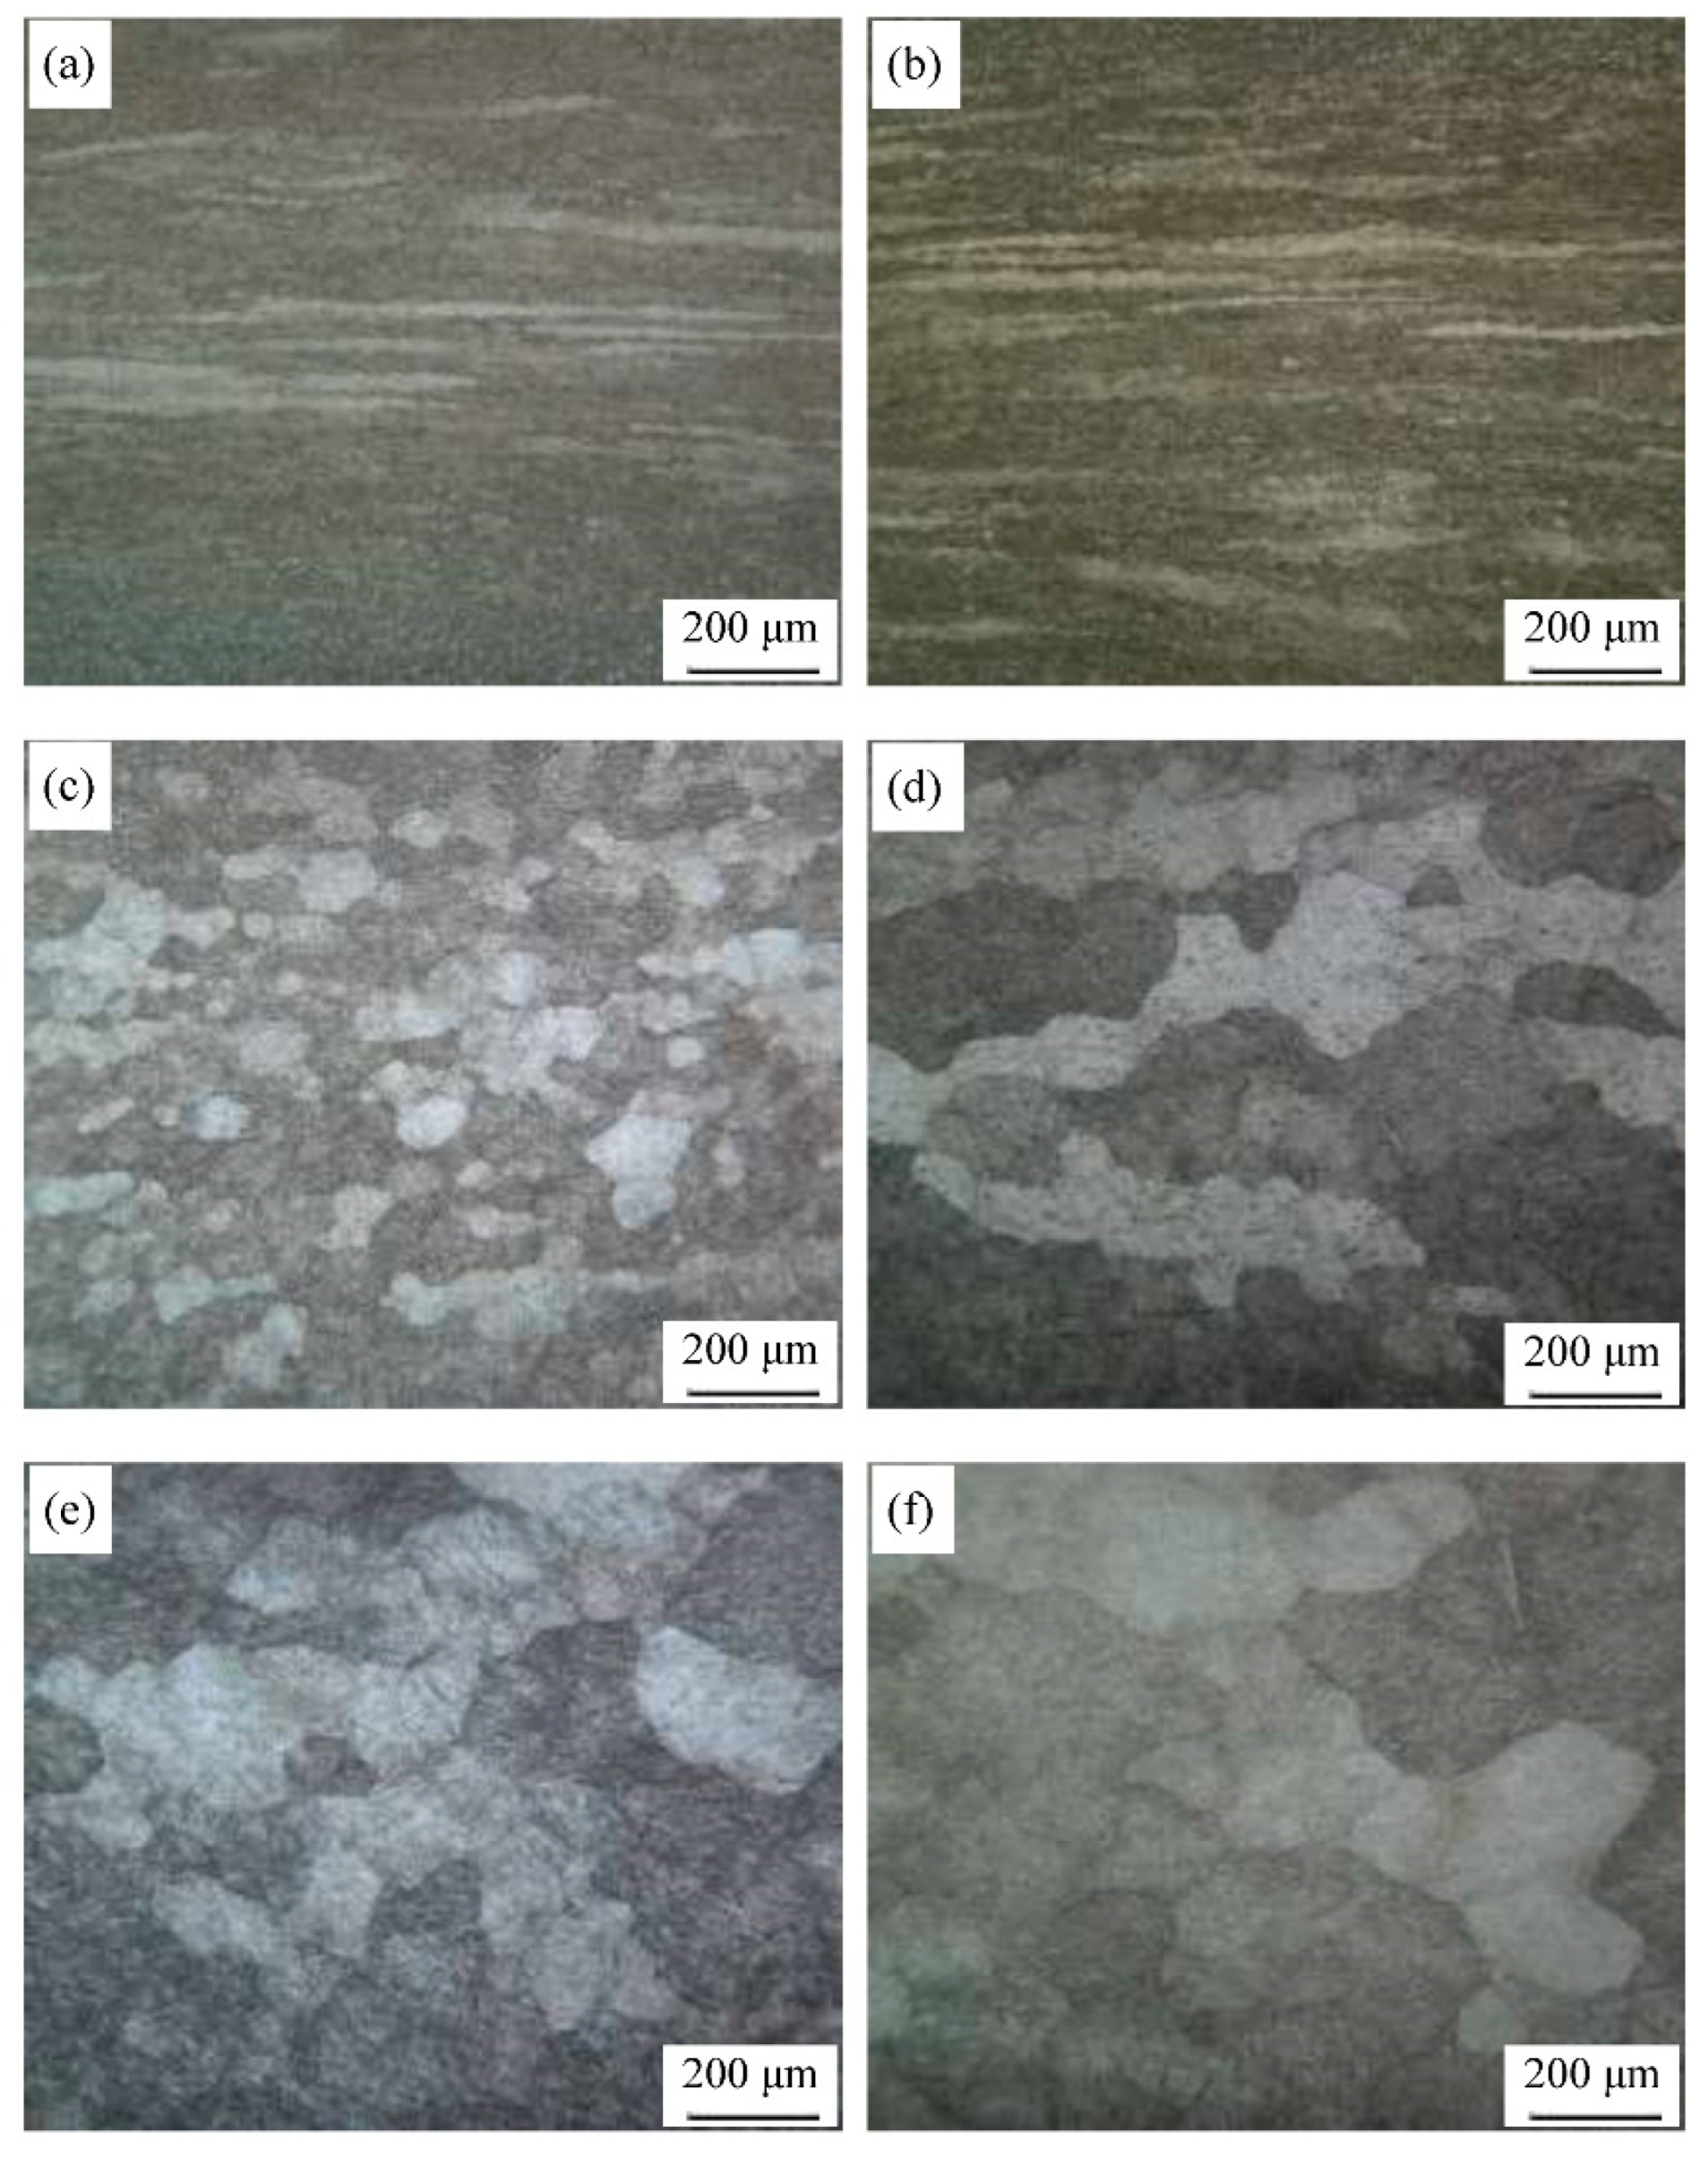
Figure 9.
Schematic diagram of finite element simulation for upsetting: (a) geometric model, (b) grid division and (c) node location.
Figure 9.
Schematic diagram of finite element simulation for upsetting: (a) geometric model, (b) grid division and (c) node location.
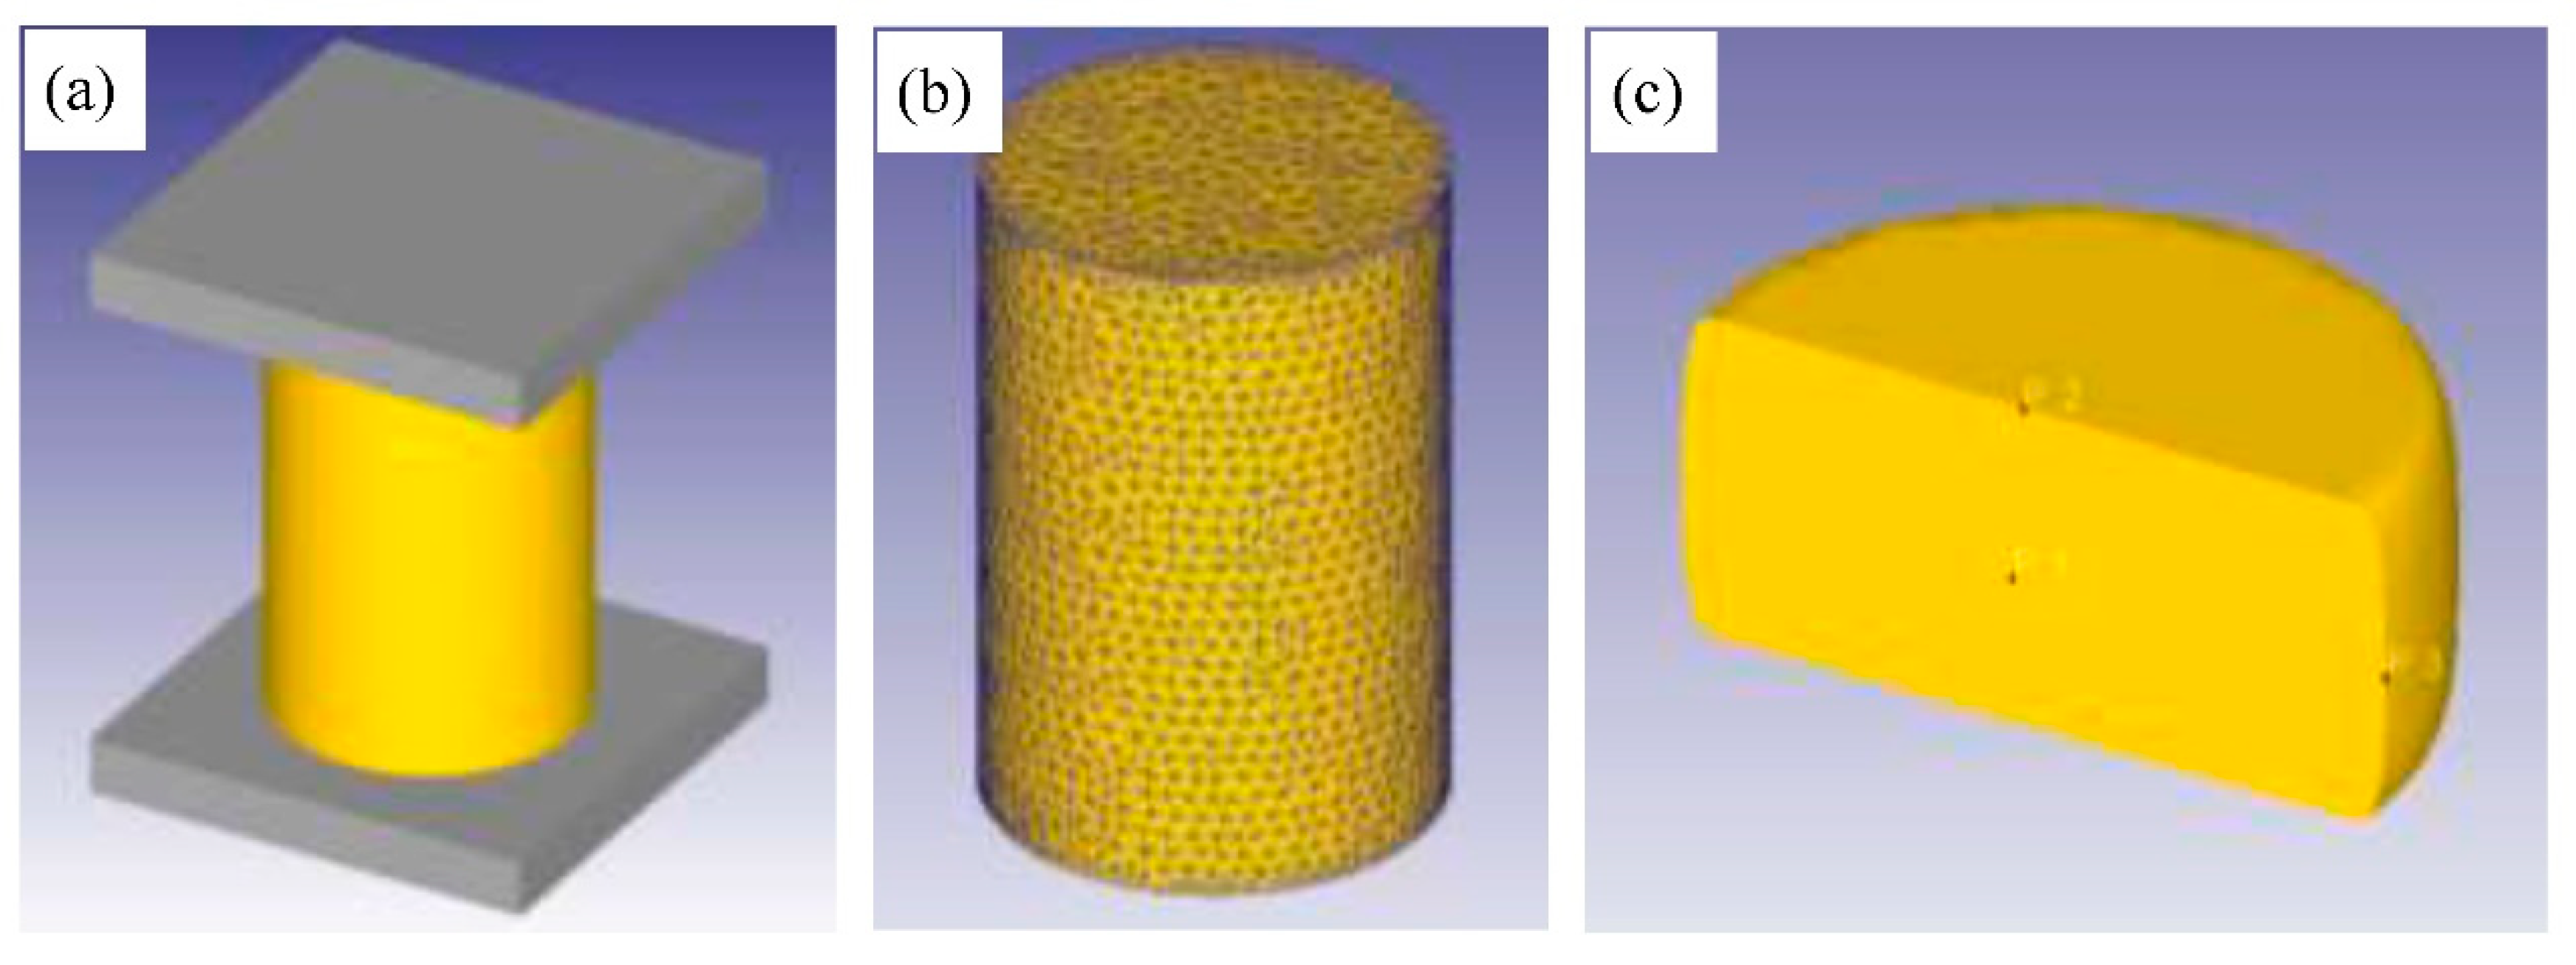
Figure 10.
Temperature field of the deformed samples at 986℃/0.001s-1: (a) 0.3, (b) 0.5, (c) 0.6 and (d) 0.8.
Figure 10.
Temperature field of the deformed samples at 986℃/0.001s-1: (a) 0.3, (b) 0.5, (c) 0.6 and (d) 0.8.
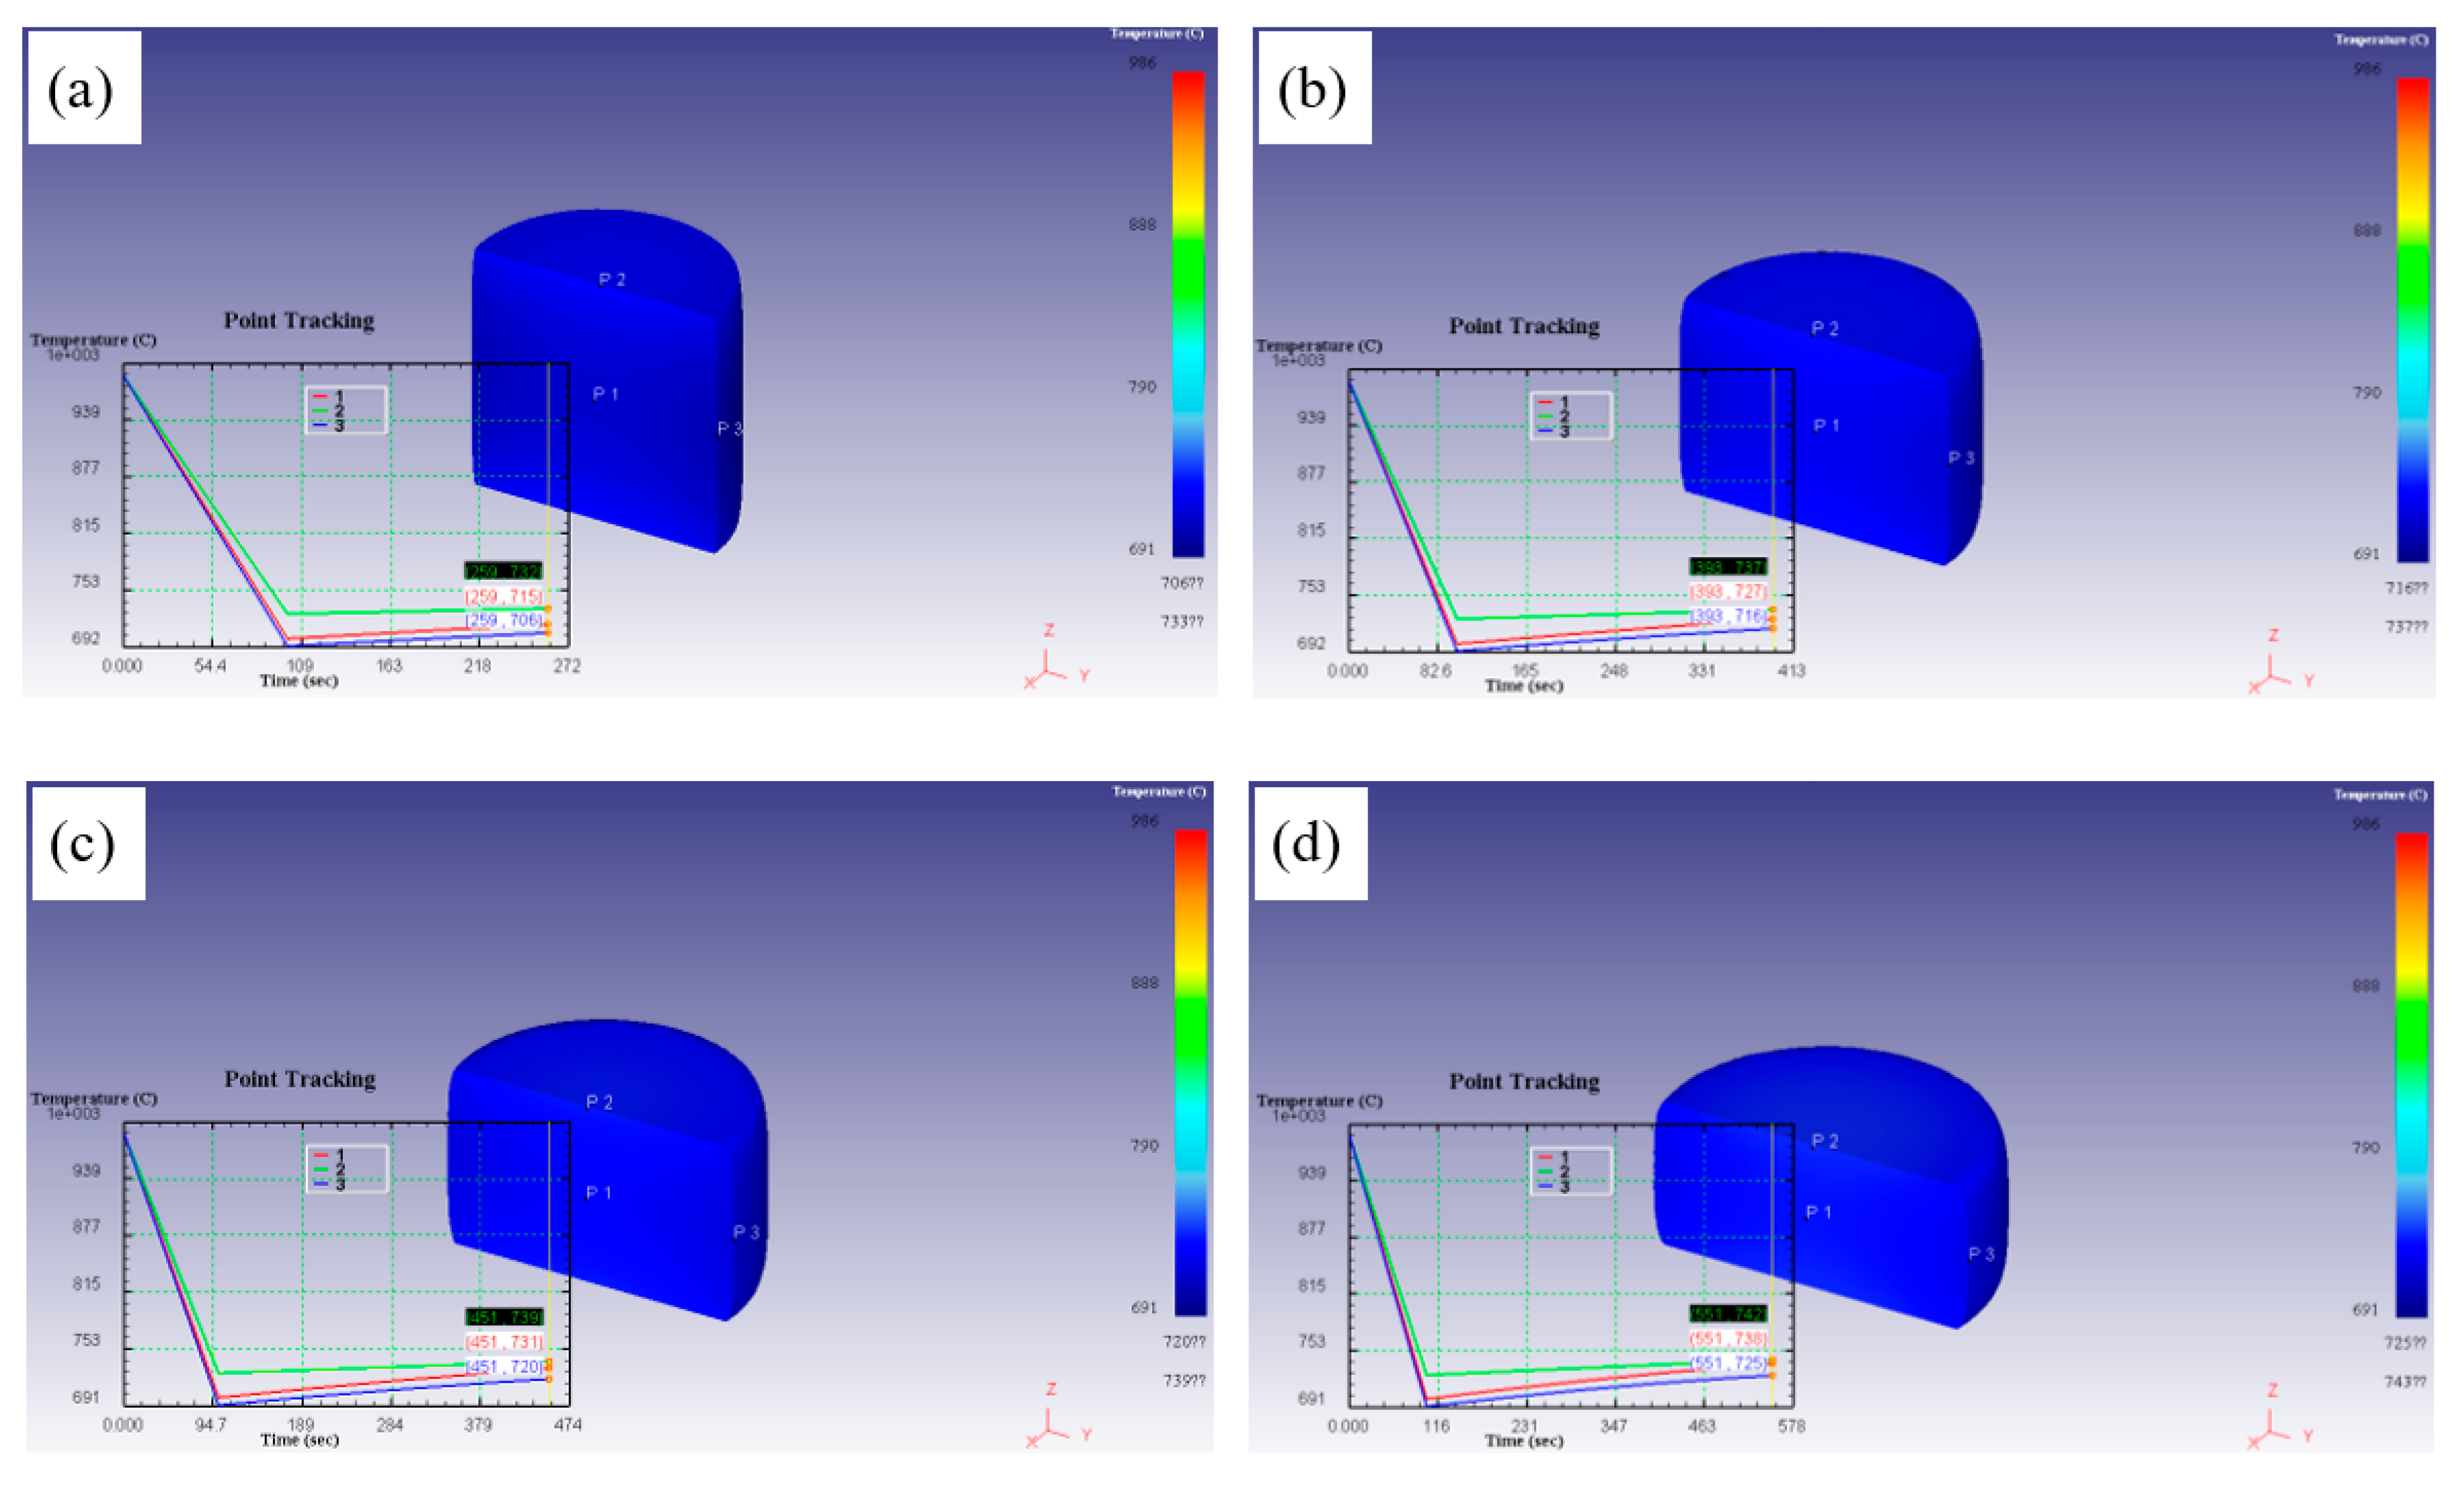
Figure 11.
Temperature field of the deformed samples at 976℃/10s-1: (a) 0.3, (b) 0.5, (c) 0.6 and (d) 0.8.
Figure 11.
Temperature field of the deformed samples at 976℃/10s-1: (a) 0.3, (b) 0.5, (c) 0.6 and (d) 0.8.
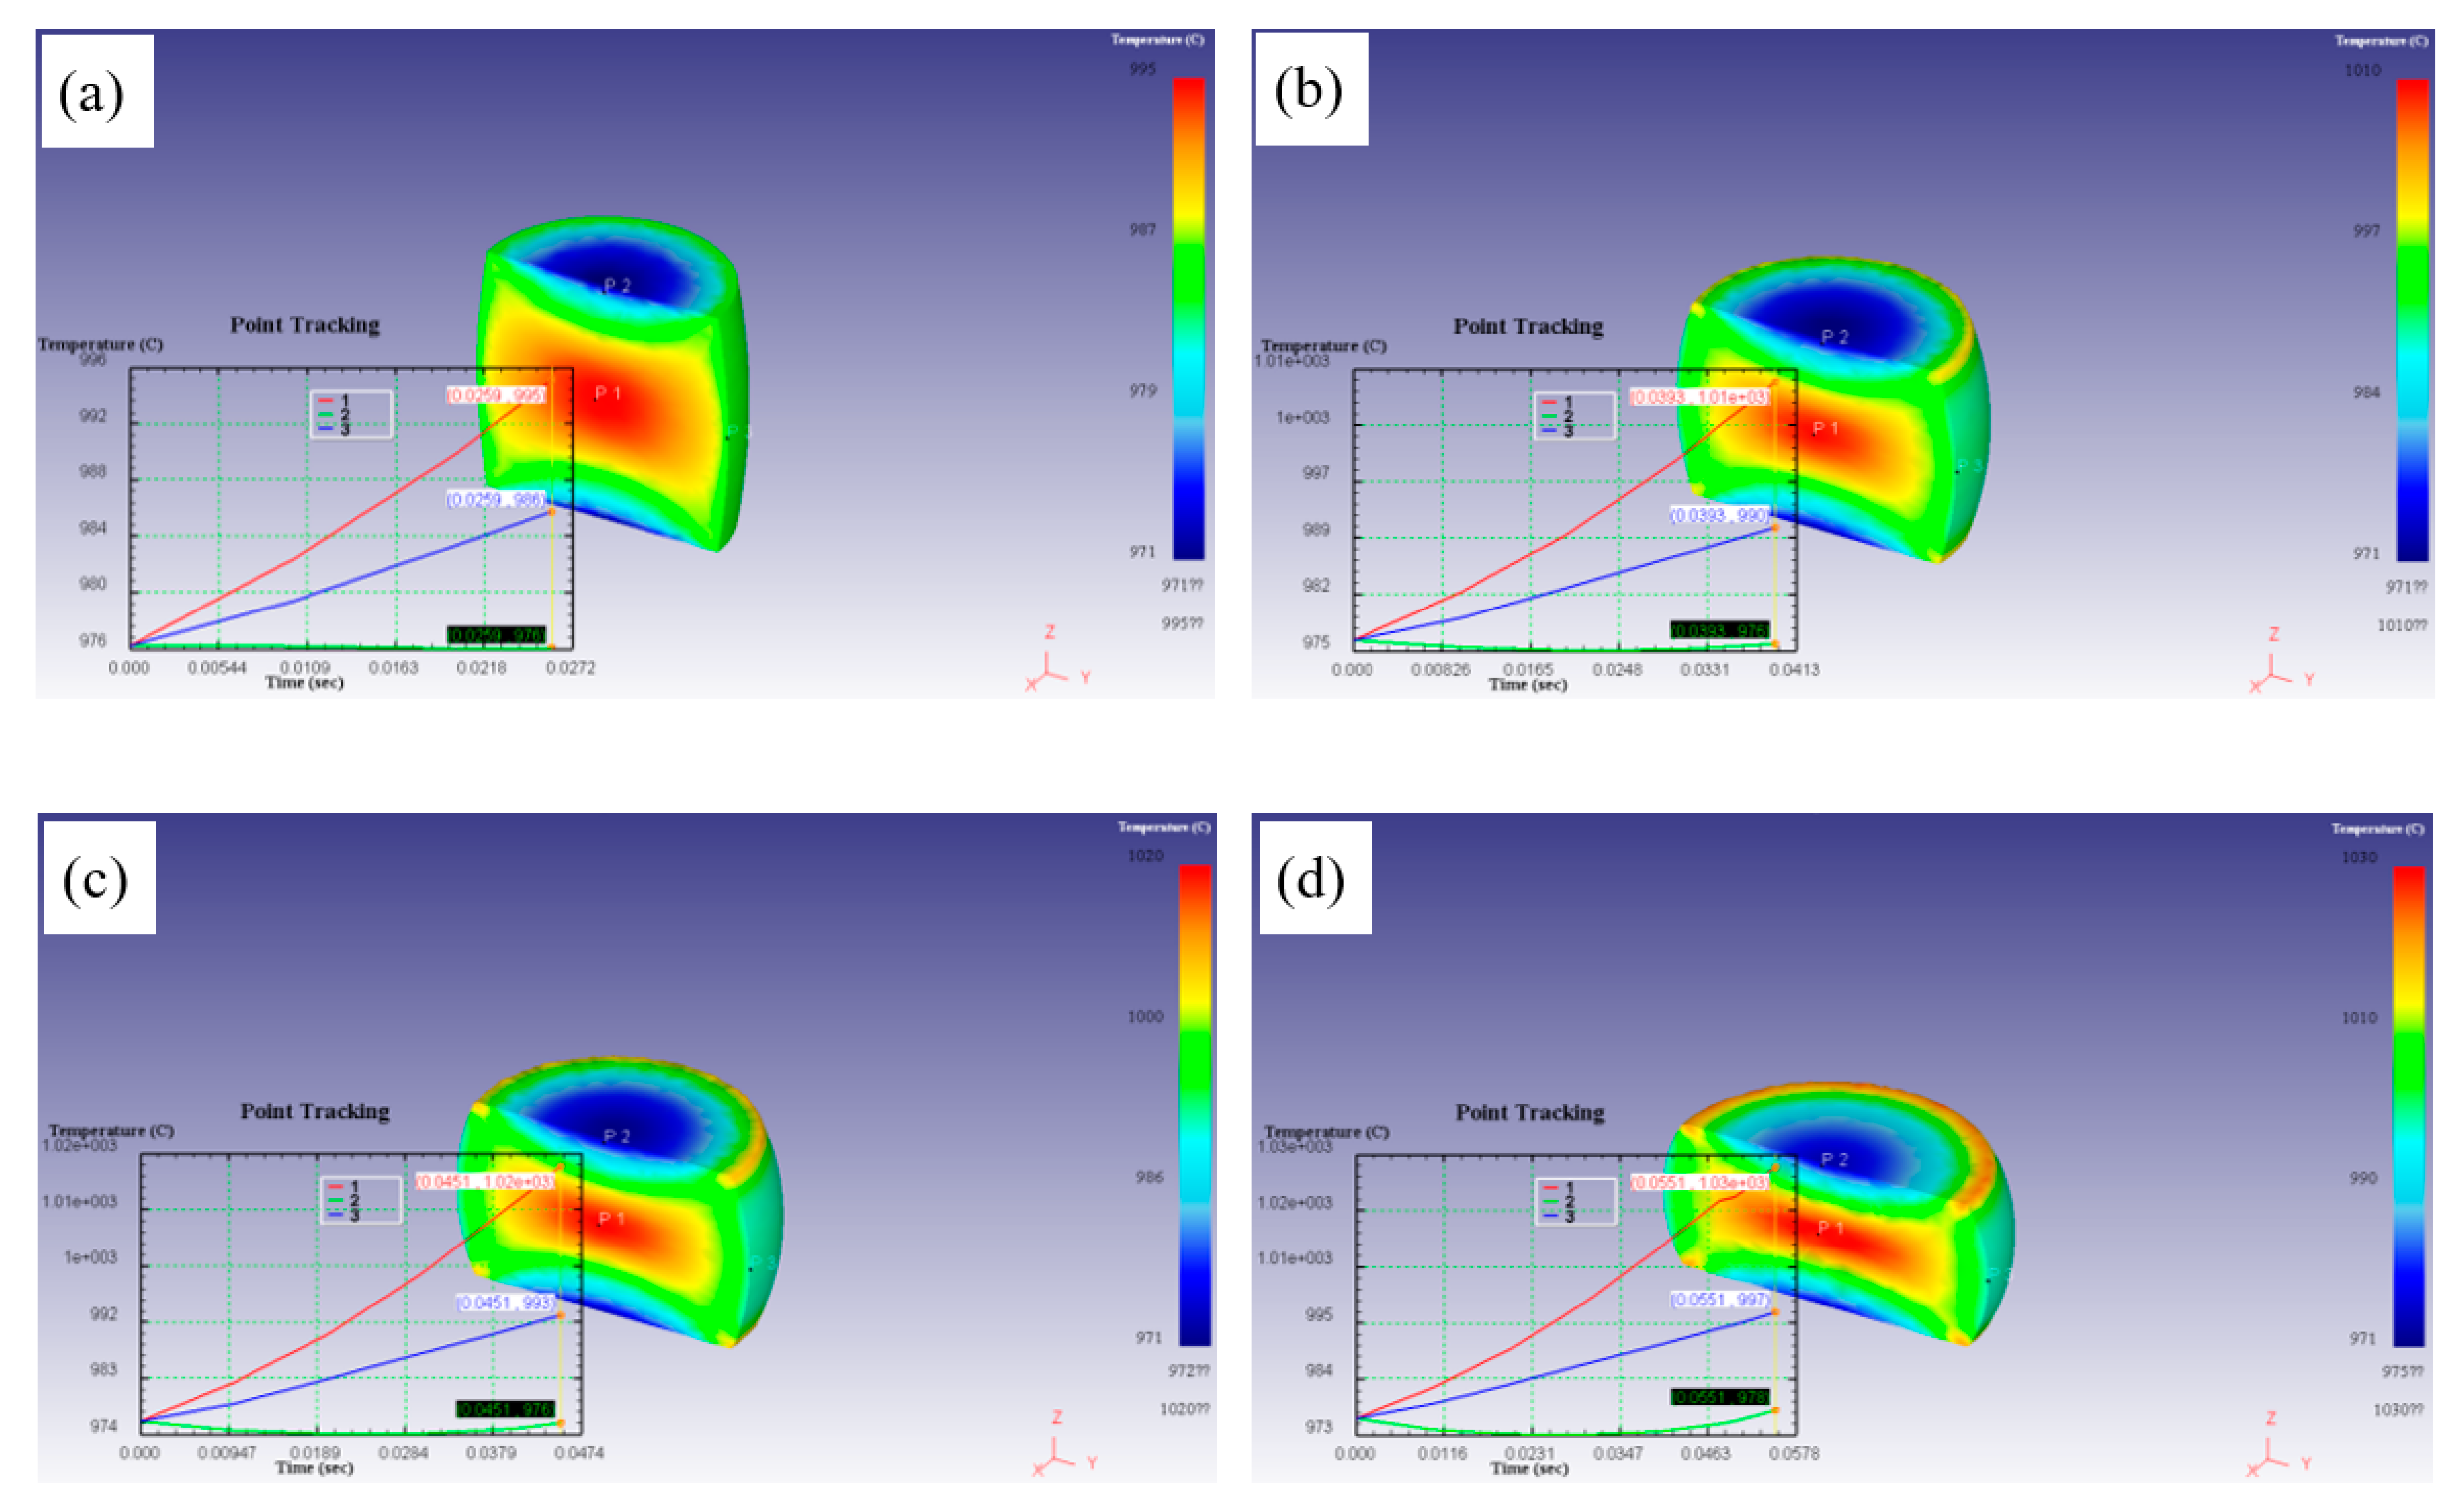
Figure 12.
Effective strain field of the deformed samples at 986℃/0.001s-1: (a) 0.3, (b) 0.5, (c) 0.6 and (d) 0.8.
Figure 12.
Effective strain field of the deformed samples at 986℃/0.001s-1: (a) 0.3, (b) 0.5, (c) 0.6 and (d) 0.8.
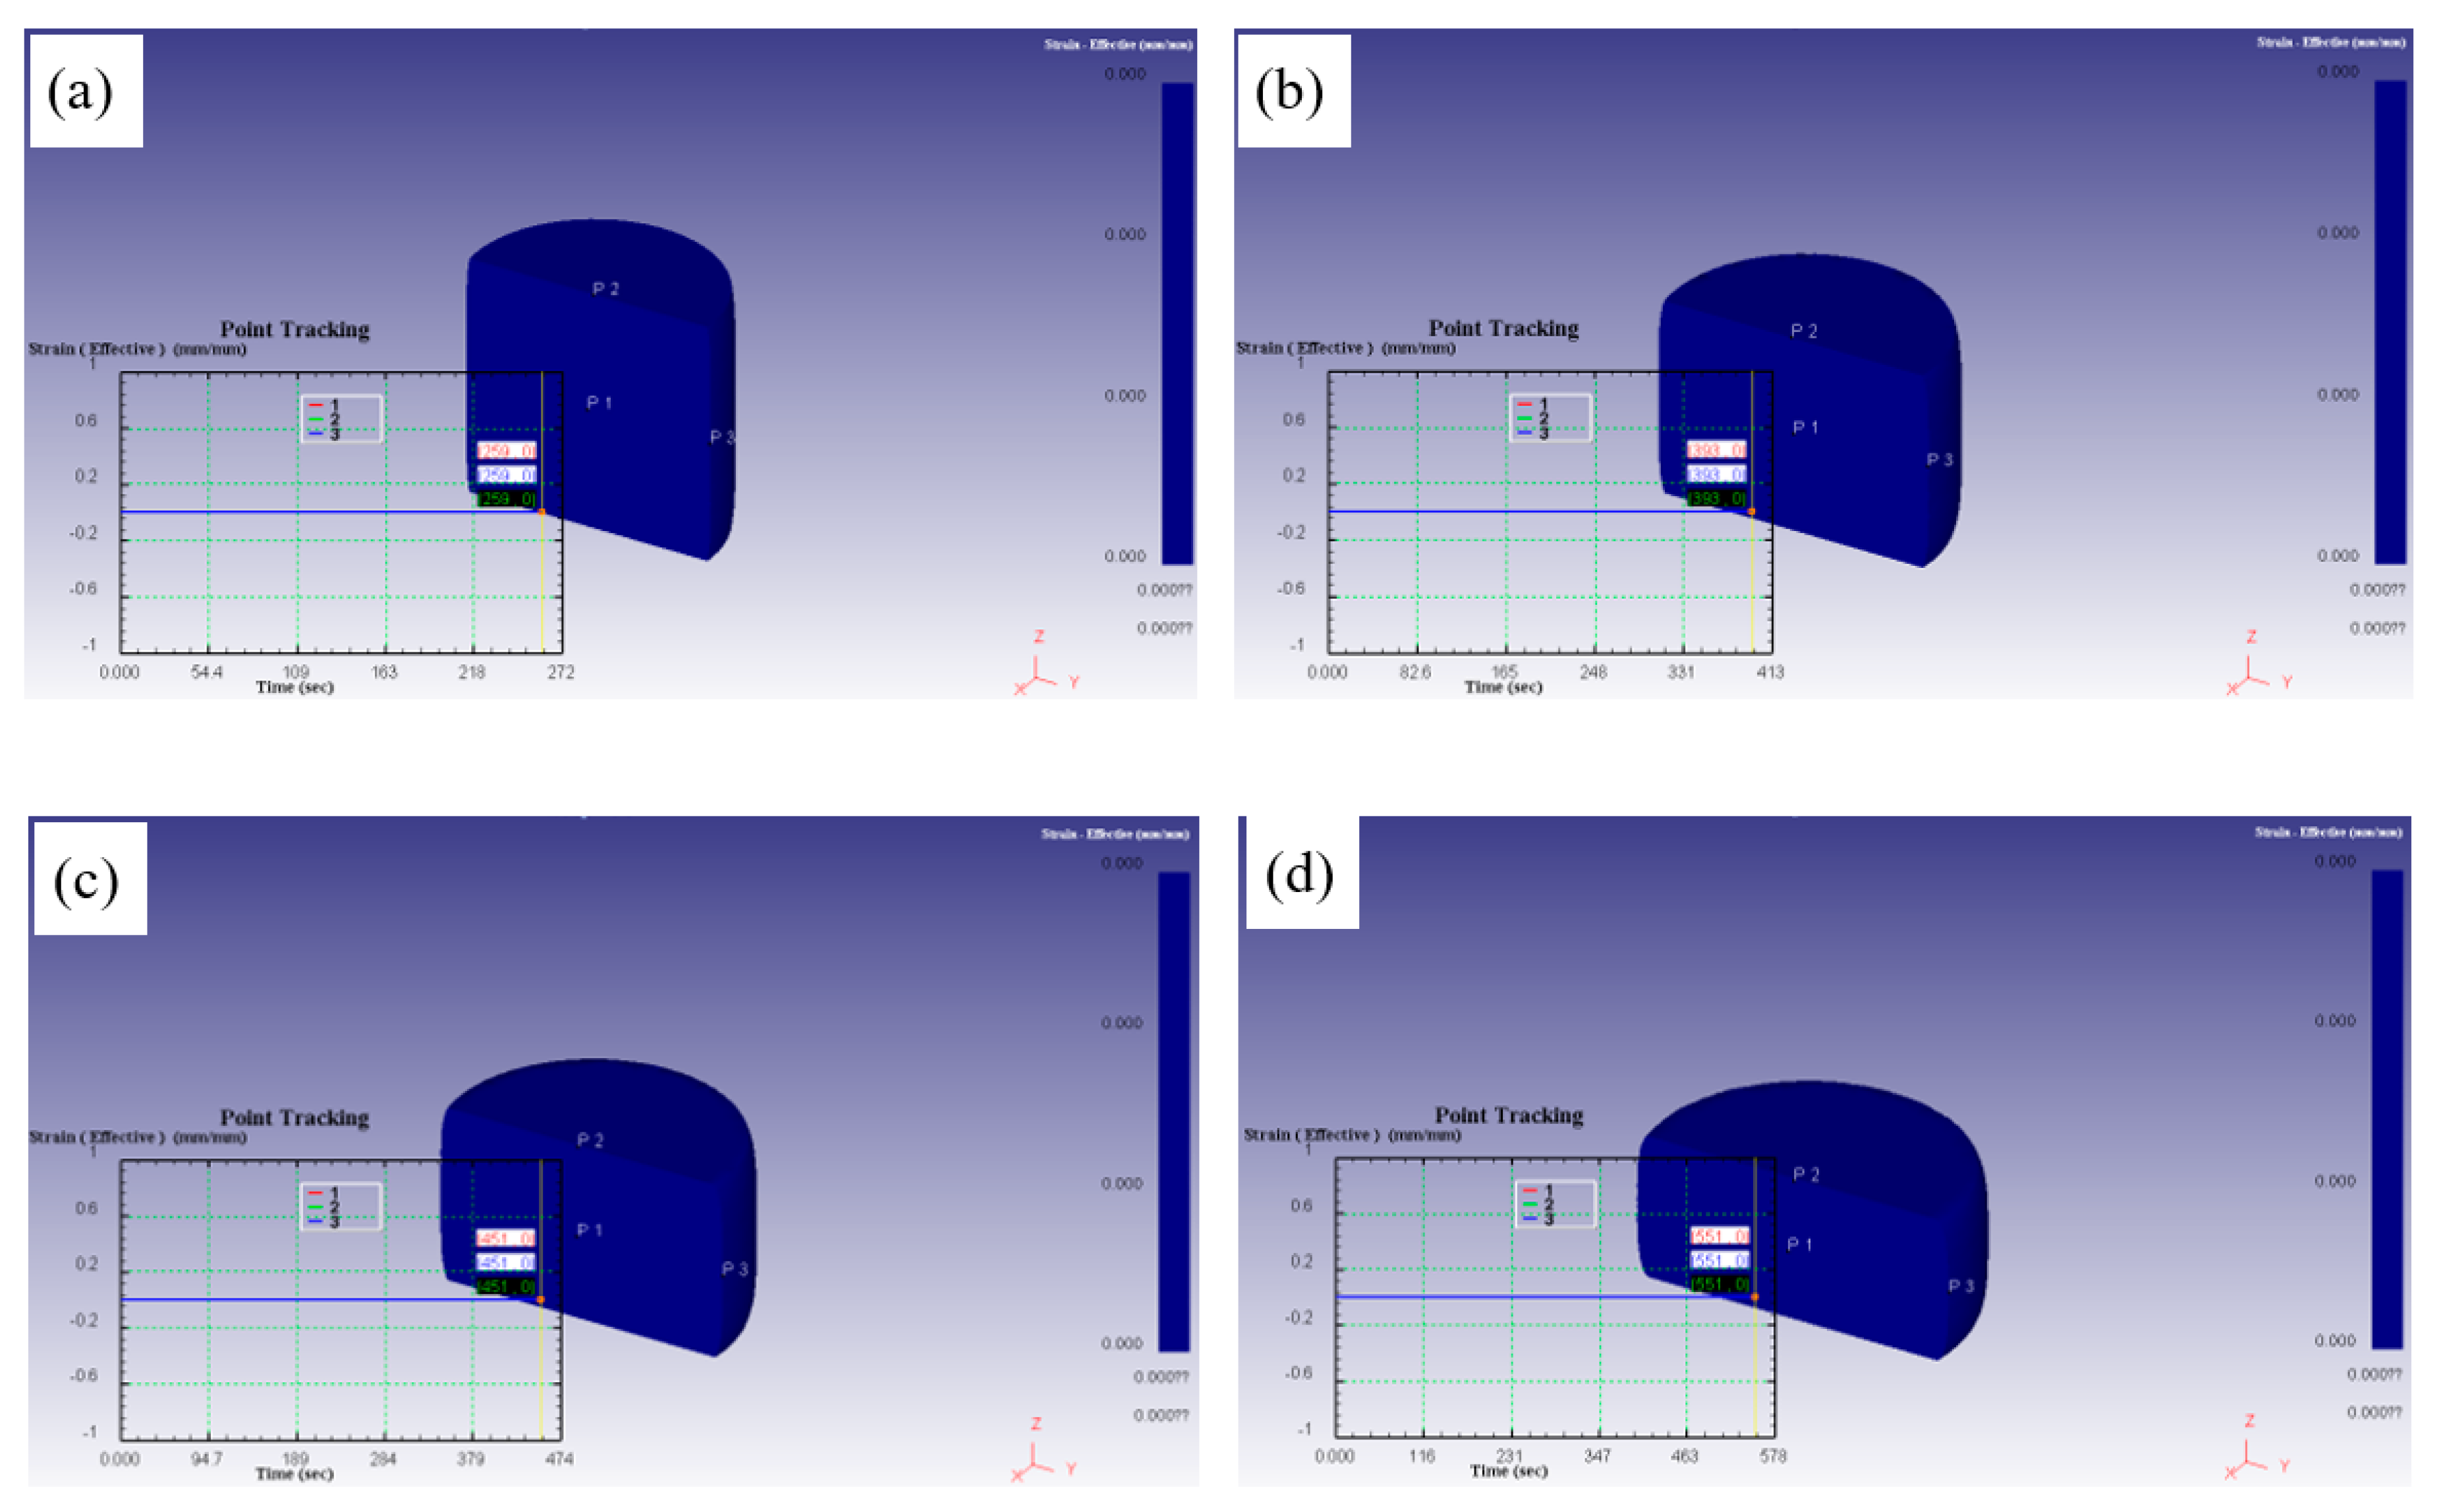
Figure 13.
Effective strain field of the deformed samples at 976℃/10s-1: (a) 0.3, (b) 0.5, (c) 0.6 and (d) 0.8.
Figure 13.
Effective strain field of the deformed samples at 976℃/10s-1: (a) 0.3, (b) 0.5, (c) 0.6 and (d) 0.8.
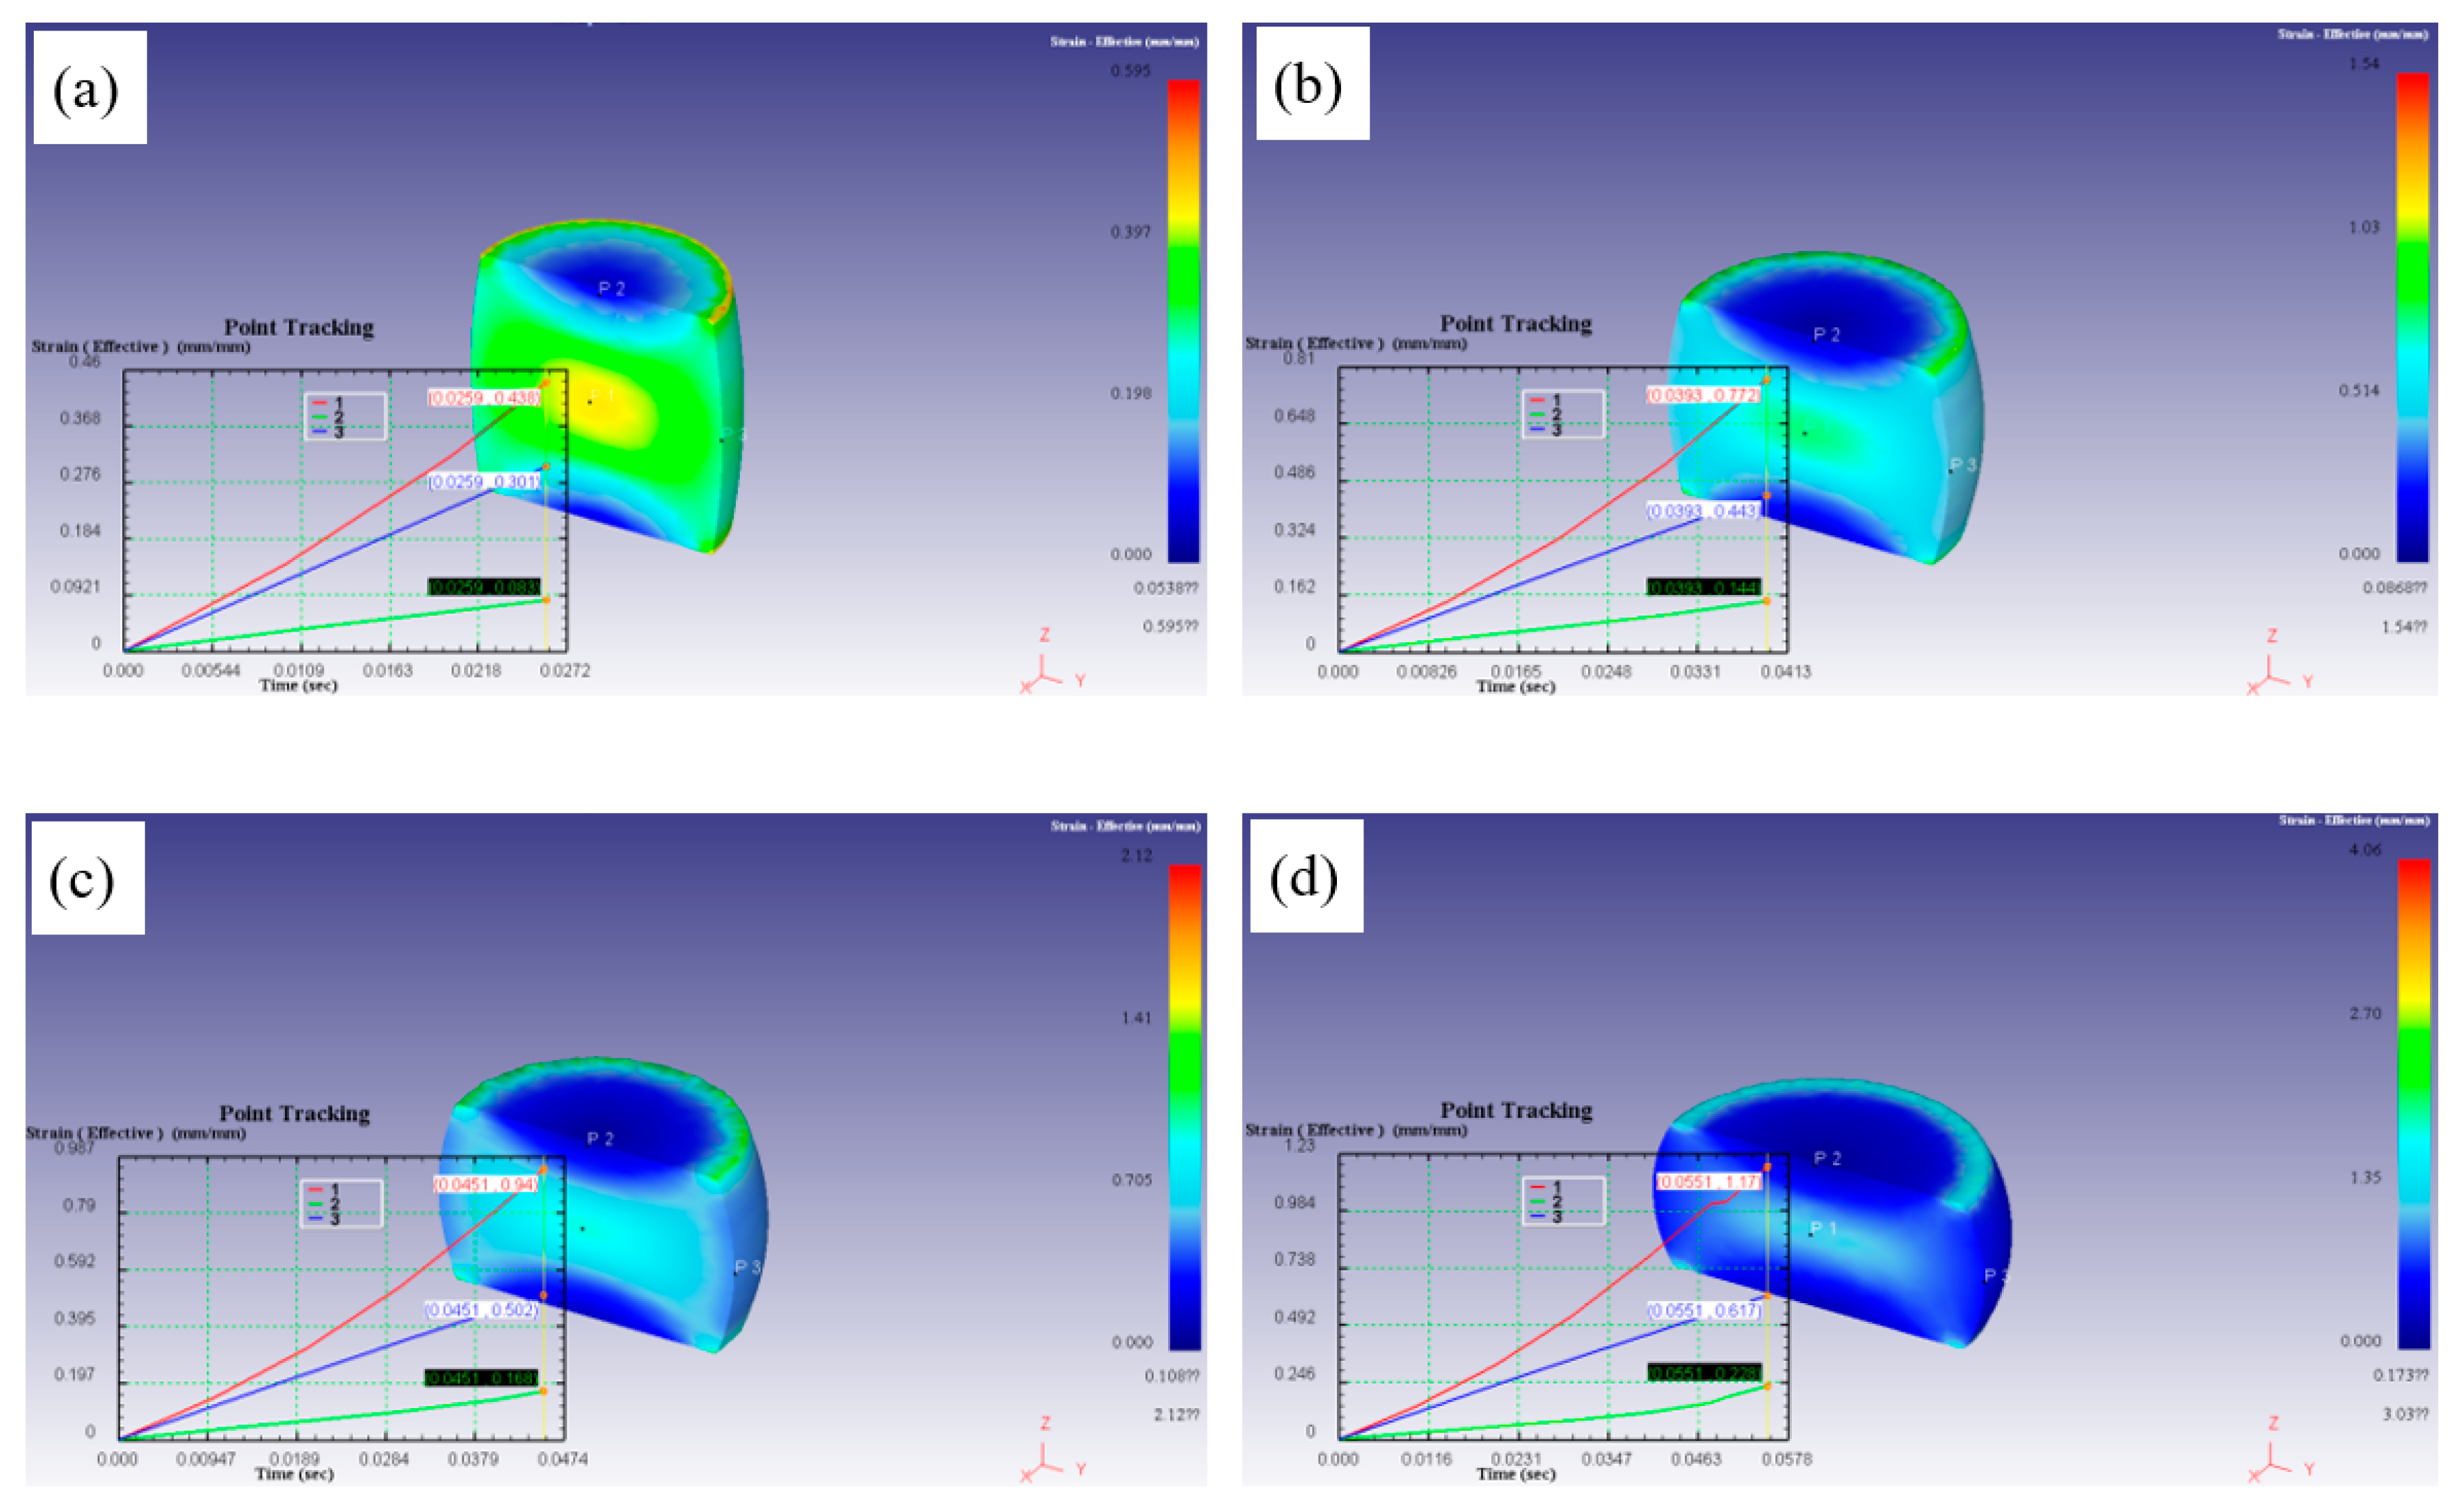
Figure 14.
Effective strain rate field of the deformed samples at 986℃/0.001s-1: (a) 0.3, (b) 0.5, (c) 0.6, (d) 0.8.
Figure 14.
Effective strain rate field of the deformed samples at 986℃/0.001s-1: (a) 0.3, (b) 0.5, (c) 0.6, (d) 0.8.
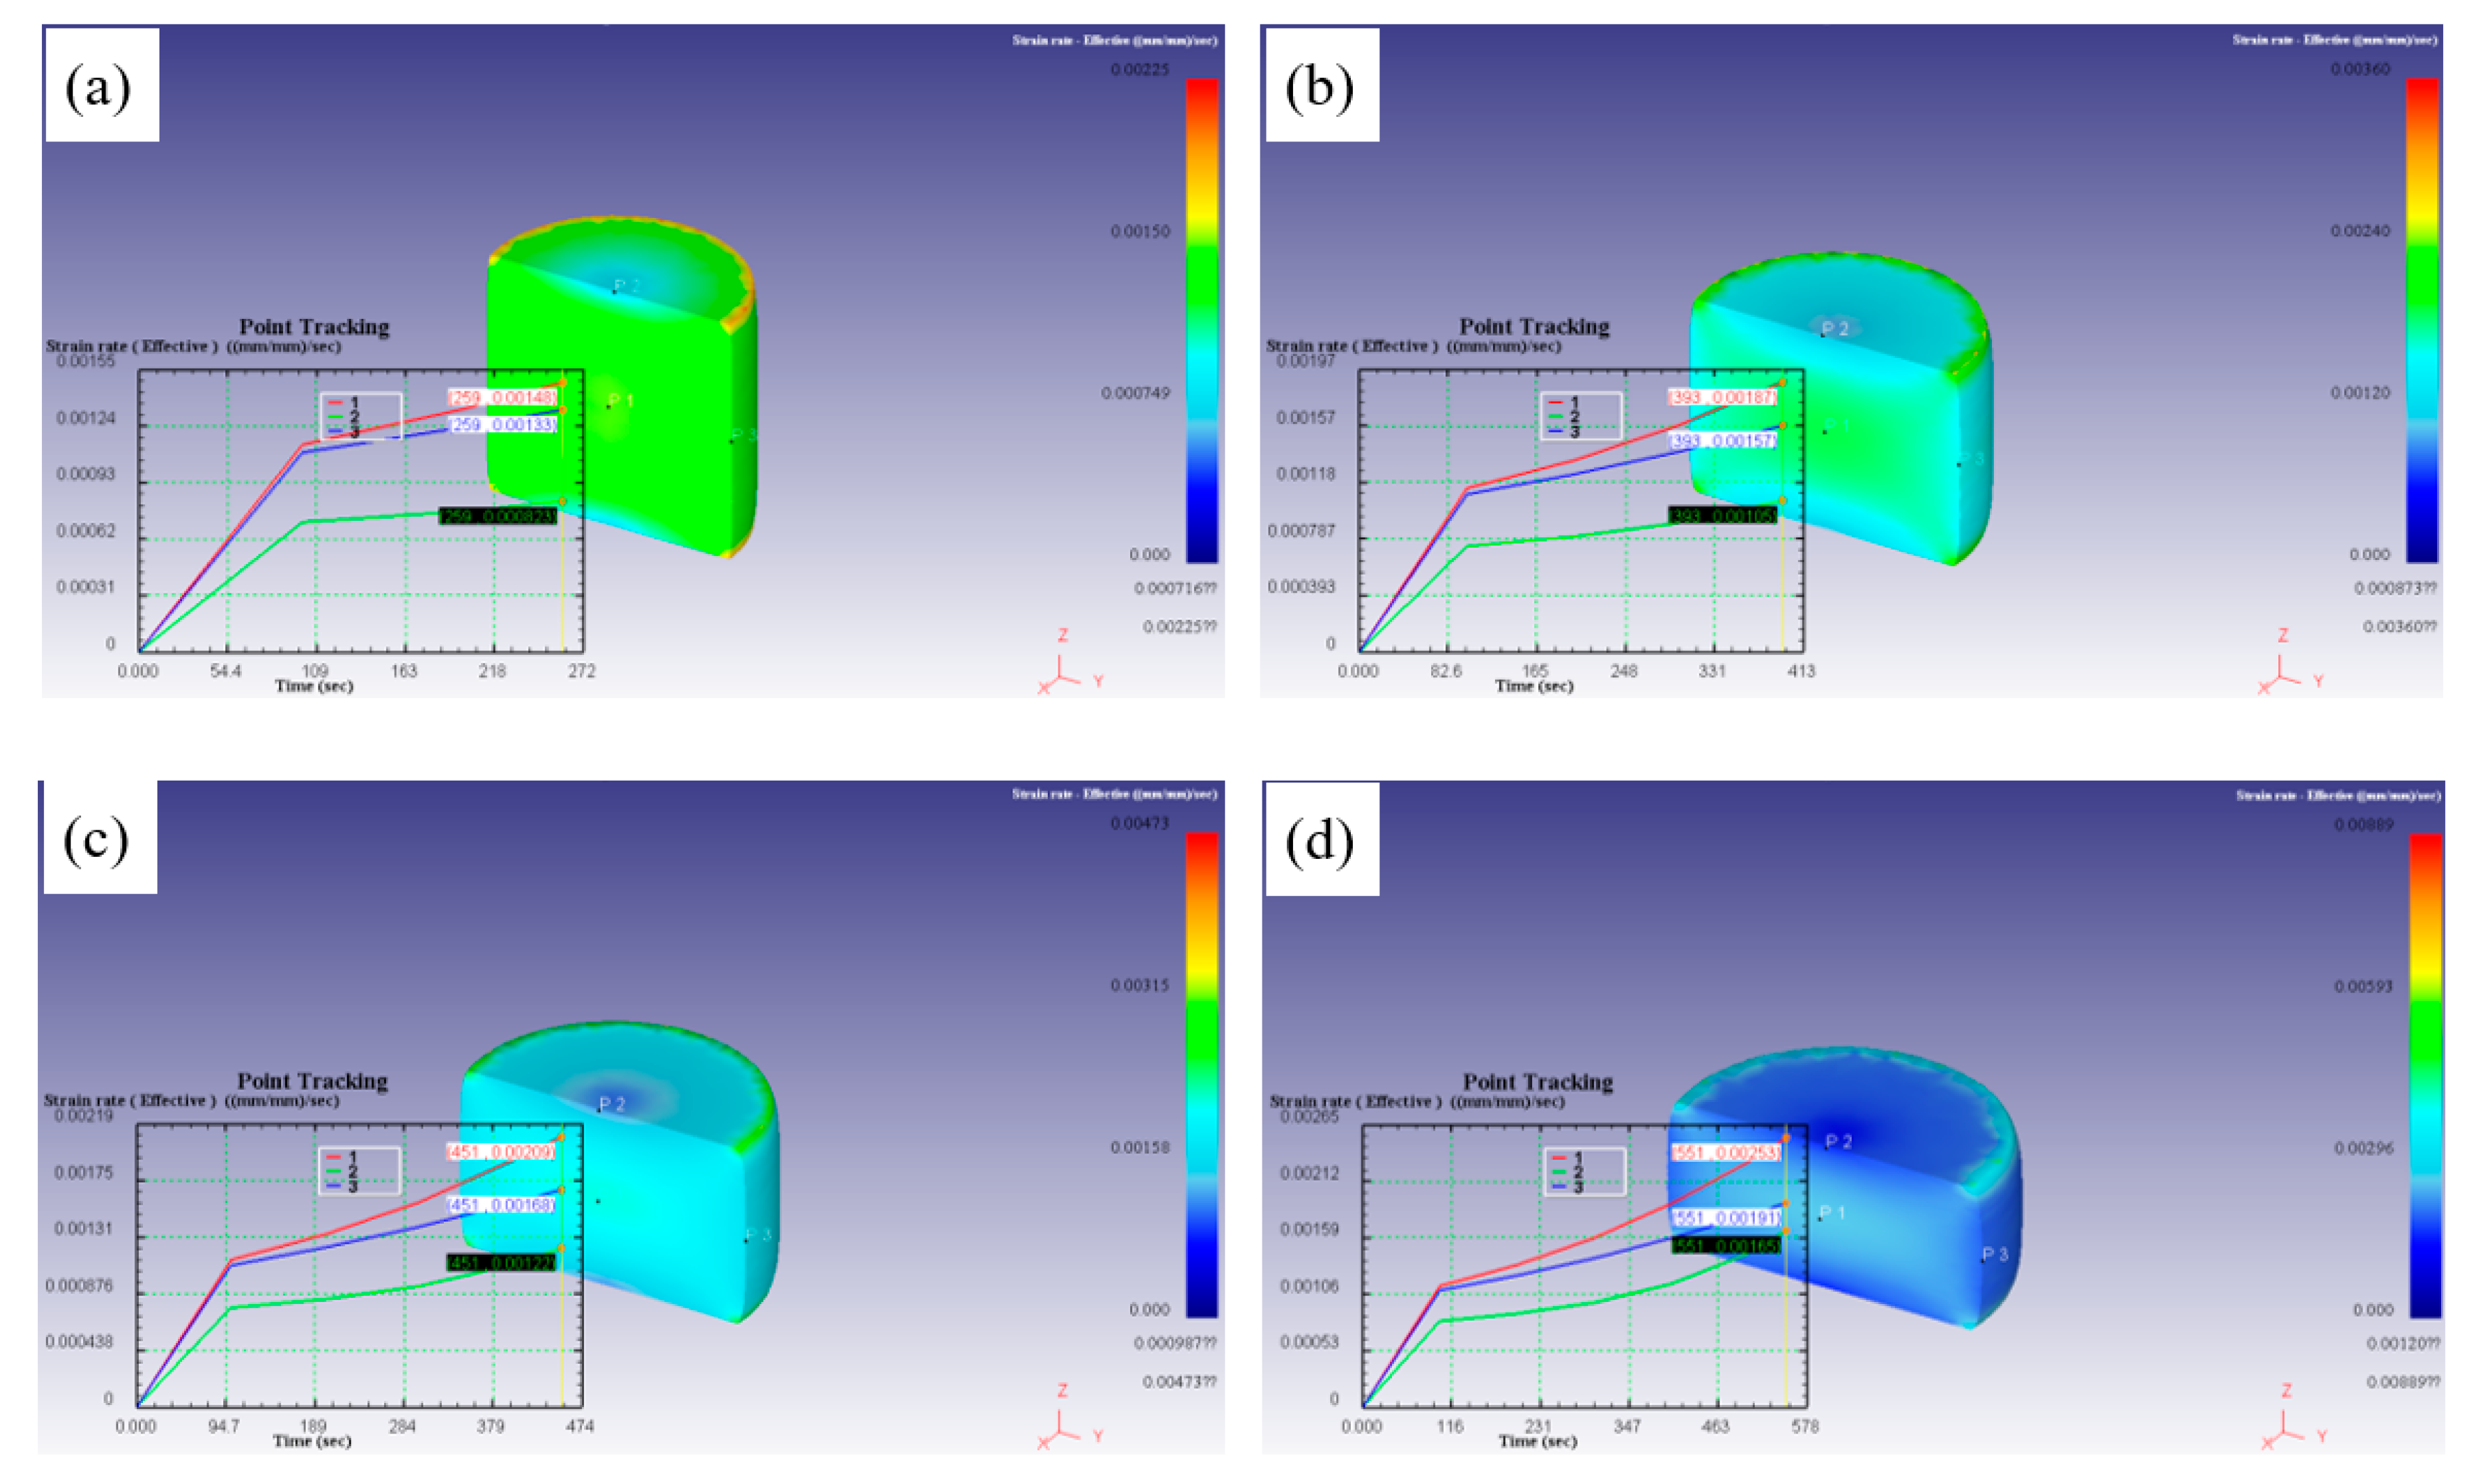
Figure 15.
Effective strain rate field of the deformed samples at 976℃/10s-1: (a) 0.3, (b) 0.5, (c) 0.6 and (d) 0.8.
Figure 15.
Effective strain rate field of the deformed samples at 976℃/10s-1: (a) 0.3, (b) 0.5, (c) 0.6 and (d) 0.8.
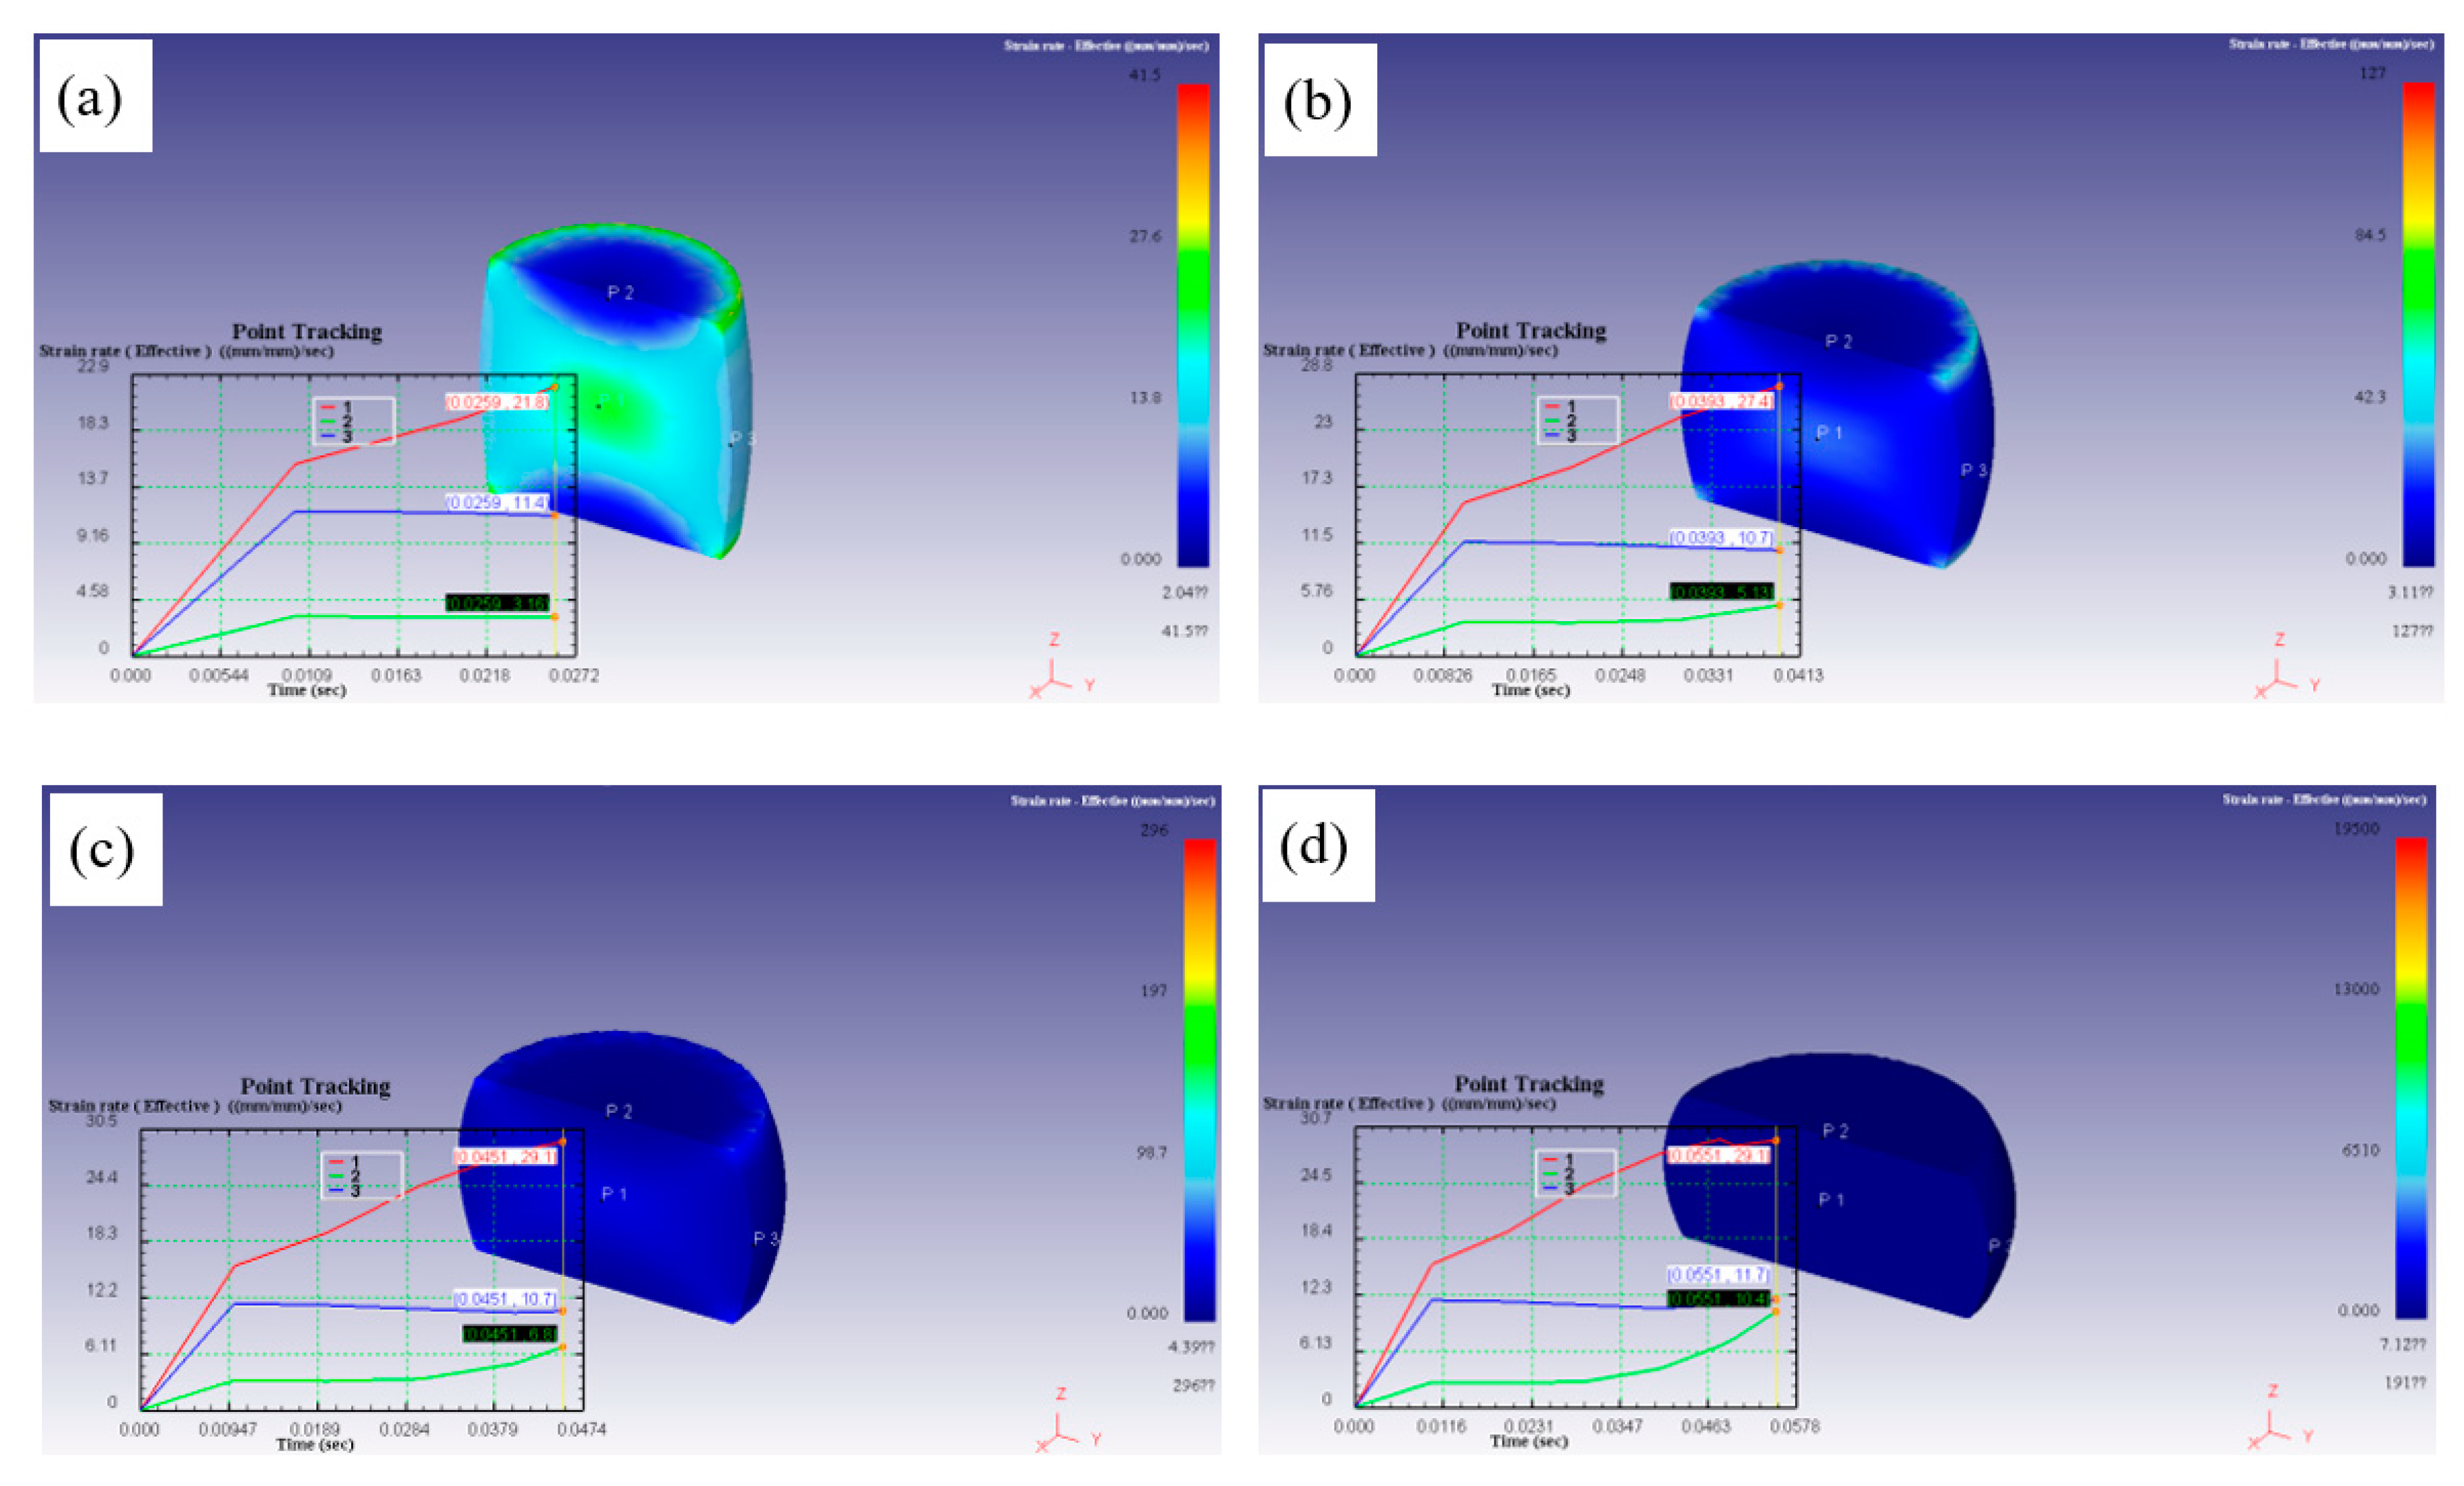
Figure 16.
Effective stress field of the deformed samples at 986℃/0.001s-1: (a) 0.3, (b) 0.5, (c) 0.6 and (d) 0.8.
Figure 16.
Effective stress field of the deformed samples at 986℃/0.001s-1: (a) 0.3, (b) 0.5, (c) 0.6 and (d) 0.8.
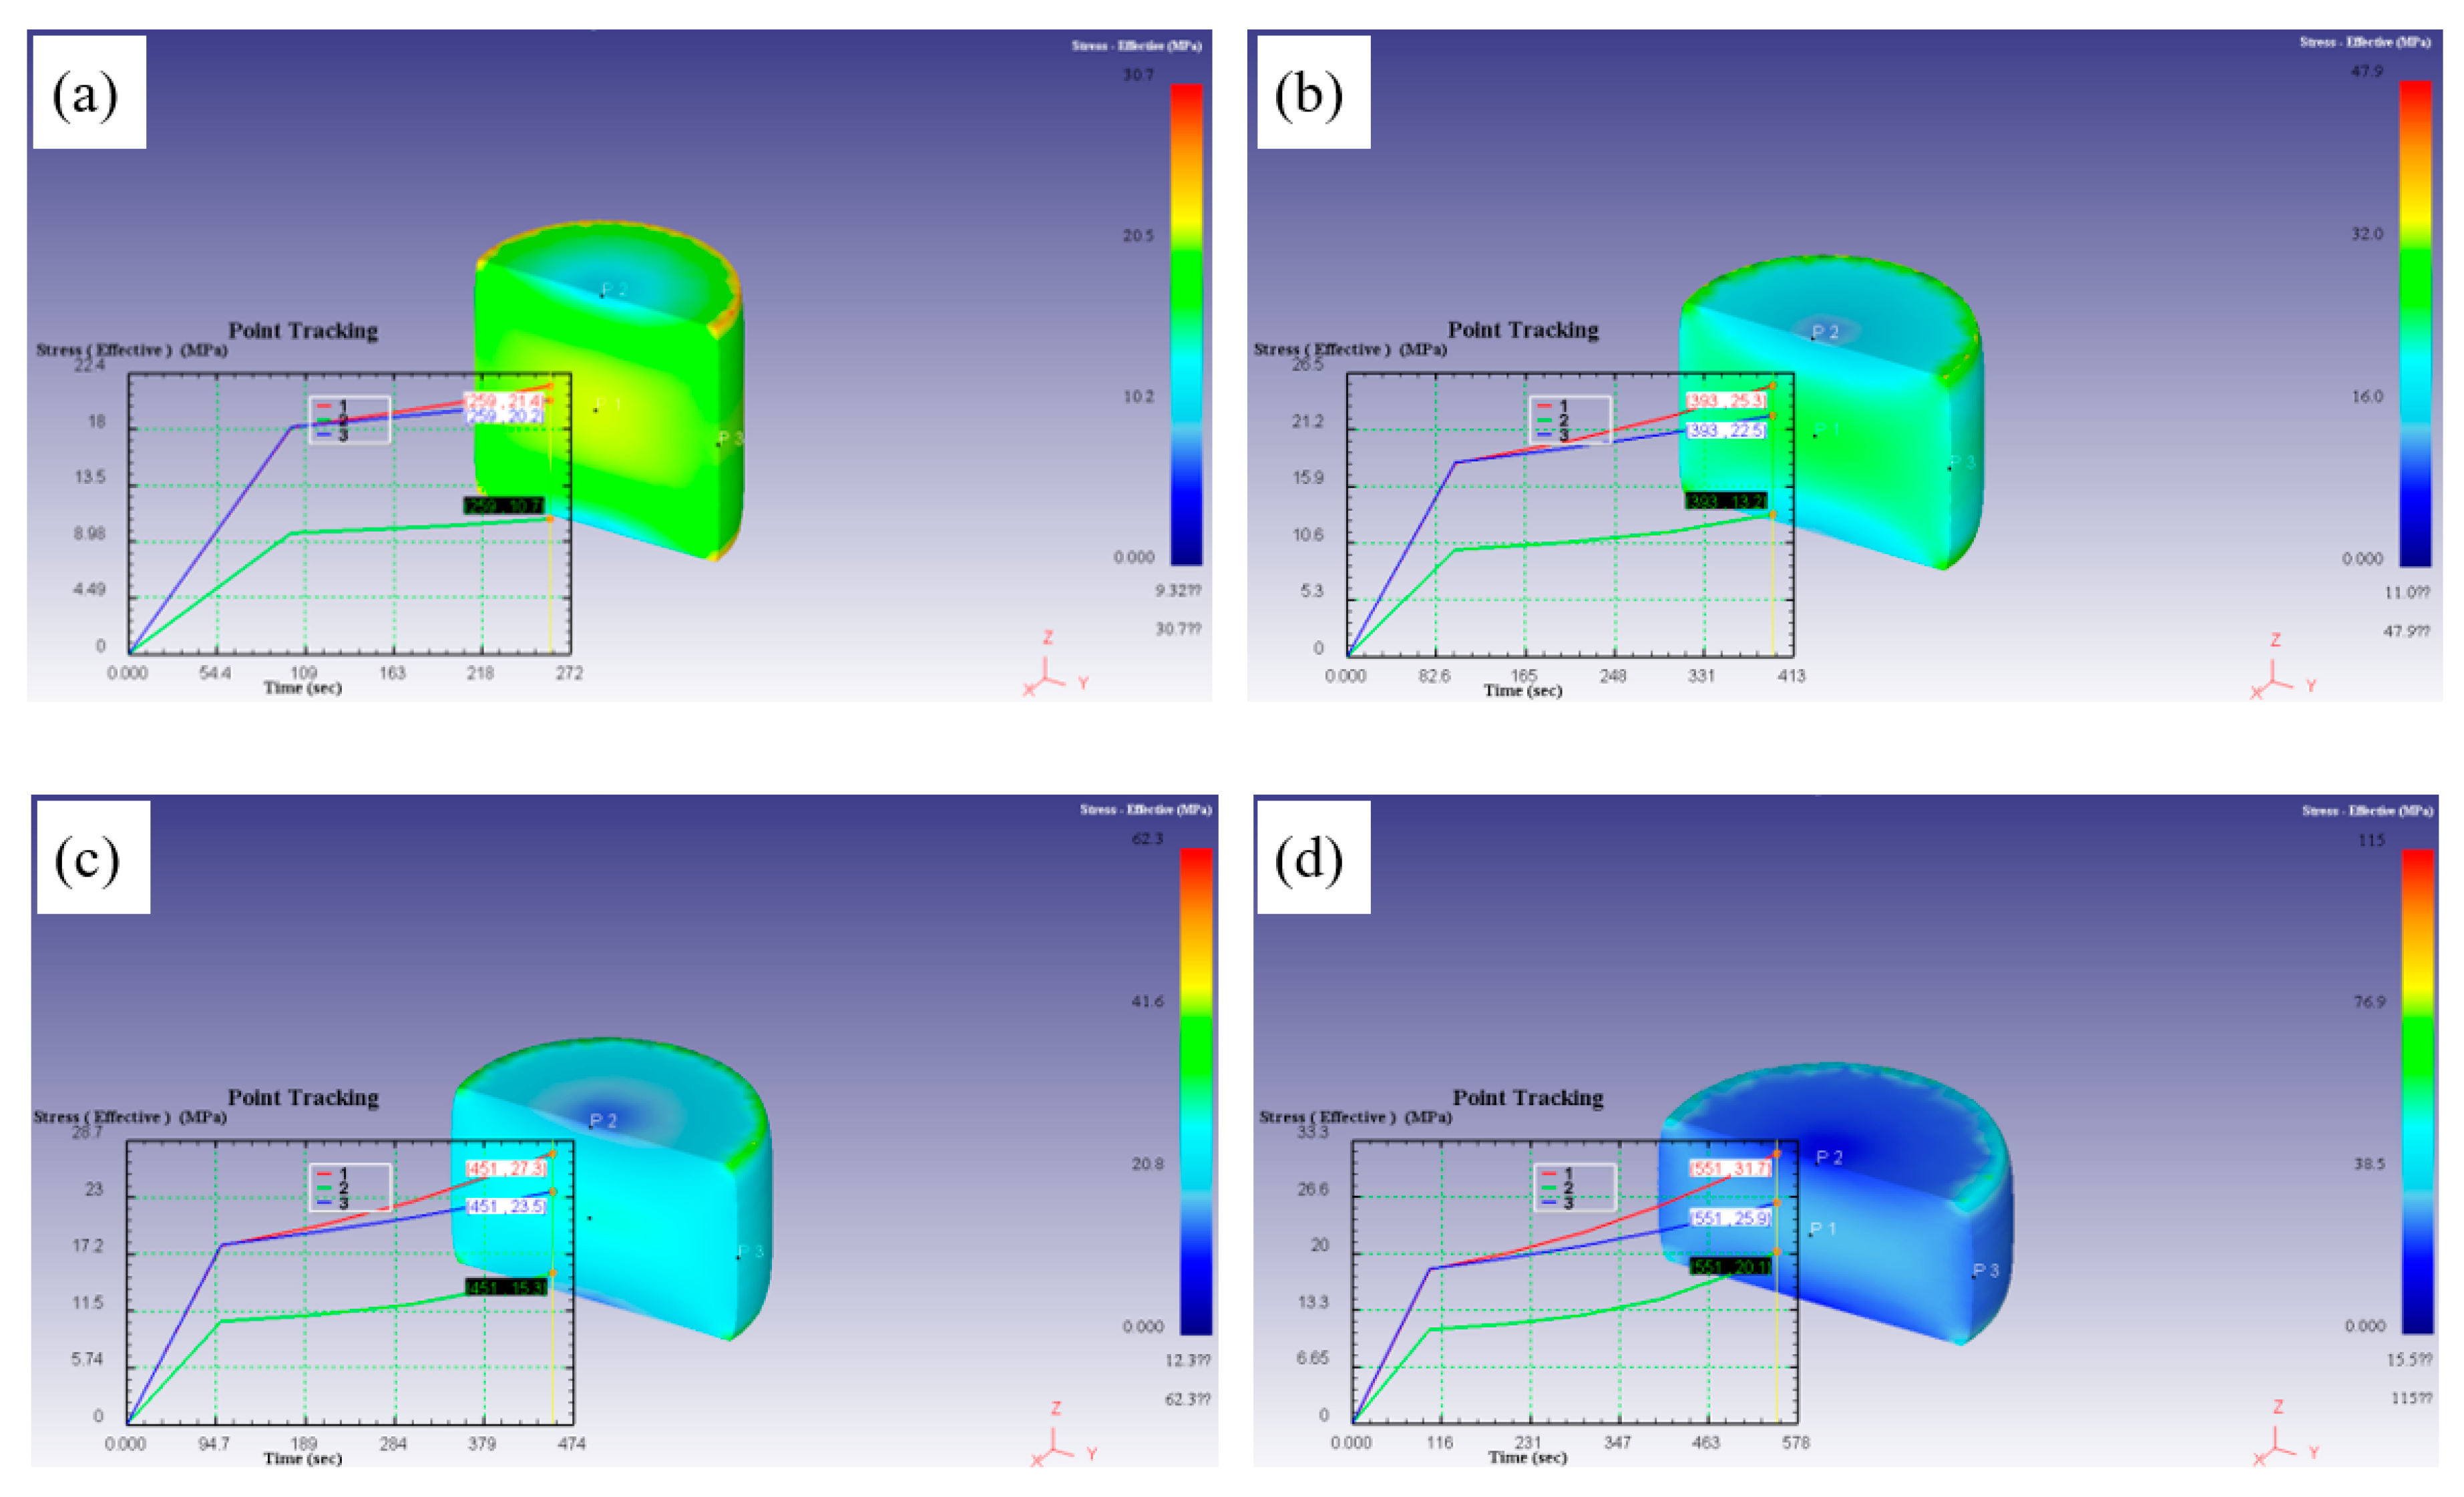
Figure 17.
Effective stress field of the deformed samples at 976℃/10s-1: (a) 0.3, (b) 0.5, (c) 0.6 and (d) 0.8.
Figure 17.
Effective stress field of the deformed samples at 976℃/10s-1: (a) 0.3, (b) 0.5, (c) 0.6 and (d) 0.8.
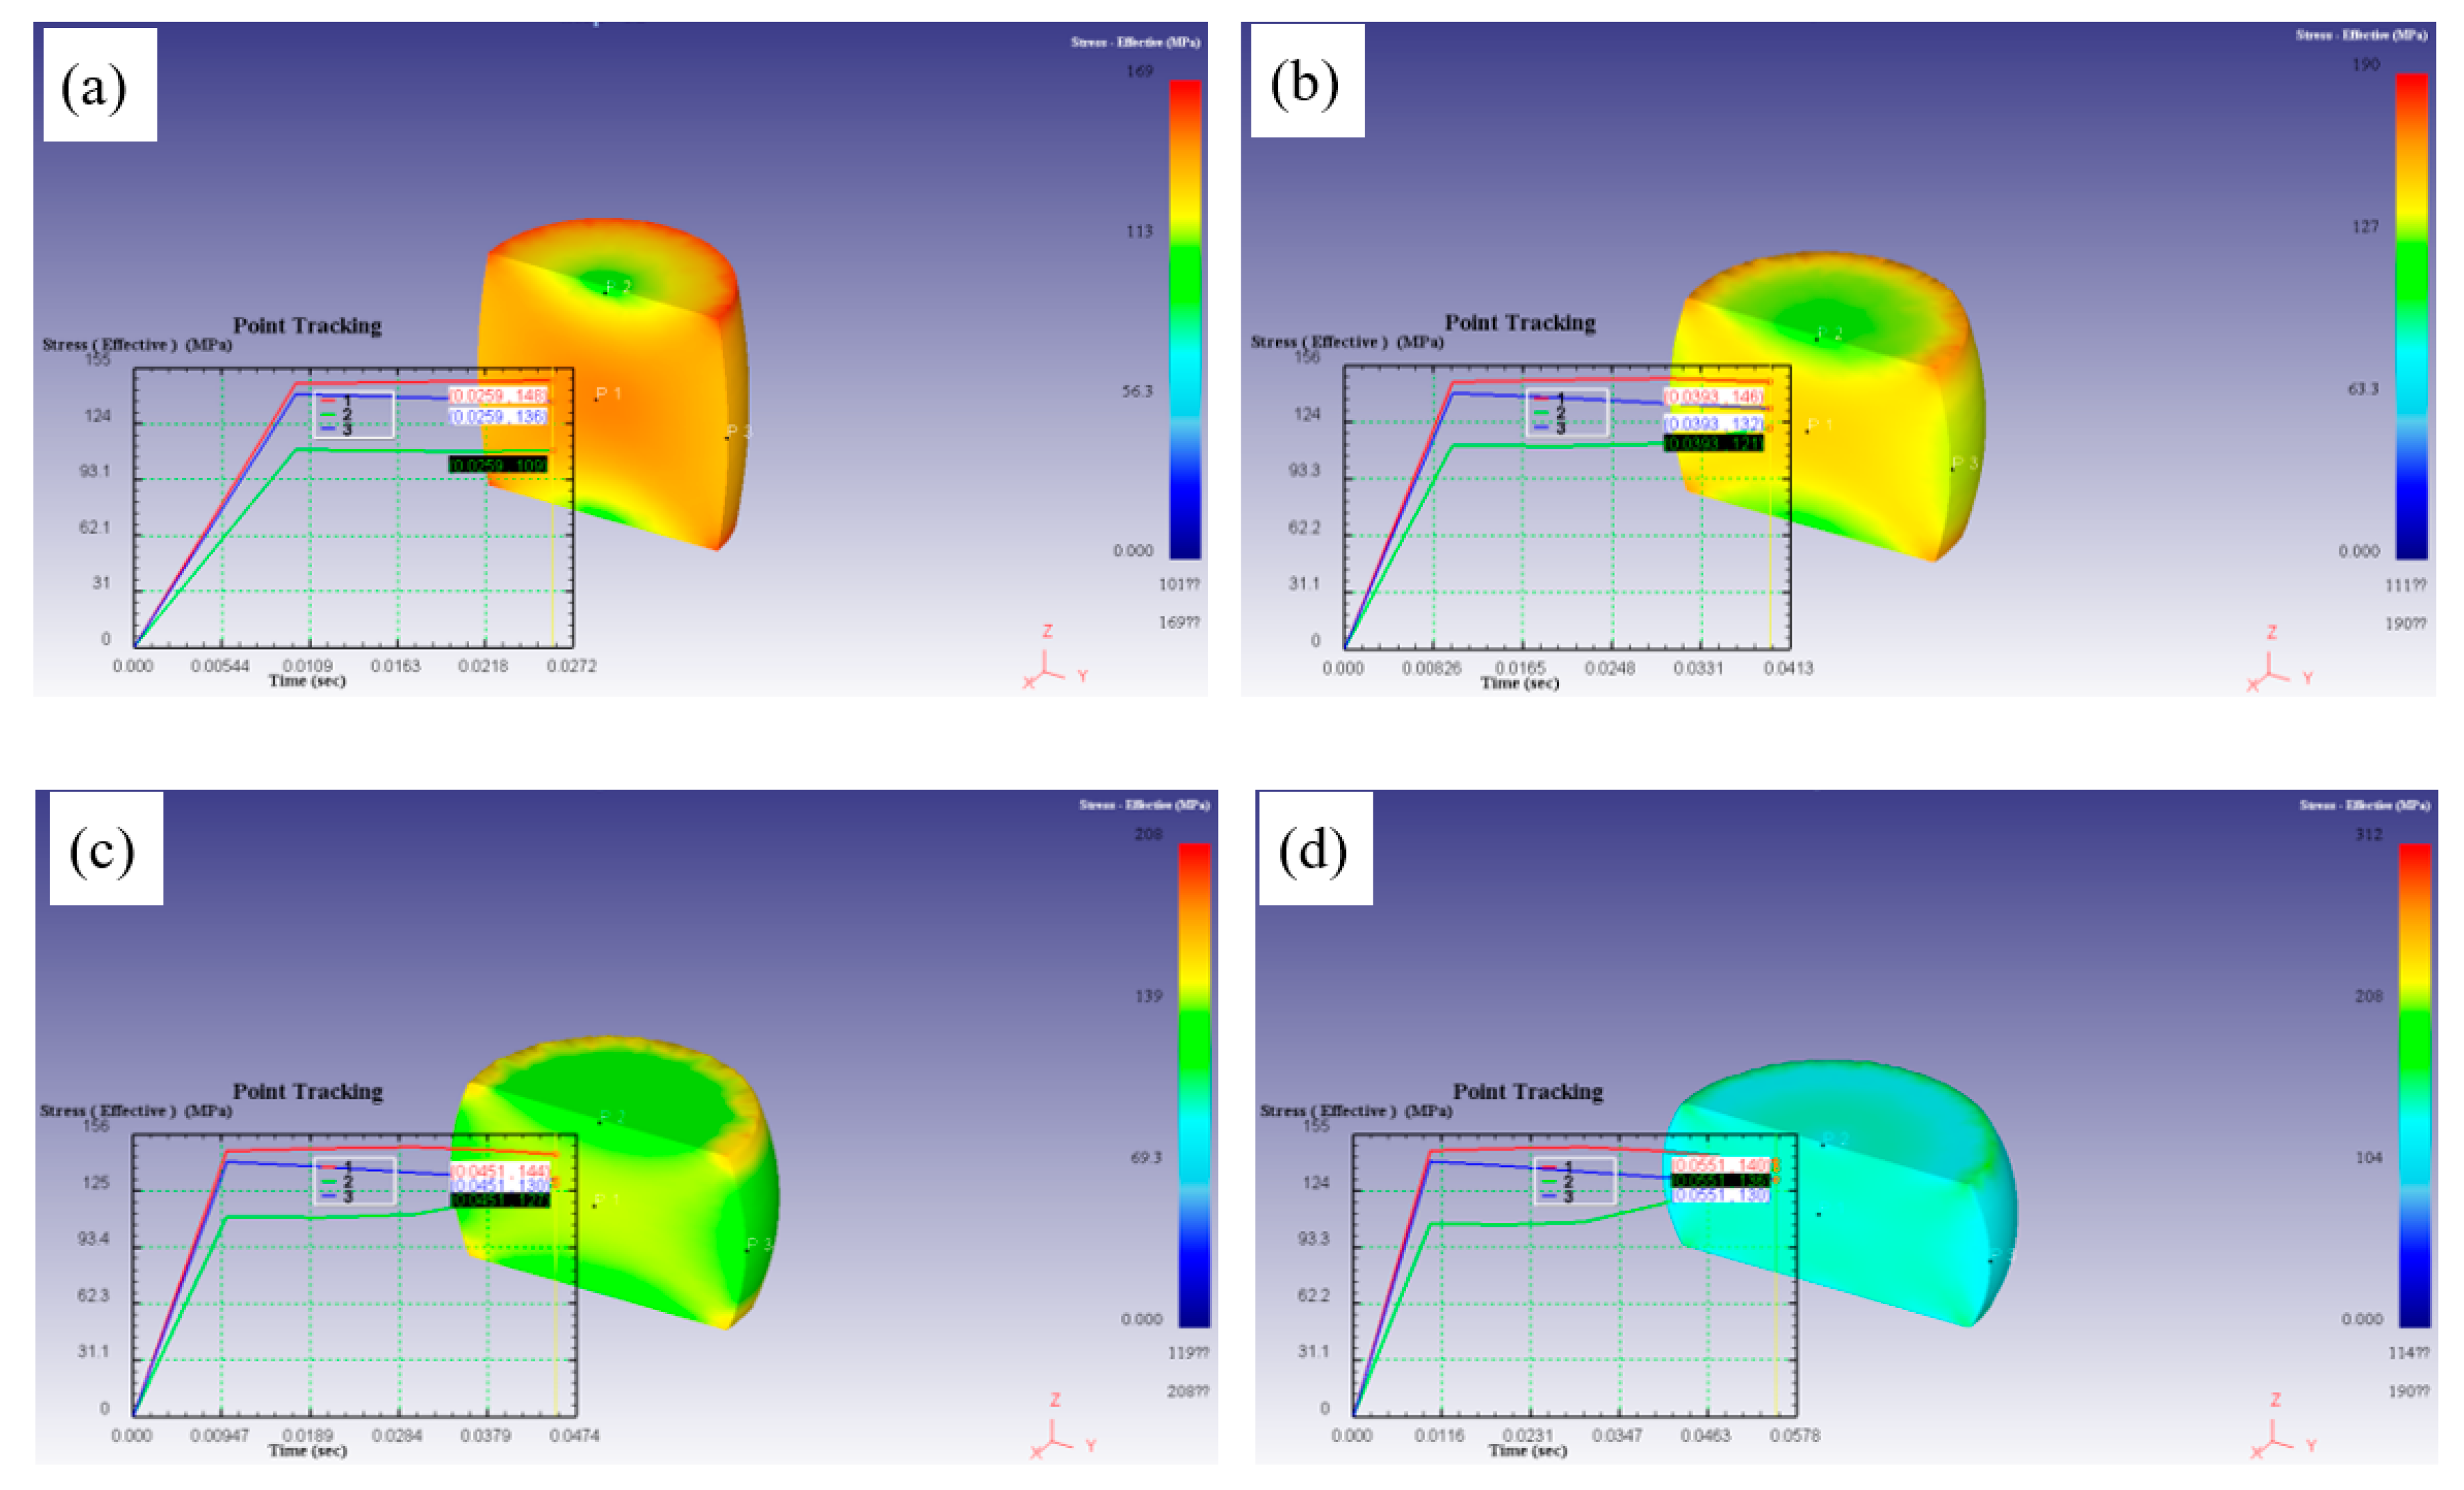

Table 1.
The chemical composition of the samples.
| Element | Al | Mo | Nb | Sn | Zr | Cr | Si | Fe | C | O | N | Ti |
| Content(wt%) | 6.28 | 3.06 | 1.89 | 2.04 | 2.18 | 1.61 | 0.066 | 0.022 | 0.009 | 0.122 | 0.005 | Balance |
Disclaimer/Publisher’s Note: The statements, opinions and data contained in all publications are solely those of the individual author(s) and contributor(s) and not of MDPI and/or the editor(s). MDPI and/or the editor(s) disclaim responsibility for any injury to people or property resulting from any ideas, methods, instructions or products referred to in the content. |
© 2023 by the authors. Licensee MDPI, Basel, Switzerland. This article is an open access article distributed under the terms and conditions of the Creative Commons Attribution (CC BY) license (http://creativecommons.org/licenses/by/4.0/).
Copyright: This open access article is published under a Creative Commons CC BY 4.0 license, which permit the free download, distribution, and reuse, provided that the author and preprint are cited in any reuse.


