Submitted:
06 September 2023
Posted:
07 September 2023
Read the latest preprint version here
Abstract
Reconstructing the Tree of Life remains a central goal in biology. Early methodologies, relying on comparative anatomy or alignments of small numbers of genetic loci, often yielded conflicting evolutionary histories, undermining confidence in the results. Investigations based on phylogenomics, which uses hundreds to thousands of loci for phylogenetic inquiry, often provide a clearer picture of life's history, but certain branches have remained challenging to resolve. Particularly problematic nodes include the root of the animal tree and the relationships among major clades of teleost fish, a group encompassing nearly half of all vertebrates. To address these debates, recent studies tested the utility of an emerging phylogenomic marker: synteny, the conserved collinearity of orthologous loci in two or more organisms. Synteny exhibits compelling phylogenomic potential, while also raising new challenges. We discuss the history of phylogenetics, contentious branches in the Tree of Life, and the use of synteny to address them. We propose five research questions to help guide the use of synteny data in phylogenomic studies. Synteny-based analyses of highly contiguous genome assemblies mark a new chapter in the phylogenomic era and the quest to reconstruct the Tree of Life.
Keywords:
phylogenomics
; synteny
; chromosomes
; long-read sequencing
; tree of life
; orthology
; phylogenetic trees
; incongruence
“A comparison of the different gene arrangements in the same chromosome may, in certain cases, throw light on the historical relationships of these structures, and consequently on the history of the species as a whole.” Dobzhansky & Sturtevant, 1938, Genetics [1].
A (very) brief history of phylogenetics
The field of phylogenetics aims to infer the evolutionary history of biological features such as phenotypes and genes. Arguably, the most ambitious goal in phylogenetics is to reconstruct the entire Tree of Life. Evolutionary histories are often represented as phylogenetic trees, diagrammatic representations of the evolutionary relationships among biological entities. To build phylogenetic trees, diverse data types have been used and our understanding of the Tree of Life has undergone significant transformations with each technological and methodological advance. Early approaches from the mid-1800′s relied on comparative morphology among extant species, where features such as leaves and skeletal structures were analyzed to infer the phylogenies of plants and animals, respectively [2,3,4]. However, morphology-based phylogenies often yielded incongruence (conflicting phylogenetic hypotheses) [5], undermining confidence in the inferred evolutionary histories. Meanwhile, strategies based on biomolecules—such as antigens [6] and hemoglobin crystals [7]—demonstrated potential for phylogenetic inquiry, partly because their similarities and differences could be clearly quantified.
Biomolecules received additional validation as phylogenetic characters through the groundbreaking work of Calvin Blackman Bridges in 1916 and Alfred Sturtevant and Theodosius Dobzhansky in the 1930s. Specifically, Bridges used phenotypic and cytologic analyses of crosses between strains of Drosophila melanogaster to provide unequivocal evidence for the chromosome theory of inheritance [8]. This finding suggested that chromosomes could be used to reconstruct the “stream of heredity [that] makes phylogeny,” as George Gaylord Simpson would later put it [9]. Indeed, in the 1930s, Sturtevant and Dobzhansky successfully reconstructed phylogenetic relationships among populations of Drosophila pseudoobscura, relying on an innovative use of chromosomal inversions [1,10]. This approach involved the generation of hybrids, examination of chromosome pairing in polytene chromosomes from salivary gland cells, and detection of inversions among chromosome pairs (Figure 1B). While robust for the purposes of population-level phylogenetics in Drosophila, the need to generate hybrids limited this analysis to closely related populations and thus posed a significant barrier to the widespread analysis of chromosomal inversions in phylogenetics. Nevertheless, this seminal work demonstrated the potential of DNA—and specifically variation in genome architecture—for phylogenetic inquiry.
Figure 1.
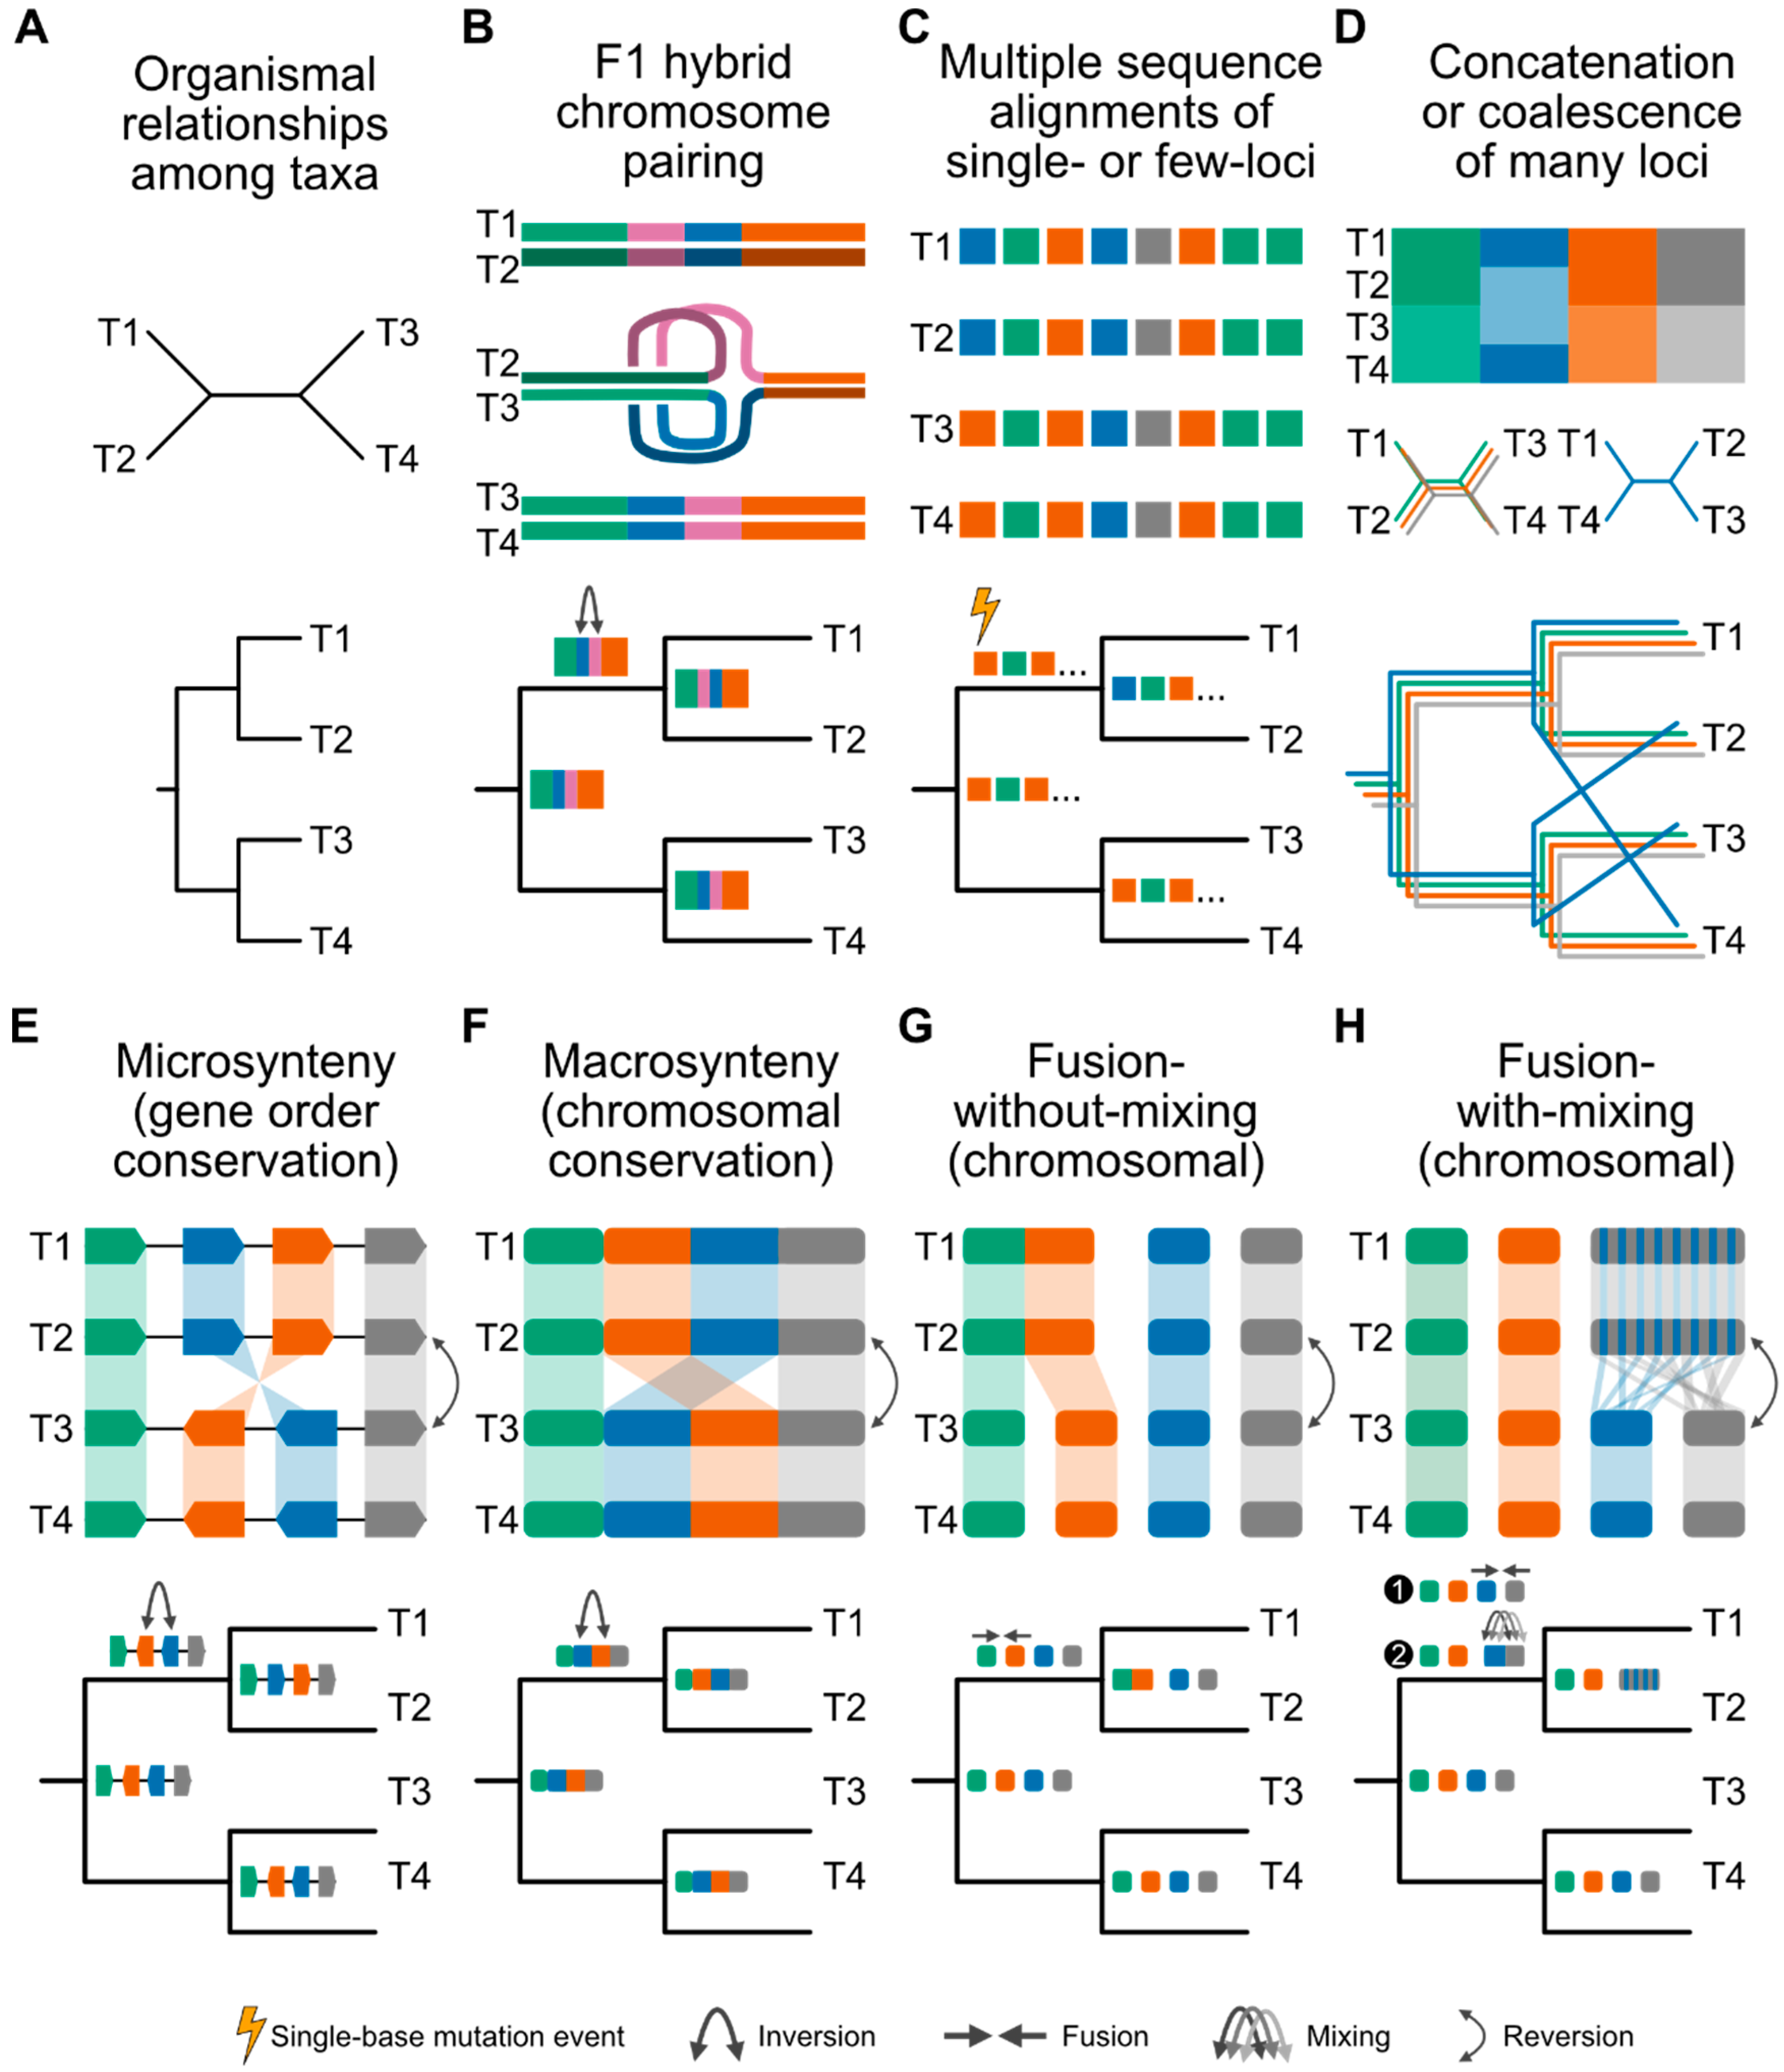
Data types for sequence-based phylogenetics. (A) Consider the relationships among four taxa (represented as T1, T2, T3, and T4) wherein the pairs T1 and T2 and T3 and T4 are sister to one another. These relationships can be depicted in an unrooted (top) or rooted (bottom) phylogeny and be inferred using several data types. For example, (B, top) patterns of chromosome pairing among F1 hybrids will reveal taxon pairs T1 and T2 and T3 and T4 display no evidence of inversions; in contrast, T2 and T3 display evidence of an inversion. (B, bottom) Thus, in a rooted phylogeny, the inversion event occurred in the stem lineage leading up to T1 and T2. (C, top) Multiple sequence alignments of single or few loci can also infer these relationships. (C, bottom) Here, a single-base mutation event occurred in the ancestor of T1 and T2. (D, top) Collections of multiple sequence alignments or (D, middle) single-locus phylogenies can be used to evolutionary histories using concatenation or coalescence, respectively. Here, the green, orange, and grey loci support T1 and T2 as sister taxa whereas the blue locus supports T2 and T3 as sister taxa. (D, bottom) Rooting these phylogenies provides an alternative depiction of how the blue locus support an alternative topology. Among markers of genome architecture (E) microsynteny (gene order), (F) macrosynteny (chromosomal organization), and (G) fusion events without- and (H) with-mixing can be phylogenomic markers. (E, top) In the case of microsynteny, evidence of an inversion may occur between the blue and orange loci, (E, bottom) which happened in the ancestor of T1 and T2. (F) The same phenomenon can happen in the case of macrosynteny. (G, top) Fusion-without-mixing events between two chromosomes may also reflect phylogeny. (G, bottom) In this case, a fusion event may have occurred in the ancestor between T1 and T2. (H, top) Fusion-with-mixing can also be used to recapitulate phylogeny. (H, bottom) Fusion-with-mixing events occur in two steps, as depicted in the ancestor of T1 and T2. First, there is a fusion event. Then, extensive rearrangements occur therein. Note, the evolutionary scenarios at the bottom of panels B, C, E, F, G, and H depict one possible scenario.
Figure 1.
Data types for sequence-based phylogenetics. (A) Consider the relationships among four taxa (represented as T1, T2, T3, and T4) wherein the pairs T1 and T2 and T3 and T4 are sister to one another. These relationships can be depicted in an unrooted (top) or rooted (bottom) phylogeny and be inferred using several data types. For example, (B, top) patterns of chromosome pairing among F1 hybrids will reveal taxon pairs T1 and T2 and T3 and T4 display no evidence of inversions; in contrast, T2 and T3 display evidence of an inversion. (B, bottom) Thus, in a rooted phylogeny, the inversion event occurred in the stem lineage leading up to T1 and T2. (C, top) Multiple sequence alignments of single or few loci can also infer these relationships. (C, bottom) Here, a single-base mutation event occurred in the ancestor of T1 and T2. (D, top) Collections of multiple sequence alignments or (D, middle) single-locus phylogenies can be used to evolutionary histories using concatenation or coalescence, respectively. Here, the green, orange, and grey loci support T1 and T2 as sister taxa whereas the blue locus supports T2 and T3 as sister taxa. (D, bottom) Rooting these phylogenies provides an alternative depiction of how the blue locus support an alternative topology. Among markers of genome architecture (E) microsynteny (gene order), (F) macrosynteny (chromosomal organization), and (G) fusion events without- and (H) with-mixing can be phylogenomic markers. (E, top) In the case of microsynteny, evidence of an inversion may occur between the blue and orange loci, (E, bottom) which happened in the ancestor of T1 and T2. (F) The same phenomenon can happen in the case of macrosynteny. (G, top) Fusion-without-mixing events between two chromosomes may also reflect phylogeny. (G, bottom) In this case, a fusion event may have occurred in the ancestor between T1 and T2. (H, top) Fusion-with-mixing can also be used to recapitulate phylogeny. (H, bottom) Fusion-with-mixing events occur in two steps, as depicted in the ancestor of T1 and T2. First, there is a fusion event. Then, extensive rearrangements occur therein. Note, the evolutionary scenarios at the bottom of panels B, C, E, F, G, and H depict one possible scenario.
The development of Sanger sequencing paved the way for using alignments of DNA sequences from individual loci for phylogenetic inference of more deeply diverged organisms [11,12] (Figure 1C). Genetic loci used for phylogenetics are ideally single-copy orthologs, homologous sequences encoded only once in the genomes of the organisms under study and, presumably, in their last common ancestor [13]. These loci are considered ideal for phylogenetics because they are ostensibly not subject to duplication and loss patterns that can complicate orthology inferences and obfuscate phylogenetic signal.
Although Sanger sequencing was essential for establishing sequence-based molecular phylogenetics, the technology had limitations, such as a relatively short maximum sequence length (<1 kilobase), high cost, and difficulty in scaling up to high-throughput. Moreover, evolutionary histories inferred from one or even a few single-copy orthologs often exhibited incongruence [14,15,16,17,18,19]. Incongruence in these analyses is partly driven by the dearth of phylogenetic information in some highly conserved genetic loci [20]. As a result, analyses of some genes yield multiple phylogenetic hypotheses with near equal support and different algorithms may lead to different “best” trees. The unreliability of a single or few loci for phylogenetic inference has led to frustration mirroring that inspired by morphology-based phylogenies and has undermined efforts to find the “true” tree within the vast forest of potential topologies.
However, with the establishment of whole-genome sequencing, DNA-based markers have taken an even more prominent role in phylogenetics, and hundreds to thousands of loci are frequently used in a total evidence approach (Figure 1D) [21,22]. Two methods for genome-scale “phylogenomic” inference of organismal histories are concatenation, in which a data matrix is analyzed as a supermatrix of individual genes, and coalescence, wherein collections of gene trees are inferred under a framework that accounts for conflict between gene trees and species trees by integrating species divergences with population-level drift and mutation (the multispecies coalescent model) [21,23,24]. Using the coalescent framework, single-locus trees and organismal histories are either co-estimated or collections of single-locus phylogenies are reconciled to a single phylogeny [23]. Phylogenomics has successfully delineated numerous previously problematic branches within the Tree of Life, including the placement of turtles as sister to archosaurs (crocodiles and birds) [25] and eukaryotes within Archaea, suggesting a two-domain Tree of Life [26]. Confidence in these topologies partly stems from independent research groups reproducibly inferring the same evolutionary relationships, while employing different approaches and data. These successes have positioned phylogenomics as the current standard for reconstructing most evolutionary histories. Nonetheless, certain branches, including some concerning critical evolutionary events, have proven recalcitrant and are subject to intense debate.
Current approaches fail to resolve certain branches in the Tree of Life
Resolving the root of the animal tree represents a major challenge. Two hypotheses have garnered significant support: the sponge-first hypothesis, which suggests that sponges were the first lineage to diverge from all other animals and the ctenophore-first hypothesis, which suggests that ctenophores (comb jellies) diverged first (Figure 2A-B) [27,28,29].
Figure 2.
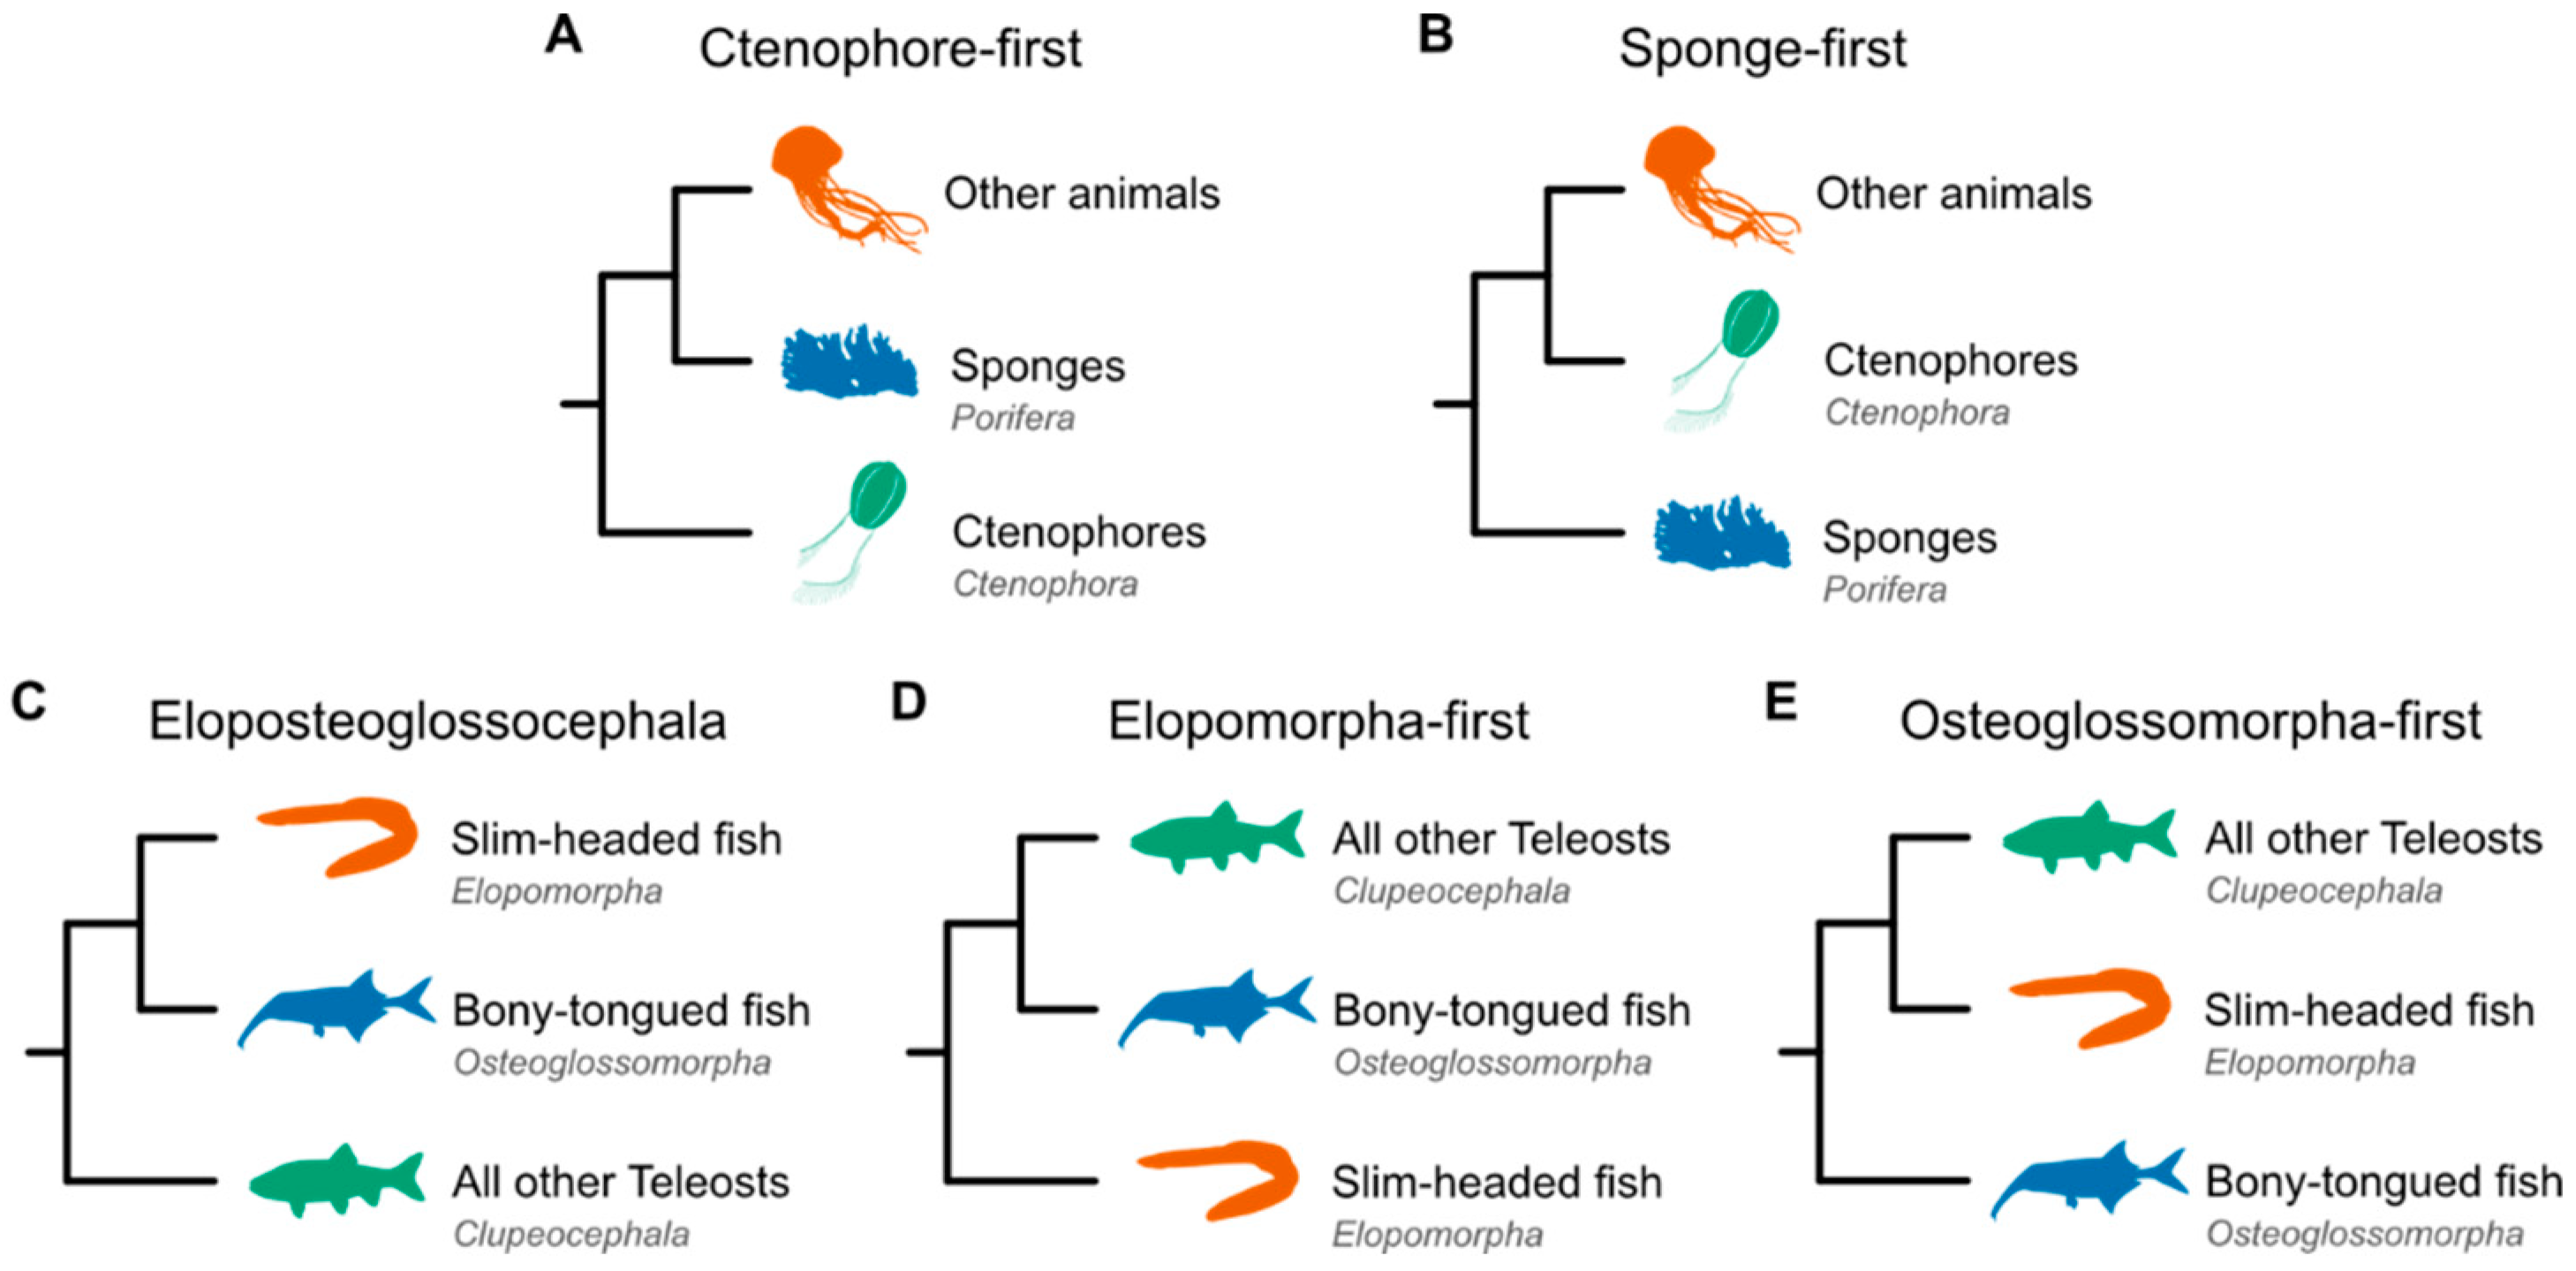
Depictions of the alternate hypotheses for the base of the animal and teleost fish phylogenies. The debate concerning early animal evolution has largely focused on the (A) ctenophore-first and (B) sponge-first hypotheses positing that Ctenophores or Sponges, respectively, diverged first from all other animals. Among teleost fish, the debate centers on the relationships among three major lineages—the Elopomorpha (mostly slim-headed fish), Osteoglossomorpha (mostly bony-tongued fish), and Clupeocephala (all other teleost fish). (C) The Eloposteoglossocephala (EO-sister) hypothesis suggests a sister relationship between slim-headed and bony-tongued fish, whereas the (D) Elopomorpha-first and (E) Osteoglossomorpha-first hypotheses suggest that slim-headed fish or bony-tongued fish, respectively, diverged before the other lineages split from one another. Recent studies that employed synteny as a phylogenomic marker supported the (A) ctenophore-first and (C) EO-sister hypotheses [134,141]. Silhouette images were obtained from PhyloPic (https://www.phylopic.org); all credit goes to their respective contributors.
Figure 2.
Depictions of the alternate hypotheses for the base of the animal and teleost fish phylogenies. The debate concerning early animal evolution has largely focused on the (A) ctenophore-first and (B) sponge-first hypotheses positing that Ctenophores or Sponges, respectively, diverged first from all other animals. Among teleost fish, the debate centers on the relationships among three major lineages—the Elopomorpha (mostly slim-headed fish), Osteoglossomorpha (mostly bony-tongued fish), and Clupeocephala (all other teleost fish). (C) The Eloposteoglossocephala (EO-sister) hypothesis suggests a sister relationship between slim-headed and bony-tongued fish, whereas the (D) Elopomorpha-first and (E) Osteoglossomorpha-first hypotheses suggest that slim-headed fish or bony-tongued fish, respectively, diverged before the other lineages split from one another. Recent studies that employed synteny as a phylogenomic marker supported the (A) ctenophore-first and (C) EO-sister hypotheses [134,141]. Silhouette images were obtained from PhyloPic (https://www.phylopic.org); all credit goes to their respective contributors.
Early studies based on morphology favored the sponge-first hypothesis [30,31]. Support for this hypothesis included the striking resemblance between sponge choanocytes and the closest living relatives of animals, the choanoflagellates. Specifically, both have cells with apical microvillar collars surrounding a single flagellum [32,33]. Sponges also lack certain cell types, including myocytes and neurons, found in many other animals [32,33,34]. Under the sponge-first hypothesis, these cell types evolved after the divergence of sponges from all other animals.
Morphological analyses also argued against the ctenophore-first hypothesis. The soft-bodied jelly structure of ctenophores originally suggested a close relationship to Cnidaria, the phylum that encompasses sea anemones and jellyfish, among other animals [27,31]. These morphological alliances were seemingly corroborated by animal behavior. Modern ctenophores and jellyfish (with few exceptions) feed on other animals, while sponges and choanoflagellates are filter feeders, capturing bacterial prey in their microvillar collar structures [32,35,36]. In addition, the neurons of ctenophores deviate in important ways from the neurons of other animals, leading some to propose that neurons of ctenophores might have evolved independently from those of other animals [34,37]. Thus, resolving these hypotheses impacts inferences about the evolution of animal cell types, development, and behavior.
During the single-locus era of phylogenetics, the sponge-first hypothesis garnered nearly universal support [30,38,39,40]. The dawn of phylogenomics, however, changed the situation, and the first study to support the ctenophore-first hypothesis was published in 2008 [41]. This study used 150 genes and 77 taxa, including two sponges and two ctenophores. The following year, in 2009, the sponge-first hypothesis was supported by a study using 128 genes and 55 taxa, including nine sponges and three ctenophores [42]. Since then, numerous investigations powered by larger datasets, including dozens of ctenophores and sponges, as well as the latest advances in phylogenomic methodologies have provided compelling and contradictory evidence for the two competing hypotheses [27,28,29,42,43,44,45].
Similarly, early branching patterns in the teleost fish phylogeny, representing the largest and most diverse group of extant vertebrates, are intensely debated. Within teleosts, three major clades exist: Elopomorpha (mostly slim-headed fish like bonefish, eels, and skipjacks), Osteoglossomorpha (mostly bony-tongued fish like elephantnose fish, African butterfly fish, and mormyrids), and Clupeocephala (the remaining extant teleosts). The ordering of these clades influences our understanding of osteologic evolution—namely, the number of bone fusion and fission events during the evolution of the pectoral girdle, fins, and anterior vertebrae, for example [46,47,48].
The Osteoglossomorpha-first hypothesis initially emerged in the late 1970s, supported by morphological data [49]. This hypothesis was challenged decades later when analyses of other morphological data or alternative coding schemes for the same morphologies favored the Elopomorpha-first hypothesis [50]. Phylogenetics of some single-locus data further intensified the debate, introducing a third hypothesis suggesting a sister relationship between Elopomorpha and Osteoglossomorpha—the Eloposteoglossocephala (EO-sister) hypothesis—in which the slim-headed and bony-tongued fish are thought to form a sister clade to all other teleosts [51]. In the phylogenomic era, all three hypotheses (Figure 2C-E) have received support. For example, the Elopomorpha-first hypothesis was frequently supported by maximum likelihood and Bayesian analysis of concatenated sequences, while the EO-sister hypothesis was better supported among single-locus trees. In contrast, the Osteoglossomorpha-first hypothesis received less support in the phylogenomic era [52,53,54,55,56,57,58,59,60,61,62]. Challenged by a history of conflict, some have suggested that the base of the teleost fish phylogeny is one of the most important unresolved questions in 21st-century research on ray-finned fish evolution [60].
Although these are only two examples, incongruence within and across phylogenomic studies is prevalent and begs the question: what causes incongruence?
Drivers of incongruence in phylogenetic analyses
Research spanning decades has sought to unravel the biological and analytical factors contributing to incongruence in phylogenetic analyses and develop methods to mitigate them [23]. Biological factors contributing to phylogenetic incongruence include incomplete lineage sorting, introgression/hybridization, horizontal gene transfer, and saturation [23,63,64,65,66,67,68]. Incomplete lineage sorting refers to the random sorting of ancestral polymorphisms, which can sometimes lead to incongruence between allelic and organismal histories (Figure 3A) [69]. To address this challenge, the multispecies coalescent model offers a framework that directly considers incomplete lineage sorting when reconstructing organismal histories [70].
Figure 3.
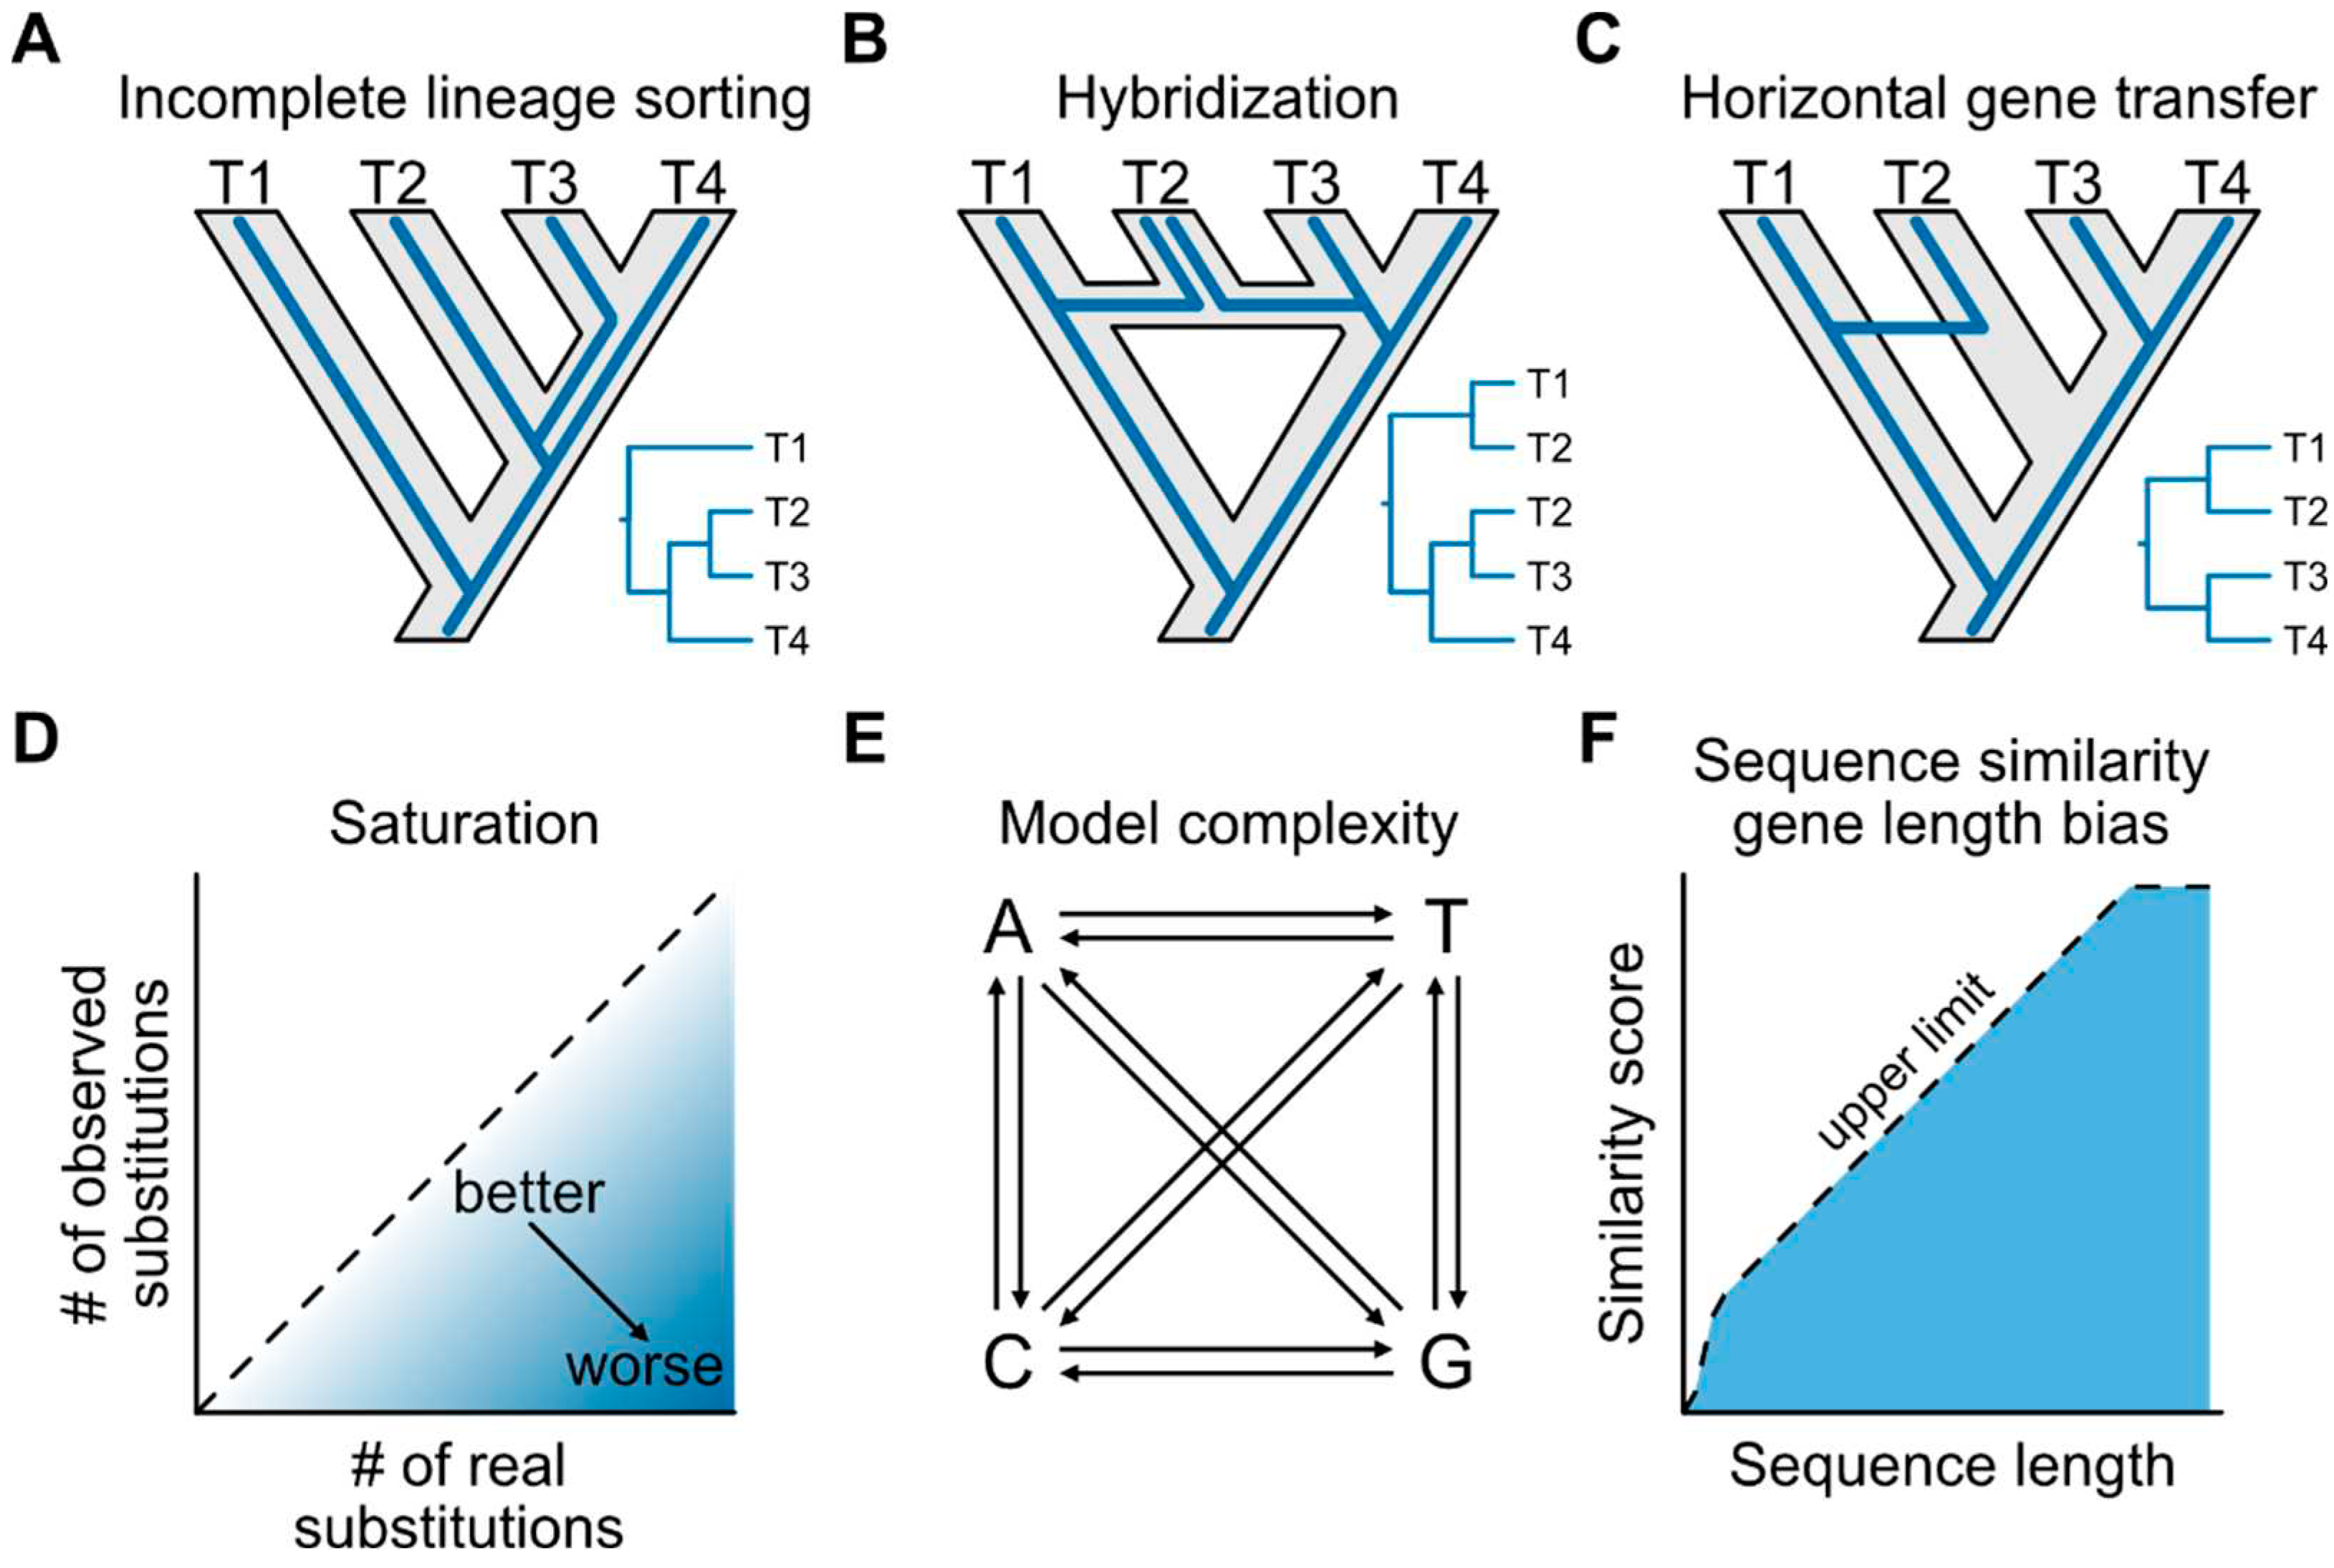
Factors driving phylogenetic incongruence. In panels A, B, and C, the grey phylogeny represents organismal history (commonly referred to as the species tree) between four taxa, represented as T1, T2, T3, and T4. As depicted here, T2 is sister to the pair of taxa T3 and T4; T1 is sister to the lineage encompassing the three others. The blue lines represent a single locus that differs in evolutionary history. An inset depicts the phylogenetic of the single-locus. (A) Incomplete lineage sorting refers to the random sorting of ancestral alleles that can, at times, differ from the species history. (B) Hybridization is also a non-vertical mode of evolution. In some cases, hybridization can give rise to new species; for example, the origin of T2 is from a hybridization event between T1 and T3. In this case, two topologies may be observed. One topology supports a sister relationship between T2 and T3, and the other supports a sister relationship between T1 and T2. (C) Horizontal gene transfer is the transfer of genetic material without sexual reproduction, leading to non-vertical evolution. Here, genetic material is transferred from T1 to T2. (D) Saturation by multiple substitutions occurs when the number of real substitutions exceeds the number of observable substitutions. The dashed line represents a perfect correlation between the number of real substitutions and observed ones. However, the number of real substitutions can exceed the number of observed ones, and the more frequently this occurs in an alignment, the worse saturation will be. (E) Substitution models generalize the exchange rates of different characters in an alignment. Here, arrows depict exchange rates between different nucleotide characters. In the simplest case, these will be the same. In a more complex substitution model, exchange rates may differ between purines and pyrimidines. In the most complex case, each arrow will be given a unique exchange rate. In site-homogeneous substitution models, these rates are applied to the whole alignment. In site heterogeneous models, these rates are applied to each site individually. (F) Gene length biases in sequence similarity scores can contribute to erroneous orthology inference. There is a distinct relationship between sequence length and sequence similarity score wherein longer sequences can have higher sequence similarity scores, whereas smaller ones cannot. The dashed line represents the upper limit of a sequence similarity score a sequence can have. Panels A-D depict biological factors driving incongruence, while panels E and F depict analytical ones.
Figure 3.
Factors driving phylogenetic incongruence. In panels A, B, and C, the grey phylogeny represents organismal history (commonly referred to as the species tree) between four taxa, represented as T1, T2, T3, and T4. As depicted here, T2 is sister to the pair of taxa T3 and T4; T1 is sister to the lineage encompassing the three others. The blue lines represent a single locus that differs in evolutionary history. An inset depicts the phylogenetic of the single-locus. (A) Incomplete lineage sorting refers to the random sorting of ancestral alleles that can, at times, differ from the species history. (B) Hybridization is also a non-vertical mode of evolution. In some cases, hybridization can give rise to new species; for example, the origin of T2 is from a hybridization event between T1 and T3. In this case, two topologies may be observed. One topology supports a sister relationship between T2 and T3, and the other supports a sister relationship between T1 and T2. (C) Horizontal gene transfer is the transfer of genetic material without sexual reproduction, leading to non-vertical evolution. Here, genetic material is transferred from T1 to T2. (D) Saturation by multiple substitutions occurs when the number of real substitutions exceeds the number of observable substitutions. The dashed line represents a perfect correlation between the number of real substitutions and observed ones. However, the number of real substitutions can exceed the number of observed ones, and the more frequently this occurs in an alignment, the worse saturation will be. (E) Substitution models generalize the exchange rates of different characters in an alignment. Here, arrows depict exchange rates between different nucleotide characters. In the simplest case, these will be the same. In a more complex substitution model, exchange rates may differ between purines and pyrimidines. In the most complex case, each arrow will be given a unique exchange rate. In site-homogeneous substitution models, these rates are applied to the whole alignment. In site heterogeneous models, these rates are applied to each site individually. (F) Gene length biases in sequence similarity scores can contribute to erroneous orthology inference. There is a distinct relationship between sequence length and sequence similarity score wherein longer sequences can have higher sequence similarity scores, whereas smaller ones cannot. The dashed line represents the upper limit of a sequence similarity score a sequence can have. Panels A-D depict biological factors driving incongruence, while panels E and F depict analytical ones.
Non-vertical modes of evolution that deviate from a bifurcating tree model also drive incongruence. These evolutionary modes include introgression/hybridization, the interbreeding between distinct lineages or species, and horizontal gene transfer, the transfer of DNA between organisms, independent of sexual reproduction (Figure 3B and 3C) [66,71,72,73,74,75,76]. Loci originating from these non-vertical modes of evolution can often be identified and removed from phylogenomic data matrices before tree inference [64,77,78,79,80]. Alternatively, transfers can be directly modeled, which has proven helpful for studies of bacteria, where horizontal gene transfer is relatively common [63,81,82,83].
Saturation by multiple substitutions can also result in incongruence due to the loss of phylogenetic information [23]. The impact of saturation can be ameliorated by purging phylogenomic data matrices of genes subject to high degrees of saturation. Saturation can be quantified by comparing the number of observed mutations in a multiple sequence alignment and a phylogenetic tree. When multiple sequence alignments underestimate phylogenetic distances, saturation is inferred to be at play [84,85]. Alternatively, character recoding, the practice of grouping amino acids or nucleotides into fewer characters based on similar physiochemical properties, can help combat saturation [84,85,86,87].
Although methods for overcoming some biological sources of error have been developed, knowing when and how to implement them can be challenging. Moreover, some issues may prevail despite best efforts to ameliorate them. For example, saturation likely afflicts any dataset of anciently diverged organisms. More broadly, detecting factors contributing to incongruence among ancient lineages is inherently challenging, making it difficult to account for them.
Analytical drivers of incongruence in phylogenetic analyses can be broadly categorized into three main groups: systematic, stochastic, and treatment errors [23]. Systematic errors encompass inadequate substitution models, which are meant to generalize rates of nucleotide or amino acid substitutions (Figure 3E) [23]. The simplest substitution models use equal character frequencies and substitution rates between them (e.g. the Jukes-Cantor model [88]), but often lack biological realism. More complex substitution models that account for variation in character frequencies and substitution rates can overcome insufficient model complexity but may suffer from relying on unsubstantiated assumptions about evolutionary processes [25,89,90].
Systematic errors can also stem from erroneously inferred orthology relationships between loci in different species [23]. These errors can stem from gene length biases in sequence similarity scores. Specifically, longer sequences have lower average expectation values and higher bitscores (Figure 3F), resulting in the inappropriate exclusion of some short sequences from groups of orthologs due to insufficient similarity scores [91,92] and the inclusion of long sequences that are not true orthologs. Correcting sequence similarity scores by sequence length can at times overcome these issues.
Although many sources of error have been uncovered and, in some cases, corrected, inaccuracies remain partly because of the intrinsic difficulty of algorithmically describing biological processes. For example, while clustering genes into groups of orthologs, users must define an inflation parameter, which impacts the “tightness” of inferred clusters; overly stringent or relaxed values may result in the over-splitting or incorrect joining of genes into groups of orthologs [93,94].
Stochastic errors arise from inadequate taxon and locus sampling [95,96,97,98]. Expanded genome or transcriptome sequencing efforts can address limited taxon sampling. Limited locus sampling can be overcome by using more loci, which can be obtained by identifying subgroups of single-copy orthologs nested within multi-copy gene families and/or pruning species-specific paralogs [99,100,101].
Treatment errors stem from undue data treatment resulting in, for example, loss of phylogenetic signal [23]. These treatments include excessive trimming of multiple sequence alignments [102,103]. Alignment trimming strategies focused on retaining informative sites can mitigate these errors [103]. Similarly, character recoding can sometimes worsen phylogenetic inferences in simulated conditions [86,87], likely due to the loss of information stemming from a reduced character alphabet [23].
These examples illustrate how biological and analytical errors can complicate every step in a phylogenomic workflow [23]. Moreover, each dataset is challenged by a unique combination and severity of these drivers of incongruence. For example, examining ancient divergences presents unique challenges compared to population-level phylogenomics. As a result, accounting for these errors is often done ad hoc, and designing independent measures to support certain analytical design choices can be difficult. Mirroring this challenge, it is impossible to design a single phylogenomic workflow capable of accounting for all sources of error in all datasets.
Despite ongoing efforts to account for diverse sources of incongruence, the base of the animal tree and early branching patterns among teleost fish remain unresolved [27,28,29,41,104]. This is particularly perplexing because conflicting results have been reported even after employing rigorous workflows that account for diverse drivers of incongruence. As a result, these findings have, at times, sparked ideological divisions supporting different best practices [45,89,104,105]. For example, much of the root of the animal tree debate revolves around the most appropriate substitution models [28,29,44]. More specifically, analysis of the same dataset using varying substitution model complexity revealed that the most highly parameterized models often support the sponge-first hypothesis [44]. Similarly, outgroup choice impacts support for the root of the animal tree, with broader outgroup taxon sampling that includes the unicellular opisthokonts and fungi tending to support the ctenophore-first hypothesis [44]. Among teleost fish, the degree of sequence divergence impacts inference. Specifically, the EO-sister hypothesis is supported by faster-evolving sequences, whereas studies using slower-evolving ultra-conserved elements support the Elopomorpha-first hypothesis [54,55,57,61]. Taken together, these observations demonstrate how tree inference can be sensitive to decisions about how data are collected and analyzed. Proponents of the competing hypotheses present compelling evidence to support their proposed methods, further intensifying the controversy.
Rare genomic changes as phylogenomic markers
Amidst these ongoing debates, the value of other phylogenetic markers, such as rare genomic changes, was explored [106]. For example, phylogenetic distributions of insertions and deletions, gene duplications and losses, and alternative genetic codes often mirror the inferred evolutionary relationships among major vertebrate, insect, fungal, and related lineages [107,108,109,110]. Early studies underscoring the promise of these phylogenetic markers were primarily conducted before widely available whole-genome sequences. The absence of comprehensive sequence data and algorithms necessary for systematically evaluating the phylogenetic value of these genomic variants stymied progress. Furthermore, multiple cases of convergence among rare genomic changes were brought to light. For example, convergent losses of gene duplicates have been repeatedly observed [90]. Similarly, genetic recoding of the CUG codon from Leucine to Serine in Saccharomycotina fungi (a subphylum of budding yeast that includes baker’s or brewer’s yeast) occurred twice independently [111]. Convergence can also be observed among structural genomic features. Distributions of mitochondrial genome size, structure, and content (e.g., intragenic spacers and open reading frames) are similar among Placozoa, chytrid fungi, and choanoflagellates [112]. Notably, this case of convergent mitochondrial genome evolution would suggest Placozoa diverged from all other animals first—a hypothesis largely refuted by phylogenomic analyses of nuclear genes [28,29,113].
Despite instances of convergence that could mislead tree inference, studies of dozens to hundreds of genomes have uncovered several examples of rare genomic changes that recapitulate phylogeny. For example, copy number variants (duplicated or deleted loci) can mirror population structure in humans [114]. This observation has also been observed in populations of several other species [115,116,117]. Gene presence-absence polymorphisms can also reflect phylogeny. For example, lineage-specific gene duplication and loss events have been detected in humans [118]. Similarly, two lineages in the bipolar budding yeast genus Hanseniaspora can be discriminated by differential degrees of gene loss [110]. Of note, these examples concern more recent divergences among lineages. Another example is the single genetic recoding event of CUG to alanine and serine, rather than leucine, in a monophyletic lineage of yeast [119]. Taken with the previous examples, these observations underscore the need to systematically evaluate rare genomic changes as phylogenomic markers for ancient divergences.
Synteny emerges in the phylogenomic era
As abundant genome assemblies have become available, algorithm development has followed suit. User-friendly software has enabled the detection of collinear DNA sequences in genomes from related organisms [120,121,122,123], thereby streamlining robust orthology inference [21] and analyses of chromosome evolution (macrosynteny) and local gene order (microsynteny; Figure 1E and F). Although there is no widely accepted consensus for what differentiates macro- from micro-synteny, macrosynteny typically refers to hundreds to thousands of collinear genes, at times spanning whole chromosomes, whereas microsynteny typically concerns only a handful of genes [124].
A major molecular mechanism driving syntenic variation includes unequal crossing over during homologous recombination [125]. Genomes with multiple copies of similar sequences, like transposable elements in plant genomes, can be particularly prone to unequal homologous recombination [126]. Similarly, recombination between highly similar but nonallelic sequences (nonhomologous recombination) can also result in major mutational events, such as recurrent deletions or duplications [127]. Whether each mechanism results in a macro- or micro-syntenic change largely depends on the spacing between recombinant regions. Other error-prone DNA repair mechanisms—including nonhomologous end joining—can result in syntenic changes [128].
Studies of macro- and micro-synteny have led to several findings. For example, angiosperms exhibit faster evolutionary rates at the scales of macro- and micro-synteny compared to mammals and Saccharomycotina yeast [129,130]. Macro- and micro-synteny can also undergo distinct evolutionary trajectories. Among Saccharomycotina species, macro-synteny rapidly degrades compared to in animals, whereas the rate of micro-synteny decay is similar in both lineages [130]. This finding suggests that Saccharomycotina chromosomes rapidly evolve, but local gene order is more conserved. Thus, ancestral state reconstructions of ancient Saccharomycotina chromosomes would be inherently more difficult than local gene order compared to reconstructions of animal chromosomes.
This analysis also allowed examination of the relationships among shared syntenic blocks and the evolutionary history of a lineage inferred using concatenated multiple sequence alignments. In a data set of 120 yeast, nearly 99% of the detected microsyntenic blocks shared more syntenic blocks than expected by random chance, [130], reinforcing the notion that synteny can reflect phylogeny [131]. Subsequent developments in software and bioinformatic pipelines, vetted through simulations and examinations of empirical data, have facilitated the inference of organismal histories based on syntenic blocks [132,133]. Although promising, these studies primarily focused on establishing the utility of synteny through proof-of-principle approaches—that is, reevaluating well-established relationships or using simulated scenarios. Applying these methodologies to address Tree of Life debates has been a more recent development.
Synteny brings fresh perspectives to Tree of Life debates
Reconstruction of ancient gene linkages by Schultz et al. has brought new data to bear on the sponge- versus ctenophore-first debate at the base of the animal Tree of Life [134]. This study relied on a new ensemble of genome assemblies among select sponges, ctenophores, bilaterians, cnidarians, and three outgroup taxa—a choanoflagellate (Salpingoeca rosetta), a filasterean (Capsaspora owczarzaki), and an ichthyosporean (Creolimax fragrantissima). Although detecting synteny is complicated by chromosomal rearrangements across deep time, comparative analyses identified syntenic blocks conserved between outgroup and metazoan taxa; 29 and 20 syntenic blocks were shared between metazoans and the filasterean or choanoflagellate, respectively. Notably, all 20 syntenic regions identified in the choanoflagellate were also present in the filasterean. The detected syntenic blocks were grouped into three categories: no fusion, fusion-without-mixing, and fusion-with-mixing (Figure 1G and H). “No fusion” refers to syntenic blocks that remained on separate chromosomes; “fusion-without-mixing” refers to when the chromosomes harboring two syntenic blocks fuse into a single chromosome; and “fusion-with-mixing” refers to chromosomal fusion followed by rearrangements that cause the syntenic blocks to overlap.
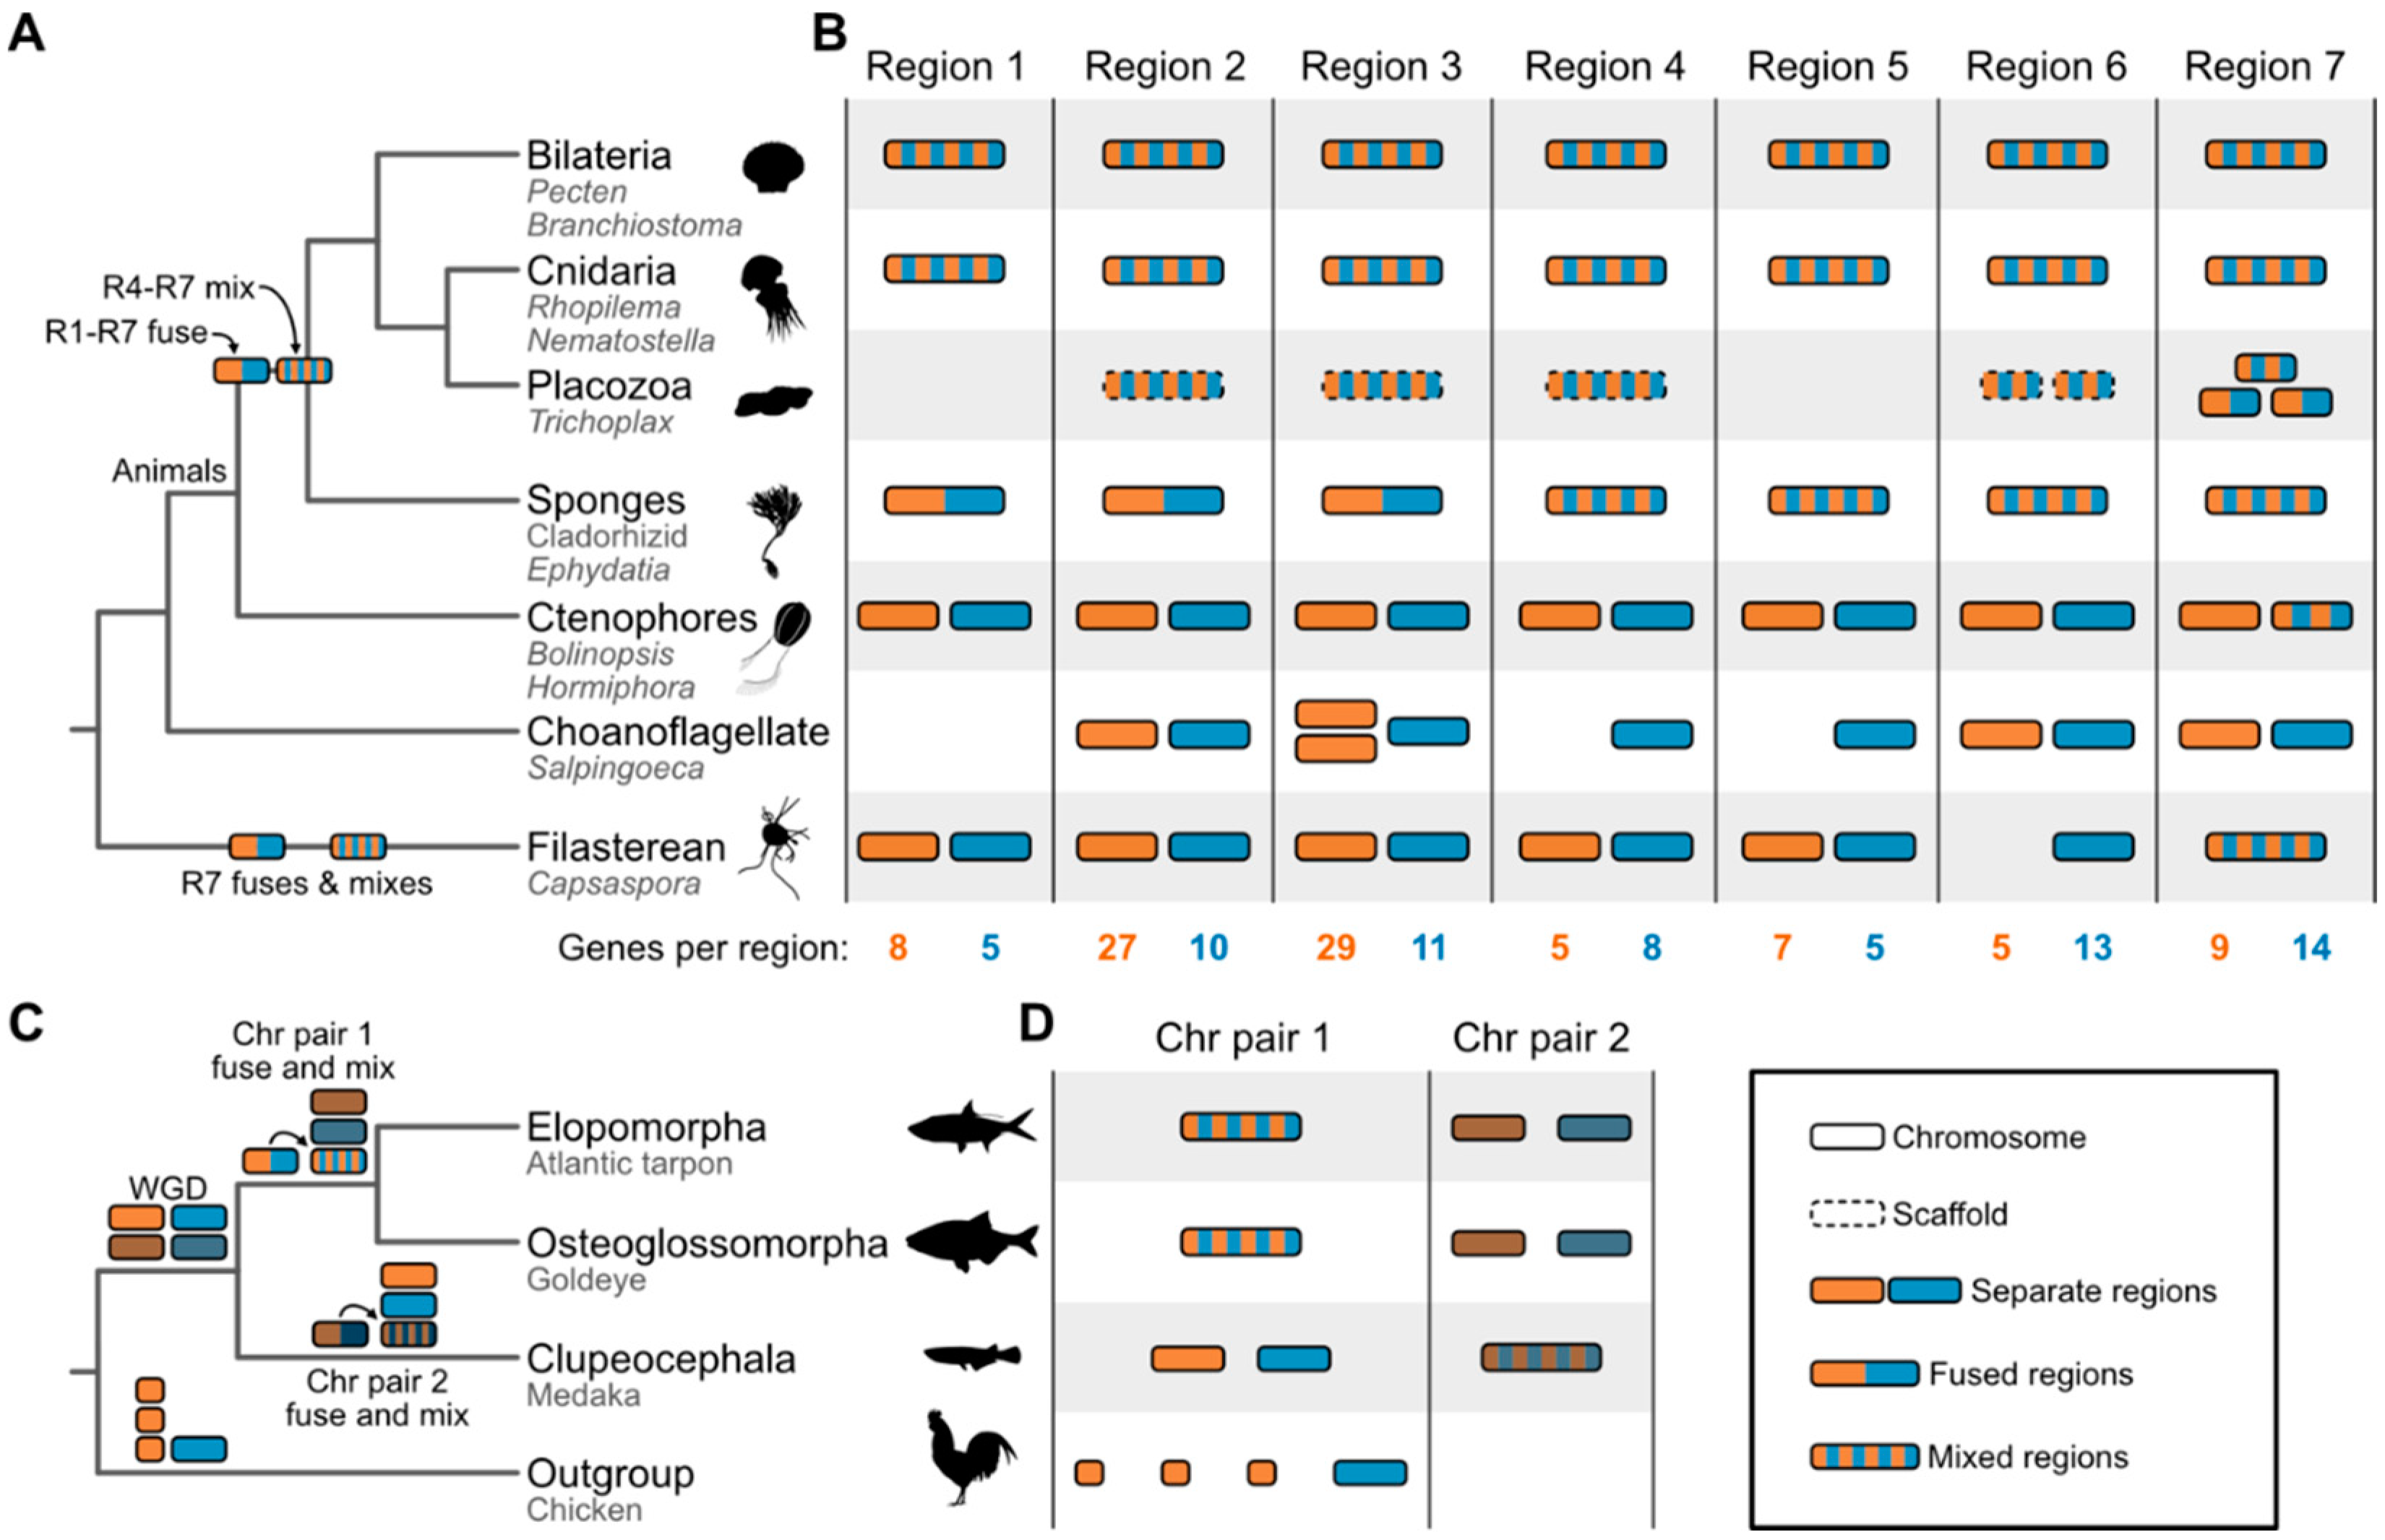
A codified matrix of fusion events was used for phylogenetic inference in a Bayesian framework. To account for the improbable unmixing event (i.e., reversal of a fusion-with-mixing event to the perfect fission of two syntenic blocks), asymmetric transition probabilities were applied to the three categories. This analysis strongly supported the ctenophore-first hypothesis. Direct examination of fusions further corroborated this finding using parsimony. Specifically, the ctenophore-first hypothesis was supported by seven fusion events that are shared by bilaterians, cnidarians, and sponges, but missing from extant ctenophores and outgroup taxa, suggesting the fusion events occurred after ctenophores diverged from all other animals (Figure 4A). Four of these events occurred with mixing; under the sponge-first hypothesis, these data could only be explained by convergent fusions with mixing or precise reversions.
Figure 4.
Summary depictions of syntenies supporting the ctenophore-sister and EO-sister hypothesis. (A) Phylogeny of animal and outgroup taxa used to examine the root of the animal tree. Underneath each higher-order lineage name, the names of representatives used in the study are listed. For example, among Bilateria, species from the genera Pecten and Branchiostoma were included in the study [134]. Note, only fusion and mixing events relevant to rooting the animal tree are depicted. (B) Patterns of synteny in seven different regions most parsimoniously support the ctenophore-sister hypothesis. Examination of these regions indicates that all underwent fusion events and four also underwent mixing events. Each region is abbreviated as “R” along the phylogeny (for example, R1 refers to region 1). The number of genes in each syntenic region is listed at the bottom of the panel. (C) Phylogeny of the three teleost fish groups, including an outgroup taxon, the chicken. Cartoon summary drawings of chromosomes are included for representative species. Common names of these species are provided below the taxonomic names. Highly contiguous genome assemblies facilitated the detection of chromosome fusing and mixing events after a whole genome duplication event. Chr is used as an abbreviation for chromosome. (D) Chromosomes observed in extant species are depicted as cartoon summaries. Complete chromosome sequences are drawn with a solid line; dashed lines indicate scaffolds. Separate chromosomes or regions are drawn with orange and blue colors. Duplicated chromosomes from a whole genome duplication event are darkened. Fused chromosomes have two blocks of colors while fused and mixed chromosomes have intermixed blue and orange blocks of sequences. Silhouette images were obtained from PhyloPic (https://www.phylopic.org); all credit goes to their respective contributors.
Nonetheless, other findings from synteny analysis contradict well-established evolutionary relationships. For example, despite phylogenomic analyses robustly supporting choanoflagellates as the closest living relatives of animals [135,136], the filasterean shared more syntenic blocks with Metazoans compared to the choanoflagellate (29 syntenic blocks compared to 20). There are also more unique syntenic blocks shared between the filasterean and animals than the choanoflagellate (nine syntenic blocks compared to two). The incongruence between the pattern of synteny conservation and prior findings from phylogenomics either suggest a previously undetected close evolutionary relationship between filastereans and animals or lineage-specific loss of synteny in choanoflagellates. Indeed, the strong and consistent phylogenomic support for the sister-group relationship between choanoflagellates and animals indicates that at least some choanoflagellates may have undergone unique, accelerated genome evolution. Specifically, the choanoflagellate, S. rosetta, used in the Schultz et al. study has experienced rapid gene family evolution compared with other choanoflagellates, resulting in a reduced gene repertoire relative to that of the last common ancestor of animals and choanoflagellates [137]. Accordingly, S. rosetta may not be the best sole representative of choanoflagellates for phylogenetics, highlighting the importance of expanded taxon sampling. Similarly, unbiased phylogenetic analysis of fusion states did not recover the monophyly of Porifera, which contradicts more recent phylogenomic studies supporting the monophyly of the lineage [41,42,113]. Although some analyses support paraphyly among Porifera [138,139], the exemplar sponges belong to the class Demospongiae, which most analyses support as monophyletic [140]. More broadly, this observation calls for caution in using syntenic blocks, especially when synteny has been lost.
Syntenic blocks and expanded taxon sampling were also used to investigate early branching patterns in the teleost fish phylogeny by Parey et al. [141]. Specifically, new highly contiguous genome assemblies were generated for seven slim-headed fish species, a previously undersampled group. Analyses of macro- and micro-synteny data (Figure 1E and 1F) using neighbor joining analysis both supported the EO-sister hypothesis. Evidence of a chromosome fusion event unique to slim-headed and bony-tongued fish and another unique to other teleosts further corroborated the EO-sister hypothesis (Figure 4B).
In addition to synteny-based analyses, standard phylogenomic approaches were employed (Figure 1D). Phylogenomic analyses (concatenation and coalescence-based summary tree methods) and distributions of single-gene support frequencies supported the EO-sister hypothesis. Interestingly, this finding was not supported by previous studies using maximum likelihood analysis of concatenated sequences [57,62]. Thus, with this set of taxa, the EO-sister hypothesis is supported by synteny analysis as well as concatenation and coalescence, pointing to the potential influence of expanded taxon sampling.
In the case of teleost fish, the precise impact of taxon sampling remains to be investigated. More broadly, analyzing data from more taxa generally improves phylogenetic inference, particularly among close relatives of phylogenetically unstable taxa [23,142,143]. For example, when represented by a single taxon, the placement of the Saccharomycotina family Ascoideaceae conflicted between two phylogenomic studies that likely did not suffer from insufficient locus sampling [96,144]. However, expanded sampling of three genomes from the Ascoideaceae and close relatives robustly supported one hypothesis [97]. Additional analyses suggested that increased taxon sampling resulted in improved model fit and greater phylogenetic stability of focal lineages. These studies demonstrate how additional taxon sampling can improve phylogenetic inference. Moreover, the benefits of high-quality, chromosome-scale genome assemblies are multifold. For example, standard phylogenomic analyses have benefitted from synteny data to improve orthology predictions, and multiple data types, such as patterns of macro- and micro-synteny, provide additional lines of evidence for phylogenomic inquiry [145].
Challenges and opportunities for synteny-based Tree of Life constructions
As highly contiguous genome assemblies become more commonplace, our understanding of synteny as a phylogenomic marker will mature. Here, we outline five questions to guide using synteny as a phylogenomic marker.
When should different types of syntenic markers be used?
The appropriate use of different syntenic events still needs to be explored. For example, whether macrosynteny, microsynteny, or fusion-and-mixing events are more helpful for addressing ancient versus more recent divergences remains an open question. The utility of each will likely be influenced by each lineage’s rate of chromosome evolution. For example, as mentioned above, plant chromosomes exhibit rapid evolutionary dynamics compared to their mammalian and yeast counterparts [129,130]. Determining the most informative syntenic markers for lineages across time and rates of evolution is an intriguing avenue for future exploration.
What makes a good syntenic marker?
Not all loci have equal phylogenetic information. Among multiple sequence alignments and single-locus trees, diverse measures are available to quantify the usefulness of different loci [84,146,147]. For example, genes displaying a clock-like pattern of evolution have often been favored for divergence time analysis [148,149,150].
Methods for evaluating the phylogenetic information in syntenic markers are underdeveloped. Several parameters may influence the phylogenetic signal of syntenic markers. For example, the genomic location may affect the signal because different regions of chromosomes evolve at different rates [151,152,153]. The size of the syntenic block may also influence the usefulness of a marker. Specifically, small syntenic blocks (e.g., those containing five or fewer genes) likely have different phylogenetic signal than larger blocks (e.g., those containing 100 or more genes). Exploration of these factors will shed light on the relative phylogenetic signal of different syntenic markers, provide the foundations to quantify signals, and aid in refining their usage and interpretation within phylogenomic analyses.
How do biological and analytical factors drive incongruence in synteny data?
Drivers of incongruence have received significant research attention in the context of multiple sequence alignments (Figure 3) [23]. Although drivers of incongruence in synteny-based phylogenomic analysis are underexplored, there are factors we expect will impact synteny-based analysis. Among biological factors, phenomena such as incomplete lineage sorting and hybridization/introgression likely manifest among syntenic blocks. Other factors may obscure the phylogenetic signal carried by synteny. For example, glass sponges were removed from synteny analyses in Schultz et al. due to their extensive lineage-specific chromosomal rearrangements [134]. More broadly, this suggests that different evolutionary rates of large-scale genome variation may contribute to differences in phylogenetic signal. These complexities highlight the need to investigate further the biological factors that can influence tree inference using synteny data.
Similarly, the impact of analytical factors on incongruence remains unclear. For example, an appropriate quality control threshold for assembly continuity remains an open question. Different quality control thresholds may be warranted for macro- versus micro-synteny analyses. Specifically, the continuity threshold may be higher for macrosynteny compared to microsynteny. Errors in genome assembly will certainly mislead phylogenomic inference. Another potential source of error concerns how the conservation or loss of synteny is modeled.
How can evolutionary processes of synteny be modeled?
In standard molecular phylogenetics, substitution models approximate the evolutionary process of transitions between character states. These models vary in complexity. Among nucleotide substitution models, the simplest is the Jukes-Cantor model, which assumes equal substitution rates and base frequencies across a multiple sequence alignment [88]. Other models consider variation in exchange rates between transitions and transversions, such as the HKY model [154]. The General Time Reversible model incorporates a higher level of parameterization, allowing unequal rates and base frequencies [155]. Models tailored to particular lineages or organelles have been developed in specific cases, such as the mitochondrial substitution model for mammals [156]. Analogous substitution models for syntenic data have not yet, to our knowledge, been developed.
Previous studies have modeled syntenic evolution in different ways. Some studies implementing binary presence/absence matrices of syntenic blocks have used a Jukes-Cantor-like model developed for morphological data to describe exchange rates [130,133]. In contrast, in Schultz et al., transitions between no fusion, fusion-without-mixing, and fusion-with-mixing were modeled using asymmetric transition probabilities, accounting for the unlikely reversion of fusion-with-mixing to fusion-without-mixing or fission [134]. However, it is unclear how to weight these transition probabilities. In the teleost fish study context, transitions between states were not explicitly modeled; instead, a distance-based approach was used [141]. The empirical determination of best practices for model selection will be important for future studies. Additionally, the absence of direct measures of exchange rates between synteny states prohibits the development of synteny-specific substitution models. Modeling the process of syntenic evolution remains an outstanding challenge.
How do we weigh synteny evidence against other sources of data?
The adequacy of synteny in elucidating evolutionary history remains largely untested. Since synteny-based phylogenomics is relatively new, it may be wise to consider synteny as a corroborating line of evidence. For example, as previously discussed, strict reliance on synteny data in the Schultz et al. study of the root of the animal Tree of Life would erroneously suggest filastereans are sister to animals, not choanoflagellates [134]. This observation suggests that lineage-specific loss of synteny may lead to erroneous findings. Moreover, divergences in deep time are challenged by having few informative synteny-breaking events that can be reliably identified. Whether each event should be equally weighted remains unclear. Thus, it stands to reason that synteny data will complement more traditional phylogenomic analyses (i.e., concatenation and coalescence) rather than stand alone.
Conclusion
The advancement of genomic data has revolutionized the quest to reconstruct the Tree of Life. With cutting-edge technologies and algorithms that enable the inference of highly contiguous genomes, synteny has emerged—or rather reemerged—as a powerful marker for Tree of Life inquiries. Two studies tackling longstanding debates in animal phylogeny serve as key early studies for demonstrating the potential utility of synteny for reconstructing life’s history [134,141]. In the phylogenomic era, this marks a new chapter wherein synteny-based phylogenomics holds promise to bring fresh insights, but also new challenges. Tackling these challenges head-on will help shape best practices and deepen our understanding of synteny-based phylogenomics.
It is unlikely that Sturtevant and Dobzhansky, pioneers of their time in the 1930s, could have foreseen the far-reaching implications of their work on synteny as a phylogenetic marker. Nonetheless, their efforts have laid the groundwork for discoveries that continue to unfold today, nearly a century later, as technological advancements enabled the realization of their ambition. In light of this, we close by expanding the scope of Sturtevant and Dobzhansky’s quote referenced at the beginning of the article—a comparison of genome architecture, in certain cases, may throw light on the history of a species and the Tree of Life as a whole.
Funding
JLS is a Howard Hughes Medical Institute Awardee of the Life Sciences Research Foundation.
Acknowledgments
JLS thanks Drs. Antonis Rokas, Xing-Xing Shen, and Yuanning Li for fruitful discussions about phylogenomics over the years. In particular, JLS thanks Dr. Rokas for teaching him much of what he knows about phylogenomics, especially regarding the field’s history. JLS and NK thank Drs. Thibaut Brunet, Maxwell C Coyle, and Xing-Xing Shen for reading the manuscript and providing helpful comments and suggestions prior to submission.
Conflicts of interest
JLS is a scientific advisor for WittGen Biotechnologies. JLS is an advisor for ForensisGroup Inc.
References
- Dobzhansky T, Sturtevant AH. INVERSIONS IN THE CHROMOSOMES OF DROSOPHILA PSEUDOOBSCURA. Genetics. 1938;23: 28–64. doi:10.1093/genetics/23.1.28. [CrossRef]
- Tassy P, Fischer MS. “Cladus” and clade: a taxonomic odyssey. Theory Biosci. 2021;140: 77–85. doi:10.1007/s12064-020-00326-2. [CrossRef]
- Benton MJ. Classification and phylogeny of the diapsid reptiles. Zoological Journal of the Linnean Society. 1985;84: 97–164. doi:10.1111/j.1096-3642.1985.tb01796.x. [CrossRef]
- Hickey LJ, Wolfe JA. The Bases of Angiosperm Phylogeny: Vegetative Morphology. Annals of the Missouri Botanical Garden. 1975;62: 538–589. doi:10.2307/2395267. [CrossRef]
- Fell HB. ECHINODERM EMBRYOLOGY AND THE ORIGIN OF CHORDATES. Biological Reviews. 1948;23: 81–107. doi:10.1111/j.1469-185X.1948.tb00458.x. [CrossRef]
- Nuttall GHF, Graham-Smith GS (George S, Pigg-Strangeways TStrangeways. Blood immunity and blood relationship; a demonstration of certain blood-relationships amongst animals by means of the precipitin test for blood. Cambridge: University press; 1904. Available: https://www.biodiversitylibrary.org/item/62820.
- Reichert ET 1855-1931 (viaf)118171449, Brown AP 1864-1917 (viaf)49611474. The differentiation and specificity of corresponding proteins and other vital substances in relation to biological classification and organic evolution : the crystallography of hemoglobins. Washington; 1909. Available: http://lib.ugent.be/catalog/rug01:001807402.
- Bridges CB. Non-Disjunction as Proof of the Chromosome Theory of Heredity (Concluded). Genetics. 1916;1: 107–163. doi:10.1093/genetics/1.2.107. [CrossRef]
- Simpson GG. The principles of classification and a classification of mammals. American Museum of Natural History; 1945.
- Sturtevant AH, Dobzhansky Th. Inversions in the Third Chromosome of Wild Races of Drosophila Pseudoobscura, and Their Use in the Study of the History of the Species. Proc Natl Acad Sci USA. 1936;22: 448–450. doi:10.1073/pnas.22.7.448. [CrossRef]
- Fitch WM, Margoliash E. Construction of Phylogenetic Trees: A method based on mutation distances as estimated from cytochrome c sequences is of general applicability. Science. 1967;155: 279–284. doi:10.1126/science.155.3760.279. [CrossRef]
- Woese CR, Fox GE. Phylogenetic structure of the prokaryotic domain: The primary kingdoms. Proc Natl Acad Sci USA. 1977;74: 5088–5090. doi:10.1073/pnas.74.11.5088. [CrossRef]
- Fitch WM. Distinguishing Homologous from Analogous Proteins. Systematic Zoology. 1970;19: 99. doi:10.2307/2412448. [CrossRef]
- Baldauf SL, Palmer JD. Animals and fungi are each other’s closest relatives: congruent evidence from multiple proteins. Proceedings of the National Academy of Sciences. 1993;90: 11558–11562.
- Giribet G, Edgecombe GD, Wheeler WC. Arthropod phylogeny based on eight molecular loci and morphology. Nature. 2001;413: 157–161.
- Hwang UW, Friedrich M, Tautz D, Park CJ, Kim W. Mitochondrial protein phylogeny joins myriapods with chelicerates. Nature. 2001;413: 154–157.
- Löytynoja A, Milinkovitch MC. Molecular phylogenetic analyses of the mitochondrial ADP-ATP carriers: the Plantae/Fungi/Metazoa trichotomy revisited. Proceedings of the National Academy of Sciences. 2001;98: 10202–10207.
- Kopp A, True JR. Phylogeny of the Oriental Drosophila melanogaster species group: a multilocus reconstruction. Systematic biology. 2002;51: 786–805.
- Rokas A, King N, Finnerty J, Carroll SB. Conflicting phylogenetic signals at the base of the metazoan tree. Evolution & development. 2003;5: 346–359.
- Sanderson MJ, McMahon MM, Steel M. Terraces in Phylogenetic Tree Space. Science. 2011;333: 448–450. doi:10.1126/science.1206357. [CrossRef]
- Rokas A, Williams BL, King N, Carroll SB. Genome-scale approaches to resolving incongruence in molecular phylogenies. Nature. 2003;425: 798–804. doi:10.1038/nature02053. [CrossRef]
- Kapli P, Yang Z, Telford MJ. Phylogenetic tree building in the genomic age. Nat Rev Genet. 2020;21: 428–444. doi:10.1038/s41576-020-0233-0. [CrossRef]
- Steenwyk JL, Li Y, Zhou X, Shen X-X, Rokas A. Incongruence in the phylogenomics era. Nature Reviews Genetics. 2023. doi:10.1038/s41576-023-00620-x. [CrossRef]
- Edwards SV. IS A NEW AND GENERAL THEORY OF MOLECULAR SYSTEMATICS EMERGING? Evolution. 2009;63: 1–19. doi:10.1111/j.1558-5646.2008.00549.x. [CrossRef]
- Crotty SM, Minh BQ, Bean NG, Holland BR, Tuke J, Jermiin LS, et al. GHOST: Recovering Historical Signal from Heterotachously Evolved Sequence Alignments. Smith S, editor. Systematic Biology. 2019; syz051. doi:10.1093/sysbio/syz051. [CrossRef]
- Williams TA, Cox CJ, Foster PG, Szöllősi GJ, Embley TM. Phylogenomics provides robust support for a two-domains tree of life. Nat Ecol Evol. 2019;4: 138–147. doi:10.1038/s41559-019-1040-x. [CrossRef]
- King N, Rokas A. Embracing Uncertainty in Reconstructing Early Animal Evolution. Current Biology. 2017;27: R1081–R1088. doi:10.1016/j.cub.2017.08.054. [CrossRef]
- Whelan NV, Kocot KM, Moroz TP, Mukherjee K, Williams P, Paulay G, et al. Ctenophore relationships and their placement as the sister group to all other animals. Nat Ecol Evol. 2017;1: 1737–1746. doi:10.1038/s41559-017-0331-3. [CrossRef]
- Simion P, Philippe H, Baurain D, Jager M, Richter DJ, Di Franco A, et al. A Large and Consistent Phylogenomic Dataset Supports Sponges as the Sister Group to All Other Animals. Current Biology. 2017;27: 958–967. doi:10.1016/j.cub.2017.02.031. [CrossRef]
- Wainright PO, Hinkle G, Sogin ML, Stickel SK. Monophyletic Origins of the Metazoa: an Evolutionary Link with Fungi. Science. 1993;260: 340–342. doi:10.1126/science.8469985. [CrossRef]
- Brusca RC, Brusca GJ. Invertebrates. Sinauer Associates Incorporated; 2002.
- Dunn CW, Leys SP, Haddock SHD. The hidden biology of sponges and ctenophores. Trends in Ecology & Evolution. 2015;30: 282–291. doi:10.1016/j.tree.2015.03.003. [CrossRef]
- Nielsen C. Early animal evolution: a morphologist’s view. R Soc open sci. 2019;6: 190638. doi:10.1098/rsos.190638. [CrossRef]
- Burkhardt P, Colgren J, Medhus A, Digel L, Naumann B, Soto-Angel JJ, et al. Syncytial nerve net in a ctenophore adds insights on the evolution of nervous systems. Science. 2023;380: 293–297. doi:10.1126/science.ade5645. [CrossRef]
- Leys SP, Hill A. The Physiology and Molecular Biology of Sponge Tissues. Advances in Marine Biology. Elsevier; 2012. pp. 1–56. doi:10.1016/B978-0-12-394283-8.00001-1. [CrossRef]
- Ying C, Ying W, Jing Z, Na W. Potential dietary influence on the stable isotopes and fatty acid compositions of jellyfishes in the Yellow Sea. Journal of the Marine Biological Association of the United Kingdom. 2012;92: 1325–1333. doi:10.1017/S0025315412000082. [CrossRef]
- Moroz LL. Convergent evolution of neural systems in ctenophores. Anderson PAV, editor. Journal of Experimental Biology. 2015;218: 598–611. doi:10.1242/jeb.110692. [CrossRef]
- Collins AG. Evaluating multiple alternative hypotheses for the origin of Bilateria: An analysis of 18S rRNA molecular evidence. Proc Natl Acad Sci USA. 1998;95: 15458–15463. doi:10.1073/pnas.95.26.15458. [CrossRef]
- Medina M, Collins AG, Silberman JD, Sogin ML. Evaluating hypotheses of basal animal phylogeny using complete sequences of large and small subunit rRNA. Proc Natl Acad Sci USA. 2001;98: 9707–9712. doi:10.1073/pnas.171316998. [CrossRef]
- Podar M, Haddock SHD, Sogin ML, Harbison GR. A Molecular Phylogenetic Framework for the Phylum Ctenophora Using 18S rRNA Genes. Molecular Phylogenetics and Evolution. 2001;21: 218–230. doi:10.1006/mpev.2001.1036. [CrossRef]
- Dunn CW, Hejnol A, Matus DQ, Pang K, Browne WE, Smith SA, et al. Broad phylogenomic sampling improves resolution of the animal tree of life. Nature. 2008;452: 745–749. doi:10.1038/nature06614. [CrossRef]
- Philippe H, Derelle R, Lopez P, Pick K, Borchiellini C, Boury-Esnault N, et al. Phylogenomics Revives Traditional Views on Deep Animal Relationships. Current Biology. 2009;19: 706–712. doi:10.1016/j.cub.2009.02.052. [CrossRef]
- Shen X-X, Hittinger CT, Rokas A. Contentious relationships in phylogenomic studies can be driven by a handful of genes. Nat Ecol Evol. 2017;1: 0126. doi:10.1038/s41559-017-0126. [CrossRef]
- Li Y, Shen X-X, Evans B, Dunn CW, Rokas A. Rooting the Animal Tree of Life. Tamura K, editor. Molecular Biology and Evolution. 2021;38: 4322–4333. doi:10.1093/molbev/msab170. [CrossRef]
- Whelan NV, Halanych KM. Available data do not rule out Ctenophora as the sister group to all other Metazoa. Nat Commun. 2023;14: 711. doi:10.1038/s41467-023-36151-6. [CrossRef]
- Patterson C. The contribution of paleontology to teleostean phylogeny. Major patterns in vertebrate evolution. 1977; 579–643.
- Hilton EJ. Comparative osteology and phylogenetic systematics of fossil and living bony-tongue fishes (Actinopterygii, Teleostei, Osteoglossomorpha). Zoological Journal of the Linnean Society. 2003;137: 1–100.
- Diogo R, Doadrio I, Vandewalle P. Teleostean phylogeny based on osteological and myological characters [Filogenia de teleosteos basada en características osteológicas y miológicas]. International Journal of Morphology. 2008;26.
- Patterson C, Rosen DE. Review of ichthyodectiform and other Mesozoic teleost fishes, and the theory and practice of classifying fossils. Bulletin of the AMNH; v. 158, article 2. 1977.
- Arratia G. Basal Teleosts and Teleostean Phylogeny: Response to C. Patterson. Copeia. 1998;1998: 1109. doi:10.2307/1447369. [CrossRef]
- Le HLV, Lecointre G, Perasso R. A 28S rRNA-Based Phylogeny of the Gnathostomes: First Steps in the Analysis of Conflict and Congruence with Morphologically Based Cladograms. Molecular Phylogenetics and Evolution. 1993;2: 31–51. doi:10.1006/mpev.1993.1005. [CrossRef]
- Hurley IA, Mueller RL, Dunn KA, Schmidt EJ, Friedman M, Ho RK, et al. A new time-scale for ray-finned fish evolution. Proceedings of the Royal Society B: Biological Sciences. 2007;274: 489–498.
- Nelson JS, Schultze H-P, Wilson MV. Origin and phylogenetic interrelationships of teleosts. New York. 2010.
- Chen M-Y, Liang D, Zhang P. Selecting Question-Specific Genes to Reduce Incongruence in Phylogenomics: A Case Study of Jawed Vertebrate Backbone Phylogeny. Syst Biol. 2015;64: 1104–1120. doi:10.1093/sysbio/syv059. [CrossRef]
- Bian C, Hu Y, Ravi V, Kuznetsova IS, Shen X, Mu X, et al. The Asian arowana (Scleropages formosus) genome provides new insights into the evolution of an early lineage of teleosts. Sci Rep. 2016;6: 24501. doi:10.1038/srep24501. [CrossRef]
- Vialle RA, de Souza JES, Lopes K de P, Teixeira DG, Alves Sobrinho P de A, Ribeiro-dos-Santos AM, et al. Whole genome sequencing of the pirarucu (Arapaima gigas) supports independent emergence of major teleost clades. Genome biology and evolution. 2018;10: 2366–2379.
- Hughes LC, Ortí G, Huang Y, Sun Y, Baldwin CC, Thompson AW, et al. Comprehensive phylogeny of ray-finned fishes (Actinopterygii) based on transcriptomic and genomic data. Proc Natl Acad Sci USA. 2018;115: 6249–6254. doi:10.1073/pnas.1719358115. [CrossRef]
- Musilova Z, Cortesi F, Matschiner M, Davies WI, Patel JS, Stieb SM, et al. Vision using multiple distinct rod opsins in deep-sea fishes. Science. 2019;364: 588–592.
- Betancur-R R, Wiley EO, Arratia G, Acero A, Bailly N, Miya M, et al. Phylogenetic classification of bony fishes. BMC evolutionary biology. 2017;17: 1–40.
- Dornburg A, Near TJ. The emerging phylogenetic perspective on the evolution of actinopterygian fishes. Annual Review of Ecology, Evolution, and Systematics. 2021;52: 427–452.
- Takezaki N. Resolving the Early Divergence Pattern of Teleost Fish Using Genome-Scale Data. Venkatesh B, editor. Genome Biology and Evolution. 2021;13: evab052. doi:10.1093/gbe/evab052. [CrossRef]
- Faircloth BC, Sorenson L, Santini F, Alfaro ME. A Phylogenomic Perspective on the Radiation of Ray-Finned Fishes Based upon Targeted Sequencing of Ultraconserved Elements (UCEs). Moreau CS, editor. PLoS ONE. 2013;8: e65923. doi:10.1371/journal.pone.0065923. [CrossRef]
- Galtier N. A Model of Horizontal Gene Transfer and the Bacterial Phylogeny Problem. Steel M, editor. Systematic Biology. 2007;56: 633–642. doi:10.1080/10635150701546231. [CrossRef]
- Lapierre P, Lasek-Nesselquist E, Gogarten JP. The impact of HGT on phylogenomic reconstruction methods. Briefings in Bioinformatics. 2014;15: 79–90. doi:10.1093/bib/bbs050. [CrossRef]
- Edelman NB, Frandsen PB, Miyagi M, Clavijo B, Davey J, Dikow RB, et al. Genomic architecture and introgression shape a butterfly radiation. Science. 2019;366: 594–599. doi:10.1126/science.aaw2090. [CrossRef]
- Steenwyk JL, Lind AL, Ries LNA, dos Reis TF, Silva LP, Almeida F, et al. Pathogenic Allodiploid Hybrids of Aspergillus Fungi. Current Biology. 2020;30: 2495-2507.e7. doi:10.1016/j.cub.2020.04.071. [CrossRef]
- Mao Y, Catacchio CR, Hillier LW, Porubsky D, Li R, Sulovari A, et al. A high-quality bonobo genome refines the analysis of hominid evolution. Nature. 2021;594: 77–81. doi:10.1038/s41586-021-03519-x. [CrossRef]
- Ragsdale AP, Weaver TD, Atkinson EG, Hoal EG, Möller M, Henn BM, et al. A weakly structured stem for human origins in Africa. Nature. 2023;617: 755–763. doi:10.1038/s41586-023-06055-y. [CrossRef]
- Avise JC, Robinson TJ. Hemiplasy: A New Term in the Lexicon of Phylogenetics. Kubatko L, editor. Systematic Biology. 2008;57: 503–507. doi:10.1080/10635150802164587. [CrossRef]
- Degnan JH, Rosenberg NA. Gene tree discordance, phylogenetic inference and the multispecies coalescent. Trends in Ecology & Evolution. 2009;24: 332–340. doi:10.1016/j.tree.2009.01.009. [CrossRef]
- Marcet-Houben M, Gabaldón T. Beyond the Whole-Genome Duplication: Phylogenetic Evidence for an Ancient Interspecies Hybridization in the Baker’s Yeast Lineage. Hurst LD, editor. PLoS Biol. 2015;13: e1002220. doi:10.1371/journal.pbio.1002220. [CrossRef]
- Husnik F, McCutcheon JP. Functional horizontal gene transfer from bacteria to eukaryotes. Nature Reviews Microbiology. 2018;16: 67–79.
- Irisarri I, Singh P, Koblmüller S, Torres-Dowdall J, Henning F, Franchini P, et al. Phylogenomics uncovers early hybridization and adaptive loci shaping the radiation of Lake Tanganyika cichlid fishes. Nat Commun. 2018;9: 3159. doi:10.1038/s41467-018-05479-9. [CrossRef]
- Suvorov A, Kim BY, Wang J, Armstrong EE, Peede D, D’Agostino ERR, et al. Widespread introgression across a phylogeny of 155 Drosophila genomes. Current Biology. 2022;32: 111-123.e5. doi:10.1016/j.cub.2021.10.052. [CrossRef]
- Arnold BJ, Huang I-T, Hanage WP. Horizontal gene transfer and adaptive evolution in bacteria. Nat Rev Microbiol. 2022;20: 206–218. doi:10.1038/s41579-021-00650-4. [CrossRef]
- Gonçalves P, Gonçalves C. Horizontal gene transfer in yeasts. Current Opinion in Genetics & Development. 2022;76: 101950. doi:10.1016/j.gde.2022.101950. [CrossRef]
- Yuan L, Lu H, Li F, Nielsen J, Kerkhoven EJ. HGTphyloDetect: facilitating the identification and phylogenetic analysis of horizontal gene transfer. Briefings in Bioinformatics. 2023;24: bbad035. doi:10.1093/bib/bbad035. [CrossRef]
- Zhu Q, Kosoy M, Dittmar K. HGTector: an automated method facilitating genome-wide discovery of putative horizontal gene transfers. BMC Genomics. 2014;15: 717. doi:10.1186/1471-2164-15-717. [CrossRef]
- Hahn MW, Hibbins MS. A Three-Sample Test for Introgression. Molecular Biology and Evolution. 2019;36: 2878–2882. doi:10.1093/molbev/msz178. [CrossRef]
- Hibbins MS, Hahn MW. Phylogenomic approaches to detecting and characterizing introgression. Turelli M, editor. Genetics. 2022;220: iyab173. doi:10.1093/genetics/iyab173. [CrossRef]
- Morel B, Schade P, Lutteropp S, Williams TA, Szöllősi GJ, Stamatakis A. SpeciesRax: A Tool for Maximum Likelihood Species Tree Inference from Gene Family Trees under Duplication, Transfer, and Loss. Pupko T, editor. Molecular Biology and Evolution. 2022;39: msab365. doi:10.1093/molbev/msab365. [CrossRef]
- Szöllősi GJ, Boussau B, Abby SS, Tannier E, Daubin V. Phylogenetic modeling of lateral gene transfer reconstructs the pattern and relative timing of speciations. Proc Natl Acad Sci USA. 2012;109: 17513–17518. doi:10.1073/pnas.1202997109. [CrossRef]
- Stolzer M, Lai H, Xu M, Sathaye D, Vernot B, Durand D. Inferring duplications, losses, transfers and incomplete lineage sorting with nonbinary species trees. Bioinformatics. 2012;28: i409–i415. doi:10.1093/bioinformatics/bts386. [CrossRef]
- Steenwyk JL, Buida TJ, Labella AL, Li Y, Shen X-X, Rokas A. PhyKIT: a broadly applicable UNIX shell toolkit for processing and analyzing phylogenomic data. Schwartz R, editor. Bioinformatics. 2021;37: 2325–2331. doi:10.1093/bioinformatics/btab096. [CrossRef]
- Philippe H, Brinkmann H, Lavrov DV, Littlewood DTJ, Manuel M, Wörheide G, et al. Resolving Difficult Phylogenetic Questions: Why More Sequences Are Not Enough. Penny D, editor. PLoS Biol. 2011;9: e1000602. doi:10.1371/journal.pbio.1000602. [CrossRef]
- Hernandez AM, Ryan JF. Six-State Amino Acid Recoding is not an Effective Strategy to Offset Compositional Heterogeneity and Saturation in Phylogenetic Analyses. Uyeda J, editor. Systematic Biology. 2021;70: 1200–1212. doi:10.1093/sysbio/syab027. [CrossRef]
- Foster PG, Schrempf D, Szöllősi GJ, Williams TA, Cox CJ, Embley TM. Recoding Amino Acids to a Reduced Alphabet may Increase or Decrease Phylogenetic Accuracy. Friedman M, editor. Systematic Biology. 2022; syac042. doi:10.1093/sysbio/syac042. [CrossRef]
- Jukes TH, Cantor CR. Evolution of Protein Molecules. Mammalian Protein Metabolism. Elsevier; 1969. pp. 21–132. doi:10.1016/B978-1-4832-3211-9.50009-7. [CrossRef]
- Lartillot N, Brinkmann H, Philippe H. Suppression of long-branch attraction artefacts in the animal phylogeny using a site-heterogeneous model. BMC Evol Biol. 2007;7: S4. doi:10.1186/1471-2148-7-S1-S4. [CrossRef]
- Martín-Durán JM, Ryan JF, Vellutini BC, Pang K, Hejnol A. Increased taxon sampling reveals thousands of hidden orthologs in flatworms. Genome Res. 2017;27: 1263–1272. doi:10.1101/gr.216226.116. [CrossRef]
- Emms DM, Kelly S. OrthoFinder: solving fundamental biases in whole genome comparisons dramatically improves orthogroup inference accuracy. Genome Biol. 2015;16: 157. doi:10.1186/s13059-015-0721-2. [CrossRef]
- Emms DM, Kelly S. OrthoFinder: phylogenetic orthology inference for comparative genomics. Genome Biol. 2019;20: 238. doi:10.1186/s13059-019-1832-y. [CrossRef]
- Chen F, Mackey AJ, Vermunt JK, Roos DS. Assessing Performance of Orthology Detection Strategies Applied to Eukaryotic Genomes. Fairhead C, editor. PLoS ONE. 2007;2: e383. doi:10.1371/journal.pone.0000383. [CrossRef]
- Natsidis P, Kapli P, Schiffer PH, Telford MJ. Systematic errors in orthology inference and their effects on evolutionary analyses. iScience. 2021;24: 102110. doi:10.1016/j.isci.2021.102110. [CrossRef]
- Wickett NJ, Mirarab S, Nguyen N, Warnow T, Carpenter E, Matasci N, et al. Phylotranscriptomic analysis of the origin and early diversification of land plants. Proc Natl Acad Sci USA. 2014;111. doi:10.1073/pnas.1323926111. [CrossRef]
- Shen X-X, Zhou X, Kominek J, Kurtzman CP, Hittinger CT, Rokas A. Reconstructing the Backbone of the Saccharomycotina Yeast Phylogeny Using Genome-Scale Data. G3 Genes|Genomes|Genetics. 2016;6: 3927–3939. doi:10.1534/g3.116.034744. [CrossRef]
- Shen X-X, Opulente DA, Kominek J, Zhou X, Steenwyk JL, Buh KV, et al. Tempo and Mode of Genome Evolution in the Budding Yeast Subphylum. Cell. 2018;175: 1533-1545.e20. doi:10.1016/j.cell.2018.10.023. [CrossRef]
- Cheng S, Xian W, Fu Y, Marin B, Keller J, Wu T, et al. Genomes of Subaerial Zygnematophyceae Provide Insights into Land Plant Evolution. Cell. 2019;179: 1057-1067.e14. doi:10.1016/j.cell.2019.10.019. [CrossRef]
- Steenwyk JL, Goltz DC, Buida TJ, Li Y, Shen X-X, Rokas A. OrthoSNAP: A tree splitting and pruning algorithm for retrieving single-copy orthologs from gene family trees. Hejnol A, editor. PLoS Biol. 2022;20: e3001827. doi:10.1371/journal.pbio.3001827. [CrossRef]
- Willson J, Roddur MS, Liu B, Zaharias P, Warnow T. DISCO: Species Tree Inference using Multicopy Gene Family Tree Decomposition. Hahn M, editor. Systematic Biology. 2022;71: 610–629. doi:10.1093/sysbio/syab070. [CrossRef]
- Kocot KM, Citarella MR, Moroz LL, Halanych KM. PhyloTreePruner: A Phylogenetic Tree-Based Approach for selection of Orthologous sequences for phylogenomics. Evol Bioinform Online. 2013;9: EBO.S12813. doi:10.4137/EBO.S12813. [CrossRef]
- Tan G, Muffato M, Ledergerber C, Herrero J, Goldman N, Gil M, et al. Current Methods for Automated Filtering of Multiple Sequence Alignments Frequently Worsen Single-Gene Phylogenetic Inference. Syst Biol. 2015;64: 778–791. doi:10.1093/sysbio/syv033. [CrossRef]
- Steenwyk JL, Buida TJ, Li Y, Shen X-X, Rokas A. ClipKIT: A multiple sequence alignment trimming software for accurate phylogenomic inference. Hejnol A, editor. PLoS Biol. 2020;18: e3001007. doi:10.1371/journal.pbio.3001007. [CrossRef]
- Redmond AK, McLysaght A. Evidence for sponges as sister to all other animals from partitioned phylogenomics with mixture models and recoding. Nat Commun. 2021;12: 1783. doi:10.1038/s41467-021-22074-7. [CrossRef]
- Whelan NV, Halanych KM. Who Let the CAT Out of the Bag? Accurately Dealing with Substitutional Heterogeneity in Phylogenomic Analyses. Syst Biol. 2016; syw084. doi:10.1093/sysbio/syw084. [CrossRef]
- Rokas A, Holland PWH. Rare genomic changes as a tool for phylogenetics. Trends in Ecology & Evolution. 2000;15: 454–459. doi:10.1016/S0169-5347(00)01967-4. [CrossRef]
- Castresana J, Feldmaier-Fuchs G, Yokobori S, Satoh N, Pääbo S. The Mitochondrial Genome of the Hemichordate Balanoglossus carnosus and the Evolution of Deuterostome Mitochondria. Genetics. 1998;150: 1115–1123. doi:10.1093/genetics/150.3.1115. [CrossRef]
- Venkatesh B, Ning Y, Brenner S. Late changes in spliceosomal introns define clades in vertebrate evolution. Proc Natl Acad Sci USA. 1999;96: 10267–10271. doi:10.1073/pnas.96.18.10267. [CrossRef]
- Rokas A, Kathirithamby J, Holland PWH. Intron insertion as a phylogenetic character: the engrailed homeobox of Strepsiptera does not indicate affinity with Diptera. Insect Mol Biol. 1999;8: 527–530. doi:10.1046/j.1365-2583.1999.00149.x. [CrossRef]
- Steenwyk JL, Opulente DA, Kominek J, Shen X-X, Zhou X, Labella AL, et al. Extensive loss of cell-cycle and DNA repair genes in an ancient lineage of bipolar budding yeasts. Kamoun S, editor. PLoS Biol. 2019;17: e3000255. doi:10.1371/journal.pbio.3000255. [CrossRef]
- Krassowski T, Coughlan AY, Shen X-X, Zhou X, Kominek J, Opulente DA, et al. Evolutionary instability of CUG-Leu in the genetic code of budding yeasts. Nat Commun. 2018;9: 1887. doi:10.1038/s41467-018-04374-7. [CrossRef]
- Dellaporta SL, Xu A, Sagasser S, Jakob W, Moreno MA, Buss LW, et al. Mitochondrial genome of Trichoplax adhaerens supports Placozoa as the basal lower metazoan phylum. Proc Natl Acad Sci USA. 2006;103: 8751–8756. doi:10.1073/pnas.0602076103. [CrossRef]
- Whelan NV, Kocot KM, Moroz LL, Halanych KM. Error, signal, and the placement of Ctenophora sister to all other animals. Proc Natl Acad Sci USA. 2015;112: 5773–5778. doi:10.1073/pnas.1503453112. [CrossRef]
- Sudmant PH, Rausch T, Gardner EJ, Handsaker RE, Abyzov A, Huddleston J, et al. An integrated map of structural variation in 2,504 human genomes. Nature. 2015;526: 75–81. doi:10.1038/nature15394. [CrossRef]
- Steenwyk JL, Soghigian JS, Perfect JR, Gibbons JG. Copy number variation contributes to cryptic genetic variation in outbreak lineages of Cryptococcus gattii from the North American Pacific Northwest. BMC Genomics. 2016;17: 700. doi:10.1186/s12864-016-3044-0. [CrossRef]
- Lee Y-L, Bosse M, Mullaart E, Groenen MAM, Veerkamp RF, Bouwman AC. Functional and population genetic features of copy number variations in two dairy cattle populations. BMC Genomics. 2020;21: 89. doi:10.1186/s12864-020-6496-1. [CrossRef]
- Brown KH, Dobrinski KP, Lee AS, Gokcumen O, Mills RE, Shi X, et al. Extensive genetic diversity and substructuring among zebrafish strains revealed through copy number variant analysis. Proc Natl Acad Sci USA. 2012;109: 529–534. doi:10.1073/pnas.1112163109. [CrossRef]
- Fortna A, Kim Y, MacLaren E, Marshall K, Hahn G, Meltesen L, et al. Lineage-Specific Gene Duplication and Loss in Human and Great Ape Evolution. Chris Tyler-Smith, editor. PLoS Biol. 2004;2: e207. doi:10.1371/journal.pbio.0020207. [CrossRef]
- Mühlhausen S, Schmitt HD, Pan K-T, Plessmann U, Urlaub H, Hurst LD, et al. Endogenous Stochastic Decoding of the CUG Codon by Competing Ser- and Leu-tRNAs in Ascoidea asiatica. Current Biology. 2018;28: 2046-2057.e5. doi:10.1016/j.cub.2018.04.085. [CrossRef]
- Haas BJ, Delcher AL, Wortman JR, Salzberg SL. DAGchainer: a tool for mining segmental genome duplications and synteny. Bioinformatics. 2004;20: 3643–3646.
- Proost S, Fostier J, De Witte D, Dhoedt B, Demeester P, Van de Peer Y, et al. i-ADHoRe 3.0—fast and sensitive detection of genomic homology in extremely large data sets. Nucleic acids research. 2012;40: e11–e11.
- Wang Y, Tang H, Debarry JD, Tan X, Li J, Wang X, et al. MCScanX: a toolkit for detection and evolutionary analysis of gene synteny and collinearity. Nucleic acids research. 2012;40: e49–e49.
- Drillon G, Carbone A, Fischer G. SynChro: a fast and easy tool to reconstruct and visualize synteny blocks along eukaryotic chromosomes. PloS one. 2014;9: e92621.
- Hane JK, Rouxel T, Howlett BJ, Kema GH, Goodwin SB, Oliver RP. A novel mode of chromosomal evolution peculiar to filamentous Ascomycete fungi. Genome Biol. 2011;12: R45. doi:10.1186/gb-2011-12-5-r45. [CrossRef]
- Robberecht C, Voet T, Esteki MZ, Nowakowska BA, Vermeesch JR. Nonallelic homologous recombination between retrotransposable elements is a driver of de novo unbalanced translocations. Genome Res. 2013;23: 411–418. doi:10.1101/gr.145631.112. [CrossRef]
- Ma J, Bennetzen JL. Recombination, rearrangement, reshuffling, and divergence in a centromeric region of rice. Proc Natl Acad Sci USA. 2006;103: 383–388. doi:10.1073/pnas.0509810102. [CrossRef]
- Liu P, Lacaria M, Zhang F, Withers M, Hastings PJ, Lupski JR. Frequency of Nonallelic Homologous Recombination Is Correlated with Length of Homology: Evidence that Ectopic Synapsis Precedes Ectopic Crossing-Over. The American Journal of Human Genetics. 2011;89: 580–588. doi:10.1016/j.ajhg.2011.09.009. [CrossRef]
- Ferguson S, Jones A, Murray K, Schwessinger B, Borevitz JO. Interspecies genome divergence is predominantly due to frequent small scale rearrangements in Eucalyptus. Molecular Ecology. 2023;32: 1271–1287. doi:10.1111/mec.16608. [CrossRef]
- Zhao T, Schranz ME. Network-based microsynteny analysis identifies major differences and genomic outliers in mammalian and angiosperm genomes. Proc Natl Acad Sci USA. 2019;116: 2165–2174. doi:10.1073/pnas.1801757116. [CrossRef]
- Li Y, Liu H, Steenwyk JL, LaBella AL, Harrison M-C, Groenewald M, et al. Contrasting modes of macro and microsynteny evolution in a eukaryotic subphylum. Current Biology. 2022; S0960982222016700. doi:10.1016/j.cub.2022.10.025. [CrossRef]
- Delsuc F, Brinkmann H, Philippe H. Phylogenomics and the reconstruction of the tree of life. Nat Rev Genet. 2005;6: 361–375. doi:10.1038/nrg1603. [CrossRef]
- Drillon G, Champeimont R, Oteri F, Fischer G, Carbone A. Phylogenetic Reconstruction Based on Synteny Block and Gene Adjacencies. Battistuzzi FU, editor. Molecular Biology and Evolution. 2020;37: 2747–2762. doi:10.1093/molbev/msaa114. [CrossRef]
- Zhao T, Zwaenepoel A, Xue J-Y, Kao S-M, Li Z, Schranz ME, et al. Whole-genome microsynteny-based phylogeny of angiosperms. Nat Commun. 2021;12: 3498. doi:10.1038/s41467-021-23665-0. [CrossRef]
- Schultz DT, Haddock SHD, Bredeson JV, Green RE, Simakov O, Rokhsar DS. Ancient gene linkages support ctenophores as sister to other animals. Nature. 2023 [cited 21 May 2023]. doi:10.1038/s41586-023-05936-6. [CrossRef]
- Fairclough SR, Chen Z, Kramer E, Zeng Q, Young S, Robertson HM, et al. Premetazoan genome evolution and the regulation of cell differentiation in the choanoflagellate Salpingoeca rosetta. Genome Biol. 2013;14: R15. doi:10.1186/gb-2013-14-2-r15. [CrossRef]
- King N, Westbrook MJ, Young SL, Kuo A, Abedin M, Chapman J, et al. The genome of the choanoflagellate Monosiga brevicollis and the origin of metazoans. Nature. 2008;451: 783–788. doi:10.1038/nature06617. [CrossRef]
- Richter DJ, Fozouni P, Eisen MB, King N. Gene family innovation, conservation and loss on the animal stem lineage. eLife. 2018;7: e34226. doi:10.7554/eLife.34226. [CrossRef]
- Sperling EA, Pisani D, Peterson KJ. Poriferan paraphyly and its implications for Precambrian palaeobiology. SP. 2007;286: 355–368. doi:10.1144/SP286.25. [CrossRef]
- Borchiellini C, Manuel M, Alivon E, Boury-Esnault N, Vacelet J, Le Parco Y. Sponge paraphyly and the origin of Metazoa: Sponge paraphyly. Journal of Evolutionary Biology. 2001;14: 171–179. doi:10.1046/j.1420-9101.2001.00244.x. [CrossRef]
- Kenny NJ, Francis WR, Rivera-Vicéns RE, Juravel K, De Mendoza A, Díez-Vives C, et al. Tracing animal genomic evolution with the chromosomal-level assembly of the freshwater sponge Ephydatia muelleri. Nat Commun. 2020;11: 3676. doi:10.1038/s41467-020-17397-w. [CrossRef]
- Parey E, Louis A, Montfort J, Bouchez O, Roques C, Iampietro C, et al. Genome structures resolve the early diversification of teleost fishes. Science. 2023;379: 572–575. doi:10.1126/science.abq4257. [CrossRef]
- Pollock DD, Zwickl DJ, McGuire JA, Hillis DM. Increased Taxon Sampling Is Advantageous for Phylogenetic Inference. Crandall K, editor. Systematic Biology. 2002;51: 664–671. doi:10.1080/10635150290102357. [CrossRef]
- Aberer AJ, Krompass D, Stamatakis A. Pruning Rogue Taxa Improves Phylogenetic Accuracy: An Efficient Algorithm and Webservice. Systematic Biology. 2013;62: 162–166. doi:10.1093/sysbio/sys078. [CrossRef]
- Riley R, Haridas S, Wolfe KH, Lopes MR, Hittinger CT, Göker M, et al. Comparative genomics of biotechnologically important yeasts. Proc Natl Acad Sci USA. 2016;113: 9882–9887. doi:10.1073/pnas.1603941113. [CrossRef]
- Scannell DR, Byrne KP, Gordon JL, Wong S, Wolfe KH. Multiple rounds of speciation associated with reciprocal gene loss in polyploid yeasts. Nature. 2006;440: 341–345. doi:10.1038/nature04562. [CrossRef]
- Shen X-X, Salichos L, Rokas A. A Genome-Scale Investigation of How Sequence, Function, and Tree-Based Gene Properties Influence Phylogenetic Inference. Genome Biol Evol. 2016;8: 2565–2580. doi:10.1093/gbe/evw179. [CrossRef]
- Mongiardino Koch N. Phylogenomic Subsampling and the Search for Phylogenetically Reliable Loci. Satta Y, editor. Molecular Biology and Evolution. 2021;38: 4025–4038. doi:10.1093/molbev/msab151. [CrossRef]
- Steenwyk JL, Shen X-X, Lind AL, Goldman GH, Rokas A. A Robust Phylogenomic Time Tree for Biotechnologically and Medically Important Fungi in the Genera Aspergillus and Penicillium. Boyle JP, editor. mBio. 2019;10: e00925-19. doi:10.1128/mBio.00925-19. [CrossRef]
- Liu L, Zhang J, Rheindt FE, Lei F, Qu Y, Wang Y, et al. Genomic evidence reveals a radiation of placental mammals uninterrupted by the KPg boundary. Proc Natl Acad Sci USA. 2017;114. doi:10.1073/pnas.1616744114. [CrossRef]
- Smith SA, Brown JW, Walker JF. So many genes, so little time: A practical approach to divergence-time estimation in the genomic era. Escriva H, editor. PLoS ONE. 2018;13: e0197433. doi:10.1371/journal.pone.0197433. [CrossRef]
- Steenwyk J, Rokas A. Extensive Copy Number Variation in Fermentation-Related Genes Among Saccharomyces cerevisiae Wine Strains. G3 Genes|Genomes|Genetics. 2017;7: 1475–1485. doi:10.1534/g3.117.040105. [CrossRef]
- Saint-Leandre B, Levine MT. The Telomere Paradox: Stable Genome Preservation with Rapidly Evolving Proteins. Trends in Genetics. 2020;36: 232–242. doi:10.1016/j.tig.2020.01.007. [CrossRef]
- Baird DM. Telomeres and genomic evolution. Phil Trans R Soc B. 2018;373: 20160437. doi:10.1098/rstb.2016.0437. [CrossRef]
- Hasegawa M, Kishino H, Yano T. Dating of the human-ape splitting by a molecular clock of mitochondrial DNA. J Mol Evol. 1985;22: 160–174. doi:10.1007/BF02101694. [CrossRef]
- Tavaré S. Some probabilistic and statistical problems in the analysis of DNA sequences. Lect Math Life Sci (Am Math Soc). 1986;17: 57–86.
- Yang Z, Nielsen R, Hasegawa M. Models of amino acid substitution and applications to mitochondrial protein evolution. Molecular Biology and Evolution. 1998;15: 1600–1611. doi:10.1093/oxfordjournals.molbev.a025888. [CrossRef]
Disclaimer/Publisher’s Note: The statements, opinions and data contained in all publications are solely those of the individual author(s) and contributor(s) and not of MDPI and/or the editor(s). MDPI and/or the editor(s) disclaim responsibility for any injury to people or property resulting from any ideas, methods, instructions or products referred to in the content. |
© 2023 by the authors. Licensee MDPI, Basel, Switzerland. This article is an open access article distributed under the terms and conditions of the Creative Commons Attribution (CC BY) license (http://creativecommons.org/licenses/by/4.0/).
Copyright: This open access article is published under a Creative Commons CC BY 4.0 license, which permit the free download, distribution, and reuse, provided that the author and preprint are cited in any reuse.


