
Submitted:
04 September 2023
Posted:
05 September 2023
You are already at the latest version
Abstract
Considering the aging society and budget constraints, a strategy for reforming public transportation welfare policies is essential for sustainability. Among the various transportation welfare policies, fare discount policies are provided to specific age groups, and most countries offer benefits to several public transportation. South Korea provides a fare-free policy limited to subways, and the need for policy modification is emerging due to sustainability problems caused by an aging society. Hence, the scope of the policy should be expanded to all travel modes, but the discount rate should be reduced, or the target group should be reduced in consideration of the budget. This study proposes a travel mode to focus on by city through the preference of the elderly. The latent class model is employed to classfy stated preference data collected from the survey. The estimation results show a significant preference heterogeneity depending on the level of subway supply by region, and a policy focused on subways would be more reasonable in cities with sufficient subway infrastructure. Hence, regarding sustainability, it may be more appropriate to focus on specific means than to provide the same discount policy for all public transport.
Keywords:
Public service obligation
; Fare-free policy
; Heterogeneity of mode choice
; Stated preference
; Latent class model
1. Introduction
In modern society, convenient travel through transportation facilities must be provided as a basic right of citizens. Thus, the nation is obligated to provide a minimum level of service so that all citizens can be guaranteed this right. This concept, known as Public Service Obligation (PSO), applies to various public transport services in many countries through legal or nation-to-provider arrangements. PSO refers to providing services to regions or groups where transportation facilities are not provided due to a lack of profitability [1]. Therefore, extra subsidies must be accompanied, and in order to efficiently use national funds, it is necessary to review the degree of PSO achievement by policy specifically. In South Korea, PSOs are fulfilled through fare-free policies for specific groups (elderly, veterans, and disabled) and the provision of extra public transit (bus, railway) lines. Among them, the fare-free policy focused on in this study has recently become a hot topic due to several problems.
The government of South Korea introduced a public transportation fare-free policy in 1984 without a detailed review. This policy was promoted by revising laws on the elderly and global trends, and a similar policy was introduced in the UK in 1997 [2]. At the beginning of the policy introduction, all available public transportation (bus, railway) was provided free of charge. However, at this time, the railway provides it free of charge. The main reason why the scope of the policy was limited to railways was that, unlike railways, buses provide services from the private sector. Since the nation needed to provide more subsidies, buses operating in the private sector had problems with policy sustainability. On the other hand, most countries, including the UK, are implementing PSO policies for all available public transportation. Moreover, in the case of the UK, it can be seen that the PSO system utilization rate for buses is high under the conditions that both buses and railways are available [3]. Considering the UK case, discussing whether South Korea's PSO system is achieving its purpose, excluding political reasons, is necessary.
In addition, the issue of the system's sustainability due to an aged society is being discussed. South Korea is an aged society with an elderly population of more than 17%, so it is expected to enter a super-aged society soon. Currently, the railway utilization rate of the PSO target group is about 20% of the total users, and the elderly are about 82% of the PSO target group [4]. In addition, the elderly group in Korea is expected to double by 2050 [5], and the PSO target group among railway users is expected to be 43% by simple calculation. Considering the PSO's purpose of ensuring that all social classes are guaranteed a "minimum service level" with a limited budget, South Korea's fare-free policy needs to improve the overall system.
This study reviews the travel behavior of the elderly, who account for most of the fare-free policy target group, and suggests revision directions to improve equity with a limited budget. The preference of the elderly for public transportation mode was investigated through an SP (Statement Preference) survey. As in the UK case, if the elderly prefer buses to subways, PSO subsidy support should be applied differently from the present case. In addition, South Korea offers PSO benefits in six areas where subways are operated, and the level of public transportation (bus and subway) infrastructure in each area is very different. Hence, subsidy policies should be tailored to each region rather than operating on a single criterion. This study applied a latent class model (LCM) that classifies the SP survey results in consideration of individual and regional attributes. As a result, this study proposed improving PSO policies for each region.
The remainder of this paper is organized as follows: Section 2 reviews studies on the definition of equity and the evaluation of equity through travel behavior. Section 3 describes related data and analysis methodology. In Section 4, empirical results and discussions are provided. Finally, the last section discusses the study's conclusion and future research direction.
2. Literature Review
Redistribution in public transportation policy, horizontal equity and vertical equity are the first mentioned. Among them, vertical equity means that extra subsidies are needed for the socially excluded class regarding accessibility or availability to transportation facilities. Another way to say vertical equity means redistribution of wealth, and its roots lie in the concept of distributive justice [6].
Vertical equity is divided into three categories: Inclusivity, Affordability, and Social justice [7]. Inclusivity refers to users of various classes being able to use public transportation under the same conditions. It means improving facilities so that all users can conveniently use it. Affordability means that higher subsidies should be provided to groups with lower income levels. Finally, Social justice defines groups that need assistance according to social norms. Overall, the group that needs assistance is defined, and equity is evaluated by considering the actual level of assistance provided. However, this research could have pointed out more about horizontal equity between target groups according to the geographical distribution of the target group.
The theory of distributive justice into five categories, each as follows: Strict egalitarianism, difference principle of justice, resource-based principles of justice, desert-based theory, and libertarianism [6]. In addition, each theory was reclassified into nine categories by target group (Geographic, Group, Individual) and by definition of equity (Market equity, Opportunity equity, Outcome equity).
Among them, geographical equity, it was mentioned that “equitable assistance” at the administrative district level should be wary in the case of the US. Past study pointed out that due to the subsidy policy paid equally to all states, states (Manhattan) with high public transportation utilization rates fail to install planned railway lines [8]. In other words, it should be divided into “geographical market equity,” “geographical opportunity equity,” and “geographical outcome equity,” not just “geographical equity.” First, geographic market equity means that subsidies should be different based on the utilization rate of each region. Next, geographical opportunity equity requires equal subsidies to all regions. Finally, geographical outcome equity means that all regions should provide services equally. Among them, the Manhattan case occurred because geographical equity was evaluated only by geographical opportunity equity.
The fare-free policy is highly related to geographical equity indicators: market equity and outcome equity. First, geographical opportunity equity is more related to infrastructure provision than fare-free policy. Since subsidies for fare-free policies are determined according to the number of users and utilization rates, it is impossible to provide the same level of policy subsidies to all regions. The geographical market equity is an indicator that can be easily achieved if there is no policy limit on the number of uses. Many countries, including South Korea, provide policies without limitations; the higher the utilization rate, the higher the subsidies. In addition, discounts are provided by purchasing season tickets in some parts of France (e.g., Navigo Annual Senior Ticket) and Japan, so the higher the utilization rate, the lower the average fare. The geographical outcome equity is typical for countries other than South Korea to be treated separately from the fare-free policy as a matter of policy provision. Since most countries provide the same fare-free policy for all available public transportation, it is essential to provide public transportation infrastructure before the fare-free policy. On the other hand, since South Korea provides a policy limited to railways, this indicator is mainly used for equity evaluation.
In summary, South Korea's fare policy, available only for specific travel modes, should be applied to various modes to improve geographical outcome equity. However, expanding the policy scope by various travel modes under budget constraints significantly reduces sustainability. Thus, although geographical market equity will be reduced, fare policy will be limited to improve sustainability. Recent studies analyzed equity in terms of total benefits through indicators related to total discounted amount [9], public transportation usage rate [10], access time [11,12,13,14,15], and mobility [16] according to travel behavior. On the other hand, the preference of the policy target group for public transportation modes was not significantly pointed out. Hence, this study presents a strategy for improving fare policy by investigating the public travel mode that the elderly prefer. Another way to say, if the same fare-discount policy cannot be applied to all travel modes due to budget constraints, providing more benefits for the modes preferred by the target group would be desirable. Through this, this study suggests ways to improve the public transportation discount policy in consideration of the characteristics of target groups by region.
3. Research Method and Data
3.1. Data Collection
The purpose of this study is to investigate the preference of the elderly according to changes in fares by public transportation modes (bus, subway). In order to convert the fare-free policy to the fare-discount policy under budget constraints, it is necessary to find out the travel mode to focus on among the two public travel modes. Since South Korea only provides a fare-free policy for the elderly, a SP experiment was designed. The questions include SP experiments and questions about respondents’ socio-demographics. This survey was conducted in face-to-face interviews for two weeks in September 2022, with respondents aged 65 or older living in six cities where the fare-free policy is provided: Seoul, Busan, Daegu, Incheon, Gwangju, and Daejeon. The survey target is limited because South Korea's fare-free policy is provided to those aged 65 or older. The sample is stratified to allocate the number of samples according to the proportion of the population in each region, and 730 samples are eventually collected (see Table 1).
3.2. Experimental Design
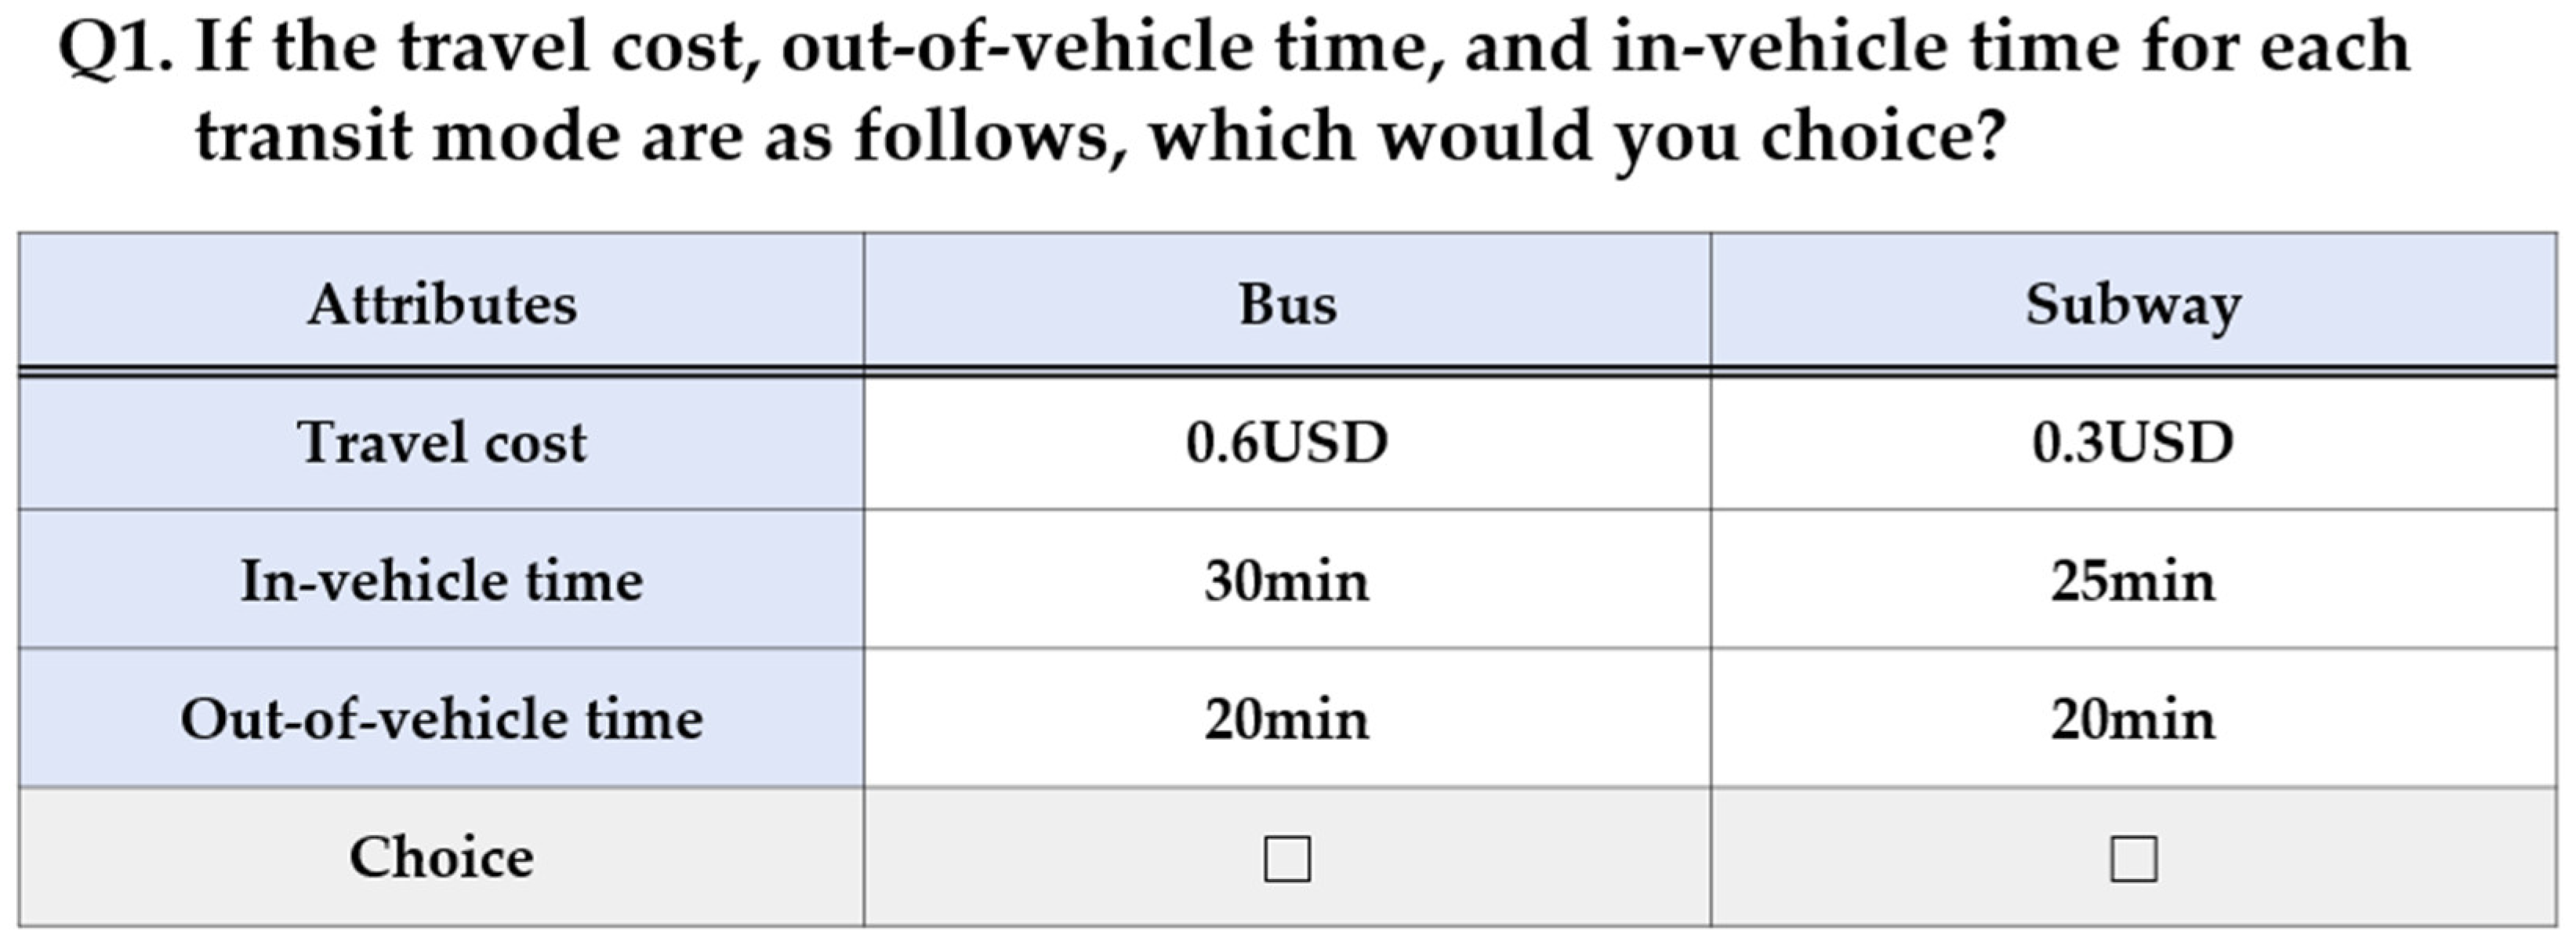
The SP experiment aims to analyze the elderly preferences for two public travel modes. The alternatives are bus service and subway service. The level of each travel attribute applied to the questionnaire is set to a maximum of four to prevent the total number of cases in the experiment from becoming too large (Table 2). Considering that the survey target group is 65 or older, only three attributes were employed to make the survey as simple as possible.
The hypothetical choice situations are constructed with an orthogonal design that provides situations satisfying attribute level balance and estimating all parameters independently. As a result, 32 hypothetical choice situations are generated and divided into 4 blocks consisting of 8 situations (Figure 2).
Figure 1.
The example of stated choice experiments.
3.3. Public Transportation Infrastructure Levels by Region
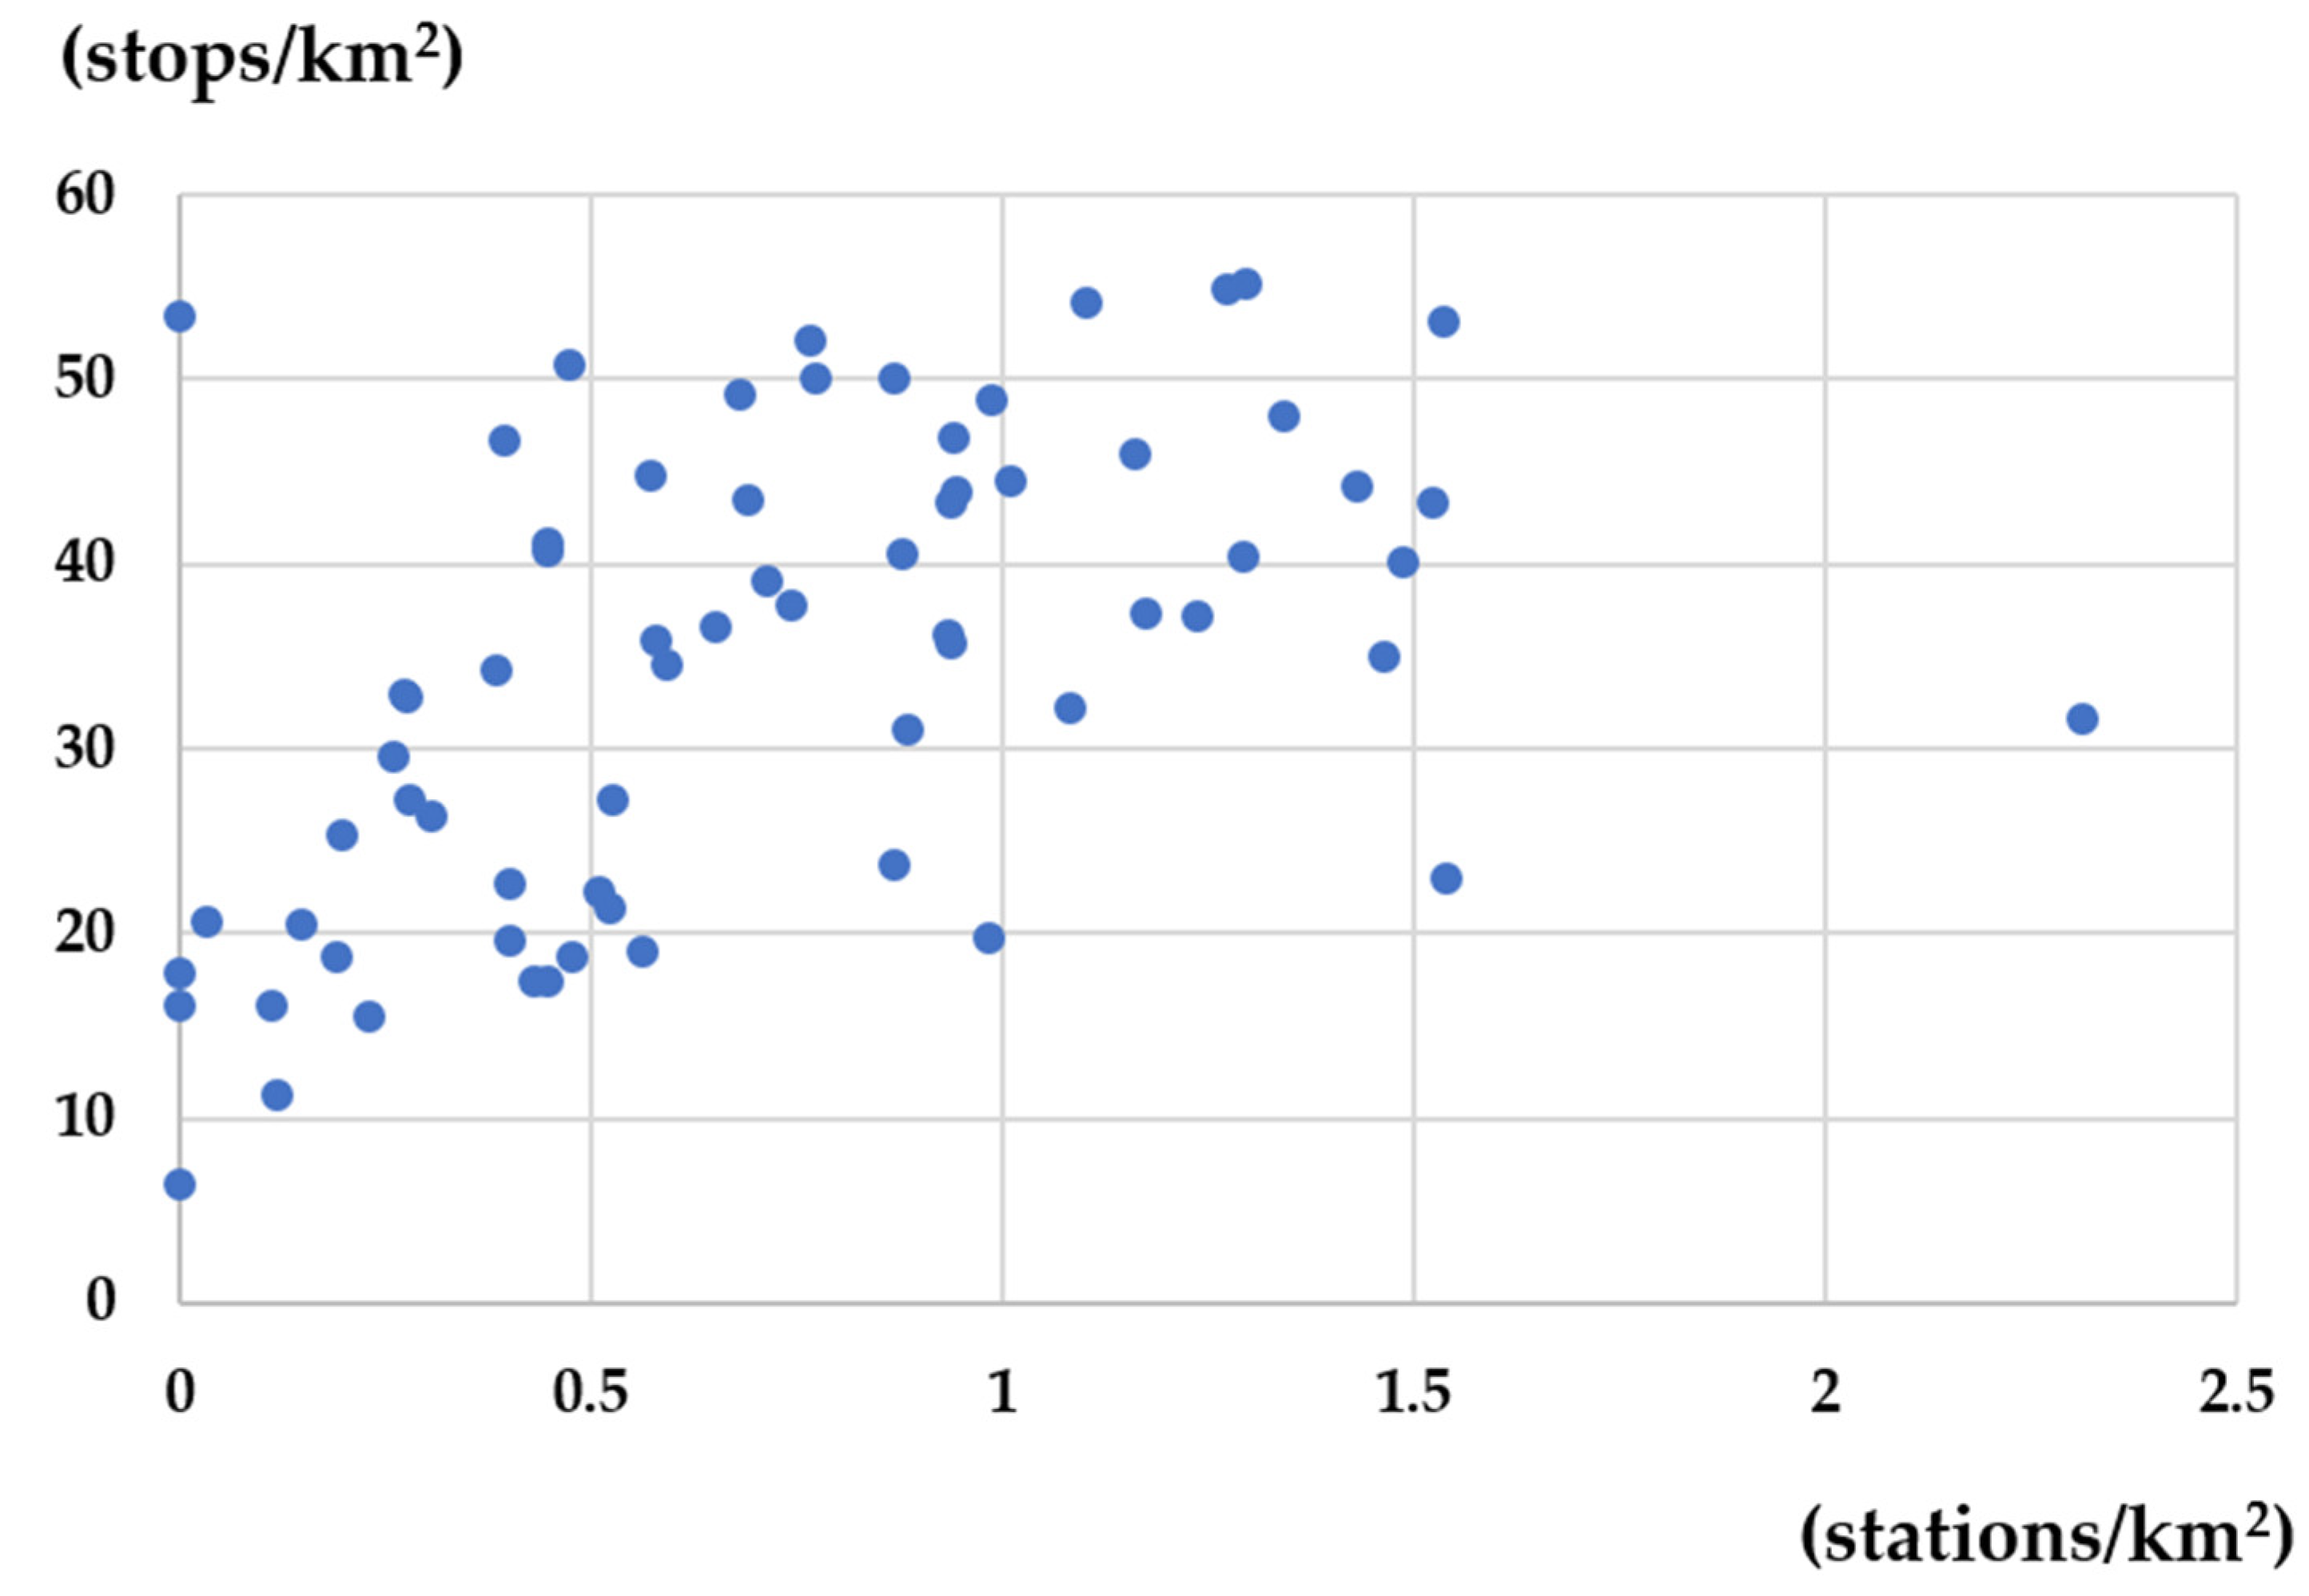
The above survey investigates the potential preference for situations where fares change without additional public transportation infrastructure supply. Hence, the infrastructure level by travel modes currently affects stated preferences, and it is necessary to consider additional data in the analysis to compensate for this. This study additionally considered regional attributes through the urban area's density of public transportation stops. Table 3 shows the distribution of station densities by 25 sub-districts in Seoul, and Table 4 shows the average stop densities in six cities. Table 3 explains that it has various infrastructure levels even within a city, and Table 4 shows that the number of bus stops and subway stations is not linearly correlated. Figure 2 is a scatterplot of the two density indicators, and the pearson correlation coefficient of the two indicators is 0.507. Moreover, since Gwangju and Daejeon have only one subway line, subway stations are concentrated in some sub-districts. Thus, it is expected that the two density indicators will have different effects on classification, and both are employed for analysis.
Figure 2.
The scatterplot of the two density indicators.
3.4. Latent Class Model Configuration
LCM considers heterogeneity, assumes that each individual belongs to a finite group, and is widely employed in various transportaion studies [17,18,19]. In particular, the population can be classified flexibly compared to the mixed logit models that should assume the distribution of parameters [20], so it is used for various marketing analyses. This study focuses on providing flexible policy strategies for the region by dividing the travel behavior of the elderly into regional attributes and individual attributes.
Since the target group of the stated preference experiment is 65 or older, the complex design can confuse and is simply constructed. The information collected in the stated preference question is in-vehicle time, out-of-vehicle time, and travel cost and was adopted as a variable in the discrete choice model part of the LCM. This study assumed that the importance of out-of-vehicle time for buses and subways would be different. The elderly have difficulty accessing the subway because they have to travel underground through stairs or elevators. By contrast, the bus is relatively easy to access because there is no change in the ground level. Thus, out-of-vehicle time was empolyed as an alternative-specific variable, and the remaining two variables were employed as generic variables. The class membership part consists of four personal attributes and one regional attribute: Age, Gender, Driving status, Employment status, and two density indicators. Table 4 summarizes the variables adopted in the LCM model.

Table 5.
Attributes employed in the LCM model.
| Attributs | |
|---|---|
| Discrete choice model part | In-vehicle time, Out-of-vehicle time, travel cost |
| Class membership model part | Age, Gender, Driving status, Employment status, The density of subway stations in urban areas, and The density of bus stops in urban areas. |
4. Results
The latent class model analysis results were estimated from LatentGold, a software package estimating the latent class model, and the goodness of fit of classification was determined Log Likelihood (LL), Bayesian Information Criterion (BIC), Consistent Akaike Information Criterion (CAIC), and ρ2. The qualitative fit of models is shown in Table 6, and the optimal model was chosen as the model with the lowest BIC, as pointed out in previous studies [21,22]. Hence, the five-class model with the lowest BIC was chosen as the optimal model.
The estimation results of the discrete choice model part and the class membership model part are shown in Table 7 and Table 8, respectively. As shown in Table 7, most of the coefficients were reasonably derived except for the in-vehicle time of class 3. Class shares are estimated to be over 10%, except for class 5. Most of the membership variables did not reach the significance level of 0.1, but 13 variables significantly affected the classification, including variables estimated to be less than 0.2. In particular, two density indicators, which refer to heterogeneity according to local infrastructure, influenced the classification.
The discrete choice model part's alternative specific constant indicates that groups except class 5 prefer subways. The strengths of subways, such as travel time reliability and travel safety not considered in this study, had a more significant impact than the inconvenience of access to subways. Figure 3 shows less than 0.5 stations/km2 among the cumulative distribution function for the density of subway stations in five classes. Class 5 prefers buses even if subway fares are lower because the proportion of respondents living in areas with low subway density is higher than that of other classes. Thus, the mode-shifting effect due to the fare discount policy will only be expected after sufficient infrastructure is supplied.
As shown in Table 9, the resistance to the out-of-vehicle time of class 2 leads to the opposite result from the hypothesis of this study. In the following two situations, the effect of extra time on the bus will be more significant than on the subway: The infrastructure of buses and subways is very similar, or the subway infrastructure is better than the bus. The cumulative distribution function of the density indicators of the three classes is shown in Figure 4 and Figure 5. As can be seen from the two figures, class 2 had a higher proportion of respondents living in a high stop and station density than other classes. In addition, as shown in Table 10, the proportion of residents living in Seoul, where the level of public transportation infrastructure distribution is high, was the highest among the three classes. Hence, the effects of out-of-vehicle hours on older people in areas where public transportation is well distributed are almost identical in the two travel modes. By contrast, class 1 and class 3, which are classes with relatively insufficient infrastructure distribution, were consistent with this study's hypothesis that the influence of out-of-vehicle time on the subway was higher than on the bus. In addition, the ratio of the out-of-vehicle time coefficient of the two traffic modes was similarly derived, and the behavior of the two groups was different in the value of out-of-vehicle time.
Figure 6 shows the distribution by class for the four attributes employed as membership variables. As shown in the membership part estimation results, there was no significant difference in distribution of employment status. On the other hand, class 3 and class 5 had a remarkably high proportion of female and most of the respondents who drove belonged to class 1. Finally, class 1 had a high distribution in the 65-69 years group, and there was no apparent difference in other age groups.
The estimation results for each class are summarized in Table 11. Table 11 refers to the average individual and regional attributes of respondents belonging to each class. The out-of-vehicle time values of class 4 and class 5 were excluded because the estimation results of the discrete choice model part were not significant. Class 1 has a high proportion of drivers and employed people because relatively many younger respondents belong to it. On the other hand, class 3 has a personal attribute in contrast to class 1, and the subway density is relatively low. From the comparison between the two classes, the higher the age group, the lower the value of out-of-vehicle time, but the preference between buses and subways does not change significantly. Hence, class 1 and class 3 will mainly appear in cities with better bus infrastructure than subways. Since both classes were estimated to prefer buses, it would be reasonable for cities with these regional attributes to offer higher discount policies for buses rather than subways.
By contrast, class 2, which had many residents in Seoul, showed a different behavior from the above results. In particular, contrasting results were derived from the ratio between out-of-vehicle time coefficients, and it was found that subways were generally preferred. Thus, it would be reasonable for cities with high subway density to provide discount policies for subways rather than buses intensively.
Overall, the elderly's preference for each means depends more on regional attributes than personal attributes. In particular, it is inferred that accessibility to each means had a significant influence, and the impact of personal attributes was small compared to regional attributes, although some important results were derived.
5. Conclusions
This study proposed strategies for improving the fare-free public transportation policy for the elderly in consideration of personal and regional characteristics. Considering the aging society and budget constraints, a strategy for reforming public transportation welfare policies is essential. In this context, this study noted the preference for public transportation of the elderly and pointed out that regional attributes had a significant impact on choice. Generally, subways are less accessible to the elderly than ordinary users because they have to use stairs or elevators to board. Nonetheless, if sufficient subway infrastructure was provided, there was a preferred behavior over buses. In particular, given that the elderly prefer the subway even though they have to walk a long distance, focusing on the subway may be a better option than using the welfare budget for various travel modes.
The regional attributes covered in this study are the density of stations in the urbanized area and the assumption that the stations are evenly distributed is included. Hence, for cities that operate only one or two subway lines, there is an over-estimated limitation in the catchment area of the subway. In future studies, it will be necessary to employ the ratio of the catchment area to the urbanization area as a regional attribute. In addition, a follow-up study will be needed to find out through panel analysis that preference behavior changes as age increases. As mentioned in Section 4, behavioral differences between groups differed significantly according to age, and it is necessary to track whether the younger group has the same behavior as the older group in the future. These follow-up studies can be a significant indicator to improve sustainability by strengthening policy flexibility for future changes.
Author Contributions
Conceptualization, Jaewoong Yun.; methodology, Jaewoong Yun.; software, Jaewoong Yun.; validation, Jaewoong Yun.; formal analysis, Jaewoong Yun.; investigation, Jaewoong Yun.; resources, Jaewoong Yun.; data curation, Jaewoong Yun.; writing—original draft preparation, Jaewoong Yun.; writing—review and editing, Jaewoong Yun.; visualization, Jaewoong Yun.; supervision, Jaewoong Yun.; project administration, Jaewoong Yun. All authors have read and agreed to the published version of the manuscript.
Conflicts of Interest
The authors declare no conflict of interest.
References
- Costa, J.; Alves, T.; Andrade, A.R.; Kalakou, S. Assessing efficiency in public service obligations in European air transport using Data Envelopment Analysis. Case Stud. Transp. Policy 2021, 9, 1783–1809. [Google Scholar] [CrossRef]
- Rye, T.; Mykura, W. Concessionary bus fares for older people in Scotland—Are they achieving their objectives? J. Transp. Geogr. 2009, 17, 451–456. [Google Scholar] [CrossRef]
- 3. Freedom Pass Handbook.
- Public Transit Card data. KoreaTransportation Safety Authority. 2022. Available online: https://stcis.go.kr.
- KOrean Statistical Information Service (KOSIS). 2022. Available online: https://kosis.kr/eng.
- Taylor, B.D.; Tassiello Norton, A. Paying for Transportation: What’s a Fair Price? J. Plan. Lit. 2009, 24, 22–36. [Google Scholar] [CrossRef]
- Litman, T. Evaluating Transportation Equity: Guidance for Incorporating Distributional Impacts in Transport Planning. Victoria Transport Policy institute. 2022.
- Lawlor, M.J. Federal urban mass transportation funding and the case of the Second Avenue Subway. Transp. Q. 1995, 49, 43–54. [Google Scholar]
- Brown, A. Not all fees are created equal: Equity implications of ride-hail fee structures and revenues. Transp. Policy 2022, 1125, 1–10. [Google Scholar] [CrossRef]
- Linovski, O.; Manaugh, K.; Baker, D.M. The route not taken: Equity and transparency in unfunded transit proposals. Transp. Policy 2022, 122, 77–84. [Google Scholar] [CrossRef]
- Claire, P.; Dupont-Kieffer, A.; Palmier, P. Potential accessibility to the workplace by public transit and its social distribution in Lille, France: A scenario-based equity appraisal. Transp. Policy 2022, 125, 256–266. [Google Scholar] [CrossRef]
- Ghosh, T.; Kanitkar, T.; Srikanth, R. Assessing equity in public transportation in an Indian city. Case Stud. Transp. Policy 2022, 10, 2337–2349. [Google Scholar] [CrossRef]
- Sen, S.; Charles, M.B.; Harrison, J.L. Usage-based road pricing and potential equity issues: A study of commuters in South East Queensland, Australia. Transp. Policy 2022, 118, 33–43. [Google Scholar] [CrossRef]
- Jin, T.; Cheng, L.; Wang, K.; Cao, J.; Huang, H.; Witlox, F. Examining equity in accessibility to multi-tier healthcare services across different income households using estimated travel time. Transp. Policy 2022, 121, 1–13. [Google Scholar] [CrossRef]
- Sun, Z.; John Zacharias, J. Transport equity as relative accessibility in a megacity: Beijing. Transp. Policy 2020, 92, 8–19. [Google Scholar] [CrossRef]
- Zhao, P.; Yu, Z. Investigating mobility in rural areas of China: Features, equity, and factors. Transp. Policy 2020, 94, 66–77. [Google Scholar] [CrossRef]
- Zhu, H.; Guan, H.; Han, Y.; Li, W. A Study of Tourists’ Holiday Rush-Hour Avoidance Travel Behavior Considering Psychographic Segmentation. Sustainability 2019, 11, 3755. [Google Scholar] [CrossRef]
- Zhang, X.; Guan, H.; Zhu, H.; Zhu, J. Analysis of Travel Mode Choice Behavior Considering the Indifference Threshold. Sustainability 2019, 11, 5495. [Google Scholar] [CrossRef]
- Casado-Sanz, N.; Guirao, B.; Attard, M. Analysis of the Risk Factors Affecting the Severity of Traffic Accidents on Spanish Crosstown Roads: The Driver’s Perspective. Sustainability 2020, 12, 2237. [Google Scholar] [CrossRef]
- Hensher, D.A.; John, R.M.; Greene, W.H. Applied Choice Analysis; Cambridge University Press: Cambridge, UK, 2015. [Google Scholar]
- Bozdogan, H. Model selection and Akaike’s information criterion (AIC): The general theory and its analytical extensions. Psychometrika 1987, 52, 345–370. [Google Scholar] [CrossRef]
- Wedel, M.; Kamakura, W.A. Market Segmentation: Conceptual and Methodological Foundations; 2nd ed.; 2000.
Figure 3.
Cumulative distribution function of subway station density for all classes.
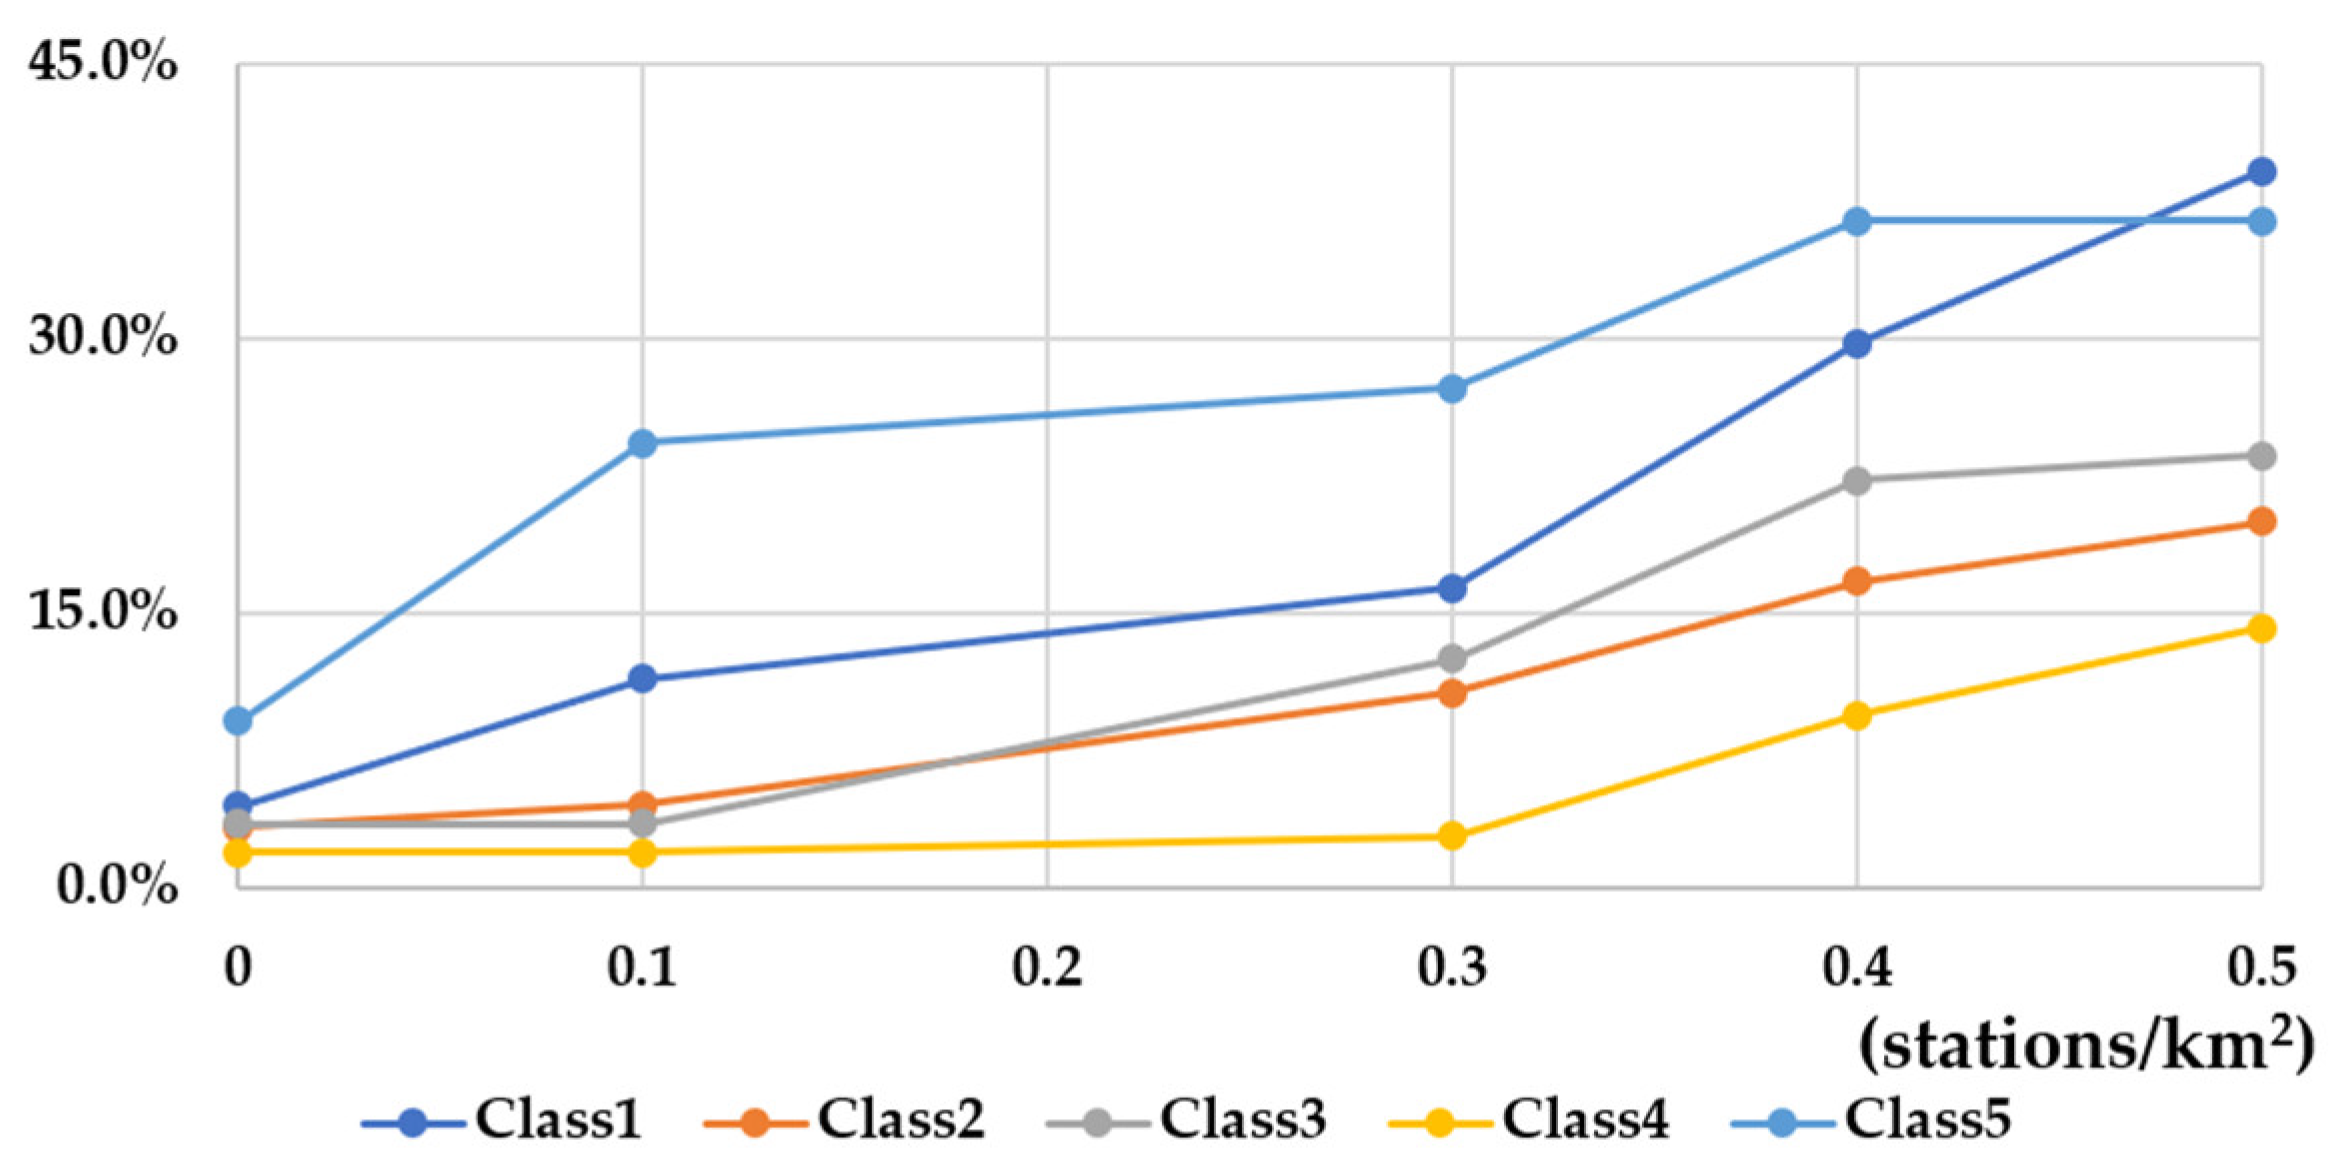
Figure 4.
Cumulative distribution function of subway station density for three classes.
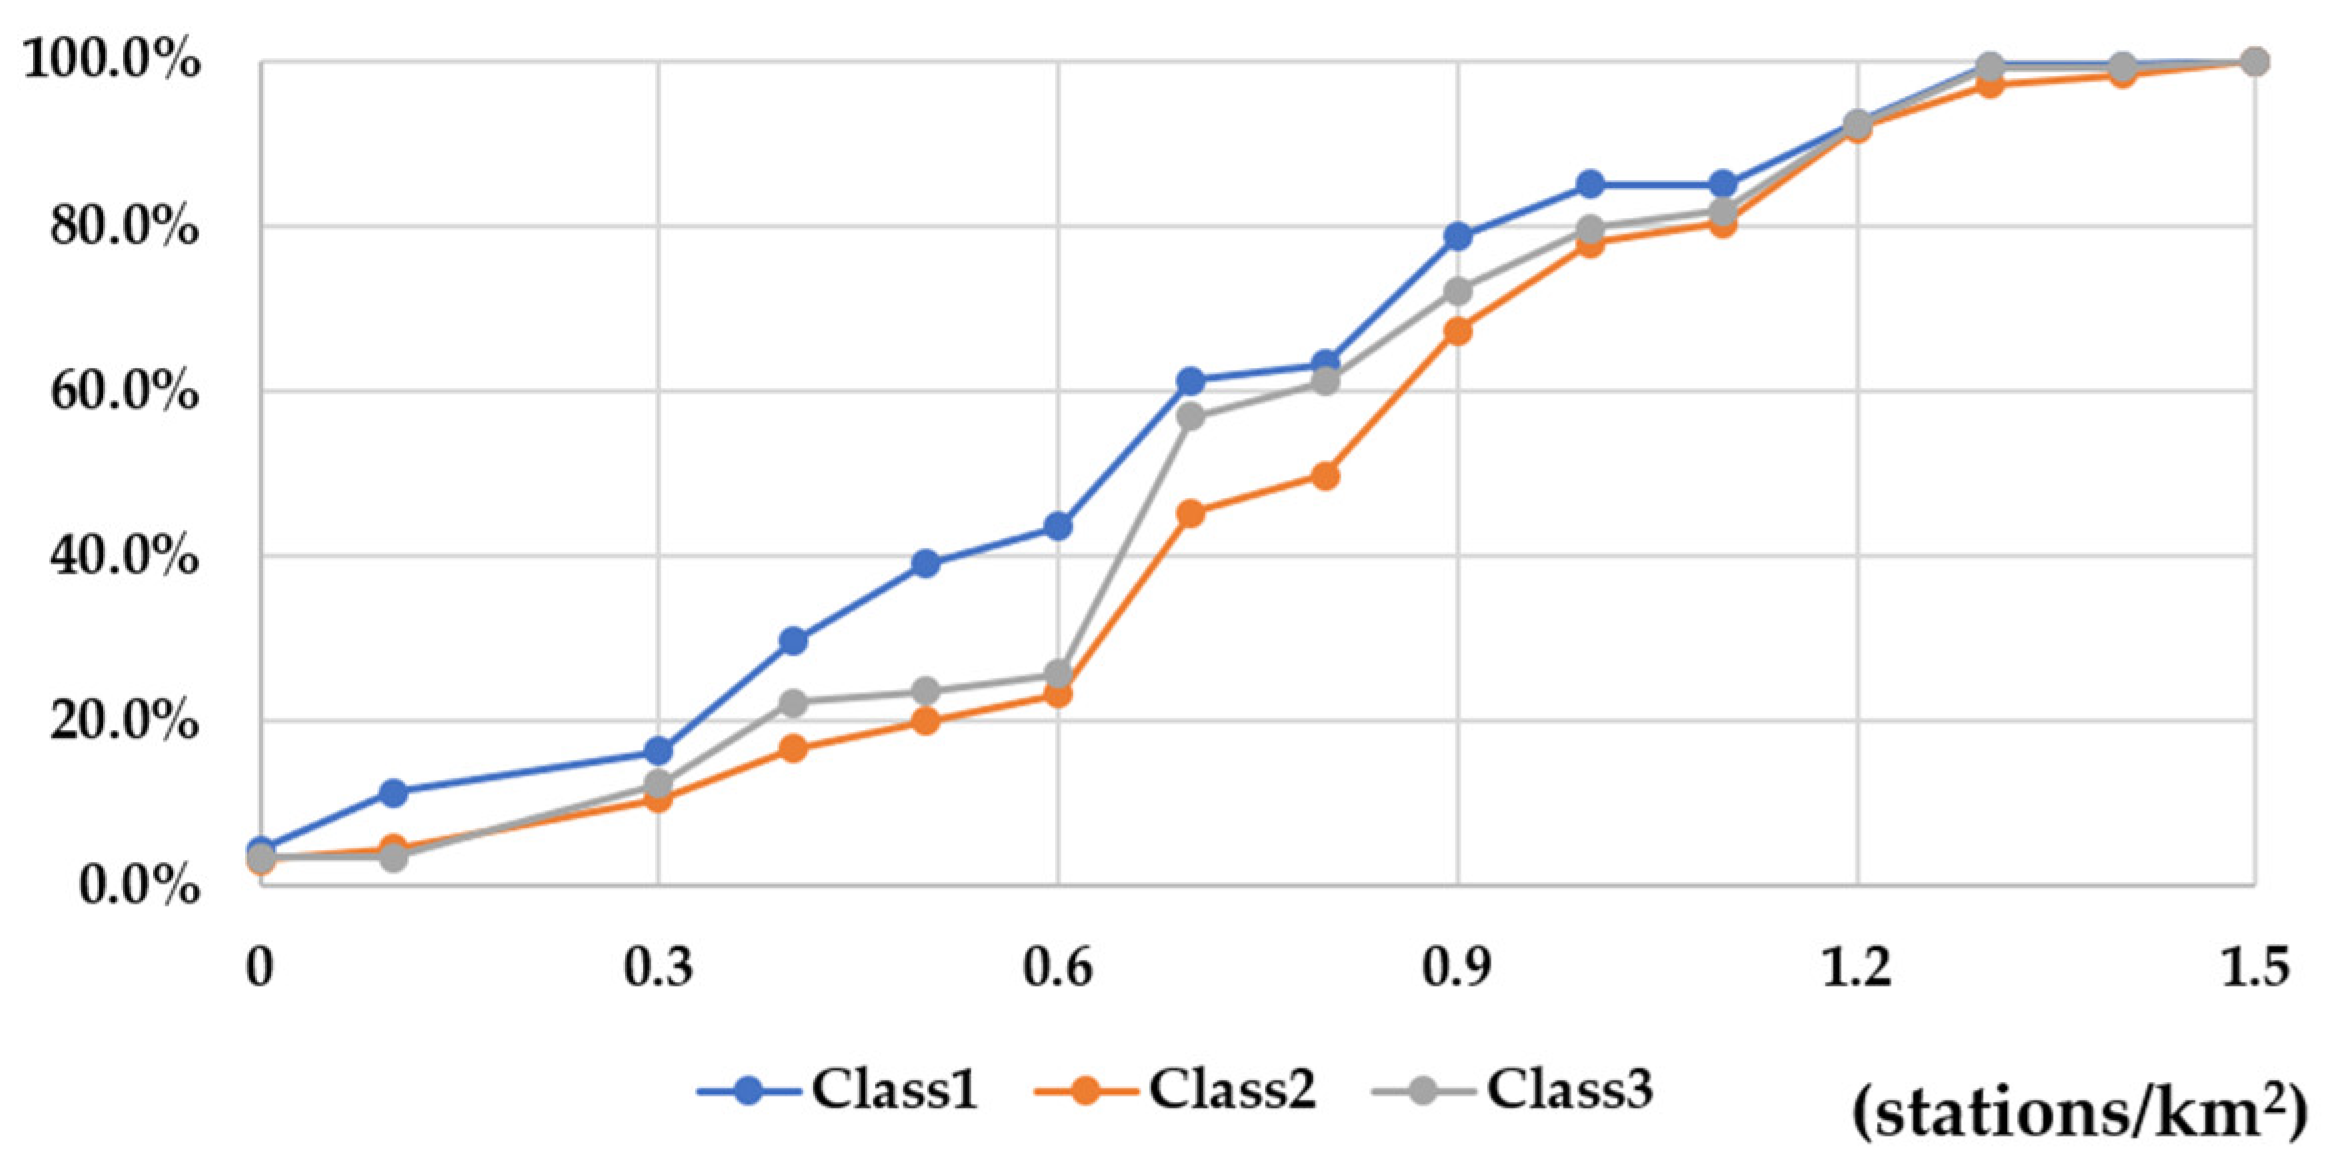
Figure 5.
Cumulative distribution function of bus stop density for three classes.
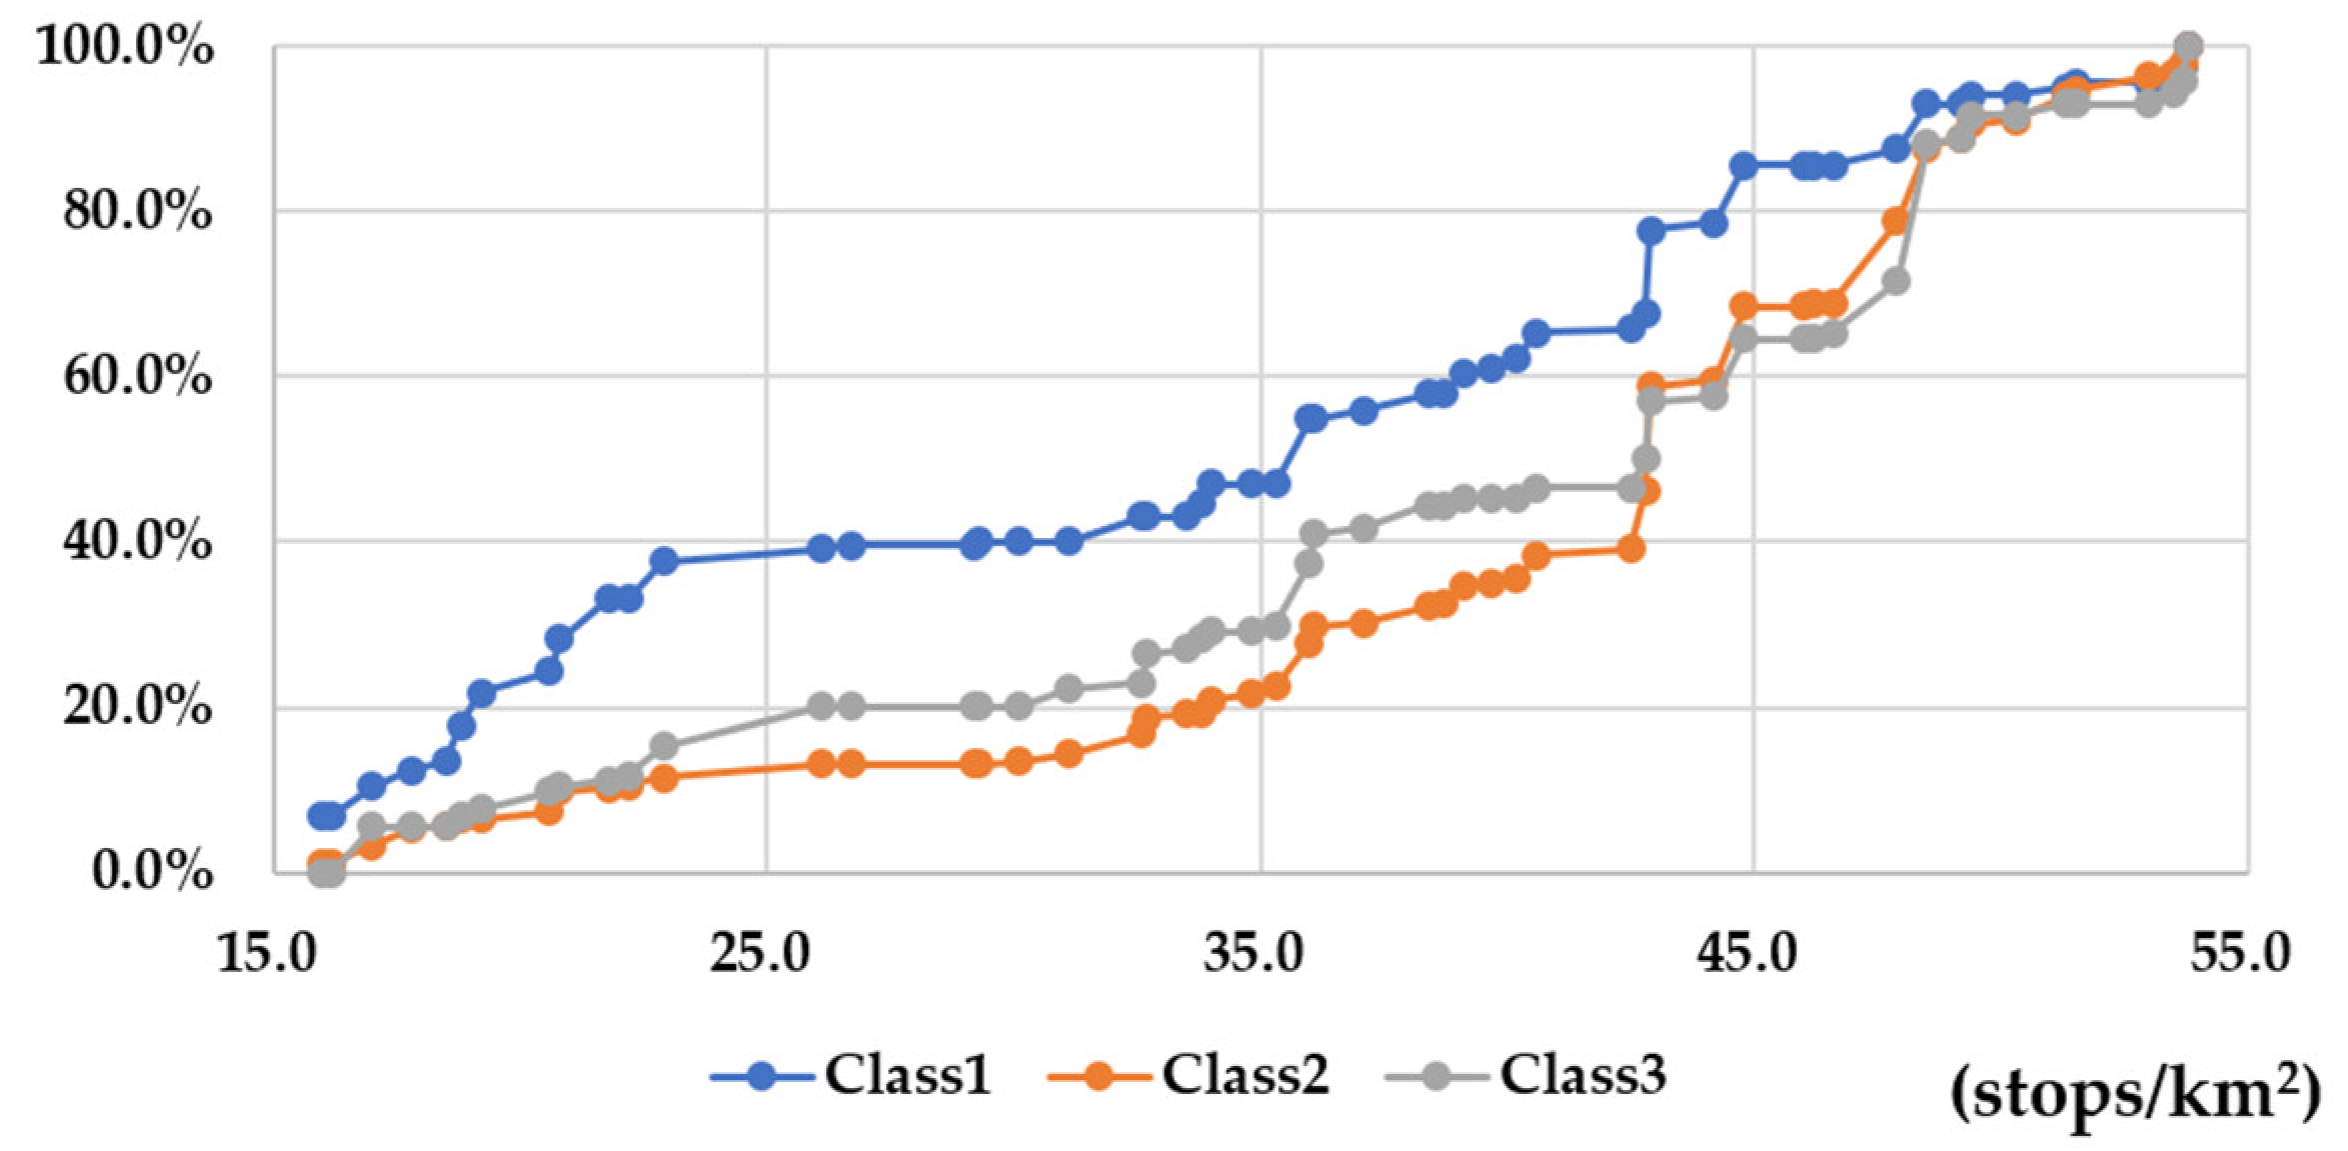
Figure 6.
Cumulative distribution function of bus stop density for three classes.
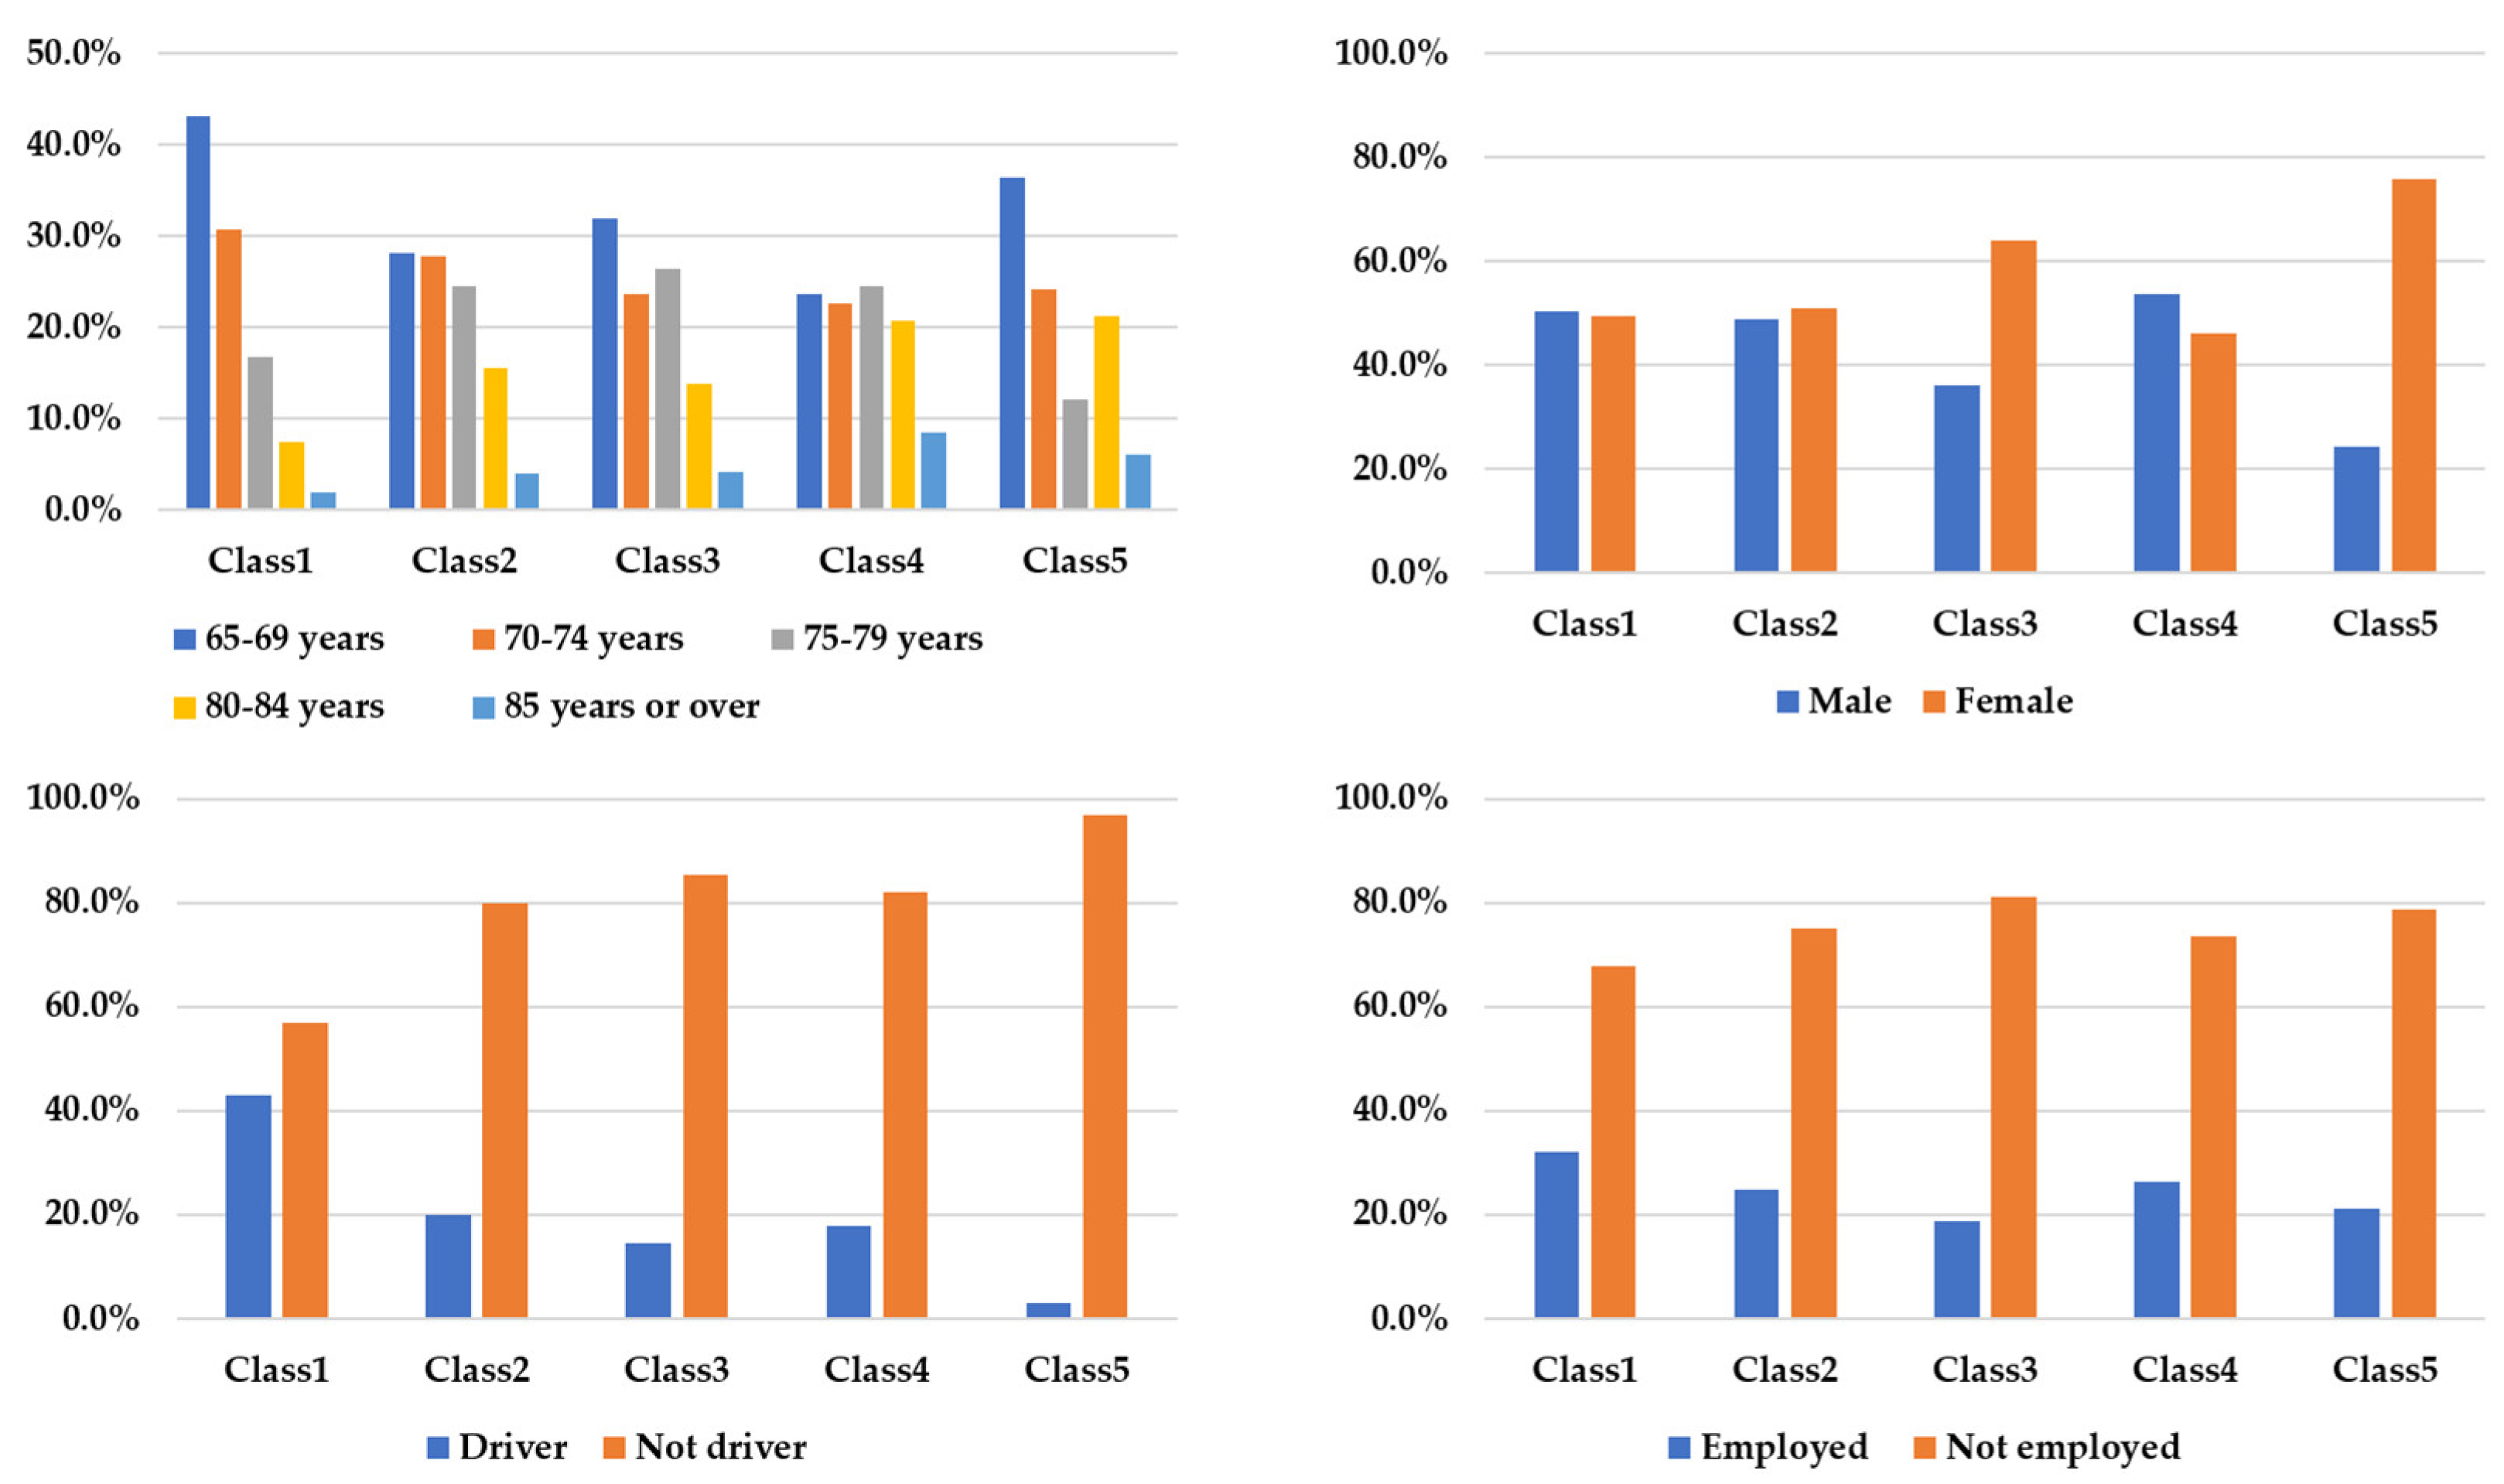
Table 1.
Socio-demographics and distribution of sample (N = 730).
| Variable | Category | Frequency | Distribution (%) |
|---|---|---|---|
| Gender | Male | 391 | 53.6 |
| Female | 339 | 46.4 | |
| Age | 65-69 years | 239 | 32.7 |
| 70-74 years | 196 | 26.8 | |
| 75-79 years | 162 | 22.2 | |
| 80-84 years | 102 | 14.0 | |
| 85 years or over | 31 | 4.3 | |
| Residence | Seoul | 329 | 45.1 |
| Busan | 116 | 15.9 | |
| Daegu | 103 | 14.1 | |
| Incheon | 82 | 11.3 | |
| Gwangju | 50 | 6.8 | |
| Daejeon | 50 | 6.8 | |
| Household Income |
less than 377.5 USD/month | 57 | 7.8 |
| 377.5-755 USD/month | 172 | 23.6 | |
| 755-1,510 USD/month | 230 | 31.5 | |
| 1,510-2,265 USD/month | 161 | 22.1 | |
| 2,265-3,020 USD/month | 66 | 9.0 | |
| 3,020-3,775 USD/month | 28 | 3.8 | |
| 3,775-5,285 USD/month | 8 | 1.1 | |
| More than 5,285 USD/month | 8 | 1.1 | |
| Empolyment status |
Employed | 205 | 28.1 |
| Unemployed | 525 | 71.9 | |
| Driving status |
Driver | 177 | 24.2 |
| Not driver | 553 | 75.8 |
Note: 1 million KRW=755 USD.
Table 2.
Attribute level.
| Attribute | Level |
|---|---|
| Travel cost (USD) | 0.3, 0.6, 0.9 |
| In-vehicle time (min) | 25, 30, 35, 40 |
| Out-of-vehicle time (min) | 5, 10, 15, 20 |
Table 3.
The distribution of density indicators in Seoul.
| Variable | Category | Frequency | Distribution (%) |
|---|---|---|---|
| The density of subway stations in urban areas (stations/km2) |
less than 0.5 stations/km2 | 3 | 12.0 |
| 0.5 - 1.0 stations/km2 | 10 | 40.0 | |
| 1.0 - 1.5 stations/km2 | 9 | 36.0 | |
| 1.5 - 2.0 stations/km2 | 2 | 8.0 | |
| more than 2.0 stations/km2 | 1 | 4.0 | |
| The density of bus stops in urban areas (stops/km2) |
less than 35 stops/km2 | 4 | 16.0 |
| 35 - 40 stops/km2 | 6 | 24.0 | |
| 40 - 45 stops/km2 | 7 | 28.0 | |
| 45 - 50 stops/km2 | 5 | 20.0 | |
| more than 50 stops/km2 | 3 | 12.0 |
Note: Urban area refers to areas requiring systematic development, maintenance, management, and preservation.
Table 4.
The density indicators in six cities.
| District | The density of subway stations in urban areas (stations/km2) |
The density of bus stops in urban areas (stops/km2) |
|---|---|---|
| Seoul | 1.049 | 41.202 |
| Busan | 0.574 | 35.287 |
| Daegu | 0.486 | 17.715 |
| Incheon | 0.438 | 28.612 |
| Gwangju | 0.163 | 17.879 |
| Daejeon | 0.227 | 27.317 |
Note: Urban area refers to areas requiring systematic development, maintenance, management, and preservation.
Table 6.
Quantitative fit of 1-6 latent class membership models.
| Number of classes | Number of parameters | LL | AIC | BIC | CAIC | ρ2 |
|---|---|---|---|---|---|---|
| 1 | 5 | -2,974.169 | 5,958.339 | 5,981.304 | 5,963.339 | 0.340 |
| 2 | 17 | -2,698.906 | 5,431.813 | 5,509.894 | 5,448.813 | 0.514 |
| 3 | 29 | -2,524.673 | 5,107.346 | 5,240.544 | 5,136.346 | 0.586 |
| 4 | 41 | -2,465.915 | 5,013.830 | 5,202.145 | 5,054.830 | 0.651 |
| 5 | 53 | -2,414.765 | 4,935.530 | 5,178.962 | 4,988.530 | 0.679 |
| 6 | 65 | -2,377.192 | 4,884.384 | 5,182.932 | 4,949.384 | 0.713 |
Table 7.
Estimation results of discrete choice model part.
| Attributes | Class 1 | Class 2 | Class 3 | Class 4 | Class 5 | |||||
|---|---|---|---|---|---|---|---|---|---|---|
| coefficient | p-value | coefficient | p-value | coefficient | p-value | coefficient | p-value | coefficient | p-value | |
| Constant (Bus) | -0.47313 | 0.029 (**) |
-2.23627 | 0.015 (**) |
-1.15786 | 0.236 | -3.59877 | 0.000 (***) |
4.39818 | 0.016 (**) |
| Out-of-vehicle time (Bus) (min) |
-0.07001 | 0.000 (***) |
-0.12609 | 0.003 (***) |
-1.06068 | 0.005 (***) |
0.03709 | 0.189 | -0.13042 | 0.157 |
| Out-of-vehicle time (Subway) (min) |
-0.09516 | 0.000 (***) |
-0.12554 | 0.042 (**) |
-1.46962 | 0.003 (***) |
0.00553 | 0.390 | -0.02889 | 0.352 |
| In-vehicle time (min) |
-0.03539 | 0.000 (***) |
-0.08819 | 0.000 (***) |
0.80961 | 0.014 (**) |
-0.01411 | 0.311 | -0.10597 | 0.189 |
| Travel cost (KRW) |
-0.00146 | 0.000 (***) |
-0.01215 | 0.000 (***) |
-0.03457 | 0.001 (***) |
-0.00255 | 0.000 (***) |
-0.00191 | 0.010 (**) |
| Class shares | 31.3% | 29.5% | 19.2% | 15.6% | 4.4% | |||||
Note: *** An estimate whose p-value is less than 0.01. *** An estimate whose p-value is less than 0.05. *** An estimate whose p-value is less than 0.1.
Table 8.
Estimation results of class membership model part.
| Attributes | Class 1 | Class 2 | Class 3 | Class 4 | Class 5 | |||||
|---|---|---|---|---|---|---|---|---|---|---|
| coefficient | p-value | coefficient | p-value | coefficient | p-value | coefficient | p-value | coefficient | p-value | |
| Age | -0.04940 | 0.191 | -0.01926 | 0.353 | -0.03822 | 0.253 | 0.00825 | 0.391 | - | - |
| Gender (male=1) |
0.63270 | 0.202 | 0.90848 | 0.084 (*) |
0.45444 | 0.277 | 1.05780 | 0.059 (*) |
- | - |
| Driving status |
2.63002 | 0.033 (**) |
1.88400 | 0.111 | 1.55523 | 0.172 | 1.87993 | 0.117 | - | - |
| Empolyment status |
-0.44045 | 0.292 | -0.21083 | 0.370 | -0.54581 | 0.250 | 0.04605 | 0.398 | - | - |
| The density of subway stations in urban areas (stations/km2) | 1.18972 | 0.126 | 1.08453 | 0.146 | 0.57986 | 0.304 | 2.01482 | 0.016 (**) |
- | - |
| The density of bus stops in urban areas (stops/km2) | -0.01056 | 0.361 | 0.04026 | 0.094 (*) |
0.03093 | 0.178 | 0.02912 | 0.206 | - | - |
Note: *** An estimate whose p-value is less than 0.01. *** An estimate whose p-value is less than 0.05. *** An estimate whose p-value is less than 0.1.
Table 9.
Coefficient ratio and out-of-vehicle time values.
| Number of classes | Class 1 | Class 2 | Class 3 |
|---|---|---|---|
| Out-of-vehicle time (Bus)/Out-of-vehicle time (Sub) | 0.73569 | 1.00441 | 0.72174 |
| Out-of-vehicle time value (Bus) (USD/hour) | 2.190 | 0.473 | 1.399 |
| Out-of-vehicle time value (Sub) (USD/hour) | 2.976 | 0.471 | 1.939 |
Table 10.
Percentage of respondents per city in 3 classes.
| District | Class 1 | Class 2 | Class 3 |
|---|---|---|---|
| Seoul | 28.7% | 51.0% | 34.0% |
| Busan | 15.8% | 17.6% | 17.4% |
| Daegu | 13.4% | 14.3% | 25.0% |
| Incheon | 21.3% | 6.5% | 11.8% |
| Gwangju | 14.4% | 2.4% | 2.8% |
| Daejeon | 6.4% | 8.2% | 9.0% |
Table 11.
Summary of chracteristics per class.
| District | Class 1 | Class 2 | Class 3 | Class 4 | Class 5 |
|---|---|---|---|---|---|
| Age |
71.7 (5th) |
74.1 (2nd) |
73.7 (4th) |
75.4 (1st) |
74.0 (3rd) |
| Gender (male=1) |
0.50 | 0.49 | 0.36 | 0.54 | 0.24 |
| Driving status |
0.43 | 0.20 | 0.15 | 0.18 | 0.03 |
| Empolyment status |
0.32 | 0.25 | 0.19 | 0.26 | 0.21 |
| The density of subway stations in urban areas (stations/km2) | 0.68 (4th) |
0.81 (2nd) |
0.76 (3rd) |
0.92 (1st) |
0.65 (5th) |
| The density of bus stops in urban areas (stops/km2) |
17.19 (1st) |
11.74 (4th) |
13.64 (3rd) |
11.57 (5th) |
14.06 (2nd) |
| Out-of-vehicle time value | 1st | 3rd | 2nd | - | - |
| Class share | 31.3% | 29.5% | 19.2% | 15.6% | 4.4% |
Disclaimer/Publisher’s Note: The statements, opinions and data contained in all publications are solely those of the individual author(s) and contributor(s) and not of MDPI and/or the editor(s). MDPI and/or the editor(s) disclaim responsibility for any injury to people or property resulting from any ideas, methods, instructions or products referred to in the content. |
© 2023 by the authors. Licensee MDPI, Basel, Switzerland. This article is an open access article distributed under the terms and conditions of the Creative Commons Attribution (CC BY) license (http://creativecommons.org/licenses/by/4.0/).
Copyright: This open access article is published under a Creative Commons CC BY 4.0 license, which permit the free download, distribution, and reuse, provided that the author and preprint are cited in any reuse.


