
Submitted:
29 August 2023
Posted:
05 September 2023
You are already at the latest version
Abstract
Background: Vitamin B12 is a water-soluble vitamin with important cellular functions and is an essential vitamin. The aim of this study is to determine the B12 levels of children in the period from the 6th month when they start taking additional foods to the age of 7 and the risk factors affecting them. Methods: One hundred pediatric patients aged 6-72 months who were diagnosed with vitamin B12 deficiency and their parents who agreed to participate in Istanbul Atlas University, Medical Faculty, “Medicine Hospital” Pediatric Clinic between September 2022 and June 2023 were prospectively included in this study. Results: B12 deficiency was significantly higher in the 6-11 (25%) month group than those in the 12-23 (5.8%) and 24-47 (2.8%) month groups. Homocysteine levels were highest in those with insufficient B12 levels compared to the other groups. There was no statistically significant difference in weekly dairy and meat consumption levels between age groups. B12 levels were lower in the 6-11-month group than in the other groups. Homocysteine levels were highest in those with insufficient B12 levels [<200 pg/mL (148 pmol/L)]. Folic acid levels were lower in the 24-47 month and 48-72 month groups than in the 6-11 month and 12-23 month groups. Conclusions: The results obtained in this study showed that low vitamin B12 and increased homocysteine levels seem to be important risk factors in children, especially from the 6th month when they start taking additional foods. The diagnosis of B12 deficiency can be confirmed by elevated serum total homocysteine levels, which are evidence of functional cobalamin deficiency.
Keywords:
children
; risk factors
; vitamin B12
; homocysteine
; folic acid
; ferritin
Introduction
Vitamin B12 (B12; also known as cobalamin) is a water-soluble vitamin that cannot be synthesized in the human body and whose main source is animal foods such as meat, fish, and dairy products. Problems such as megaloblastic anemia and neuromotor developmental delay that occur in its deficiency are causes of serious morbidity (1,2). B12 deficiency is an important health problem in Turkey as well as worldwide (3). However, high B12 values suggest that leukemia may develop later in some pediatric patients (4).
Vitamin B12 has important functions in the body. One of these functions is to use it as a cofactor while forming methionine from homocysteine. In the deficiency of this vitamin, there is an increase in homocysteine levels (5). Vitamin B12 deficiency is mostly due to cobalamin absorption insufficiency, which occurs due to functional disorders in the gastrointestinal tract (6). Hypotonia, apathy, adynamia, loss of visual contact, lethargy, and coma may be seen in children of mothers with low socioeconomic status or inadequate food intake or with accompanying signs of pernicious anemia (7).
Vitamin B12 stores of newborn babies depend on their mothers' B12 levels. However, after the 6th month, with the intake of additional nutrients, external B12 intake begins. Since vitamin B12 is mainly found in animal foods, deficiency is common in children, especially in developing countries, in those who do not consume enough of this type of food. Since B12 deficiency is common in children who visited our outpatient clinic, we wanted to evaluate these patients in terms of their risk. The aim of this study is to determine the B12 levels of children in the period from the 6th month when they start taking additional foods to the age of 7 and the risk factors affecting them.
Materials and methods
This prospective study was approved by the Istanbul Atlas University ethics committee, Istanbul (Approval Date: August 12, 2022; number: E-22686390-050.99-19213) and was conducted in accordance with the Declaration of Helsinki. An “informed consent form” was obtained from the legal parents for each child included in the study. One hundred and sixty children aged 6-72 months who were diagnosed with vitamin B12 deficiency and their parents who agreed to participate in Istanbul Atlas University, Medical Faculty, “Medicine Hospital” Pediatric Clinic between September 2022 and June 2023 were prospectively included in this study.
Detailed anamnesis (complaints on admission, whether there is a diagnosed disease or a drug that they use constantly, weekly dairy and meat consumption of the children, especially the vitamin supplements) were questioned and recorded on the forms specially prepared for the study. Detailed physical examinations were performed, and growth and development assessments, which may be clinical signs of B12 deficiency, were performed and recorded.
The social, economic, anthropometric and nutritional levels of the family (mother and father) were also questioned.
Exclusion Criteria
Children were excluded from the study if they were taking any medication, had a disease related to parasitosis and malabsorption, had acute infection, mental retardation, hereditary neuropathies, neurodegenerative diseases, autoimmune diseases, primary cardiac pathologies, and hormonal disorders, whose parents were vegan or vegetarian.
Blood samples were taken into standardized tubes without anticoagulant and containing ethylenediamine tetraacetic acid (EDTA) for complete blood count (CBC) parameters. The CBC results were recorded with an automatic hematology analyzer (Sysmex XN-1000, Kobe, Japan). The neutrophil-lymphocyte ratio (NLR), and platelet-lymphocyte ratio (PLR) were calculated from neutrophil/lymphocyte/thrombocyte counts.
Serum vitamin B12, ferritin, homocysteine, and folate levels were measured by Chemiluminiscent Microparticle Immuno Assay (CMIA) technology with assay protocols, referred to as Chemiflex. The required kits were purchased from Abbott Diagnostics. All the parameters were analyzed on an automated biochemistry analyzer (Architect i2000, Illinois, USA). Vitamin B12 levels <200 pg/mL (148 pmol/L) have been defined as deficiency and 200-300 pg/mL (148-221 pmol/L) has been defined as a borderline value (8,9).
Statistical analysis
Statistical Package for the Social Sciences version 21.0 software package for Windows (IBM Corp., Armonk, NY, USA) was used for data evaluation and analysis. Jamovi 2.3.18 was used to create figures. Categorical variables are presented as frequencies (n) and percentages (%), and numerical variables are presented as medians (25. Percentile- 75th percentile). The Kolmogorov‒Smirnov test was applied for normality analysis. The chi-square test or Fisher’s exact test was used to compare the distribution of categorical variables between groups. One-way ANOVA or the Kruskal‒Wallis test was used to compare continuous variables between three independent groups. The Tukey HSD test was used for the post hoc analysis after one-way ANOVA; adjusted p values were used after the Kruskal‒Wallis test. A value of p < 0.05 was accepted as statistically significant.
Results
The characteristics of the participants by age group are shown in Table 1. Of those included in the study, 55.9% were male, and 93.5% were term. A total of 26.5% had used only breastmilk, 20.6% breastmilk and formula, 34.1% breastmilk and supplementary food, and 18.8% formula/supplementary food for the first 6 months. In addition, 17.6% received vitamin supplements. A total of 1.2% received fish oil, 12.4% received vitamin D, 8.8% received iron, and 1.2% received vitamin B. Vitamin B12 levels were <200 in 11.2%, 200-299 in 23.5%, and ≥300 in 65.3%.
The vitamin B12 level of 11.2% of those included in the study was <200, that of 23.5% was 200-299, and that of 65.3% was ≥300. According to age groups, gender, term status, nutritional status in the first 6 months, and mother or father education status were similar. At 24 months and later, the use of vitamin supplements decreased significantly (p:<0.001), while fish oil and vitamin B supplementation did not show a statistically significant difference; vitamin D and iron supplementation decreased with increasing age. None of the patients who were 24 months or older were receiving vitamin D, iron, or B vitamin supplements. Twenty-five percent of those in the 6-11 months group had vitamin B12 deficiency, 5.8% of those in the 12-23 months group, 2.8% of those in the 24-47 months group, and 8.8% of those in the ≥48 months group had B12 deficiency. B12 deficiency was significantly higher in the ≤11 months group than in the 12-23 and 24-47 months groups (p<0.001).
In Table 2, demographic, food consumption and laboratory characteristics by age groups are shown. There was no statistically significant difference between the weekly dairy product and meat consumption levels between age groups (p=0.199; p=0.051, respectively). B12 levels were significantly lower in the 6-11 month group (282; 201.5-405.5) than in the other groups (p=0.001). Homocysteine levels were significantly higher in the 11-month group (7.38; 5.62-9.4) than in the 24-47-month group (p=0.002). Folic acid levels were significantly lower in the 24-47 months (10.34±3.75) and ≥48 months (9.35±3.93) groups than in the ≤11 months (14.86±2.42) and 12-23 months (14.09±3.55) groups (p: <0.001). Hgb levels were significantly lower in the ≤11 month group (11.35±0.93) and 12-23 month group (11.68±1) than in the ≥48 month group (12.23±0.97) (p=0.001). NLR, PLR and SII levels were not significantly different between age groups. (p: 0.638; 0.746; 0.620). No significant difference was found between the social, economic, anthropometric and nutritional levels of the family (mother and father) (p>0.05).
Table 3 shows the distribution of demographic and nutritional characteristics according to B12 levels. A total of 57.9% of those with insufficient B12 levels (<200), 57.5% of those with borderline B12 levels (200-299), and 55% of those with normal B12 levels (≥300) were male; B12 levels and gender distribution were similar (p=0.972). The distribution between B12 levels and term delivery was similar. A total of 63.2% of those with insufficient B12 levels, 40% of those with borderline B12 levels, and 18% of those with normal B12 levels were ≤11 months; insufficient and borderline B12 levels at ≤11 months were significantly higher (p<0.001). The rate of feeding with formula/supplementary food was significantly higher in patients with normal B12 levels (p=0.026). There was no significant relationship between B12 levels and vitamin supplementation and its subtypes. No significant relationship was found between maternal or paternal education and B12 levels.
Table 4 shows the relationship between B12 levels and demographic, nutritional and laboratory characteristics. While the weekly consumption of dairy products was significantly lower in those with insufficient B12 levels than in those with normal levels, there was no statistically significant relationship between the frequency of meat consumption and meat consumption. There was a significant difference in homocysteine between all three B12 levels; homocysteine levels were higher in those with insufficient B12 levels (p<0.001). There was no statistically significant difference between B12 levels in terms of ferritin, NLR, PLR, and SII.
While B12 levels and homocysteine levels showed a negative correlation (r=0.63) in the whole group, no significant correlation was observed in those with insufficient and borderline B12 levels; however, a negative correlation (r=-0.320) was found in those with normal B12 levels. While there was no significant correlation between folic acid levels and B12 levels in the whole group, in those with insufficient and borderline B12 levels, a positive correlation (r=0.270) was observed in those with normal B12 levels. The correlation between B12 levels and homocysteine in all groups is shown in Figure 1.
Discussion
There is no clear consensus on blood concentrations of B12 in the world (10). In the present study, B12 deficiency was significantly higher in the 6-11 (25%) month group than in the 12-23 (5.8%) and 24-47 (2.8%) month groups. Homocysteine levels were highest in those with insufficient B12 levels compared to the other groups. There was no statistically significant difference in weekly dairy and meat consumption levels between age groups. Another important result obtained is that homocysteine levels were highest in those with insufficient B12 levels [<200 pg/mL (148 pmol/L)]. Folic acid levels were lower in the 24-47 month and 48-72 month groups than in the 6-11 month and 12-23 month groups. Vitamin B12 is important for healthy body functions because it has important cellular functions. It has an active role in growth, development and neurologic processes, especially in children. Therefore, children are highly susceptible to B12 deficiency. The results are important for identifying the risk group and taking precautions. Evaluation of blood homocysteine levels in terms of risk, especially when breastfeeding is discontinued and supplementary food is started, is important in terms of prevention of future disorders.
When the causes of micronutrient deficiencies are investigated, poor socioeconomic conditions are frequently mentioned. To determine the etiology, we questioned the income status of the family, educational status and occupation of the parents, vitamin supplementation and dietary patterns of the children. In the current study, no statistically significant relationship was found between B12 deficiency and the educational level and occupation of the mother and father. At 24 months and later, the intake of vitamin supplements decreased significantly, while fish oil and vitamin B supplementation did not show a statistically significant difference. Supplementary intake, especially vitamin D and iron supplementation, decreased with increasing age. B12 deficiency (<200 pg/mL) was seen in 12 patients aged 6-11 months, 3 patients aged 12-23 months, and 1 patient aged 24-47 months, and no B12 deficiency was seen in patients aged 48-72 months despite not receiving vitamin D and iron. B12 at the limit (200-299 pg/mL) was seen in 16 subjects aged 6-11 months, 15 subjects aged 12-23 months, 6 subjects aged 24-47 months and 3 subjects aged 48-72 months. Basically, if RDW is increased with anemia in the blood count, nutritional deficiency should be considered; if MCV is low, iron deficiency should be considered. deficiency, B12 or folic acid deficiency if MCV is high may be in question. In the current study, anemia due to erythrocyte morphology and pathophysiology, vitamin B12 and folic acid deficiency was not observed. This is because vitamin B12 can be stored in the liver. Studies including iron, vitamin B12 and folate deficiencies according to age groups have been conducted. When the participants were categorized according to B12 levels, although there were differences in HGB, HCT, MCV and MCH levels, all values were within normal values. The values of the new inflammatory markers NLR, PLR and SII were at similar levels. İn Atlanta, Ramussen et al. (11) found that vitamin B12 deficiency was high in the 12-18 age group. However, when clinicians recognize the symptoms of B12 deficiency, B12 levels should be checked even in the absence of anemia. It has been emphasized that neurological findings may be observed in patients with B12 and folate deficiency without megaloblastic anemia, and the neurological symptoms may be more severe (12-14). In the last third of the 20th century, these deeply held misconceptions were slowly eroded with the application of folate and vitamin B12 assays and other techniques to neuropsychiatric patients with and without megaloblastic anemia (12).
Vitamin B12 deficiency is common in Turkey. Response to treatment is rapid and effective. However, delays may result in neurological sequelae. Although deficiencies, especially in infancy, are generally reported as case reports in Western studies, it has been reported that nutritional deficiency is more common in Turkey, India and Lebanon (15,16). In the current study, B12 < 200 pg/mL in 6 (31,6%), B12=200-299 pg/mL in 10 (25,0%) and B12 ≥300 pg/mL in 29 (26,1%) breastfed children. B12<200 pg/mL was not found in any of the children fed with formula and/or supplementary food, B12=200-299 pg/mL in 3 (7,5%) children and B12 ≥300 pg/mL in 29 (26,1%) children. Similar to our study, in the study conducted by Minet et al. (17), vitamin B12 levels were found to be lower in children who received breast milk as the main nutrition and who were not switched to supplementary food on time. In addition, vitamin B12 deficiency was not found in children fed formula. This was attributed to the fact that the low level of vitamin B12 (0.3-0.5 mcg/100 ml) in formula foods prevented vitamin B12 deficiency and the socioeconomic level of these families was higher. Vitamin B12 deficiency, which has an important role in brain development from the period in the womb, is a preventable cause of neurological deficits. Therefore, screening and treatment before clinical symptoms occur are very important. We think that our study is useful in this regard.
Vitamin B12 is a cofactor involved in DNA synthesis, methylation, and neurotransmitter synthesis and is also involved in the homocysteine/methionine cycle. Therefore, vitamin B12 deficiency during periods of rapid growth, such as neonatal and infancy, leads to much more important symptoms than the symptoms of anemia seen at other times. Two cobalamin-dependent reactions reduce plasma levels of two toxic materials. 1) Homocysteine is associated with vascular endothelial damage. 2) Methylmalonyl CoA can cause metabolic acidosis. In 2003, Anne-Lise Bjorke et al. (18) investigated the relationship between plasma cobalamin, folic acid, methylmalonic acid and total homocysteine in 700 children of different age groups between 4 days and 19 years. They found a strong correlation between cobalamin deficiency in the first 6 months of life and elevated serum homocysteine. In our study, B12 levels were significantly lowest in the 6-11-month group, and a significant difference was found between the groups. Although homocysteine and folic acid levels were within normal limits in all groups, the highest homocysteine level was significant in the 6-11-month group. A significant difference was found between the groups. In the >300 pg/mL group, there was a weak correlation between B12 and homocysteine and a positive correlation with folic acid. However, no correlation was found in the 6-11-month group. When all participants were evaluated, a highly negative correlation was found between B12 and homocysteine. Although homocysteine levels were highest in children with B12 <200 pg/mL, no significant correlation was found. The reason for the lack of correlation may be the small number of children in the study. Vitamin B12 deficiency or insufficiency and elevated homocysteine may contribute to the etiopathogenesis of depression in children and adolescents with depression (19). The homocysteine and B12 levels were found to be significantly lower in children with autism spectrum disorder (20,21). Carbamazepine monotherapy may cause a significant increase in the levels of homocysteine and a significant decrease in the levels of serum folate and vitamin B12 in children with epilepsy, with significant changes in the abovementioned parameters occurring early in the course of treatment (22). Reduced homocysteine, pyridoxine, folate and vitamin B12 levels could be a risk factor in the etiology of attention deficit hyperactivity disorders (23). Verhoef et al. (24) reported that plasma folate and, to a lower extent, plasma vitamin B12 and plasma homocysteine concentrations were inversely related and that folate levels were the most important marker for plasma homocysteine, including individuals receiving adequate amounts of vitamins through diet. The prognosis of vitamin B12 deficiency depends on the severity and duration of deficiency. Therefore, the diagnosis should be made as early as possible, and treatment should be started (25-27).
There is a strong correlation between plasma homocysteine levels and serum B12 levels in the first years of life, and the mean homocysteine level has been reported to be 6-9 µmol/L in healthy newborns and infants (28). Karademir et al. (29) showed that homocysteine levels decreased below 7.5 mmol/L and that methyl malonic acid (MMA) excretion in urine remained within normal values when serum B12 levels were above 200 pg/mL in infants receiving only breast milk. Önal et al. (30) classified 250 newborn babies as those with serum homocysteine levels above and below 10 mmol/L and compared them with ROC curves in terms of serum B12 levels and found that the limit B12 level was 200 pg/mL.
The most important limitation of the study is that the B12 levels of the mothers could not be analysed. The second important problem is that serum MMA levels were not analysed. A third important reason was the small number of participants in the study, especially those with vitamin B12 deficiency.
The results obtained in this study showed that low vitamin B12 and increased homocysteine levels seem to be important risk factors in children, especially from the 6th month when they start taking additional foods. The diagnosis of B12 deficiency can be confirmed by elevated serum total homocysteine levels, which are evidence of functional cobalamin deficiency. Vitamin B12 deficiency and increased hoöosistein levels should be considered in patients with neurological complaints, even if hematological findings are normal. In newborn babies, vitamin B12 level should be performed as a screening test; if it cannot be performed, at least one dose of vitamin B12 should be administered intramuscularly.
Author contributions
Yusuf Elgormuş: Conceptualization, Methodology, Funding acquisition, Writing - Original Draft; Omer Okuyan: Data curation, Visualization, Investigation, Writing - Original Draft; Seyma Dumur: Data curation, Investigation, Writing - Original Draft; Ugurcan Sayili: Software, Formal analysis, Visualization, Writing - Original Draft; Hafize Uzun: Methodology, Supervision, Project administration, Writing- Reviewing and Editing.
Funding
The author declared that this study has received no financial support.
Availability of data and materials
Participant-level data are available from the corresponding author
Acknowledgments
Not applicable.
Availability of data and materials
Participant-level data are available from the corresponding author
Competing interests
The authors state no conflicts of interest.
Consent for publication
Not applicable.
Ethical approval
This prospective study was approved by the Istanbul Atlas University ethics committee, Istanbul (Approval Date: August 12, 2022; number: E-22686390-050.99-19213) and was conducted in accordance with the Declaration of Helsinki. Informed consent was obtained from the legal guardian(s) of subjects.
References
- Rasmussen SA, Fernhoff PM, Scanlon KS. Vitamin B12 deficiency in children and adolescents. J Pediatr. 2001;138(1):10-17. [CrossRef]
- Hunt A, Harrington D, Robinson S. Vitamin B12 deficiency. BMJ. 2014;349: g5226.
- Koc A, Kocyigit A, Soran M, et al. High frequency of maternal vitamin B12 deficiency as an important cause of infantile vitamin B12 deficiency in Sanliurfa province of Turkey. Eur J Nutr. 2006;45(5):291-297. [CrossRef]
- Albayrak D, Albayrak C. Clinical follow-up of children with high vitamin B12 values: should we worry?. Turk J Pediatr. 2021;63(6):1064-1071. [CrossRef]
- Green R, Miller JW. Vitamin B12 deficiency. Vitam Horm. 2022; 119:405-439.
- Guéant JL, Guéant-Rodriguez RM, Alpers DH. Vitamin B12 absorption and malabsorption. Vitam Horm. 2022; 119:241-274. [CrossRef]
- Avci Z, Turul T, Aysun S, Unal I. Involuntary movements and magnetic resonance imaging findings in infantile cobalamine (vitamin B12) deficiency. Pediatrics. 2003;112(3 Pt 1):684-686. [CrossRef]
- Rasmussen SA, Fernhoff PM, Scanlon KS. Vitamin B12 deficiency in children and adolescents. J Pediatr. 2001;138(1):10-17. [CrossRef]
- Stabler SP, Allen RH. Vitamin B12 Deficiency As a Worldwide Problem. Annu Rev Nutr. 2004;24(1):299-326. [CrossRef]
- McLean E, de Benoist B, Allen LH. Review of the magnitude of folate and vitamin B12 deficiencies worldwide. Food Nutr Bull. 2008; 29 (2): 38-51. [CrossRef]
- Ramussen SA, Fernboff PM, Scanlon KS. Vitamin B12 deficiency in children and adolescents. J Pediat. 2001; 138: 7-10.
- Reynolds EH. The neurology of folic acid deficiency. Handb Clin Neurol. 2014;120:927-943. [CrossRef]
- Crellin R, Bottiglieri T, Reynolds EH. Folates and psychiatric disorders. Clinical potential. Drugs. 1993;45(5):623-636. [CrossRef]
- Reynolds E. Vitamin B12, folic acid, and the nervous system. Lancet Neurol. 2006;5(11):949-960.
- Goraya JS, Kaur S, Mehra B. Neurology of Nutritional Vitamin B12 Deficiency in Infants: Case Series From India and Literature Review. J Child Neurol 2015;30:1831–7.
- Bahadir A, Reis PG, Erduran E. Oral vitamin B12 treatment is effective for children with nutritional vitamin B12 deficiency. J Paediatr Child Health 2014;50:721–5. [CrossRef]
- Minet JC, Bissé E, Aebischer CP, Beil A, Wieland H, Lütschg J. Assessment of vitamin B-12, folate, and vitamin B-6 status and relation to sulfur amino acid metabolism in neonates. Am J Clin Nutr. 2000;72(3):751-757. [CrossRef]
- Monsen AL, Refsum H, Markestad T, Ueland PM. Cobalamin status and its biochemical markers methylmalonic acid and homocysteine in different age groups from 4 days to 19 years. Clin Chem. 2003;49(12):2067-2075. [CrossRef]
- Esnafoglu E, Ozturan DD. The relationship of severity of depression with homocysteine, folate, vitamin B12, and vitamin D levels in children and adolescents. Child Adolesc Ment Health. 2020;25(4):249-255. [CrossRef]
- Erden S, Akbaş İleri B, Sadıç Çelikkol Ç, Nalbant K, Kılınç İ, Yazar A. Serum B12, homocysteine, and anti-parietal cell antibody levels in children with autism. Int J Psychiatry Clin Pract. 2022;26(1):8-13.
- Yektaş Ç, Alpay M, Tufan AE. Comparison of serum B12, folate and homocysteine concentrations in children with autism spectrum disorder or attention deficit hyperactivity disorder and healthy controls. Neuropsychiatr Dis Treat. 2019;15:2213-2219. [CrossRef]
- Sharma TK, Vardey SK, Sitaraman S. Serum Homocysteine, Folate, and Vitamin B12 Levels in Carbamazepine Treated Epileptic Children. Clin Lab. 2016;62(7):1217-1224. [CrossRef]
- Altun H, Şahin N, Belge Kurutaş E, Güngör O. Homocysteine, Pyridoxine, Folate and Vitamin B12 Levels in Children with Attention Deficit Hyperactivity Disorder. Psychiatr Danub. 2018;30(3):310-316. [CrossRef]
- Verhoef P, Stampfer MJ, Buring JE, Gaziano JM, Allen RH, Stabler SP, et al. Homocysteine metabolism and risk of myocardial infarction: relation with vitamins B6, B12 and folate. Am J Epidemiol 1996;1;143:845-59. [CrossRef]
- Kuzminski AM, Del EJ, Allen RH, et al. Effective treatment of cobalamin deficiency with oral cobalamin. Blood 1998; 92:1191-1198.
- Lee GR, Foerster J, Lukens J, et all: Wintrobe’s clinical Hematology; Pernicious anemia and other causes of vitamin B12 (cobalamin) deficiency. Lippincott Williams & Wilkins Philadelphia, 2004; 947-978.
- Schenck UV, Bender-Götze C, Koletzko B: Persistance of neurological damage induced by dietary vitamin B12 deficiency in infancy. Arch Dis Child 1997; 77:137-139.
- Guerra-Shinohar EM, Paiva AA, Rondo PH, Yamasaki K, Terzi CA, D’Almeida V. Relationship between total homocystein and folate levels in pregnant women and their newborn babies according to maternal serum levels of vitamin B12. BJOG 2002;109:784-91. [CrossRef]
- Karademir F, Suleymanoglu S, Ersen A, Aydinoz S, Gultepe M, Meral C, Ozkaya H, Gocmen I. Vitamin B12, folate, homocystein and urinary methlymalonic acid levels in infants. J Int Med Res 2007;35:384-8.
- Onal H, Adal E, Oner T, Onal Z, Aydın A. An important problem in developing countries: maternal and neonatal vitamin B12 deficiency. Turk Arc Ped 2010;45:242-5.
Figure 1.
The correlation between B12 levels and homocysteine in all group.
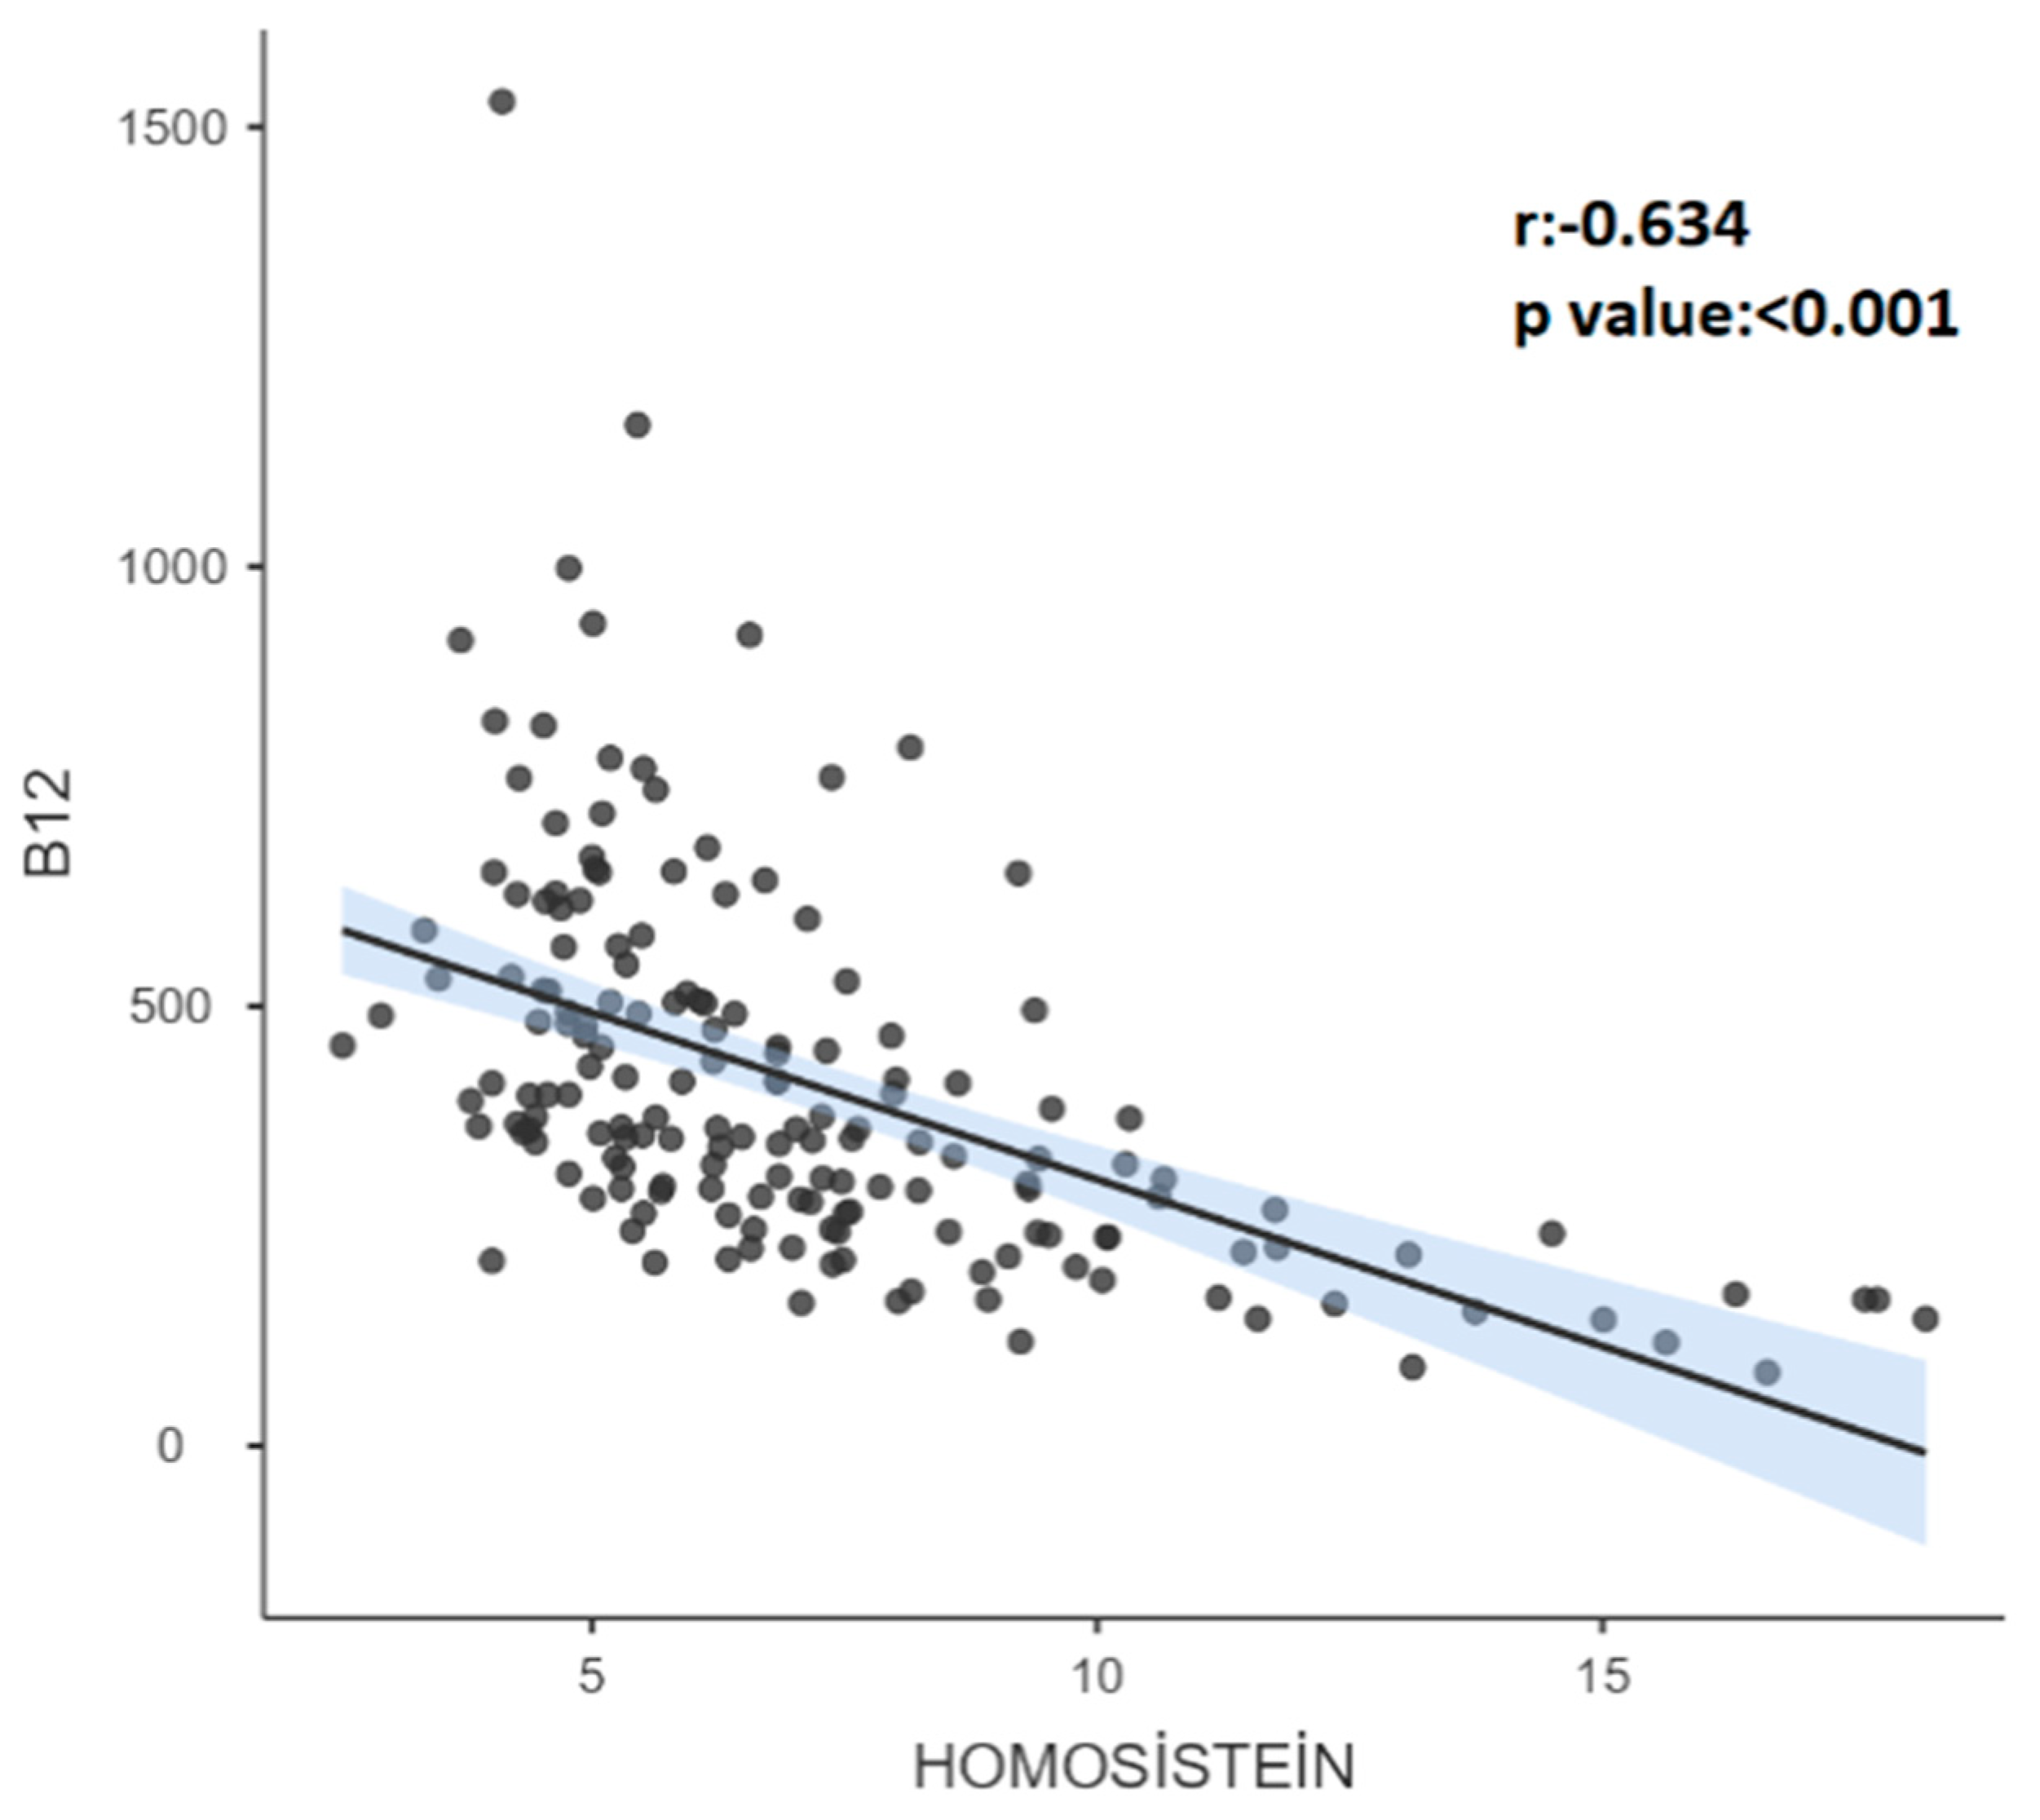

Table 1.
The general characteristics of the participants by age groups.
| 6-11 |
12-23 |
24-47 |
≥48 |
||||||||
|---|---|---|---|---|---|---|---|---|---|---|---|
| All groups | |||||||||||
| n | % | n | % | n | % | n | % | n | % | p | |
| GENDER | |||||||||||
| Boys | 95(55,9%) | 26(54,2%) | 28(53,8%) | 19(52,8%) | 22(64,7%) | 0,715* | |||||
| Girls | 75(44,1%) | 22(45,8%) | 24(46,2%) | 17(47,2%) | 12(35,3%) | ||||||
| TERM_D | |||||||||||
| Term | 159(93,5%) | 46(95,8%) | 48(92,3%) | 34(94,4%) | 31(91,2%) | 0,881† | |||||
| Preterm | 11(6,5%) | 2(4,2%) | 4(7,7%) | 2(5,6%) | 3(8,8%) | ||||||
| NUTRITION | |||||||||||
| Breastfed | 45(26,5%) | 12(25,0%) | 16(30,8%) | 10(27,8%) | 7(20,6%) | ||||||
| Breast milk + formula | 35(20,6%) | 15(31,3%) | 8(15,4%) | 6(16,7%) | 6(17,6%) | 0,173† | |||||
| Breast milk + supplementary food | 58(34,1%) | 15(31,3%) | 22(42,3%) | 12(33,3%) | 9(26,5%) | ||||||
| Formula and/or supplementary food | 32(18,8%) | 6(12,5%) | 6(11,5%) | 8(22,2%) | 12(35,3%) | ||||||
| VITAMIN SUPLEMENT | 30(17,6%) | 12 (25,0%) a | 16 (30,8%) a | 1 (2,8%) b | 1(2,9%) b | <0,001† | |||||
| Fish oil | 2(1,2%) | 0(0,0%) | 0(0,0%) | 1(2,8%) | 1(2,9%) | 0,247† | |||||
| Vitamin D | 21(12,4%) | 11(22,9%) | 10(19,2%) | 0(0,0%) | 0(0,0%) | <0,001† | |||||
| Iron | 15(8,8%) | 5(10,4%) | 10 (19,2%) | 0(0,0%) | 0(0,0%) | <0,001† | |||||
| Vitamin B | 2(1,2%) | 2(4,2%) | 0(0,0%) | 0(0,0%) | 0(0,0%) | 0,161† | |||||
| Education mother | |||||||||||
| Elementary Education | 27(15,9%) | 6(12,5%) | 5(9,6%) | 6(16,7%) | 10(29,4%) | 0,068† | |||||
| High School/associate degree | 72(42,4%) | 24(50,0%) | 17(32,7%) | 17(47,2%) | 14(41,2%) | ||||||
| Bachelor and above | 71(41,8%) | 18(37,5%) | 30(57,7%) | 13(36,1%) | 10(29,4%) | ||||||
| Education father | |||||||||||
| Elementary Education | 27(15,9%) | 6(12,5%) | 7(13,5%) | 8(22,2%) | 6(17,6%) | 0,721† | |||||
| High School/associate degree | 79(46,5%) | 24(50,0%) | 24(46,2%) | 13(36,1%) | 18(52,9%) | ||||||
| Bachelor and above | 64(37,6%) | 18(37,5%) | 21(40,4%) | 15(41,7%) | 10(29,4%) | ||||||
| B12 (pg/mL) | |||||||||||
| <200 | 19(11,20%) | 12 (25%) a | 3 (5,8%) b | 1 (2,8%) b | 3a,b(8,8%) | <0.001† | |||||
| 200-299 | 40(23,50%) | 16(33%) | 15(28,8%) | 6(16,7%) | 3(8,8%) | ||||||
| ≥300 | 111(65,30%) | 20 (41,70%) a | 34 (65,4%) a,b | 29 (80,6%) b | 28 (82,4%) b | ||||||
| B12 (pg/mL) | |||||||||||
| <300 | 59(34,7%) | 28 (58,3%) a | 18a,b(34,6%) | 7(19,4%) b | 6 (17,6%) b | <0.001* | |||||
| ≥300 | 111(65,30%) | 20 (41,70%) a | 34a,b(65,4%) | 29(80,6%) b | 28 (82,4%) b | ||||||
| *: chi-square test; †: Fisher exact test Different superscript letters indicate groups with significant differences. | |||||||||||
Table 2.
Demographic, food consumption and laboratory characteristics by age groups.
| All Groups | 6-11 | 12-23 | 24-47 | 48-72 | |||
| Mean±std | Mean±std | Mean±std | Mean±std | p | |||
| Age (Month) | Mean±std | 26.34±21.61 | 8.58±1.35 | 14.58±3.54 | 31.47±7.77 | 63.94±11.98 | - |
| Median(Q1-Q3) | 17(10-36) | 9(8-10) | 12(12-17) | 30.5(24-36) | 62(53-72) | ||
| Height (cm) | Mean±std | 86.05±17.38 | 69.92±3.94 | 78.14±5.65 | 92.92±8.14 | 113.66±9.6 | - |
| Median(Q1-Q3) | 79(72.5-97) | 70.25(66-72.75) | 78(75-81) | 94.5(88.5-99) | 113.65(108-120) | ||
| Weight (kg) | Mean±std | 12.84±5.13 | 8.69±1.09 | 10.85±1.47 | 13.91±2.42 | 20.58±5.39 | - |
| Median(Q1-Q3) | 11(9.4-15.3) | 8.6(8-9.35) | 10.78(9.85-11.4) | 14.05(11.9-16) | 19(17-22.7) | ||
| BMI (kg/m2) | Mean±std | 17.03±2.24 | 17.81±2.09 | 17.82±2.04 | 16.07±1.62 | 15.72±2.35 | - |
| Median(Q1-Q3) | 16.86(15.72-18.01) | 17.4(16.46-19.07) | 17.44(16.4-19.1) | 16.22(14.92-16.85) | 15.28(14.31-16.58) | ||
| Dairy products (…day/week) | Mean±std | 5.86±2.27 | 5.23±2.87 | 5.88±2.13 | 6.31±2.01 | 6.26±1.58 | 0,199¶ |
| Median(Q1-Q3) | 7(7-7) | 7(3-7) | 7(7-7) | 7(7-7) | 7(7-7) | ||
| Meat consumption (…day/week) | Mean±std | 2.31±1.73 | 1.67±1.56 | 2.71±1.92 | 2.43±1.59 | 2.49±1.62 | 0,051¶ |
| Median(Q1-Q3) | 2(1-3) | 2(0-3) | 2(1.75-3.75) | 2(2-3) | 2(1.5-3) | ||
| B12 (pg/mL) | Mean±std | 411.99±215.58 | 322.23±179.08 | 430.13±233.84 | 491.11±219.41 | 427.21±193.51 | 0,001¶ |
| Median(Q1-Q3) | 360.5(264-506) | 282(201.5-405.5)a | 361.5(272-532)b | 459.5(332.5-635)b | 395(317-514)b | ||
| Homocysteine(μmol/L) | Mean±std | 7.12±3.03 | 8.46±3.83 | 6.99±2.91 | 5.75±1.75 | 6.86±2.23 | 0,002¶ |
| Median(Q1-Q3) | 6.34(5.01-8.16) | 7.38(5.62-9.4)a | 6.4(5.03-8.26)a,b | 5.34(4.64-6.49)b | 6.37(5.33-7.52)a,b | ||
| Folic acid(ng/mL) | Mean±std | 12.57±4.09 | 14.86±2.42 | 14.09±3.55 | 10.34±3.75 | 9.35±3.93 | <0,001Ͳ |
| Median(Q1-Q3) | 13(9.8-15.7) | 14.95(12.95-16.7)a | 14.3(11.55-15.9)a | 10.35(7-13.75)b | 8.3(6.2-12.7)b | ||
| Ferritin(mL/ng) | Mean±std | 30.44±24.13 | 36.99±30.59 | 25.01±19.36 | 27.85±20.52 | 32.23±22.45 | 0,181¶ |
| Median(Q1-Q3) | 22.31(14.21-40.24) | 29.88(15.28-48.15) | 19.94(12.03-32.18) | 19.24(13.29-43.44) | 23.12(19.09-39.54) | ||
| Leukocyte(x103/µL) | Mean±std | 10.36±3.04 | 10.58±3.1 | 11.13±3.03 | 9.38±2.52 | 9.9±3.23 | 0,037¶ |
| Median(Q1-Q3) | 10.1(8.31-12.14) | 9.9(8.91-11.8)a,b | 10.48(9.14-12.75)a | 9.32(7.41-10.82)b | 9.54(7.75-12.14)a,b | ||
| Neutrophil(103/µL) | Mean±std | 3.66±1.06 | 3.78±1.14 | 3.74±0.99 | 3.64±0.91 | 3.41±1.17 | 0,432Ͳ |
| Median(Q1-Q3) | 3.7(2.91-4.32) | 3.86(2.95-4.45) | 3.9(3.18-4.39) | 3.69(3.1-4.21) | 3.17(2.57-4.2) | ||
| Lymphocyte(103/µL) | Mean±std | 2.66±1.14 | 2.6±1.05 | 2.65±1.25 | 2.51±0.83 | 2.9±1.34 | 0,831¶ |
| Median(Q1-Q3) | 2.44(1.9-3.2) | 2.53(1.8-3.2) | 2.18(1.89-3.35) | 2.4(2.09-2.97) | 2.69(2-3.9) | ||
| HGB(g/dL) | Mean±std | 11.73±1 | 11.35±0.93 | 11.68±1 | 11.83±0.94 | 12.23±0.97 | 0,001Ͳ |
| Median(Q1-Q3) | 11.8(11-12.4) | 11.4(10.6-12.05)a | 11.8(11.05-12.3)a | 11.9(11.35-12.3)a,b | 12.55(11.4-12.8)b | ||
| HCT(%) | Mean±std | 35.06±2.58 | 34.07±2.47 | 35.04±2.72 | 35.14±2.18 | 36.39±2.4 | 0,001Ͳ |
| Median(Q1-Q3) | 34.95(33.2-37) | 33.8 (32.45-35.65)a | 34.8 (33.15-36.55)a,b | 34.9 (33.65-36.65)a,b | 37.1(34.3-37.9)b | ||
| PLT(x103/mL) | Mean±std | 344.52±89.01 | 356.31±101.39 | 343.58±94.64 | 341.08±81.79 | 332.94±68.13 | 0,691Ͳ |
| Median(Q1-Q3) | 341.5(288-399) | 352(295-406.5) | 343(273.5-402) | 336(289.5-380.5) | 330(290-370) | ||
| MCV(fL) | Mean±std | 76.21±4.76 | 75.59±4.55 | 75.14±4.99 | 77.17±4.05 | 77.71±5.01 | 0,003¶ |
| Median(Q1-Q3) | 76.9(74.2-79.4) | 76.15(74.1-78.2)a | 76(72.8-78.6)a | 77.5(75.5-80.3)a,b | 78.65(76.4-80.6)b | ||
| MCH(pg) | Mean±std | 25.92±4.75 | 25.7±4.4 | 25.9±6.92 | 25.99±2.84 | 26.18±2.28 | 0,013¶ |
| Median(Q1-Q3) | 25.9(24.3-27.1) | 25.45(24.15-26.5)a | 25.2(24-27.05) a,b | 26.4(25.4-27.35) a,b | 26.6(25.4-27.5)b | ||
| MCHC(g/L) | Mean±std | 33.49±1.41 | 33.31±1.17 | 33.35±1.59 | 33.64±1.42 | 33.81±1.38 | 0,307¶ |
| Median(Q1-Q3) | 33.6(32.7-34.5) | 33.35(32.5-34.05) | 33.5(32.3-34.4) | 33.7(33.05-34.65) | 33.8(33-34.8) | ||
| NLR | Mean±std | 1.68±1.06 | 1.69±0.88 | 1.71±0.86 | 1.8±1.56 | 1.51±0.93 | 0.638¶ |
| Median(Q1-Q3) | 1.57(1.05-2.06) | 1.59(1.13-2.05) | 1.6(1.14-2.08) | 1.41(1.07-1.98) | 1.33(0.71-2.11) | ||
| PLR | Mean±std | 153.95±80.22 | 160.13±86.03 | 154.34±76.78 | 157.89±86.88 | 140.44±70.99 | 0.746¶ |
| Median(Q1-Q3) | 135.91(101.44-181.48) | 144.27(108.24-185.09) | 128.94(94.75-188.33) | 146.34(104.96-183.55) | 125.31(82.86-174) | ||
| SII | Mean±std | 573.85±384.37 | 597.37±375.9 | 580.78±348.19 | 606.44±502.3 | 495.55±303.36 | 0.620¶ |
| Median(Q1-Q3) | 507.82(326.63-696) | 547.07(361-668.45) | 520.04(344.03-729.66) | 506.7(306.21-706.75) | 419.08(223.89-711.74) | ||
| ¶: Kruskal-Wallis test;Ͳ:One-way ANOVA | |||||||
BMI: Body mass index, HGB: hemoglobin, HCT: hematocrit, PLT: platelet, MCV: mean corpuscular volume; MCH: mean corpuscular hemoglobin, MCHC: mean corpuscular hemoglobin concentration, NLR: neutrophil-to-lymphocyte ratio, PLR: platelet-to-lymphocyte ratio, SII: systemic immune-inflammation index. Different superscript letters indicate groups with significant differences.
Table 3.
The distribution of demographic and nutritional characteristics according to B12 levels.
| B12 Groups | |||||||
| <200 | 200-299 | ≥300 | |||||
| n | % | n | % | n | % | p | |
| Gender | |||||||
| Boys | 11(57,9%) | 23(57,5%) | 61(55,0%) | 0,972* | |||
| Girls | 8(42,1%) | 17(42,5%) | 50(45,0%) | ||||
| Birth | |||||||
| Term | 18(94,7%) | 38(95,0%) | 103(92,8%) | 1† | |||
| Preterm | 1(5,3%) | 2(5,0%) | 8(7,2%) | ||||
| Age (month) | |||||||
| ≤11 | 12 (63.2%)a | 16 (40.0%)a | 20 (18.0%)b | ||||
| 12-23 | 3 (15.8%) | 15 (37.5%) | 34 (30.6%) | <0.001† | |||
| 24-47 | 1 (5.3%) | 6 (15.0%) | 29 (26.1%) | ||||
| ≥48 | 3 (15.8%) | 3 (7.5%) | 28 (25.2%) | ||||
| Nutrition | |||||||
| breastfed | 6(31,6%) | 10(25,0%) | 29(26,1%) | ||||
| breast milk + formula | 5(26,3%) | 9(22,5%) | 21(18,9%) | 0,026† | |||
| breast milk + supplementary food | 8(42,1%) | 18(45,0%) | 32(28,8%) | ||||
| formula and/or supplementary food | 0 (0,0%) a | 3 (7,5%) a | 29 (26,1%) b | ||||
| Vitamin Supplement | 5(26,3%) | 9(22,5%) | 16(14,4%) | 0,256† | |||
| Fish oil | 0(0,0%) | 0(0,0%) | 2(1,8%) | 1† | |||
| Vitamin D | 4(21,1%) | 6(15,0%) | 11(9,9%) | 0,304† | |||
| Iron | 3(15,8%) | 5(12,5%) | 7(6,3%) | 0,181† | |||
| Vitamin B | 0(0,0%) | 1(2,5%) | 1(0,9%) | 0,575† | |||
| Education mother | |||||||
| Elementary Education | 1(5,3%) | 9(22,5%) | 17(15,3%) | ||||
| High School/Associate Degree | 7(36,8%) | 18(45,0%) | 47(42,3%) | 0,346† | |||
| Bachelor and above | 11(57,9%) | 13(32,5%) | 47(42,3%) | ||||
| Education father | |||||||
| Elementary Education | 2(10,5%) | 6(15,0%) | 19(17,1%) | ||||
| High School/associate degree | 10(52,6%) | 22(55,0%) | 47(42,3%) | 0,675† | |||
| Bachelor and above | 7(36,8%) | 12(30,0%) | 45(40,5%) | ||||
Table 4.
The relationship between B12 levels and demographic, nutritional and laboratory characteristics.
Table 4.
The relationship between B12 levels and demographic, nutritional and laboratory characteristics.
| B12 Groups | |||||||
| <200 (pg/mL) | 200-299 (pg/mL) | >=300 (pg/mL) | |||||
| Mean±std | Median(Q1-Q3) | Mean±std | Median(Q1-Q3) | Mean±std | Median(Q1-Q3) | p | |
| Age (month) | 20,53±24,2 | 9(8-12)a | 19,58±18,18 | 12,5(9-22,5)a | 29,77±21,68 | 24(12-48)b | <0,001¶ |
| BMI (kg/m2) | 17,86±2,62 | 17,3(15,49-20)a,b | 17,5±1,87 | 17,29(16,55-18,61)a | 16,71±2,24 | 16,4(15,28-17,75)b | 0,016¶ |
| Dairy products (…day/week) | 4,74±3,12 | 7(1-7)a | 5,35±2,53 | 7(3-7)a,b | 6,24±1,9 | 7(7-7)b | 0,012¶ |
| Meat consumption (…day/week) | 1,76±1,77 | 2(0-2,5) | 2,39±1,95 | 2(1-3) | 2,38±1,64 | 2(1,5-3) | 0,273¶ |
| Homocysteine (μmol/L) | 12,6±3,72 | 12,35(8,92-16,32)a | 8,03±2,36 | 7,46(6,35-9,47)b | 5,85±1,65 | 5,45(4,64-6,84)c | <0,001¶ |
| Folic Acid (ng/mL) | 14,53±2,91 | 14,8(13-17) | 12,06±4,12 | 11,9(9,8-14,3) | 12,41±4,18 | 13,3(9,2-15,8) | 0,075Ͳ |
| Ferritin (mL/ng) | 36,26±36,05 | 22,4(11,77-53,49) | 27,43±24,32 | 17,8(10,3-36,05) | 30,53±21,52 | 23,15(15,39-42,05) | 0,296¶ |
| Leukocyte (x103/µL) | 10,61±4,28 | 9,45(7,75-12,84) | 10,53±2,75 | 10,39(8,33-11,93) | 10,25±2,91 | 10,07(8,38-12,14) | 0,787¶ |
| Neutrophil (103/µL) | 3,44±1,16 | 3,1(2,41-4,5) | 3,77±1,13 | 3,86(2,96-4,55) | 3,67±1,01 | 3,7(3-4,2) | 0,53Ͳ |
| Lymphocyte (103/µL) | 2,53±0,91 | 2,3(2-3,1) | 2,66±1,12 | 2,6(1,95-3,2) | 2,68±1,18 | 2,37(1,9-3,2) | 0,982¶ |
| HGB (g/dL) | 11,56±1,14 | 11,4(10,6-12,5)a,b | 11,34±0,9 | 11,4(10,55-12)a | 11,9±0,98 | 12(11,3-12,5)b | 0,006Ͳ |
| HCT (%) | 34,88±2,86 | 35(32,9-38)a,b | 34,15±2,17 | 34,25(32,55-35,35)a | 35,41±2,61 | 35,4(33,4-37,5)b | 0,027Ͳ |
| PLT (x103/mL) | 357,42±99,37 | 349(316-426) | 350,58±76,74 | 354,5(295-406) | 340,13±91,69 | 335(281-388) | 0,655Ͳ |
| MCV (fL) | 75,03±5,2 | 76,4(72,1-78,6) a,b | 75,05±5,02 | 75,6(72,95-78,35)a | 76,83±4,51 | 77,3(74,9-79,9)b | 0,03¶ |
| MCH (pg) | 24,66±2,31 | 25(22,7-26,5) a,b | 25,15±2,62 | 25,3(24,15-26,55)a | 26,41±5,53 | 26,3(25-27,2)b | 0,012¶ |
| MCHC (g/L) | 33,13±1,16 | 33,3(32,2-34,2) a,b | 33,18±1,25 | 33,25(32,4-34)a | 33,67±1,48 | 33,7(33-34,6)b | 0,045¶ |
| NLR | 1.52±0.66 | 1.58(1.07-1.88) | 1.73±0.98 | 1.6(1-2.22) | 1.7±1.14 | 1.54(1.03-2.06) | 0.852¶ |
| PLR | 164.83±85.8 | 152.17(112.76-194.38) | 156.09±79.95 | 126.23(105.06-194.11) | 151.31±79.92 | 135.5(98.54-179.71) | 0.733¶ |
| SII | 528.97±267.95 | 446.81(295.63-737.32) | 611±419.88 | 554.96(329.17-691.75) | 568.15±389.67 | 506.45(326.63-709.23) | 0.841¶ |
| Height (cm) | 76,1±13,8 | 73,5(66-75)a | 80,74±15,35 | 75,5(70-89)b | 89,67±17,59 | 85(75-104)c | <0,001¶ |
| Weight (kg) | 10,40±3,43 | 9,5(8,1-11,20)a | 11,73±4,93 | 10,7(8,33-13,45)b | 13,65±5,26 | 11,8(9,9-16,5)c | <0,001¶ |
| ¶: Kruskal-Wallis test; Ͳ:One-way ANOVA Significant differences are shown with the letters a, b, c in the columns. | |||||||
BMI: Body mass index, HGB: hemoglobin, HCT: hematocrit, PLT: platelet, MCV: mean corpuscular volume; MCH: mean corpuscular hemoglobin, MCHC: mean corpuscular hemoglobin concentration, NLR: neutrophil-to-lymphocyte ratio, PLR: platelet-to-lymphocyte ratio, SII: systemic immune-inflammation index. Different superscript letters indicate groups with significant differences.
Disclaimer/Publisher’s Note: The statements, opinions and data contained in all publications are solely those of the individual author(s) and contributor(s) and not of MDPI and/or the editor(s). MDPI and/or the editor(s) disclaim responsibility for any injury to people or property resulting from any ideas, methods, instructions or products referred to in the content. |
© 2023 by the authors. Licensee MDPI, Basel, Switzerland. This article is an open access article distributed under the terms and conditions of the Creative Commons Attribution (CC BY) license (http://creativecommons.org/licenses/by/4.0/).
Copyright: This open access article is published under a Creative Commons CC BY 4.0 license, which permit the free download, distribution, and reuse, provided that the author and preprint are cited in any reuse.


