
Submitted:
24 October 2025
Posted:
27 October 2025
You are already at the latest version
Abstract
Background According to the World Health Organization (WHO), worldwide anemia prevalence in children of 6–59 months is 40% [1]. Though iron deficiency is recognized as a significant cause of anemia, vitamin B₁₂ (B₁₂) and folate deficiencies are also important causes. The previous Pakistan National Nutrition Survey (NNS) 2011 showed a high prevalence among women of reproductive age (WRA), which necessitated further investigation in follow-up surveys among children. Methods We performed a secondary analysis of the National Nutrition Survey (NNS) 2018–2019. Blood samples were obtained from 31,828 children (< 5 years), with a subsample analyzed for B₁₂ (n=2693) and folate (n=6690) deficiency. B₁₂ was assessed by electrochemiluminescence immunoassay, and folate by CDC’s microbiologic assay. Logistic regressions were applied to determine factors associated with deficiency. Results 35.1%, while 24.8% of children showed folate and B₁₂ deficiency, respectively. Higher odds of folate and B₁₂ deficiency were observed in Khyber Pakhtunkhwa, OR = 1.424 (95% CI 1.157, 1.752), and newly merged districts of Khyber Pakhtunkhwa, OR = 11.257 (95% CI 2.291, 55.314), respectively. Additionally, mother’s education was associated with B₁₂ deficiency i.e. uneducated OR = 2.017, (95% CI 1.229, 3.308), primary OR = 2.361 (95% CI 1.359, 4.103) and middle OR = 2.108 (95% CI 1.144, 3.882) while underweight was associated with folate deficiency only, OR = 1.181 (95% CI 1.016, 1.371). Conclusion This analysis highlights a considerable burden of folate (35.1%) and vitamin B₁₂ (24.8%) deficiencies among Pakistani children under five years of age, with regional disparities. Socioeconomic and nutritional factors, particularly maternal education and child undernutrition, further influence the risk of deficiency. These results emphasize the need for region-specific nutrition interventions, maternal education programs, and strengthened food fortification strategies.
Keywords:
children <
; 5 years
; B₁₂ deficiency
; folate deficiency
; Pakistan
Background
The first few years of a child’s life mark an essential window for physical growth, brain development, and the foundation of long-term health. Children are particularly susceptible to nutritional deficiencies during this formative stage, which generally has long-lasting effects on survival, development, and quality of life [2] . Among these, anemia is a serious global public health issue that affects both developed and developing countries and is more common in young children [3]. It affects a significant number of children under five, with noticeable regional and socioeconomic differences [4]. According to the World Health Organization (WHO), worldwide anemia prevalence in children 6–59 months is 40% [1]. In Pakistan, the prevalence of anemia among children aged 6 to 59 months was 53%, according to the WHO in 2019 [5].
Anemia is linked to elevated morbidity, mortality, and impaired cognitive and behavioral development in children [6,7]. Anemia, as measured by hemoglobin levels, is a sign of iron deficiency. However, iron deficiency is not the sole reason for anemia, as deficiencies in Vitamin B₁₂ (B₁₂) and folate can also lead to this condition [8]. Millions of people worldwide suffer from deficiencies in these two vitamins, according to the WHO, which is a serious and little-known global health issue, particularly in areas with limited resources [9].
Inadequate folate and B₁₂ status impacts DNA synthesis, genomic hypomethylation, and chromosomal abnormalities [10,11,12]. On the other hand, B₁₂ and folate deficits are linked to megaloblastic anemia, and both vitamins are involved in a variety of standard metabolic processes [13]. Additionally, there is a link between low B₁₂ levels during pregnancy and early childhood as well as delayed cognitive and psychomotor development in children [14,15,16]. Folate deficiency has been associated with atherosclerosis, stunting, and an increased risk of low birth weight and neural tube closure defects, including encephalocele, anencephaly, and spina bifida, during pregnancy [17,18,19]. Primary dietary sources of folate include plant sources, including leafy greens and fruits, as well as animal sources like yeast, meat, and liver. Animals’ gut microbes produce B₁₂, which is then absorbed and integrated into animal tissues. Therefore, the only source of B₁₂ for humans is products derived from herbivorous animals, such as meat, eggs, and milk. Thus, the risk of folate and B₁₂ deficiency is increased when an inadequate intake of these foods is consumed [20]. In children under five, these deficiencies often reflect broader and frequently linked to more general problems like inadequate nutrition for mothers, inadequate infant feeding techniques, food insecurity, a lack of dietary diversity, and restricted access to foods derived from animals [21,22].
A Pakistani study found that giving schoolchildren controlled oral iron supplements for more than 6 months does not significantly reduce anemia. The investigators suggested that the ineffectiveness of iron supplementation may be due to deficiencies in other micronutrients, such as B₁₂ and folate [23]. While B₁₂ and folate deficiencies in women of reproductive age were previously studied in Pakistan’s 2011 National Nutrition Survey (NNS-2011), a thorough evaluation of these deficiencies in children under 5 years of age was not conducted. Following NNS-2011, studies have been undertaken to investigate supply, demand, perceptions, knowledge, and practices regarding iron IFA supplements in rural and urban settings of Pakistan. Qualitative research that was conducted to assess the Supply and Demand of Maternal Iron-Folic Acid has reported that IFA supplements are primarily available to pregnant women via LHW network, district clinics, and private pharmacies [24].
The recent large-scale NNS conducted in Pakistan in 2018 again identified deficiencies in various micronutrients among the Pakistani population, particularly among children <5 years, women of reproductive age, and adolescents, targeting both genders. To evaluate the present status of B₁₂ and folate deficiencies associated with anemia and other contributing factors among children under 5 years of age, we conducted a secondary analysis of data collected during NNS-2018.
Methodology
Study Design
The National Nutrition Survey (NNS) April 2018 - January 2019 was a cross-sectional, household-based survey to measure nutrition indicators in Pakistan. Both qualitative and quantitative research techniques were used to gather substantial data. Sampling frame was designed to obtain data on the district level for all provinces in Pakistan including Punjab, Sindh, Baluchistan, and Khyber Pakhtunkhwa (KPK), as well as Azad Jammu and Kashmir (AJK), Gilgit-Baltistan (GB), the KP Newly Merged Districts (KP-NMD), and Islamabad Capital Territory (ICT) with among rural/urban localities for both genders.
Sample Size Calculation
The sample size to estimate the prevalence of folate and B₁₂ deficiency in Pakistan was calculated using figures from an Indian Comprehensive National Nutrition Survey (CNNS-2016-18) for under-five children [25]. The estimates were made assuming an alpha level of 5% and a design effect of 2 to adjust for multi-stage cluster sampling. With 90% confidence level, at least 384 children would be required to estimate folate deficiency while at least 261 children would be needed to estimate B₁₂ deficiency. The sample size has been calculated using the formula below.
Sample size n = [DEFF*Np(1-p)]/ [(d2/Z21-α/2*(N-1) + p*(1-p)]
Sampling Technique
For sampling, the Pakistan Bureau of Statistics (PBS) provided a sampling frame based on the Population and Housing Census 2017 and created compact enumeration blocks, also known as PSUs, with 200–250 households each, along with digital maps having conspicuous localities. 115600 secondary sampling units (SSUs) were selected from 5780 primary sampling units (PSUs) at the household level. The field staff’s nomination of households from each sampled PSU was conducted through the line-listing exercise from AKU. Paper-based line-listing data were collected and transferred to electronic tablets for easy upload by AKU’s Data Management Unit.
Blood Collection
Venous blood samples were collected from participants by qualified phlebotomists while following the WHO safe phlebotomy guidelines. [26]. During the NNS-2018 survey, 31,828 children aged <5 years, regardless of gender, provided blood samples. B₁₂ and folate assays were performed on a subset, randomly chosen from archived samples of NNS-2018’s blood samples. A total of 6690 children’s samples were subjected to folate determination, while 2693 samples were analyzed for B₁₂ levels (Figure 1a,b).
Biochemical Assessment
Biochemical assessments were conducted in the Nutrition Research Laboratory (NRL) at Aga Khan University, Karachi, Pakistan. B₁₂ was quantitatively measured in serum samples by electrochemiluminescence immunoassay (ECLIA), a competitive binding assay for in vitro analysis that uses intrinsic factors specific to B₁₂ for selective detection. The Roche Cobas e411 Vitamin B₁₂ II assay kit (Reference number 07212771 190) was used for the analysis, with a detection range of 50 to 2000 pg/mL. Calibration was performed using Roche Vitamin B₁₂ II Cal Set (reference number 07212780190), following a two-point calibration process once per reagent lot, within 24 hours of reagent registration, every 28 days for the same lot, or at least once every 7 days when using the same reagent kit. To ensure accuracy, PreciControl Varia (Reference number 05618860190) was used for quality control, with high- and low-concentration controls run once per reagent kit and after each calibration. The assay’s reliability was further confirmed through external validation by participating in the Vital EQA program of the CDC, USA, which is a standardization program designed to provide labs measuring nutritional markers in serum with an independent assessment of their analytical performance [27]. We received three blinded serum samples biannually for duplicate analysis. Results were compared for relative difference to the CDC’s target value and imprecision with round-by-round descriptive detail statistics. Statistical parameters served as the basis for performance criteria, with acceptable (optimal, desirable, or minimal performance) or unacceptable (less than minimal performance). During the analysis of this survey, we participated in CDC’s round 33 with an overall acceptance of 100% for the assay.
Folate levels were analyzed using a microbiologic assay [28,29], the gold standard method recommended by CDC, USA, due to its accuracy and ability to detect all biologically active forms of folate, making it ideal for population surveys. The assay used 5-methyltetrahydrofolate as a calibrator for precise quantification. The kit provided a natural auxotrophic strain of Lactobacillus rhamnosus resuspended in folate-free medium, ensuring their proliferation depended solely on folate availability in the serum samples. To perform the assay, diluted serum samples were added to 96-well plates containing the inoculated growth medium. The plates were incubated for 42 hours at 37 °C, allowing bacterial growth to correspond to folate concentration in serum samples. Samples were tested in quadruplicate to enhance precision, and folate levels were determined by measuring bacterial growth at OD590 using a microplate reader. Our Nutrition Research Laboratory (NRL) personnel were trained by CDC’s Folate Task Team at CDC Atlanta with the support of Nutrition International, ensuring proper assay execution at NRL. The method’s reliability was validated through two rounds of quality control testing, confirming its accuracy and reproducibility.
The estimates have been classified as deficiency status (deficient/non-deficient) as per cut-offs established for CDC’s microbiology assay i.e., <7nmoL/L (3ng/mL) for serum folate levels [20,21] and <191pg/mL for B₁₂ levels that aligns with cut-offs commonly used in large-scale population surveys utilizing Electrochemiluminescence Immunoassay (ECLIA) [22,23].
Statistical Analysis
Descriptive analysis was conducted to summarize the study population, presenting the percentages of individuals in each variable category, along with 95% confidence intervals (CIs). Folate and B₁₂ concentrations were classified based on established cut-offs, and the prevalence of deficiency was reported across different study variables.
To assess the contribution of potential covariates with folate and B₁₂ deficiency, serum folate and B₁₂ concentrations were categorized into two groups (deficient and non-deficient) and logistic regression analysis was performed. Variables with a p-value ≤ 0.25 in univariate analysis were considered for inclusion in the multivariate model. Collinear variables (correlation coefficient>0.8) were excluded using correlation analysis, Eta coefficient, and Cramér’s V. A stepwise forward approach was used to build the final multivariate models, where variables with a p-value <0.10 were considered significant. Key variables, including residence, food insecurity status, and wealth index, were retained in the model regardless of their p-values. Adjusted odds ratios (AORs) and 95% CIs have been reported for the associated factors. All statistical analyses were performed using Stata version 17.
Results
Characteristics of the Study Population
Table 1 presents demographics and health data of the study population. Approximately similar distribution of residence was observed for both folate and B₁₂ samples that is around 56% of children were from rural areas of Pakistan. Provincial distribution was skewed representing higher number of samples from Sindh and Punjab provinces like 45.7% of folate samples were from Punjab while 58.7% of the B₁₂ samples were from Sindh. Most of the samples were from the 24-59 months age group (~80%). The majority of the children’s mothers were not pregnant, 20 to 34 years old, had ≥3 parity status, were unemployed, and did not have any formal education. An almost equal number of samples were collected from each category of household size and wealth index, for both the assays. Most of the samples were from the population having improved drinking water sources, had improved sanitation facilities, access to secure food, while insufficient dietary diversity. Equal number of males and females were included in the study in which approximately 42% were stunted, 30% were underweight, and 15% were wasted, reflecting a high burden of malnutrition consistent with the NNS-2018 survey and indicating a population at significant public health risk [30]. The majority of them were healthy with no history of diarrhea, acute respiratory infections, or fever in the two weeks before the survey.
Prevalence of B₁₂ and Folate Deficiency Among Children Aged 6-59 Months
Table 2 presents the distribution of serum folate and B₁₂ deficiency in the study population. A higher deficiency of folate was observed in children from both rural and urban districts as compared to B₁₂ deficiency. However, the provincial breakdown showed notable differences. The highest prevalence of folate deficiency was recorded in children from Khyber Pakhtunkhwa (41%). In comparison, only 20.4% of children in the newly merged districts of Khyber Pakhtunkhwa (KP-NMD) were found to be deficient. Folate deficiency appeared consistently across various socio-demographic factors, including household size, wealth index, drinking water source, sanitation, food insecurity status, maternal education, maternal occupation, maternal age, maternal parity status, maternal pregnancy status as well as the child’s gender and age. When examining health-related factors, a slight difference was noted for weight-for-age and weight-for-height categories i.e., folate deficiency was more common among underweight and wasted (38.1% & 37.5%). Surprisingly, children without a recent history of fever (within the 2 weeks before sampling) had a higher prevalence of folate deficiency, which contradicts the association of megaloblastic anemia with a frequent yet often overlooked cause of pyrexia of unknown origin [31,32]. However, other health indicators, such as stunting, a recent history of diarrhea, or acute respiratory infection, did not show a significant association with folate deficiency.
B₁₂ deficiency was found in fewer children compared to folate deficiency. The deficiency was more common in children from rural areas (27%) than in those from urban areas (22%). There were also significant differences between provinces, ranging from 18.6% in Gilgit-Baltistan to 79.5% in the newly merged districts of Khyber Pakhtunkhwa (KP-NMD). Some other factors also seemed to affect B₁₂ levels: children from low wealth index, poor sanitation, and food-insecure households showed a higher prevalence of deficiency. Some maternal factors also appeared to have a positive effect: children whose mothers were not pregnant and had at least secondary or higher education showed lower deficiency rates —i.e., 24.2%, 18.2%, and 14.8%, respectively. Younger children (6–23 months) had a higher deficiency rate (29.7%). However, there were no noticeable differences in the prevalence of B₁₂ deficiency between categories of drinking water source, minimum dietary diversity, maternal occupation, maternal age, maternal parity status, and child’s gender. Health factors such as stunting, wasting, underweight, and a recent history of fever appeared unrelated, whereas children with a recent history of diarrhea showed a higher prevalence of B₁₂ deficiency, whereas, conversely, children with a recent ARI showed a lower prevalence of B₁₂ deficiency.
Key Determinants of Childhood Folate and B₁₂ Deficiency
Folate deficiency was independently associated with various socio-demographic and health-related factors, including provincial distribution, food insecurity, minimum dietary diversity, wealth index, underweight, wasting, and a history of fever in the 2 weeks before the survey. In the final multivariable analysis, all the initially significant factors remained associated, except for wealth index, food insecurity, minimum dietary diversity, and wasting. Wealth-index, food insecurity, and residence were deliberately kept in the analysis because of theoretical and contextual association [33]. At the provincial level, the odds of being folate-deficient among children living in Sindh and Khyber Pakhtunkhwa were 1.213 (95% CI 1.026, 1.434) and 1.424 (95% CI 1.157, 1.752) times higher, respectively, than those living in Punjab. Moreover, folate deficiency was higher in underweight children (OR 1.181, 95% CI 1.016, 1.371), whereas it was 21.6% lower than in children with fever within 2 weeks before sampling.
B₁₂ deficiency showed significant association with the child’s age, gender, residence, province, wealth index, sanitation facility, food insecurity status, maternal education, and pregnancy status at the univariate level. The assessment of the adjusted association showed that province, maternal education, and the age of both mothers and children were significant. Residence, wealth index, and food insecurity did not show any association, but they were retained in the analysis [34]. The odds of being B₁₂ deficient among those residing in Islamabad were 1.880 (95% CI 0.970, 3.647), and in KP-NMD were 11.257 (95% CI 2.291, 55.314), both higher than in Punjab. Moreover, B₁₂ deficiency was associated with children aged 6-23 months (OR 1.425, 95% CI 1.0952, 1.860) and with having a middle-aged mother (OR 1.327, 95% CI 1.027, 1.713). Mother’s education seemed to play a key role as all low categories of mother’s education i.e., mothers with no formal education (OR 2.017, 95% CI 1.229, 3.308), primary education (OR 2.361, 95% CI 1.359, 4.103) and middle level education (OR 2.108, 95% CI 1.144, 3.882) showed higher odds of being B₁₂ deficient.

Table 3.
Multivariable ORs and 95% CIs of folate and B₁₂ deficiency among children aged 6-59 months.
Table 3.
Multivariable ORs and 95% CIs of folate and B₁₂ deficiency among children aged 6-59 months.
| Folate deficiency | Vitamin B12 | |||||||
| Characteristics |
OR (95% CIs) |
P-values |
aOR* (95% CIs) |
P-values |
OR (95% CIs) |
P-values |
aOR* (95% CIs) |
P-values |
| Residence | ||||||||
| Urban | Ref. | Ref. | Ref. | Ref. | ||||
| Rural | 1.062 (0.930,1.212) | 0.373 | 1.077 (0.907,1.280) | 0.397 | 1.310 (1.048,1.636) | 0.018 | 1.087 (0.809,1.461) | 0.579 |
| Province | ||||||||
| Punjab | Ref. | Ref. | Ref. | Ref. | ||||
| Sindh | 1.210 (1.042,1.407) | 0.013 | 1.213 (1.026,1.434) | 0.024 | 1.181 (0.895,1.557) | 0.239 | 1.148 (0.842,1.566) | 0.382 |
| KP | 1.445 (1.182,1.766) | 0.000 | 1.424 (1.157,1.752) | 0.001 | 1.303 (0.895,1.895) | 0.167 | 1.232 (0.840,1.808) | 0.286 |
| Baluchistan | 1.218 (0.981,1.512) | 0.074 | 1.225 (0.966,1.553) | 0.093 | 1.533 (0.917,2.563) | 0.103 | 1.450 (0.843,2.493) | 0.180 |
| ICT | 0.876 (0.558,1.377) | 0.567 | 0.914 (0.582,1.435) | 0.695 | 1.497 (0.812,2.760) | 0.196 | 1.880 (0.970,3.647) | 0.062 |
| KP-NMD | 0.526 (0.268,1.036) | 0.063 | 0.494 (0.246,0.991) | 0.047 | 13.678 (2.993,62.507) | 0.001 | 11.257 (2.291,55.314) | 0.003 |
| AJK | 0.837 (0.620,1.129) | 0.243 | 0.828 (0.611,1.122) | 0.223 | 1.695 (0.864,3.326) | 0.125 | 1.790 (0.869,3.686) | 0.114 |
| GB | 0.890 (0.657,1.206) | 0.452 | 0.901 (0.656,1.238) | 0.521 | 0.808 (0.371,1.761) | 0.592 | 0.770 (0.344,1.723) | 0.524 |
| HH size | ||||||||
| <7 | 0.949 (0.833,1.081) | 0.429 | 0.947 (0.761,1.179) | 0.629 | ||||
| 7 or more members | Ref. | Ref. | ||||||
| Wealth Index | ||||||||
| Poorest | Ref. | Ref. | Ref. | Ref. | ||||
| Second | 1.017 (0.837,1.236) | 0.862 | 1.080 (0.879,1.328) | 0.464 | 1.294 (0.970,1.726) | 0.080 | 1.315 (0.955,1.811) | 0.094 |
| Middle | 0.959 (0.785,1.173) | 0.687 | 1.054 (0.838,1.326) | 0.653 | 0.905 (0.651,1.258) | 0.551 | 0.969 (0.636,1.476) | 0.884 |
| Fourth | 0.939 (0.769,1.147) | 0.537 | 1.070 (0.835,1.371) | 0.593 | 0.630 (0.447,0.890) | 0.009 | 0.719 (0.456,1.134) | 0.156 |
| Richest | 0.880 (0.711,1.088) | 0.236 | 1.025 (0.779,1.348) | 0.863 | 0.764 (0.530,1.102) | 0.150 | 1.080 (0.642,1.818) | 0.772 |
| Drinking water source | ||||||||
| Improved sources | 1.092 (0.838,1.421) | 0.516 | 1.022 (0.660,1.581) | 0.923 | ||||
| Unimproved sources | Ref. | Ref. | ||||||
| Sanitation | ||||||||
| Improved sanitation facility | 0.942 (0.797,1.114) | 0.485 | 0.815 (0.639,1.040) | 0.100 | ||||
| Unimproved sanitation facility | Ref. | Ref. | ||||||
| Food Insecurity Status | ||||||||
| Food Secure | Ref. | Ref. | Ref. | Ref. | ||||
| Milld food insecure | 0.962 (0.781,1.183) | 0.711 | 0.973 (0.788,1.202) | 0.801 | 1.318 (0.967,1.797) | 0.080 | 1.329 (0.966,1.828) | 0.081 |
| Moderate food insecure | 1.222 (0.955,1.564) | 0.111 | 1.235 (0.961,1.586) | 0.099 | 0.941 (0.608,1.456) | 0.784 | 0.917 (0.591,1.424) | 0.701 |
| Severe food insecure | 0.953 (0.806,1.128) | 0.577 | 0.943 (0.784,1.133) | 0.529 | 1.221 (0.938,1.589) | 0.139 | 1.101 (0.829,1.462) | 0.507 |
| Mother’s Education | ||||||||
| None | 1.114 (0.894,1.387) | 0.337 | 2.115 (1.376,3.251) | 0.001 | 2.017 (1.229,3.308) | 0.005 | ||
| Primary | 1.041 (0.790,1.372) | 0.774 | 2.195 (1.297,3.714) | 0.003 | 2.361 (1.359,4.103) | 0.002 | ||
| Middle | 1.120 (0.835,1.503) | 0.448 | 2.008 (1.131,3.565) | 0.017 | 2.108 (1.144,3.882) | 0.017 | ||
| Secondary | 1.017 (0.774,1.337) | 0.903 | 1.276 (0.746,2.183) | 0.373 | 1.301 (0.748,2.261) | 0.352 | ||
| Higher | Ref. | Ref. | Ref. | |||||
| Mother’s Occupation | ||||||||
| Employed | 0.932 (0.687,1.265) | 0.651 | 0.883 (0.550,1.416) | 0.604 | ||||
| Unemployed | Ref. | Ref. | ||||||
| Mother’s Age | ||||||||
| 15-19 years | 1.036 (0.590,1.819) | 0.902 | 1.344 (0.574,3.150) | 0.496 | 1.050 (0.430,2.564) | 0.914 | ||
| 20-34 years | 0.973 (0.844,1.123) | 0.712 | 1.298 (1.013,1.662) | 0.039 | 1.327 (1.027,1.713) | 0.030 | ||
| 35-49 years | Ref. | Ref. | Ref. | |||||
| Parity | ||||||||
| <3 | 0.999 (0.877,1.139) | 0.992 | 0.971 (0.779-1.211) | 0.795 | ||||
| >=3 | Ref. | Ref. | ||||||
| Pregnancy status | ||||||||
| Pregnant | 1.071 (0.837,1.372) | 0.585 | 1.494 (1.026-2.176) | 0.036 | ||||
| Non-Pregnant | Ref. | Ref. | ||||||
| Minimum dietary diversity | ||||||||
| <5 food groups | Ref. | Ref. | ||||||
| >=5 food groups | 1.098 (0.937,1.285) | 0.247 | 1.031 (0.79-1.346) | 0.824 | ||||
| Gender | ||||||||
| Male | 0.951 (0.836,1.082) | 0.444 | 1.163 (0.936,1.445) | 0.173 | - | |||
| Female | Ref. | Ref. | ||||||
| Age | ||||||||
| 6-23 months | 1.051 (0.891,1.239) | 0.555 | 1.377 (1.060,1.788) | 0.017 | 1.425 (1.092,1.860) | 0.009 | ||
| 24-59 months | Ref. | Ref. | Ref. | |||||
| Stunting (Height for Age) | ||||||||
| Normal | Ref. | Ref. | ||||||
| Stunting | 0.969 (0.848,1.106) | 0.638 | 1.017 (0.816,1.268) | 0.880 | ||||
| Under-weight (Weight for Age) | ||||||||
| Normal | Ref. | Ref. | Ref. | |||||
| Under-weight | 1.193 (1.031,1.380) | 0.018 | 1.181 (1.016,1.371) | 0.030 | 1.038 (0.821,1.314) | 0.754 | ||
| Wasting (Weight for Height) | ||||||||
| Normal | Ref. | Ref. | ||||||
| Wasted | 1.128 (0.942,1.351) | 0.192 | - | 0.988 (0.741,1.318) | 0.935 | |||
| History of diarrhea in the two weeks prior to survey | ||||||||
| Yes | 0.964 (0.762,1.220) | 0.762 | 1.217 (0.859,1.723) | 0.269 | ||||
| No | Ref. | Ref. | ||||||
| History of ARI in the two weeks prior to survey | ||||||||
| Yes | 0.867 (0.568,1.324) | 0.510 | 0.700 (0.320,1.528) | 0.370 | ||||
| No | Ref. | Ref. | ||||||
| History of fever in the two weeks prior to survey | ||||||||
| Yes | 0.782 (0.651,0.940) | 0.009 | 0.784 (0.651,0.944) | 0.010 | 1.120 (0.837,1.497) | 0.446 | ||
| No | Ref. | Ref. | Ref. | |||||
| aOR*: adjusted odds ratio, the adjusted odds ratios were derived from a mixed effect logistic regression model and were adjusted to account for all the variables listed in the table that had a p-value less than 0.25 in the univariate analysis. A P value <0.05 was considered significant for multivariate analysis. | ||||||||
Discussion
Folate and B₁₂ analysis reported here, have been performed on randomly selected subset of blood samples collected from participants enrolled in National Nutrition Survey (NNS) Pakistan 2018. This analysis reflects nationally representative estimates of serum B₁₂ and serum folate in Pakistan’s population. Among under-five children, the prevalence of folate deficiency (35.1%) was higher than that of B₁₂ deficiency (24.8%). This pattern, however, does not correspond with results from other studies. For instance, a hospital-based study in Northern India conducted among children aged 6-59 months revealed a much lower prevalence of folate deficiency at 10.9% compared to having higher prevalence of B₁₂ deficiency at 22.3% [35]. Similarly to these observations, a population-based survey conducted in Mexico among children aged between 1 and 6 years reported even lower rates of folate (3.2%) and vitamin B₁₂ deficiency (7.7%); with B₁₂ deficiency was also higher in comparison to folate deficiency [36]. The prevalence of these micronutrient deficiencies is considerably high despite an extensive national food fortification initiative in Pakistan. Nutrition International is currently assisting both national and provincial governments with a large food fortification program under the “Pakistani Food Fortification Program” (PFFP) initiative working in 56 districts across the country, wheat flour and edible oils is fortified with important micronutrients including iron, folic acid, B₁₂, vitamin D and A to reduce deficiencies particularly among women and children [37]. Based on our findings, there may be inconsistencies in the impact of this program by nutrient. While the deficiency of B₁₂ may be relatively low, folate deficiency remains widespread. These differences may be partially explained by stability differences of the vitamins when food is prepared. Research has shown that compared to vitamin B₁₂, folate is not as heat stable, and it can lose a defined portion when subjected to prolonged cooking, which is evident in traditional Pakistani cuisine [38,39]. Therefore, the stability of folate may reduce the effectiveness of folic acid fortification which could partially explain the higher prevalence of folate deficiency in the food fortification interventions studied, despite interventions which are directed at both nutrients
These estimates have been further evaluated for association with important geographical, demographic, socioeconomic, and health-related determinants. A substantial variation in the prevalence of both micronutrients was observed at the provincial level yet; no disparity was evident between rural and urban populations. Research suggests that folate deficiency continues to be a public health problem, affecting both rural and urban populations or showing slightly higher in rural population, especially in South-East Asia. A community-based cross-sectional survey of 2018 conducted in India showed similar prevalence of folate deficiency of 23.5% and 22.5% in rural and urban children of 01 to 04 years of age, respectively [40]. However, the odds of B₁₂ deficiency in the study rural population was observed but only when it was not adjusted for other covariates (Unadjusted OR 1.310; 95% CI 1.048-1.636) versus (Adjusted OR 1.087 (0.809,1.461), a similar pattern has been observed in another study conducted among primary school children residing in Ethiopia, a country with almost similar socioeconomic status, indicating slightly higher odds in rural children (Unadjusted OR 1.55; 95% CI 1.07-2.24) versus (Adjusted OR 1.62; 95% CI 0.80-3.26) [41].
Similarly, food insecurity was found to be a significant predictor of folate as well as B₁₂ deficiency in children, only when not adjusted for other factors. It is observant that young children with moderate food insecurity have greater chances of folate deficiency (OR 1.222; 95% CI 0.955,1.564) and those with mild food insecurity have greater chances of B₁₂ deficiency (OR 1.318; 95% CI 0.967,1.797) as compared to those who had secure access to food. The maternal education level has been also observed to impact positively and showing higher risk of B₁₂ deficiency in children with mothers having none, primary and middle level education, i.e., (OR 2.017, 95% CI 1.229-3.308), (OR 2.361, 95% CI 1.359,4.103) and (OR 2.108, 95% CI 1.144-3.882) as compared to having higher education.
Our findings are in accordance with the results of study in Bogotá, Colombia, wherein it was found that there is a lower level of plasma B₁₂ concentration in food-insecure children (314 ± 101 pmol/L) than that in food-secure (332 ± 107 pmol/L; p = 0.003). Folate deficiency overall was not found, probably due to compulsory fortification of wheat flour in the country; nevertheless, there was a modest unadjusted correlation between food security and lower erythrocyte folate concentrations, suggesting reduced folate status in populations across both conditions. However, this correlation became insignificant after confounder adjustment [42]. Moreover, a study conducted in rural India found that children’s vitamin B₁₂ concentrations were positively impacted by maternal education levels [42]. All these findings highlight how the socioeconomic environment, in particular food security and maternal education, shapes children’s micronutrient status.
Among growth-related factors, we observed higher odds of folate deficiency in underweight children. The high rate of folate deficiency among underweight children in Pakistan has been linked to the predominance of lower socioeconomic status in the study population, more than 60% belonging to middle and lower income status and can even be attributed to the whole nation, which shows that around 37% of the population was living below the poverty line in 2018-19 [43]. Some of the basic health-related determinants were evaluated for the children group specifically, and they showed an important association with folate deficiency. Interestingly, children who had experienced fever during the two weeks leading up to sampling showed a 21.8% reduced risk for folate deficiency. However, the impact of acute infections on serum micronutrient status is well established as inflammatory cytokines in response to infection can alter nutrient metabolism and distribution. Folate and other micronutrients may be redirected to immune-related functions, reducing their availability in serum [44]. Moreover, the effect of balanced nutritional status in immunomodulation has also been previously elucidated, reporting positive outcomes in infectious diseases [45]. One potential explanation to our unexpected observation is that during illnesses, caregivers may offer increased nutritional support, such as nutrient-rich foods, which may account for better folate levels.
Age, an important demographic factor was assessed in different ways. Children were assessed on their age groups as well as their mothers’ age. Younger children were observed to have higher odds of B₁₂ deficiency (OR 1.425; 95% CI 1.092-1.860), whereas folate deficiency was not observed to be significantly associated with age. Lower B₁₂ levels in young children are likely a result of multiple factors i.e., they are primarily fed breast milk and uncomplicated complementary foods, and when maternal B₁₂ deficiency is coupled with a delayed introduction of animal-source foods, the risk of deficiency in infants increases. It is recommended that breastfeeding women should consume adequate B₁₂ in their diet to provide their infants with desirable amounts through breastfeeding as B₁₂ is transferred to their infant through breast milk [46]. In contrast, the neonates are born with sufficient folate reserves because the fetal sac actively absorbs folate against a concentration gradient. At birth, neonatal serum folate concentrations have been observed to be about twice as much as those of the mother [47]. Mother’s age also showed significant relation with children B₁₂ deficiency status. Children born to middle-aged mothers showed higher odds (OR 1.327; 95% CI 1.027-1.713) of deficiency as compared to the older aged mothers. The association may also be influenced by several dietary, health and lifestyle factors which work in complex interactions with one another. This reflects the need of further in-depth research to evaluate these relationships [48].
Conclusion
Our analysis highlights a considerable burden of folate (35.1%) and vitamin B₁₂ (24.8%) deficiencies among Pakistani children under five years of age. The findings point to marked regional disparities, with the highest odds observed in Khyber Pakhtunkhwa and its newly merged districts. Socioeconomic and nutritional factors, particularly maternal education and child undernutrition, further influence deficiency risks. These results emphasize the need for region-specific nutrition interventions, maternal education programs, and strengthened food fortification strategies to address micronutrient deficiencies early in life and reduce the long-term health impacts of anemia and related conditions.
Author Contributions
Z.A.B. conceptualized the study and assisted with interpreting the results. S.S. and J.I. provided senior supervision and drafted the overall manuscript. K.B. and R.Z. wrote the manuscript. I.A. oversaw data cleaning activities and managed the data, while S.M. performed the statistical analysis. A.Y., K.B., and R.Z. conducted the laboratory analysis. J.I., S.A., S.S., and Z.A.B. critically reviewed the final manuscript. All authors reviewed and approved the manuscript for submission.
Funding
The NNS-2018 survey was supported by funding from a UKAID grant provided by UNICEF Pakistan
[grant number 43234896]. Secondary analysis for this study was supported by the Center of Excellence in
Preprints.org (www.preprints.org) | NOT PEER-REVIEWED | Posted: Posted: 27 October 2025 doi:10.20944/preprints202510.1984.v1
© 2025 by the author(s). Distributed under a Creative Commons CC BY license.
17 of 19
Women & Child Health at The Aga Khan University, which also provided institutional and operational support
for the study.
Ethical Approval
The NNS 2018 survey was approved approval from the National Bioethics Committee of the Government of Pakistan as well as the Ethics Review Committee of Aga Khan University.
Review Committee
No further approval was deemed necessary for the anonymized secondary analysis.
Ethical Integrity
Informed consent was obtained from all study participants prior to data and blood sample collection during NNS 2018 survey for both primary and secondary analyses.
Data availability
The data will be available on request to the corresponding author.
Acknowledgments
We acknowledge Dr. Christine Pfeiffer, Ms. Mindy Zhang, and Ms. Shameem Jabbar from the Nutritional Biomarkers Branch in the Division of Laboratory Sciences, Center for Disease Control and Prevention (CDC) and Ms. Madhulika Chaudhary, General Health Scientist, CDC for their technical support and training of our laboratory personnel on the CDC Folate Microbiologic Assay Kit, as well as their guidance in assay optimization. We also sincerely thank Dr. Homero Martinez, Senior Technical Advisor at Nutrition International, for sponsoring the training visit. This work was conducted as part of a broader collaborative initiative between CDC, the CDC Foundation, the Nutrition International Folate Task Team, and the Bill and Melinda Gates Foundation aimed at developing regional laboratory capacity for the measurement of blood folate levels.
Conflict of Interest
The authors declare no conflict of interest with this work.
References
- Stevens, G.A., et al., National, regional, and global estimates of anaemia by severity in women and children for 2000-19: a pooled analysis of population-representative data. Lancet Glob Health, 2022. 10(5): p. e627-e639.
- Prado, E.L. and K.G. Dewey, Nutrition and brain development in early life. Nutrition Reviews, 2014. 72(4): p. 267-284.
- Habib, M.A., et al., Factors associated with low birthweight in term pregnancies: a matched case-control study from rural Pakistan. East Mediterr Health J, 2018. 23(11): p. 754-763.
- Liu, Y., et al., Global burden of anemia and cause among children under five years 1990-2019: findings from the global burden of disease study 2019. Front Nutr, 2024. 11: p. 1474664.
- WHO, The Global Health Observatory. 2019.
- Scott, S.P., et al., The impact of anemia on child mortality: an updated review. Nutrients, 2014. 6(12): p. 5915-32.
- Walker, S.P., et al., Child development: risk factors for adverse outcomes in developing countries. Lancet, 2007. 369(9556): p. 145-57.
- Brittenham, G.M., et al., Biology of Anemia: A Public Health Perspective. The Journal of Nutrition, 2023. 153: p. S7-S28.
- de Benoist, B., Conclusions of a WHO Technical Consultation on Folate and Vitamin B12 Deficiencies. Food and Nutrition Bulletin, 2008. 29(2_suppl1): p. S238-S244.
- Gurugubelli, K.R. and V.B. Ballambattu, Perspectives on folate with special reference to epigenetics and neural tube defects. Reproductive Toxicology, 2024. 125: p. 108576.
- Duthie, S.J., Folic acid deficiency and cancer: mechanisms of DNA instability. Br Med Bull, 1999. 55(3): p. 578-92.
- Beetstra, S., et al., Folic acid deficiency increases chromosomal instability, chromosome 21 aneuploidy and sensitivity to radiation-induced micronuclei. Mutation research, 2005. 578: p. 317-26.
- Bhattacharya., A.H.P.T., Megaloblastic Anemia. NIH, 2023.
- Fenech, M., Folate (vitamin B9) and vitamin B12 and their function in the maintenance of nuclear and mitochondrial genome integrity. Mutation Research/Fundamental and Molecular Mechanisms of Mutagenesis, 2012. 733(1): p. 21-33.
- Finkelstein, J.L., A.J. Layden, and P.J. Stover, Vitamin B-12 and Perinatal Health. Advances in Nutrition, 2015. 6(5): p. 552-563.
- Venkatramanan, S., et al., Vitamin B-12 and Cognition in Children. Advances in Nutrition, 2016. 7(5): p. 879-888.
- Abdollahi, Z., et al., Folate, vitamin B12 and homocysteine status in women of childbearing age: baseline data of folic acid wheat flour fortification in Iran. Annals of Nutrition and Metabolism, 2008. 53(2): p. 143-150.
- Haidar, J., Prevalence of anaemia, deficiencies of iron and folic acid and their determinants in Ethiopian women. J Health Popul Nutr, 2010. 28(4): p. 359-68.
- Viteri, F.E. and H. Gonzalez, Adverse outcomes of poor micronutrient status in childhood and adolescence. Nutr Rev, 2002. 60(5 Pt 2): p. S77-83.
- WHO, Evaluating the public health significance of micronutrient malnutrition.
- Abi Khalil, H., M. Hawi, and M. Hoteit, Feeding Patterns, Mother-Child Dietary Diversity and Prevalence of Malnutrition Among Under-Five Children in Lebanon: A Cross-Sectional Study Based on Retrospective Recall. Front Nutr, 2022. 9: p. 815000.
- Ng’eno, B.N., et al., High Prevalence of Vitamin B12 Deficiency and No Folate Deficiency in Young Children in Nepal. Nutrients, 2017. 9(1).
- Rousham, E.K., et al., The effect of a school-based iron intervention on the haemoglobin concentration of school children in north-west Pakistan. Eur J Clin Nutr, 2013. 67(11): p. 1188-92.
- Mazhar Alam, J.D., Hira Hur, Meg Walker, Albertha Nyaku, Allison Gottwalt, A Qualitative Assessment of Supply and Demand of Maternal Iron-Folic Acid Supplementation and Infant and Young Child Feeding Counseling in Jamshoro and Thatta Districts, Pakistan. USAID, 2018.
- UNICEF, Comprehensive National Nutrition Survey. 2016-2018.
- WHO, WHO guidelines on drawing blood: best practices in phlebotomy. 2010.
- CDC, U., Laboratory Quality Assurance Programs. 2024.
- Pfeiffer, C.M., et al., Estimation of trends in serum and RBC folate in the U.S. population from pre- to postfortification using assay-adjusted data from the NHANES 1988-2010. J Nutr, 2012. 142(5): p. 886-93.
- CDC, C.f.D.C.a.P., FOLATE MICROBIOLOGIC ASSAY. 2018.
- UNICEF, National Nutrition Survey 2018, Key Finding Report. 2018-2019.
- Siddiqui, B., et al., Megaloblastic anemia: A common but often neglected cause of pyrexia of unknown origin. J Transl Int Med, 2015. 3(2): p. 64-67.
- Meisel, E., et al., Folate Levels in Patients Hospitalized with Coronavirus Disease 2019. Nutrients, 2021. 13(3): p. 812.
- DHSPROGRAM, WEALTH INDEX. 2016.
- Villamor, E., et al., Vitamin B-12 Status Is Associated with Socioeconomic Level and Adherence to an Animal Food Dietary Pattern in Colombian School Children123. The Journal of Nutrition, 2008. 138(7): p. 1391-1398.
- Gupta, S., et al., Prevalence of serum cobalamin and folate deficiency among children aged 6-59 months: A hospital-based cross-sectional study from Northern India. J Family Med Prim Care, 2022. 11(3): p. 1063-1069.
- Cuevas-Nasu, L., et al., Prevalence of folate and vitamin B12 deficiency in Mexican children aged 1 to 6 years in a population-based survey. Salud Publica Mex, 2012. 54(2): p. 116-24.
- Nutrition International, M.M., Food Fortification Program (FFP) Pakistan. 2016.
- McKillop, D.J., et al., The effect of different cooking methods on folate retention in various foods that are amongst the major contributors to folate intake in the UK diet. Br J Nutr, 2002. 88(6): p. 681-8.
- Bajaj, S.R. and R.S. Singhal, Fortification of wheat flour and oil with vitamins B12 and D3: Effect of processing and storage. Journal of Food Composition and Analysis, 2021. 96: p. 103703.
- Shalini, T., et al. Prevalence of Vitamin B12 and Folate Deficiencies in Indian Children and Adolescents. Nutrients, 2023. 15, DOI: 10.3390/nu15133026.
- Melaku, E.E., et al., Prevalence of vitamin B 12 deficiency and associated factors among primary school children: North East Ethiopia: multicenter cross-sectional study. J Health Popul Nutr, 2024. 43(1): p. 82.
- Pasricha, S.-R., et al., Vitamin B-12, folate, iron, and vitamin A concentrations in rural Indian children are associated with continued breastfeeding, complementary diet, and maternal nutrition1234. The American Journal of Clinical Nutrition, 2011. 94(5): p. 1358-1370.
- Jamal, H., Updating Pakistan’s poverty numbers for the year 2019. 2021.
- Palmer, A.C., J.R. Bedsaul-Fryer, and C.B. Stephensen, Interactions of Nutrition and Infection: The Role of Micronutrient Deficiencies in the Immune Response to Pathogens and Implications for Child Health. Annual Review of Nutrition, 2024. 44(Volume 44, 2024): p. 99-124.
- Calder, P.C., et al., Optimal nutritional status for a well-functioning immune system is an important factor to protect against viral infections. Nutrients, 2020. 12(4): p. 1181.
- CDC, C.f.D.C.a.P., Breastfeeding and vitamin B12 in infants. 2023.
- Molloy, A.M., et al., Effects of folate and vitamin B12 deficiencies during pregnancy on fetal, infant, and child development. Food Nutr Bull, 2008. 29(2 Suppl): p. S101-11; discussion S112-5.
- van Weelden, W., et al., Folate and vitamin B12 status: associations with maternal glucose and neonatal DNA methylation sites related to dysglycaemia, in pregnant women with obesity. Journal of developmental origins of health and disease, 2022. 13(2): p. 168-176.
Figure 1.
Map showing the sample size distribution by provinces and regions of Pakistan for the subset sampling used in (a) folate and (b) vitamin B₁₂ analysis. This secondary analysis utilized samples collected from children less than 5 years of age in the National Nutrition Survey of Pakistan, 2018. The map highlights the number of samples from each region included in this analysis.
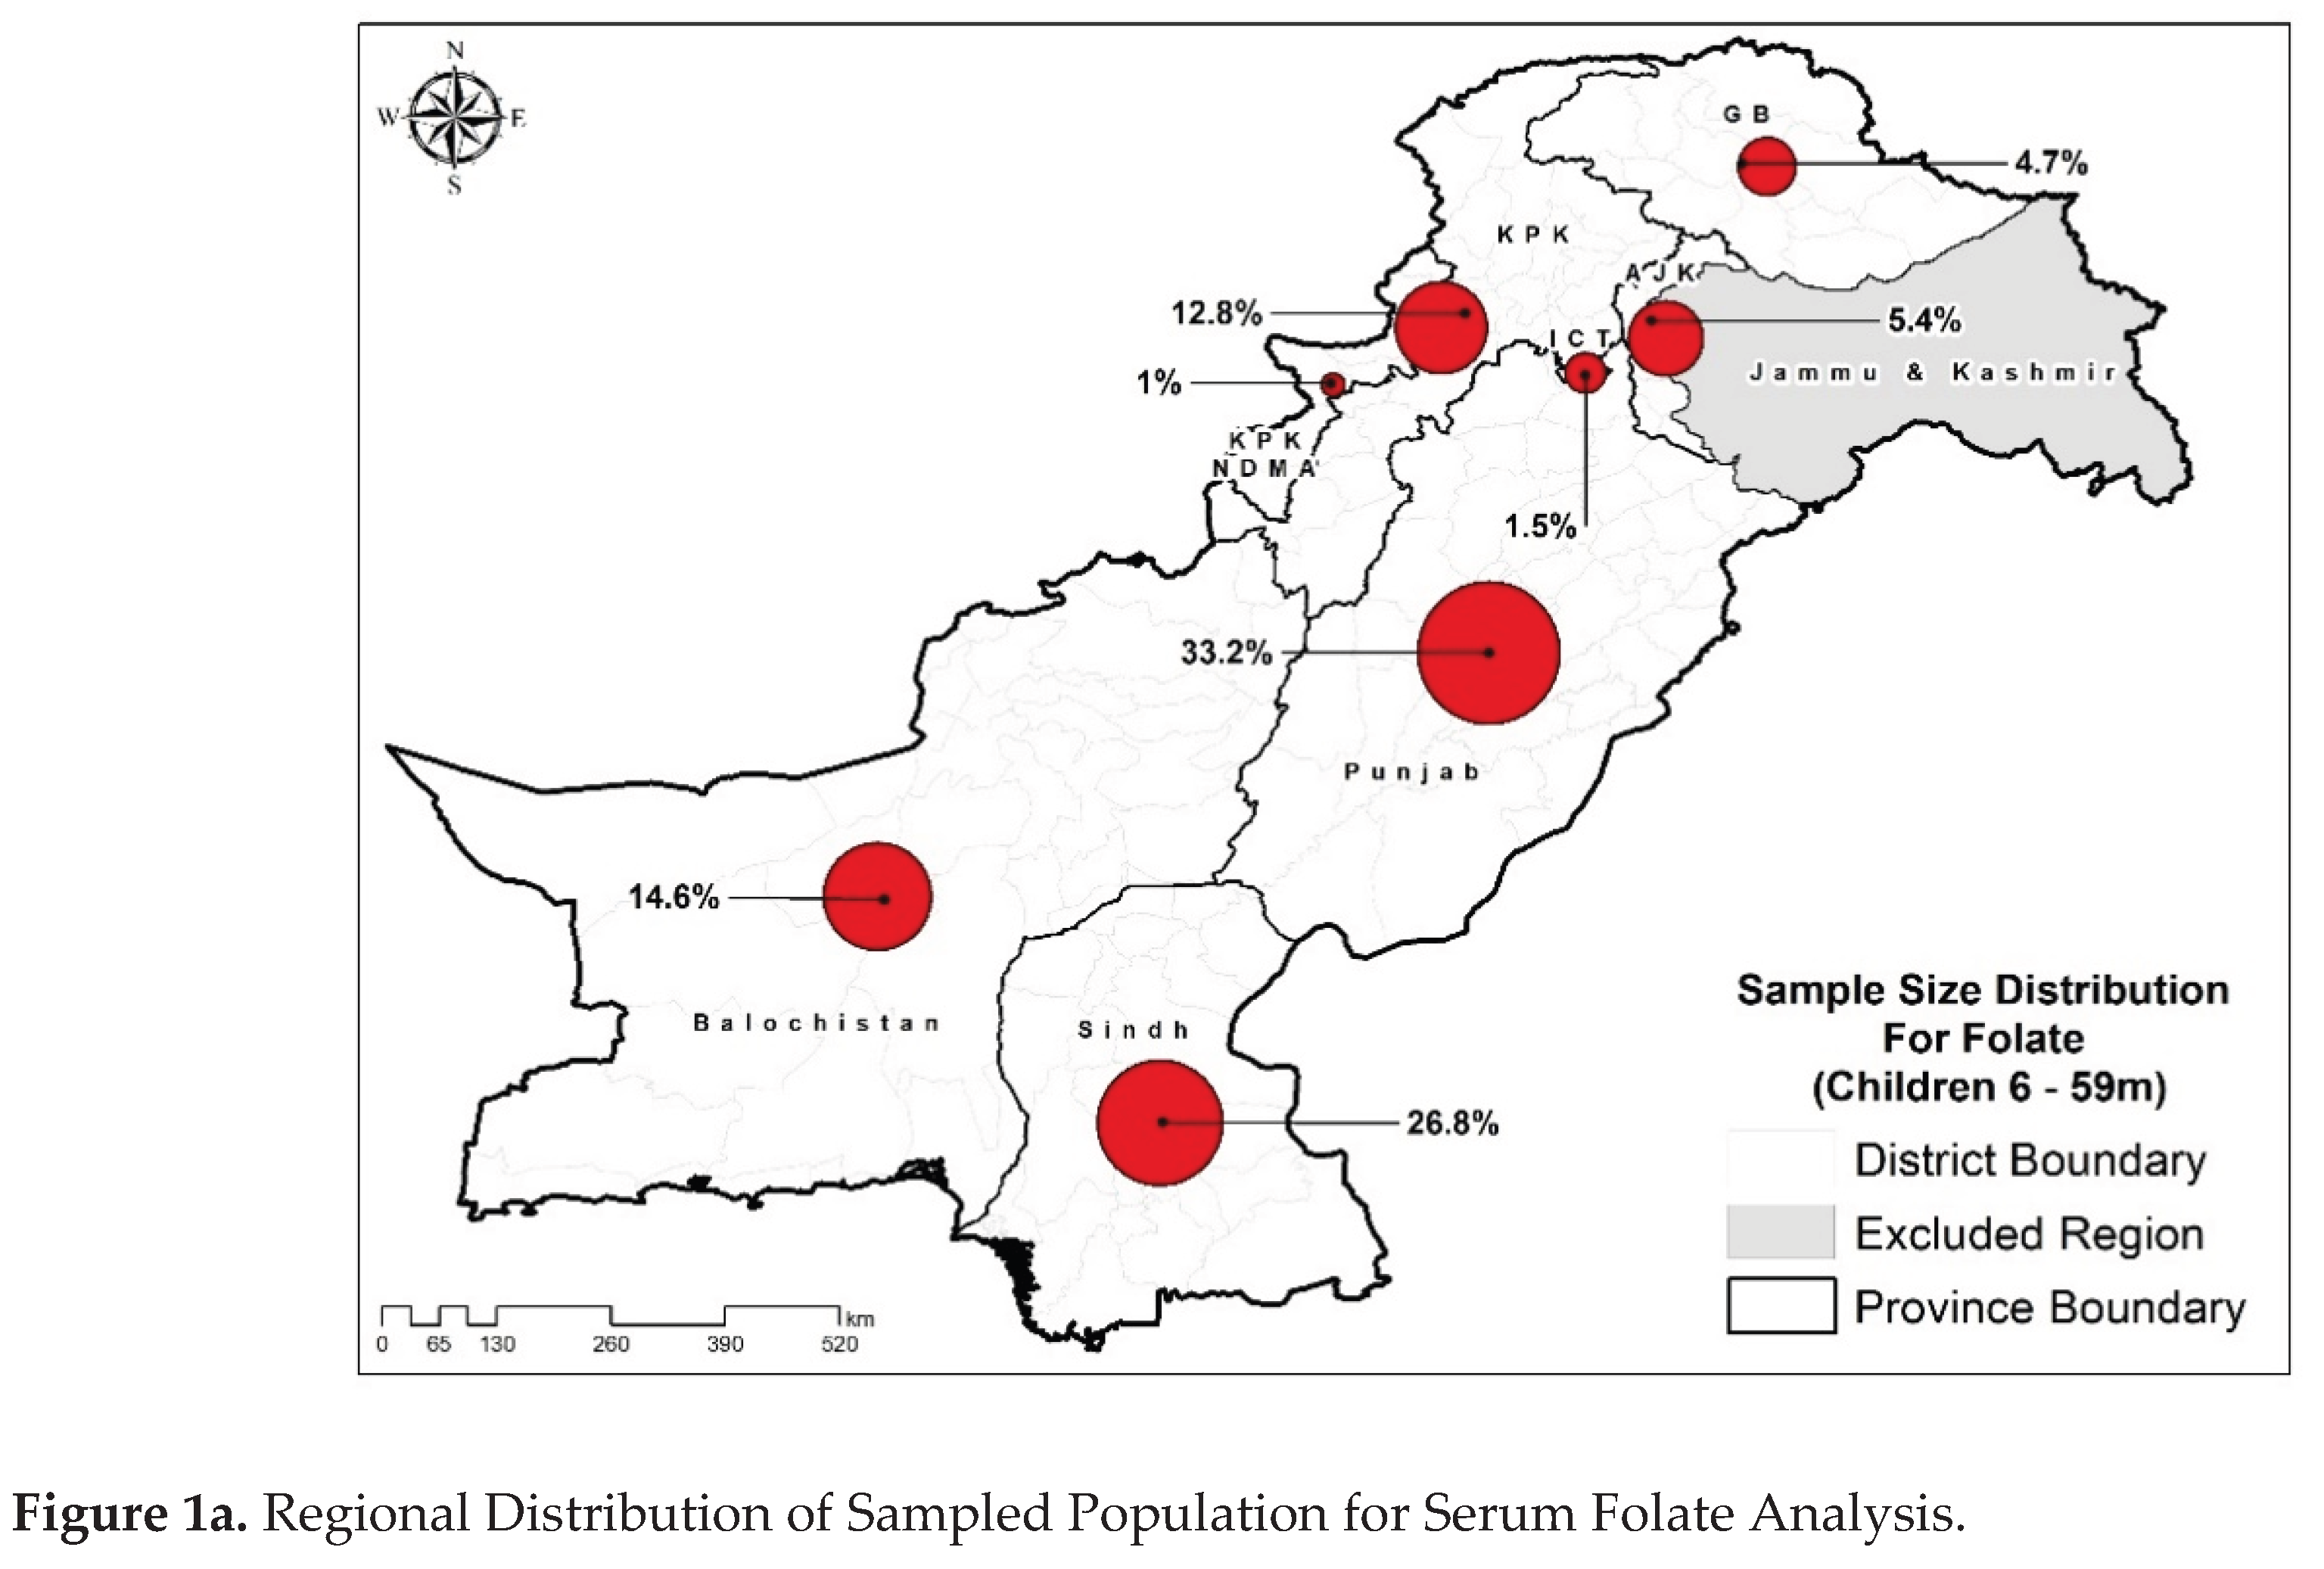
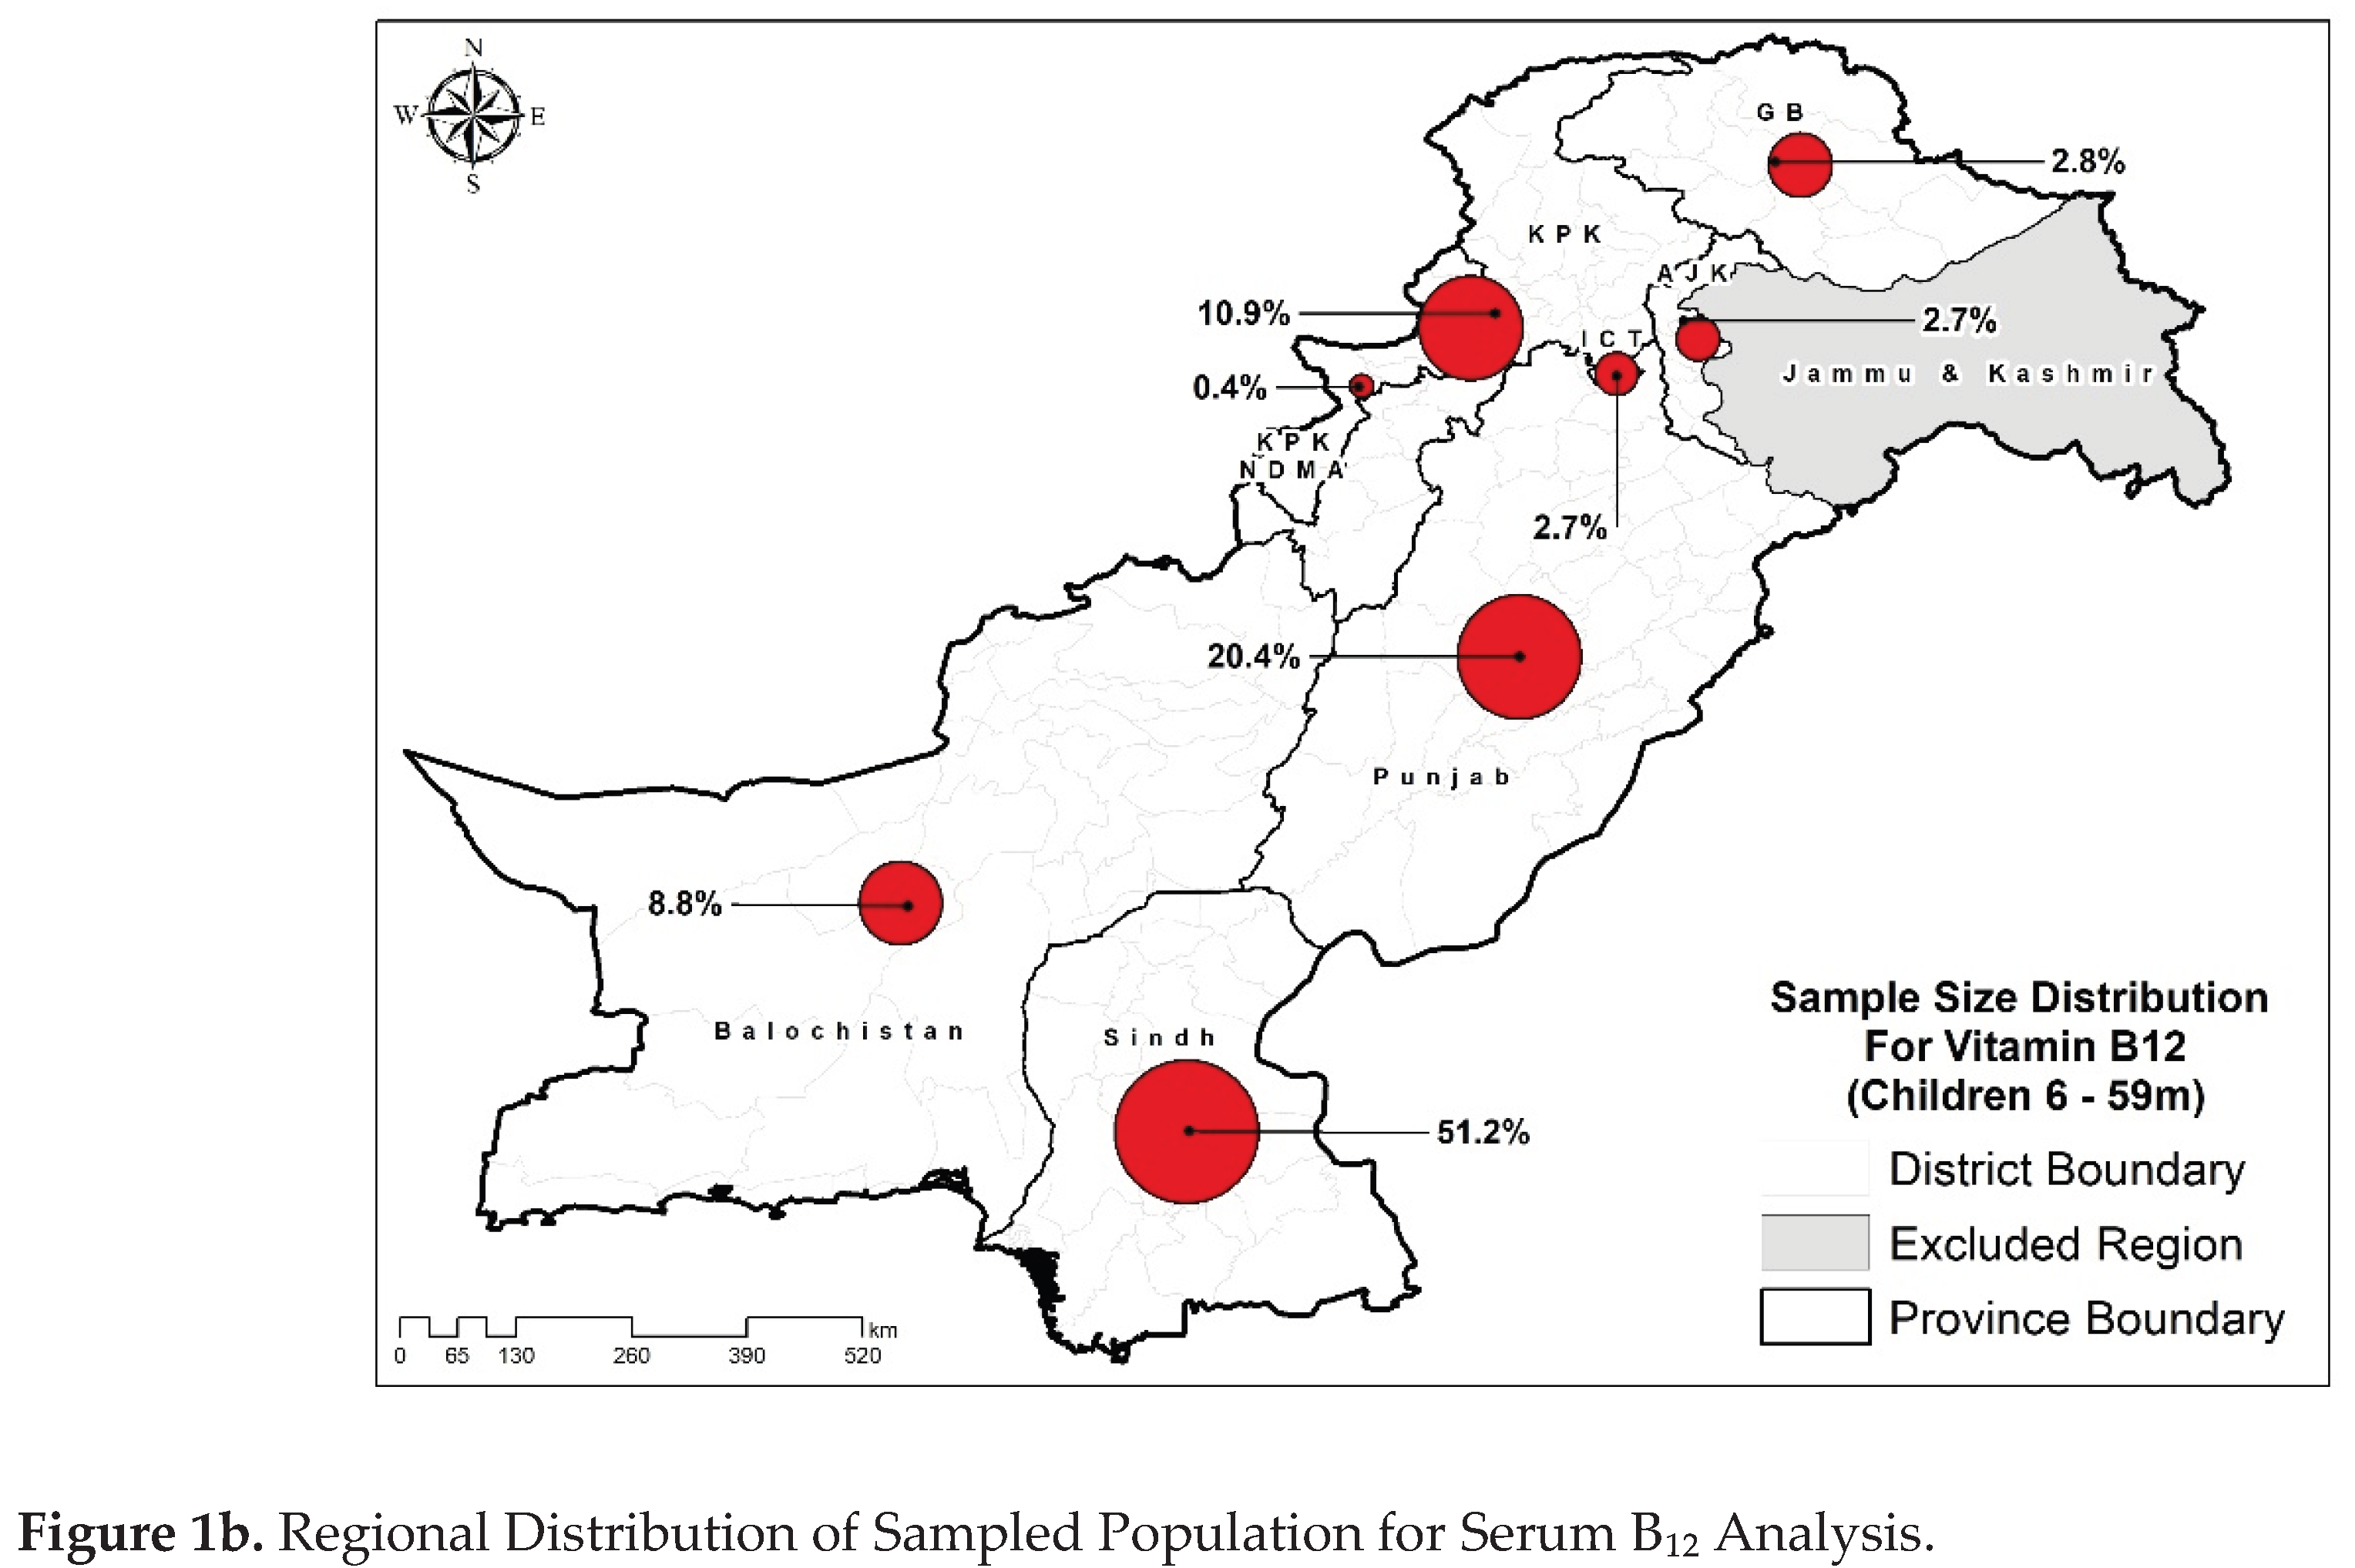
Table 1.
Characteristics of the study population among children of 6-59 months age.
| Characteristics |
Folate (n=6690) % (95% CIs) |
Vitamin B12 (n=2693) % (95 CIs) |
| Residence | ||
| Urban | 43.0 (41.5-44.6) | 44.6 (42.3-46.9) |
| Rural | 57.0 (55.4-58.5) | 55.4 (53.1-57.7) |
| Province | ||
| Punjab | 45.7 (44.2-47.3) | 27.1 (25.0-29.3) |
| Sindh | 36.5 (35.0-38.0) | 58.7 (56.5-61.0) |
| KP | 9.8 (9.1-10.6) | 8.6 (7.5-9.7) |
| Baluchistan | 4.4 (4.0-4.9) | 2.7 (2.2-3.3) |
| ICT | 1.2 (1.0-1.5) | 1.8 (1.4-2.4) |
| KP-NMD | 0.5 (0.4-0.7) | 0.3 (0.1-0.5) |
| AJK | 1.4 (1.2-1.6) | 0.6 (0.5-0.8) |
| GB | 0.4 (0.3-0.4) | 0.2 (0.1-0.2) |
| HH size | ||
| <7 | 56.2 (54.7-57.7) | 54.7 (52.4-57.0) |
| 7 or more members | 43.8 (42.3-45.3) | 45.3 (43.0-47.6) |
| Wealth Index | ||
| Poorest | 18.8 (17.7-19.9) | 24.7 (22.8-26.6) |
| Second | 19.0 (17.9-20.2) | 18.2 (16.6-19.9) |
| Middle | 20.5 (19.3-21.7) | 20.0 (18.1-22.0) |
| Fourth | 23.1 (21.8-24.5) | 20.3 (18.4-22.3) |
| Richest | 18.6 (17.4-19.9) | 16.9 (15.2-18.8) |
| Drinking water source | ||
| Improved sources | 91.9 (90.9-92.8) | 89.7 (87.7-91.4) |
| Unimproved sources | 8.1 (7.2-9.1) | 10.3 (8.6-12.3) |
| Sanitation | ||
| Improved sanitation facility | 84.4 (83.4-85.4) | 78.7 (76.9-80.5) |
| Unimproved sanitation facility | 15.6 (14.6-16.6) | 21.3 (19.5-23.1) |
| Food Insecurity Status | ||
| Food Secure | 59.9 (58.3-61.4) | 53.5 (51.2-55.8) |
| Milld food insecure | 11.7 (10.8-12.7) | 13.9 (12.4-15.6) |
| Moderate food insecure | 9.2 (8.2-10.3) | 11.0 (9.3-12.9) |
| Severe food insecure | 19.2 (18.0-20.4) | 21.6 (19.7-23.6) |
| Mother’s Education | ||
| None | 55.4 (53.9-56.9) | 60.5 (58.1-62.7) |
| Primary | 11.4 (10.5-12.4) | 9.9 (8.7-11.4) |
| Middle | 9.1 (8.3-10.1) | 8.2 (7.0-9.8) |
| Secondary | 13.4 (12.3-14.5) | 12.6 (11.0-14.4) |
| Higher | 10.6 (9.7-11.6) | 8.7 (7.6-10.1) |
| Mother’s Occupation | ||
| Employed | 4.4 (3.9-5.1) | 4.7 (3.9-5.7) |
| Unemployed | 95.6 (94.9-96.1) | 95.3 (94.3-96.1) |
| Mother’s Age | ||
| 15-19 years | 1.0 (0.8-1.3) | 1.1 (0.8-1.7) |
| 20-34 years | 72.6 (71.3-73.9) | 71.9 (69.8-73.9) |
| 35-49 years | 26.4 (25.1-27.7) | 27.0 (25.0-29.0) |
| Parity | ||
| <3 | 41.0 (39.5-42.5) | 39.4 (37.1-41.7) |
| >=3 | 59.0 (57.5-60.5) | 60.6 (58.3-62.9) |
| Pregnancy status | ||
| Pregnant | 6.5 (5.8-7.3) | 7.3 (6.2-8.6) |
| Non-Pregnant | 93.5 (92.7-94.2) | 92.7 (91.4-93.8) |
|
Minimum dietary diversity <5 food groups >=5 food groups |
75.3 (73.9-76.6) 24.7 (23.4-26.1) |
80.4 (78.5-82.1) 19.6 (17.9-21.5) |
| Gender | ||
| Male | 50.5 (48.9-52.0) | 49.7 (47.3-52.0) |
| Female | 49.5 (48.0-51.1) | 50.3 (48.0-52.7) |
| Age | ||
| 6-23 months | 20.6 (19.3-21.9) | 20.6 (18.7-22.7) |
| 24-59 months | 79.4 (78.1-80.7) | 79.4 (77.3-81.3) |
| Stunting (Height for Age) | ||
| Normal | 60.4 (58.8-61.9) | 55.4 (53.0-57.7) |
| Stunting | 39.6 (38.1-41.2) | 44.6 (42.3-47.0) |
| Under-weight (Weight for Age) | ||
| Normal | 74.3 (72.9-75.6) | 68.2 (66.0-70.3) |
| Under-weight | 25.7 (24.4-27.1) | 31.8 (29.7-34.0) |
| Wasting (Weight for Height) | ||
| Normal | 85.5 (84.3-86.5) | 83.6 (81.8-85.3) |
| Wasted | 14.5 (13.5-15.7) | 16.4 (14.7-18.2) |
| History of diarrhea in the two weeks prior to survey | ||
| Yes | 8.4 (7.5-9.3) | 9.8 (8.4-11.4) |
| No | 91.6 (90.7-92.5) | 90.2 (88.6-91.6) |
| History of ARI in the two weeks prior to survey | ||
| Yes | 2.2 (1.8-2.7) | 1.9 (1.4-2.5) |
| No | 97.8 (97.3-98.2) | 98.1 (97.5-98.6) |
| History of fever in the two weeks prior to survey | ||
| Yes | 15.0 (14.0-16.2) | 16.4 (14.7-18.3) |
| No | 85.0 (83.8-86.0) | 83.6 (81.7-85.3) |
Table 2.
Prevalence of B₁₂ and Folate deficiency among children of 6-59 months age.
| Characteristics |
Folate (n=6690) Deficiency % (95% CIs) |
Vitamin B12 (n=2693) Deficiency % (95 CIs) |
| Residence | ||
| Urban | 34.3 (32.0-36.7) | 22.0 (19.2-25.2) |
| Rural | 35.7 (33.9-37.6) | 27.0 (24.4-29.8) |
| Province | ||
| Punjab | 32.7 (30.5-35.0) | 22.1 (18.3-26.4) |
| Sindh | 37.0 (34.5-39.6) | 25.1 (22.5-27.8) |
| KP | 41.2 (37.1-45.5) | 26.9 (21.6-33.0) |
| Baluchistan | 37.2 (32.8-41.7) | 30.3 (21.6-40.6) |
| ICT | 29.9 (21.5-39.8) | 29.8 (19.4-42.7) |
| KP-NMD | 20.4 (11.6-33.3) | 79.5 (46.3-94.6) |
| AJK | 28.9 (23.5-35.0) | 32.4 (20.3-47.4) |
| GB | 30.2 (24.5-36.5) | 18.6 (9.8-32.5) |
| HH size | ||
| <7 | 34.6 (32.7-36.5) | 24.3 (21.8-27.0) |
| 7 or more members | 35.8 (33.6-38.1) | 25.3 (22.3-28.6) |
| Wealth Index | ||
| Poorest | 36.1 (32.9-39.4) | 26.6 (22.9-30.7) |
| Second | 36.5 (33.4-39.7) | 31.9 (27.6-36.6) |
| Middle | 35.1 (31.9-38.5) | 24.7 (20.2-29.9) |
| Fourth | 34.7 (31.5-37.9) | 18.6 (14.7-23.2) |
| Richest | 33.2 (29.8-36.8) | 21.7 (16.9-27.4) |
| Drinking water source | ||
| Improved sources | 35.3 (33.8-36.8) | 24.8 (22.8-27.0) |
| Unimproved sources | 33.3 (27.9-39.2) | 24.4 (17.5-33.0) |
| Sanitation | ||
| Improved sanitation facility | 34.9 (33.3-36.5) | 24.0 (21.7-26.3) |
| Unimproved sanitation facility | 36.3 (32.8-39.8) | 27.9 (23.9-32.2) |
| Food Insecurity Status | ||
| Food Secure | 35.0 (33.2-36.9) | 23.4 (20.8-26.1) |
| Milld food insecure | 34.1 (30.0-38.5) | 28.7 (23.5-34.5) |
| Moderate food insecure | 39.7 (34.3-45.4) | 22.3 (16.0-30.2) |
| Severe food insecure | 33.9 (30.7-37.3) | 27.1 (23.0-31.6) |
| Mother’s Education | ||
| None | 35.8 (33.9-37.8) | 26.9 (24.4-29.6) |
| Primary | 34.3 (30.2-38.6) | 27.6 (21.5-34.7) |
| Middle | 35.9 (31.2-41.0) | 25.9 (18.9-34.3) |
| Secondary | 33.7 (29.8-38.0) | 18.2 (13.6-23.9) |
| Higher | 33.4 (29.0-38.0) | 14.8 (10.4-20.8) |
| Mother’s Occupation | ||
| Employed | 33.6 (27.3-40.5) | 22.6 (15.6-31.7) |
| Unemployed | 35.2 (33.7-36.7) | 24.9 (22.9-27.1) |
| Mother’s Age | ||
| 15-19 years | 36.4 (24.8-49.8) | 26.7 (13.8-45.4) |
| 20-34 years | 34.9 (33.2-36.7) | 26.1 (23.7-28.6) |
| 35-49 years | 35.6 (32.8-38.4) | 21.3 (18.0-25.1) |
| Parity | ||
| <3 | 35.1 (32.9-37.4) | 24.5 (21.5-27.7) |
| >=3 | 35.1 (33.2-37.1) | 25.0 (22.5-27.7) |
| Pregnancy status | ||
| Pregnant | 36.6 (31.3-42.3) | 32.3 (25.0-40.6) |
| Non-Pregnant | 35.0 (33.5-36.5) | 24.2 (22.2-26.4) |
|
Minimum dietary diversity <5 food groups >=5 food groups |
34.5 (32.7-36.3) 36.6 (33.5-39.8) |
24.7 (22.2-27.3) 25.2 (21.2-29.8) |
| Gender | ||
| Male | 34.5 (32.5-36.6) | 26.2 (23.4-29.2) |
| Female | 35.7 (33.6-37.8) | 23.4 (20.7-26.3) |
| Age | ||
| 6-23 months | 36.0 (32.7-39.5) | 29.7 (25.2-34.8) |
| 24-59 months | 34.9 (33.3-36.5) | 23.5 (21.4-25.8) |
| Stunting (Height for Age) | ||
| Normal | 35.5 (33.6-37.4) | 24.6 (22.1-27.4) |
| Stunting | 34.7 (32.4-37.1) | 25.0 (22.0-28.2) |
| Under-weight (Weight for Age) | ||
| Normal | 34.1 (32.4-35.8) | 24.6 (22.2-27.1) |
| Under-weight | 38.1 (35.2-41.1) | 25.3 (21.8-29.2) |
| Wasting (Weight for Height) | ||
| Normal | 34.7 (33.1-36.4) | 24.9 (22.7-27.2) |
| Wasted | 37.5 (33.7-41.5) | 24.7 (20.1-29.8) |
| History of diarrhea in the two weeks prior to survey | ||
| Yes | 34.4 (29.5-39.6) | 28.2 (22.1-35.3) |
| No | 35.2 (33.7-36.7) | 24.4 (22.4-26.6) |
| History of ARI in the two weeks prior to survey | ||
| Yes | 32.0 (23.7-41.7) | 18.8 (9.7-33.5) |
| No | 35.2 (33.7-36.7) | 24.9 (22.9-27.0) |
| History of fever in the two weeks prior to survey | ||
| Yes | 30.5 (27.0-34.2) | 26.6 (21.7-32.1) |
| No | 35.9 (34.3-37.5) | 24.4 (22.3-26.7) |
Disclaimer/Publisher’s Note: The statements, opinions and data contained in all publications are solely those of the individual author(s) and contributor(s) and not of MDPI and/or the editor(s). MDPI and/or the editor(s) disclaim responsibility for any injury to people or property resulting from any ideas, methods, instructions or products referred to in the content. |
© 2025 by the authors. Licensee MDPI, Basel, Switzerland. This article is an open access article distributed under the terms and conditions of the Creative Commons Attribution (CC BY) license (http://creativecommons.org/licenses/by/4.0/).
Copyright: This open access article is published under a Creative Commons CC BY 4.0 license, which permit the free download, distribution, and reuse, provided that the author and preprint are cited in any reuse.


