
Submitted:
24 October 2025
Posted:
24 October 2025
You are already at the latest version
Abstract
Background: Anemia is a severe public health issue, particularly among women of reproductive age (WRA) in low-and middle-income countries. Pakistan National Nutrition Survey (NNS) 2011 showed a high prevalence of B12 and folate deficiency in WRA, necessitating further investigation in follow-up surveys. Methods: Using a stratified multi-stage sampling technique, we conducted a secondary analysis of the National Nutrition Survey (NNS) 2018–2019. Blood samples were collected from 31,828 WRA (15–49 years old), and a subsample was examined for folate (n=12662) and B12 deficiencies (n=4442). B12 and folate levels were measured using Electrochemiluminescence immunoassay and a CDC-approved microbiologic assay, respectively. The association of factors was analyzed using logistic regression. Results: 44.7% and 20.2% WRA had folate and B12 deficiency, respectively. Provincial distribution was associated with folate deficiency i.e., Sindh OR=1.140 (95% CI 1.018, 1.285), Baluchistan OR = 1.237 (95% CI 1.052, 1.453), Islamabad OR = 1.524 (95% CI 1.109, 2.092). In comparison, B12 deficiency was prevalent in Islamabad, OR = 1.673 (95% CI 1.122, 2.497), Gilgit Baltistan, OR = 2.472 (95% CI 1.197, 5.106), and the tribal districts of KPK, OR = 1.584 (95% CI 0.977, 2.570). Rural residence OR=1.407 (95% CI 1.125, 1.760), being obese OR=1.649 (95% CI 1.282, 2.122), and being overweight OR=1.560 (95% CI 1.262, 1.928) were also associated with B12 deficiency. Conclusion: Study revealed that nearly half of women were affected by folate deficiency and one in five by B12 deficiency. The findings highlight significant regional disparities and stronger vulnerability among women in rural areas and those with higher body mass indices. These results emphasize the need for targeted nutritional interventions, improved dietary diversity, and public health strategies.
Keywords:
women of reproductive age
; B12 deficiency
; Folate deficiency
; Pakistan
Background
Anemia is a serious global public health issue that affects both developed and developing countries and is more common in young children, adolescent girls, women of reproductive age, pregnant, and postpartum women [1]. Anemia can cause significant fatigue, weakness, shortness of breath, and may lead to severe health issues due to reduced oxygen supply to the body’s tissues [2,3]. Left untreated, anemia can result in fatigue, limit daily activities, and potentially cause heart problems [4] or pregnancy complications [5]. Anemia in women during their reproductive age has been associated with impaired ovulation, disturbed endometrial receptivity, and menstrual irregularities [6,7]. Anemia-related chronic inflammation or hypoxia can alter the reproductive hormonal axis and when associated with comorbidities, hormonal imbalances, and micronutrient deficiencies, lead to infertility issues [8,9,10].
According to the WHO, worldwide anemia prevalence in pregnant and non-pregnant women is 36% and 30%, respectively [11]. Adolescent anemia prevalence is 6% in developed nations and 27% in developing nations [12]. In Pakistan, among WRA, the prevalence of anemia was 44% in pregnant women compared to 41.1% in non-pregnant women, according to the World Health Organization (WHO) in 2019 [13]. Anemia has been linked to elevated morbidity and mortality in women and children [14], which is evaluated by measuring hemoglobin levels, serving as a sign of iron deficiency. However, iron deficiency is not the sole reason for anemia, as deficiencies in Vitamin B12 (B12) and folate can also lead to this condition [15]. The World Health Organization claims that the prevalence of folate and B12 deficiency is a global public health issue impacting millions of people [16]. Additionally, there is a link between low B12 levels during pregnancy and a higher chance of adverse pregnancy outcomes [17]. Folate deficiency has been associated with atherosclerosis, stunting, and an increased risk of low birth weight and neural tube closure defects, including encephalocele, anencephaly, and spina bifida, during pregnancy [18,19,20]. On the other hand, B12 and folate deficits are linked to megaloblastic anemia, and both vitamins are involved in a variety of common metabolic processes [21]. Primary dietary sources of folate include plant sources, including leafy greens and fruits, as well as animal sources like yeast, meat, and liver. Animals’ gut microbes produce B12, which is then absorbed and integrated into animal tissues. And therefore, the only source of B12 for humans is products derived from herbivorous animals such as meat, eggs, and milk. Thus, the risk of folate and B12 deficiency is increased when an inadequate intake of these foods is consumed [22].
We evaluated the association of B12 and folate deficiencies in Pakistani women with anemia and other contributing factors following Pakistan’s 2011 National Nutrition Survey (NNS). This survey indicated that 52.4% WRA had B12 deficiency and 50.8% had folate deficiency. The survey recorded a high prevalence of anemia (50.4%) in the region, reporting a significant positive correlation with B12 deficiency in two provinces. In Khyber Pakhtunkhwa, the RR of WRA was 1.25 (95% CI 1.11 to 1.43), p<0.00 , while Azad Jammu and Kashmir had a significantly higher risk with an RR of 1.50 (95% CI 1.08 to 2.08), p=0.01 [23]. Following NNS-2011, studies have been conducted to investigate supply, demand, perceptions, knowledge, and practices regarding iron IFA supplements in rural and urban settings of Pakistan. Qualitative research that was conducted to assess the Supply and Demand of Maternal Iron-Folic Acid has reported that IFA supplements are mostly available to pregnant women via LHW network, district clinics, and private pharmacies [24].
The recent large-scale NNS in Pakistan conducted in 2018 again surveyed deficiencies of various micronutrients among the Pakistani population, including WRA. To evaluate the present status of B12 and folate deficiencies associated with anemia and other contributing factors among WRA, we conducted a secondary analysis of data collected during NNS-2018.
Methodology
Study Design
The National Nutrition Survey (NNS) April 2018 - January 2019 was a cross-sectional, household-based survey to measure nutrition indicators in Pakistan. Both qualitative and quantitative research techniques were used to gather substantial data. Sampling frame was designed to obtain data on the district level for all provinces in Pakistan including Punjab, Sindh, Baluchistan, and Khyber Pakhtunkhwa (KPK), as well as Azad Jammu and Kashmir (AJK), Gilgit-Baltistan (GB), the KP Newly Merged Districts (KP-NMD), and Islamabad Capital Territory (ICT) with among rural/urban localities for both genders.
Sample Size Calculation
Data from the National Nutrition Survey (NNS) Pakistan 2011 for WRA were used to determine the sample size needed to estimate the prevalence of folate and B12 deficiencies in Pakistan [22]. To account for multi-stage cluster sampling, the estimates were calculated using a design effect of two and an alpha level of 5%. It would take at least 541 participants to estimate folate deficit and 540 people to estimate B12 deficiency among WRA at a 90% confidence level. The following formula has been used to determine the sample size.
Sample size n = [DEFF*Np(1-p)]/ [(d2/Z21-α/2*(N-1) + p*(1-p)]
Sampling Technique
The Population and Housing Census 2017 served as the basis for the sample frame provided by the Pakistan Bureau of Statistics (PBS), which also produced digital maps of prominent localities and compact enumeration blocks, or PSUs, with 200–250 households. At the household level, 115600 secondary sampling units (SSUs) were chosen from 5780 primary sampling units (PSUs). The line-listing exercise from AKU was used to nominate households from each sampled PSU by the field personnel. AKU’s Data Management Unit gathered paper-based line-listing data and uploaded it to electronic tablets for the selection of the study population.
Blood Collection
Venous blood samples were collected from participants by qualified phlebotomists while following the WHO safe phlebotomy guidelines. [25]. During the NNS-2018 survey, 31,828 women of reproductive age (WRA) aged 15–49 years provided blood samples.
B12 and folate assays were performed on a subset, chosen from archived samples of NNS-2018’s blood samples. A total of 12662 samples were subjected to folate determination, while 4442 samples were analyzed for B12 levels. (Figure 1).
Biochemical Assessment
Biochemical assessments were conducted in the Nutrition Research Laboratory (NRL) at Aga Khan University, Karachi, Pakistan. B12 was quantitatively measured in the serum samples through electrochemiluminescence immunoassay (ECLIA), a competitive binding assay for the in vitro analysis using intrinsic factors specific to B12 for selective detection. The Roche Cobas e411 Vitamin B12 II assay kit (Reference number 07212771 190) was used for the analysis, with a detection range of 50 to 2000 pg/mL. Calibration was performed using Roche Vitamin B12 II Cal Set (reference number 07212780190), following a two-point calibration process once per reagent lot, within 24 hours of reagent registration, every 28 days for the same lot, or at least once every 7 days when using the same reagent kit. To ensure accuracy, PreciControl Varia (Reference number 05618860190) was used for quality control, with high and low concentration controls run once per reagent kit, and after each calibration. The assay’s reliability was further confirmed through external validation by participating in the Vital EQA program of the CDC, USA, which is a standardization program designed to provide labs measuring nutritional markers in serum with an independent assessment of their analytical performance [26]. We received 03 blinded serum samples biannually for duplicate analysis. Results were compared for relative difference to the CDC’s target value and imprecision with round-by-round descriptive detail statistics. Statistical parameters were used as a basis for performance criteria and were considered acceptable (optimal, desirable, or minimal performance) or unacceptable (less than minimal performance). During the analysis of this survey, we participated in CDC’s round 33 with an overall acceptance of 100% for the assay.
Folate levels were analyzed using a microbiologic assay [27,28]. The gold standard method recommended by the CDC, USA, is due to its accuracy and ability to detect all biologically active forms of folate, making it ideal for population surveys. The assay used 5-methyltetrahydrofolate as a calibrator for precise quantification. The kit provided a natural auxotrophic strain of Lactobacillus rhamnoses resuspended in folate-free medium, ensuring their proliferation depended solely on folate availability in the serum samples. To perform the assay, diluted serum samples were added to 96-well plates containing the inoculated growth medium. The plates were incubated for 42 hours at 37 °C, allowing bacterial growth to correspond to folate concentration in serum samples. Samples were tested in quadruplicate to enhance precision, and folate levels were determined by measuring bacterial growth at OD590 using a microplate reader. Nutrition Research Laboratory (NRL)’s staff received training from CDC Atlanta, with the support of CDC’s Folate Task Team and Nutrition International, for this assay to ensure proper assay optimization at NRL. The method’s reliability was then validated through two rounds of quality control testing, confirming the assay’s accurate reproducibility.
Statistical Analysis
Descriptive analysis was conducted to summarize the study population, presenting the percentage of individuals in each category of the variables along with 95% confidence intervals (CIs). Folate and B12 concentrations were classified based on established cut-offs, and the prevalence of deficiency was reported across different study variables.
To identify factors associated with folate and B12 deficiency, logistic regression analyses were performed. Serum folate and B12 concentrations were categorized into two groups (deficient and non-deficient) to outline the outcome variables. The estimates have been classified as deficiency status (deficient/non-deficient) as per cut-offs established for CDC’s microbiology assay i.e., <7nmoL/L (3ng/mL) for serum folate levels [20,21] and <191pg/mL for B12 levels that aligns with cut-offs commonly used in large-scale population surveys utilizing Electrochemiluminescence Immunoassay (ECLIA) [22,23].
Variables with a p-value ≤ 0.25 in univariate analysis were considered for inclusion in the multivariate model. Collinear variables (correlation constant > 0.8) were excluded through correlation analysis, Eta coefficient, and Cramér’s V. A stepwise forward approach was used to build the final multivariate models, where variables with a p-value <0.10 were considered significant. Key variables, including residence, food insecurity status, and wealth index, were retained in the model regardless of their p-values. Adjusted odds ratios (AORs) and 95% CIs have been reported for the associated factors. All statistical analyses were performed using STATA version 17 software.
Results
Characteristics of the Study Population
Data recorded for sociodemographic, anthropometric, environmental food insecurity, as well as health, indicators of the study population (WRA) are presented in Table 1. 60% of WRA were from rural areas of Pakistan. Provincial distribution was skewed, with a higher number of samples from Sindh and Punjab provinces. Specifically, around 50% of folate samples came from Punjab, and 60% of the B12 samples were from Sindh. Most of the samples were from WRA aged between 20 and 34 years. An almost equal number of samples were collected from each category of household size for both assays, while a slightly higher proportion of B12 samples were from the poorest households as compared to other wealth index categories. Most of the samples were from the population having improved drinking water sources, improved sanitation facilities, and access to secure food, but with insufficient dietary diversity. Similarly, a higher proportion of WRA had normal BMI, ≥3 parity status, and no formal education. Most of the WRA at the time of sampling were non-pregnant (around 94%).
Prevalence of B12 and Folate Deficiency Among Women of Reproductive Age
Table 2 shows the distribution of the WRA population based on serum folate and B12 deficiency. Approximately 45% of the WRA were found to be folate-deficient, regardless of whether they lived in urban or rural areas. Similar levels of folate deficiency were observed for WRA living in households having either <7 or ≥7 family members. All categories of wealth index, food insecurity status, dietary diversity, drinking water source, and sanitation facility also showed folate deficiency in around 45% of the WRA. Approximately a similar proportion of women showed folate deficiency across different categories of education, occupation status, BMI, parity, and pregnancy status. Folate deficiency levels varied across provinces, with about 39.1% of women in Azad Jammu & Kashmir affected, while the highest prevalence was seen in Islamabad Capital Territory at 53.6%. Younger WRA (15 to 19 years old) also had a slightly higher rate, with around 51.3% affected with folate deficiency.
B12 deficiency was observed in a smaller proportion of WRA as compared to folate deficiency, with slightly more rural women affected (21.8%) than urban women (17.8%). The prevalence of B12 deficiency also varied by province, with the highest proportion observed in Gilgit-Baltistan (37.1%) and the lowest in Sindh (17.5%). Household size appeared to play a role, as WRA from smaller families (fewer than seven members) had a higher prevalence of B12 deficiencies (22.5%) compared to those from larger families (17.2%). Differences were also noted across various demographic and health-related factors. Women who were aged 20 to 34 years, had higher education levels, were classified as overweight or obese, had fewer parities, and were pregnant at the time of sample collection were more likely to be B12 deficient. However, all categories of food insecurity, wealth index, drinking water source, dietary diversity, and sanitation facility showed no difference in the proportion of B12-deficient WRA.
Key Determinants of Folate and B12 Deficiency in Women of Reproductive Age
At the univariate level, when looking for the association of individual factors, the odds of being folate-deficient among WRA varied significantly across categories of province, wealth index, drinking water source, sanitation facility, food insecurity status, age, and education level. After adjusting for covariates in the model, the odds of being folate deficient among WRA did not vary significantly according to residence in rural or urban dwellings, food insecurity status, and wealth index, which were, in contrast, expected to be substantially associated according to the literature [29,30,31]. The significant association was observed for provincial distribution that is the odds of being folate deficient the odds of being folate deficient among WRA in Sindh, Baluchistan and Islamabad were observed to be 1.140 (95% CI 1.018, 1.285), 1.237 (95% CI 1.052, 1.453) and 1.524 (95% CI 1.109, 2.092) times as compared in Punjab, while Azad Jammu Kashmir (AJK) showed slight significant trend towards lower odds of being folate deficient that is 0.834 (95% CI 0.682,1.021) times, suggesting 16.6% lower likelihood as compared to Punjab.
The univariate analysis of B12 deficiency among WRA revealed variations across categories of residence, province, household size, wealth index, food insecurity status, age, education, BMI, parity, and pregnancy status. After adjusting for these covariates during multivariable analysis, the wealth index showed an insignificant association but was kept in the model due to its theoretical and contextual relevance [32]. Among WRA of Pakistan, the odds of B12 deficiency were observed to be 1.407 (95% CI 1.125, 1.760) times higher in rural areas than in urban areas. Higher odds of being B12 deficient were observed among those living in Islamabad, Gilgit Baltistan, and newly merged districts of KPK, i.e., 1.673 (95% CI 1.122, 2.497), 2.472 (95% CI 1.197, 5.106), and 1.584 (95% CI 0.977, 2.570) respectively. In comparison, Sindh showed slight significant trend towards lower odds of being B12 deficient that is 0.814 (95% CI 0.654,1.013) times, suggesting 18.6% lower likelihood as compared to Punjab. The B12 deficiency was prevalent in households with <7 members (OR 1.385, 95% CI 1.152, 1.664), obese (OR 1.649, 95% CI 1.282, 2.122) and overweight (1.560, 95% CI 1.262, 1.928) WRA, those having less than three parities (OR 1.247, 95% CI 1.042, 1.492), and among pregnant women (OR 1.903, 95% CI 1.374, 2.635). Being B12-deficient was observed to be protective, i.e., 20.0%, 32.4% and 20.5% less in WRA having mild, moderate, or severe food insecurity as compared to those having no food insecurity. Surprisingly, the odds of being B12 deficient were observed to be 31.6% and 38.7% lower in WRA with lower education levels (primary and secondary) as compared to those having higher education.

Table 3.
Multivariable ORs and 95% CIs of folate and B12 deficiency among women of reproductive age.
Table 3.
Multivariable ORs and 95% CIs of folate and B12 deficiency among women of reproductive age.
| Folate deficiency | B12 deficiency | |||||||
|---|---|---|---|---|---|---|---|---|
| Characteristics | OR (95% CIs) |
P-values | aOR* (95% CIs) |
P-values | OR (95% CIs) |
P-values | aOR* (95% CIs) |
P-values |
| Residence | ||||||||
| Urban | Ref. | Ref. | Ref. | Ref. | ||||
| Rural | 0.967 (0.881,1.062) | 0.485 | 0.967 (0.862,1.085) | 0.569 | 1.293 (1.083,1.544) | 0.005 | 1.407 (1.125,1.760) | 0.003 |
| Province | ||||||||
| Punjab | Ref. | Ref. | Ref. | Ref. | ||||
| Sindh | 1.152 (1.037,1.280) | 0.009 | 1.144 (1.018,1.285) | 0.024 | 0.717 (0.590,0.872) | 0.001 | 0.814 (0.654,1.013) | 0.065 |
| KP | 1.007 (0.881,1.150) | 0.921 | 1.003 (0.875,1.149) | 0.970 | 0.971 (0.651,1.449) | 0.887 | 0.953 (0.632,1.437) | 0.818 |
| Baluchistan | 1.241 (1.069,1.440) | 0.005 | 1.237 (1.052,1.453) | 0.010 | 1.575 (0.988,2.510) | 0.056 | 1.380 (0.857,2.222) | 0.184 |
| ICT | 1.505 (1.099,2.062) | 0.011 | 1.524 (1.109,2.092) | 0.009 | 1.643 (1.130,2.389) | 0.009 | 1.673 (1.122,2.497) | 0.012 |
| KP-NMD | 1.009 (0.738,1.378) | 0.957 | 1.005 (0.732,1.379) | 0.975 | 1.849 (1.176,2.907) | 0.008 | 1.584 (0.977,2.570) | 0.062 |
| AJK | 0.837 (0.686,1.022) | 0.081 | 0.834 (0.682,1.021) | 0.079 | 1.216 (0.743,1.989) | 0.436 | 1.296 (0.770,2.182) | 0.329 |
| GB | 0.897 (0.730,1.103) | 0.304 | 0.885 (0.715,1.095) | 0.261 | 1.990 (0.998,3.966) | 0.051 | 2.472 (1.197,5.106) | 0.015 |
| HH size | ||||||||
| <7 | 0.972 (0.889,1.064) | 0.540 | 1.399 (1.175,1.665) | <0.001 | 1.385 (1.152,1.664) | 0.001 | ||
| 7 or more members | Ref. | Ref. | Ref. | |||||
| Wealth Index | ||||||||
| Poorest | Ref. | Ref. | Ref. | Ref. | ||||
| Second | 0.984 (0.861,1.125) | 0.813 | 1.027 (0.892,1.183) | 0.708 | 1.200 (0.935,1.539) | 0.152 | 1.064 (0.817,1.386) | 0.646 |
| Middle | 0.977 (0.852,1.120) | 0.739 | 1.022 (0.875,1.195) | 0.781 | 1.317 (1.023,1.695) | 0.032 | 1.189 (0.894,1.580) | 0.234 |
| Fourth | 0.994 (0.866,1.141) | 0.929 | 1.031 (0.871,1.221) | 0.719 | 0.978 (0.754,1.270) | 0.870 | 0.901 (0.650,1.248) | 0.530 |
| Richest | 0.902 (0.782,1.040) | 0.156 | 0.924 (0.770,1.110) | 0.399 | 1.266 (0.976,1.641) | 0.075 | 1.155 (0.794,1.680) | 0.451 |
| Drinking water source | ||||||||
| Improved sources | 0.879 (0.726,1.065) | 0.189 | 1.107 (0.792,1.546) | 0.553 | ||||
| Unimproved sources | Ref. | Ref. | ||||||
| Sanitation | ||||||||
| Improved sanitation facility | 0.916 (0.816,1.027) | 0.132 | 1.065 (0.874,1.298) | 0.534 | ||||
| Unimproved sanitation facility | Ref. | Ref. | ||||||
| Food Insecurity Status | ||||||||
| Food Secure | Ref. | Ref. | Ref. | Ref. | ||||
| Mild food insecure | 1.091 (0.949,1.254) | 0.223 | 1.072 (0.931,1.234) | 0.333 | 0.809 (0.630,1.040) | 0.098 | 0.760 (0.584,0.991) | 0.043 |
| Moderate food insecure | 1.128 (0.949,1.342) | 0.172 | 1.104 (0.924,1.318) | 0.276 | 0.667 (0.489,0.909) | 0.010 | 0.676 (0.492,0.930) | 0.016 |
| Severe food insecure | 1.040 (0.924,1.171) | 0.512 | 1.007 (0.885,1.146) | 0.913 | 0.758 (0.608,0.943) | 0.013 | 0.795 (0.627,1.007) | 0.057 |
| Age | ||||||||
| 15-19 years | 1.267 (0.984,1.632) | 0.066 | 0.818 (0.473,1.414) | 0.471 | ||||
| 20-34 years | 0.951 (0.865,1.046) | 0.300 | 1.142 (0.951,1.372) | 0.156 | ||||
| 35-49 years | Ref. | Ref. | ||||||
| Education | ||||||||
| None | 1.123 (0.967,1.304) | 0.129 | 0.757 (0.576,0.995) |
0.046 | 0.919 (0.662,1.275) | 0.613 | ||
| Primary | 0.998 (0.822,1.212) | 0.983 | 0.645 (0.449,0.925) | 0.017 | 0.684 (0.461,1.014) | 0.058 | ||
| Middle | 1.086 (0.888,1.330) | 0.421 | 0.664 (0.444,0.994) | 0.047 | 0.677 (0.444,1.031) | 0.069 | ||
| Secondary | 1.062 (0.876,1.287) | 0.541 | 0.616 (0.424,0.895) | 0.011 | 0.613 (0.421,0.892) | 0.011 | ||
| Higher | Ref. | Ref. | Ref. | |||||
| Occupation | ||||||||
| Employed | 0.966 (0.779,1.199) | 0.757 | 0.985 (0.678,1.430) | 0.936 | ||||
| Unemployed | Ref. | Ref. | ||||||
| Marital Status | ||||||||
| Currently Married | 1.021 (0.835,1.250) | 0.836 | 0.956 (0.642,1.425) | 0.826 | ||||
| Ever Married | 1.019 (0.681,1.527) | 0.926 | 0.712 (0.307,1.652) | 0.429 | ||||
| Un-Married | Ref. | Ref. | ||||||
| BMI of women | ||||||||
| Underweight (<18.5) | 0.988 (0.854,1.142) | 0.868 | 0.688 (0.521,0.909) | 0.008 | 0.711 (0.534,0.946) | 0.019 | ||
| Normal (18.5-24.9) | Ref. | Ref. | Ref. | |||||
| Overweight (25.0-29.9) | 1.001 (0.897,1.117) | 0.986 | 1.456 (1.184,1.790) | <0.001 | 1.560 (1.262,1.928) | <0.001 | ||
| Obese (>=30) | 0.986 (0.866,1.124) | 0.837 | 1.530 (1.207,1.940) | <0.001 | 1.649 (1.282,2.122) | <0.001 | ||
| Parity | ||||||||
| <3 | 0.997 (0.911,1.091) | 0.946 | 1.263 (1.067,1.496) | 0.007 | 1.247 (1.042,1.492) | 0.016 | ||
| >=3 | Ref. | Ref. | Ref. | |||||
| Pregnancy status | ||||||||
| Pregnant | 0.967 (0.799,1.171) | 0.732 | 1.976 (1.436,2.720) | <0.001 | 1.903 (1.374,2.635) | <0.001 | ||
| Non-Pregnant | Ref. | Ref. | ||||||
| Minimum dietary diversity | ||||||||
| <5 food groups | Ref. | Ref. | ||||||
| >=5 food groups | 0.944 (0.844,1.057) | 0.320 | 1.027 (0.823,1.283) | 0.811 | ||||
Discussion
Folate and B12 analysis has been performed on a randomly selected subset of blood samples collected from WRAs enrolled in the National Nutrition Survey (NNS) Pakistan 2018. This analysis reflects nationally representative estimates of serum B12 and folate deficiencies in Pakistani’s WRA population. The prevalence of folate deficiency (44.7%) was found to be higher than that of B12 deficiency (20.2%), the same as the pattern observed in NNS-2011 [18]. However, the prevalence of B12 deficiency was lower in NNS-2018 compared to NNS-2011 [24]. National-level nutrition intervention programs, like the Fortification Initiative Program (2016-2018), targeting wheat and edible oil fortification [33,34]. It could have been responsible for the declining trend in B12 deficiency among WRA. However, these interventions included both folate and B12 fortification, but as studies suggest that folate is less heat-stable than B12 and can degrade during high-temperature cooking, this may contribute to the disparity between trends of folate and B12 deficiency in the population [35,36].
These estimates have been further evaluated for association with important geographical, demographic, socioeconomic, and health-related determinants. Substantial variations in the prevalence of both micronutrients were observed at the provincial level. Yet, no disparity was evident between rural and urban populations, except for B12, showing significantly higher odds of deficiency among rural populations (OR 1.293; 95% CI 1.083-1.544). Research from geographically similar regions of South-East Asia suggests that folate deficiency continues to be a public health problem, affecting both rural and urban populations, with a slightly higher prevalence in rural population like studies conducted among adolescent girls and WRA in Iran, a developing country, and in Turkey, a relatively more developed Asian country, reporting rural folate deficiency rates of 30.4% and 20.1%, respectively, compared to 32.7% and 14.7% in urban areas. While the pattern in Iran shows a marginally higher urban prevalence, the overall trend across countries leans toward a greater burden in rural populations [37,38].
Socio-economic determinants showed that the wealth index was a predictor of both folate and B12 deficiency during preliminary analysis, with richer women having 9.8% lower risk of folate deficiency (OR 0.902, 95% CI 0.782, 1.040) but higher risk of B12 deficiency (OR 1.266, 95% CI 0.976,1.641) than the poorest. The education level of WRA surprisingly showed 39.7% lower risk of B12 deficiency in the less educated category, i.e., (OR 0.613, 95% CI 0.421,0.892) for secondary education as compared to those with higher education. Our findings for socioeconomic factors are in accordance with the model suggested by the HELENA study, a cross-sectional, multicenter study on nutrition and lifestyle among adolescents from 10 European cities in 09 countries. The study investigated socioeconomic determinants as predictors of folate and B12 intake, as well as serum levels, supporting the idea that socioeconomic status, particularly maternal education and occupation, has an essential influence on diet, which in turn affects blood vitamin and nutrient levels. However, genetic factors [39], physiological status, and their interactions with other nutrients can influence these levels as well [40]. Similar observations for wealth index, a key factor of socioeconomic status (SES), have been observed to be positively associated with both micronutrients in Guatemala among WRA conducted in 2009-2010 [41]. An analysis conducted on findings from the Canadian Community Health Survey (CCHS 2.2) indicates higher prevalences of nutrient inadequacy (including folate and B12) among adolescents and adults in food-insecure households [42].
Among growth-related factors, we observed higher odds of B12 deficiency in overweight (OR 1.560, 95% CI 1.262, 1.928) and obese WRA (OR 1.649, 95% CI 1.282, 2.122). These findings align with existing literature, further supporting the association between excess body weight and an increased risk of vitamin B12 deficiency. [43,44]. This association might be attributed to underlying physiological mechanisms, such as obesity predisposing to alterations in metabolic pathways leading to malabsorption, increased catabolism, and sequestration in adipose tissue. [45]. However, the basic cause of obesity is an inadequate or unbalanced diet, which tends to be associated with the intake of foods with high energy but lower diversity and intake of B12-rich foods such as lean meats, fish, dairy products, and eggs [46]. In contrast, obese women are generally perceived as healthier in settings with low awareness. A 2018 review article on the present and future attitudes towards obesity in Pakistan documented that nearly 52% of overweight and 73% of obese people do not perceive their condition as abnormal. [47] This may predispose them not to sense the requirement for micronutrient supplementation, resulting in low B12 status. Moreover, in low-resource settings like Pakistan, where a smaller percentage of household spending is on milk, meat, and fruits [48]. The risk of B12 deficiency in obese women can be even greater.
Age, an important demographic factor, was assessed qualitatively by categorizing the study population into specific age groups. Age was found to be a significant determinant for both folate and B12 deficiencies but unexpectedly only during the preliminary analysis. Younger groups of WRA, i.e., 15-19 years old, showed higher odds of folate deficiency (OR 1.267, 95% CI 0.984,1.632), and 20-34 years old showed higher odds of B12 deficiency (OR 1.142, 95% CI 0.951,1.372) as compared to the older age group (35-49 years). Female adolescents and those in their twenties exhibit higher metabolic activity and increased nutritional demands due to ongoing physiological growth, menstruation, and possible pregnancies [49]. Thus, these increased requirements for essential micronutrients, such as folate and B12, place younger WRA at a higher risk of deficiency. This was also evident in the last survey of Pakistan, where younger WRA had 1.15 times the odds of being folate-deficient and 1.07 times the odds of being B12-deficient compared with older WRA. Similarly, the association was insignificant when adjusted for other factors [50]. The higher fertility rates associated with younger WRA entail additional pregnancies and breastfeeding, consequently depleting maternal folate and B12 stores, as observed in our study, where pregnant women showed higher odds of being B12 deficient (OR 1.903, 95% CI 1.374,2.635) [51,52]. These disparities may be attributed to the increasing use of oral contraceptive pills (OCPs) in the population, which have been associated with lowering serum folate and B12 levels [53,54]. The increasing accessibility to affordable and diverse contraceptive options in the region is evident in the success rates of widespread free family planning campaigns [55,56,57]. All these factors explain the higher likelihood of folate and B12 deficiencies among younger WRA compared to their older counterparts.
Conclusions
This study found that nearly half of Pakistani WRA had folate deficiency, while 1 in 5 had vitamin B12 deficiency. Regional, nutritional, and physiological factors, particularly obesity, rural residence, high fertility, and pregnancy, were key determinants. Despite national fortification programs, disparities in the population persist, indicating gaps in policy implementation. Targeted interventions promoting dietary diversification, fortified foods, and age- and pregnancy-specific supplementation are essential. Other areas that remain salient for research are dietary patterns and bioavailable sources of folate and B12, especially in relation to food fortification and dietary diversification strategies.
Authors’ Contributions
Z.A.B. conceptualized the study and assisted with interpreting the results. S.S. and J.I. provided senior supervision and drafted the overall manuscript. K.B. and R.Z. wrote the manuscript. I.A. oversaw data cleaning and data management, while S.M. performed the statistical analysis. A.Y., K.B., and R.Z. conducted the laboratory analysis. J.I., S.N., S.S., and Z.A.B. critically reviewed the final manuscript. All authors reviewed and approved the manuscript for submission.
Funding
The NNS-2018 survey was supported by funding from a UKAID grant provided by UNICEF Pakistan [grant number 43234896]. Secondary analysis for this study was supported by the Center of Excellence in Women & Child Health at The Aga Khan University, which also provided institutional and operational support for the study.
Ethical Approval
The NNS 2018 survey was approved by the National Bioethics Committee of the Government of Pakistan and the Ethics Review Committee of Aga Khan University.
Review Committee
No further approval was deemed necessary for the anonymized secondary analysis.
Ethical Integrity
Informed consent was obtained from all study participants before data and blood sample collection during NNS 2018 survey for both primary and secondary analyses.
Data availability
The data will be available on request to the corresponding author.
Acknowledgments
We acknowledge Dr. Christine Pfeiffer, Ms. Mindy Zhang, and Ms. Shameem Jabbar from the Nutritional Biomarkers Branch in the Division of Laboratory Sciences, Center for Disease Control and Prevention (CDC) and Ms. Madhulika Chaudhary, General Health Scientist, CDC for their technical support and training of our laboratory personnel on the CDC Folate Microbiologic Assay Kit, as well as their guidance in assay optimization. We also sincerely thank Dr. Homero Martinez, Senior Technical Advisor at Nutrition International, for sponsoring the training visit. This work was conducted as part of a broader collaborative initiative between CDC, the CDC Foundation, the Nutrition International Folate Task Team, and the Bill and Melinda Gates Foundation aimed at developing regional laboratory capacity for the measurement of blood folate levels.
Conflicts of Interest
The authors declare no conflict of interest with this work.
References
- Habib, M.A.; et al. Factors associated with low birthweight in term pregnancies: a matched case-control study from rural Pakistan. East Mediterr Health J, 2018. 23(11): p. 754-763.
- Prochaska, M.T.; et al. Association Between Anemia and Fatigue in Hospitalized Patients: Does the Measure of Anemia Matter? Journal of Hospital Medicine, 2017. 12(11): p. 898-904.
- Sawant Dessai, A., J. Chakrabarty, and B. Sulochana, The relationship between fatigue, quality of life, and performance status among cancer patients with anemia. Clinical Epidemiology and Global Health, 2025. 31: p. 101899.
- Gan, T.; et al. Causal Association Between Anemia and Cardiovascular Disease: A 2‐Sample Bidirectional Mendelian Randomization Study. Journal of the American Heart Association, 2023. 12(12): p. e029689.
- Shi, H.; et al. Severity of Anemia During Pregnancy and Adverse Maternal and Fetal Outcomes. JAMA Network Open, 2022. 5(2): p. e2147046-e2147046.
- Defrère, S.; et al. Potential involvement of iron in the pathogenesis of peritoneal endometriosis. Molecular human reproduction, 2008. 14(7): p. 377-385.
- Kapper, C.; et al. Minerals and the Menstrual Cycle: Impacts on Ovulation and Endometrial Health. Nutrients, 2024. 16(7): p. 1008.
- Tonai, S.; et al. Iron deficiency induces female infertile in order to failure of follicular development in mice. Journal of Reproduction and Development, 2020. 66(5): p. 475-483.
- Whitaker, M. Calcium at fertilization and in early development. Physiological reviews, 2006. 86(1): p. 25-88.
- Yılmaz, B.K.; et al. Serum concentrations of heavy metals in women with endometrial polyps. Journal of Obstetrics and Gynaecology, 2020. 40(4): p. 541-545.
- Stevens, G.A.; et al. National, regional, and global estimates of anaemia by severity in women and children for 2000-19: a pooled analysis of population-representative data. Lancet Glob Health, 2022. 10(5): p. e627-e639.
- Işık Balcı, Y.; et al. Prevalence and Risk Factors of Anemia among Adolescents in Denizli, Turkey. Iran J Pediatr, 2012. 22(1): p. 77-81.
- WHO, The Global Health Observatory. 2019.
- Black, R.E.; et al. Maternal and child undernutrition and overweight in low-income and middle-income countries. Lancet, 2013. 382(9890): p. 427-451.
- Brittenham, G.M.; et al. Biology of Anemia: A Public Health Perspective. The Journal of Nutrition, 2023. 153: p. S7-S28.
- de Benoist, B. Conclusions of a WHO Technical Consultation on Folate and Vitamin B12 Deficiencies. Food and Nutrition Bulletin, 2008. 29(2_suppl1): p. S238-S244.
- Finkelstein, J.L. A.J. Layden, and P.J. Stover, Vitamin B-12 and Perinatal Health. Adv Nutr, 2015. 6(5): p. 552-63.
- Abdollahi, Z.; et al. Folate, vitamin B12 and homocysteine status in women of childbearing age: baseline data of folic acid wheat flour fortification in Iran. Annals of Nutrition and Metabolism, 2008. 53(2): p. 143-150.
- Haidar, J. Prevalence of anaemia, deficiencies of iron and folic acid and their determinants in Ethiopian women. J Health Popul Nutr, 2010. 28(4): p. 359-68.
- Viteri, F.E. and H. Gonzalez, Adverse outcomes of poor micronutrient status in childhood and adolescence. Nutr Rev, 2002. 60(5 Pt 2): p. S77-83.
- Bhattacharya., A.H.P.T. Megaloblastic Anemia. NIH, 2023.
- WHO, Evaluating the public health significance of micronutrient malnutrition.
- Soofi, S.; et al. Prevalence and possible factors associated with anaemia, and vitamin B ((12)) and folate deficiencies in women of reproductive age in Pakistan: analysis of national-level secondary survey data. BMJ Open, 2017. 7(12): p. e018007.
- Mazhar Alam, J.D. Hira Hur, Meg Walker, Albertha Nyaku, Allison Gottwalt, A Qualitative Assessment of Supply and Demand of Maternal Iron-Folic Acid Supplementation and Infant and Young Child Feeding Counseling in Jamshoro and Thatta Districts, Pakistan. USAID, 2018.
- WHO, WHO guidelines on drawing blood: best practices in phlebotomy. 2010.
- CDC, U. Laboratory Quality Assurance Programs. 2024.
- Pfeiffer, C.M.; et al. Estimation of trends in serum and RBC folate in the U.S. population from pre- to postfortification using assay-adjusted data from the NHANES 1988-2010. J Nutr, 2012. 142(5): p. 886-93.
- CDC, C.f.D.C.a.P. FOLATE MICROBIOLOGIC ASSAY. 2018.
- Sanjay, R.; et al. Household Food Insecurity Is Associated with RBC Folate Deficiency and Iron-Deficiency Anaemia Among Non-Pregnant Nepalese Women Aged 15-49 Years. Journal of Health and Environmental Research, 2023. 9(2): p. 59-66.
- Ndiaye, N.F.; et al. Folate Deficiency and Anemia Among Women of Reproductive Age (15-49 Years) in Senegal: Results of a National Cross-Sectional Survey. Food and Nutrition Bulletin, 2018. 39(1): p. 65-74.
- Saxena, V., M. Naithani, and R. Singh, Epidemiological determinants of Folate deficiency among pregnant women of district Dehradun. Clinical Epidemiology and Global Health, 2017. 5(1): p. 21-27.
- DHSPROGRAM, WEALTH INDEX. 2016.
- story, W.n. New Food Fortification Programme to help tackle malnutrition in Pakistan. 2016.
- Ibne Youaaf, A. Food Fortifications and Programs Running in Pakistan. 2022.
- McKillop, D.J.; et al. The effect of different cooking methods on folate retention in various foods that are amongst the major contributors to folate intake in the UK diet. Br J Nutr, 2002. 88(6): p. 681-8.
- Bajaj, S.R. and R.S. Singhal, Fortification of wheat flour and oil with vitamins B12 and D3: Effect of processing and storage. Journal of Food Composition and Analysis, 2021. 96: p. 103703.
- Sedehi, M., N. Behnampour, and M.J. Golalipour, Deficiencies of the microelements, folate and vitamin B12 in women of the child bearing ages in gorgan, northern iran. J Clin Diagn Res, 2013. 7(6): p. 1102-4.
- Öner, N.; et al. The prevalence of folic acid deficiency among adolescent girls living in Edirne, Turkey. Journal of Adolescent Health, 2006. 38(5): p. 599-606.
- Bueno, O.; et al. Common Polymorphisms That Affect Folate Transport or Metabolism Modify the Effect of the MTHFR 677C > T Polymorphism on Folate Status123. The Journal of Nutrition, 2016. 146(1): p. 1-8.
- Iglesia, I.; et al. Socioeconomic factors are associated with folate and vitamin B12 intakes and related biomarkers concentrations in European adolescents: the Healthy Lifestyle in Europe by Nutrition in Adolescence study. Nutrition Research, 2014. 34(3): p. 199-209.
- Rosenthal, J.; et al. Folate and Vitamin B12 Deficiency Among Non-pregnant Women of Childbearing-Age in Guatemala 2009-2010: Prevalence and Identification of Vulnerable Populations. Matern Child Health J, 2015. 19(10): p. 2272-85.
- Kirkpatrick, S.I. and V. Tarasuk, Food Insecurity Is Associated with Nutrient Inadequacies among Canadian Adults and Adolescents123. The Journal of Nutrition, 2008. 138(3): p. 604-612.
- Baltaci, D.; et al. Association of vitamin B12 with obesity, overweight, insulin resistance and metabolic syndrome, and body fat composition; primary care-based study. Med Glas (Zenica), 2013. 10(2): p. 203-10.
- Sun, Y.; et al. Inverse Association Between Serum Vitamin B12 Concentration and Obesity Among Adults in the United States. Front Endocrinol (Lausanne), 2019. 10: p. 414.
- Krishnaveni, G.; et al. Low plasma vitamin B 12 in pregnancy is associated with gestational ‘diabesity’and later diabetes. Diabetologia, 2009. 52: p. 2350-2358.
- Troesch, B.; et al. Increased Intake of Foods with High Nutrient Density Can Help to Break the Intergenerational Cycle of Malnutrition and Obesity. Nutrients, 2015. 7(7): p. 6016-37.
- Siddiqui, M.; et al. Obesity in Pakistan; current and future perceptions. J Curr Trends Biomed Eng Biosci, 2018. 17(2): p. 555958.
- Shabnam, N., N. Aurangzeb, and S. Riaz, Rising food prices and poverty in Pakistan. PLOS ONE, 2023. 18(11): p. e0292071.
- University, O.s. Adolescents. 2012.
- Soofi, S.; et al. Prevalence and possible factors associated with anaemia, and vitamin B 12 and folate deficiencies in women of reproductive age in Pakistan: analysis of national-level secondary survey data. BMJ open, 2017. 7(12): p. e018007.
- Hampstead, V.p.o. Breastfeeding and Vitamin Deficiency. 2017.
- Bae, S.; et al. Vitamin B-12 Status Differs among Pregnant, Lactating, and Control Women with Equivalent Nutrient Intakes. J Nutr, 2015. 145(7): p. 1507-14.
- Shere, M.; et al. Association Between Use of Oral Contraceptives and Folate Status: A Systematic Review and Meta-Analysis. Journal of Obstetrics and Gynaecology Canada, 2015. 37(5): p. 430-438.
- Berenson, A.B. and M. Rahman, Effect of hormonal contraceptives on vitamin B12 level and the association of the latter with bone mineral density. Contraception, 2012. 86(5): p. 481-7.
- Abdullahi, H. and N. Usman, Evaluation of serum Vitamin B12 levels in hormonal contraceptive users in some hospitals in Kano Metropolis. Bayero Journal of Medical Laboratory Science, 2020. 5(2): p. 69-73.
- Sultana, N. Factors influencing contraception choice and use among women of reproductive age in the LMICs of the South Asia region: a scoping review. 2023.
- Pakistan, U. Successes of the SMK Project; Health Families for Pakistan.
Figure 1.
a: Regional Distribution of Sampled Population for Serum Folate Analysis. b: Regional Distribution of Sampled Population for Serum B12 Analysis. Map showing the sample size distribution by provinces and regions of Pakistan for the subset sampling used in (a) folate and (b) vitamin B12 analysis. This secondary analysis utilized samples collected from women of reproductive age in the National Nutrition Survey of Pakistan 2018. The map highlights the number of samples from each region included in this analysis.
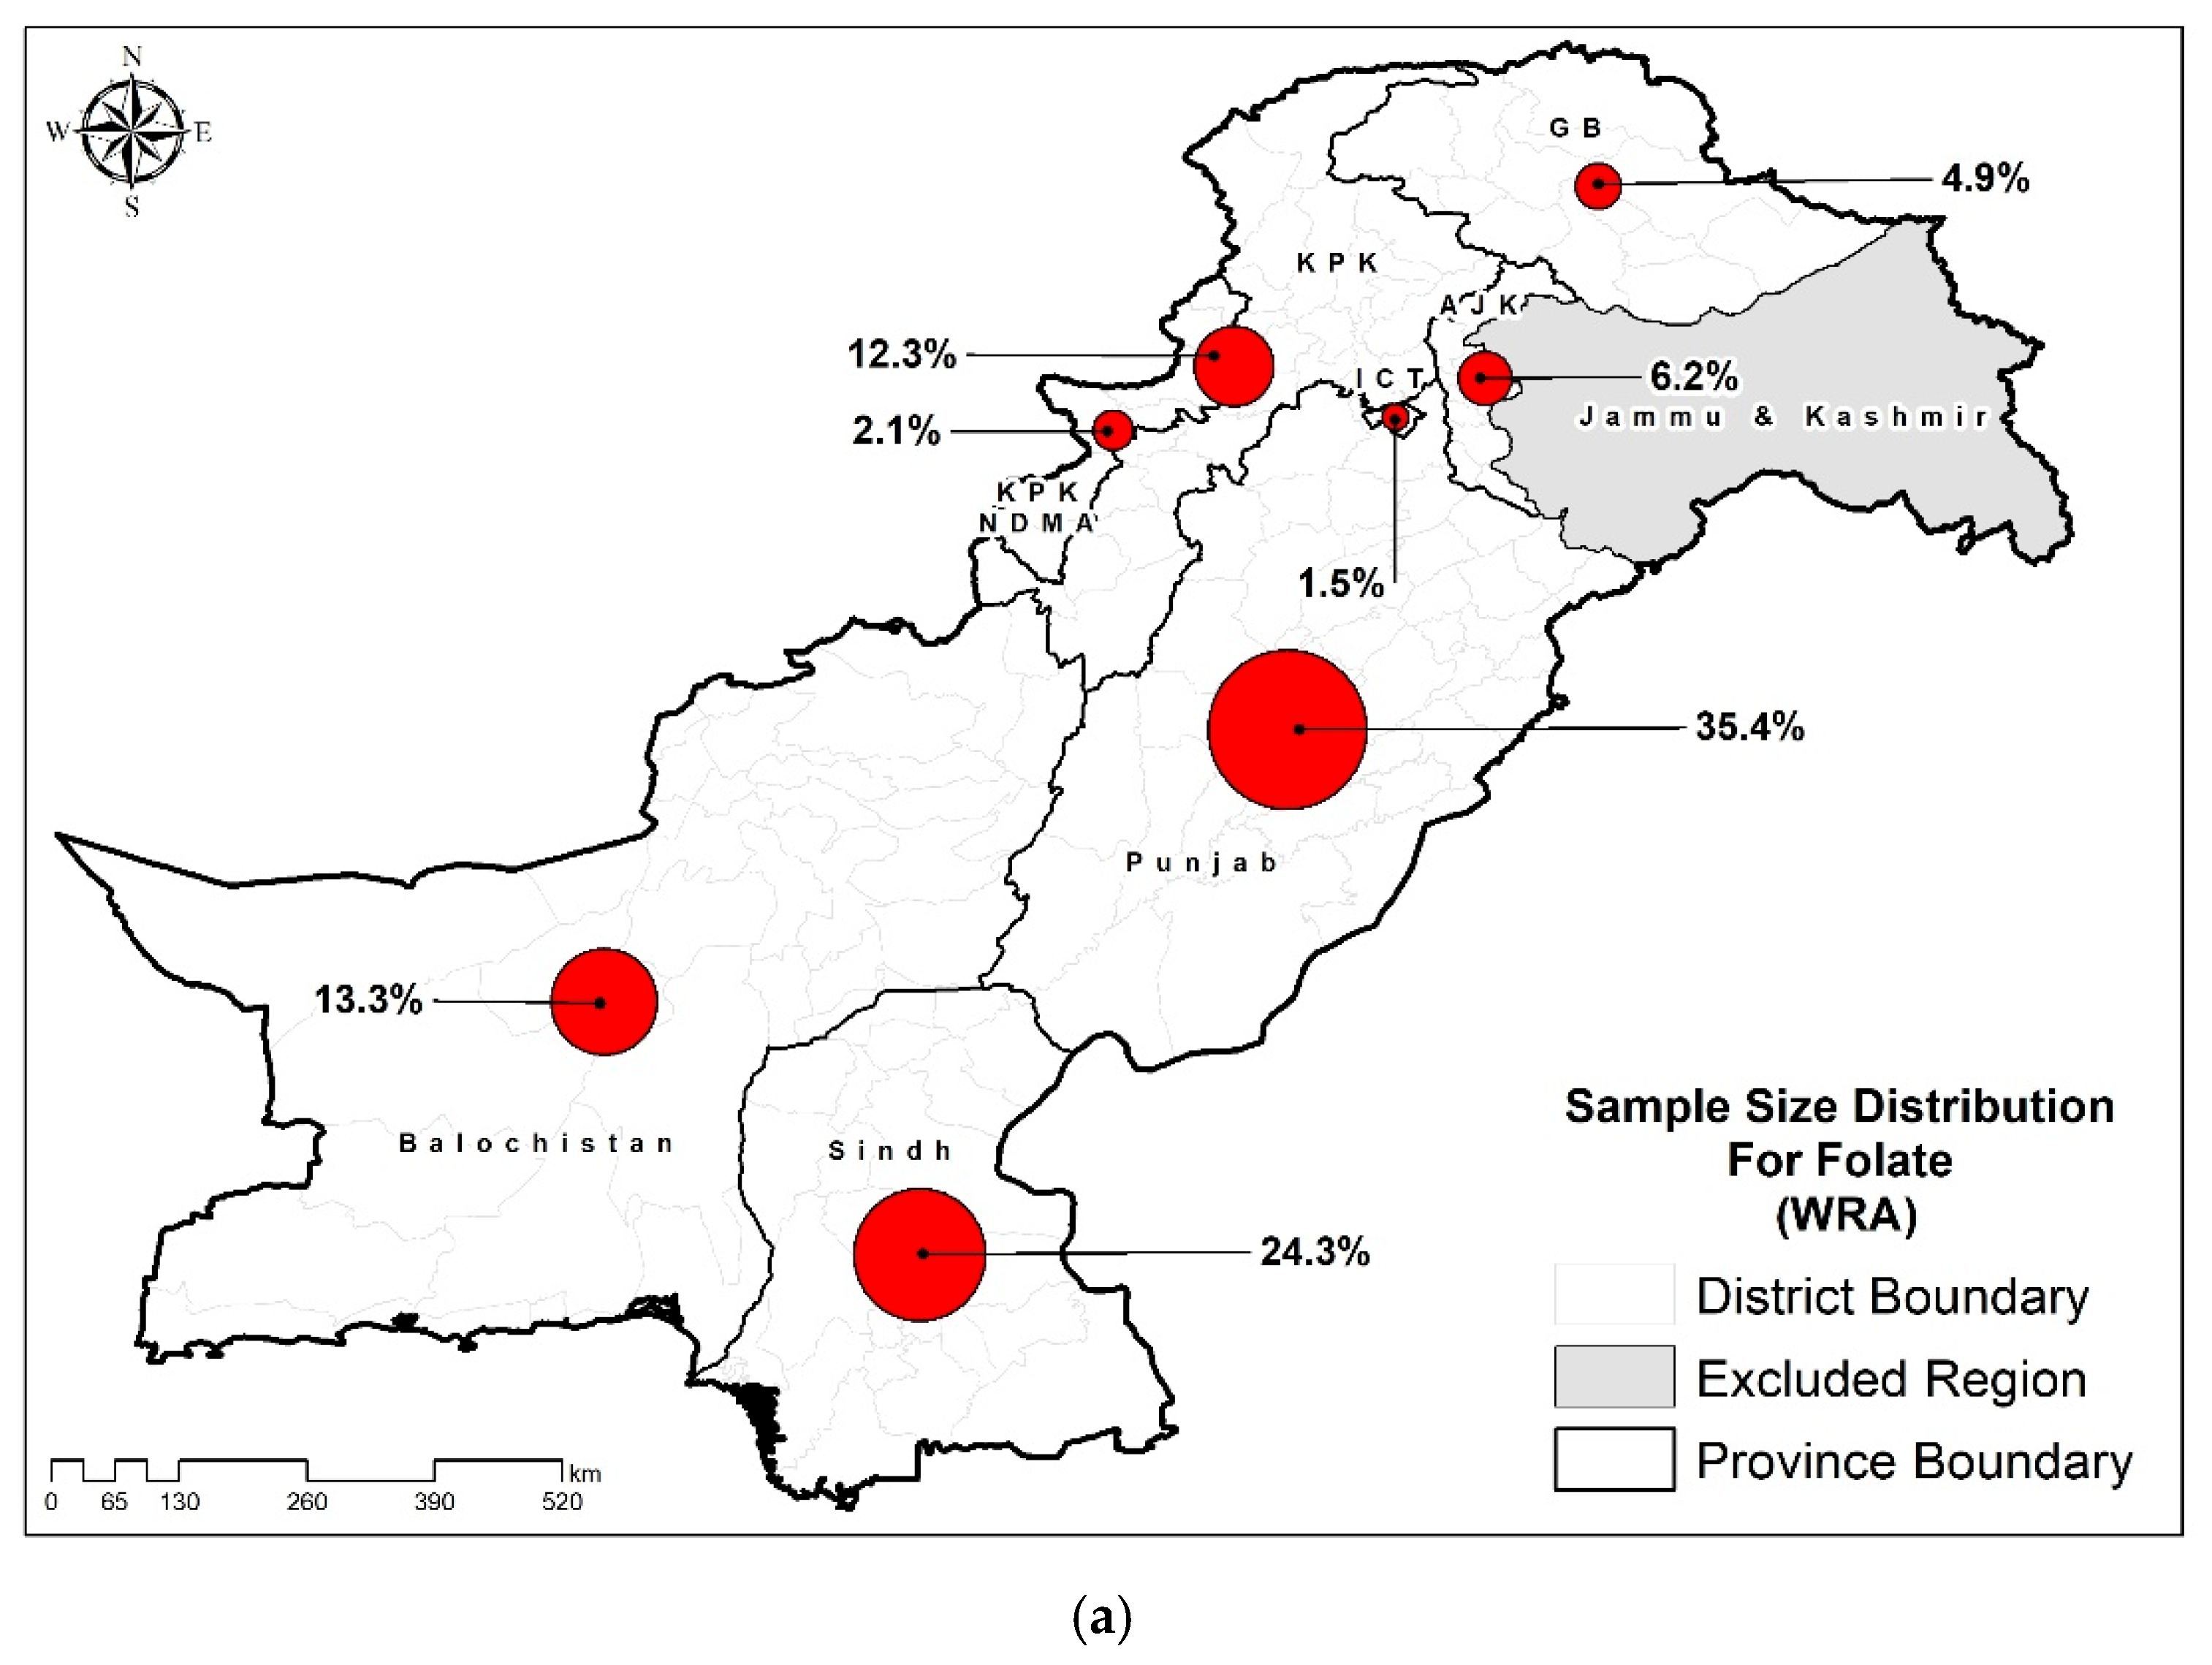
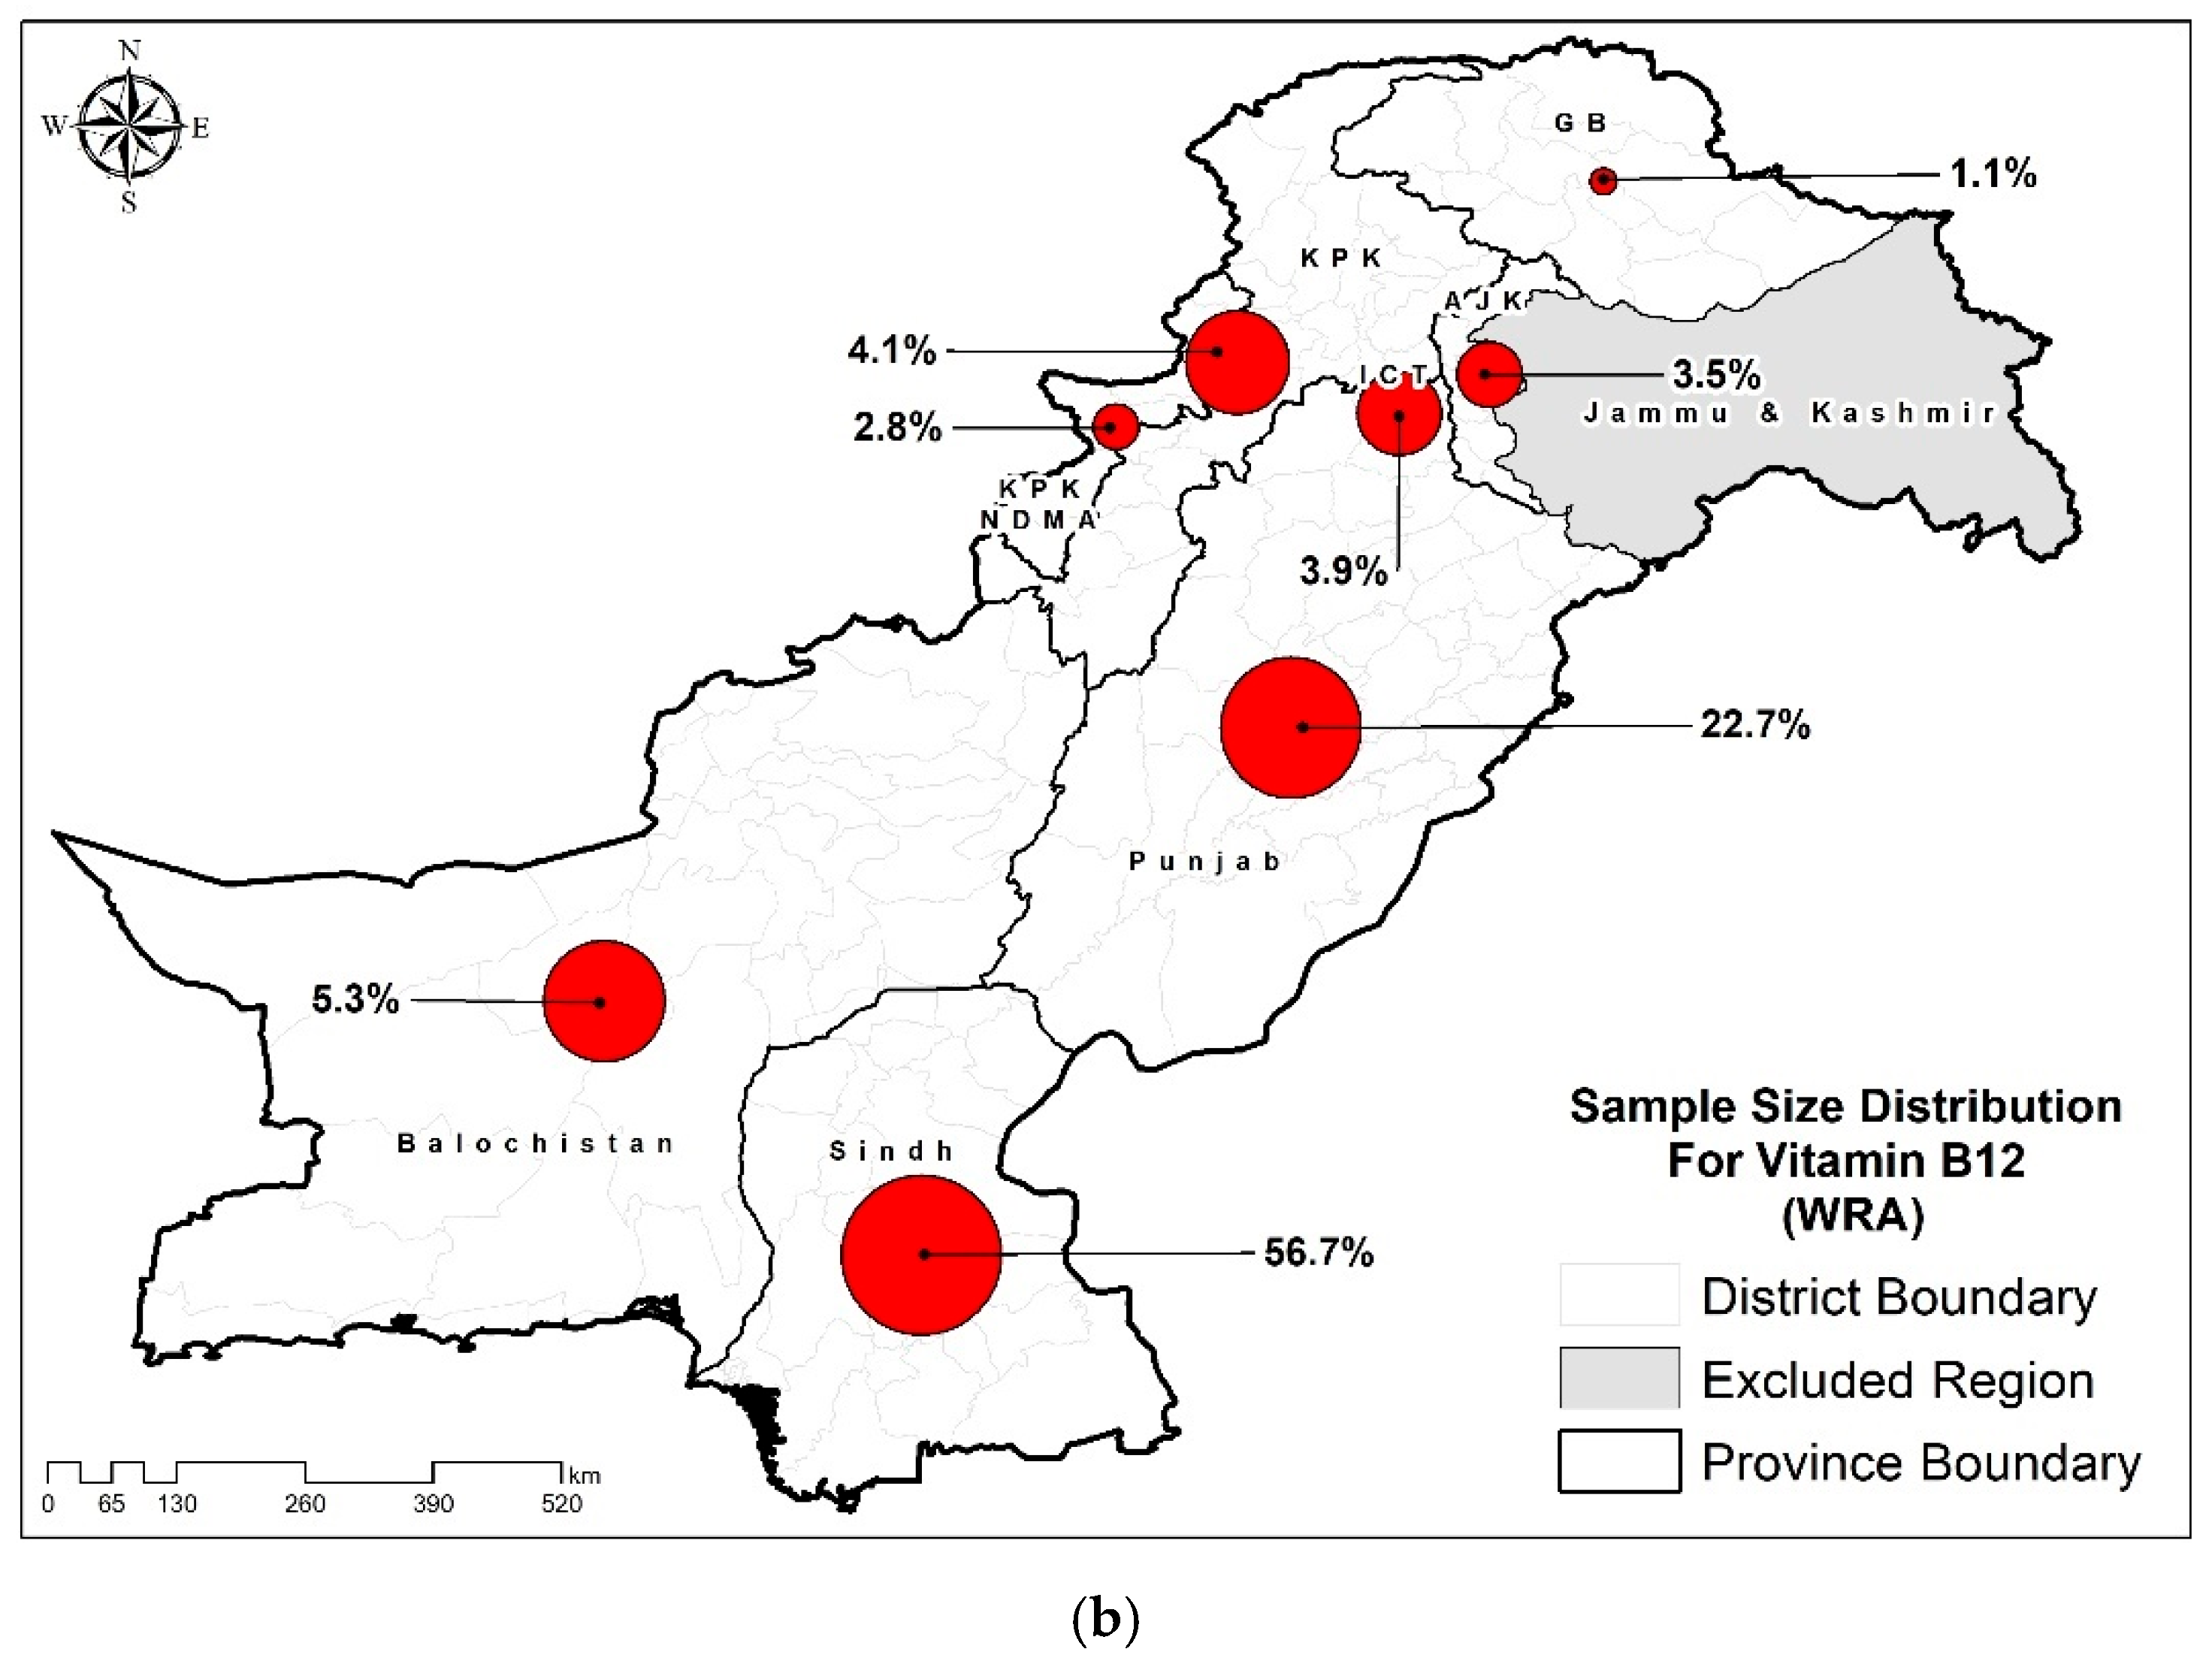
Table 1.
Characteristics of the study population among women of reproductive age.
| Characteristics | Folate (n=12662) % (95% CIs) |
Vitamin B12 (n=4442) % (95 CIs) |
|---|---|---|
| Residence | ||
| Urban | 40.0 (38.9-41.2) | 40.0 (38.3-41.7) |
| Rural | 60.0 (58.8-61.1) | 60.0 (58.3-61.7) |
| Province | ||
| Punjab | 49.7 (48.6-50.8) | 29.9 (28.3-31.6) |
| Sindh | 32.8 (31.7-33.9) | 60.4 (58.7-62.1) |
| KP | 9.5 (9.0-10.0) | 3.3 (2.8-3.9) |
| Baluchistan | 4.1 (3.8-4.3) | 1.8 (1.4-2.2) |
| ICT | 1.2 (1.0-1.4) | 2.5 (2.1-2.9) |
| KP-NMD | 1.0 (0.9-1.1) | 1.4 (1.1-1.7) |
| AJK | 1.4 (1.3-1.5) | 0.6 (0.5-0.8) |
| GB | 0.4 (0.3-0.4) | 0.1 (0.1-0.1) |
| HH size | ||
| <7 | 56.9 (55.8-58.0) | 57.3 (55.6-58.9) |
| 7 or more members | 43.1 (42.0-44.2) | 42.7 (41.1-44.4) |
| Wealth Index | ||
| Poorest | 19.7 (18.9-20.5) | 27.3 (25.8-28.8) |
| Second | 19.1 (18.2-19.9) | 18.9 (17.6-20.2) |
| Middle | 20.3 (19.4-21.2) | 18.8 (17.5-20.2) |
| Fourth | 21.6 (20.7-22.6) | 18.7 (17.4-20.1) |
| Richest | 19.4 (18.5-20.3) | 16.3 (15.0-17.6) |
| Drinking water source | ||
| Improved sources | 92.2 (91.5-92.9) | 91.3 (90.2-92.2) |
| Unimproved sources | 7.8 (7.1-8.5) | 8.7 (7.8-9.8) |
| Sanitation | ||
| Improved sanitation facility | 83.5 (82.8-84.3) | 76.7 (75.3-78.1) |
| Unimproved sanitation facility | 16.5 (15.7-17.2) | 23.3 (21.9-24.7) |
| Food Insecurity Status | ||
| Food Secure | 59.8 (58.7-60.9) | 54.0 (52.4-55.7) |
| Milld food insecure | 12.5 (11.7-13.2) | 14.6 (13.5-15.9) |
| Moderate food insecure | 8.4 (7.8-9.0) | 10.0 (9.1-11.1) |
| Severe food insecure | 19.4 (18.5-20.3) | 21.3 (20.0-22.7) |
| Age | ||
| 15-19 years | 3.4 (3.0-3.8) | 3.4 (2.9-4.1) |
| 20-34 years | 63.2 (62.1-64.2) | 62.9 (61.3-64.6) |
| 35-49 years | 33.5 (32.4-34.5) | 33.7 (32.1-35.3) |
| Education | ||
| None | 55.7 (54.5-56.8) | 63.2 (61.6-64.9) |
| Primary | 11.5 (10.8-12.3) | 10.4 (9.4-11.4) |
| Middle | 9.0 (8.4-9.6) | 6.9 (6.1-7.8) |
| Secondary | 12.8 (12.1-13.7) | 10.5 (9.4-11.6) |
| Higher | 11.0 (10.3-11.7) | 9.0 (8.1-10.0) |
| Occupation | ||
| Employed | 4.6 (4.2-5.1) | 4.8 (4.2-5.6) |
| Unemployed | 95.4 (94.9-95.8) | 95.2 (94.4-95.8) |
| Marital Status | ||
| Currently Married | 93.3 (92.7-93.8) | 93.9 (93.1-94.7) |
| Ever Married | 1.6 (1.4-2.0) | 1.5 (1.1-1.9) |
| Un-Married | 5.1 (4.6-5.6) | 4.6 (4.0-5.4) |
| BMI of women | ||
| Underweight (<18.5) | 11.0 (10.4-11.7) | 14.3 (13.2-15.6) |
| Normal (18.5-24.9) | 45.9 (44.8-47.0) | 46.1 (44.4-47.8) |
| Overweight (25.0-29.9) | 26.9 (25.9-27.9) | 24.8 (23.4-26.4) |
| Obese (>=30) | 16.2 (15.4-17.0) | 14.7 (13.5-15.9) |
| Parity | ||
| <3 | 45.8 (44.7-46.9) | 43.5 (41.8-45.2) |
| >=3 | 54.2 (53.1-55.3) | 56.5 (54.8-58.2) |
| Pregnancy status | ||
| Pregnant | 6.3 (5.8-6.9) | 6.3 (5.5-7.3) |
| Non-Pregnant | 93.7 (93.1-94.2) | 93.7 (92.7-94.5) |
| Minimum dietary diversity | ||
| <5 food groups | 74.7 (73.6-75.7) | 80.2 (78.7-81.6) |
| >=5 food groups | 25.3 (24.3-26.4) | 19.8 (18.4-21.3) |
Table 2.
Prevalence of B12 and Folate deficiency among women of reproductive age.
| Characteristics | Folate (n=6690) Deficiency % (95% CIs) |
Vitamin B12 (n=2693) Deficiency % (95 CIs) |
|---|---|---|
| Residence | ||
| Urban | 45.3 (43.4-47.1) | 17.8 (15.8-20.0) |
| Rural | 44.5 (43.1-45.8) | 21.8 (20.1-23.7) |
| Province | ||
| Punjab | 43.4 (41.7-45.0) | 22.9 (20.2-25.8) |
| Sindh | 46.9 (44.9-48.9) | 17.5 (15.9-19.3) |
| KP | 43.5 (40.8-46.4) | 22.4 (16.6-29.4) |
| Baluchistan | 48.7 (45.4-52.1) | 31.8 (23.1-42.0) |
| ICT | 53.6 (45.9-61.1) | 32.8 (25.8-40.6) |
| KP-NMD | 43.6 (36.3-51.2) | 35.4 (26.4-45.6) |
| AJK | 39.1 (34.7-43.6) | 26.5 (18.5-36.5) |
| GB | 40.7 (36.1-45.5) | 37.1 (23.2-53.6) |
| HH size | ||
| <7 | 44.5 (43.0-46.0) | 22.5 (20.7-24.4) |
| 7 or more members | 45.2 (43.5-46.8) | 17.2 (15.3-19.2) |
| Wealth Index | ||
| Poorest | 45.5 (43.2-47.9) | 18.3 (16.0-20.8) |
| Second | 45.1 (42.8-47.5) | 21.1 (18.2-24.4) |
| Middle | 44.9 (42.5-47.4) | 22.7 (19.5-26.3) |
| Fourth | 45.4 (42.9-47.9) | 17.9 (15.1-21.1) |
| Richest | 43.0 (40.3-45.6) | 22.1 (18.8-25.7) |
| Drinking water source | ||
| Improved sources | 44.1 (42.7-45.5) | 22.3 (20.4-24.2) |
| Unimproved sources | 46.2 (43.1-49.4) | 18.8 (15.6-22.5) |
| Sanitation | 47.1 (43.0-51.2) | 16.0 (12.5-20.3) |
| Improved sanitation facility | 45.1 (42.5-47.6) | 17.8 (15.2-20.8) |
| Unimproved sanitation facility | ||
| Food Insecurity Status | 44.5 (43.4-45.7) | 20.3 (19.0-21.8) |
| Food Secure | 47.7 (43.1-52.4) | 18.7 (14.3-24.2) |
| Milld food insecure | ||
| Moderate food insecure | 44.4 (43.2-45.7) | 20.4 (18.9-22.0) |
| Severe food insecure | 46.6 (44.1-49.2) | 19.4 (16.9-22.3) |
| Age | ||
| 15-19 years | 51.3 (45.3-57.3) | 16.1 (10.2-24.5) |
| 20-34 years | 44.1 (42.7-45.5) | 21.1 (19.4-22.9) |
| 35-49 years | 45.4 (43.5-47.3) | 19.0 (16.7-21.4) |
| Education | ||
| None | 45.7 (44.2-47.1) | 20.5 (18.8-22.3) |
| Primary | 42.8 (39.5-46.2) | 18.0 (14.5-22.1) |
| Middle | 44.9 (41.2-48.6) | 18.4 (14.2-23.7) |
| Secondary | 44.3 (41.0-47.7) | 17.3 (13.7-21.7) |
| Higher | 42.8 (39.5-46.2) | 25.4 (20.9-30.4) |
| Occupation | ||
| Employed | 44.0 (38.9-49.2) | 20.0 (14.8-26.4) |
| Unemployed | 44.8 (43.7-46.0) | 20.2 (18.9-21.6) |
| Marital Status | ||
| Currently Married | 44.8 (43.7-46.0) | 20.2 (18.9-21.7) |
| Ever Married | 44.8 (36.3-53.6) | 15.9 (8.2-28.5) |
| Un-Married | 44.3 (39.5-49.2) | 21.0 (15.2-28.1) |
| BMI of women | ||
| Underweight (<18.5) | 44.6 (41.4-47.8) | 13.3 (10.7-16.5) |
| Normal (18.5-24.9) | 44.9 (43.2-46.5) | 18.3 (16.5-20.3) |
| Overweight (25.0-29.9) | 44.9 (42.7-47.1) | 24.6 (21.7-27.7) |
| Obese (>=30) | 44.5 (41.8-47.3) | 25.5 (21.9-29.5) |
| Parity | ||
| <3 | 44.7 (43.1-46.4) | 22.3 (20.3-24.5) |
| >=3 | 44.8 (43.3-46.3) | 18.5 (16.9-20.4) |
| Pregnancy status | ||
| Pregnant | 44.0 (39.5-48.6) | 32.2 (25.9-39.3) |
| Non-Pregnant | 44.8 (43.7-46.0) | 19.4 (18.1-20.8) |
| Minimum dietary diversity | ||
| <5 food groups | 45.3 (43.9-46.7) | 19.4 (18.1-20.8) |
| >=5 food groups | 43.9 (41.5-46.3) | 20.6 (17.6-24.0) |
Disclaimer/Publisher’s Note: The statements, opinions and data contained in all publications are solely those of the individual author(s) and contributor(s) and not of MDPI and/or the editor(s). MDPI and/or the editor(s) disclaim responsibility for any injury to people or property resulting from any ideas, methods, instructions or products referred to in the content. |
© 2025 by the authors. Licensee MDPI, Basel, Switzerland. This article is an open access article distributed under the terms and conditions of the Creative Commons Attribution (CC BY) license (http://creativecommons.org/licenses/by/4.0/).
Copyright: This open access article is published under a Creative Commons CC BY 4.0 license, which permit the free download, distribution, and reuse, provided that the author and preprint are cited in any reuse.


