
Submitted:
31 August 2023
Posted:
04 September 2023
You are already at the latest version
Abstract
Craters are the most prominent geomorphological features on the surface of celestial bodies, which is playing a crucial role in studying the formation and evolution of celestial bodies, as well as in landing and planning for surface exploration. Currently, the main automatic crater detection models and datasets focus on the detection of large and medium craters. In this paper, we created 23 small lunar crater datasets for model training based on the Chang’E-2 (CE-2) DOM, DEM, Slope, and integrated data with 7 kinds of visualization stretching methods. And then, we proposed the YOLO-Crater model for Lunar and Martian small crater detection by replacing EioU and VariFocal loss to solve the crater samples imbalance problem and introducing a CBAM attention mechanism to mitigate interference from the complex extraterrestrial environment. The results show that the accuracy (P = 87.86%, R = 66.04%, and F1 = 75.41%) of the Lunar YOLO-Crater model based on the DOM-MMS (Maximum-Minimum Stretching) dataset is the highest and better than that of YOLOX model. And the Martian YOLO-Crater, trained by the Martian dataset from the 2022 GeoAI Martian Challenge, achieves good performance with P = 88.37%, R = 69.25%, and F1 = 77.65%. It indicates that the YOLO-Crater model has a strong transferability and generalization capability, which can be applied to detect small craters on the Moon and other celestial bodies.
Keywords:
small crater detection
; YOLO-Crater
; Efficient-IoU (EIoU)
; VariFocal
; Convolutional Block Attention Module (CBAM)
; DOM
; DEM
; Slope
; stretching method
1. Introduction
As circular geomorphological features, craters are formed by the collision of small celestial bodies at high speed. They have great significance for geological age estimating [1], terrain and evolutionary history research [2], mineral resource assessment [3], landing site selection and obstacle avoidance for rovers [4]. Hence, crater detection has always been a hot topic. In the early days, crater detection mainly relied on visual interpretation with astronomical telescopes and remote sensing images. Whereas these methods based on subjective experience are instable and time-consuming [5]. With the development of information and space technology, more and more automatic CDAs have been brought forward with high accuracy [6]. Now, the feature extracted by deep networks has stronger discrimination and generalization abilities than hand-crafted feature [7], and numerous detection methods based on deep learning have been emerging.
As one of the most popular object detection models, You Only Look Once (YOLO) makes predictions by global information of image and makes good use of the context [7]. Moreover, it performs well in the detection of multi-scale small objects. Therefore, more and more researchers use YOLO to detect craters. Benedix et al. [8] developed a model based on YOLOv3 to detect kilometer-size craters on Mars using daytime infrared data (100 m/pixel) acquired by Thermal Emission Imaging System (THEMIS) with accuracy F1 = 87%. Also, YOLOv3 got a good performance in detecting sub-kilometer craters using Lunar Reconnaissance Orbiter Camera Narrow Angle Camera (LROC-NAC) data with high accuracy (F1 = 84%), but low accuracy for large-scale craters (F1 = 62%)[10]. Cui et al. [9] trained YOLOv5 with SLDEM to detect craters of diameters ranging from 2 to 15 km in the South Pole-Aitken Basin, with accuracy F1 = 95%. Tang et al. [11] utilized YOLOv5 to detect kilometer-size craters using Lunar Reconnaissance Orbiter Camera Wide Angle Camera (LROC-WAC) data, with accuracy F1 = 69%. In terms of model construction, most methods directly used the baseline YOLO model to detect craters. But the loss function of the YOLO is difficult to solve the sample imbalance problem of small targets in the training process [12], which may lead to poor performance under complex conditions. Therefore, to improve the detection accuracy of small craters, it is necessary to improve the YOLO model.
Currently, a lot of lunar data have been used to build crater sample datasets. For example, the main image datasets are based on Chang’E CCD, LROC-NAC and SELENE TC (Terrain Camera). Most topographical datasets came from the Chang’E-DEM (Digital Elevation Model), LOLA-DEM, SLDEM and SELENE-DEM. In model training, the dataset requires completeness, self-consistency, timeliness, confidentiality, accuracy, standardization, unbiasedness, and ease of use [13]. That is to say, the quality and distribution of the dataset will affect the detecting accuracy. However, there is no standard sample dataset for crater detection. In fact, the sample data is selected regardless of regional differences, geomorphological features, data types, resolution, object size and so on. According to the data processing, there is no systemic analysis on the impact of the data visualization. Some models directly use the original data, some use the processed data with different visualization stretching methods [14,15]. But different methods will lead to different visual effects and potential information loss, which may pay a great impact on the detecting accuracy. While Chang’E-2 (CE-2) data has a good consistency in imaging mode, coverage, data processing, and resolution [16], which makes it possible to build a dataset for global small lunar crater detection.
In this paper, we proposed a novel crater detection model (called YOLO-Crater) by replacing the loss function and introducing the CBAM attention mechanism based on the YOLOX network structure. And then, the CE-2 DOM, DEM, Slope, and integrated data were used to build 23 sample datasets with different visualization stretching methods and train the YOLO-Crater models respectively. To determine the final dataset and the corresponding Lunar YOLO-Crater model, a series of comparative experiments were made to analyze the visualization stretching methods and the detection model accuracy. At last, the Martian sample dataset provided by the 2022 GeoAI Martian Challenge was used to train the Lunar YOLO-Crater model to build the Martian crater detection model (called Martian YOLO-Crater) and evaluate the YOLO-Crater’s transferability and generalization capability.
2. Dataset
Small crater detection requires high resolution data and the small crater sample dataset. Currently, the SELENE-TC, LROC-NAC and CE-2-CCD can provide lunar image data with high resolution [16,18,19]. The resolution of SELENE-TC data is 7.4 m/pixel, and the coverage rate is 92.4%. But the mosaic image has a dislocation, leakage in the middle and low latitudes, and inconsistent brightness in the polar regions. The LROC-NAC data resolution covers from 0.5 to 2 m/pixel. However, due to inconsistent imaging condition, there are great differences in positioning, resolution, brightness and shadow. Now, the CE-2 provides the global DOM data (7 m/pixel) and DEM data (20 m/pixel) with consistent imaging conditions and positioning control network, which made it possible to build a standard sample dataset for all of the lunar crater detection. As for the sample dataset, there is no publicly available and unified small crater dataset. Now, many lunar crater databases have been created by Head et al. [20], Salamunićcar et al. [21], Povilaitis et al. [22], Robbins [23] and so on. But the crater size is more than kilometer, which can’t be used to create the small crater sample dataset. Many CDAs have used the DOM, DEM and some derived data to detect the crater, but there is no adaption evaluation about the above data. So, we selected DOM, DEM, Slope extracted from DEM, and integrated data (DOM, DEM and Slope: DDS) to create the small crater sample dataset in the typical sample areas and make a comparative experiment to evaluate the applicability of datasets. The dataset creation includes data preparation and data creation (see Figure 1).
2.1. Data Preparation
Though the CE-2 image has consistent imaging conditions, the difference in terrain and placement makes the texture different. To make the detection model have better generalization capability, the crater samples should cover different features, such as reflectance, geomorphology, shadow direction and so on. In this paper, we selected 6 sample areas in Maria and Highland. Among them, R1- R4 and R6 were selected by Zang et al. [17]. While R5 is reselected to expand the Maria area. R5 coves 57.59°W and 39.41°N - 40.61°N, with the same extent as the R6 (in Highland).
We labelled the crater with DOM data manually using ArcMap software and recorded the center coordinates and radius of the crater. The labeling principle is that the shadow direction of any given crater in the same area is consistent. And to improve the detecting accuracy of the model and the completeness of the crater label set, we verified and corrected the labels marked by Zang et al. [17]. In the end, a total of 83,620 labels were obtained. The number of labels is significantly more than those labelled by Fairweather et al. [11] with 43,402, Hashimoto and Mori [24] with 4,967, Yang et al. [25] with 14,406, and Lagain et al. [26] with 2,142. The number of labels in R1 to R6 are 8,632, 8,857, 23,970, 34,884, 3,519, and 3,758 respectively. And 42,006 new craters were labelled. The size-frequency distribution of labels (see Figure 2) shows that 99% are less than 1 km in diameter.
2.2. Dataset Creation
DEM data is the value of the elevation, which can’t be used to detect the craters directly in the CDAs. So DEM should be transformed and visualized into the image [27]. But there is no reference to analyze and evaluate the effect of the visualization transform, which may affect the detecting accuracy deeply. In the compiling Chang’E-1 Topographic Atlas of the Moon [28]. Mu had made a comparative experiment about the DEM visualization. If the global DEM data acquired by Chang’E-1 was divided into 188 sheets, and then each sheet was enhanced and visualized, the topographic details were very clear. In verse, if the global DEM was visualized and then divided, the topographic details in each sheet were unclear. Mu got the same result in compiling The Chang'E-2 High Resolution Image Atlas of Lunar Sinus Iridum [29]. So, we used the former data processing to visualize the dataset with several image stretching methods. The following are the steps for dataset creation:
Firstly, we cropped the data into 640 pixel640 pixel blocks with a certain overlap to make the crater on the segmentation boundary be detected properly [30]. As shown in Figure 2, approximately 90% craters’ radius is less than 250 m, and we weighed the completeness of the crater and the efficiency of model training, and chose an overlap rate of 5% (250 meters ÷ 7 meters/pixel ÷ 640 pixels ≈ 5%).
Secondly, we used 7 kinds of stretching methods commended by Gao [31] and ArcMap [32] to visualize and enhance the cropped data. The stretching methods include Maximum-Minimum Stretching (MMS), 1%/2% Linear Truncation Stretching (1%/2% LTS), Standard Deviation Stretching (SDS), Histogram Equalization (HE), Laplacian Sharpening (LS), and Gaussian Smoothing (GS). As a result, we got 22 datasets [3 kinds of data ( DOM, DEM and Slope) * 7 ( methods ) + 1( DOM without any enhancement) = 22] in VOC format for model training and stretching method adaption evaluation.
Finally, we divided the dataset into training, validation and testing data. In each dataset, the training data and validation data with a ratio of 9:1 was randomly selected in R1-R4, and the testing data contained all of the samples in R5 and R6.
2.3. Martian Dataset
The Martian dataset, downloaded from the 2022 GeoAI Martian Challenge in CodaLab (http://cici.lab.asu.edu/martian/#data-download), was created by Hsu et al [33]. The image data was THEMIS daytime infrared with 100 m resolution and global coverage [34]. In addition, Martian sample craters were labelled with bounding boxes (BBOXs) recording the center and length diameter provided by Robbin’s crater database [35]. The total number of labels was 301,912, with 27.3% between 0.2 km to 1 km in diameter, 38.94% between 1 to 1.5 km and nearly 90% no more than 3 km. The dataset contained 102,675 images of 256 pixel256 pixel. The training data contained 50,838 images with 149,560 craters, the testing data contained 50,837 images with 149,389 craters, and the validation data contained 2,963 craters.
3. Methods
3.1. YOLO-Crater
In this paper, we took the YOLOX [36] as the baseline crater detection framework. In the framework, the loss function was replaced, and an attention mechanism was introduced to solve the sample imbalance problem and enhance the feature extraction ability. As shown in Figure 2, there is an imbalanced distribution in crater samples, 59.66% less than 100 m in radius, 21.73% from 100 m to 150 m, 12.51% from 150 m to 250 m, and only 6.11% more than 250m. As for the sample type, there are simple craters, complex craters and degraded craters. However, YOLOX uses the traditional binary cross entropy loss to calculate the confidence loss, which is difficult to solve the crater samples imbalance problem [37]. VariFocal loss borrows the weighting idea from the focal loss and deals with large, small, simple and complex craters asymmetrically to solve the imbalance problem [38]. So, we replaced the traditional binary cross entropy loss with VariFocal loss. Furthermore, YOLOX uses the Intersection over Union (IoU) loss to calculate the localization loss. When the crater prediction box and crater ground truth box have no intersection with IoU = 0, which can result in a gradient vanishing problem for non-overlapping. Zheng et al. [39] suggested that a good positioning loss should consider three important geometric indicators, namely overlapping area, center point distance, and aspect ratio. Efficient-IoU (EIoU) loss combines these geometric indicators, which can relieve the gradient vanishing problem [40]. So, we replaced IoU loss with EIoU loss. EIoU is measured by the following expressions:
where , , are the central point, height and width of the prediction box. ,, are the central point, height, and width of the ground truth box. and are the width and height of the smallest enclosing box covering the prediction box and ground truth box. is the Euclidean distance.
In addition, YOLOX uses the Darknet53 backbone and Path Aggregation Network (PANet) neck to extract features, which enhance the entire feature hierarchy with accurate localization signals in lower layers by bottom-up path augmentation [41]. However, due to the complex lunar topographic surface, some circular highlight-shadow landforms are easy to be misidentified as craters, such as volcanic cones, domes, etc. What's more, if there is a low contrast between the crater and the background in the image, it is difficult to detect the crater. To enhance the circular highlight-shadow feature and make the model focus on the crater area, the Convolutional Block Attention Module (CBAM) was introduced to the YOLOX. CBAM consists of a channel attention module and a spatial attention module [42], as shown in Figure 3. Channel attention focuses on ‘what’ is meaningful given an input image, while spatial attention focuses on ‘where’ is an informative part, which is complementary to channel attention [42].
By replacing the loss function and introducing the CBAM attention mechanism, we proposed a YOLO-Crater model shown in Figure 4. In the first stage, CE-2 images of 640 pixel ×640 pixel were input into the backbone. In the second stage, Darknet53 was used to extract crater features. In the third stage, CBAM was added to the connection channel between the backbone and neck to enhance the crater features extracted by the backbone. In the fourth stage, PANet used up-sampling and down-sampling to merge the different hierarchy features from CBAM. In the last stage, the YoloHead was used to predict crater localization and size. Additionally, the VariFocal loss and EIoU loss were used to tune the model through backward propagation.
3.2. Model Training and Testing
The model training aims to get the best Lunar and Martian crater detection model. The model training was under the PyTorch framework (torch 1.8 + cu11) using Python language (Python 3.7) and torchvision library (version:0.9.0 + cu11). Accuracy metrics, including Precision (P), Recall (R) and F1 score [43], were adopted to evaluate the detecting accuracy using Equations (3)-(5).
where TP, FP, and FN are the number of true positives, false positives, and false negatives, respectively.
The model training and testing include the following steps (see Figure 5):
The first step is to train the YOLO-Crater model using the DOM dataset and other 21 datasets (DOM, DEM and Slope with 7 kinds of visualization stretching method), and select the optimal stretching method for each data type and 3 corresponding datasets. And then, the above 3 datasets were integrated into the DDS dataset (see Section 4.1.1) to train the YOLO-Crater again.
The second step is to use the testing data from the above 3 datasets and the DDS dataset to evaluate the trained models using the accuracy metrics and determine the optimal model as the Lunar YOLO-Crater (see Section 4.1.2).
The last step is to take the Lunar YOLO-Crater model as a pre-trained model, and use the Martian dataset to train and test the Martian YOLO-Crater.
The following is the model hyper-parameters. Due to the crater texture information in Maria being poorer than that in Highland, we set the confidence threshold to 0.4 in Maria and 0.3 in Highland.

Table 1.
The model hyper-parameters.
| Hyper-parameter | Value |
|---|---|
| epoch | 100 |
| batch size | 16 |
| nmsthre | 0.5 |
| test size | (640, 640) |
| test_conf | 0.4(Maria) / 0.3(Highland) |
3.3. Detection Post-processing
In Lunar YOLO-Crater model training and testing, the detected craters were located in image coordinates, which should be transformed into geo-coordinates to put the detected craters together. Furthermore, we cropped the data with a 5% overlap rate, which may produce duplicate craters and affect the detecting accuracy. So, the detection post-processing includes the projection coordinate transforming, the duplication craters removing and the accuracy calculating. We used the GetGeoTransform method described in [17] to transform the image coordinates (x, y) into the geo-coordinates (θ, ϕ). To remove the duplicate craters, we used Non-Maximum Suppression (NMS) method, which selected the bounding box with the highest probability and suppressed all other bounding boxes that had an IoU greater than a threshold () [15]. The threshold is determined below.
The correct detection (TP), missed detection (FN) and false detection (FP), used in (3)-(5), are calculated by (6)-(7). If the coordinates of the detected crater satisfy Equations (6)-(7), which means a correct detection (TP) [43]. Conversely, it is a missed detection (FN) or false detection (FP).
where is the center pixel coordinates and radius of the labels; is the center pixel coordinates and radius of the detected crater; and are tunable hyper-parameters.
To determine the tunable hyper-parameters, we selected the parameter combination with the highest F1. The range of is [0, 1]. A low threshold is not conducive to detecting overlapped craters. While a high threshold is not conducive to removing duplicate craters. So, we selected ∈ [0.3-0.7] with a step size of 0.1. and have the same range [0.5, 3] [43]. A small step size can cause slow changes and consume more computing time, so we set the step size to 0.5 for and . In the end, a total of 180 sets of parameter combinations were obtained, with the F1∈[0.7120-0.7541]. And we selected the best parameter combination (,,) with the corresponding F1=0.7541 (see Figure 6).
4. Results and Discussion
Based on the following comparative experiments, we used the detecting accuracy metrics to evaluate the data visualization, determine the optimal dataset for the Lunar YOLO-Crater and analyze the detecting accuracy distribution. In addition, we used the Martian dataset download from the 2022 GeoAI Martian Challenge to test the transferability and generalization capability of the YOLO-Crater model.
4.1. Comparative Analysis of Lunar Crater Detection
4.1.1. Data Visualization Evaluating
In this experiment, the accuracy metrics such as Precision (P), Recall (R), and F1 score are used to evaluate visualization enhancement methods using the testing data, which can determine the optimal stretching method for each data type.
DEM: The testing data was used to evaluate the detecting accuracy shown in Table 2. The highest detecting accuracy is based on the DEM-1% LTS method, with F1 = 23.35%. But the lowest accuracy is based on the DEM-HE method, with F1 = 13.51%. Furthermore, the MMS and LTS methods have similar accuracy, which also means that the values of the summit and lowest point pay more impact on the DEM visualization. Additionally, the detecting accuracy of the DEM datasets is low. So, the geomorphological features for detecting in DEM data are limited.
Slope: In the sample areas, the max value of the slope is not more than 69°. Table 3 shows the detecting accuracy for different stretching methods. The Slope-SDS gets the highest accuracy with F1 = 22.97%, more 1.5% than the Slope-1% LTS. But the Slope-HE gets the lowest accuracy, with F1 = 19.23%. Compared with the DEM datasets, the detecting accuracy of the Slope datasets has no apparent increase.
DOM: Table 4 is the accuracy of the detection based on Change’E-2 DOM with different image stretching methods. The DOM-MMS obtains the highest detecting accuracy, with F1 = 75.41%. The lowest is 67.29% corresponding to the DOM- LS+ MMS+GS. But the DOM gets a better result (F1 = 72.33%). Compared with the MMS, the others didn’t improve the detecting accuracy, but reduced it, which means the above image stretching methods have no great impact on detecting accuracy. The main reason is that the DOM, as the processed image data, has been enhanced [19]. Compared with the DEM and Slope datasets, DOM datasets have an apparent detecting accuracy increase. If image data were used to detect the crater, the MMS may be the best recommended stretching method.
DDS: After the above comparison and analysis, we got the optimal stretching method for each datatype, and then we used the corresponding dataset (DOM-MMS, DEM-1% LTS and Slope-SDS) to form the DDS dataset by layerstacking in ENVI software.
4.1.2. Best Dataset Selecting
The above step determined the optimal stretching method for each data type and the corresponding dataset. To select the best dataset, we used the best testing accuracy for each data type. As shown in Table 5, the DOM-MMS dataset got the highest detecting accuracy, with P = 87.86%, R = 66.04%, and F1 = 75.41%. DDS dataset got better accuracy with P=84.33%, R=63.01%, and F1=72.13%, but missing some detections (see Figure 7).
The DEM-1% LTS dataset and Slope-SDS dataset derived from the DEM got the lowest accuracy. In Figure 8, we can see more texture information in the DOM-MMS dataset than that in the DEM-1% LTS and Slope-SDS dataset. Though the illumination can’t affect the DEM and slope, the texture in the image was affected by the landscape and the illumination, in Figure 8. That is to say, the DOM image contains more crater’s features. For example, we can see that the craters have shadow and shine spot, and the texture is directional, which become an apparent feature for the craters. In the DEM-1% LTS image, we can’t get the apparent features. But in the Slope-SDS data, we can see the slope changes in and out of the crater. So, the detecting accuracy based on Slope-SDS is better than that based on the DEM-1% LTS.
4.1.3. Accuracy Distribution Analysis
To evaluate the detection model improvements, an ablation experiment was carried out to analyze the effect of the new loss function, CBAM, and both of them. Table 6 shows the results. Without any improvement, the YOLOX was used to detect the crater with F1 = 66.75%. When the CBAM was added into the model, the P (92.51%), R (52.8%), and F1 (67.23%) all increase a little, which indicates that the CBAM promotes extracting fine features of craters slightly. When changing the new loss function described in Section 3.1, the P decreases (by 5%), but the R (by 10%) and F1 (by 6%) increase obviously, which indicates that the new loss function enables the model to relieve the crater sample imbalanced problem and identify more small-scale craters efficiently. When both of them were embedded into the model at the same time, the model became (Lunar) YOLO-Crater with higher detecting accuracy (F1 = 75.41%).
Figure 9 is the distribution of craters detected by the Lunar YOLO-Crater in Maria and Highland. As shown in Figure 9, the Lunar YOLO-Crater has some missed and false detections. Some craters have severe degradation and unclear highlight-shadow features, which make it difficult to detect them. In addition, due to the limitation of the cropped image size and image resolution, the model cannot detect a crater radius of more than 2.24 km (Figure 9b, blue dashed circle). Besides, the interference derived from other lunar circular features which have significant highlight-shadow features, leading to misidentifying them as craters. However, when we verified the false detections, found that some “false” craters are true craters. This reflects the limitations of manually labelled crater dataset and the importance of automatic crater detection research.
As shown in Table 7, the Lunar YOLO-Crater got a higher detecting accuracy both in the Maria and Highland than YOLOX, and had a better performance in the Highland (P = 89.56%, R = 66.18%, F1 = 76.11%) than that in Maria (P = 86.11%, R = 65.9%, F1 = 74.66%). The main reason is the features in Highland, including image contrast, image hierarchy, clarity, and texture information, are better than those in Maria [18].
In order to evaluate the ability of YOLO-Crater to detect craters at different scales, we made a detecting accuracy statistic as shown in Figure 10 and Table 8. We found that the F1 is 73.97% with the radius < 100 m, while greater than 80% within 100 m to 350 m, and 77.14% within 350 m to 400 m. But a lower performance for detecting craters is shown with the radii between 400 m to 500 m. As can be seen in Figure 10, the Recall (green) and F1 (blue) curves showed a downtrend.
4.2. Martian Crater Detection
There are significant geomorphological differences between Mars and the Moon, which can be used to examine the generalization ability of YOLO-Crater. As described in Section 3.2, we took the Lunar YOLO-Crater model as a pre-trained model, and used the Martian dataset downloaded from the 2022 GeoAI Martian Challenge to train the pre-trained model and got the Martian YOLO-Crater model. Figure 11 shows the detecting results (in brown) and the ground-truth labels (in green) using validation data. Figure 11a-11c demonstrates the Martian YOLO-Crater model can detect craters of different sizes (Figure 11c). In addition, the model can detect unlabeled craters (see Figure 11d, e, f). However, there are some crater-like features undetected by the model (Figure 11e). In Table 9, the results indicate a good performance in detecting Martian craters with P = 88.37%, R = 69.25%, and F1 = 77.65%.
The organizer only provided the testing image data without corresponding labels, and required the contestant put the detected result back. Based on the feedback, the organizer evaluated the detecting accuracy using the Average Precision (AP) metric. The detecting accuracy of the Martian YOLO-Crater ranked second place (http://cici.lab.asu.edu/martian/#eval-award) with AP50:95 = 46.7% and AP50 = 86.1% in the Challenge, while the first place with AP50:95 = 48.4% and AP50 = 86.0% (https://codalab.lisn.upsaclay.fr/competitions/1934#results). The above results indicate that the YOLO-Crater has strong transferability and generalization ability, and can be applied to detect small craters on other celestial bodies.
5. Conclusions
In this paper, we proposed a novel small crater detection model (called YOLO-Crater) by replacing the IoU loss and traditional binary cross entropy loss with EIoU loss and VariFocal loss and introducing the CBAM attention mechanism. To get more small crater samples with high accuracy, about 42,006 labels had been remodified manually, based on the existing labels made by Zang et al. [17]. And a series of comparative experiments were made to analyze the impact of data type, stretching method, terrain type, and crater size on the crater detection model systematically.
The results showed that the data type and visualization stretching methods pay an important impact on the detecting accuracy. The DOM is the best data type for small crater detection. And CE-2 DOM-MMS (Maximum and Minimum Stretching) is the best stretching method with total P = 87.86%, R = 66.04%, and F1 = 75.41%. Compared with the YOLOX, the Lunar YOLO-Crater gets a better performance both in Mare and Highland with accuracy F1= 74.66% and 76.11% respectively. Moreover, the Lunar YOLO-Crater obtains a higher accuracy in detecting small-scale craters within 400 m in radius. In addition, the Martian crater detection model (Called Martian YOLO-Crater) was trained by image sample data from the 2022 GeoAI Martian Challenge and achieved second place with P = 88.37%, R = 69.25%, and F1 = 77.65%, which means the Martian YOLO-Crater has strong transferability and generalization capability.
In the future, more and more high resolution data will be acquired for the Moon and other celestial bodies. The remodified lunar small crater dataset could serve as a valuable supplement for GeoAI datasets, which would enable more researchers to utilize, improve and expand it to other celestial bodies. Meanwhile, the strong transferability and generalization capability of the YOLO-Crater will make it possible to detect the craters with high accuracy on other celestial bodies using image data.
Author Contributions
Conceptualization, L.M.; methodology, L.M., L.X. and G.L.; software, L.X.; validation, L.X. and L.M.; data processing L.X. and L.L.; formal analysis, L.M. and L.X.; investigation, L.M., L.X., L.L. and M.C.; resources, L.X., L.L. and M.C; writing—original draft preparation, L.X. and L.M.; writing—review and editing, L.M., G.L. and W.Z.; visualization, L.X., L.M. and M.C.; supervision, L.M. and G.L.; project administration, L.M. and W.Z.; funding acquisition, L.M.; mapping, L.X., L.M. and L.L. All authors have read and agreed to the published version of the manuscript.
Funding
This research was funded by The National High Technology Research and Development Program of China (No. 2010AA122202) and National Natural Science Foundation of China (No. 42230103).
Data Availability Statement
CE-2 data is available at https://moon.bao.ac.cn/searchOrder_pdsData.search (accessed on 15 July 2021). Lunar samples of training data, validation data, testing data, and code are available from the authors. Martian samples of training data, validation data, and testing data are available from http://cici.lab.asu.edu/martian/#data-download.
Acknowledgments
We thank the Ground Research & Applications System (GRAS) of the Chinese Lunar Exploration Project (CLEP) for providing data and Hsu et al. for providing the Martian dataset. Careful comments given by the anonymous reviewers helped to improve the manuscript.
Conflicts of Interest
The authors declare no conflict of interest.
References
- Salih, A.L.; Schulte, P.; Grumpe, A.; Wöhler, C.; Hiesinger, H. Automatic crater detection and age estimation for mare regions on the lunar surface. 25th European Signal Processing Conference (EUSIPCO), Greece, AUG 28-SEP 02 2017; pp. 518–522.
- Cheng, W.; Wang, J.; Wan, C. Morphometric Characterization and Reconstruction Effect Among Lunar Impact Craters. Earth Moon and Planets 2014, 111, 139–155. [Google Scholar] [CrossRef]
- West, M.D.; Clarke, J.D.A. Potential martian mineral resources: Mechanisms and terrestrial analogues. Planetary and Space Science 2010, 58, 574–582. [Google Scholar] [CrossRef]
- Watkins, R.N.; Jolliff, B.L.; Mistick, K.; Fogerty, C.; Lawrence, S.J.; Singer, K.N.; Ghent, R.R. Boulder Distributions Around Young, Small Lunar Impact Craters and Implications for Regolith Production Rates and Landing Site Safety. Journal of Geophysical Research: Planets 2019, 124, 2754–2771. [Google Scholar] [CrossRef]
- Rodionova, Z.F.; Shevchenko, V.V.; Karlov, A.A.; Smolyakova, T. F. A Morphological Catalogue of Lunar Craters: a Preliminary Study. Lunar and Planetary Science XVII 1986, 17, 722–723. [Google Scholar]
- DeLatte, D.M.; Crites, S.T.; Guttenberg, N.; Yairi, T. Automated Crater Detection Algorithms from a Machine Learning Perspective in the Convolutional Neural Network Era. Advances in Space Research 2019, 64, 1615–1628. [Google Scholar] [CrossRef]
- Wang, Z.; Liu, J. A review of object detection based on convolutional neural network, 2017 36th Chinese Control Conference (CCC), Dalian, China, 26-28 July 2017; pp. 1 1104–11109. [CrossRef]
- Benedix, G. K.; Lagain, A.; Chai, K.; Meka, S.; Anderson, S.; Norman, C.; Bland, P.A.; Paxman, M.C.; Towner, T. Tan. Deriving surface ages on Mars using automated crater counting. Earth and Space Science 2020, 7, e2019EA001005. [Google Scholar] [CrossRef]
- Cui, X.; Ding, M.; Wang, G. Automated crater detection on the South Pole⁃Aitken basin of the Moon and absolute model ages of mid⁃sized craters based on convolution neural network. Journal of Nanjing University (Natural Sciences) 2021, 57, 905–915. [Google Scholar]
- Fairweather, J.H.; Lagain, A.; Servis, K.; Benedix, G.K.; Kumar, S.S.; Bland, P.A. Automatic mapping of small lunar impact craters using LRO-NAC images. Earth and Space Science 2022, 9, e2021EA002177. [Google Scholar] [CrossRef]
- Tang, K.; Liang, J.; Yan, P.; Tian, X. Lunar Crater Detection based YoloV5 using CCD Data. IEEE International Conference on Artificial Intelligence and Computer Applications (ICAICA), Dalian, China, 24-. 26 June.
- Li, Y.; Sun, H.; Hu, Y.; Han, Y. Electrode defect YOLO detection algorithm based on attention mechanism and multi-scale feature fusion. Control and Decision 2022. [Google Scholar] [CrossRef]
- Gong, Y.; Liu, G.; Xue, Y.; Li, R.; Meng, L. A survey on dataset quality in machine learning. Information and Software Technology, 0726. [Google Scholar] [CrossRef]
- Jia, Y.; Wan, G.; Liu, L.; Wang, J.; Wu, Y.; Xue, N.; Wang, Y.; Yang, R. Split-Attention Networks with Self-Calibrated Convolution for Moon Impact Crater Detection from Multi-Source Data. Remote Sens 2021, 13, 3193. [Google Scholar] [CrossRef]
- Tewari, A.; Verma, V.; Srivastava, P.; Jain, V.; Khanna, N. Automated Crater detection from Co-registered optical images, elevation maps and slope maps using deep learning. Planetary and Space Science 2022, 218, 105500. [Google Scholar] [CrossRef]
- Liu, J.; Ren, X.; Wang, F.; Mu, L.; Wang, W.; Tan, X. Progress in the Lunar optical remote sensing and mapping research. Bulletin of Mineralogy, Petrology and Geochemistry 2015, 34, 461–470. [Google Scholar]
- Zang, S.; Mu, L.; Xian, L.; Zhang, W. Semi-Supervised Deep Learning for Lunar Crater Detection Using CE-2 DOM. Remote Sensing 2021, 13, 2819. [Google Scholar] [CrossRef]
- Wang, F.; Ren, X.; Liu, J.; Li, C. Image quality evaluation of the CCD stereo camera of Chang’E-2 lunar satellite. Astronomical Research & Technology 2016, 13, 7. [Google Scholar]
- Liu, J.; Ren, X.; Tan, X.; Li, C. Lunar image data preprocessing and quality evaluation of CCD stereo camera on Chang’E-2. Geomatics and Information Science of Wuhan University 2013, 38, 186–190. [Google Scholar]
- Head, J.W., 3rd; Fassett, C.I; Kadish, S.J.; Smith, D.E.; Zuber, M.T.; Neumann, G.A.; Mazarico, E. Global Distribution of Large Lunar Craters: Implications for Resurfacing and Impactor Populations. Science 2010, 329, 1504–1507. [Google Scholar] [CrossRef]
- Salamunićcar, G.; Lončarić, S.; Grumpe, A.; Wöhler, C. Hybrid method for crater detection based on topography reconstruction from optical images and the new LU78287GT catalogue of Lunar craters. Adv. Space Res. 2014, 53, 1783–1797. [Google Scholar] [CrossRef]
- Povilaitis, R.Z.; Robinson, M.S.; van der Bogert, C.H.; Hiesinger, H.; Meyer, H.M.; Ostrach, L.R. Crater density differences: Exploring regional resurfacing, secondary crater populations, and crater saturation equilibrium on the moon. Planet. Space Sci. 2018, 162, 41–51. [Google Scholar] [CrossRef]
- Robbins, S.J. A New Global Database of Lunar Impact Craters >1–2 km: 1. Crater Locations and Sizes, Comparisons With Published Databases, and Global Analysis. J. Geophys. Res. 2019, 124, 871–892. [Google Scholar] [CrossRef]
- Hashimoto, S.; Mori, K. Lunar Crater detection based on grid partition using deep learning. IEEE 13th International Symposium on Applied Computational Intelligence and Informatics (SACI), Timisoara, ROMANIA, 29-; pp. 75–80. 31 May.
- Yang, C.; Zhao, H.; Bruzzone, L.; Benediktsson, J.A.; Liang, Y.; Liu, B.; Zeng, X.; Guan, R.; Li, C.; Ouyang, Z. Lunar impact crater identification and age estimation with Chang’E data by deep and transfer learning. Nature Communications 2021, 11, 6358. [Google Scholar] [CrossRef]
- Lagain, A.; Benedix, G.K.; Servis, K.; Baratoux, D.; Doucet, L.S.; Rajšic, A.; Devillepoix, H.A.R.; Bland, P.A.; Towner, M.C.; Sansom, E.K.; Miljković, K. The Tharsis mantle source of depleted shergottites revealed by 90 million impact craters. Nature Communications 2021, 12, 6352. [Google Scholar] [CrossRef] [PubMed]
- Wu, Y.; Wan, G.; Liu, L.; Wei, Z.; Wang, S. Intelligent Crater Detection on Planetary Surface Using Convolutional Neural Network. IEEE 5th Advanced Information Technology, Electronic and Automation Control Conference (IAEAC), Chongqing, China, 12-; pp. 1229–1234. 14 March.
- Li, C.; Liu, J.; Mu, L.; Ren, X.; Zuo, W. The Chang'E-1 Topographic Atlas of the Moon[M]. Springer, 2016.
- Li, C.; Liu, J.; Mu, L. The Chang’E-2 High Resolution Image Atlas of the Sinus Iridum. Sinomap press, China, 2014.
- Li, Z.; Wang, Y.; Zhang, N.; Zhang, Y.; Zhao, Z.; Xu, D.; Ben, G.; Gao, Y. Deep Learning-Based Object Detection Techniques for Remote Sensing Images: A Survey. Remote Sens. 2022, 14, 2385. [Google Scholar] [CrossRef]
- Gao, L.; Wu, Q. Optimized linear stretch for remote sensing images based on GDAL. Beijing Surveying and Mapping 2020, 34, 1508–1510. [Google Scholar] [CrossRef]
- Chao, Y.; Zheng, G.; Yang, N. Analysis and application of ArcGIS geographic information system. Publishing House of Electronics Industry, China, 2018.
- Hsu, C.Y.; Li, W.; Wang, S. Knowledge-Driven GeoAI: Integrating Spatial Knowledge into Multi-Scale Deep Learning for Mars Crater Detection. Remote Sensing 2021, 13, 2116. [Google Scholar] [CrossRef]
- Edwards, C.; Nowicki, K.; Christensen, P.; Hill, J.; Gorelick, N.; Murray, K. Mosaicking of global planetary image datasets: 1.Techniques and data processing for Thermal Emission Imaging System (THEMIS) multi-spectral data. Journal of Geophysical Research: Planets 2011, 116. [Google Scholar] [CrossRef]
- Robbins, S.J.; Hynek, B.M. A new global database of Mars impact craters ≥1 km: 1. Database creation, properties, and parameters. J. Geophys. Res. Planets 2012, 117. [Google Scholar] [CrossRef]
- Ge, Z.; Liu, S.; Wang, F. YOLOX: Exceeding YOLO Series in 2021. arXiv:2107.08430, 2021.
- Xie, Y.; Li, X.; Li, T.; Li, C. Expression recognition based on improved ResNet and loss function. Automation & Instrumentation 2022, 37, 64–69. [Google Scholar] [CrossRef]
- Zhang, H.; Wang, Y.; Dayoub, F.; Sunderhauf, N. VarifocalNet: An IoU-aware Dense Object Detector. IEEE/CVF Conference on Computer Vision and Pattern Recognition (CVPR), ELECTR NETWORK, 19-; pp. 8510–8519. 25 January.
- Zhang, Z.; Wang, P.; Liu, W.; Li, J.; Ye, R.; Ren, D. Distance-IoU Loss: Faster and Better Learning for Bounding Box Regression. AAAI Conference on Artificial Intelligence, 2020, 12993-13000.
- Zhang, Y.; Ren, W.; Zhang, Z.; Jia, Z.; Wang, L.; Tan, T. Focal and Efficient IOU Loss for Accurate Bounding Box Regression. Neurocomputing 2022, 506, 146–157. [Google Scholar] [CrossRef]
- Liu, S.; Qi, L.; Qin, H.; Shi, J.; Jia, J. Path Aggregation Network for Instance Segmentation. 31st IEEE/CVF Conference on Computer Vision and Pattern Recognition (CVPR), Salt Lake City, UT, 18-; pp. 8759–8768. 23 January.
- Woo, S.H.; Park, J.; Lee, J.Y.; Kweon, I.S. CBAM: convolutional block attention module. 15th European Conference on Computer Vision (ECCV), Munich, GERMANY, 08-. 14 September.
- Silburt, A.; Ali-Dib, M.; Zhu, C.; Jackson, A.; Valencia, D.; Kissin, Y.; Tamayo, D.; Menou, K. Lunar crater identification via deep learning. Icarus 2019, 317, 27–38. [Google Scholar] [CrossRef]
Figure 1.
Workflow of the lunar sample dataset creation.
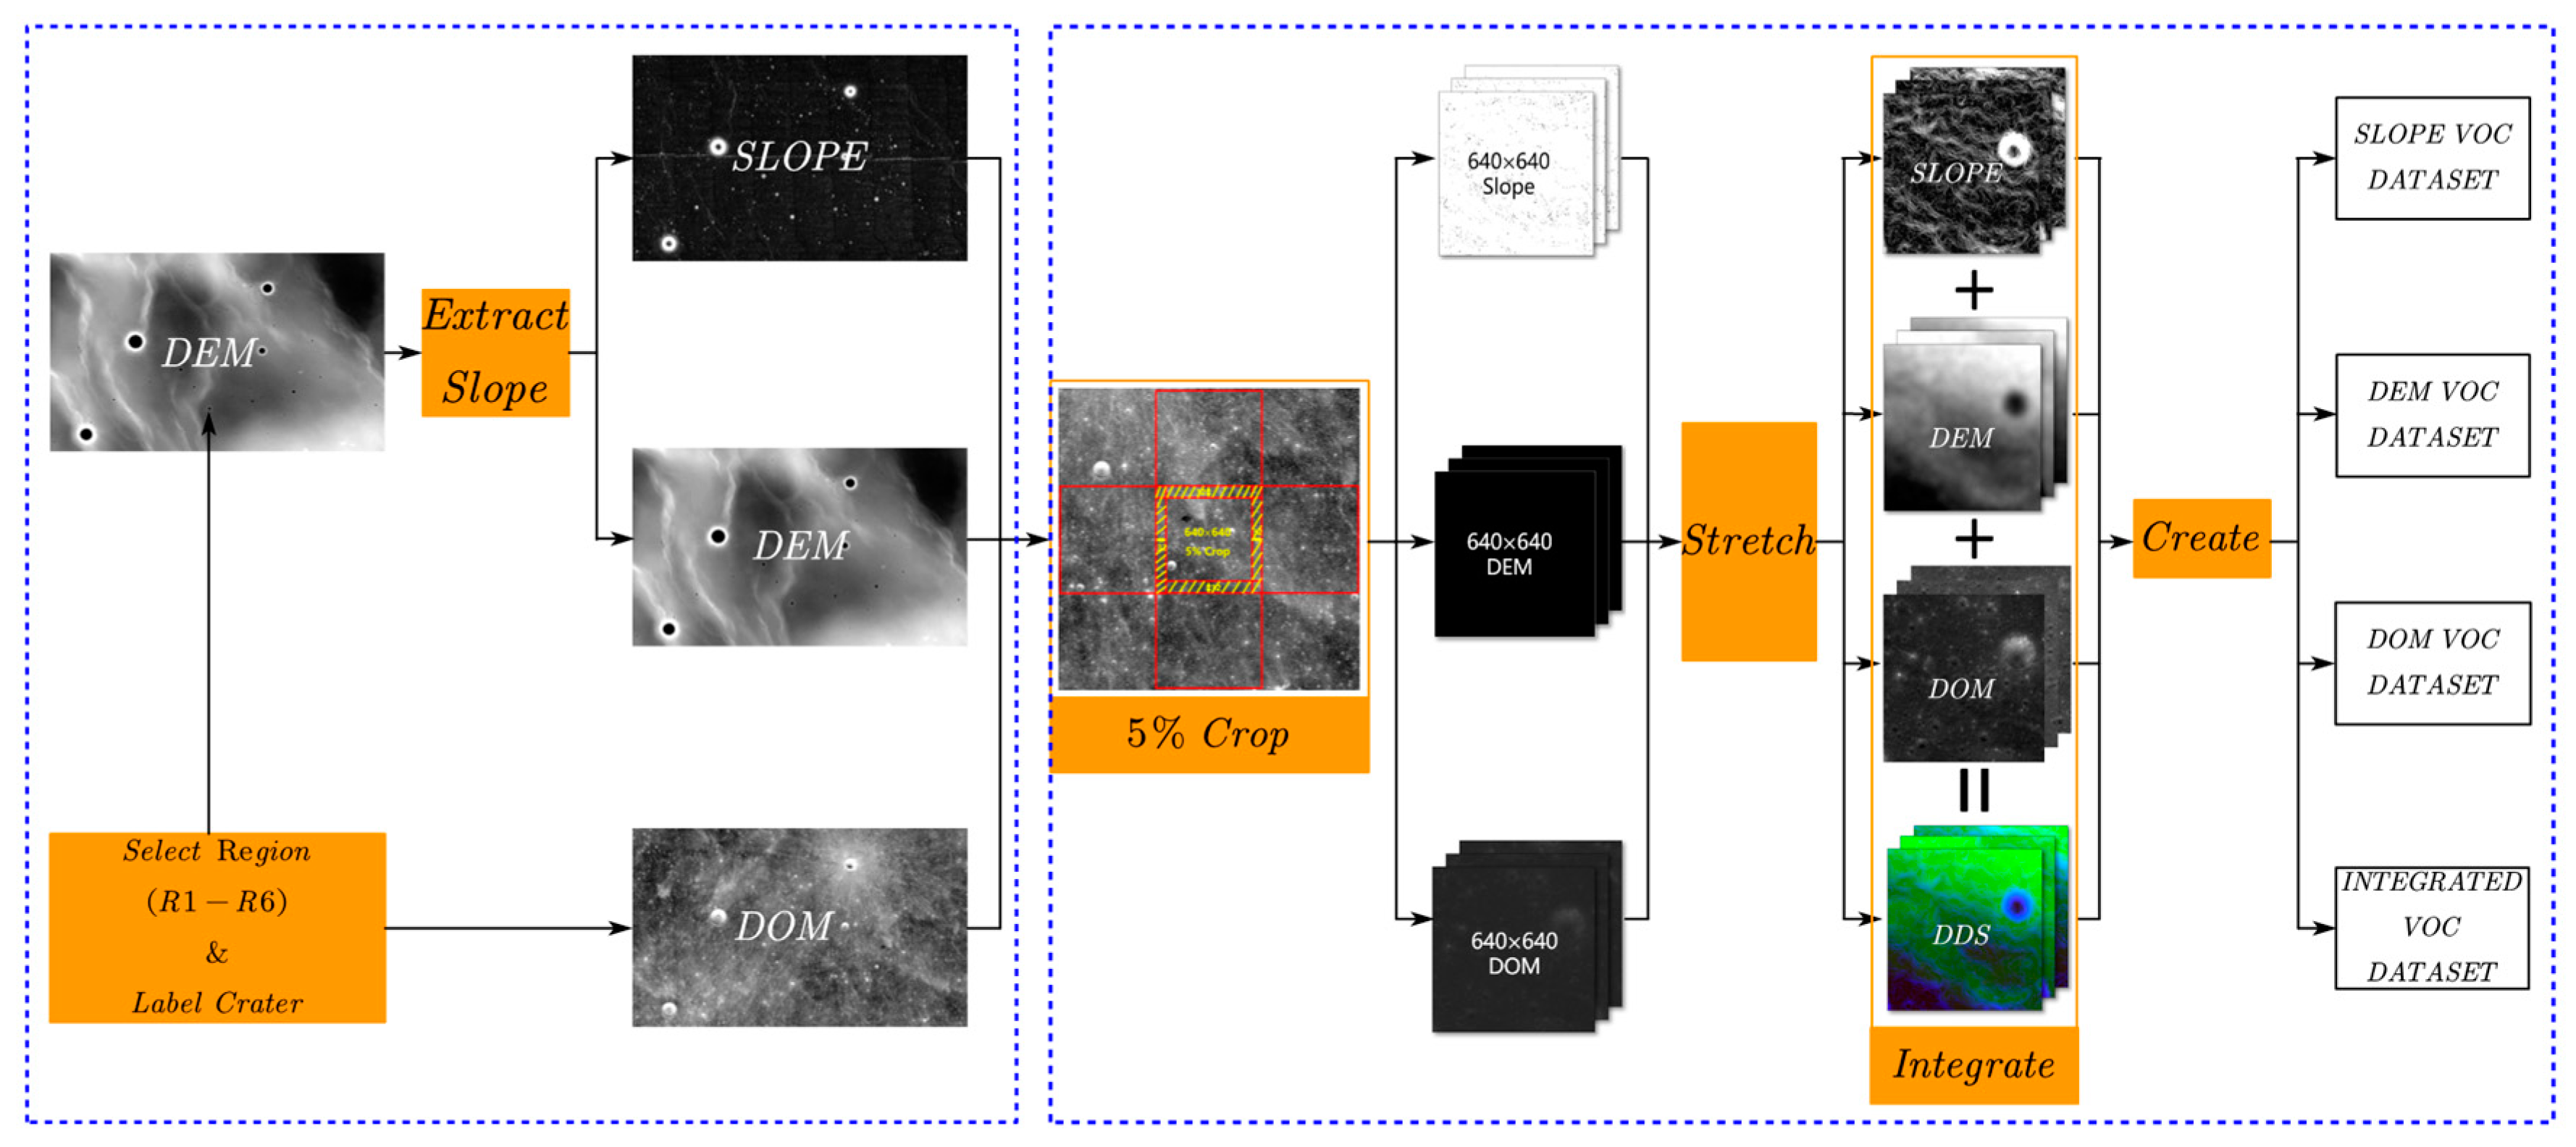
Figure 2.
Size-frequency distribution of the labelled craters.
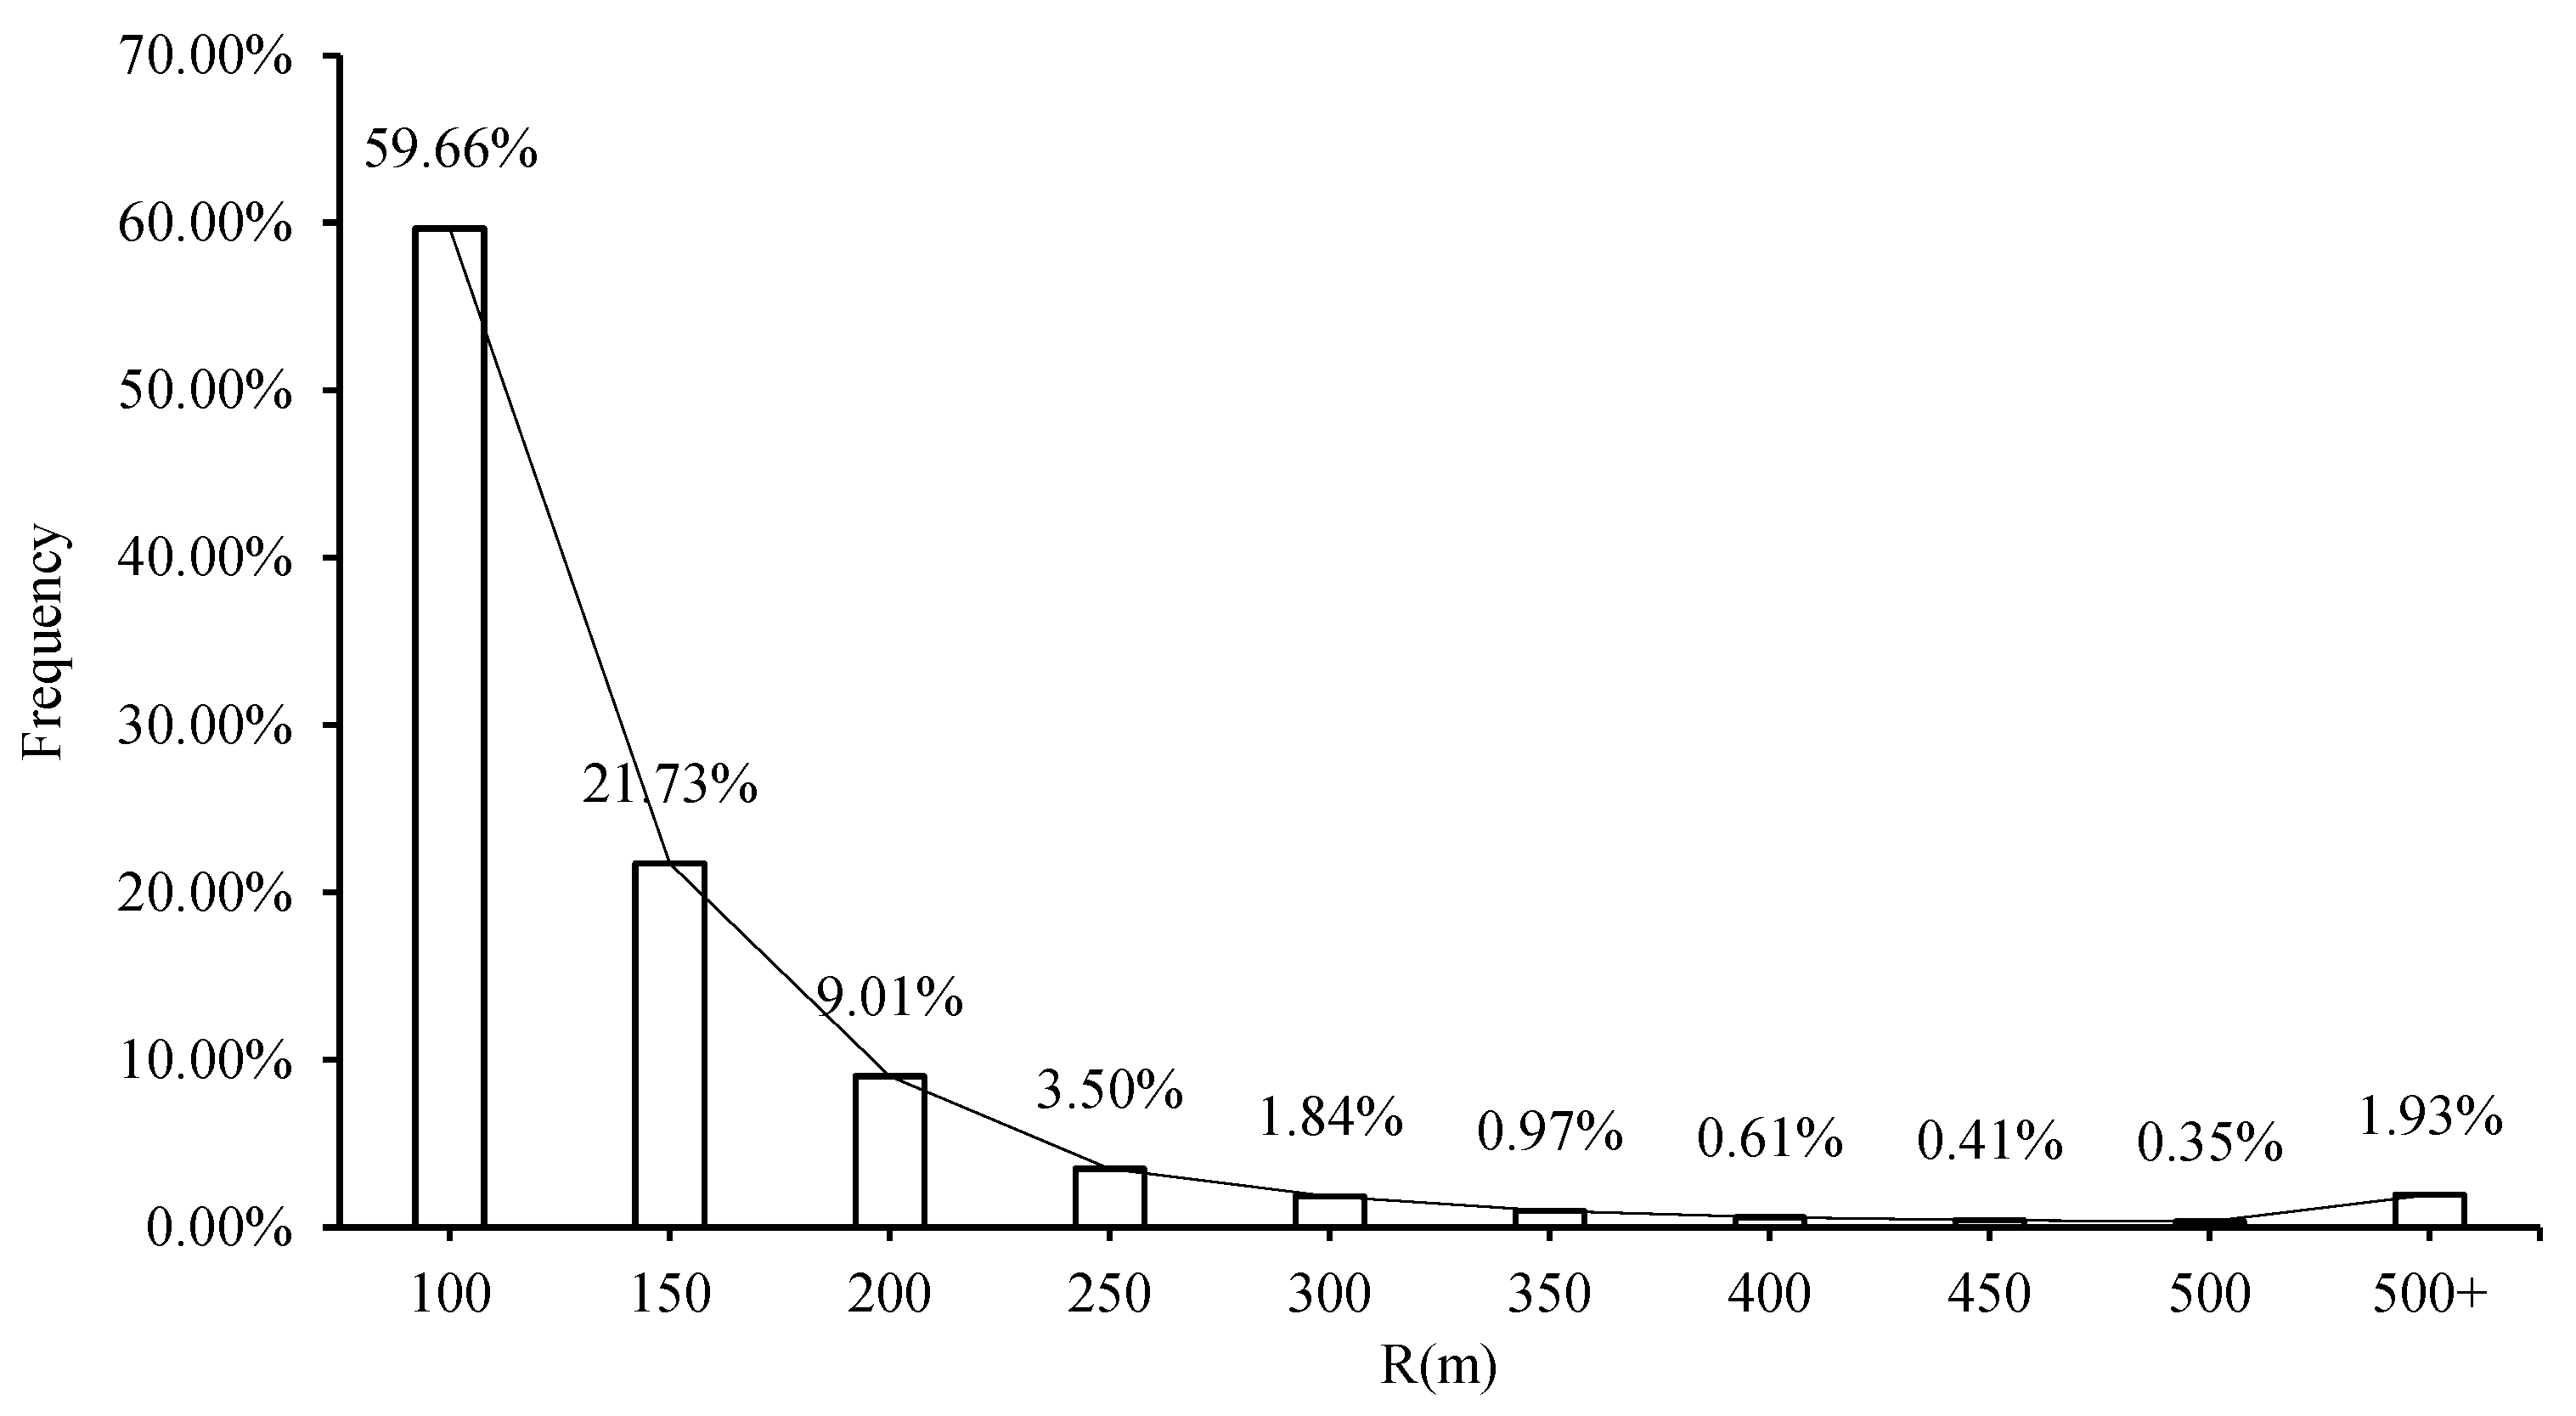
Figure 3.
The schematic representation of the Convolutional Block Attention Module (CBAM).
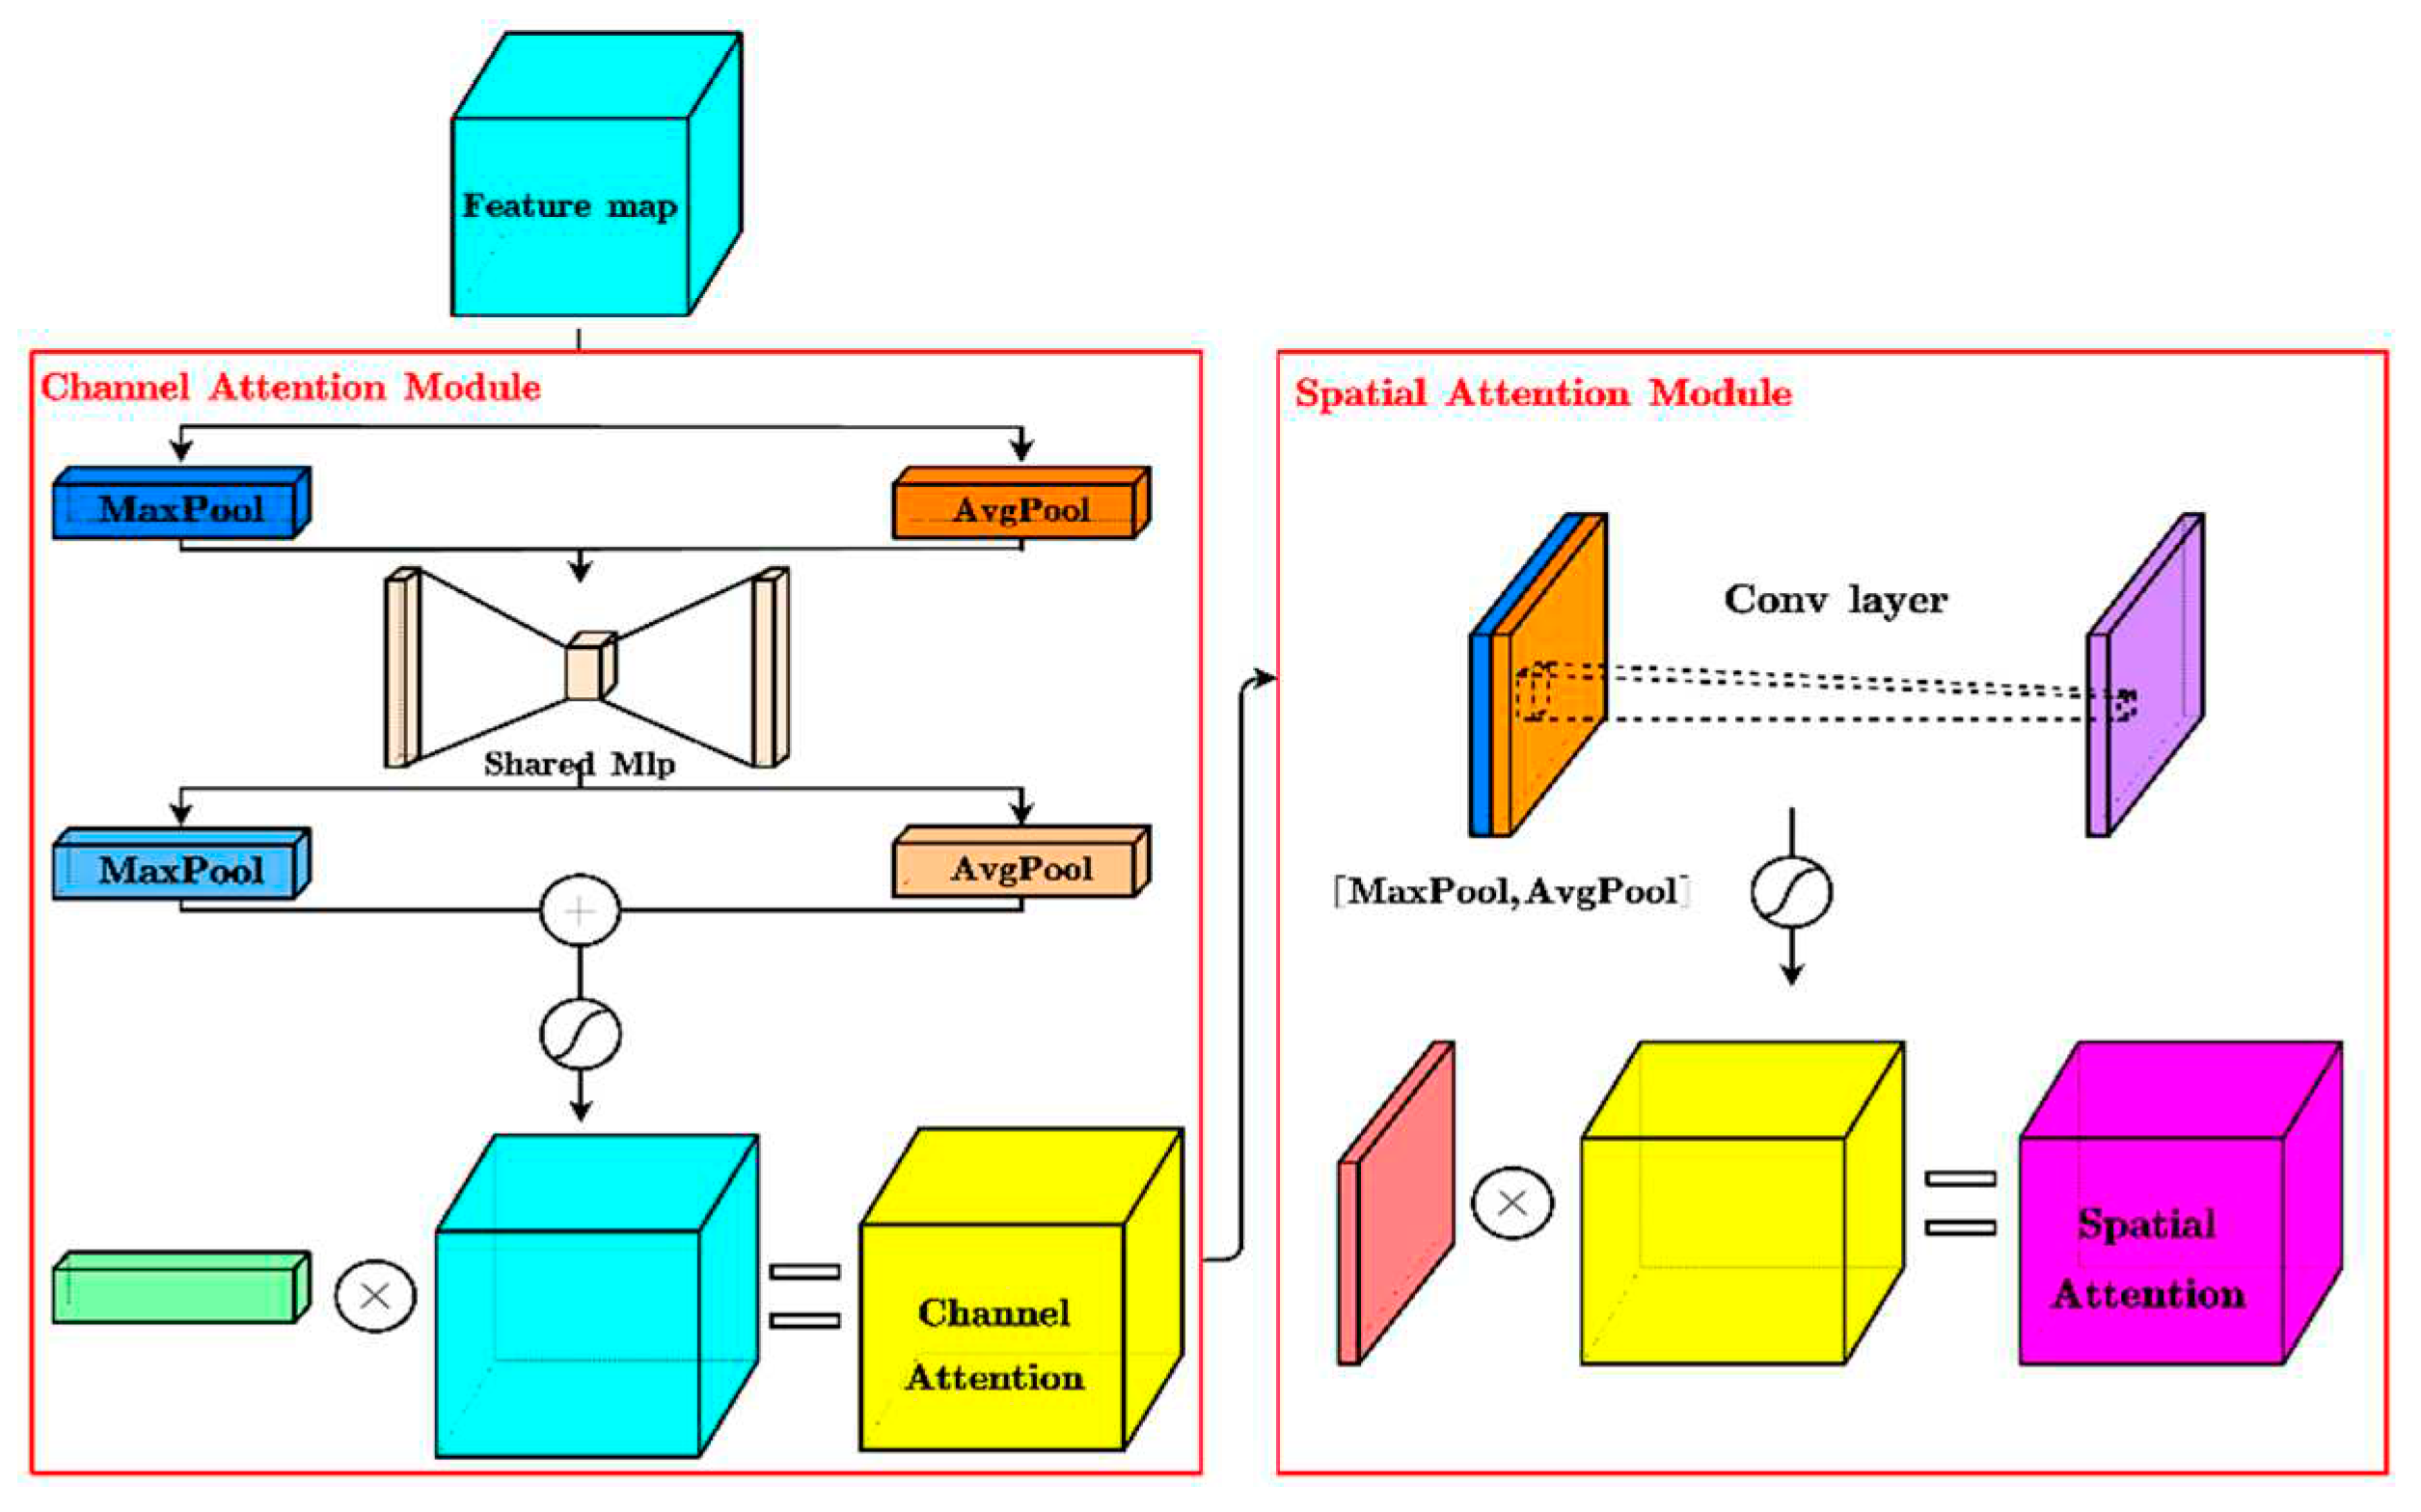
Figure 4.
The detection framework of YOLO-Crater.
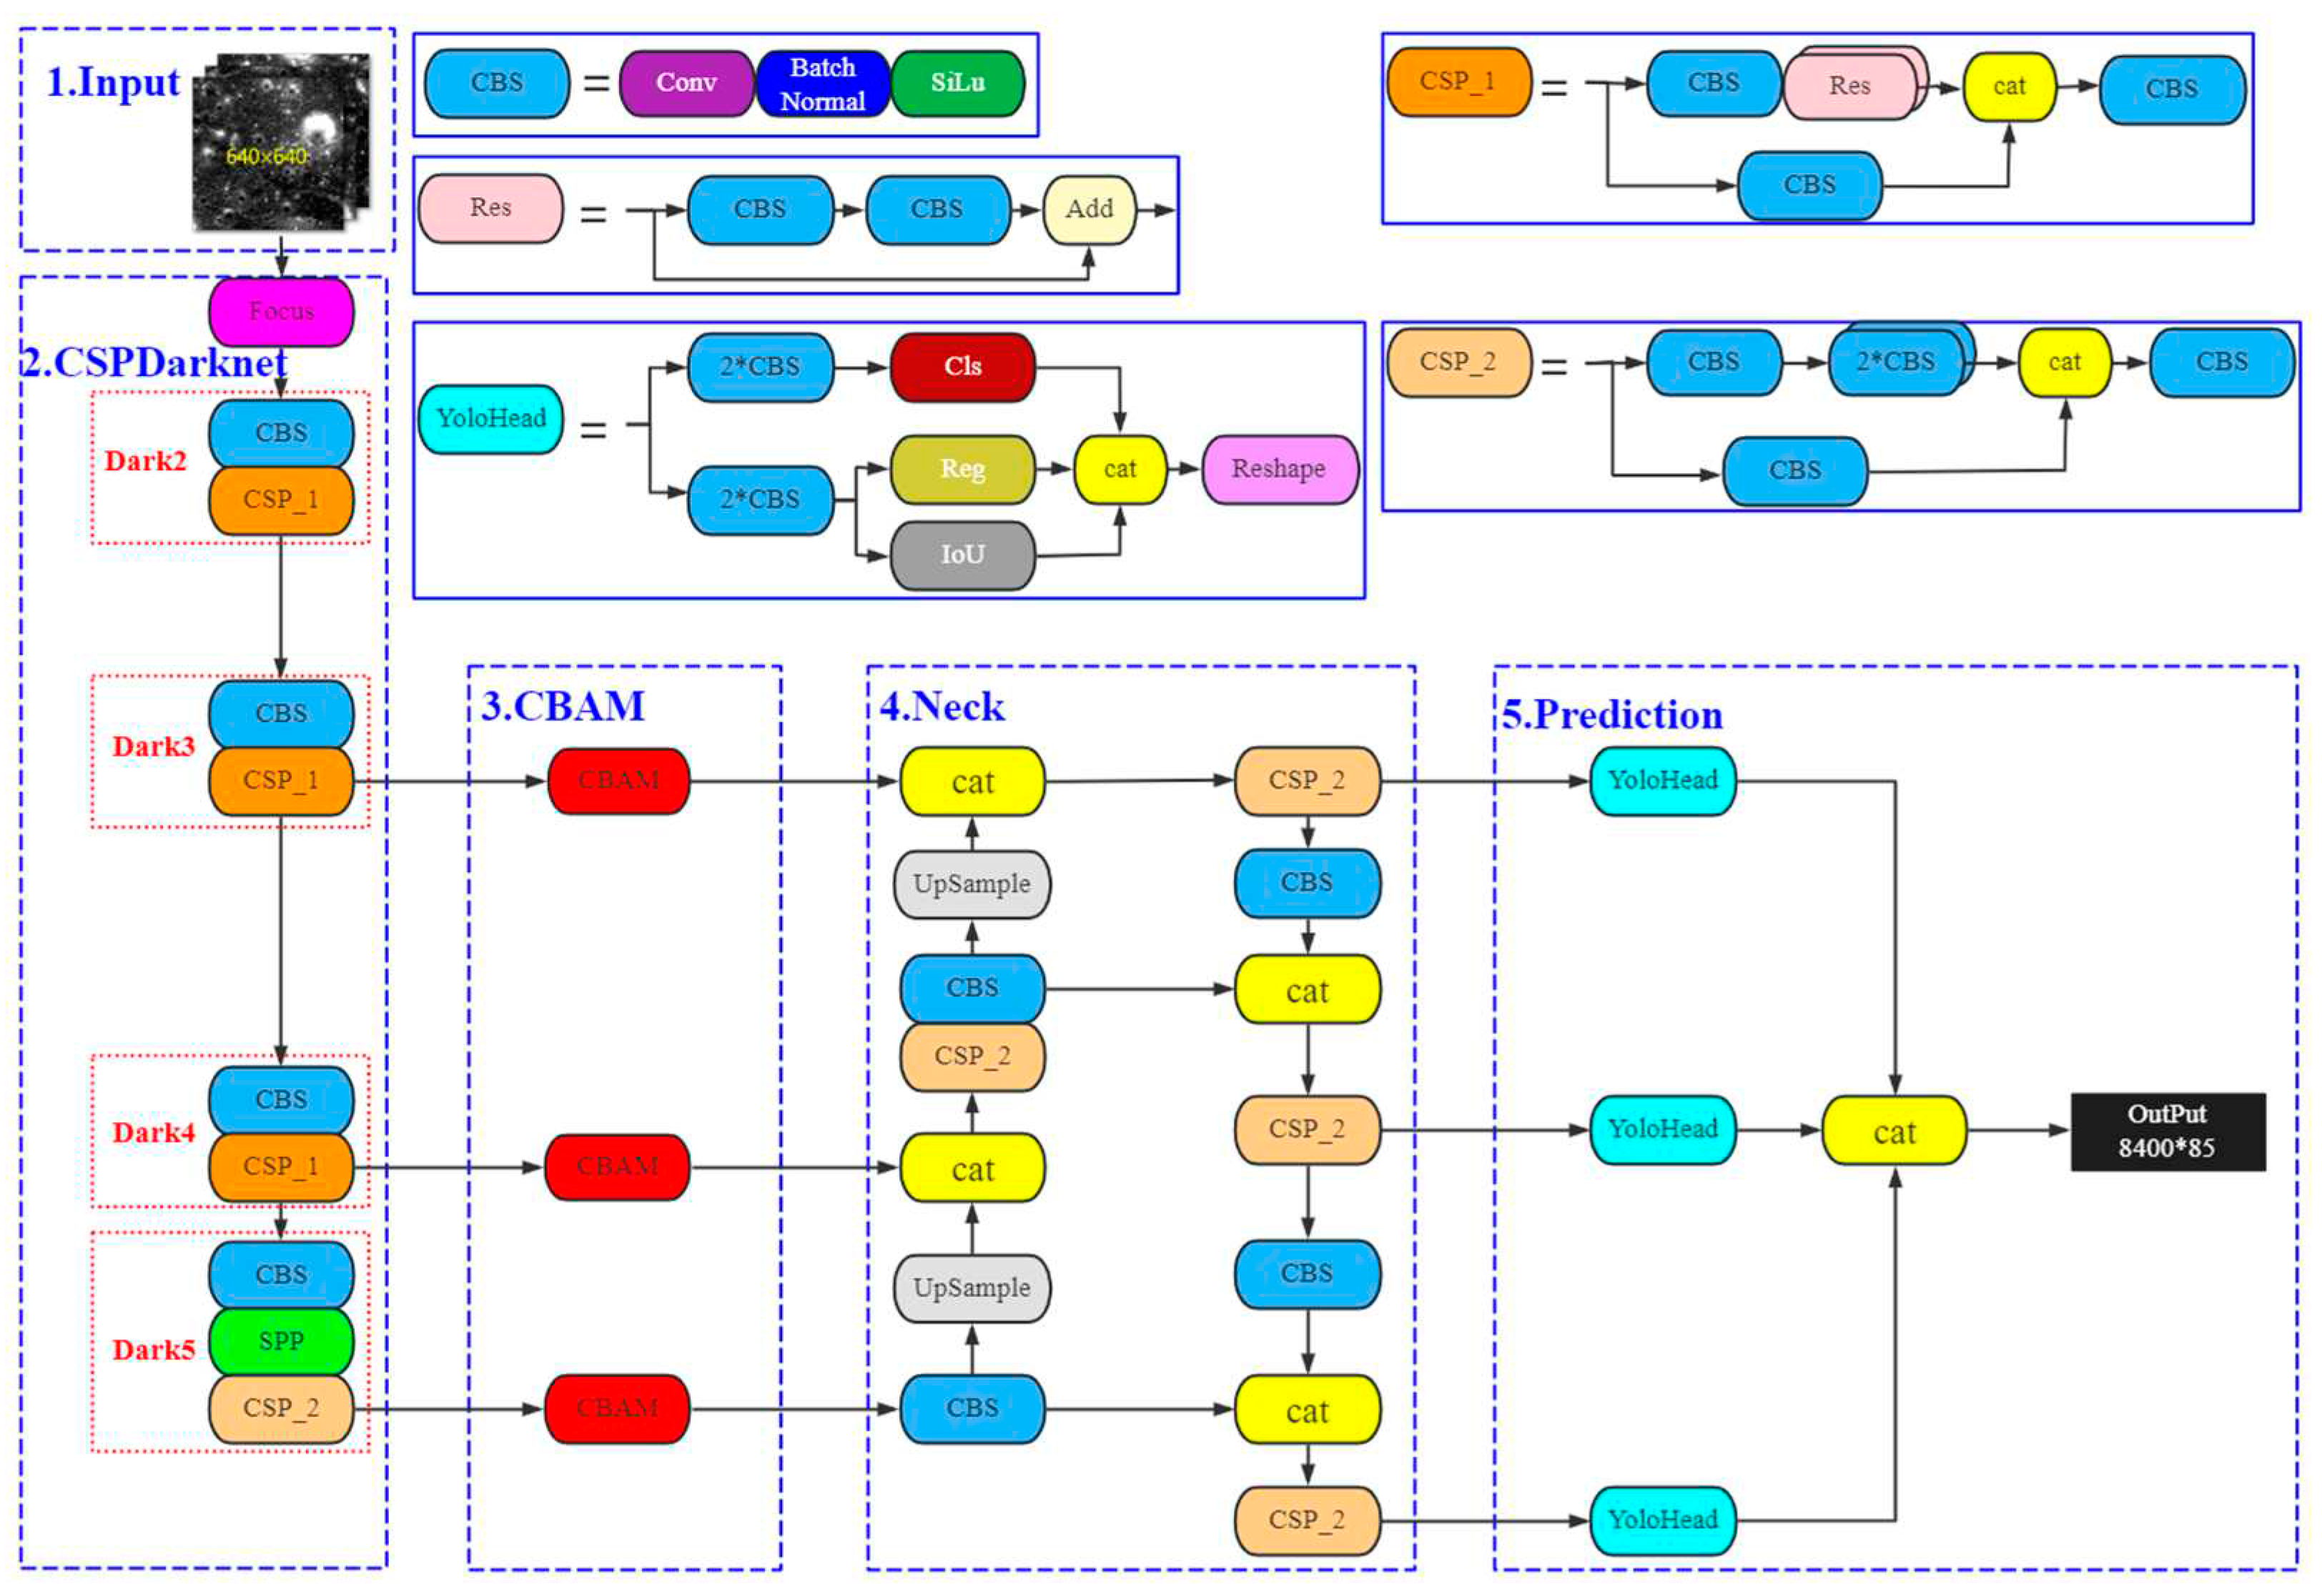
Figure 5.
Workflow of the model training and testing.
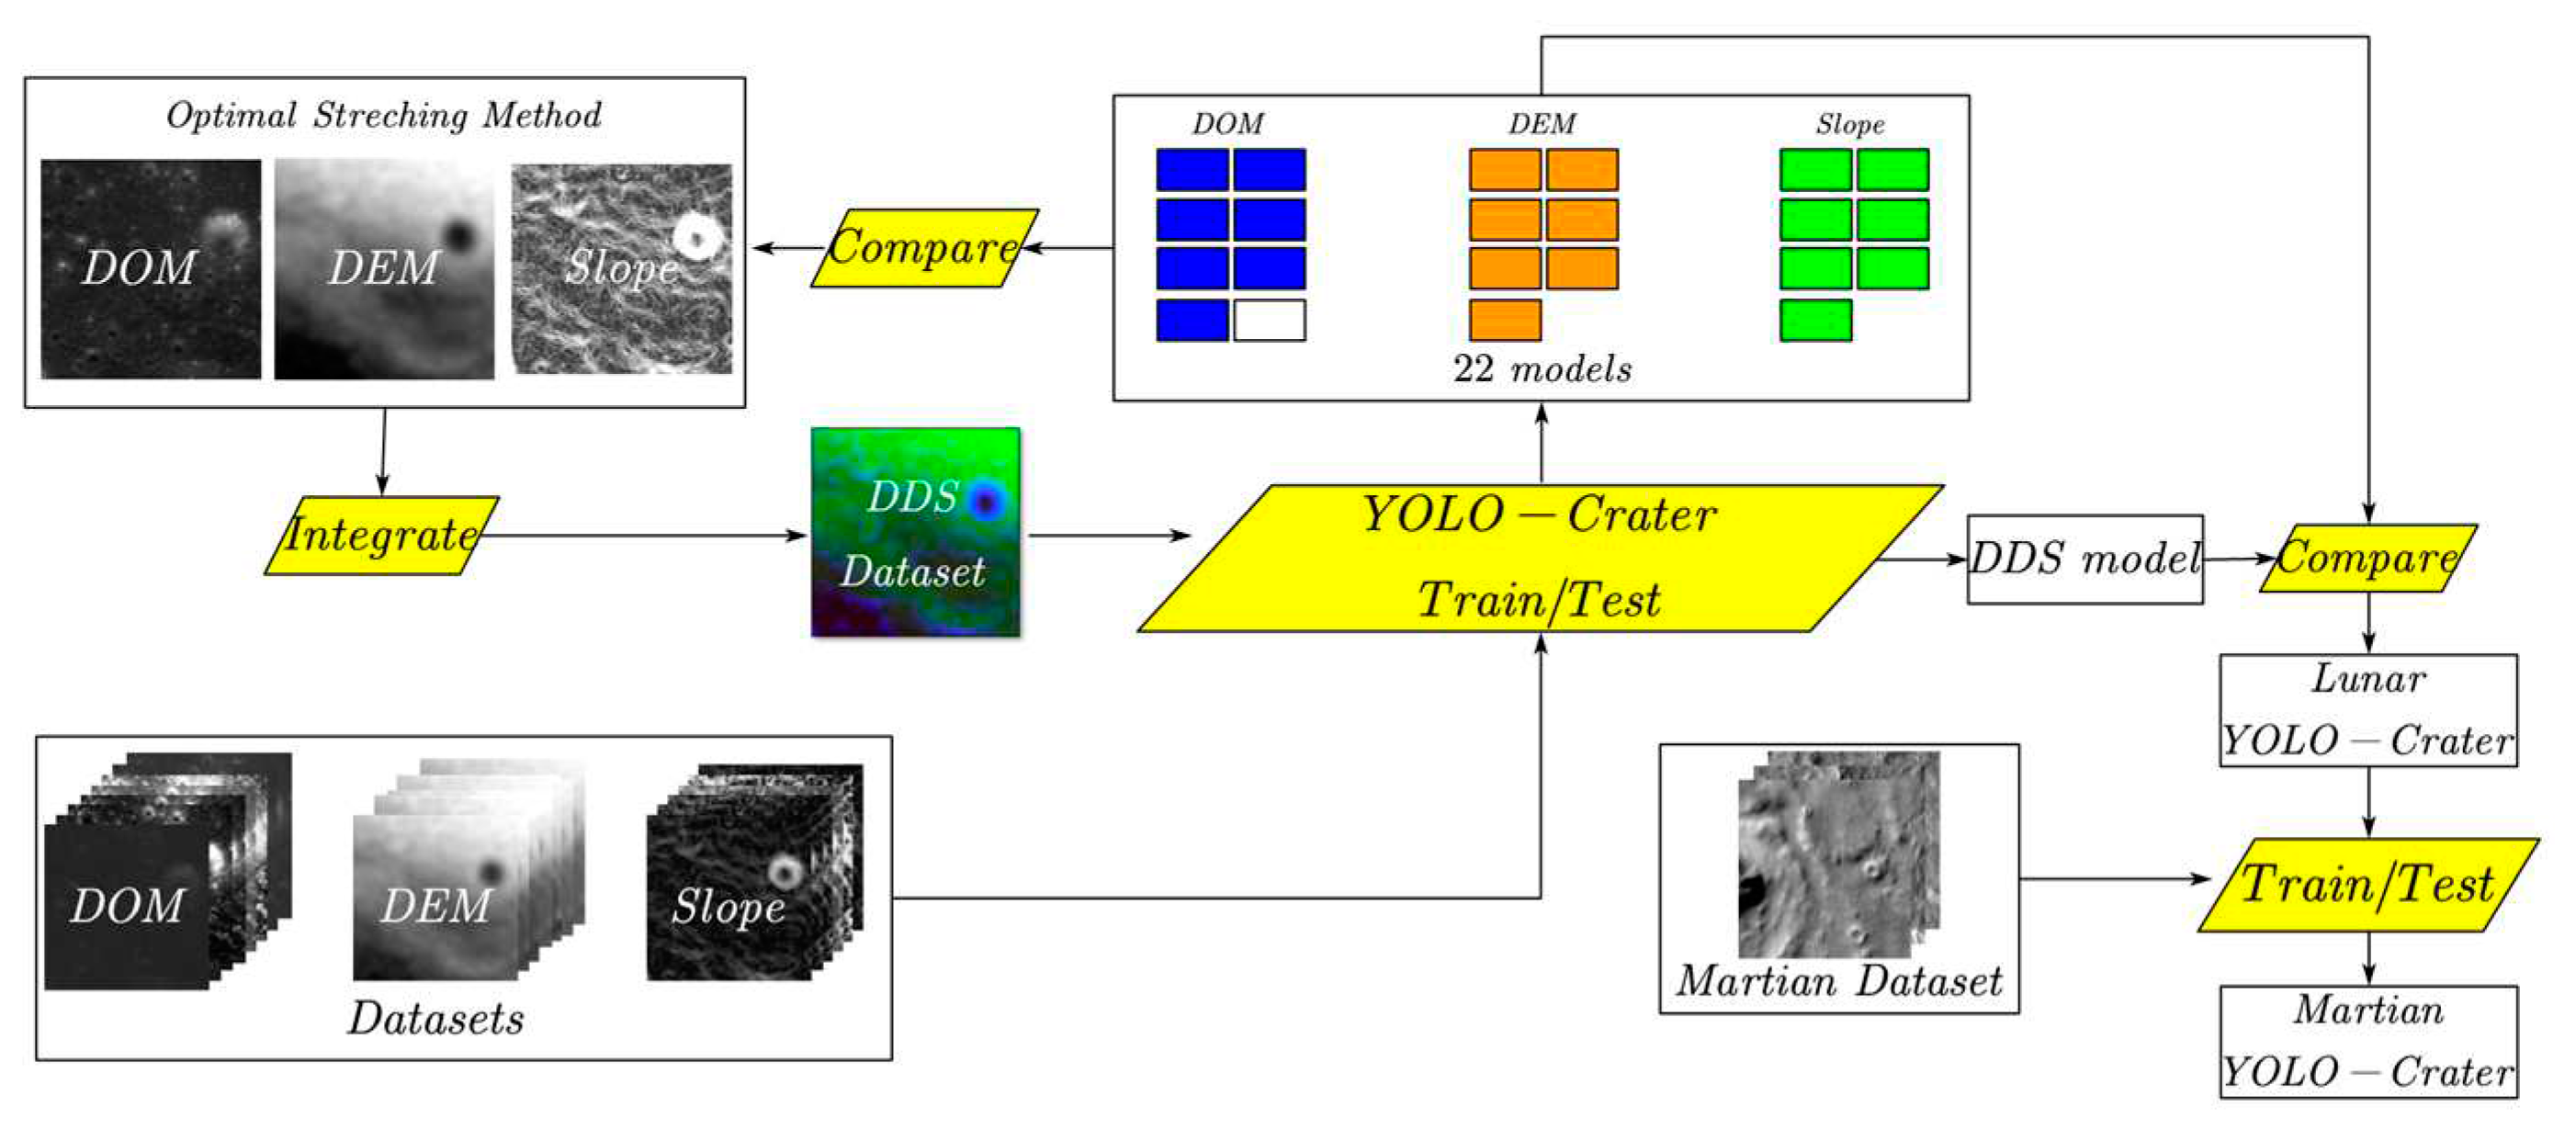
Figure 6.
F1 with different parameter combinations (,,).
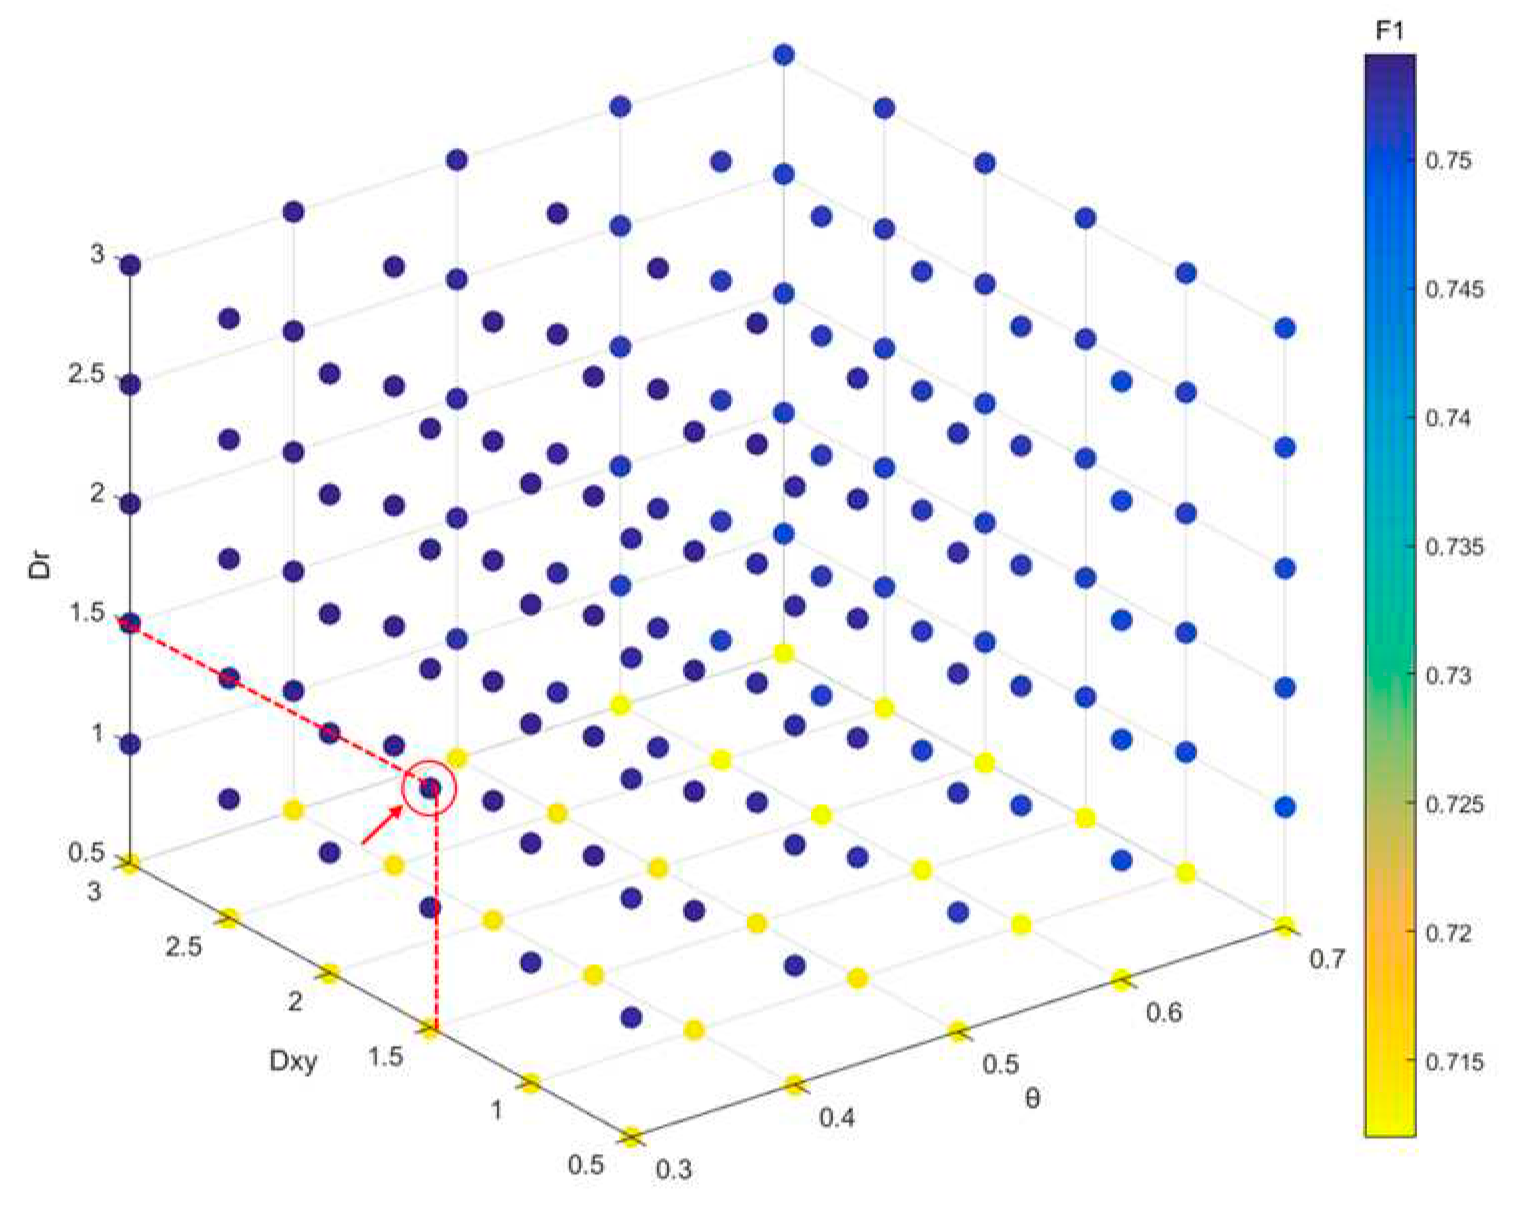
Figure 7.
Crater detection results with DOM-MMS (a) and DDS (b): Red for correct detection, black for missed detection.
Figure 7.
Crater detection results with DOM-MMS (a) and DDS (b): Red for correct detection, black for missed detection.
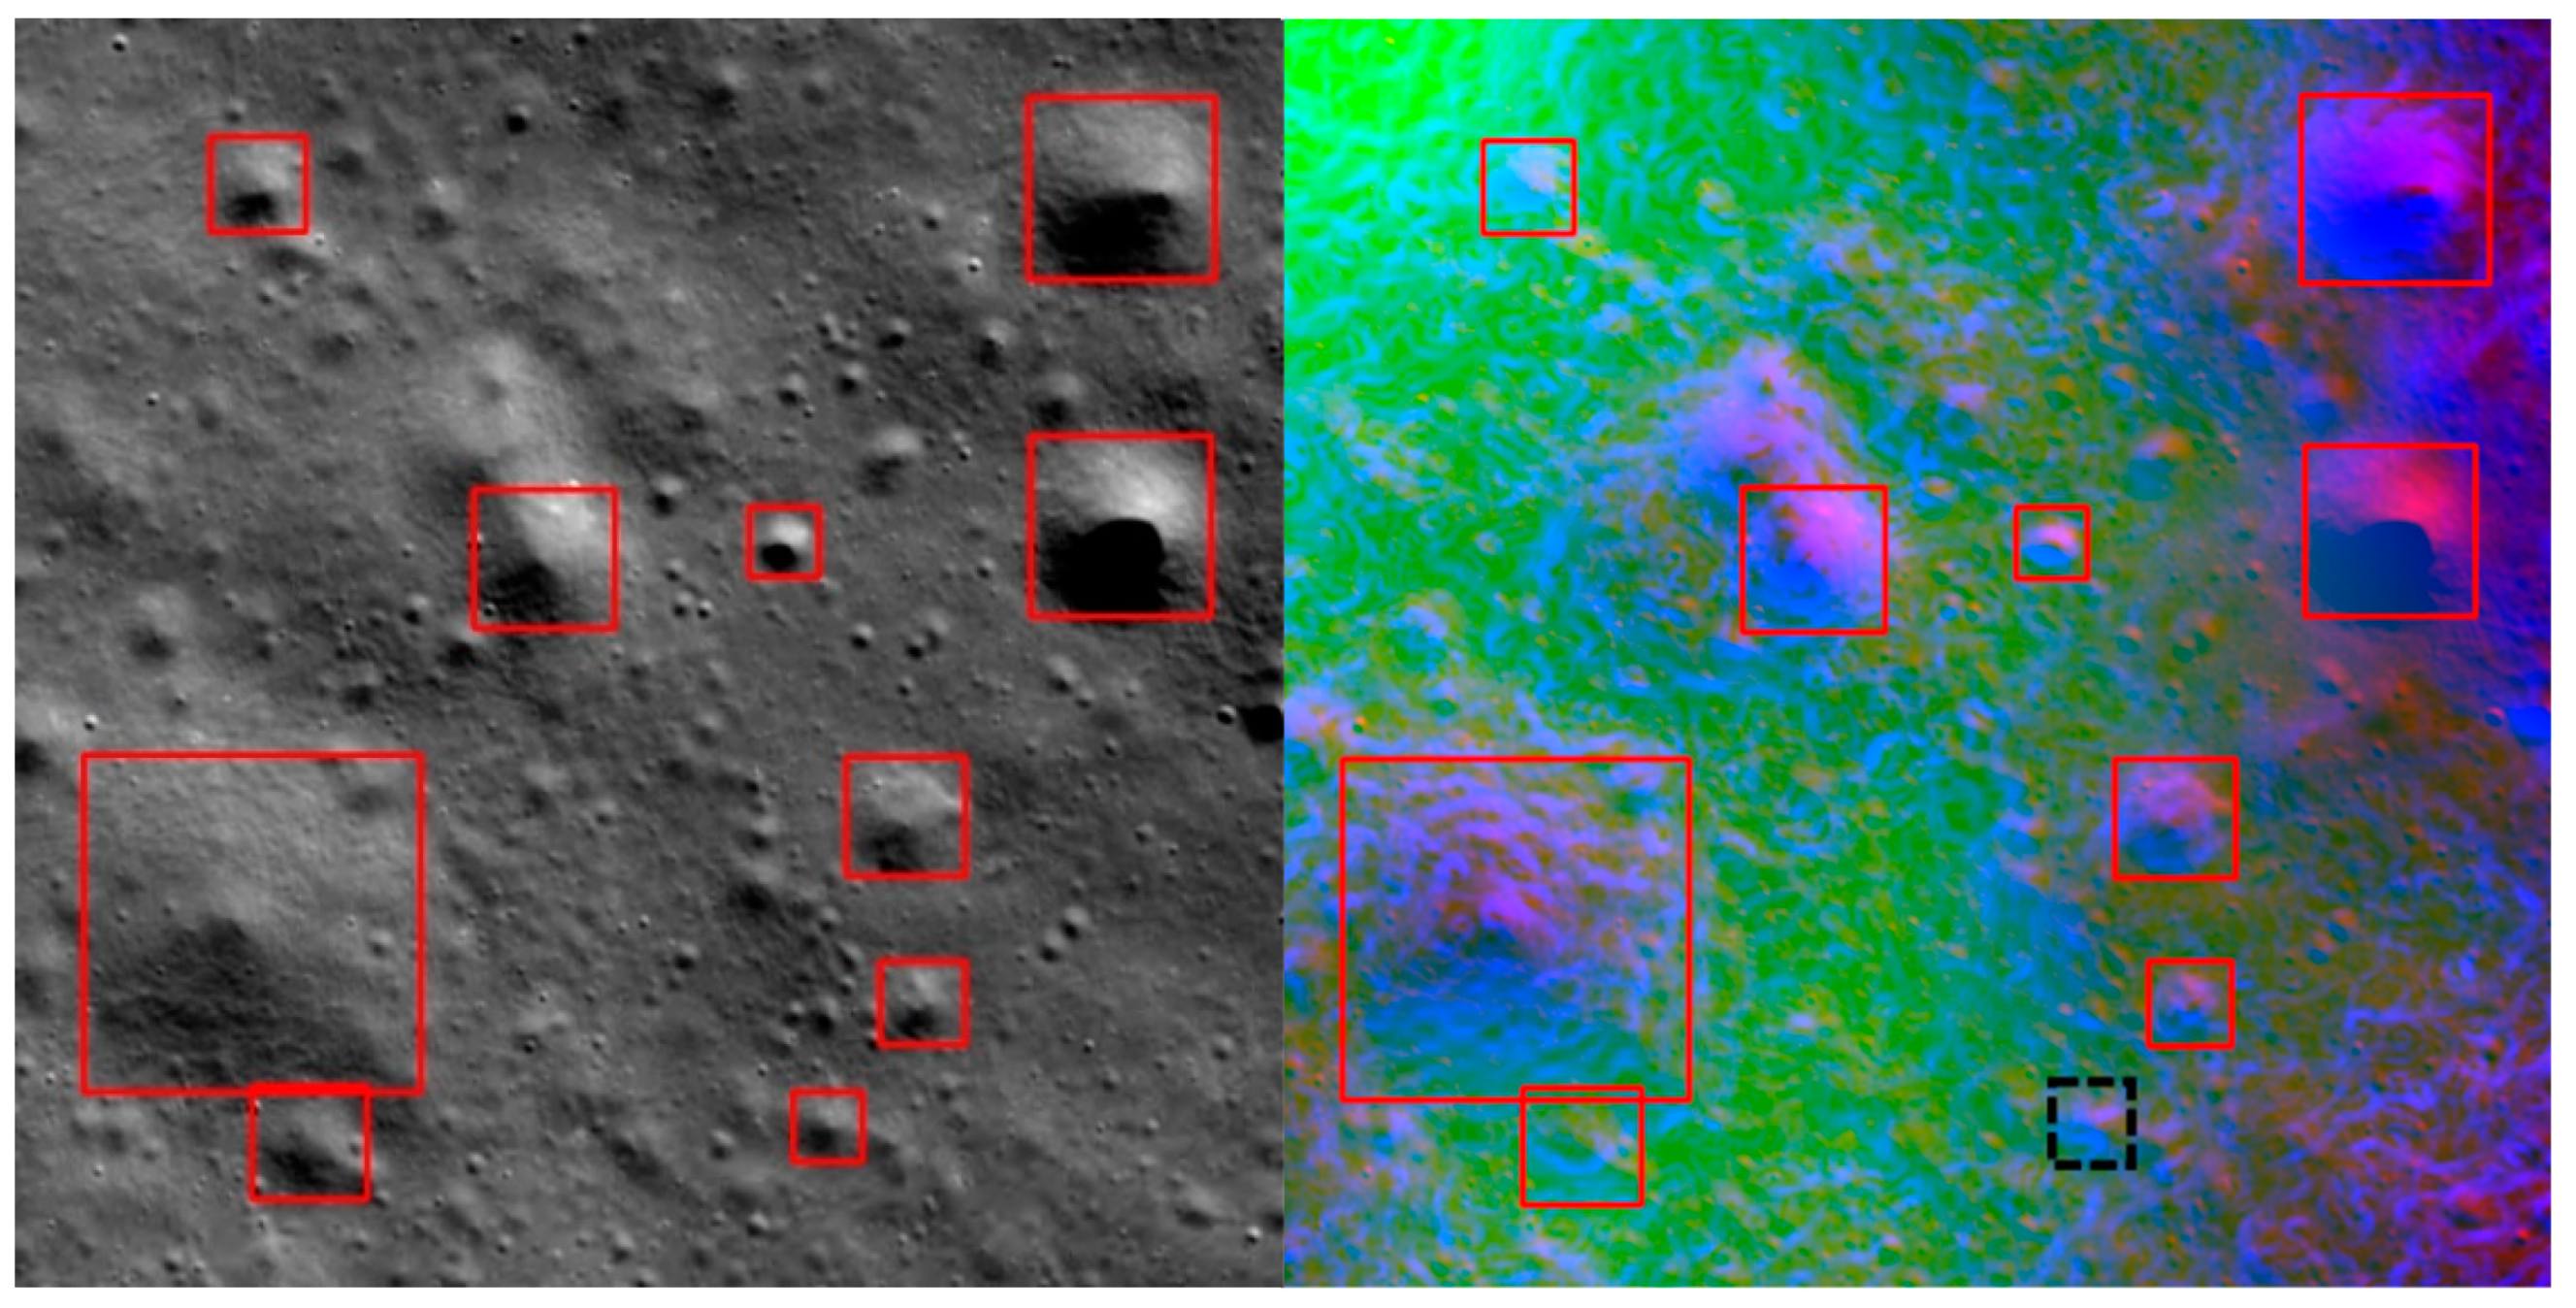
Figure 8.
Craters showed in different datasets: (a) DOM-MMS; (b) DEM-1% LTS; (c) Slope-SDS.
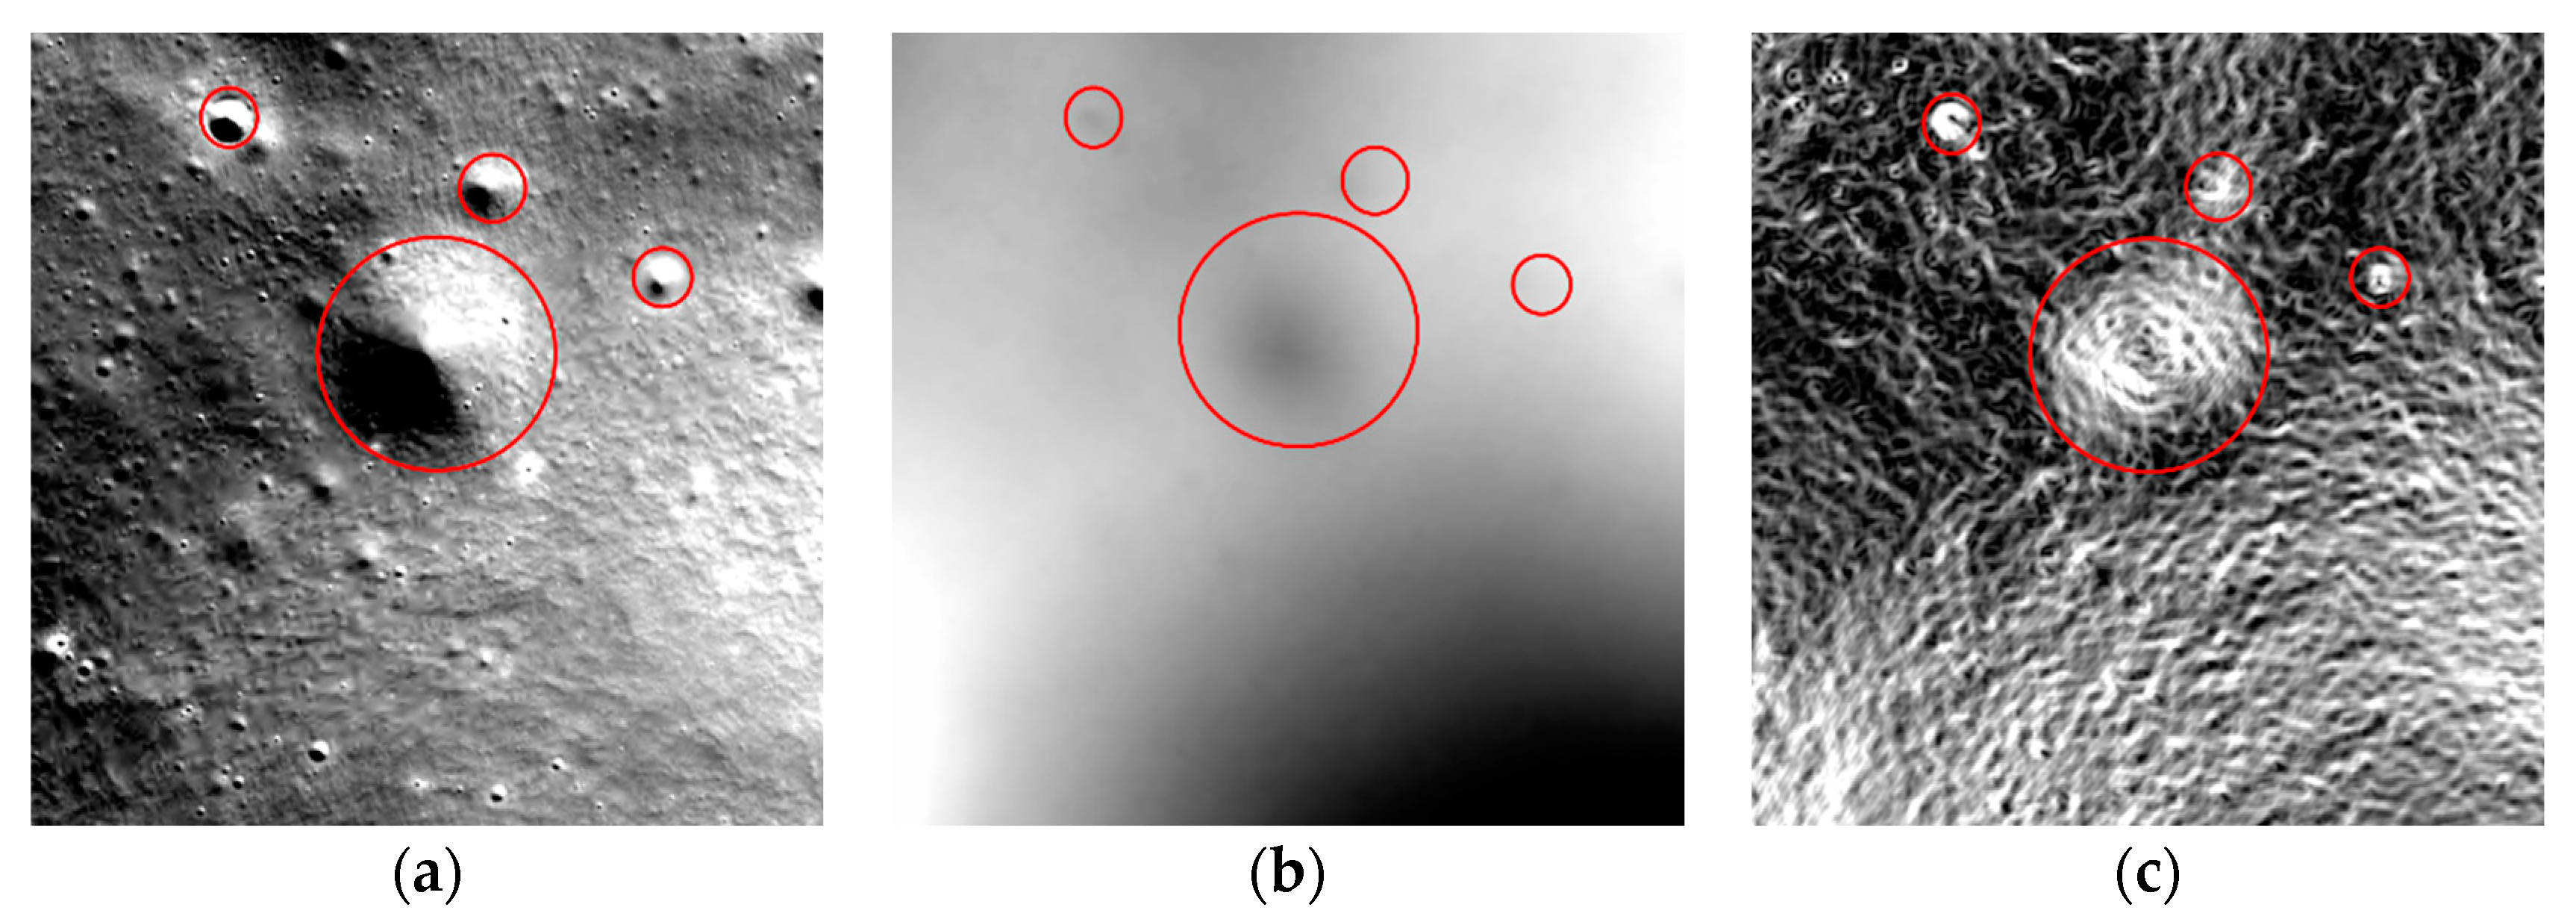
Figure 9.
Distribution of craters detected by the Lunar YOLO-Crater in Maria (a) and Highland (b): Green for correct detection, red for false detection, and blue for missed detection.
Figure 9.
Distribution of craters detected by the Lunar YOLO-Crater in Maria (a) and Highland (b): Green for correct detection, red for false detection, and blue for missed detection.
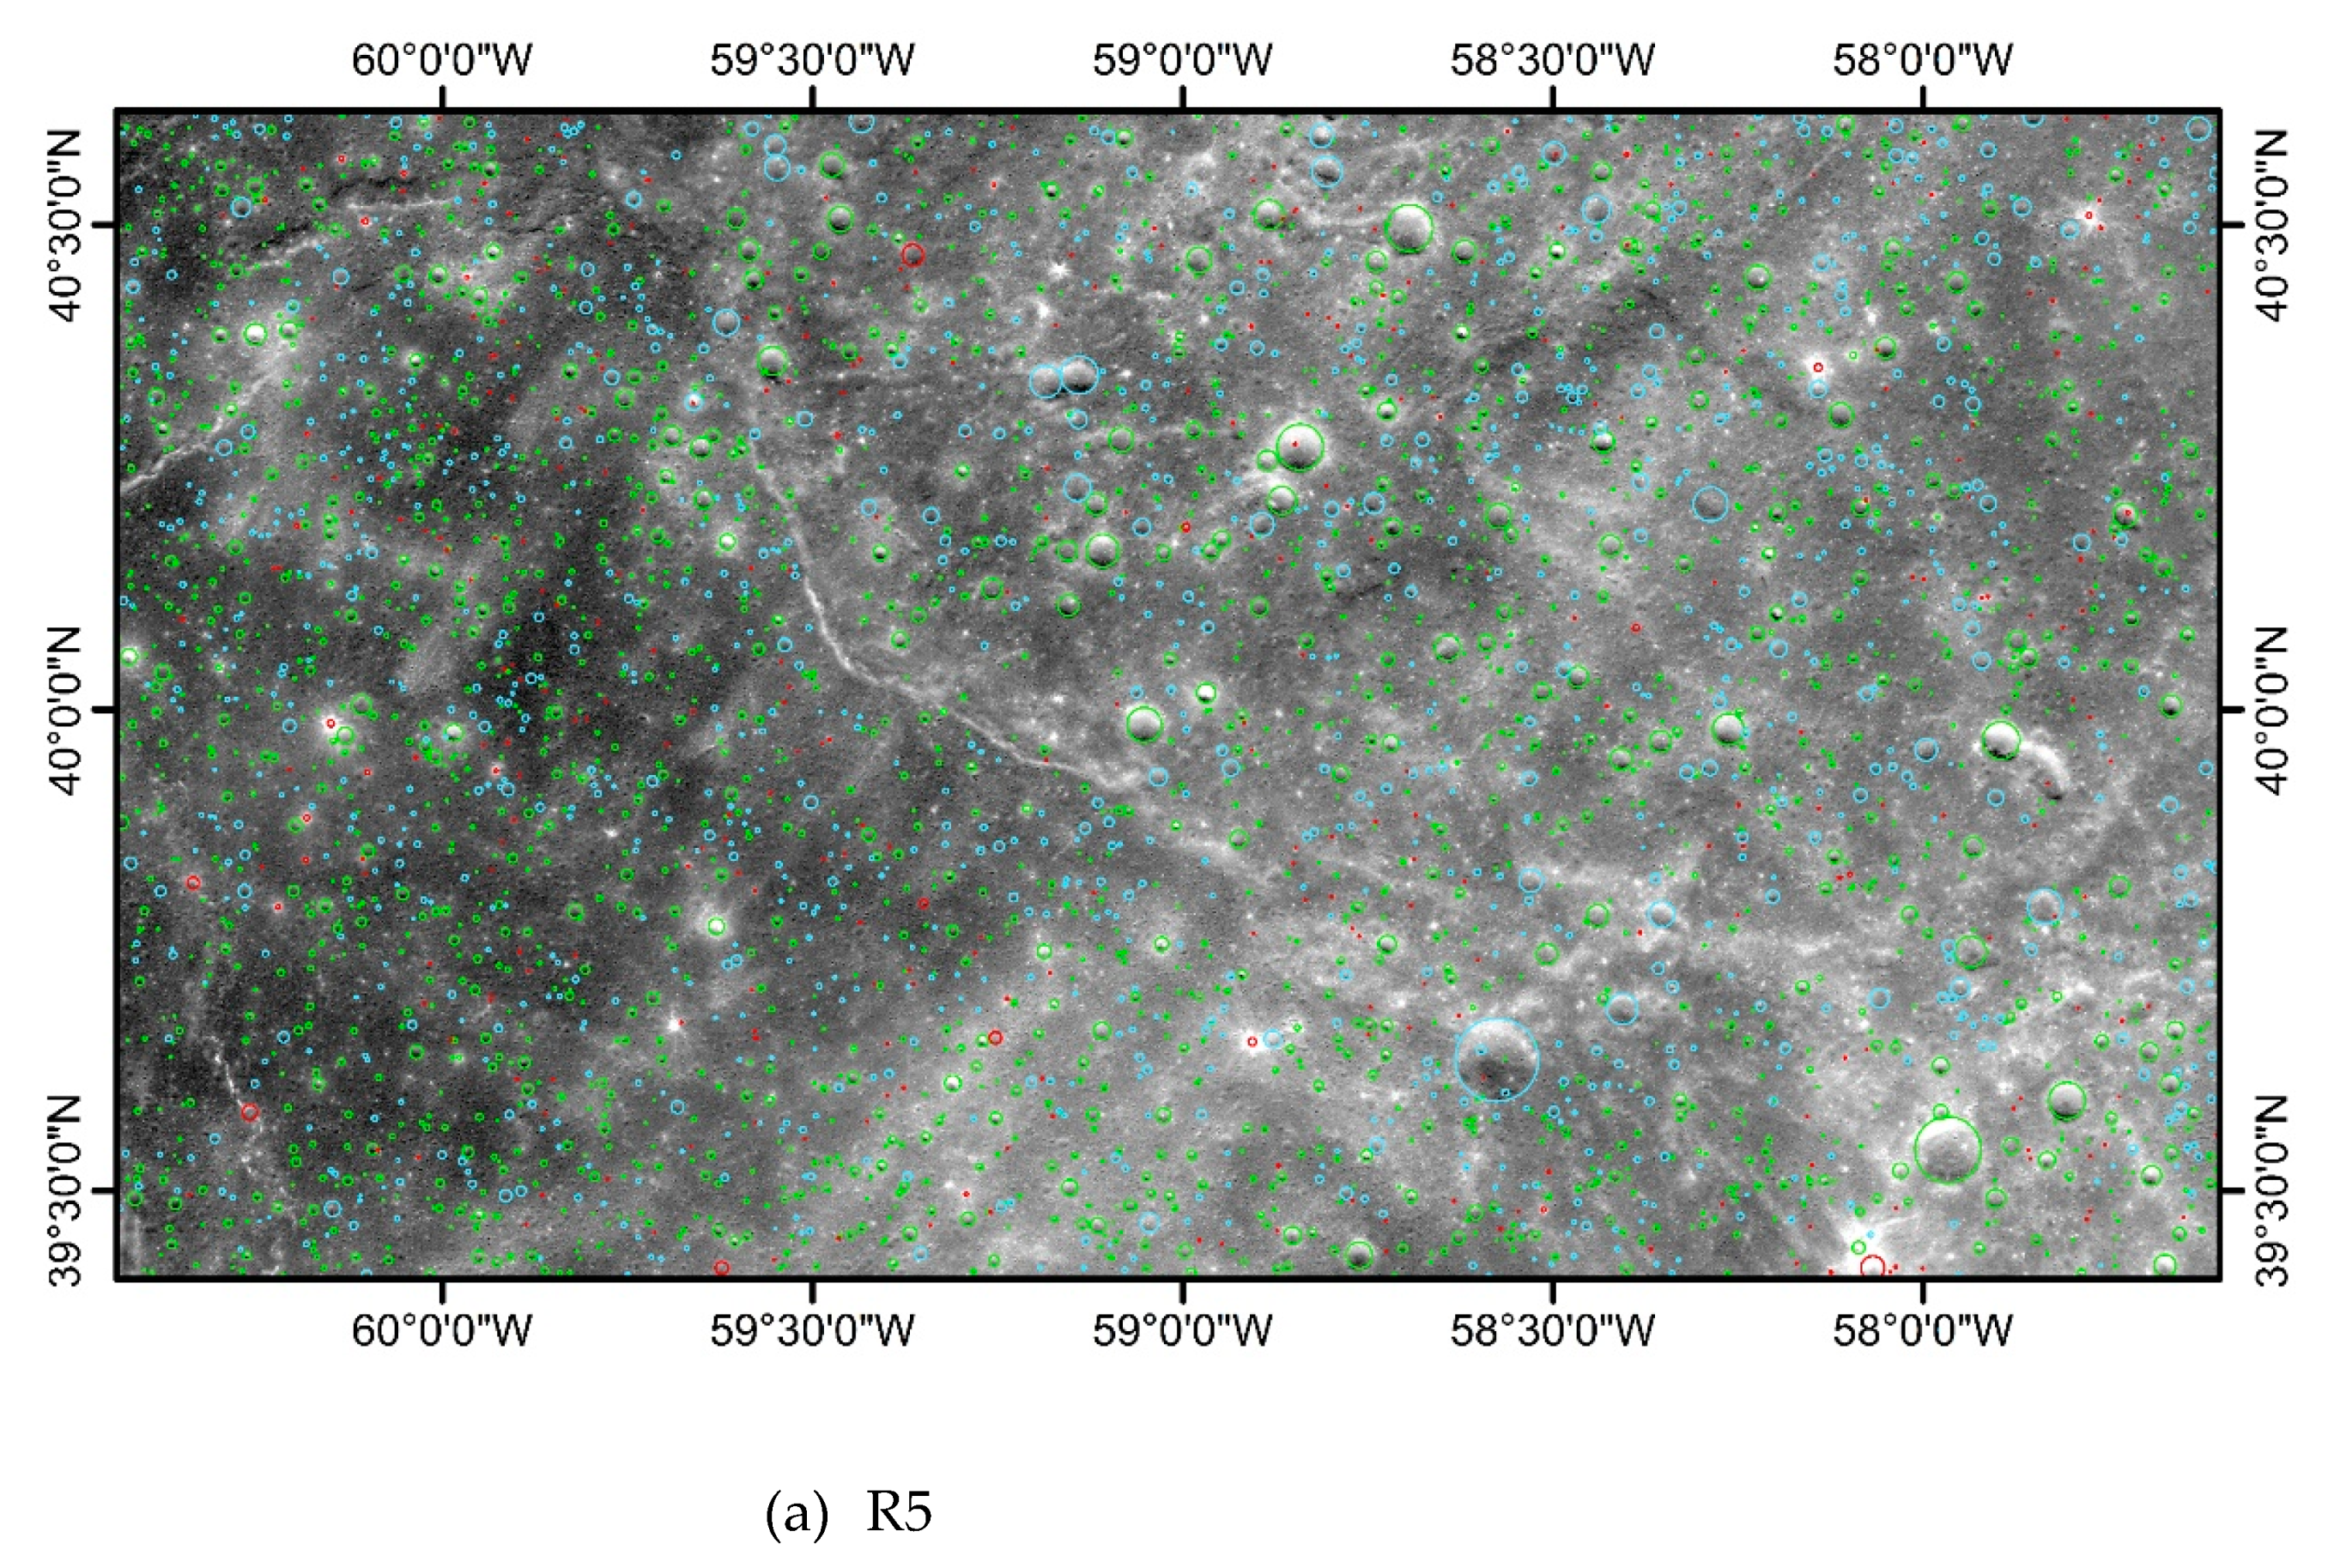
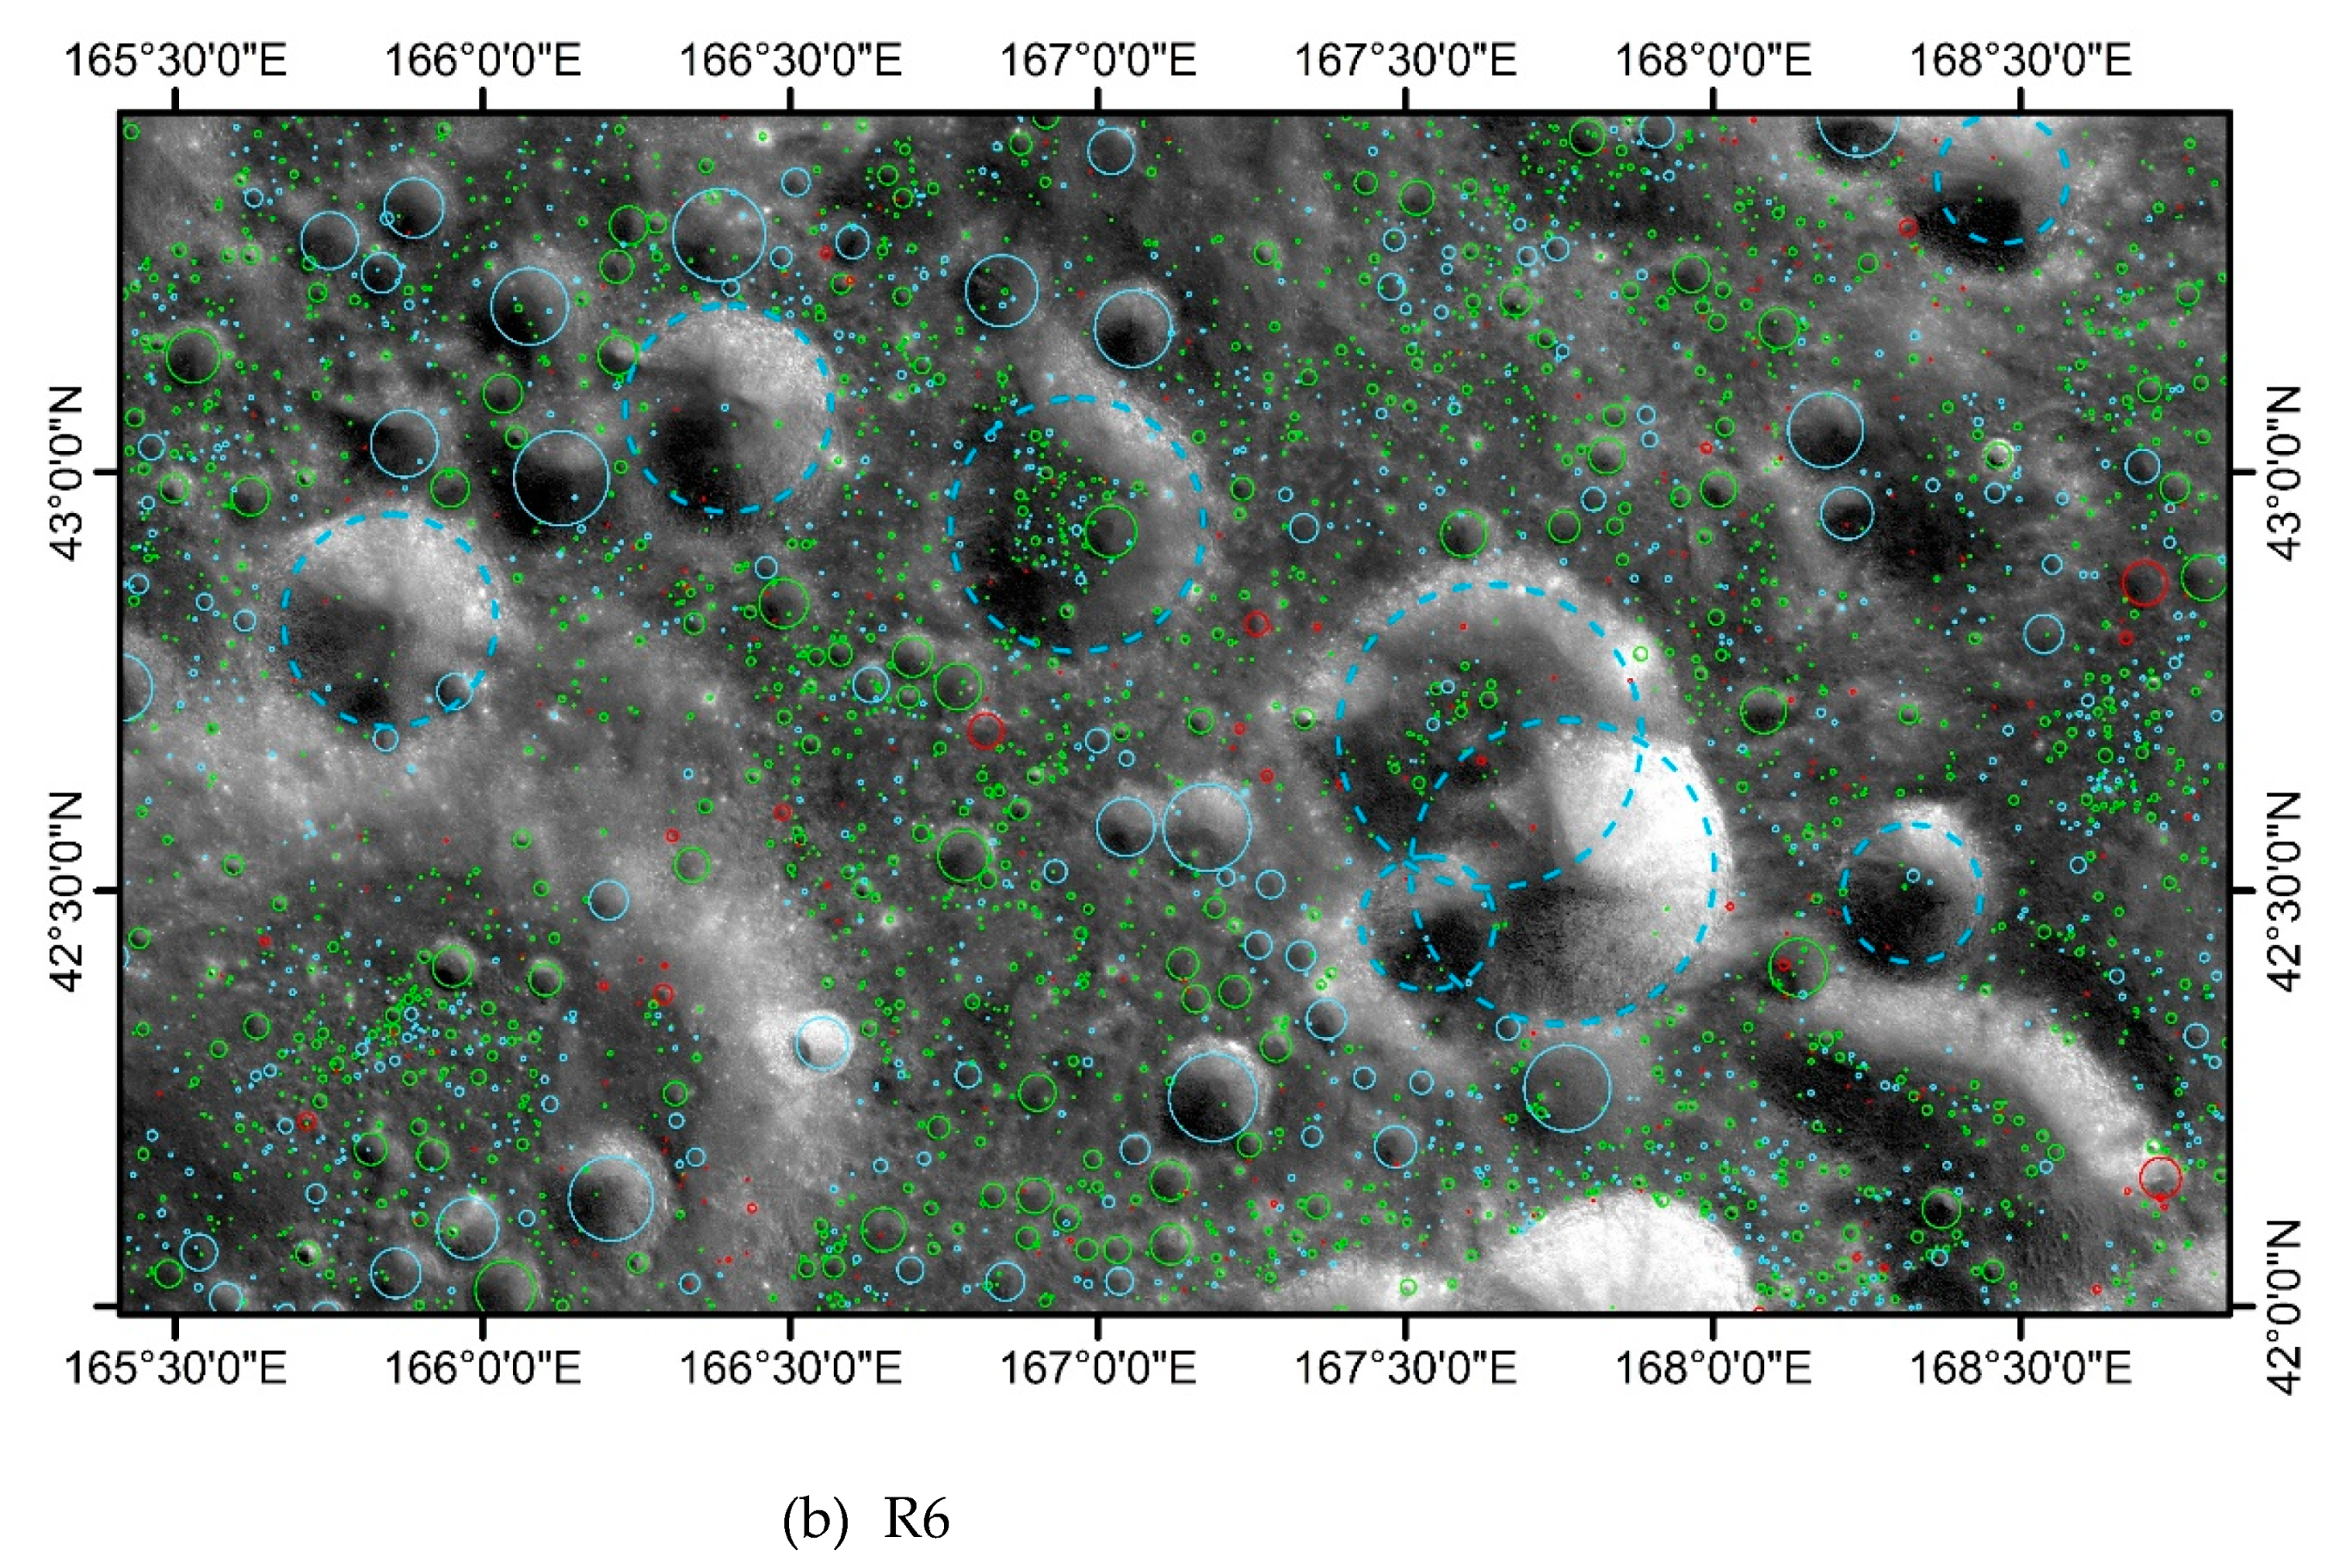
Figure 10.
Detecting accuracy at different scales in Maria (a) and Highland (b).
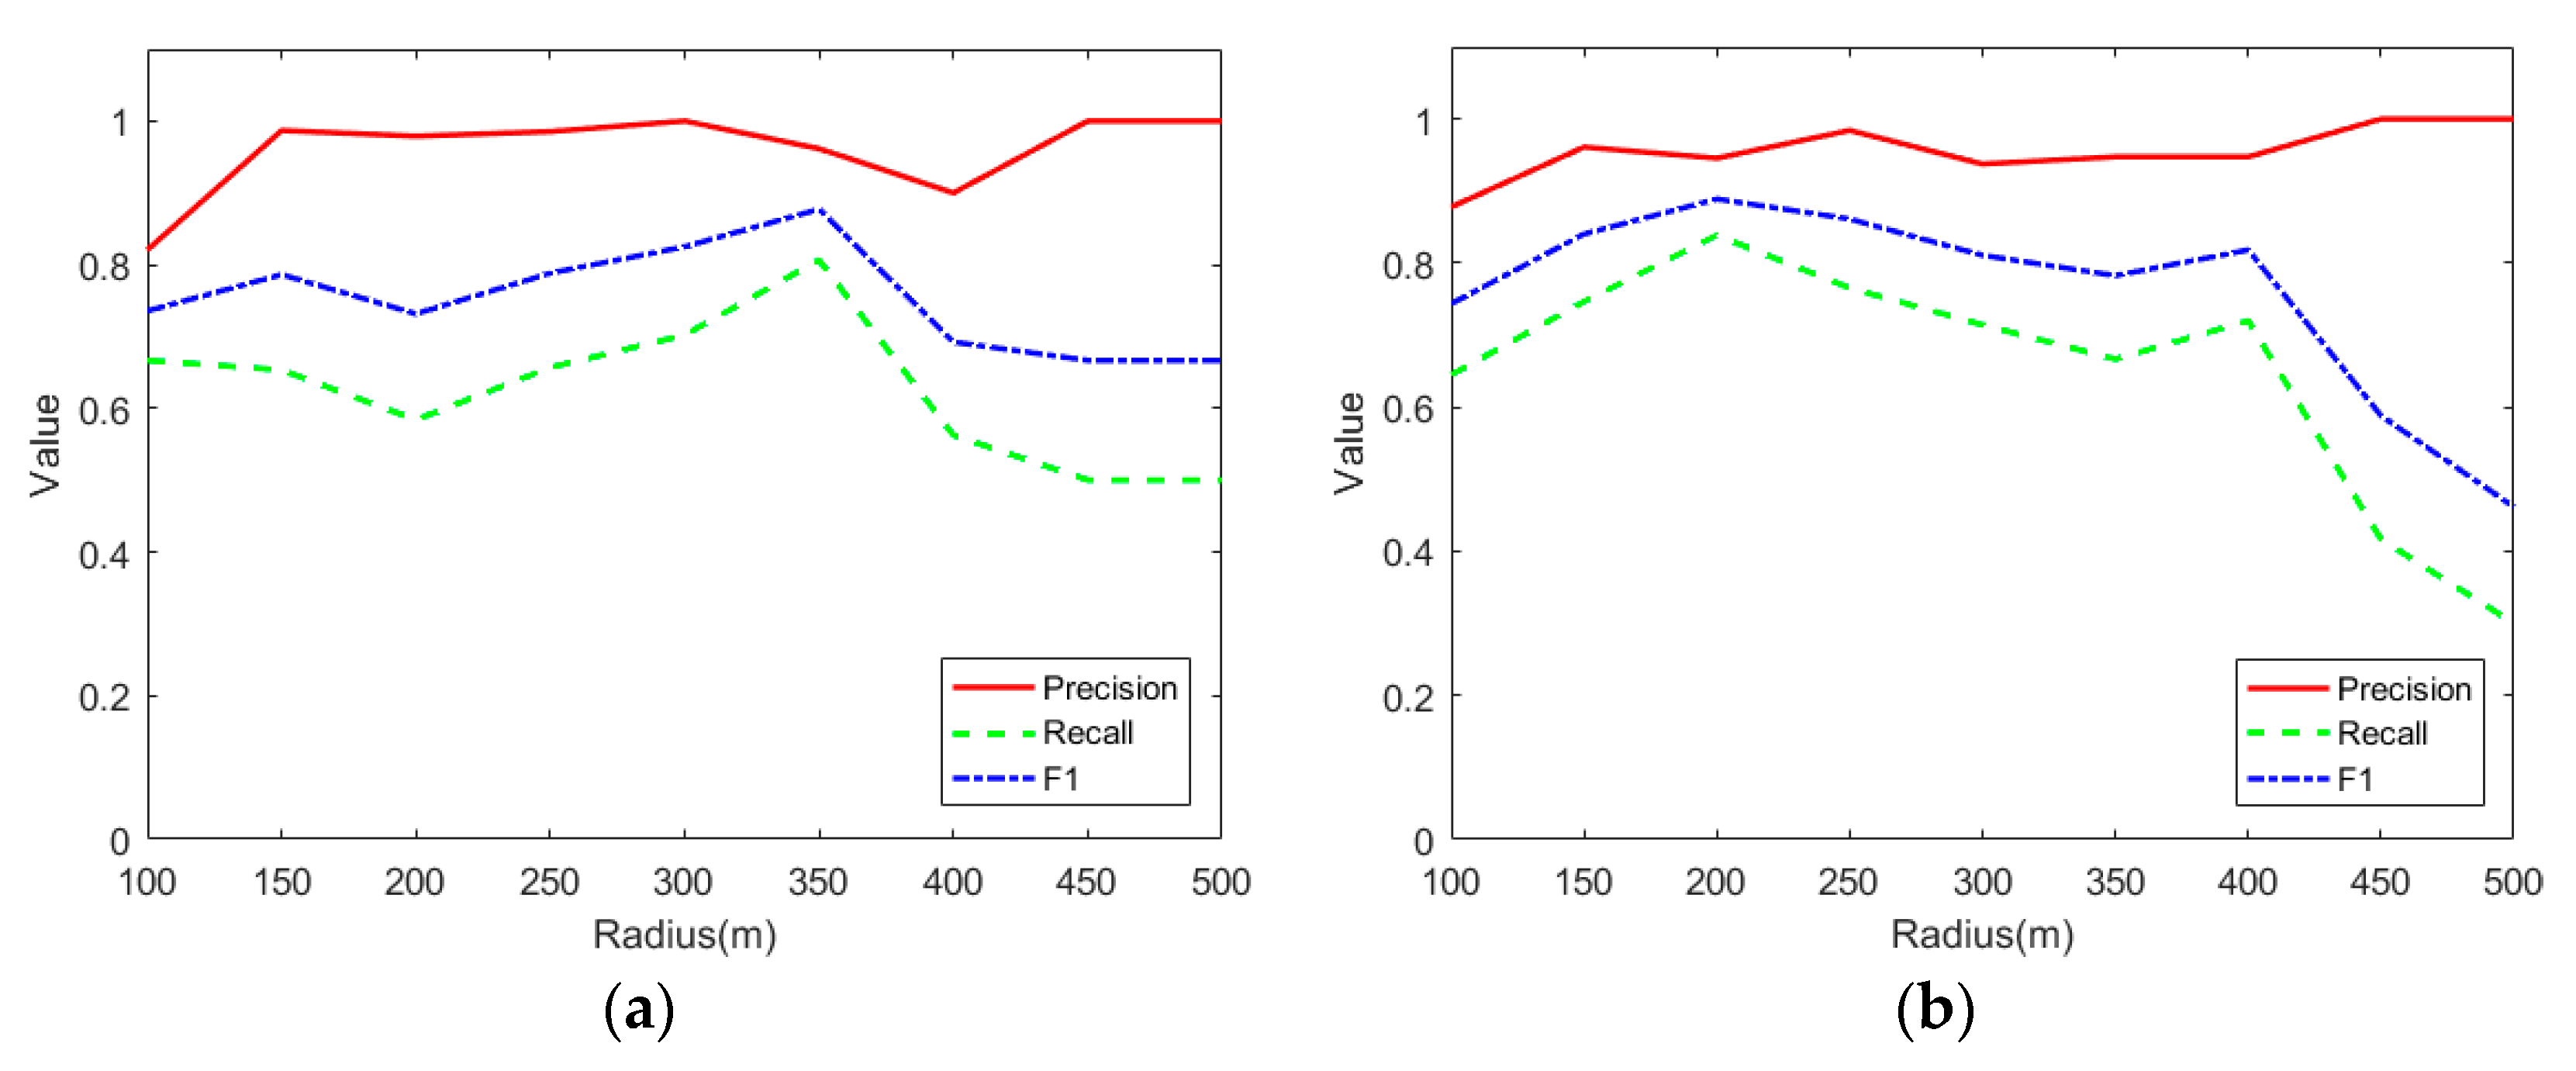
Figure 11.
Craters detected by Martian YOLO-Crater using the validation data. The ground-truth Bounding Boxes (BBOX) are in green and the detected results are in brown.
Figure 11.
Craters detected by Martian YOLO-Crater using the validation data. The ground-truth Bounding Boxes (BBOX) are in green and the detected results are in brown.
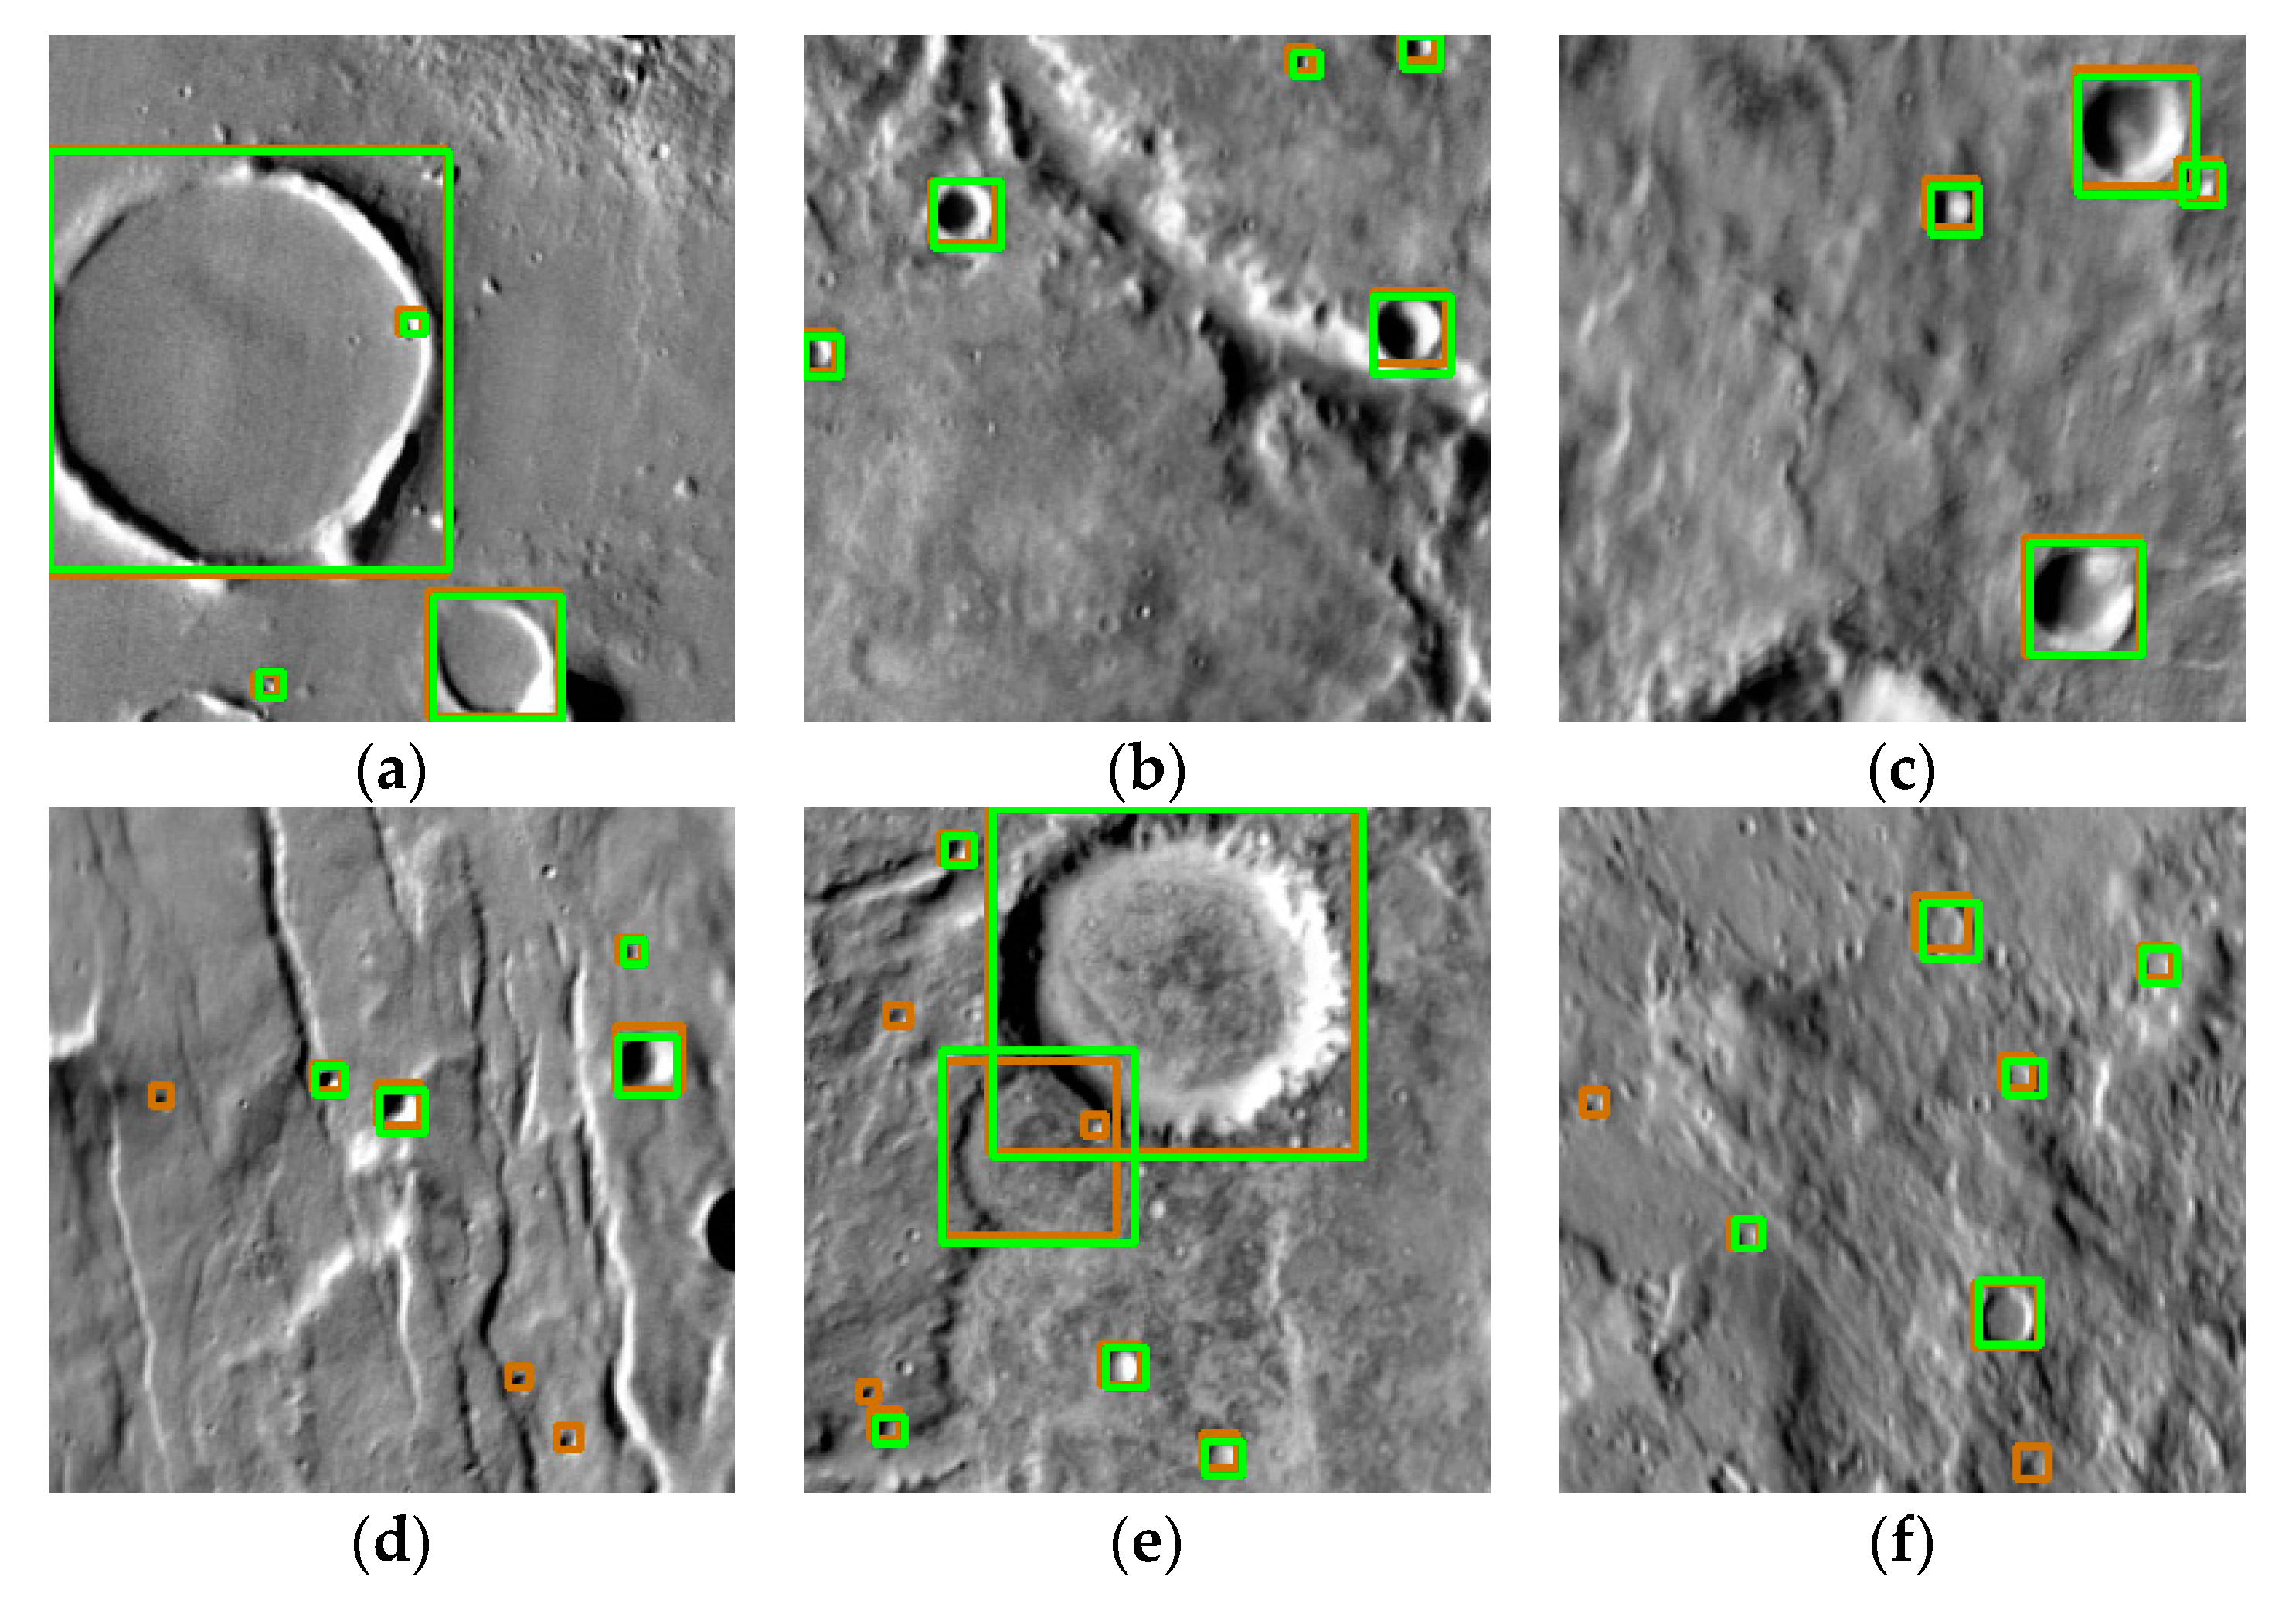
Table 2.
Detecting accuracy based on DEM visualization datasets with 7 kinds of stretching methods.
| Method | P | R | F1 |
|---|---|---|---|
| DEM-MMS | 0.9093 | 0.1088 | 0.1944 |
| DEM-1% LTS | 0.8712 | 0.1348 | 0.2335 |
| DEM-2% LTS | 0.8962 | 0.1186 | 0.2095 |
| DEM-SDS | 0.9147 | 0.1120 | 0.1996 |
| DEM-HE | 0.9092 | 0.0730 | 0.1351 |
| DEM-LS+ MMS | 0.9135 | 0.1088 | 0.1945 |
| DEM- LS+ MMS+GS | 0.9174 | 0.1114 | 0.1988 |
Table 3.
Detecting accuracy based on Slope visualization datasets with 7 kinds of stretching methods.
Table 3.
Detecting accuracy based on Slope visualization datasets with 7 kinds of stretching methods.
| Method | P | R | F1 |
|---|---|---|---|
| Slope-MMS | 0.9243 | 0.1108 | 0.1978 |
| Slope-1% LTS | 0.8777 | 0.1223 | 0.2147 |
| Slope-2% LTS | 0.8989 | 0.1124 | 0.1998 |
| Slope-SDS | 0.8410 | 0.1330 | 0.2297 |
| Slope-HE | 0.8950 | 0.1077 | 0.1923 |
| Slope-LS+ MMS | 0.9049 | 0.1112 | 0.1980 |
| Slope- LS+ MMS+GS | 0.8922 | 0.1218 | 0.2143 |
Table 4.
Detecting accuracy based on DOM and visualization datasets with 7 kinds of stretching methods.
Table 4.
Detecting accuracy based on DOM and visualization datasets with 7 kinds of stretching methods.
| Method | P | R | F1 |
|---|---|---|---|
| DOM | 0.8562 | 0.6261 | 0.7233 |
| DOM-MMS | 0.8786 | 0.6604 | 0.7541 |
| DOM-1% LTS | 0.7956 | 0.6390 | 0.7087 |
| DOM-2% LTS | 0.7815 | 0.6280 | 0.6964 |
| DOM-SDS | 0.7764 | 0.6505 | 0.7079 |
| DOM-HE | 0.7312 | 0.6390 | 0.6820 |
| DOM-LS+ MMS | 0.8672 | 0.5886 | 0.7012 |
| DOM- LS+ MMS+GS | 0.8765 | 0.5461 | 0.6729 |
Table 5.
The best testing accuracy for each data type.
| Dataset | P | R | F1 |
|---|---|---|---|
| DOM-MMS | 0.8786 | 0.6604 | 0.7541 |
| DDS | 0.8433 | 0.6301 | 0.7213 |
| Slope-SDS | 0.8410 | 0.1330 | 0.2297 |
| DEM-1% LTS | 0.8712 | 0.1348 | 0.2335 |
Table 6.
Result of ablation experiment.
| CBAM | Loss | P | R | F1 |
|---|---|---|---|---|
| ✕ | ✕ | 0.9115 | 0.5266 | 0.6675 |
| ✓ | ✕ | 0.9251 | 0.5280 | 0.6723 |
| ✕ | ✓ | 0.8656 | 0.6257 | 0.7263 |
| ✓ | ✓ | 0.8786 | 0.6604 | 0.7541 |
Table 7.
Detecting accuracy in Maria and Highland.
| Type | Model | TP | FP | FN | P | R | F1 |
|---|---|---|---|---|---|---|---|
| Maria(R5) | YOLOX | 1948 | 274 | 1571 | 0.8767 | 0.5536 | 0.6786 |
| YOLO-Crater | 2319 | 374 | 1200 | 0.8611 | 0.6590 | 0.7466 | |
| Highland(R6) | YOLOX | 1884 | 98 | 1874 | 0.9506 | 0.5013 | 0.6564 |
| YOLO-Crater | 2487 | 290 | 1271 | 0.8956 | 0.6618 | 0.7611 |
Table 8.
Detecting accuracy at different scales.
| R(m) | TP | FP | FN | P | R | F1 |
|---|---|---|---|---|---|---|
| R≤100 | 3533 | 624 | 1862 | 0.8499 | 0.6549 | 0.7397 |
| R(100~150] | 646 | 16 | 291 | 0.9758 | 0.6894 | 0.8080 |
| R(150~200] | 295 | 12 | 129 | 0.9609 | 0.6958 | 0.8071 |
| R(200~250] | 129 | 2 | 54 | 0.9847 | 0.7049 | 0.8217 |
| R(250~300] | 63 | 2 | 26 | 0.9692 | 0.7079 | 0.8182 |
| R(300~350] | 43 | 2 | 15 | 0.9556 | 0.7414 | 0.8350 |
| R(350~400] | 27 | 2 | 14 | 0.9310 | 0.6585 | 0.7714 |
| R(400~450] | 13 | 0 | 17 | 1.0000 | 0.4333 | 0.6047 |
| R(450~500] | 9 | 0 | 17 | 1.0000 | 0.3462 | 0.5143 |
Table 9.
Detecting accuracy using the validation data.
| Model | AP50 | AP50:95 | P | R | F1 |
|---|---|---|---|---|---|
| Martian YOLO-Crater | 0.8490 | 0.4550 | 0.8837 | 0.6925 | 0.7765 |
Disclaimer/Publisher’s Note: The statements, opinions and data contained in all publications are solely those of the individual author(s) and contributor(s) and not of MDPI and/or the editor(s). MDPI and/or the editor(s) disclaim responsibility for any injury to people or property resulting from any ideas, methods, instructions or products referred to in the content. |
© 2023 by the authors. Licensee MDPI, Basel, Switzerland. This article is an open access article distributed under the terms and conditions of the Creative Commons Attribution (CC BY) license (http://creativecommons.org/licenses/by/4.0/).
Copyright: This open access article is published under a Creative Commons CC BY 4.0 license, which permit the free download, distribution, and reuse, provided that the author and preprint are cited in any reuse.


