
Submitted:
31 August 2023
Posted:
01 September 2023
You are already at the latest version
Abstract
We investigated whether cigarette smoking and dietary acid load (DAL) are associated with the risk of chronic obstructive pulmonary disease (COPD) in middle-aged healthy Korean men. Healthy men without diagnosed chronic disease (40-64 yrs) from the KNHANES-VI (2013–2015) included in the analysis (n=774) were subdivided by smoking status and DAL levels as estimated by the net endogenous acid production (NEAP) quartile. Current smokers tended to have a higher risk of COPD than non-smokers before and after the adjustment. When divided by the DAL quartile, the Q4 tended to have a higher risk of COPD than the Q1. Additionally, current smokers with lower (Q2), modest (Q3), and highest NEAP scores (Q4) showed more than 4-fold higher risks of COPD than the non-smokers with the lowest NEAP scores (Q1). Ex–smokers with higher NEAP scores (Q3 and Q4) showed more than 4-fold higher risks of COPD than the Q1. Interestingly, the risk of COPD was also more than 6-fold higher in non-smokers with the highest NEAP scores compared to the Q1. NEAP scores and smoking status synergistically increased the risk of COPD in middle-aged healthy Korean men. It suggests that DAL levels are an important factor for the prevention and management of COPD.
Keywords:
dietary acid load
; net endogenous acid production
; chronic obstructive pulmonary disease
; KNHANES
1. Introduction
Recently, chronic obstructive pulmonary disease (COPD) has been on the rise worldwide, now emerging as a serious public health problem [1]. According to a report by the World Health Organization, COPD is the third leading cause of death worldwide [2]. The Korea Disease Control and Prevention Agency (KDCPA) reported that the prevalence of COPD was 10.8% among the population older than 40 years, and was 27.3% among the population older than 70 years [3].
COPD is characterized by airflow limitation and persistent respiratory symptoms caused by diverse environmental risk factors such as tobacco smoking and air pollution (household or outdoor), as well as genetic factors and various exposures [4]. Among the various factors affecting COPD risk, tobacco smoking is an important and preventable cause of COPD prevalence [5]. Exposure to cigarette smoke is a major cause of lung disease, which results in pronounced and chronic inflammation of lung function [6]. Thus, quitting smoking has been recommended to effectively slow the acceleration of COPD progression, which contributes to a decline in lung function and increased respiratory symptoms and morbidity [7,8,9]. Smoking is a key factor contributing to the risk of COPD, although other environmental factors are also known to influence the risk [10]. A meta-analysis study reported that exposure to biomass smoke is clinically related to mortality and progression of COPD [11]. Additionally, aging affects the development of COPD [12] and, together with smoking duration, is related to the prevalence of COPD [13]. Dietary habits are also known to influence the risk of COPD directly or indirectly [14,15,16,17]. Indeed, dietary patterns are associated with non-communicable diseases such as obesity, cardiovascular disease, diabetes, and respiratory disease because metabolic conditions can be influenced by nutrient intake [18]. Healthy diet patterns, such as consumption of various healthy plant-based foods (i.e., fruits, vegetables, nuts, and whole grains) and fish, are beneficial for lung function and may reduce the incidence of COPD in contrast with Westernized diet patterns, such as consumption of red and processed meat, refined grains, sweets, and desserts [14,15,16,17]. Thus, dietary pattern is thought to be an important factor affecting the risk of COPD [14].
Food intake has been reported to affect endogenous acid production and is associated with dietary acid load (DAL) levels [19]. Higher consumption of many protein-rich foods such as meat, cheese, and eggs increase the acid levels in the body, while consumption of fruits and vegetables increase the level of alkalis [20]. An imbalance between acid and base (alkalis) in the body can lead to metabolic acidosis and cause metabolic disorders [21]. DAL levels are mainly expressed as potential renal acid load (PRAL) or net endogenous acid production (NEAP), which are calculated using intake of dietary protein and a few minerals [22,23]. In a previous systematic review and meta-analysis, high PRAL scores (indicating high DAL levesls) were associated with cardiometabolic risk factors such as high blood pressure, increased insulin concentration, and risk of diabetes [24]. In other systematic reviews and meta-analyses, hypertension was found to be significantly associated with increased PRAL and NEAP scores [25]. Likewise, high DAL levels, as expressed by PRAL scores, have been found to be associated with high serum triglyceride concentrations [26]. In other words, DAL levels are closely associated with an increased risk of chronic metabolic diseases [19]. It has been reported that consumption of foods with a high acid load influences the respiratory system, including by increasing carbon dioxide excretion from the lung [27]. Thus, patients with COPD can be prescribed a diet composed of low-carbohydrate and high-fat to regulate the carbon dioxide production in the lung [28]. Indeed, the lung plays an important role in regulating the systemic pH and acid-base balance [29].
Therefore, in this study, we aimed to investigate whether smoking status and DAL levels are associated with the risk of COPD among people who have not been diagnosed with the disease, and to examine whether DAL levels can be applied to establish optimal dietary guidelines for the prevention and management of COPD.
2. Materials and Methods
2.1. Subjects
Data were obtained from the Korean National Health and Nutrition Examination Survey (KNHANES) 2013–2015 (VI). The KNHANES was conducted by the Korea Centers for Disease Control and Prevention (KCDC), formerly known as the KDCPA (Cheongju, Korea), and consisted of a nationwide, cross-sectional, multistage, and stratified survey. The survey includes information such as health interview and nutrition survey, anthropometric parameters, biochemical measures, and health examination. Among the 22,948 subjects who participated in the KNHANES 2013–2015 (VI), we included males aged 40–79 years (n = 5,304). We excluded participants without lung function measurements (n = 2,062), those with a total calorie intake (TCI) < 500 kcal/day or > 5,000 kcal/day, or missing data on nutrient intake information (n = 59). We also excluded participants who had missing data on disease history (n = 189), sociodemographic data (n = 46), and a lack of important biochemical parameter risk factor information (n = 94). Subsequently, we excluded those who were diagnosed with diseases (i.e., diabetes, hypertension, dyslipidemia, chronic obstructive pulmonary disease, asthma, tuberculosis, sinusitis, otitis media, allergic rhinitis, stroke, myocardial infarction, angina pectoris, hepatitis, liver cirrhosis, renal failure, thyroid gland disease, arthritis, osteoarthritis, rheumatoid arthritis, cancer) (n = 1,790). Subjects were also excluded if they had missing data from the nutrition survey, including the food frequency questionnaire (FFQ) (n = 290). As the FFQ was surveyed only among adults ≤ 64 years, and lung function was measured only among adults ≥ 40 years in KNHANES VI, the age range of the subjects included in this study was 40–64 years. Finally, 774 subjects aged 40–64 years were included in the final statistical analysis (Figure 1). All procedures for conducting the KNHANES were originally approved by the Institutional Review Board (IRB) of the KCDC (2013-07CON-03-4C, 2013-12EXP-03-5C). In addition, this study was approved with the exemption from the IRB of Dong-A University (2-104709-AB-N-01-202112-HR-087-02) becuasethe datasets were the publicly available from the KDCA website.
2.2. Assessment of Dietary Patterns
This study included nutrition intake information investigated by the semiquantitative-FFQ (SQ-FFQ) and a 24-h recall diet (RD) survey. Dietitians conducted the survey by conducting face-to-face interviews at the participants’ homes. The SQ-FFQ consists of 112 food items and nine levels of frequency (3 times/day, 2 times/day, 1 time/day, 5-6 times/week, 2–4 times/week, 1 time/week, 2–3 times/month, 1 time/month, and rarely eat). The SQ-FFQ asks questions to obtain information on food consumed within the past year based on a standard intake (one portion size). The 24-h RD survey included diet intake information throughout the day. The diet survey was used to collect the nutrient information of each participant over the course of 1 day, including the TCI and the amounts of carbohydrate, protein, fat, fatty acid, cholesterol, dietary fiber, calcium, phosphorus, iron, sodium, and potassium. The macronutrient contents, including carbohydrate, protein, and fat, were also expressed as proportions derived from the TCI. The DAL levels were calculated indirectly using the NEAP score. NEAP was calculated as the ratio of protein-potassium intake: NEAP (mEq/d) = 54.5 × [protein intake (g/day)/potassium intake (mEq/day)] – 10.2 [19,23].
2.3. Assessment of COPD
COPD was diagnosed in participants with a forced expiratory volume in 1 s (FEV1) less than 70% of the forced vital capacity (FVC) (FEV1/FV < 0.7) according to the criteria of the Global Initiative for Chronic Obstructive Lung Disease (GOLD) [30]. Among patients with a FEV1/FVC less than 0.7, the severity of COPD was classified into four categories: GOLD 1, mild (FEV1 ≥ 80% predicted); GOLD 2, moderate (50% ≤ FEV < 80% predicted); GOLD 3, severe (30% ≤ FEV1 < 50% predicted); and GOLD 4, very severe (FEV1 < 30% predicted) [30].
2.4. Basic Information
The participants’ basic information was collected, including sociodemographic and lifestyle factors, such as sex, age, education status, household income status, smoking status, and alcohol drinking information based on the answers collected by the health survey. Education status was classified into two groups: ≤ 12 or > 12 years of schooling (based on high school). Household income status was categorized into four groups: lowest, lower-middle, upper-middle, and highest. Cigarette smoking status was divided into three categories: never-smoker, ex-smoker, and current smoker. During a lifetime, people who have smoked more than 100 cigarettes (more than 5 packs) were considered smokers. The smokers were additionally classified into current smokers (yes) or ex-smokers (no) based on the answer to the question “do you smoke cigarettes now?” During a lifetime, people who have smoked less than 100 cigarettes (less than 5 packs) were considered never-smokers. Alcohol drinkers were classified into two groups: current drinkers and nondrinkers. Current drinkers were defined as those who drank alcohol more than once a month.
2.5. Anthropometric and Biochemical Parameters
We obtained data for anthropometric and biochemical parameters from the KNHANES VI (2013–2015). Trained staff members conducted the anthropometric measurements, including height (cm), weight (kg), body mass index (BMI; kg/m2), waist circumference (cm), and systolic and diastolic blood pressures (mmHg). Blood and urine samples were collected after at least 8 h of fasting to measure glucose (mg/dL), hemoglobin A1c (HbA1c), triglyceride (mg/dL), high-density lipoprotein cholesterol (HDL-C, mg/dL), low-density lipoprotein cholesterol (LDL-C, mg/dL), aspartate aminotransferase (AST, IU/L), alanine aminotransferase (ALT, IU/L), blood urea nitrogen (BUN, mg/dL), creatinine, urine pH, urine creatinine, and estimated glomerular filtration rate (eGFR). The eGFR was calculated using the equation by CKD-EPI 2021 (Chronic Kidney Disease Epidemiology Collaboration) [31].
2.6. Statistical Analysis
All statistical analyses were performed using SPSS software, version 27.0 (IBM Corp, Armonk, NY, USA). To represent the Korean population, we used a complex sampling design recommended in the KNHANES guidelines (weighted sampling, stratified variable, and cluster variable). Categorical variables are presented as numbers (percentages) and were tested by the χ2 test. Continuous variables are presented as the mean ± standard errors for the descriptive variables and were tested by one-way analysis of variance (unadjusted) or general linear model with least significant difference (LSD) correction (adjustment for confounding factors). Skewed variables were tested after log transformation. We also conducted a logistic regression model to calculate the odds ratio (OR) and 95% confidence interval (CI) for the risk of COPD. with and without adjustment. The variables used for the adjustment were age, BMI, TCI, education status, household income status, smoking status, alcohol consumption, and/or NEAP. P-values < 0.05 were considered statistically significant.
3. Results
3.1. General Characteristics of Participants According to Smoking Status
Table 1 shows the general characteristics of the study participants according to their smoking status. The mean age, proportion of education status, and current drinkers were significantly different among the groups. Specifically, ex-smokers were significantly older, and never-smokers had a higher proportion of longer education periods than the other groups. Additionally, current smokers showed a higher proportion of current drinkers. However, the proportions of household income status and CODP were not significantly different among the three groups.
3.2. Anthropometric and Biochemical Parameters and Lung Function Measurements of Participants According to Smoking Status
Table 2 shows the anthropometric and biochemical parameters and lung function measurements of the study participants according to smoking status. Anthropometric parameters, such as BMI, height, weight, and waist circumference, were not significantly different among the groups. However, diastolic blood pressure was significantly different according to smoking status, which was maintained after adjusting for confounding factors (age, BMI, TCI, household income status, education status, alcohol drinking and/or NEAP scores). Regarding glycemic parameters, serum fasting glucose levels were significantly different among the groups, but the difference disappeared after the adjustments. The HbA1c percentage was significantly higher in ex-smokers and particularly in current smokers before and after the adjustments, but the mean values were within the normal range. In terms of lipid parameters, the serum levels were significantly different according to the smoking status group before and after adjustment. Smokers, particularly current smokers, had higher serum TG levels. and HDL-C levels were also significantly different among the smoking status group. However, the serum levels of TC and LDL-C were not significantly different between the groups. Additionally, the serum levels of AST, BUN, and creatine, as well as urine pH and eGFR were significantly different among the three groups before and after the adjustments, although their mean values were within the normal range. Furthermore, the FEV1/FVC, which indicates lung function for determining COPD, was significantly different according to the smoking status groups before and after adjustment (age, BMI, TCI, household income status, education status, and alcohol drinking), but the significance turned out to be a trend after further adjustment for NEAP scores.
3.3. Nutrient Intake Information and DAL Levels of Participants According to Smoking Status
Table 3 shows the nutrient intake information and DAL levels of the study participants according to their smoking status. Regarding macronutrient intake, the proportion of carbohydrate derived from the TCI was significantly greater in the non-smoker group than in the other groups. However, the proportions of the other two macronutrients were not significantly different among the groups. Additionally, the intake of dietary fiber and potassium were significantly lower in the current smoker group compared to those in the other groups. Regarding DAL levels, the NEAP scores varied according to smoking status, with significantly higher scored in the current smoker group than those in the non-smoker group. This difference remained after adjustment for the confounding factor (P1). Additionally, the NEAP quartile groups were differently distributed according to smoking status.
3.4. Association between Smoking Status and Risk of COPD
Table 4 shows the association between smoking status and the risk of COPD among the study participants. The risk of COPD was evaluated by ORs and 95% CIs using a logistic regression model with adjustment for confounding factors. The risk of COPD tended to be higher in current smokers (unadjusted, Model 1: OR: 2.130; CI: 0.975–4.654; p = 0.058) than in non-smokers. This tendency was maintained even after adjustment for confounding factors such as age, BMI, TCI, education status, household income status, and alcohol consumption (Models 2–6). However, the tendency disappeared after further adjustment with NEAP values (Model 7: OR: 2.070; CI: 0.852–5.031; p = 0.108). In contrast, these patterns were not observed in the ex-smokers.
3.5. Association between NEAP Scores and Risk of COPD
Table 5 shows the association between the NEAP scores and the risk of COPD among the study participants. The study participants were subdivided into four groups according to the quartile of NEAP scores (Q1–Q4). The risk of COPD was evaluated by ORs and 95% CIs using a logistic regression model with adjustment for confounding factors. The lowest quartile of the NEAP scores was considered as the reference group (Q1). The highest NEAP quartile group (Q4) showed a significantly higher risk of COPD after age adjustment compared to the Q1 group (Model 2: OR: 2.171; CI: 1.039–4.535, p < 0.05). However, the significance shown in the Q4 group changed to a tendency after further adjustment for BMI, TCI, household income status, education status, drinking, and cigarette smoking in the Q4 group (Models 3–5). In contrast, there was no significant association between the quartile of NEAP scores (Q2–Q3) and the risk of COPD in all models (Models 1–5).
Risk of COPD according to the quartile of NEAP scores and smoking status
Figure 2 shows the risk of COPD according to the quartile of NEAP scores and smoking status in the study participants. The risk of COPD was evaluated by ORs and 95% CIs using a logistic regression model with adjustment for confounding factors such as age, BMI, TCI, household income status, education status, and alcohol consumption. The lowest quartile of NEAP scores (Q1) in non-smokers was considered as the reference group. Compared to the reference group, the Q2–Q4 groups from the current smokers showed a significantly higher risk of COPD after adjustment for confounding factors (current-smoker, Q2: OR: 4.603; CI: 1.267–16.731; p = 0.021; current-smoker, Q3: OR: 4.841; CI: 1.414–16.573; p = 0.012; current-smoker, Q4: OR: 4.697; CI: 1.390–15.869; p = 0.013). In the ex-smoker groups, the groups with relatively high NEAP scores (Q3–Q4) had significantly higher risks of COPD after adjustment for confounding factors compared to the reference group (ex-smoker, Q3: OR: 4.865; CI: 1.192–19.853; p = 0.028; ex-smoker, Q4: OR: 4.103; CI: 1.094–15.388; p = 0.036) . However, the risks of COPD in the ex-smoker groups with relatively low NEAP scores (Q1–Q2) were not significantly different from those in the reference group after adjustment for confounding factors. Additionally, the risks of COPD in the never-smoker groups with moderate NEAP scores (Q2–Q3) were not significantly different from those in the reference group after adjustment for confounding factors. Interestingly, the never-smokers in the highest NEAP quartile (Q4) had a significantly higher risk of COPD than the reference group after adjustment for confounding factors (never-smoker, Q4: OR: 6.724; CI: 1.286–35.168; p = 0.024).
4. Discussion
In this study, we investigated the association among cigarette smoking status, DAL levels expressed as NEAP scores, and the risk of COPD among healthy Korean adult men. Our results demonstrated that NEAP scores and smoking status synergistically increased the risk of COPD among middle-aged healthy Korean men, even though neither NEAP scores nor cigarette smoking significantly increased the risk of COPD. This result suggests that DAL levels are an important risk factor for the prevention and management of COPD.
In the pathology of COPD, cigarette smoking is a major risk factor for the development of the disease [32]. In a previous study, Nacul et al. reported that current and former smokers had a high prevalence of COPD compared to never smokers [33]. A recent report also suggested that smoking was the key factor contributing to the development of COPD based on data on the prevalence, death, and disability-adjusted life years (DALYs) of COPD [34]. It has been reported that cigarette smoke induces airway inflammation and causes excessive reactive oxygen species-mediated damage to the lung, ultimately affecting COPD pathogenesis [35]. Therefore, many studies have suggested that smoking cessation is an effective intervention for managing COPD [32]. In this regard, quitting smoking can be a useful method to slow the acceleration of lung function decline, thereby further reducing mortality [8]. Liu et al. showed that people who have quit smoking for 10 years or more showed a lower prevalence of COPD as well as other respiratory symptoms compared to current smokers [36]. However, as smoking experience is a critical factor for the risk of COPD, continuous management of lung function is recommended to ex-smokers [36]. Yoon et al. reported that the duration of quitting smoking was associated with the improvement in lung function parameters, but that ex-smokers who have quit smoking for 20 years or more still showed higher obstructive spirometry patterns compared to never-smokers among Korean men [37]. In other words, smoking cessation is an important factor in terms of disease prevention and management, but the higher risk of COPD still existing in ex-smokers compared to non-smokers may indicate that the risk of disease depends on various environmental factors, therefore the effort of controlling other environmental confounders are being needed. In contrast to previous results, in our study, neither ex-smokers nor current smokers showed a significantly higher risk of COPD compared to non-smokers before and after confounding factors. This discrepancy may be due to the differences in the clinical setting because our study participants were relatively healthy men with no diagnoses of chronic disease. Furthermore, as our study did not include more detailed information on smoking cessation, such as the cessation period among the ex-smokers, future studies are needed to confirm the relationship between the smoking cessation period and the risk of COPD.
Interestingly, when a dietary factor such as NEAP score (indicating DAL levels) was considered in our study, current smokers with relatively high NEAP scores (Q2–Q4) had more than a 4-fold increased risk of COPD than non-smokers with low NEAP scores (Q1) before and after the confounding factors. Additionally, the ex-smokers with relatively high NEAP scores (Q3, Q4) showed a significantly higher risk of COPD than non-smokers with low NEAP scores (Q1). Interestingly, even in the non-smokers, those in the highest NEAP quartile (Q4) had a significantly higher risk of COPD (more than 6-fold higher) than those in the lowest NEAP quartile (Q1). This suggests that the risk of COPD is interactively influenced by both smoking status and other environmental factors such as DAL levels, even in people who are relatively healthy and have no diagnosed disease. Our results are partly supported by the findings of previous reports [38,39]. Indeed, Szmidt et al. reported that long-term dietary fiber intake was associated with a decreased COPD risk and that this pattern was related to smoking status [38]. Kaluza et al. also demonstrated that the consumption of vegetables and fruits significantly affected the occurrence of COPD in both current and ex-smokers, although this effect was not observed in never-smokers [39].
Indeed, half of COPD cases worldwide are associated with non-tobacco-related risk factors, such as the exposure to household biomass smoke, outdoor air pollution, and environmental tobacco smoke, among others [40]. As environmental risk factors have been suggested to impact the risk of COPD, never-smokers should also take care to avoid exposure to other risk factors besides cigarette smoking. As mentioned above, many studies have shown that the association between the prevalence of COPD and smoking status is associated with dietary patterns [15,16,17]. In our study, we were interested in the relationship between the risk of COPD and DAL levels together with cigarette smoking. DAL levels are influenced by the amount of acidic and alkali foods consumed, which are used to confirm the acid-base balance by evaluating the dietary pattern [19,20,23]. The PRAL and NEAP scores are the representative equations for calculating the DAL levels [20]. As mentioned above, NEAP scores are calculated with amount of dietary protein and potassium consumed [20,23]. PRAL scores are estimated by amount of dietary protein, potassium, phosphorus, magnesium, and calcium consumed [20,22]. In this study, the DAL levels were calculated using NEAP scores because the KNHANES VI data do not provide information of magnesium intake. Even though the PRAL score seems to be a more sensitive estimation index, NEAP scores are commonly used to indirectly calculate net acid excretion (NAE) but can rather accurately predict NAE, representing a useful way in which to perform an alkalizing and acidifying evaluation of diets and foods [23,41]. Therefore, NEAP scores are a reliable equation for calculating DAL levels. It has been reported that Western dietary patterns commonly contain high-acidity foods, which may contribute to the increased risk of various chronic diseases [19]. In particular, chronic kidney disease (CKD) is commonly associated with DAL levels [42]. According to the report by Toba et al. [43], an increase in NEAP scores is a risk factor for CKD progression, and low consumption of fruits and vegetables not only affects the increase in DAL levels but can also affect the progression of renal dysfunction in patients with CKD [42]. López et al. also reported that dietary patterns with poor DAL levels may be risk factors for disease progression by promoting metabolic acidosis in children with CKD [44]. Because the kidneys play an important role in acid-base balance control [45], excessive dietary acid intake can impair kidney function [42]. Accordingly, many studies have reported that metabolic disorders can occur when metabolic acidosis is continuously maintained, which is also related to various chronic diseases [19,24,25,26]. Acid-base balance is also associated with the respiratory system. Indeed, Cunha et al. showed that DAL levels affect the development of overweight- and obese-associated asthma phenotypes among overweight and obese children with asthma [46]. These results suggest that the lungs play an important role in acid-base balance. In the acid-base balance mechanism, the consumption of high acid load foods can lead to the net production of nonvolatile acids (hydrogen chloride [HCI] and hydrogen sulfate [H2SO4]), which are buffered through the excretion of carbon dioxide (CO2) via the lungs and the production of sodium salts from nonvolatile acids, which are excreted by the kidney [47]. In other words, the lungs maintain the blood pH within a narrow range by changing the rate at which CO2 is released in proportion to actual changes in the level of carbonation in the blood, such as respiratory compensation [48]. According to these mechanisms, as the lungs are closely related to the acid-base equilibrium in the body, further research is needed to identify the effect of DAL levels on lung-related diseases. COPD is a multifactorial disease caused by the interaction between genetic and environmental factors [49]. In particular, a COPD genome-wide association study (GWAS) confirmed the HHIP and FAM13A loci as genetic determinants of spirometric values in the general population [50]. However, the pathogenesis of COPD still needs to be further investigated in terms of its genetics, and research on diverse omics data could provide a better understanding of disease occurrence [50,51]. Therefore, it is important to manage not only smoking status but also various environmental and genetic factors influencing the risk of COPD.
Our results reveal that DAL levels affect the risk of COPD, and that their contribution is associated with smoking status among Korean men with good health. However, this study has several limitations that warrant discussion. First, the final analysis was conducted only in men; although both men and women were initially analyzed, the proportion of non-smokers was relatively high in women, which made it difficult to compare the values between the smoking groups. Second, the number of subjects included in the final analysis was relatively small. Although the total number of subjects in the KNHANES VI was 22,948, the number of subjects in the final analysis was rather small because women were excluded and lung function was only measured in those aged ≥ 40 years. Additionally, subjects with a chronic disease diagnosis and missing FFQ data were excluded. Consequently, the total number of subjects in the analysis was relatively small. Finally, the DAL levels were calculated using only NEAP scores because PRAL scores cannot be calculated with limited data.
Despite the limitations, this study demonstrated that DAL levels expressed as NEAP scores and cigarette smoking status significantly interact with an increased risk of COPD among middle-aged healthy men, suggesting that DAL levels play an important role in the prevention and management of COPD.
Author Contributions
Jihyun Park, Mi Ri Ha, Oh Yoen Kim, and Juhyun Song analyzed the data; Oh Yoen Kim and Juhyun Song planned and supervised the study project; JiHyun Park and Oh Yoen Kim wrote the first draft; and Oh Yoen Kim and Juhyun Song revised the manuscript and provided funding. All authors have read and approved the final manuscript.
Funding
This study was supported by grants from the National Research Foundation of Korea (NRF; NRF-2022R1A2C1010398 to Oh Yoen Kim, and NRF-2022R1A2C1006125 to Juhyun Song).
Institutional Review Board Statement
The Korea National Health and Nutrition Examination Survey (KNHANES) was approved by the institutional review board (IRB) of the Korea Centers for Disease Control and Prevention (No. 2012-01EXP-01-2C, 2013-07CON-03-4C, 2013-12EXP-03-5C) and also approved with the exemption from the IRB of Dong-A University (2-104709-AB-N-01-202112-HR-087-02).
Informed Consent Statement
All survey participants in KNHANES provided written informed consent.
Data Availability Statement
This study was a secondary analysis of the publicly available KNHANES data which can be obtained from the KDCA website (https://knhanes.kdca.go.kr/knhanes/sub03/sub03_02_05.do).
Acknowledgments
IThe authors acknowledge the KNHANES.
Conflicts of Interest
The authors declare no conflict of interest.
References
- Lopez-Campos, J.L.; Tan, W.; Soriano, J.B. Global burden of COPD. Respirology 2016, 21, 14–23. [Google Scholar] [CrossRef]
- World Health Organization (WHO) facts about Chronic obstructive pulmonary disease (COPD). https://www.who.int/news-room/fact-sheets/detail/chronic-obstructive-pulmonary-disease-(copd) Web site. Updated 2022. Accessed November 20, 2022. 20 November.
- Kyung Sook, C. Current Status of Chronic Obstructive Pulmonary Disease (COPD) in the Republic of Korea. Division of Chronic Disease Control, Bureau of Chronic Disease Control, Korea Disease Control and Prevention Agency (KDCA). 2021; 949-951.
- Riley, C.M.; Sciurba, F.C. Diagnosis and Outpatient Management of Chronic Obstructive Pulmonary Disease: A Review. JAMA 2019, 321, 786–797. [Google Scholar] [CrossRef] [PubMed]
- Salvi, S. Tobacco smoking and environmental risk factors for chronic obstructive pulmonary disease. Clin Chest Med. 2014, 35, 17–27. [Google Scholar] [CrossRef] [PubMed]
- Taylor, J.D. COPD and the response of the lung to tobacco smoke exposure. Pulm Pharmacol Ther. 2010, 23, 376–383. [Google Scholar] [CrossRef] [PubMed]
- Godtfredsen, N.S.; Lam, T.H.; Hansel, T.T.; et al. COPD-related morbidity and mortality after smoking cessation: status of the evidence. Eur Respir J. 2008, 32, 844–853. [Google Scholar] [CrossRef]
- Tonnesen, P. Smoking cessation and COPD. Eur Respir Rev. 2013, 22, 37–43. [Google Scholar] [CrossRef]
- Temitayo Orisasami, I.; Ojo, O. Evaluating the effectiveness of smoking cessation in the management of COPD. Br J Nurs. 2016, 25, 786–791. [Google Scholar] [CrossRef]
- Barnes, P.J.; Burney, P.G.J.; Silverman, E.K.; et al. Chronic obstructive pulmonary disease. Nat Rev Dis Primers. 2015, 1, 15076. [Google Scholar] [CrossRef]
- Hu, G.; Zhou, Y.; Tian, J.; et al. Risk of COPD from exposure to biomass smoke: a metaanalysis. Chest. 2010, 138, 20–31. [Google Scholar] [CrossRef]
- Brandsma, C.; de Vries, M.; Costa, R.; Woldhuis, R.R.; Konigshoff, M.; Timens, W. Lung ageing and COPD: is there a role for ageing in abnormal tissue repair? Eur Respir Rev. 2017, 26, 170073. [Google Scholar] [CrossRef]
- Kim, E.; Yoon, S.; Kim, Y.; Go, D.; Jung, Y. Effects of Aging and Smoking Duration on Cigarette Smoke-Induced COPD Severity. J Korean Med Sci. 2018, 34 (Suppl 1). [Google Scholar] [CrossRef]
- Scoditti, E.; Massaro, M.; Garbarino, S.; Toraldo, D.M. Role of Diet in Chronic Obstructive Pulmonary Disease Prevention and Treatment. Nutrients. 2019, 11, E1357. [Google Scholar] [CrossRef] [PubMed]
- Varraso, R.; Chiuve, S.E.; Fung, T.T.; et al. Alternate Healthy Eating Index 2010 and risk of chronic obstructive pulmonary disease among US women and men: prospective study. BMJ. 2015, 350, h286. [Google Scholar] [CrossRef] [PubMed]
- Voortman, T.; Kiefte-de Jong, J.C.; Ikram, M.A.; et al. Adherence to the 2015 Dutch dietary guidelines and risk of non-communicable diseases and mortality in the Rotterdam Study. Eur J Epidemiol. 2017, 32, 993–1005. [Google Scholar] [CrossRef]
- Fischer, A.; Johansson, I.; Blomberg, A.; Sundstrom, B. Adherence to a Mediterranean-like Diet as a Protective Factor Against COPD: A Nested Case-Control Study. COPD. 2019, 16, 272–277. [Google Scholar] [CrossRef]
- Cena, H.; Calder, P.C. Defining a Healthy Diet: Evidence for The Role of Contemporary Dietary Patterns in Health and Disease. Nutrients. 2020, 12, E334. [Google Scholar] [CrossRef]
- Ostrowska, J.; Janiszewska, J.; Szostak-Wegierek, D. Dietary Acid Load and Cardiometabolic Risk Factors-A Narrative Review. Nutrients. 2020, 12, E3419. [Google Scholar] [CrossRef]
- Osuna-Padilla, I.A.; Leal-Escobar, G.; Garza-Garcia, C.A.; Rodriguez-Castellanos, F.E. Dietary Acid Load: mechanisms and evidence of its health repercussions. Nefrologia (Engl Ed). 2019, 39, 343–354. [Google Scholar] [CrossRef]
- Carnauba, R.A.; Baptistella, A.B.; Paschoal, V.; Hubscher, G.H. Diet-Induced Low-Grade Metabolic Acidosis and Clinical Outcomes: A Review. Nutrients. 2017, 9, E538. [Google Scholar] [CrossRef]
- Remer, T.; Manz, F. Estimation of the renal net acid excretion by adults consuming diets containing variable amounts of protein. Am J Clin Nutr. 1994, 59, 1356–1361. [Google Scholar] [CrossRef]
- Frassetto, L.A.; Todd, K.M.; Morris, R.C.J.; Sebastian, A. Estimation of net endogenous noncarbonic acid production in humans from diet potassium and protein contents. Am J Clin Nutr. 1998, 68, 576–583. [Google Scholar] [CrossRef]
- Dehghan, P.; Abbasalizad Farhangi, M. Dietary acid load, blood pressure, fasting blood sugar and biomarkers of insulin resistance among adults: Findings from an updated systematic review and meta-analysis. Int J Clin Pract. 2020, 74, e13471. [Google Scholar] [CrossRef] [PubMed]
- Chen, S.; Chen, Z.; Liang, Y.; Wang, P.; Peng, J. Elevated hypertension risk associated with higher dietary acid load: A systematic review and meta-analysis. Clin Nutr ESPEN. 2019, 33, 171–177. [Google Scholar] [CrossRef]
- Abbasalizad Farhangi, M.; Nikniaz, L.; Nikniaz, Z. Higher dietary acid load potentially increases serum triglyceride and obesity prevalence in adults: An updated systematic review and meta-analysis. PLoS One. 2019, 14, e0216547. [Google Scholar] [CrossRef] [PubMed]
- Cunha, P.; Moreira, A.; Moreira, P.; Delgado, L. Dietary diversity and childhood asthma-Dietary acid load, an additional nutritional variable to consider. Allergy. 2020, 75, 2418–2420. [Google Scholar] [CrossRef] [PubMed]
- Malmir, H.; Onvani, S.; Ardestani, M.E.; Feizi, A.; Azadbakht, L.; Esmaillzadeh, A. Adherence to Low Carbohydrate Diet in Relation to Chronic Obstructive Pulmonary Disease. Front Nutr. 2021, 8, 690880. [Google Scholar] [CrossRef]
- Kane, K.K. The role of the lungs in the adjustment of acid-base balance. Ann Clin Lab Sci. 1973, 3, 323–328. [Google Scholar]
- Global Initiative for Chronic Obstructive Lung Disease, (GOLD). GLOBAL STRATEGY FOR PREVENTION, DIAGNOSIS AND MANAGEMENT OF COPD: 2023 Report. 2022, 22-29.
- Inker, L.A.; Eneanya, N.D.; Coresh, J.; et al. New Creatinine- and Cystatin C-Based Equations to Estimate GFR without Race. N Engl J Med. 2021, 385, 1737–1749. [Google Scholar] [CrossRef]
- Duffy, S.P.; Criner, G.J. Chronic Obstructive Pulmonary Disease: Evaluation and Management. Med Clin North Am. 2019, 103, 453–461. [Google Scholar] [CrossRef]
- Nacul, L.C.; Soljak, M.; Meade, T. Model for estimating the population prevalence of chronic obstructive pulmonary disease: cross sectional data from the Health Survey for England. Popul Health Metr. 2007, 5, 8–8. [Google Scholar] [CrossRef]
- Safiri, S.; Carson-Chahhoud, K.; Noori, M.; et al. Burden of chronic obstructive pulmonary disease and its attributable risk factors in 204 countries and territories, 1990-2019: results from the Global Burden of Disease Study 2019. BMJ. 2022, 378, e069679–e069679. [Google Scholar] [CrossRef]
- Hikichi, M.; Mizumura, K.; Maruoka, S.; Gon, Y. Pathogenesis of chronic obstructive pulmonary disease (COPD) induced by cigarette smoke. J Thorac Dis. 2019, 11 (Suppl 17), S2129–S2140. [Google Scholar] [CrossRef] [PubMed]
- Liu, Y.; Pleasants, R.A.; Croft, J.B.; et al. Smoking duration, respiratory symptoms, and COPD in adults aged >/=45 years with a smoking history. Int J Chron Obstruct Pulmon Dis. 2015, 10, 1409–1416. [Google Scholar] [CrossRef] [PubMed]
- Yoon, Y.J.; Lee, M.S.; Jang, K.W.; Ahn, J.B.; Hurh, K.; Park, E. Association between smoking cessation and obstructive spirometry pattern among Korean adults aged 40-79 years. Sci Rep. 2021, 11, 18667–9. [Google Scholar] [CrossRef] [PubMed]
- Szmidt, M.K.; Kaluza, J.; Harris, H.R.; Linden, A.; Wolk, A. Long-term dietary fiber intake and risk of chronic obstructive pulmonary disease: a prospective cohort study of women. Eur J Nutr. 2020, 59, 1869–1879. [Google Scholar] [CrossRef]
- Kaluza, J.; Larsson, S.C.; Orsini, N.; Linden, A.; Wolk, A. Fruit and vegetable consumption and risk of COPD: a prospective cohort study of men. Thorax. 2017, 72, 500–509. [Google Scholar] [CrossRef]
- Yang, I.A.; Jenkins, C.R.; Salvi, S.S. Chronic obstructive pulmonary disease in never-smokers: risk factors, pathogenesis, and implications for prevention and treatment. Lancet Respir Med. 2022, 10, 497–511. [Google Scholar] [CrossRef]
- Remer, T.; Dimitriou, T.; Manz, F. Dietary potential renal acid load and renal net acid excretion in healthy, free-living children and adolescents. Am J Clin Nutr. 2003, 77, 1255–1260. [Google Scholar] [CrossRef]
- Hamidianshirazi, M.; Ekramzadeh, M. Dietary Acid Load and Chronic Kidney Disease. Saudi J Kidney Dis Transpl. 2021, 32, 1511–1522. [Google Scholar] [CrossRef]
- Toba, K.; Hosojima, M.; Kabasawa, H.; et al. Higher estimated net endogenous acid production with lower intake of fruits and vegetables based on a dietary survey is associated with the progression of chronic kidney disease. BMC Nephrol. 2019, 20, 421–8. [Google Scholar] [CrossRef]
- López, M.; Moreno, G.; Lugo, G.; Marcano, G. Dietary acid load in children with chronic kidney disease. Eur J Clin Nutr. 2020, 74 (Suppl 1), 57–62. [Google Scholar] [CrossRef] [PubMed]
- Nagami, G.T.; Hamm, L.L. Regulation of Acid-Base Balance in Chronic Kidney Disease. Adv Chronic Kidney Dis. 2017, 24, 274–279. [Google Scholar] [CrossRef]
- Cunha, P.; Paciencia, I.; Cavaleiro Rufo, J.; et al. Dietary Acid Load: A Novel Nutritional Target in Overweight/Obese Children with Asthma? Nutrients. 2019, 11, E2255. [Google Scholar] [CrossRef] [PubMed]
- Williams, R.S.; Kozan, P.; Samocha-Bonet, D. The role of dietary acid load and mild metabolic acidosis in insulin resistance in humans. Biochimie. 2016, 124, 171–177. [Google Scholar] [CrossRef]
- Remer, T. Influence of diet on acid-base balance. Semin Dial. 2000, 13, 221–226. [Google Scholar] [CrossRef] [PubMed]
- Berndt, A.; Leme, A.S.; Shapiro, S.D. Emerging genetics of COPD. EMBO Mol Med. 2012, 4, 1144–1155. [Google Scholar] [CrossRef] [PubMed]
- Silverman, E.K. Genetics of COPD. Annu Rev Physiol. 2020, 82, 413–431. [Google Scholar] [CrossRef]
- Agusti, A.; Melen, E.; DeMeo, D.L.; Breyer-Kohansal, R.; Faner, R. Pathogenesis of chronic obstructive pulmonary disease: understanding the contributions of gene-environment interactions across the lifespan. Lancet Respir Med. 2022, 10, 512–524. [Google Scholar] [CrossRef]
Figure 1.
Flow chart of the study population. FFQ: Food frequency questionnaire, KNHANES: Korean National Health and Nutrition Examination Survey.
Figure 1.
Flow chart of the study population. FFQ: Food frequency questionnaire, KNHANES: Korean National Health and Nutrition Examination Survey.
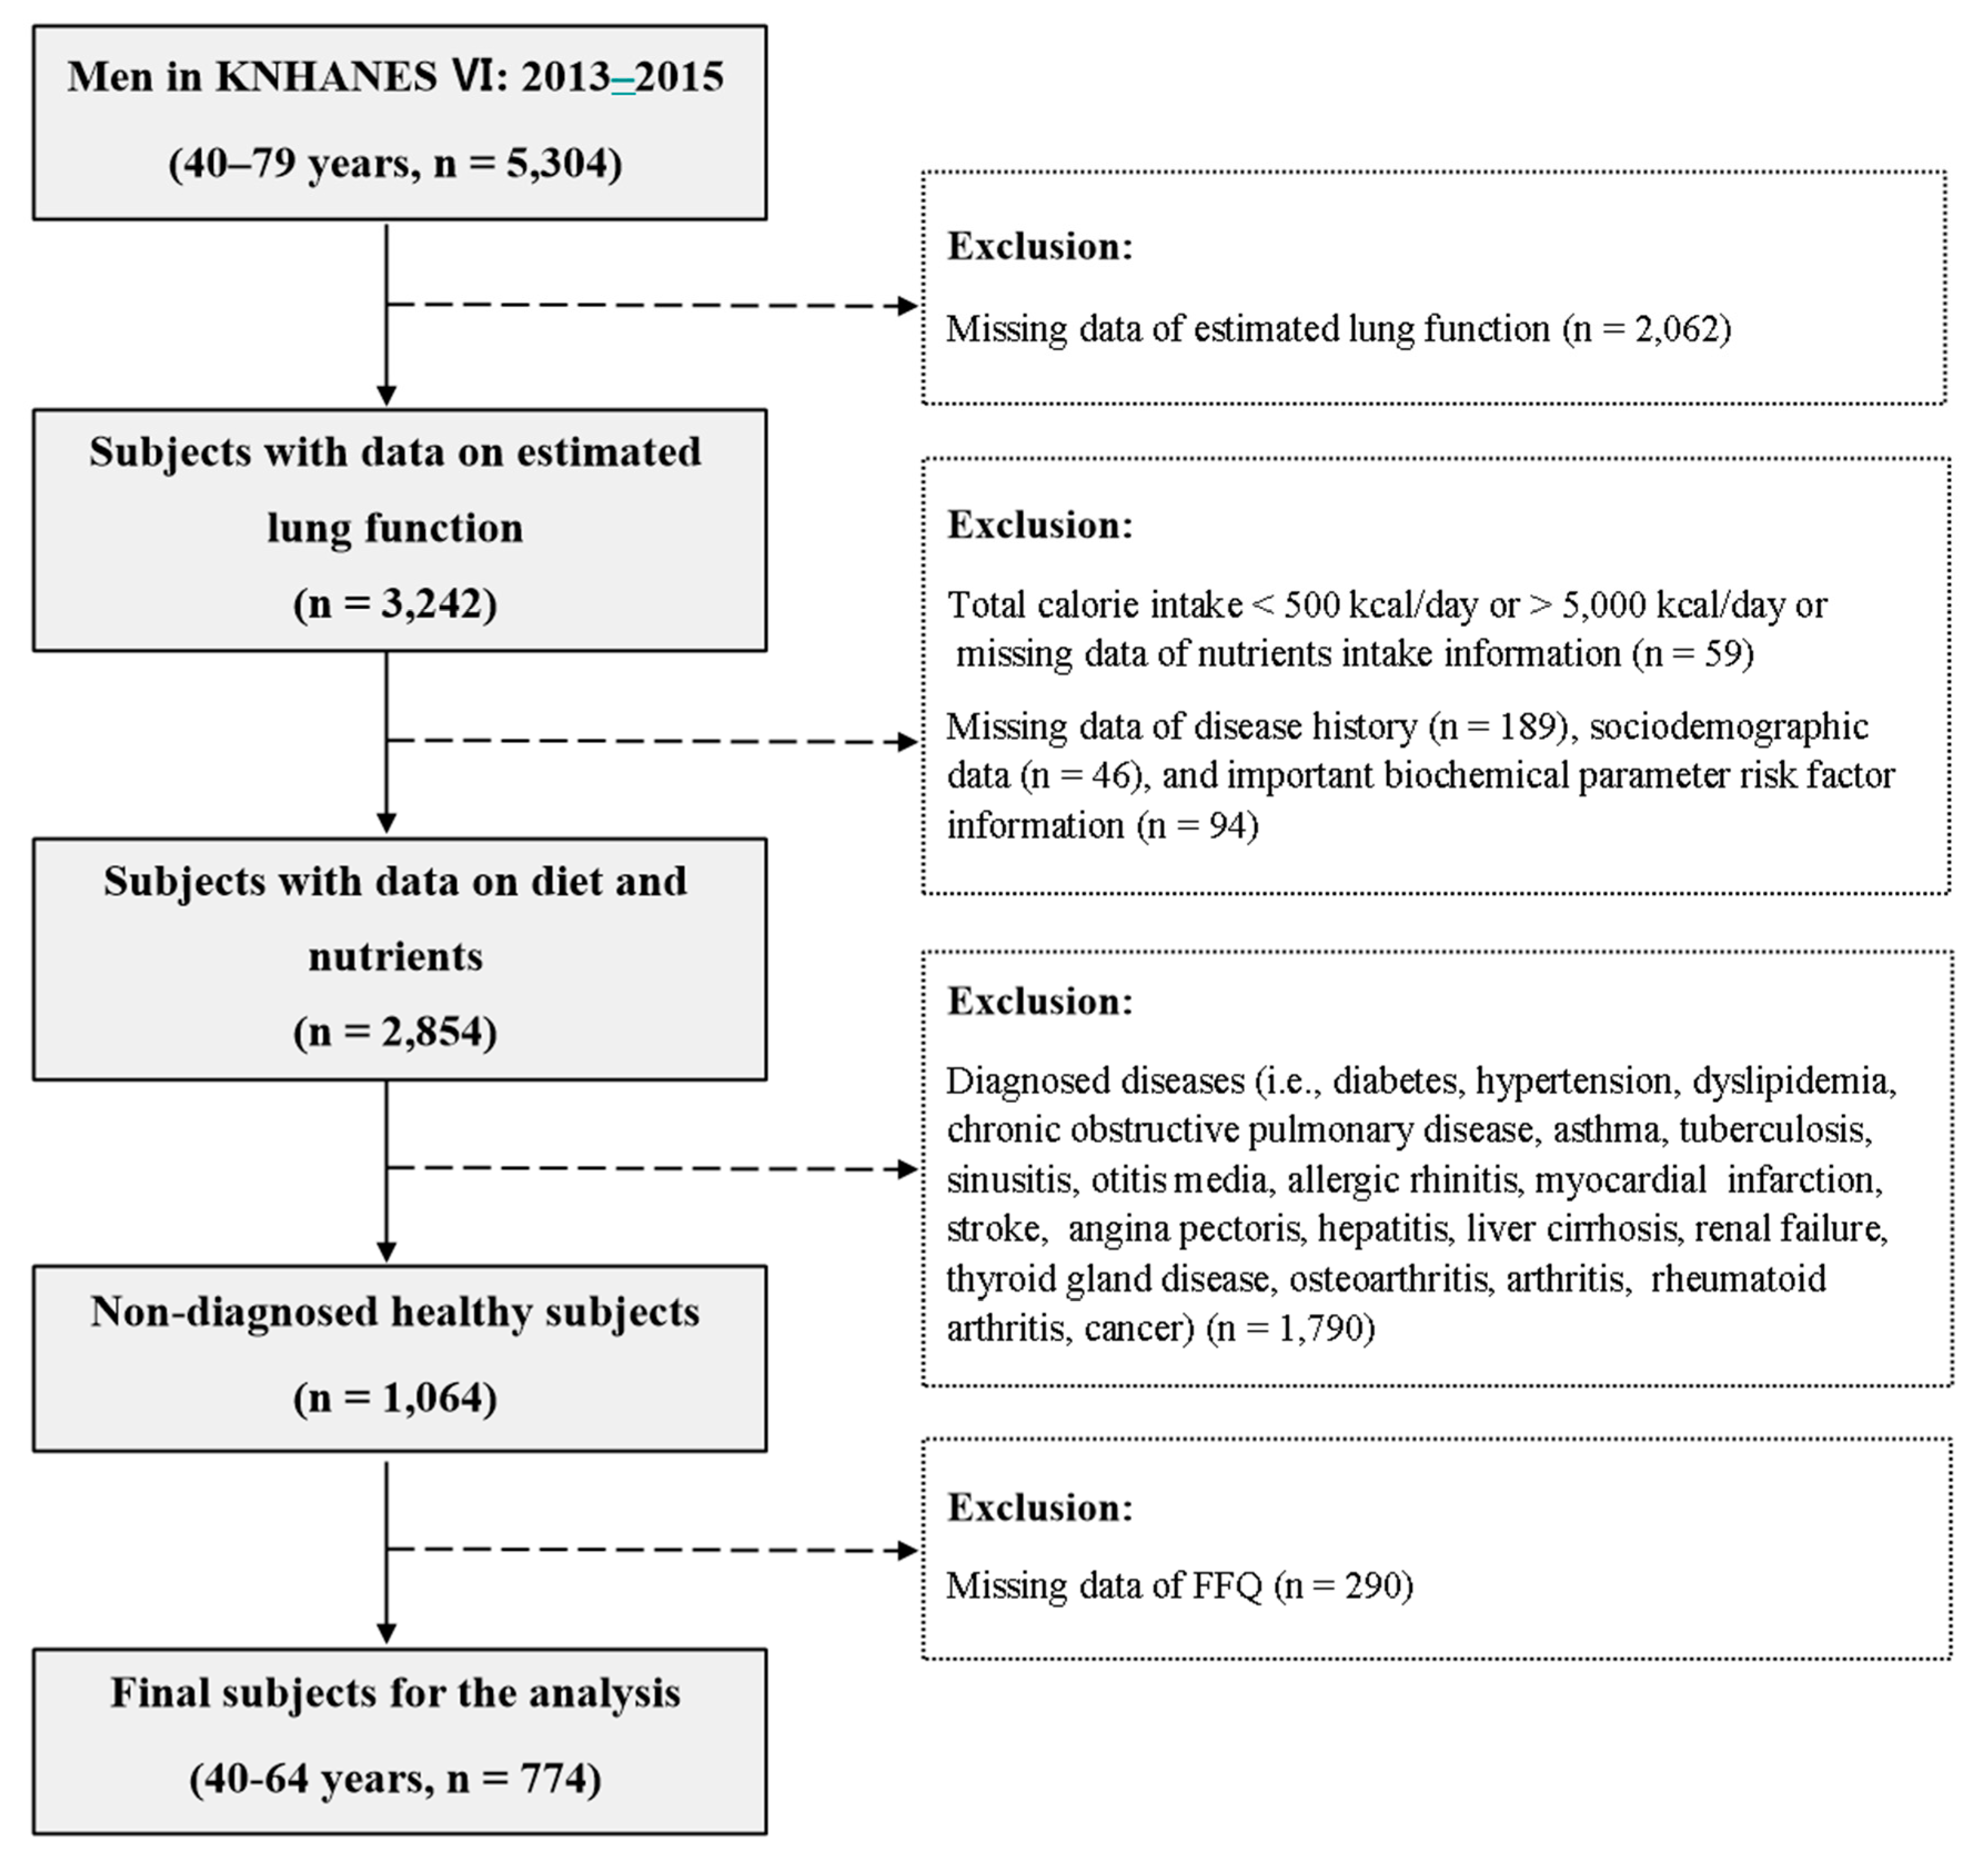
Figure 2.
ORs and 95% CIs for the risk of COPD according to the quartile of NEAP scores (Q1–Q4) and the smoking status. Odds ratio (confidence intervals), performed by the logistic regression model. Reference group: Never-smoker, Q1 group. ORs were calculated with adjustments for age, body mass index, total calorie intake, household income status, education status, and alcohol drinking. CI: Confidence interval, COPD: Chronic obstructive pulmonary disease, OR: Odds ratio.
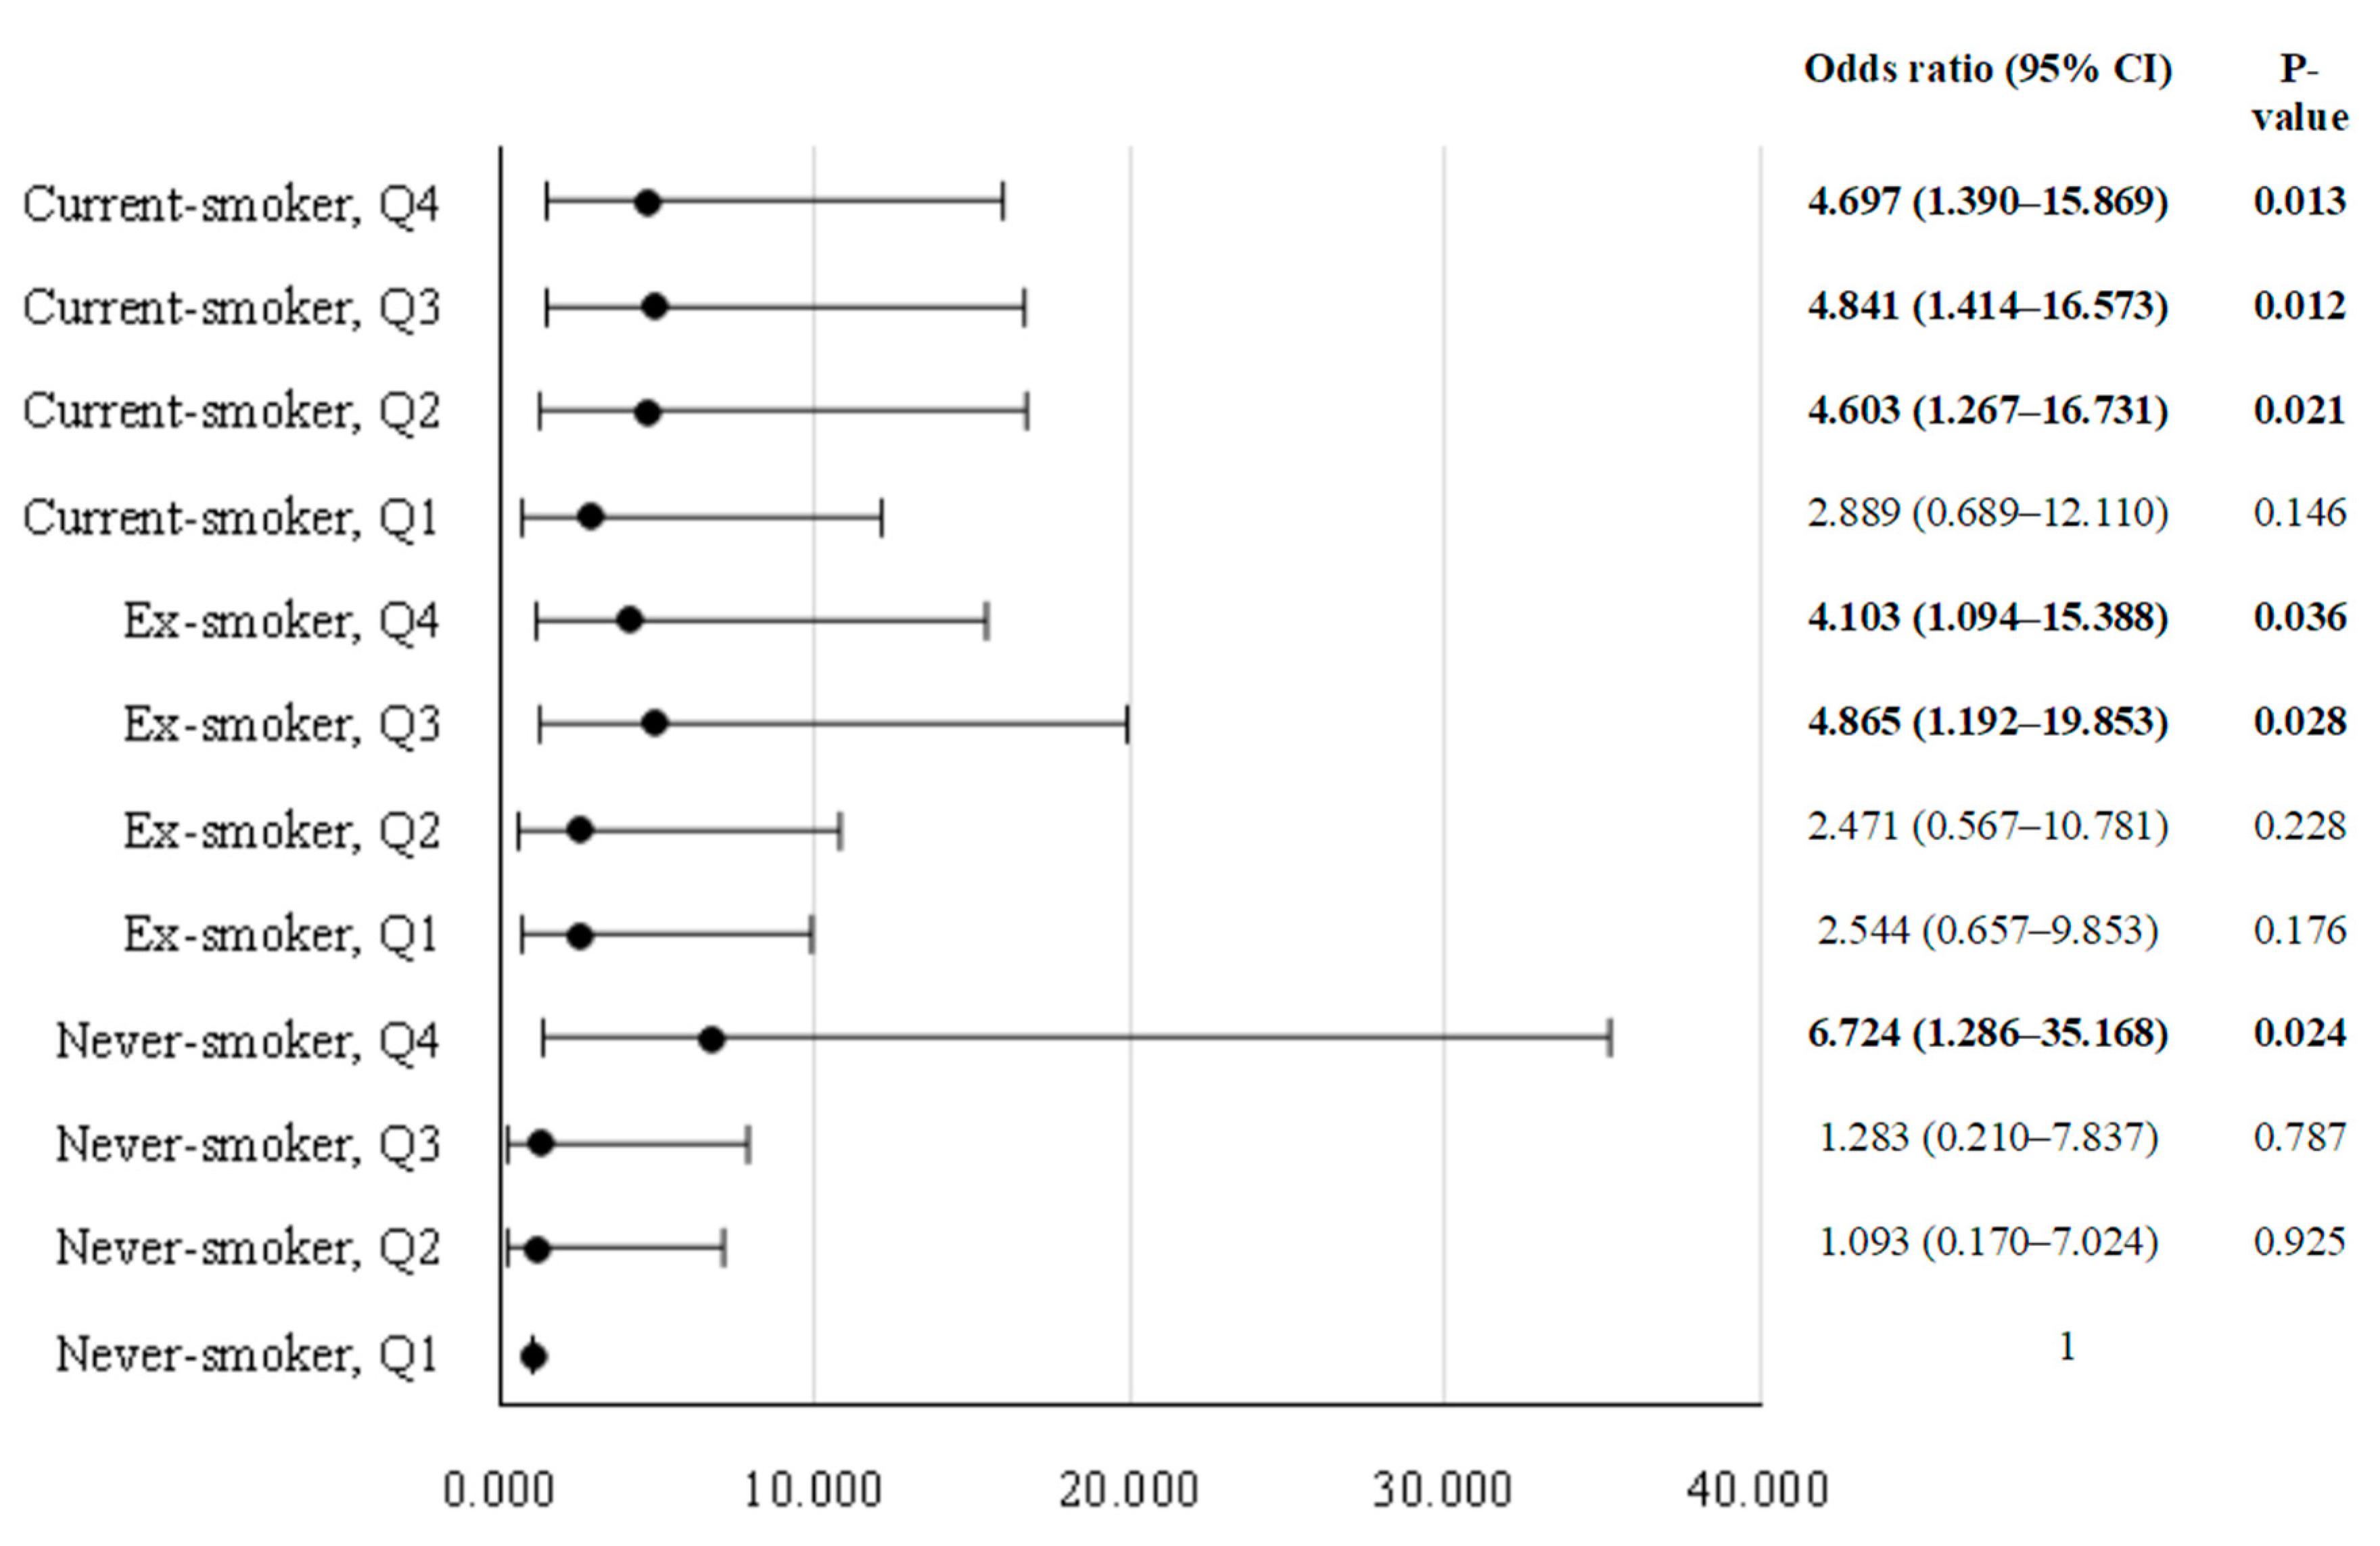

Table 1.
General characteristics of the study participants (n = 774) according to smoking status.
| Variables | Non-smokers (n = 168) |
Ex-smokers (n = 272) |
Current-smokers (n = 334) |
Total (n = 774) |
P-value |
|---|---|---|---|---|---|
| Age (y) | 49.05 ± 0.49 | 50.75 ± 0.40 | 48.95 ± 0.36 | 49.59 ± 0.24 | 0.001 |
| Education period (y) | |||||
| ≤ 12 | 81 (47.9%) | 158 (59.9%) | 206 (63.6%) | 445 (58.9%) | 0.009 |
| > 12 | 87 (52.1%) | 114 (40.1%) | 128 (36.4%) | 329 (41.1%) | |
| Household income status | |||||
| Lowest | 7 (4.2%) | 18 (5.9%) | 27 (7.4%) | 52 (6.2%) | 0.208 |
| Lower middle | 40 (25.2%) | 59 (24.9%) | 74 (23.5%) | 173 (24.3%) | |
| Upper middle | 44 (27.4%) | 84 (30.9%) | 118 (37.2%) | 246 (32.9%) | |
| Highest | 77 (43.2%) | 111 (38.3%) | 115 (31.9%) | 303 (36.5%) | |
| Current drinker | 104 (64.1%) | 203 (73.2%) | 280 (85.0%) | 587 (76.5%) | < 0.001 |
| COPD status, n (%) | 11 (6.4%) | 33 (12.0%) | 49 (12.8%) | 93 (11.1%) | 0.146 |
Means ± S.E tested by one-way analysis of variance; n (%) tested by χ2 test. COPD: Chronic obstructive pulmonary disease.
Table 2.
Anthropometric and biochemical parameters of the study participants (n = 774) according to smoking status.
Table 2.
Anthropometric and biochemical parameters of the study participants (n = 774) according to smoking status.
| Variables | Non-smokers (n = 168) |
Ex-smokers (n = 272) |
Current-smokers (n = 334) |
Total (n = 774) |
P0 | P1 | P2 | ||||||||
|---|---|---|---|---|---|---|---|---|---|---|---|---|---|---|---|
| BMI (kg/m2) | 24.24 | ± | 0.23 | 24.58 | ± | 0.19 | 24.21 | ± | 0.16 | 24.34 | ± | 0.11 | 0.319 | ||
| Height (cm) | 169.99 | ± | 0.51 | 170.44 | ± | 0.38 | 170.58 | ± | 0.38 | 170.34 | ± | 0.25 | 0.654 | 0.208 | 0.207 |
| Weight (kg) | 70.11 | ± | 0.73 | 71.53 | ± | 0.68 | 70.56 | ± | 0.57 | 70.73 | ± | 0.38 | 0.334 | 0.174 | 0.174 |
| Waist circumference (cm) | 83.86 | ± | 0.62 | 85.57 | ± | 0.52 | 84.34 | ± | 0.44 | 84.59 | ± | 0.31 | 0.079 | 0.206 | 0.209 |
| SBP (mmHg) | 116.44 | ± | 0.97 | 119.20 | ± | 0.81 | 117.34 | ± | 0.82 | 117.66 | ± | 0.51 | 0.065 | 0.228 | 0.183 |
| DBP (mmHg) | 79.86 | ± | 0.71 | 81.02 | ± | 0.66 | 78.69 | ± | 0.56 | 79.86 | ± | 0.37 | 0.024 | 0.006 | 0.004 |
| Fasting glucose (mg/dL) * | 97.94 | ± | 1.23 | 101.49 | ± | 1.18 | 103.09 | ± | 1.35 | 100.84 | ± | 0.72 | 0.008 | 0.053 | 0.094 |
| HbA1c (%)*† | 5.59 | ± | 0.04 | 5.73 | ± | 0.04 | 5.85 | ± | 0.04 | 5.72 | ± | 0.02 | < 0.001 | < 0.001 | < 0.001 |
| Total cholesterol (mg/dL) | 196.55 | ± | 2.58 | 199.45 | ± | 2.38 | 197.54 | ± | 1.91 | 197.85 | ± | 1.29 | 0.704 | 0.766 | 0.762 |
| Triglyceride (mg/dL) * | 142.30 | ± | 8.58 | 170.75 | ± | 10.20 | 201.97 | ± | 9.47 | 171.67 | ± | 5.36 | < 0.001 | < 0.001 | < 0.001 |
| HDL-cholesterol (mg/dL) | 46.03 | ± | 0.73 | 48.04 | ± | 0.74 | 45.82 | ± | 0.67 | 46.63 | ± | 0.42 | 0.051 | 0.002 | 0.003 |
| LDL-cholesterol (mg/dL) | 124.32 | ± | 2.37 | 121.46 | ± | 2.24 | 118.22 | ± | 1.86 | 121.33 | ± | 1.23 | 0.121 | 0.412 | 0.410 |
| AST (IU/L) * | 24.42 | ± | 0.82 | 24.83 | ± | 0.75 | 22.96 | ± | 0.44 | 24.07 | ± | 0.42 | 0.059 | 0.039 | 0.029 |
| ALT (IU/L) * | 27.46 | ± | 1.49 | 27.36 | ± | 1.55 | 24.75 | ± | 0.81 | 26.52 | ± | 0.78 | 0.270 | 0.284 | 0.193 |
| BUN (mg/dL) | 15.70 | ± | 0.32 | 15.71 | ± | 0.23 | 14.20 | ± | 0.21 | 15.20 | ± | 0.15 | < 0.001 | < 0.001 | < 0.001 |
| Creatinine (mg/dL) | 0.99 | ± | 0.01 | 0.97 | ± | 0.01 | 0.95 | ± | 0.01 | 0.97 | ± | 0.00 | 0.003 | 0.010 | 0.014 |
| Urine pH† | 5.82 | ± | 0.07 | 5.58 | ± | 0.05 | 5.54 | ± | 0.05 | 5.65 | ± | 0.03 | 0.007 | 0.004 | 0.005 |
| Urine creatinine (mg/dL)† | 180.94 | ± | 6.94 | 169.22 | ± | 5.09 | 184.84 | ± | 5.11 | 178.34 | ± | 3.38 | 0.061 | 0.146 | 0.155 |
| eGFR (mL/min/1.73m2) | 93.06 | ± | 0.88 | 93.95 | ± | 0.71 | 96.82 | ± | 0.67 | 94.61 | ± | 0.43 | 0.001 | 0.011 | 0.012 |
| FEV1 (% of predicted) | 93.62 | ± | 0.97 | 92.14 | ± | 0.78 | 91.22 | ± | 0.70 | 92.33 | ± | 0.48 | 0.140 | 0.088 | 0.099 |
| FVC (% of predicted) | 94.82 | ± | 0.91 | 94.70 | ± | 0.71 | 94.25 | ± | 0.65 | 94.59 | ± | 0.44 | 0.848 | 0.513 | 0.513 |
| FEV1/FVC | 0.79 | ± | 0.00 | 0.77 | ± | 0.00 | 0.77 | ± | 0.00 | 0.78 | ± | 0.00 | 0.009 | 0.040 | 0.053 |
Means ± S.E tested by one-way analysis of variance (unadjusted: P0) or general linear model methods (adjusted: P1, P2). P0: Unadjusted p-value, P1: Adjusted p-value for age, body mass index, total calorie intake, household income status, education status, and alcohol drinking, P2: Adjusted p-value for age, body mass index, total calorie intake, household income status, education status, alcohol drinking, and NEAP. *Tested after log-transformed, †missing data in a few subjects. ALT: Alanine aminotransferase, AST: Aspartate aminotransferase, BMI: Body mass index, BUN: Blood urea nitrogen, DBP: Diastolic blood pressure, eGFR: Estimated glomerular filtration rate, FEV1: Forced expiratory volume in one second, FVC: Forced vital capacity, HDL: High-density lipoprotein, LDL: Low-density lipoprotein, NEAP: Net endogenous acid production, SBP: Systolic blood pressure.
Table 3.
Nutrient intake information and DAL levels of the study participants (n = 774) according to smoking status.
Table 3.
Nutrient intake information and DAL levels of the study participants (n = 774) according to smoking status.
| Nutrient intake (per day) | Non-smoker (n = 168) |
Ex-smoker /(n = 272) |
Current-smoker (n = 334) |
Total (n = 774) |
P0 | P1 | P2 | ||||||||
|---|---|---|---|---|---|---|---|---|---|---|---|---|---|---|---|
| TCI (kcal) | 2390.44 | ± | 71.74 | 2499.39 | ± | 55.18 | 2481.05 | ± | 52.75 | 2456.96 | ± | 34.78 | 0.480 | ||
| Carbohydrate (% of TCI) | 64.38 | ± | 1.05 | 62.68 | ± | 0.85 | 58.30 | ± | 0.94 | 61.79 | ± | 0.55 | < 0.001 | < 0.001 | 0.022 |
| Protein (% of TCI) | 13.97 | ± | 0.36 | 13.75 | ± | 0.22 | 13.67 | ± | 0.23 | 13.80 | ± | 0.16 | 0.800 | 0.850 | 0.063 |
| Fat (% of TCI) | 17.95 | ± | 0.63 | 17.87 | ± | 0.48 | 18.15 | ± | 0.47 | 17.99 | ± | 0.30 | 0.917 | 0.793 | 0.928 |
| Dietary cholesterol (mg) | 269.94 | ± | 20.42 | 301.39 | ± | 16.71 | 323.70 | ± | 18.11 | 298.34 | ± | 10.49 | 0.159 | 0.489 | 0.645 |
| Dietary fiber (g) | 30.68 | ± | 1.18 | 30.43 | ± | 0.87 | 25.05 | ± | 0.77 | 28.72 | ± | 0.58 | < 0.001 | < 0.001 | < 0.001 |
| Calcium (mg) | 583.39 | ± | 26.33 | 608.02 | ± | 20.98 | 564.65 | ± | 17.63 | 585.35 | ± | 13.32 | 0.280 | 0.412 | 0.594 |
| Phosphorus (mg) | 1295.98 | ± | 40.89 | 1344.42 | ± | 31.08 | 1278.50 | ± | 31.53 | 1306.30 | ± | 20.76 | 0.281 | 0.332 | 0.235 |
| Iron (mg) | 20.11 | ± | 0.69 | 21.47 | ± | 0.56 | 20.28 | ± | 0.77 | 20.62 | ± | 0.41 | 0.196 | 0.585 | 0.668 |
| Sodium (mg)* | 4830.46 | ± | 250.10 | 4696.02 | ± | 140.66 | 4841.71 | ± | 172.78 | 4789.40 | ± | 111.03 | 0.968 | 0.410 | 0.485 |
| Potassium (mg)* | 3794.60 | ± | 160.81 | 3836.63 | ± | 123.92 | 3301.56 | ± | 86.13 | 3644.27 | ± | 76.52 | < 0.001 | < 0.001 | 0.022 |
| NEAP (mEq/day)* | 39.19 | ± | 1.36 | 41.63 | ± | 1.41 | 46.87 | ± | 1.25 | 42.56 | ± | 0.78 | < 0.001 | 0.001 | |
| NEAP (quartile) | |||||||||||||||
| Q1 | 54 (32.9%) | 80 (29.5%) | 60 (17.0%) | 194 (24.7%) | 0.001 | ||||||||||
| Q2 | 46 (26.0%) | 63 (22.9%) | 85 (23.5%) | 194 (23.8%) | |||||||||||
| Q3 | 36 (21.5%) | 61 (21.5%) | 96 (30.8%) | 193 (25.6%) | |||||||||||
| Q4 | 32 (19.6%) | 68 (26.1%) | 93 (28.8%) | 193 (25.9%) | |||||||||||
Means ± S.E tested by one-way analysis of variance (unadjusted: P0) or general linear model methods (adjusted: P1, P2); n (%) tested by χ2 test. P0: Unadjusted p-value; P1: Adjusted P-value for age, body mass index, total calorie intake, household income status, education status, and alcohol drinking; P2: Adjusted p-value for age, body mass index, TCI, household income status, education status, alcohol drinking, and NEAP. *Tested after log-transformed. NEAP: Net endogenous acid production, TCI: Total calorie intake.
Table 4.
Odd ratios (ORs) and 95% confidence intervals (CIs) for the risk of COPD among study participants (n = 774) according to smoking status.
Table 4.
Odd ratios (ORs) and 95% confidence intervals (CIs) for the risk of COPD among study participants (n = 774) according to smoking status.
| Model | Non-smoker (n = 168)(reference group) | Ex-smoker (n = 272) | Current-smoker (n = 334) | P-value for pattern | ||
|---|---|---|---|---|---|---|
| ORs (95% CIs) | P-value | ORs (95% CIs) | P-value | |||
| Model 1 | 1 | 1.974 (0.869–4.485) | 0.104 | 2.130 (0.975–4.654) | 0.058 | 0.161 |
| Model 2 | 1 | 1.700 (0.738–3.916) | 0.212 | 2.189 (0.992–4.831) | 0.052 | 0.144 |
| Model 3 | 1 | 1.711 (0.740–3.953) | 0.209 | 2.173 (0.989–4.772) | 0.053 | 0.146 |
| Model 4 | 1 | 1.680 (0.723–3.900) | 0.227 | 2.140 (0.969–4.725) | 0.060 | 0.159 |
| Model 5 | 1 | 1.654 (0.700–3.910) | 0.251 | 2.044 (0.904–4.620) | 0.086 | 0.217 |
| Model 6 | 1 | 1.745 (0.722–4.216) | 0.216 | 2.228 (0.931–5.333) | 0.072 | 0.188 |
| Model 7 | 1 | 1.711 (0.706–4.149) | 0.234 | 2.070 (0.852–5.031) | 0.108 | 0.272 |
Odds ratio (confidence intervals), performed by the logistic regression model. Reference group: Never-smoker group. Model 1: Unadjusted; Model 2: Adjusted for age; Model 3: Adjusted for age and body mass index; Model 4: Adjusted for age, body mass index, and total calorie intake; Model 5: Adjusted for age, body mass index, total calorie intake, education status, and household income status; Model 6: Adjusted for age, body mass index, total calorie intake, education status, household income status, and alcohol drinking; Model 7: Adjusted for age, body mass index, total calorie intake, education status, household income status, alcohol drinking, and NEAP. CI: Confidence interval, COPD: Chronic obstructive pulmonary disease, NEAP: Net endogenous acid production, OR: Odds ratio.
Table 5.
Odd ratios (ORs) and 95% confidence intervals (CIs) for the risk of COPD by the smoking among study participants (n=774).
Table 5.
Odd ratios (ORs) and 95% confidence intervals (CIs) for the risk of COPD by the smoking among study participants (n=774).
| Model | ORs (95% CIs) | |||
|---|---|---|---|---|
| Q1 (Reference group)(n=194) | Q2 (n=194) | Q3(n=193) | Q4(n=193) | |
| Model 1 | 1 | 1.055 (0.486-2.292) | 1.443 (0.705-2.955) | 1.689 (0.841-3.389) |
| Model 2 | 1 | 1.287 (0.574-2.885) | 1.831 (0.858-3.907) | 2.171 (1.039-4.535)* |
| Model 3 | 1 | 1.284 (0.568-2.904) | 1.834 (0.843-3.992) | 2.028 (0.951-4.322)† |
| Model 4 | 1 | 1.353 (0.586-3.126) | 1.928 (0.861-4.315) | 2.172 (0.980-4.811) |
| Model 5 | 1 | 1.293 (0.566-2.957) | 1.765 (0.787-3.962) | 2.011 (0.886-4.564) |
Odds ratio (confidence intervals), performed by the logistic regression model. Model 1: unadjusted; Model 2: adjusted for age; Model 3: adjusted for age, body mass index, total calorie intake, household income status, and education status; Model 4: adjusted for age, body mass index, total calorie intake, household income status, education status, and alcohol drinking; Model 5: adjusted for age, body mass index, total calorie intake, household income status, education status, alcohol drinking, and cigarette smoking. CI, confidence interval; COPD, chronic obstructive pulmonary disease; NEAP, net endogenous acid production; OR, odds ratio. *p<0.05, † p<0.1.
Disclaimer/Publisher’s Note: The statements, opinions and data contained in all publications are solely those of the individual author(s) and contributor(s) and not of MDPI and/or the editor(s). MDPI and/or the editor(s) disclaim responsibility for any injury to people or property resulting from any ideas, methods, instructions or products referred to in the content. |
© 2023 by the authors. Licensee MDPI, Basel, Switzerland. This article is an open access article distributed under the terms and conditions of the Creative Commons Attribution (CC BY) license (http://creativecommons.org/licenses/by/4.0/).
Copyright: This open access article is published under a Creative Commons CC BY 4.0 license, which permit the free download, distribution, and reuse, provided that the author and preprint are cited in any reuse.


