Submitted:
08 December 2023
Posted:
11 December 2023
You are already at the latest version
Abstract
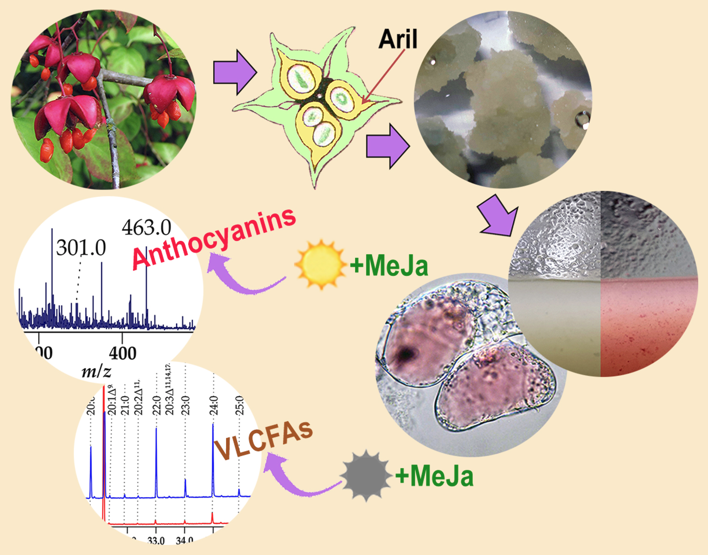
The genus Euonymus (L.) consists of shrubs or woody plants, distributed mainly in the Northern Hemisphere. To date, from Euonymus spp. several hundreds of different secondary metabolites have been isolated and identified. In addition, fatty oil was found in the fruits of some species of these plants, which accumulates not only in the seeds, but also in the arils. This study presents the research of unique long-term (ten-year-old) suspension cell cultures of Euonymus maximoviczianus Prokh. which were obtained from arils of unripe capsules. Suspension cells retain the ability to form oil droplets containing neutral lipids, both in the dark and in the light, the cells are able to synthesize very-long-chain fatty acids (VLCFAs), and can synthesize delphinidin-3-O-hexoside, cyanidin-3-O-hexoside, and peonidin-3-O-hexoside. Here, we research of the fatty acid, VLCFA, and anthocyanin biosynthesis dynamics in the subcultivation, as well as the influence of methyl jasmonate (MeJa) on these processes in the dark- and under-light-grown cell cultures. In the darkness, the formation of VLCFAs is more intense, and the biosynthesis of anthocyanins is significantly activated in the light. MeJA substantially enhances the biosynthesis of anthocyanins in the light and, surprisingly, the formation of VLCFAs in the darknss. In connection with the commonality of the cytosolic pool of malonyl-CoA, which is necessary both for the biosynthesis of VLCFAs and dihydroflavonols (and, ultimately, anthocyanins), the competition of these biosynthetic pathways is discussed.
Keywords:
anthocyanins
; aril
; Euonymus spp.
; jasmonates
; light
; malonyl-CoA
; plant cell culture
; TAG
; VLCFAs
1. Introduction
The Celastraceae (Lindl.) family is indigenous to the tropical and subtropical regions of the world, including North Africa, South America, and many parts of East Asia, particularly China. The family constitutes approximately 88 genera and 1300 species [1]. One of the largest genera, Euonymus L., belonging to this family, according to different authors, includes from 129 [2] to more than 200 species [3], broadly distributed in the temperate, subtropical, and tropical regions of the Old and New Worlds, predominantly in the Northern Hemisphere. Many species of Euonymus are widely cultivated in a landscape gardens or parks and are prized for their vibrant fall foliage and fruits in the form of pod-like capsules that are conspicuously pink-red in color which split open to reveal a pendants of seeds covered with fleshy orange or red arils [1,2].
Moreover, Euonymus species produce several hundreds of the secondary metabolites, including triterpenoids (e.g., oleanolic acid, lupeol, epifriedelanol, wilforlide, ursolic acid, etc.), sesquiterpenes (e.g., alatol, 3-deoxymatol, etc.), flavonoids (e.g., quercetin, kaempferol, naringenin, aromadendrene, etc.), alkaloids (e.g., evonine, neoevonine, alatamine, wilforine, etc.), steroids (e.g., 𝛼-spinasterol, daucosterol, etc.), euonymusosides, lignanoids, and other compounds [3]. Therefore, Euonymus species have been used in folk medicine in a number of countries [4] due to the fact that mentioned chemicals have antitumor, antimicrobial, antidiabetic, and insecticidal effects [3], and also have an ameliorating effect on cognitive impairments [5]. As before, species of the genus Euonymus continue to be sources of new, including rare bioactive natural chemical substances, such as dihydro-β-agarofuran sesquiterpene pyridine alkaloids [6], isopimarane diterpenoids [7], and (3β,16α)-3,16-dihydroxypregn-5-en-20-one [8].
Besides, the Euonymus species are deciduous or evergreen wild woody oil plants because both their seeds and arils (differentiated structures, juicy fleshy outgrowths associated with seed and/or funiculus) contain oils, but sharply differing in their composition [9,10]. They demonstrated that among the separate neutral acylglycerol (NAG) classes, the absolute content of 3-acetyl-1,2-diacyl-sn-glycerols (acDAGs) in the seeds was 1.5 orders of magnitude higher than that of 1,2,3-triacyl-sn-glycerols (TAGs). In contrast, in the arils TAGs were much more abundant than acDAGs. Thus, the proportion of TAG in the NAG of the seeds and arils of Euonymus species was 4–5% and ~ 98%, respectively [9,10]. The Euonymus species also differed markedly in the size, content and topography of oleosomes (lipid droplets/oil bodies) in the seeds and arils [9,11]. The Euonymus arils are polyfunctional structures, and one of their most important destiny, due to their vibrant color, fleshy consistency, and high oil content, is the attraction of seed distributors, the frugivorous animals [12].
The arils are not uncommon in representatives of various Angiospermae taxa, as well as in some Gymnospermae. The arils are juicy edible parts of such economically important plants as currant (Ribes spp. L.), lychee (Litchi chinensis Sonn.), passion fruit (Passiflora edulis Sims.), durian (Durio zibethinus L.), rambutan (Nephelium lappaceum L.), longan (Dimocarpus longan L.), mangosteen (Garcinia mangostana L.), etc. The arils often contain very important biologically active substances. For example, the arils surrounding nutmeg tree (Myristica fragrans Houtt.) seeds, main source of the mace spice contain highly biologically active compounds – malabaricone A, malabaricone C, nectandrin B, macelignan, etc. [13]. The dry spice contains up to 10% essential oil, the main component of which is sabinene (38.4%) [14]. The arils of gac fruit (Momordica cochinchinensis Spreng.), commonly used in its native countries as food and traditional remedies, are rich in lycopene, β-carotene, rutin, and luteolin [15]. Interestingly, the only non-poisonous parts of common yew (Taxus baccata L.), the red arils contain carotenoids with rhodoxanthin being the most abundant and showing the substantial cytotoxic potential, expressed in a dose-dependent manner towards the melanoma cell line, however, without obvious signs of a cytotoxic effect on human keratinocytes [16]. Returning to Euonymus, note that arils can also contain biologically active proteins, for example, the arils of spindle tree (Euonymus europaeus L.) contain very high concentration of the so-called Euonymus europaeus agglutinin (EEA) [17].
Overall, there is no doubt that the arils will still provide many biochemical surprises. The functions of the arils are not fully understood, they are optional parts of the fruits and are often very rich in nutrient reserves and biologically active molecules [18]. It seems interesting to obtain in vitro cell cultures of the arils. Such cell models will allow studying the regulation of synthesis and accumulation of primary and possible secondary metabolites. In addition, a like cell cultures may be of biotechnological importance.
We chose Euonymus maximowiczianus Prokh. as the object. The arils of the seeds of its ripe fruits contains almost 70 times more TAG than the seeds themselves [10]. In addition, these arils are funicular-exostome structures in nature [9], i.e., ontogenetically and cellularly linked with ovary wall, future pericarp. Therefore, under the certain conditions, the activation of anthocyanin biosynthesis, which is inherent in the ripening pericarp, can be expected.
Experimental plant biologists have known for many years that somatic plant cells are amenable to be reprogrammed, which happens in vitro. Here exposed to the proper conditions, even the most specialized plant cells can be induced to express a genes that otherwise would only be expressed at much earlier morphogenesis stages. That is, under in vitro conditions, cell dedifferentiation occurs. For example, in the definition of Jopling et al. [19] this process “involves a terminally differentiated cell reverting back to a less differentiated stage from within its own lineage”. This situation presupposes a return to active proliferation of cells that have received earlier and therefore broader developmental potencies. The presence of active proliferation is the essence of the establishment and existence of plant cell cultures in vitro, but at the same time, this is a certain limiting framework. The processes incompatible with active cells’ division, in particular, the synthesis and accumulation of some secondary metabolites and large-scale creation of nutrient reserves, will not be willingly supported by cultured plant cells. The study of these issues seems to be important for current plant cell biology.
It should be noted that to date, long-term callus and suspension cell cultures of Euonymus spp. have not been obtained, nor have been studied the influence of elicitors, in particular jasmonates, on the biosynthesis of secondary metabolites in in vitro cells of these species.
Due to this, the aim of the present study was to establish the suspension culture of Euonymus maximowiczianus (E. max.) aril-originated cells in order to clarify five main issues. 1) Is the cell culture of E. max. capable to synthesize and accumulate TAG, as well as retain these properties during long-term cultivation? 2) What are the other stable features of lipid metabolism in E. max. cell culture? 3) Is it possible to “wake up” the biosynthesis of anthocyanins in the cell culture of E. max.? 4) What are the molecular species of anthocyanins and is the cell culture of E. max. capable to support the biosynthesis of anthocyanins during long-term cultivation? 5) To what extent do conditions that normally stimulate anthocyanin biosynthesis (e.g., in-light growth, methyl jasmonate treatment) affect very-long-chain fatty acid (VLCFA) biosynthesis, given that these metabolic pathways are fueled by a common precursor, malonyl-CoA?
2. Materials and Methods
2.1. Reagents and Consumables
Unless otherwise noted, reagents used for the preparation of culture media, methyl jasmonate, dyes, solvents, chromatographic standards, acids, alkalis, inorganic and organic salts, filter paper, TLC plates, and miscellaneous were purchased from Merck KGaA (Darmstadt, Germany). Serological pipettes, test tubes, microplates, cuvettes, and tips were purchased from Eppendorf (Hamburg, Germany).
2.2. Plant Material
Euonymus maximowiczianus Prokh., a plant species of the genus Euonymus L. of the Celastraceae (Lindl.) family, indigenous to the Russian Far East and adjacent areas of China, North Korea and Japan. Deciduous tree up to 8 m tall, with an ovoid crown, branches drooping at the ends and a trunk up to 12 cm in diameter, sometimes growing bushy. Species was named after the Russian botanist Maximowicz K.I. In the report “Flora of China” [20], for unknown reasons, it is described as a synonym for the Sakhalin euonymus (Euonymus sachalinensis). Currently, the scientific community accepts Euonymus maximowiczianus Prokh. as an independent species [21].
Unripe capsules of E. max. were collected in mid-July 2011 in the arboretum of the Main Botanical Garden of the Russian Academy of Sciences (located at the coordinates: 55°50’35.1”N 37°36’17.9”E), Moscow. The supervision was performed by Dr. Trusov N.A., as well as taxonomic identification [21]. Collected fruits of E. max., which were between the stage I (the globular embryo stage) and stage II (the stage of a mature embryo and unripe fruit) of embryo development [9], were used for callus induction. Fully opened deep red-pink capsules and seeds coated by orange arils (Figure 1a) were collected separately in mid-September 2021, snap frozen in liquid nitrogen, and stored at –80 °C until analysis for anthocyanins.
The suspension cell culture of Arabidopsis thaliana (L.) Heynh., ecotype Col-0, strain NFC-0 from the All-Russian Collection of Higher Plant Cell Cultures was cultivated as described earlier [22] and used as a control sample for microscopic detection of lipid droplets.
2.3. Callus Induction
Unripe capsules of E. max. were rinsed with a plenty of tap water, first surface-sterilized in 70% ethanol for 3 min and washed for 10 min in sterile distilled water, second sterilized in 0.1% HgCl2 solution with 0.01% Tween-20 for 20 min and washed three times (10 min each) in sterile distilled water. The capsules were shortly dried on filter paper, cut across, then the cut seeds were taken out together with light yellow arils (Figure 1b) and placed into 6-cm vented Petri dishes (Thermo Fisher Scientific, Waltham, Massachusetts, USA) on the surface of Schenk and Hildebrandt (SH) [23] nutrient agar medium containing 0.5 mg/L 2,4-dichlorophenoxyacetic acid (2,4-D), 0.5 mg/L α-naphthaleneacetic acid (NAA), 0.1 mg/L kinetin, 5 mg/L thiamine hydrochloride, 0.5 mg/L pyridoxine hydrochloride, 5 mg/L nicotinic acid, 100 mg/L meso-inositol, 30 g/L sucrose, and 7 g/L agar (Duchefa Biochemie, Haarlem, The Netherlands). Explants were cultured in the darkness at 25–26 °C and 60–70% RH. Two weeks later, callus began to form from the arils. The primary calli were separated from the explants and transferred into new 6-cm Petri dishes with the same medium for further propagation.
2.4. Derivation of Suspension Cell Cultures
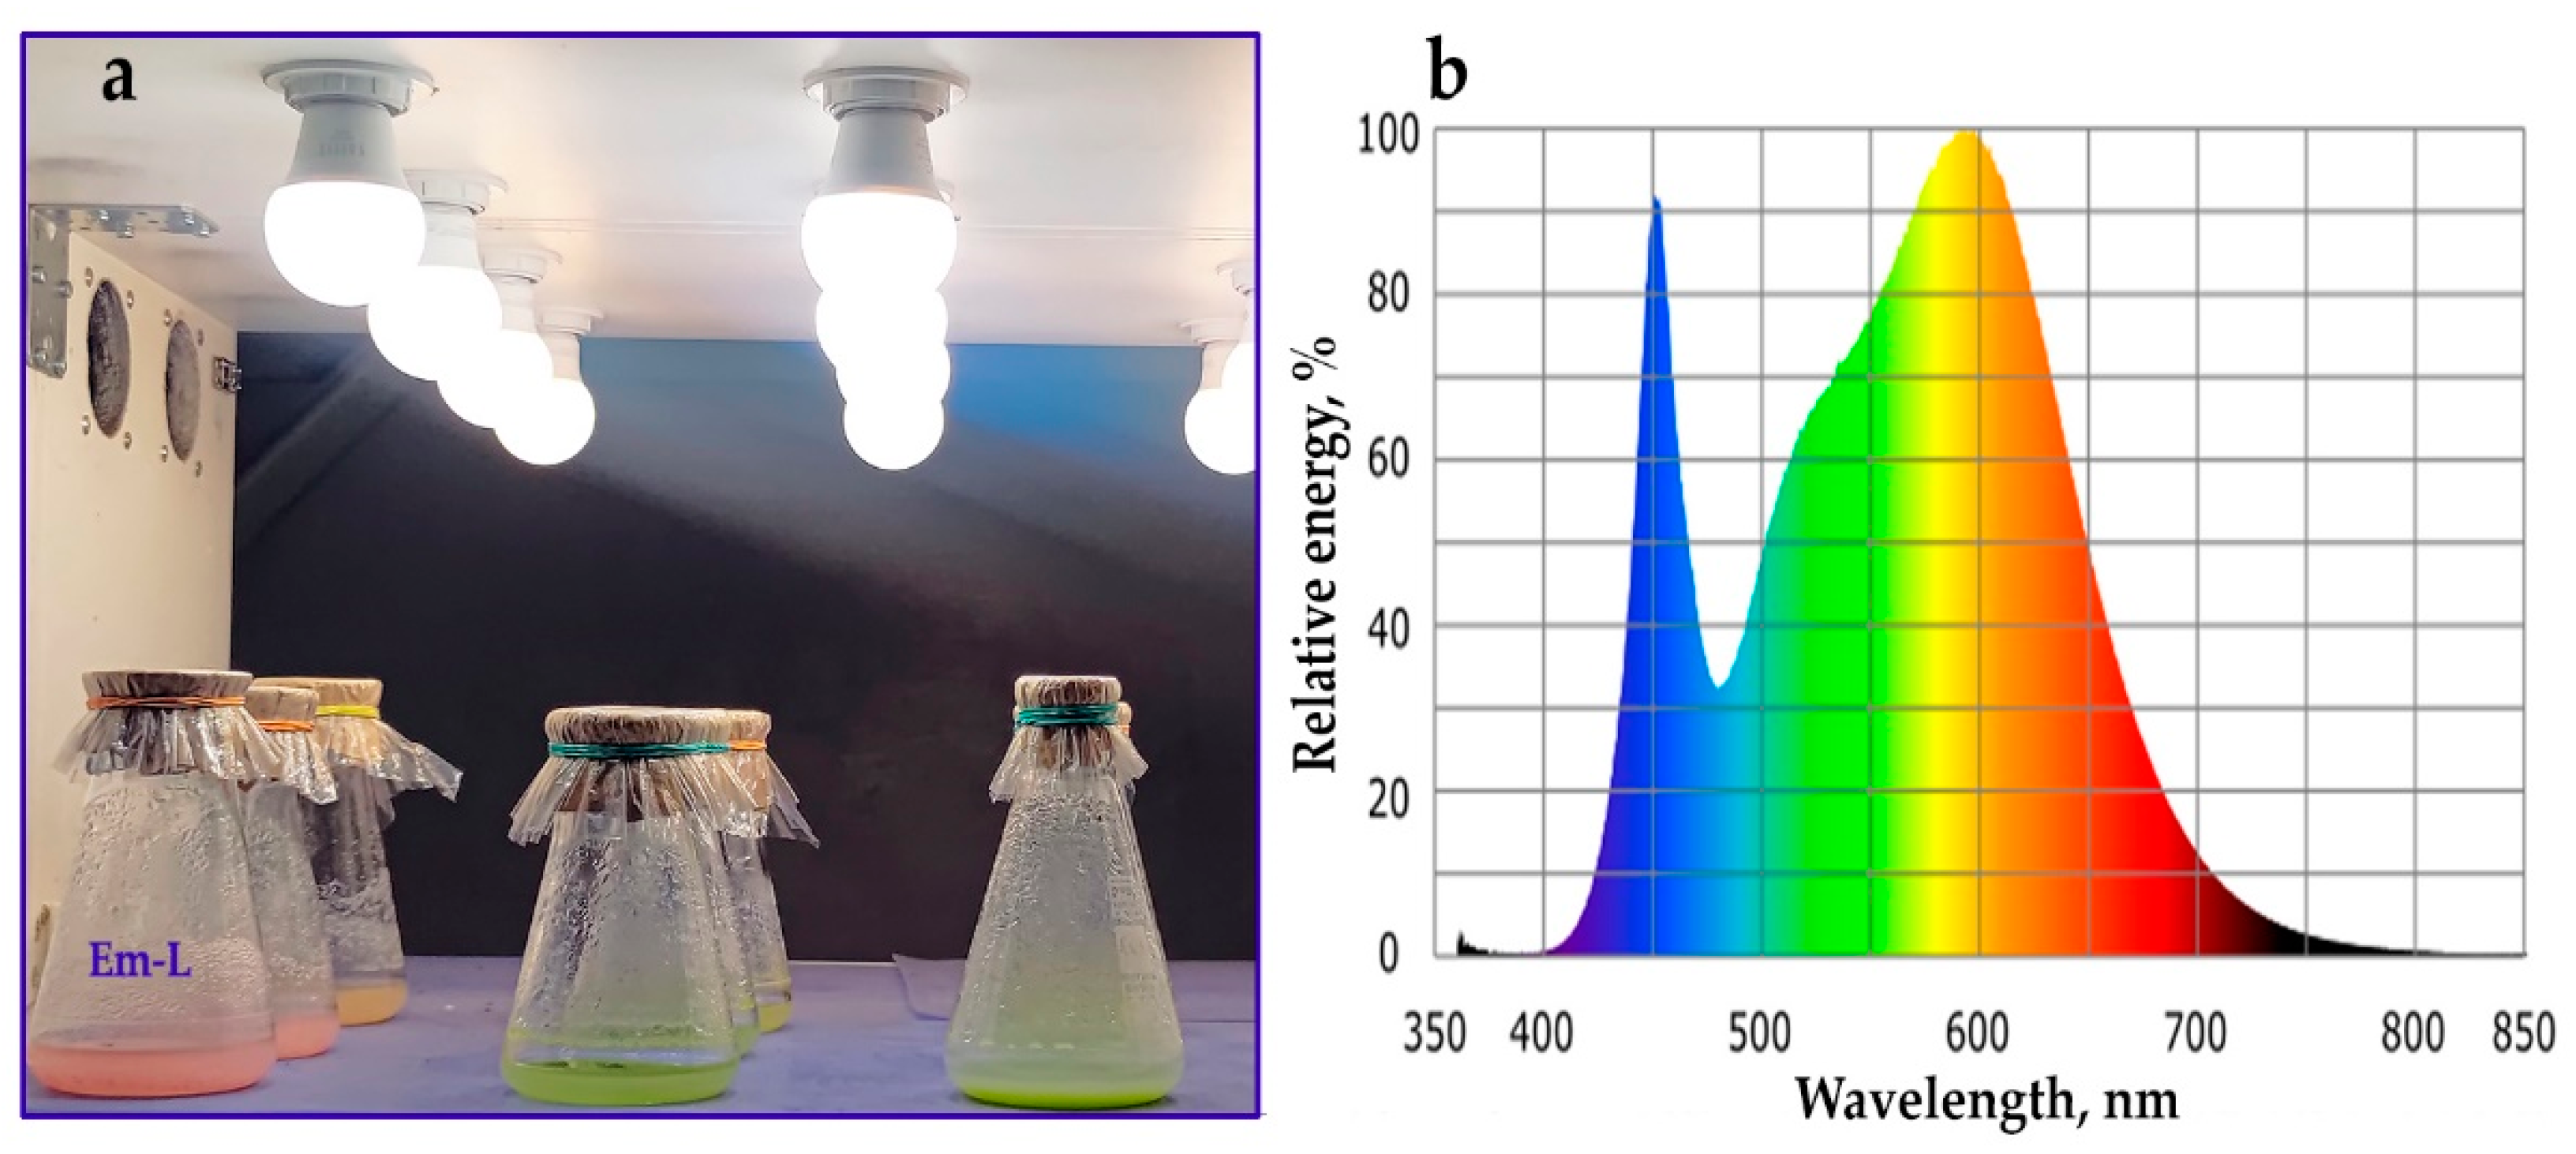
After four weeks friable aril-derived callus from several Petri dishes (approximately 500 mg) was dispersed in liquid SH medium (20 mL) of the same composition as above, but without NAA and with 1 mg/L 2,4-D. On 20 days, the entire volume of this suspension cell culture (20 mL) were inoculated into 50 mL of fresh SH medium. Further passages were carried out every 20 days, trying, if possible, before transfer to fresh medium, to gently destroy large cell aggregates with a pipette. As the growth rate of the cell culture increased, the inoculum was changed; until 2015, 20-mL inoculum was kept, then until 2019, 15 mL of inoculum per 50 mL of medium was used. At present, the aril-derived suspension cell culture of E. max. subcultured every 20 days, namely, 10 mL of inoculum is transferred to 50 mL of SH medium in 250-mL wide-necked Erlenmeyer flasks, covered with aluminum foil discs (Rotilabo®, Carl Roth, Karlsruhe, Germany), kraft paper and cellophane. Since 2017, two lines of E. max. cell suspension cultures have been maintained, one line – Em-D is grown in the darkness in a thermostatically controlled room (25 ± 1 °C and 65 ± 5% RH) on an orbital shaker (100 ± 5 rpm), the second line – Em-L grows under the conditions described above, but under illumination with GP LEDA60-14WE27-40K lamps (Figure A1a) at 50 µmol photons m–2 s–1 and 16/8-h (day/night) photoperiod; lamps have a relative spectral emission shown in Figure A1b.
Macrophotographs of callus tissue and cell suspensions in flasks were taken with a PowerShot G9 X Mark II digital camera (Canon Europe, Uxbridge, Middlesex UK).
2.5. DNA Fragment Analysis
To identify possible genetic differences between the Em-D and Em-L cell cultures, short tandem repeats (STR) amplification was used with the subsequent high resolution DNA fragment analysis by capillary electrophoresis. In October 2023, samples of the Em-D and Em-L suspension cell cultures in the active growth phase were taken, frozen in liquid nitrogen and stored at –80 °C. Genomic DNA was isolated using the GenElute Plant Genomic DNA Miniprep Kit (Merck). To identify and amplify the microsatellite loci of E. max. we used a primer design developed for the microsatellite loci ef01, ef02, ef04, and ef09 of Euonymus fortunei, established as a result of genomic sequences obtained from double-digest restriction site associated DNA [24]. Microsatellite loci were selected based on the largest number of alleles and observed heterozygosity for Euonymus fortunei [24]. Primer synthesis and DNA fragment analysis procedure were carried out at “Syntol” Company (Moscow, Russia) where CFX96 Touch Real-Time PCR Detection System (Bio-Rad, Hercules, California, USA) and 24-capillary 3500xL Genetic Analyzer (Applied Biosystems, Foster City, CA , USA) were applied.
2.6. Determination of Growth Characteristics and Sampling
To determine the growth parameters, cell suspensions were grown in a series of flasks, at least three flasks per point. For evaluating a fresh weight (FW), cells were separated from culture medium on Whatman 52 filter paper under vacuum, using a Büchner funnel and a Bunsen flask and weighed. To determine dry weight (DW), cell biomass after FW measurement was dried in plant tissue dehydrator GL-FD-635S (Gemlux, Moscow, Russia) to constant weight (approximately for 48 h) at 40 °C. The maximal growth indices for FW (IFW) and DW (IDW) of suspension cell cultures were evaluated during a subcultivation using the formulas:
where, FW0, DW0 and FWmax, DWmax are, respectively, FW and DW of suspension cultures at the beginning of sub-culture and ones at the time point of their maxima. The specific growth rates for FW (µFW) and DW (µDW) were calculated as:
where, FW0, DW0 and FWe, DWe are, respectively, FW and DW at the start and the end points within the chosen interval of exponential growth phase; ∆t is the duration of this interval. The doubling time of FW and DW in the exponential growth phase was determined by the formulas:
IFW = (FWmax − FW0)/FW0; IDW = (DWmax − DW0)/DW0,
µFW = (1nFWe – lnFW0)/∆t; µDW = (1nDWe – lnDW0)/∆t,
τFW = ln2/µFW; τDW = ln2/µDW.
Cells viability was estimated by the number of cells unstained with 0.02% aqueous solution of Erythrosin B.
For the quantitative determination of anthocyanins, at least three 300–500 mg samples of fresh cell biomass prepared as for FW were wrapped in aluminum foil, frozen in liquid nitrogen, and stored at –80 °C. Parallel weights were used to determine DW and water content.
2.7. Light Microscopy
For microscopy of cultured cells, 30-40 μl of cell suspension was dropped onto the glass slide and covered with a cover slip. Then, cells were observed in bright field mode and photographed using a Carl Zeiss Axio Imager D1 microscope with an AxioCam MRc camera (Oberkochen, Germany).
To visualize lipid droplets, 30 µL of Nile red solution (1 mg/mL in DMSO) was added to 30 mL of cell suspension and incubated for 1 h at room temperature. Then, the medium with the dye was removed from the flask as much as possible with a pipette, and 30 mL of fresh SH medium was added. Preparations were made as described above and then observed using transmitted light and epifluorescence an Axio Imager Z2 microscope with Apotome (device for optical sectioning in fluorescence imaging) and an MRm camera (Carl Zeiss, Oberkochen, Germany). The filter sets 43 HE and 65 HE, excitation 545/25 and 475/30 nm, emission 605/70 and 550/100 nm, were used to visualize membrane or neutral lipids (e.g., TAGs) in red or yellow, respectively [25]. The photos were taken in the multichannel recording mode in program AxioVision 4.8.; in the photographs, the yellow-green fluorescence of lipid droplets is shifted to the green for better perception [26]. Alternatively, lipid droplets were stained with BODIPY 505/515 (at final concentration 5 μg/mL and 30 min incubation in the dark) or a combination of BODIPY 505/515 and Nile red with the same post-wash procedure as for Nile red. Filter set 38, excitation 470/40, emission 525/50 was used to visualize neutral lipids in green after BODIPY 505/515 staining.
2.8. Quantification of Triacylglycerols
Unfrozen cells of the suspension cultures ca 4–12 g of FW were homogenized with mortar and pestle in liquid nitrogen, transferred into 50-mL tubes followed by extraction of neutral lipids with 25 mL benzene contained 0.0001% butylhydroxytoluene as an antioxidant for three times at 20 min, the extracts were combined and then the solvent was evaporated by using rotary vacuum evaporator IKA RV-10 (IKA-Werke, Staufen, Germany) and the dry residue was dissolved in chlorophorm in a volume of 200 μL. Triacylglycerols (TAGs) were isolated from the extract by TLC with Merck Silica Gel 60 TLC plates with n-hexane : diethyl ester (70 : 30 v/v) as a mobile phase. Zone, contained TAGs (Rf ≈ 0.65), was visualized under UV λ=365 nm, pre-staining the plate by spraying with 0.05% metanolic solution of 2′7′-dichlorofluorescein. Alternatively, TLC plates were dipped into a staining solution consisting of 0.02% Coomassie brilliant blue in 20% methanol [27]. After 30 min, the plates were removed from the staining solution, immersed in 20% methanol, and allowed to stand for 3 min with gentle agitation. The plates were removed from the stain removal solution and air dried. As a TAG standard, 10 μg of glyceryl trioleate was used. The silica gel with absorbed TAGs was scraped-off from the plate followed by extraction of TAGs with 2 mL of n-hexane : diethyl ester (1 : 1 v/v), after that the solvent was evaporated under argon stream and dried TAGs were weighted.
2.9. Qualitative and Quantitative Composition of Fatty Acids in the Total Lipids
Unfrozen fresh cell biomass (150–200 mg) was placed into a 2-mL Eppendorf tubes, 1 mL of 1 M KOH in 80% aqueous ethanol was added and margaric acid (25.2 ng in 100 µL isopropanol) was also added, as an internal standard; the tubes were stored at –20 °С. The tubes were brought to room temperature, vigorously shaken on a Biosan Microspin vortex (BioSan, Riga, Latvia) and kept for 60 min in a solid-state thermostat (Biosan) at 75 °C. Then n-hexane (300 μL) was added, the tubes were shaken vigorously, and the top layer, which contained unsaponifiable compounds, was removed. Sulfuric acid (20%, 100 μL) was introduced into the resulting suspension to a slightly acidic reaction (pH of 4.5–4.7 according to the paper test), and the free fatty acids were extracted with n-hexane (300 μL). The hexane solution was transferred into Eppendorf tubes and dried under argon stream, after which sulfuric acid in absolute methanol (1%, 150 μL) was added to the dry residue. The tubes were kept for 30 min at 55 °C in a solid-state thermostat. Fatty acid methyl esters (FAMEs) thus obtained, were extracted with 200 μL of n-hexane and stored at –20 °C before analysis.
The composition of FAMEs were analyzed by GC-MS on Agilent 7890A GC (Agilent, Santa Clara, USA) with a quadrupole mass-detector Agilent 5975C fitted with a 60-m capillary column HP-88 (inner diameter 0.25 mm, thickness of stationary phase—(88%-cyanopropyl)aryl-polysyloxane)—250 μm). The prepared FAMEs were separated under the following conditions: carrier gas Helium at 1 mL/min and sample volume 1 μL. Splitless injection was used and the evaporator temperature was 260 °C. The oven temperature program was as follows: 8 min hold at 60 °C, from 60 °C to 175 °C at 12 °C/min (5 min hold at this temperature), to 245 °C at 9 °C/min (20 min hold at this temperature). The operational temperature of the ion source of the mass-detector was set to 230 °C, and the ionization energy to 70 eV. GC-MS data were processed via Chemstation and OpenChrome software.
2.10. Extraction of Total Anthocyanins and their Quantification by pH-Differential Spectrophotometrical Method
A methanol : water : trifluoroacetic acid (80 : 19.9 : 0.1, v/v/v) extracting solution was added to frozen cell samples (300–500 mg) placed in 5-mL screw cap tubes, in a ratio of 5 : 1 (v/w). The tubes were vigorously shaken with a vortex “Reax top” (Heidolph Instruments, Schwabach, Germany) 4 times within an hour and kept in the dark at +4 °C overnight. Then the tubes were shaken up and the extracts were separated from the cells using a CM-6MT centrifuge (Elmi SIA, Riga, Latvia), 30 min at 3500 rpm. The supernatants were transferred into 2-mL Eppendorf tubes and centrifuged in Heraeus®-Biofuge® fresco (Kendro Laboratory, Hanau, Germany) at +4 °C, 16,000× g, 30 min; the cell-free extracts were transferred into new Eppendorf tubes and stored at +4 °C not more than three days before using for spectrophotometric determination of anthocyanins, as well as for HPLC MS/MS analysis. Note that for ripe E. max. capsules, one flap was randomly selected from each of 5–7 capsules, all together they ground into powder in liquid nitrogen with a mortar and pestle, ~500 mg were taken, and then extracted as described above. An average sample of 10–15 ripe arils was processed in a similar way.
The pH-differential spectrophotometry was used to determine the total anthocyanin concentration. Monomeric anthocyanins (as opposed to the polymeric form of anthocyanins and other pigments, which are resistant to color change) reversibly change color with a change in pH; the colored oxonium form exists at pH 1.0, and the colorless hemiketal form predominates at pH 4.5. The difference in the absorbance of the anthocyanins at 520 nm under pH 1.0 and pH 4.5 is proportional to their concentration [28]. Additionally the absorbance was measured at 700 nm to subtract the turbidity of the samples. Extracts in a volume of 200 µL were added to two series of test tubes containing 800 µL of buffer solutions: pH 1.0 buffer (0.025 M KCl; pH was adjusted to 1.0 ± 0.05 with HCl) and pH 4.5 buffer (0.4 M sodium acetate; pH was adjusted to 4.5 ± 0.05 with HCl); the contents of the tubes were mixed and 200 µL were taken into each well of 96-well microplates, in triplicate. As a standard, we used cyanidin chloride in an extracting solution (0.25 mg/mL), from which a series of dilutions was prepared to construct a calibration curve. Dilutions of the standard were mixed with buffer solutions similarly to the experimental samples and 200-μL aliquots were added to a series of microplate wells in parallel with experimental ones. Absorbance was measured using a Synergy H1 Multimode microplate reader (Agilent Technologies, Santa Clara, USA). The difference in the adsorption of samples at two pH values, corrected for the turbidity of the solutions, was calculated using the formula:
ΔA = (A520 nm – A700 nm)pH 1.0 – (A520 nm – A700 nm)pH 4.5.
A calibration curve was constructed on which the ΔA values were plotted as a function of the concentrations of the standard. Prepared different concentrations of the standard and calculated by the linear regression formula coincided with the coefficient of determination, R2 = 0.999. The concentration of total anthocyanins (in cyanidin equivalent) in the samples was determined from the calibration curves, the data were recalculated taking into account the water added to the extract by the sample, and expressed as mg/g DW.
2.11. Anthocyanin Identification by HPLC-DAD and HPLC-ESI-MS/MS
The separation of anthocyanins was carried out using the Shimadzu LC-20 Prominence chromatograph (Shimadzu Europa GmbH, Duisburg, Germany) with the Shimadzu SPD20MA diode matrix detector and MN Nucleodur C18 column (250 × 4.6 mm, phase particle size 5 μm). The solvent mixture, 4% aqueous formic acid (solvent A) and methanol (solvent B) used as a mobile phase. The mode with gradient constituents was applied at separation: 0 min – 80% A, 20 min – 20% A. The flow rate was 1 mL/min, column temperature was 24 °C; sample volume was 20 μL. The detection was carried out at λ = 520 nm.
LC–MS and MS/MS analyses were performed to confirm the molecular formulas of fragment ions. The experiments were carried out using the Agilent Technologies modular 1290 equipped with a 6430 mass analyzer (Agilent Technologies, Palo Alto, USA) with an electrospray ionization source (ESI). The HPLC column and conditions for the mobile phase gradient for anthocyanins identification were the same, as reported above for the HPLC-DAD separation. Mass spectra were recorded in the positive ion mode in the range 100-1600 (m/z) under the following conditions: drying gas temperature 320 °C, drying gas flow rate 12.0 L/min, capillary voltage 4000 V, fragmentor potential 150 V, nebulizer gas pressure 45 psi, spray voltage 5000 V, and skimmer voltage 45 V. For obtaining MS/MS fragment ions, argon was used as a collision gas. The optimal collision energy was 5 eV. The MS has been applied to reveal the positive molecular ions, and the MS2 to break down the most abundant ones by collision-induced dissociation. The mass differences between molecular ions and MS2 product ions were used to identify substitutions on the aglycone backbone. An Agilent MassHunter Workstation has employed for data acquisition and processing. The identification of compounds was done by comparing spectral characteristics of sample compounds, as well as by fragmentation, and comparison of the obtained fragments with the literature data, e.g [29].
2.12. Treatment of Cell Suspension Cultures with Methyl Jasmonate
In experiments with methyl jasmonate (MeJa), 6 flasks of suspension cell cultures of Em-D and Em-L were additionally prepared and cultivated for 9 days under standard conditions, in the darkness and in the light, respectively. MeJa stock solution was prepared under sterile conditions, for which 100 µL MeJa and 900 µL methanol were added to a test tube, then 900 µL methanol was added to 100 µL stock solution in a new tube to obtain a working solution. Then, 28 μL of MeJa working solution was added to 3 flasks with 50 mL of a nine-day Em-D and Em-L cell suspensions, which gave a MeJa concentration of 25 μM. An appropriate amount of methanol was added to the control flasks to a final concentration of 0.05%. All MeJa-supplemented flasks and controls were returned to orbital shakers under standard conditions for 5 days. Experiments with MeJa were carried out twice.
2.13. Statistical Analysis
Experimental data on the growth parameters, the amount of FAs in total lipids, the amount of TAGs, and the content of anthocyanins are presented as the average values of the arithmetic means of triplicate values for the same time-point from 2–3 independent passages. Data are presented as mean ± SD and statistical analysis was performed using SigmaPlot 14.0 software package (Systat Software Inc., San Jose, CA, USA). The significance of the differences between compared data was analyzed by one-way ANOVA with a Holm-Sidak all pairwise multiple comparison post hoc test. The data were considered significantly different at p ≤ 0.05.
3. Results and Discussion
3.1. Callus Induction, Suspension Cell Cultures Derivation and Their Growth Characteristics
For callus induction, we used Schenk and Hildebrandt (SH) medium with α-naphthaleneacetic acid (NAA), 2,4-dichlorophenoxyacetic acid (2,4-D), and kinetin, which is often used to establish and maintain cultured plant cells of different species [23]. The SH medium was also successfully used in our studies [22,30]. One of the goals of the present work was to obtain a cell culture from aril tissues. It is obvious that rather friable arils surrounding mature seeds of fully opened capsules of Euonymus maximowiczianus are not suitable explants for any long-term manipulations with and surface sterilization of them (Figure 1a). Because of this, unripe capsules of E. max. were chosen as a source of primary explants. The sterile capsules were cut across and the cut seeds were pulled out together with the arils (Figure 1b). It was seemed more benign than the separation of the arils, which could be severely damaged in this case. Note that callus did not form either from the embryo or endosperm. Callus began to form from the arils already after two weeks on SH medium. The primary calli were separated from explants and transferred to new Petri dishes to grow them a little without explants and check the axenicity of the culture (Figure 1c). Four weeks after induction, the friable aril-derived callus served as the source of the initial cell suspension culture of E. max. in liquid SH medium. Two years later, in 2013, the cell suspension showed stable growth. However, the cell suspension increased the growth rate, and the for subculture inoculum was gradually reduced from 20 mL to the current 10 mL per 50 mL medium. In addition, at first, the cell suspension was grown in the darkness, but even under these conditions, by the end of the passage (on days 20–21), the cells periodically had a pink tint, and by the 30th day they had a pale carmine color. At the same time, when an acid was added, the suspension acquired a pronounced red color, and the addition of an alkali led to the appearance of a blue-green color, which indicated the presence of anthocyanins. Therefore, since 2017, the suspension cell cultures of E. max. have been maintained in the form of two lines, one grows in the darkness – Em-D, the other grows under the light – Em-L. However, despite relatively long-term cultivation in the dark or in the light, no differences were detected in the DNA profiles at microsatellite loci of the Em-D and Em-L cell cultures to date (Figure S1 and Table S1).
Compared to the 2013 cell suspension, the Em-D and Em-L cell cultures are currently growing faster (Figure 2 and Table 1). The maximum growth indices (IFW and IDW) have become higher (Table 1). The maximum increase in FW and DW is more than 10 days ahead of the initial culture (Figure 2), which is due to almost twice the specific growth rates, therefore, two times shorter the biomass doubling times (Table 1).
Certainly, there are strains of cultured plant cells that grow faster than Em-D and Em-L, for example, the well-known tobacco cultured cells, BY-2 or Arabidopsis thaliana cell culture (NFC-0 strain), for which the specific growth rates of DW (µDW) have been shown as 0.94 and 0.86 day–1, respectively [31,32]. However, cell populations with a specific growth rate > 0.12 day–1 are considered to be suitable for the large-scale biotechnological applications [33]. For example, the suspension cell cultures of Dioscorea deltoidea Wall., Panax japonicus (T. Nees) C.A. Mey., and Taxus baccata L., producing pharmacologically important secondary metabolites, have the specific growth rates, 0.16, 0.12, and 0.22 day–1, respectively, comparable to the µDW of the Em-D and Em-L cell cultures, and two times lower values for the maximum DW accumulation [34,35,36].
Note that the Em-D and Em-L cell cultures contain more water that initial one throughout the subcultivation (Table 1). Currently, the active cell proliferation, accompanied by massive synthetic processes and, consequently, an increase in DW, ends by day 11 (Figure 2b), and then the water uptake, hence an increase in FW (Figure 2a) and cell volume expansion prevail.
In general, the callus and suspension cell cultures of Euonymus, namely E. europaeus were once mentioned in the literature in 1980, without any details of their obtaining and growth, as well, with an unknown further history [37]. The literature also contains information about a short-term maintained embryogenic callus culture of Euonymus europaeus [38] and about a one-year-old embryogenic suspension cell culture of Euonymus alatus [39], which were used to study the efficiency of somatic embryogenesis and plant regeneration. Therefore, the long-term maintained suspension cell cultures of E. max. were derived for the first time in the present work. As for obtaining cell culture from arils’ tissues, the only work on this subject indicates that red mature arils of Taxus spp. did not grow in culture, possibly due to a significant cell lysis at this stage. Green arils displayed relatively intense growth during the first 10 to 15 days of culture, but no visible growth occurred after this period [40].
3.2. TAG Content and Fatty Acid Composition of Total Lipids during Subcultivation of E. max. Suspension Cell Cultures
As noted above, the arils of Euonymus spp., especially were being ripe, accumulate a large amount of triacylglycerols (TAGs), which are deposited in the special structures, lipid droplets [9,10,11]. In the present study E. max. arils were used as explants when embryo development was between the stage I (the stage of a globular embryo) and stage II (the stage of a mature embryo and unripe fruit). At this time, small of similar size (~2 μm) lipid droplets could be observed in aril tissues, and TAG content was about 5–7% of its amount in mature arils [9]. Apparently, the processes of dedifferentiation accompanying cell culture derivation did not completely turn off their ability to synthesize and accumulate TAGs. As can be seen in the Nile red-stained preparations (Figure 1d,g), after two years of periodic subculture, the suspension-cultured cells typically contained many small lipid droplets and solo droplets of 2–3 μm in size. After another ten years of cultivation, this pattern was preserved (Figures 1e,h and S2), perhaps, there are now fewer small lipid droplets and more ones of 4–5 μm in size. For comparison, in a fast growing suspension cell culture NFC-0 of Arabidopsis thaliana cultured in vitro for 17 years, have no lipid droplets detected (Figure 1f). The amount of TAGs increased compared to the initial suspension cell culture, but its wave-like profile remained during subcultivation, and the maximum TAG content found on day 21 in the Em-D cell culture was 12.5 mg/g DW (Figure 3 and Figure S3). This corresponds to approximately 6.5% of TAG content in the arils of ripe E. max. fruits [10] and accounts for 1.25% of the DW at 21st day of passage.
Seeds are the major storage site for lipids, where synthesized TAGs are packaged into lipid droplets/oil bodies/oleosomes during seed maturation, and the oil-seed tissues typically contain large amount of TAGs, more than half of the total weight [41]. However, a cultured plant cells as actively proliferating should mainly synthesize polar lipids for the assembly of new cell membranes. Therefore TAG content (even if the primary explants actively synthesized TAGs) in photosynthetic and non-photosynthetic plant cell cultures ranges in 5–15% of total lipids [42]. Certainly, more TAG accumulates in the cells committed to embryogenesis. For example, the non-embryogenic suspension cell culture of Pimpinella anisum L. had a relatively low TAG content (up to 2% DW), and in the embryogenic culture, the amount of TAG was up to 15% DW [43]. In the microspore-derived suspension cell culture of Brassica napus L., the amount of TAG was 4.5% DW and increased following an increase in the concentration of sucrose in the medium [44].
In general, although the “oleaginosity” of the Em-D and Em-L cell cultures is not very high, it is important that the ability to synthesize and accumulate TAGs has preserved during a more than ten-year in vitro cultivation, and these non-embryogenic cell cultures are the useful models for our ongoing studies in the mechanisms of TAG reserve formation.
The cultured plant cells being in active proliferation reproduce cells like to themselves, in which alike membrane structures are formed, therefore, during this period, a generally stable pattern of the fatty acid (FA) composition of total lipids can be expected. (Note: here and below, for brevity, when data on the composition of FAs are considered, data on the composition of the corresponding methyl esters of FAs, FAMEs, which were analyzed by GC-MS, are meant). Indeed, Figure 4a demonstrates that in the initial E. max. cell culture, the proportions of the five major FAs of total lipids in fact remained unchanged during the 21-day DW linear growth period (Figure 2b) usually associated with cell proliferation. In the current cultures, Em-D and Em-L, the period of linear DW accumulation lasts ~11 days (Figure 2b), that is accompanied with a more or less stable quota of the main FAs during this period (Figures 4b,c and S4). Further, proliferation in the populations of Em-D and Em-L cells subside and cells enter the stationary stage of growth, although the processes of water uptake and increase in FW continue (Figure 2a). By the end of subcultivation, the high cell biomass density is reached, about 300 g/L (Figure 2a).
A high cell density usually makes it difficult to mix a cell culture and leads to a decrease in oxygen mass transfer [45], i.e., to a certain degree of hypoxia. This should lead to the accumulation of ethylene, which is good seen, for example, when plants are flooded [46]. In addition, by the end of subcultivation the nutrient medium is depleted of sucrose, nitrogen, phosphorus, etc., and all these factors activate cell senescence that terminates in programmed cell death [47,48]. In any way, after the completion of active divisions, cells enter a stage of proliferative quiescence, and not a metabolic rest, which can manifest itself in a change in the activity of some biosynthetic or catabolic pathways.
So, in the Em-D and Em-L suspension cell cultures in the stationary growth phase, the ratio of 18-carbon FAs changes substantially. The proportion of stearic acid (18:0) increases significantly, while the level of linoleic (18:2) and oleic acids (18:1), and to a lesser extent α-linolenic acid (18:3), falls (Figures 4b,c and S4).
It is possible that, under hypoxic conditions, oxygen depletion limits desaturation of FAs, as was demonstrated with sycamore (Acer pseudoplatanus L.) suspension cell culture, when under the oxygen concentration below 60 μM, the molar proportion of oleate increased dramatically whereas that of the linoleate decreased [49]. Also, anaerobically growing rice coleoptiles showed that under anoxic conditions there is no net biosynthesis of unsaturated FAs [50]. However, it is a fact that Arabidopsis thaliana SAD6 desaturase is able to be induced and actively operate under hypoxic conditions [51]. It now appears that the desaturation of fatty-acyl chains in diverse lipid species represents a strategy for protecting plants from hypoxia-induced damage, and this is mainly due to the signaling role of unsaturated long-chain and very-long-chain acyl-CoAs in plant responses to hypoxia [52]. But even so, it is difficult to imagine a great benefit from increasing the proportion of unsaturated FAs (UFAs), which are part of the most important structural lipids, during reoxygenation, since under these conditions UFAs will be the first and accessible targets of lipid peroxidation.
It is not clear to what extent such a change in the ratio of 18-carbon FAs (Figure 4b,c) during the transition of the in vitro E. max. cell populations from the exponential growth phase to the stationary one is common for other plant cell cultures. In our recent study on suspension cell cultures of cancer bush (Sutherlandia frutescens (L.) R. Br.), obtained from hypocotyl and cotyledon explants, at the end of the active growth phase, approximately the similar proportions were observed for palmitic (16:0), oleic and linoleic acids, but the cultures were more than five times poorer in stearic acid and near two times richer in α-linolenic acid [30]. Also, in the callus culture of camelthorns (Alhagi persarum Boiss. et Buhse) obtained from the hypocotyl, at the end of the subcultivation cycle, total lipids have had similar percentages of palmitic and stearic acids as the Em-D and Em-L cell cultures in the stationary growth phase, but have had near two times lower and higher of linoleic and α-linolenic acid, respectively [53]. The C18 FAs of total lipids in Arabidopsis suspension cell culture T87 were mostly represented by linoleic and α-linolenic acids and in BY-2 tobacco cell culture linoleic acid was the most abundant [54] as in the Em-D and Em-L cell cultures. Unfortunately, no studies were found that examined the lipid and FA compositions during plant cell culture cycles, except for the work of Coline Meï et al. [55], which a correlation between the growth rate of a cell population and the level of unsaturation of C18 FAs was supposed on the dark-grown cell culture of Acer pseudoplatanus, ligt-grown cell suspension and calli of Arabidopsis thaliana. That is, in fast-growing tissues (calli) or in highly dividing cells (cell suspension cultures), the proportion of PUFAs (18:2 + 18:3) is lower than in slow growing ones [55]. In the present study, we found the opposite pattern, at least with linoleic acid (Figure 4b,c). Undoubtedly, this important issue requires further research.
3.3. Very-Long-Chain FA Proportion and Composition during Subcultivation of E. max. Suspension Cell Cultures
Another peculiarity of lipid metabolism in the suspension cultures of E. max. – a noticeable increase in the level of very-long-chain FAs (VLCFAs, sum of saturated and unsaturated FAs with 20–26 carbon atoms) in the composition of total lipids in the stationary growth phase, i.e., after completion of the increase in DW, that was preserved during long-term cultivation (Figure 5).
VLCFAs are synthesized as VLC-acyl-CoAs by the endoplasmic reticulum-localized FA elongase (FAE) multiprotein complexes [56,57]. One of the two main participants in the synthesis of VLCFAs is malonyl-CoA, which is produced by both plastidial and cytosolic acetyl-CoA carboxylases (ACC). The second participant is any of the saturated or monounsaturated long-chain (LC) FAs (C16 and C18) produced in the plastid and activated in the cytosol as LC-acyl-CoAs. Next, four core enzymes of FAE complex perform sequential reactions, beginning with a condensation of a LC(n)-acyl-CoA (as a primer) and malonyl-CoA (as a two-carbon donor) catalyzed by β-ketoacyl-CoA synthase (KCS) to give a β-keto-LC(n+2)-acyl-CoA, then function β-ketoacyl-CoA reductase, β-hydroxyacyl-CoA dehydratase, and enoyl-CoA reductase to form a LC(n+2)-acyl-CoA, which can further elongated by repeated cycles [56,57]. Take note of KCS determines the chain-length substrate specificity of each elongation cycle [56,57,58].
Note that VLCFAs are a components of certain, non-minor lipids involved in various physiological processes, such as carbon-energy storage, membrane vesicle trafficking, cell differentiation, prevention of water loss aside of stomatal regulation, etc. [56,59]. Some more, VLCFAs may be a precursors of valuable chemicals [60]. Also, VLCFAs play an essential role in plant cell expansion [61] and limit cell proliferation [62], so it seems logical has an increase their level when cells stop dividing and begin to expand intensively (Figure 5). There is evidence that hypoxia, which, apparently, in our case, is formed at the end of the cultivation cycle of suspension cell cultures that have gained a large biomass, promotes the biosynthesis of VLCFAs, and VLCFAs, in turn, activate the synthesis of ethylene and its signaling [52,63]. Phosphatidylserines (PS) are minor membrane lipids containing a lot of VLCFAs. And in relation to PS, Li et al. demonstrated that PS’ acyl chains are lengthened during plant development, aging and under environment-provoked stresses, the increase in acyl chain length is also accelerated due to prompted-senescence [64].
An increase in the proportion of VLCFAs after 14th day is more active in the dark (Figure 5), and not all VLCFA molecular species, detected by GC-MS increase their levels in the same way (Figure 6 and Figure S4). The main players are arachidic (20:0), behenic (22:0), tricosanoic (23:0), lignoceric (24:0), and pentacosanoic acids (25:0), which increase almost proportionally from 21 to day 31, both in the dark-grown suspension cell culture, Em-D (Figure 6a) and light-grown, Em-L (Figure 6b). It can be seen that the process of elongation of FAs with an even number of C atoms actively proceeds up to 24:0 and there are no signs of substrate deficiency and a decrease in the activity of the corresponding KCS. FAs with an odd number of C atoms are lengthened to 23:0 (up to 0.83% in the Em-L cells) and further, at the level of 25:0, elongation stops (Figure 6). In general, the mechanism of formation of VLCFAs with an odd number of C atoms — 21:0, 23:0, and 25:0 is still not completely clear. It is supposed that odd-chain VLCFAs can either be products of α-oxidation of saturated even-chain VLCFAs, or products of β-oxidation in peroxisomes. Odd-chain FAs, similar to even number FAs, can arise in the C2-elongation reaction if propionyl-CoA is used instead of acetyl-CoA as the primer for the biosynthesis of LCFAs, and these LCFAs will be used in the further elongation reaction [57]. Odd-chain VLCFAs are rare in nature and have low concentrations. For example, pollen coat of Nicotiana tabacum L. contains a significant amount of VLCFAs (about 43%), but only 1.4% of tricosanoic acid [65].
Considering the total quota of VLCFAs accumulating in the Em-D and Em-L suspension cell cultures in the stationary growth phase (Figure 5), we can assume that it is not at all small (4–5%). It is possible that the accumulation of VLCFAs is indeed associated with cultured cell population senescence in a growth cycle. Near values of the total percentage of VLCFAs were demonstrated in under-light-grown callus and in dark-grown suspension cell cultures of Sutherlandia frutescens containing 4.7 and 2–2.4% VLCFAs, respectively, at the end of the subcultivation [30].
3.4. Anthocyanin Production in the Em-D and Em-L Cell Cultures during Subcultivation
Anthocyanins, probably the best known and popular plant secondary metabolites, are flavonoids and not only give plants an attractive coloration, but also have antioxidant characteristics and protect plants against adverse environments through scavenging stress-induced ROS molecules. Anthocyanins are also bioactive molecules and commonly used in foods due to their attractive color and increasingly being understood as a health benefit plant metabolites [66,67,68].
The primary callus tissue (Figure 1c) had a light greenish-beige hue and after transfer into liquid medium, the initial cell suspension was grown in the darkness. As already mentioned in section 3.1., periodically the cell culture had a pink tint or pale carmine color and a simple test with changing the pH of the medium showed that the cells produce anthocyanins. The suspension cell culture of E. max. has been maintained as two lines, one grows in the dark – Em-D, and the other – Em-L under illumination with LED lamps (see section 2.4.) for a more pronounced manifestation of the ability to synthesize anthocyanins, since light is an essential regulatory factor in this process [67,69,70].
Externally, the Em-D and Em-L cell suspensions are very different at the end of subcultivation (Figure 1l). However, despite relatively long-term cultivation in the dark or in the light, no differences were detected in the DNA profiles at microsatellite loci of the Em-D and Em-L cell cultures to date (Figure S1 and Table S1). At the same time, both ten years ago (Figure 1i) and now (Figure 1j,k), the cells are very heterogeneous in terms of the presence of anthocyanins and the intensity of their accumulation. Even in a file of several recently divided cells, some remained colorless, while others, as a result of ill-known regulation at a neighbor-cell level, began to synthesize anthocyanins actively (Figure 1i, right). It is noticeable, that there are more cultured Em-L cells with more intense color of vacuole-deposited anthocyanins (Figure 1k).
In whole plants, anthocyanins accumulate in the vacuoles of cells of certain tissues. There is also a mosaic pattern in their accumulation, as, for example, in apple skin cells [71], in the subepidermal layer of Hydrangea macrophylla sepal cells [72] or in the spongy mesophyll of jewel orchids [73]. Such tissues may contain a significant number of cells with anthocyanins, but it should be noted that these cells are in the terminal stage of differentiation and they will no longer have to divide in vivo. This is in contrast to dividing cultured cells in vitro, where anthocyanin-synthesizing cells, as a rule, do not constitute the majority of the population. Thus, Robert Hall and Michael Yeoman [74] exploring the cell culture of Madagascar periwinkle (Catharanthus roseus (L.) G.Don.) demonstrated that accumulation of the anthocyanins occurred in a small proportion of the cell population. In this case, cells begin to accumulate anthocyanins only in the last part of the culture growth cycle, i.e., during the period of cell expansion and therefore it can be regarded as one of the aspects of cellular differentiation. Besides, heterogeneity of cells in terms of anthocyanin accumulation was observed in a suspension culture of strawberry (Fragaria ananassa) cells [75], in a Cleome rosea cell culture there was also a mixture of non-pigmented, low-pigmented, and high-pigmented cells [76] etc. It seems that such cell heterogeneity (segregation of duties among the cells) and the beginning of anthocyanin synthesis late in the cell growth cycle provide a guarantee of the cell population existence. That is the remaining cells that do not synthesize anthocyanins will be able to resume cell divisions after transfer to a fresh nutrient medium.
The Em-L cell culture begins to accumulate anthocyanins from the 14th day, and the Em-D cell culture, by the 21st day (Figures 7 and S5) and does this less intensively. As discussed above, by the end of subcultivation, a complex of unfavorable conditions is formed, such as high biomass density, a certain degree of hypoxia, possible accumulation of ethylene, and depletion of the nutrient medium for sucrose, nitrogen, phosphorus and other elements. In particular, the deficiency of nitrogen, phosphorus, magnesium, sulfur, boron, and copper stimulates anthocyanin accumulation that may be considered as indicator of nutrient stress [77]. The maximum accumulation of anthocyanins occurs already beyond the standard 20-day cell growth cycle (Figure 7) and reaches 0.62 mg/g DW in under-light culture, which is ~ 38% of the total anthocyanin content in mature opened E. max. capsules (1.63 mg/g DW). Anthocyanins were not detected spectrophotometrically in mature arils, possibly due to the strong turbidity of the extract caused by high non-polar lipid content, but according to HPLC data, arils contain 0.024 mg/g DW of anthocyanins.
Anthocyanin production has been revealed in in vitro cultures of plant cells or tissues of various plant species. At the same time, Vitis vinifera, Rosa hybrida and Daucus carota were found to be most studied plants for this purpose [66]. Thus, for example, the suspension cell culture of Vitis vinifera without the use of elicitors contained 0.83 mg/g DW of anthocyanins, and after the action of ethephon and pulsed electric fields, 2.2 mg/g DW [78]. The callus culture of red-fleshed apple (Malus sieversii f. niedzwetzkyana) under the most favorable conditions for the accumulation of anthocyanins (at 16 °C and light) contained (in our recalculation) about 5 mg/g DW of cyanidin-3-O-galactoside, while there was a negative correlation between callus anthocyanin content and growth rate [79]. Undoubtedly, cultured cells are inferior, for instance, to the well-known champion in anthocyanins, blueberry, which, according to various researchers, contain 6–28 mg/g DW of anthocyanins [80]. However, there is information in the literature about a suspension cell culture of Perilla frutescens, which contained an unimaginable amount of anthocyanins, up to 300 mg/g DW [81].
According to HPLC-DAD and HPLC-ESI-MS/MS, anthocyanins in the Em-D and Em-L suspension cell cultures, as well as in the mature pericarp of E. max. fruits are represented by at least three molecular species (Figures 8 and S5). Three peaks (I, II, and III) on the HPLC-DAD chromatogram (Figure 8a) are identified by HPLC-ESI-MS/MS as anthocyanins representing derivatives of three anthocyanidins plus a hexose (either glucose or galactose), namely delphinidin-3-O-hexoside (peak I: [M]+ m/z 465, MS/MS m/z 303; Figure 8b,e), cyanidin-3-O-hexoside (peak II: [M]+ m/z 449, MS/MS m/z 287; Figure 8c,f), and peonidin-3-O-hexoside (peak III: [M]+ m/z 463, MS/MS m/z 301; Figure 8d,g). In the literature, there is information on the molecular composition of anthocyanins isolated from the epiderma of mature fruits of seven species with varieties of the genus Euonymus, in which cyanidin-3-O-glucoside was the sole anthocyanin; only traces of cyanidin-3-O-xylosylglucoside were found in Euonymus japonicus Thunb. [82,83]. Euonymus anthocyanins with delphinidin and peonidin as aglycones were first discovered in the present study.
3.5. Influence of Methyl Jasmonate on the Biosynthesis of Anthocyanins and VLCFAs in the Em-D and Em-L Cell Cultures
Among the considered functions of secondary metabolites, their protective role in counteracting biotic and abiotic stresses is in the lead [84,85]. This also applies to anthocyanins. In this regard, among the accepted methods for increasing the productivity of a cultured plant cells, elicitation is most often used or some phytohormones are used, the level of which, as a rule, increases in response to biotic and abiotic stressors or elicitors. The list of such phytohormones usually includes salicylic acid, jasmonates, and, much less frequently, ethylene, and jasmonates are the most common choice.
A suitable methyl jasmonate (MeJa) concentration is important for the cell growth, viability and production of anthocyanins in plant cell suspension culture. The most commonly used concentrations of MeJa lie in the range of 5–100 μm [86], which, of course, is determined by the plant species and the physiological state of the cells. In preliminary experiments, we chose a concentration of 25 µm. Lower concentrations for 5 days had no noticeable effect on the color of the cell cultures (as an indicator of anthocyanin accumulation), and higher concentrations reduced cell viability by up to 60%. The choice of the time point for adding MeJa to the cell cultures is due to the fact that by the 9th day the cultures almost complete their active growth and enough biomass is already accumulating. It should be kept in mind that jasmonates, as a rule, inhibit cell division [87,88] and hence biomass accumulation. Therefore, it is reasonable to first allow the cells to build up biomass.
Five days after the addition of MeJa, the cells changed their color significantly (Figure 9a) and these visible changes were confirmed by measurements of total anthocyanins (Figure 9b). Treatment with MeJa led to an almost twofold increase in anthocyanins in the Em-D cell culture and a fourfold increase in them in Em-L cells (Figure 9b and Figure S5). In general, the content of anthocyanins in the MeJa treated Em-L culture was almost 10 times higher than in the Em-D culture without elicitation.
Interestingly, some plant cells in vitro are able to synthesize a significant amount of anthocyanins in the dark, such as callus culture of Fragaria ananassa, in which the concentration of anthocyanins increased during subcultivation, while light had negative effect on both cell growth and anthocyanin accumulation [89]. In contrast, in most cell cultures, light is indispensable for anthocyanin production, as in the suspension cell culture of Rosa hybrida, which was completely unable to synthesize cyanidin-3-O-glucoside in the dark [90]. The same was true in the callus culture of red-fleshed apple, where darkness inhibited the accumulation of anthocyanins [79].
Jasmonates, as a rule, activate the synthesis of anthocyanins even in the dark and show synergy with the light effect. For example, in the suspension cell culture of Vitis vinifera growing in the dark, on the 7th day after treatment with 20 μm jasmonic acid, the content of malvidin-3-p-coumaroylglucoside (Mv3CG, one of the main anthocyanins of this cell culture) increased by 6.4 times [91]. The light led to an increase in the amount of Mv3CG by 3.3 times, and treatment with jasmonate in the light increased the amount of this anthocyanin by 12 times, compared with the in dark-grown control cell culture [91].
This combined effect of the light and jasmonate is very similar to our results (Figure 9b).
Before presenting the results on the effect of MeJa on VLCFA biosynthesis, we note that they exceeded our modest expectations. Since, in fact, only one study on Arabidopsis showed that the genes involved in VLCFA biosynthesis may be direct downstream targets of MYB30 transcription factor, and suggest a rather complex, and probably indirect, link of MYB30 with jasmonate signaling pathways [92]. So, the cell cultures responded to MeJa with a substantial increase in the total amount of VLCFAs, i.e., 5.5-fold in the Em-D cell culture and 3.6-fold in the Em-L cell culture (Figure 10a).
Compared to the extensive studies of the effect of MeJa on anthocyanin biosynthesis in cultured plant cells, its effect on the formation of VLCFAs in this cell system has not been investigated. The only work on this topic shows that day after treatment of the suspension cell culture of Catharanthus roseus with jasmonic acid, the level of arachidic (20:0), behenic (22:0) and lignoceric acids (24:0) increased markedly [93]. Another indirect study demonstrates that mechanical stress, which is typically manifested through jasmonate or/and ethylene signaling pathway(s), induced an accumulation of 22:0, 24:0, as well as tricosanoic (23:0) and pentacosanoic acids (25:0) in a suspension cell culture of Taxus chinensis [94].
Qualitatively, both with an increase in the VLCFA content by the end of the standard subcultivation cycle (Figure 6) and under the MeJa treatment, the main participants in the events were 20:0, 22:0, 23:0, 24:0, and 25:0 FAs (Figure 10b, Figure 11 and Figure 4). In the Em-D cell culture, the proportion of 20:0, 22:0, and 24:0 species under the influence of MeJa increased significantly, forming ascending steps, indicating active tunneling of the elongation process to 24:0, the absence of substrate starvation and the presence of relevant KCSs in working state (Figure 10b). However, in the Em-L cell culture, where the MeJa effect was 65% of that in the dark-grown cells, steps from these VLCFAs go down after 20:0 (Figure 10b). This is in contrast to VLCFAs behavior in the Em-D and Em-L cell cultures under standard condition (Figure 6) and in the Em-D cells under MeJa. All this may indicate a shortage of substrates (VLC-acyl-CoAs or malonyl-CoA) and/or, that is unlikely, a negative effect of MeJa in the light-grown cell culture on the activity of KCSs or other enzymes of FAE complex. Odd-chain VLCFA, 23:0 and 25:0 behave in the same way as in the standard cell culture and are not as responsive to MeJa.
Comparing the effect of MeJa on the relative production of VLCFAs and anthocyanins, it can be seen that the most favorable condition for the production of VLCFAs is the MeJa treatment of the Em-D culture (Figure 12a), and for the production of anthocyanins, the MeJa treatment of the Em-L culture (Figure 12b). At the same time, it appears that the stimulating effect of MeJA on the biosynthesis of VLCFAs most likely does not depend on whether the suspension cultures were grown in the light or in the dark. The yield of VLCFAs in the Em-L cell cultue decreases somewhat (Figure 10a) due to a significant activation under these conditions of anthocyanin biosynthesis (Figures 9b and 12) probably competing for the substrate (malonyl-CoA).
In order to find out how realistic the proposed scenario is, we briefly consider the simplified picture of the biosynthesis of VLCFAs and anthocyanins, based on numerous reviews [56,57,66,67,69,70,95], while not deep scrutinizing the gene regulation, but rather focusing on the biochemical processes and the effect of light and jasmonates on them (Figure 13).
The main steps in the biosynthesis of VLCFAs by the endoplasmic reticulum-localized FAE multienzyme complexes have already been briefly presented in section 3.3. As noted above, the transcription factor MYB30 controls the expression of the main genes of the FAE complex in Arabidopsis, but the connection of MYB30 with the jasmonate signaling pathways is still questionable [92]. Also, AP2/ERF-type transcription factor DEWAX negatively regulates the expression of some KCS, KCR and ECR genes of the FAE complexes of Arabidopsis in the dark [96]. Undoubtedly, a regular supply of precursors is necessary for the successful biosynthesis of VLCFAs. In plastids, by fatty acid synthase (FAS) multienzyme complex, saturated or monounsaturated long-chain (LC) FAs (C16 and C18) are produced. They are converted under the action of long-chain acyl-CoA synthetases (LACSs) into LC-acyl-CoAs and serve as primary precursors in the synthesis of VLCFAs. Unfortunately, little is known about the regulation of plastidial FAS, acyl-ACP desaturases (AADs), and acyl-ACP thioesterases (TESs) in heterotrophic cells. However, for example, transcription factor MYB30 has been shown to act as positive regulator and DEWAX1/2 act as darkness-dependent negative regulator of AtLACS2 expression [97], suggesting questionable-positive regulation by jasmonate and regulation by light (Figure 13). Finally, light-dependent but photosynthesis-independent inhibition of plastidial heteromeric acetyl-CoA carboxylase (ACC) activity is known to occur by enhancing the binding of plastidial protein, CARBOXYLTRANSFERASE INTERACTOR to the α-carboxyltransferase subunit of ACC, which inhibits ACC activity and subsequently FA synthesis [98]. Whether such a mechanism works in heterotrophic cultured plant cells remains to be seen in future studies.
The second precursor in the biosynthesis of VLCFAs, malonyl-CoA, is not supplied from plastids, but is synthesized by a multifunctional homomeric ACC located in cytosol [99,100,101]. In addition to VLCFA biosynthesis, cytosolic malonyl-CoA is required for flavonoid and stilbene biosynthesis, as well as for the malonylation of 1-aminocyclopropane-1-carboxylic acid and D-amino acids. The expression of the cytosolic ACC is regulated by light, UV-B irradiation, wounding, jasmonic acid and ethylene treatment [100,101,102] (Figure 13).
Turning now to the left side of Figure 13, to the anthocyanin synthesis, that begins from phenylpropanoid pathway through the transformation of phenylalanine into 4-coumaroyl-CoA, which is the first precursor molecule in the flavonoid biosynthetic pathway. The phenylpropanoid pathway initiates from phenylalanine, which synthesized by the shikimate pathway in plastids. The first specific enzyme working on the anthocyanin pathway is chalcone synthase (CHS), which produces chalcone skeletons using one molecule of 4-coumaroyl-CoA and three molecules of malonyl CoA. Chalcone isomerase (CHI) then works to convert naringenin chalcone into colorless naringenin, which is hydroxylated by the flavanone 3-hydroxylase (F3H) to produce dihydrokaempferol. Flavonoid 3’-hydroxylase (F3’H) and flavonoid 3’,5’-hydroxylase (F3’5’H) are cytochrome P450 enzymes, catalyzing the hydroxylation of dihydrokaempferol to dihydroquercetin and dihydromyricetin, respectively and their hydroxylation pattern is essential for the production of cyanidin and delphinidin (Figure 13). Further, by the dihydroflavonol 4-reductase (DFR) dihydroflavonols are reduced to the corresponding leucoanthocyanidins and anthocyanidin synthase (ANS) catalyzes the synthesis of colored anthocyanidins, which can be further modified, e.g., by UDP-dependent glycosyltransferases (UGT) and O-methyltransferases (OMT) to produce stable and water-soluble anthocyanins, usually transported into the central vacuole with the help of specialized transporters (Figure 13).
It is well known that the committed steps of anthocyanin biosynthesis are activated by a highly conserved among all flowering plants of transcription factors’ MYB-bHLH-WD40/WDR different complexes. These complexes are under orchestration with phytohormones, light, and repressive transcription factors. Almost all enzymes of flavonoid biosynthetic pathway are positively regulated by light and jasmonates [66,69,70,103], as well as key enzymes of phenylpropanoid pathway [104] (Figure 13).
Summing up the facts from other studies and our data, we can definitely say that the positive effect of MeJa on the biosynthesis of anthocyanins is synergistic with the effect of under-light gowth condition for the Em-L cell culture. Apparently, without MeJa and regardless of the peculiarities of regulation (Figure 13), in the suspension cultures of Em-D and Em-L cells, the pool of LC-acyl-CoAs is filled, as evidenced by a stable level of C16 and C18 FAs during the active growth period (Figure 4). So the shortage of LC-acyl-CoAs for the biosynthesis of VLCFAs is very unlikely. The expression of homomeric ACC located in cytosol is significantly increased under the action of jasmonates and light, as shown by other research, that is, the level of the second component for the biosynthesis of VLCFAs, malonyl-CoA, should be high under these conditions. Thus, in the under-light-grown cell culture, the level of precursors for the biosynthesis of VLCFAs cannot be lower. Even taking into account the found stimulating effect of MeJa on the production of VLCFAs, somewhat decrease of this production in the light-grown cells can only be explained by a noticeable outflow of malonyl-CoA into the biosynthesis of anthocyanins.
4. Conclusions
The presented data show that, aril-derived suspension cell cultures of Euonymus maximowiczianus represent unique cell populations capable of synthesizing and accumulating TAGs, VLCFAs, and anthocyanins. These properties, which have been preserved for more than 10 years, provide great opportunities for elucidating the mechanisms of regulation and competitive relationships between large metabolic flows. Undoubtedly, further research is needed in this direction, including at the gene expression level of regulatory factors and enzymes.
Supplementary Materials
The following supporting information can be downloaded at the website of this paper posted on Preprints.org., Figure S1: DNA fragment analysis of the Em-D and Em-L cell cultures by capillary electrophoresis; Fgure S2: Visualization of lipid droplets in the suspension-cultured cells of Euonymus maximoviczianus; Figure S3: Thin-layer chromatography (TLC) analysis of total triacylglycerol (TAG); Figure S4: Total ion current chromatograms of GC-MS separation of FA methyl esters obtained from total lipids of the control and MeJa-treated suspension cell cultures; Figure S5: HPLC-DAD chromatograms of the methanolic extracts of the control and MeJa-treated Euonymus maximowiczianus suspension-cultured cells from different passages; Table S1: Allelic polymorphism analysis of the microsatellite DNA markers in the Em-D and Em-L suspension cell cultures.
Author Contributions
Conceptualization, A.V.N., A.F., A.A.F., and R.A.S.; methodology, A.V.N., A.F., A.A.F., R.A.S., and S.V.G.; validation, A.V.N., A.F., A.A.F., and R.A.S.; formal analysis, A.V.N.; investigation, A.V.N., A.A.F., R.A.S., and S.V.G.; resources A.V.N., A.F., A.A.F., R.A.S., and S.V.G.; writing—original draft preparation, A.V.N., A.A.F., and R.A.S.; writing—review and editing, A.V.N., A.F., A.A.F., and R.A.S.; visualization, A.V.N. and R.A.S.; supervision A.V.N. and A.F.; project administration, A.V.N and A.F..; funding acquisition, A.F. and A.V.N. All authors have read and agreed to the published version of the manuscript.
Funding
The research was supported by The Russian Science Foundation (grant № 23-44-00101).
Institutional Review Board Statement
Not applicable.
Informed Consent Statement
Not applicable.
Data Availability Statement
The datasets generated and/or analyzed during the current study are available from the corresponding author upon reasonable request.
Acknowledgments
The infrastructural support provided by the Timiryazev Institute of Plant Physiology, Russian Academy of Sciences (themes no. 122042600086-7 and No. 122042700045-3) is acknowledged. Cultivation of plant cell suspensions was performed using the equipment of the large-scale research facilities “Experimental biotechnological facility” and “All-Russian Collection of cell cultures of higher plants” of the IPPRAS (EBF IPPRAS and ARCCC HP IPPRAS). HPLC-ESI-MS/MS analysis was supported by the RUDN University Strategic Academic Leadership Program.
Conflicts of Interest
The authors declare no conflict of interest.
Appendix A
Figure A1.
One tier of a stationary multi-tiered orbital shaker equipped with LED lamps (a) with a relative spectral emission typical for this type of light sources (b).
Figure A1.
One tier of a stationary multi-tiered orbital shaker equipped with LED lamps (a) with a relative spectral emission typical for this type of light sources (b).
References
- Mabberley, D.J. Plant-Book: A Portable Dictionary of Plants, Their Classification and Uses; 4th ed.; Cambridge University Press: Cambridge, England, 2017; ISBN 9781316335581. [Google Scholar]
- Ma, J.S. A Revision of Euonymus (Celastraceae). Thaiszia J. Bot. 2001, 11, 1–264. [Google Scholar]
- Zhu, J.-X.; Qin, J.-J.; Chang, R.-J.; Zeng, Q.; Cheng, X.-R.; Zhang, F.; Jin, H.-Z.; Zhang, W.-D. Chemical Constituents of Plants from the Genus Euonymus. Chem. Biodivers. 2012, 9, 1055–1076. [Google Scholar] [CrossRef] [PubMed]
- Alvarenga, N.; Ferro, E.A. Bioactive Triterpenes and Related Compounds from Celastraceae. Stud. Nat. Prod. Chem. 2006, 33, 239–307. [Google Scholar] [CrossRef]
- Gurung, P.; Shrestha, R.; Lim, J.; Thapa Magar, T.B.; Kim, H.-H.; Kim, Y.-W. Euonymus Alatus Twig Extract Protects against Scopolamine-Induced Changes in Brain and Brain-Derived Cells via Cholinergic and BDNF Pathways. Nutrients 2022, 15, 128. [Google Scholar] [CrossRef]
- Tantry, M.A.; Khuroo, M.A.; Shawl, A.S.; Najar, M.H.; Khan, I.A. Dihydro-β-Agarofuran Sesquiterpene Pyridine Alkaloids from the Seeds of Euonymus Hamiltonianus. J. Saudi Chem. Soc. 2016, 20, S323–S327. [Google Scholar] [CrossRef]
- Li, F.; Ma, J.; Li, C.-J.; Yang, J.-Z.; Zhang, D.; Chen, X.-G.; Zhang, D.-M. Bioactive Isopimarane Diterpenoids from the Stems of Euonymus Oblongifolius. Phytochemistry 2017, 135, 144–150. [Google Scholar] [CrossRef]
- Lee, S.; Lee, D.; Baek, S.C.; Jo, M.S.; Kang, K.S.; Kim, K.H. (3β,16α)-3,16-Dihydroxypregn-5-En-20-One from the Twigs of Euonymus Alatus (Thunb.) Sieb. Exerts Anti-Inflammatory Effects in LPS-Stimulated RAW-264.7 Macrophages. Molecules 2019, 24, 3848. [Google Scholar] [CrossRef]
- Sidorov, R.A.; Trusov, N.A.; Zhukov, A. V.; Pchelkin, V.P.; Vereshchagin, A.G.; Tsydendambaev, V.D. Accumulation of Neutral Acylglycerols during the Formation of Morphologo-Anatomical Structure of Euonymus Fruits. Russ. J. Plant Physiol. 2013, 60, 800–811. [Google Scholar] [CrossRef]
- Sidorov, R.A.; Zhukov, A. V.; Pchelkin, V.P.; Vereshchagin, A.G.; Tsydendambaev, V.D. Content and Fatty Acid Composition of Neutral Acylglycerols in Euonymus Fruits. J. Am. Oil Chem. Soc. 2014, 91, 805–814. [Google Scholar] [CrossRef]
- Blehová, A.; Murín, M.; Nemeček, P.; Gajdoš, P.; Čertík, M.; Kraic, J.; Matušíková, I. Alterations in Allocation and Composition of Lipid Classes in Euonymus Fruits and Seeds. Protoplasma 2021, 258, 169–178. [Google Scholar] [CrossRef]
- Trusov, N.A. Arils of Dried Fruits and Their Relationship with Dissemination. Contemp. Probl. Ecol. 2021, 14, 690–700. [Google Scholar] [CrossRef]
- Rastegari, A.; Manayi, A.; Rezakazemi, M.; Eftekhari, M.; Khanavi, M.; Akbarzadeh, T.; Saeedi, M. Phytochemical Analysis and Anticholinesterase Activity of Aril of Myristica Fragrans Houtt. BMC Chem. 2022, 16, 106. [Google Scholar] [CrossRef]
- Ashokkumar, K.; Simal-Gandara, J.; Murugan, M.; Dhanya, M.K.; Pandian, A. Nutmeg (Myristica Fragrans Houtt.) Essential Oil: A Review on Its Composition, Biological, and Pharmacological Activities. Phyther. Res. 2022, 36, 2839–2851. [Google Scholar] [CrossRef]
- Kubola, J.; Siriamornpun, S. Phytochemicals and Antioxidant Activity of Different Fruit Fractions (Peel, Pulp, Aril and Seed) of Thai Gac (Momordica Cochinchinensis Spreng). Food Chem. 2011, 127, 1138–1145. [Google Scholar] [CrossRef]
- Dumitraş, D.-A.; Bunea, A.; Vodnar, D.C.; Hanganu, D.; Pall, E.; Cenariu, M.; Gal, A.F.; Andrei, S. Phytochemical Characterization of Taxus Baccata L. Aril with Emphasis on Evaluation of the Antiproliferative and Pro-Apoptotic Activity of Rhodoxanthin. Antioxidants 2022, 11, 1039. [Google Scholar] [CrossRef]
- Fouquaert, E.; Van Damme, E.J.M. Promiscuity of the Euonymus Carbohydrate-Binding Domain. Biomolecules 2012, 2, 415–434. [Google Scholar] [CrossRef]
- Silveira, S.R.; Dornelas, M.C.; Martinelli, A.P. Perspectives for a Framework to Understand Aril Initiation and Development. Front. Plant Sci. 2016, 7. [Google Scholar] [CrossRef]
- Jopling, C.; Boue, S.; Belmonte, J.C.I. Dedifferentiation, Transdifferentiation and Reprogramming: Three Routes to Regeneration. Nat. Rev. Mol. Cell Biol. 2011, 12, 79–89. [Google Scholar] [CrossRef] [PubMed]
- Ma, J.S.; Funston, A.M. Celastraceae, Euonymus. In Flora of China, (Oxalidaceae through Aceraceae); Wu, Z.Y., Raven, P.H., Hong, D.Y., Eds.; Science Press: Beijing, China; Missouri Botanical Garden Press: St. Louis, USA, 2008; pp. 440–463. [Google Scholar]
- Savinov, I.A.; Trusov, N.A. Far Eastern Species of Euonymus L. (Celastraceae): Additional Data on Diagnostic Characters and Distribution. Bot. Pacifica 2018, 7. [Google Scholar] [CrossRef]
- Novikova, G. V.; Mur, L.A.J.; Nosov, A. V.; Fomenkov, A.A.; Mironov, K.S.; Mamaeva, A.S.; Shilov, E.S.; Rakitin, V.Y.; Hall, M.A. Nitric Oxide Has a Concentration-Dependent Effect on the Cell Cycle Acting via EIN2 in Arabidopsis Thaliana Cultured Cells. Front. Physiol. 2017, 8, 1–11. [Google Scholar] [CrossRef] [PubMed]
- Schenk, R.U.; Hildebrandt, A.C. Medium and Techniques for Induction and Growth of Monocotyledonous and Dicotyledonous Plant Cell Cultures. Can. J. Bot. 1972, 50, 199–204. [Google Scholar] [CrossRef]
- Mori, H.; Ueno, S.; Matsumoto, A.; Uchiyama, K.; Kamijo, T.; Masaki, T.; Tsumura, Y. Isolation and characterization of microsatellite markers from the RAD sequence of two temperate liana species: Euonymus fortunei (Celastraceae) and Schizophragma hydrangeoides (Hydrangeaceae). Silvae Genet. 2017, 66, 40–42. [Google Scholar] [CrossRef]
- Greenspan, P.; Mayer, E.P.; Fowler, S.D. Nile Red: A Selective Fluorescent Stain for Intracellular Lipid Droplets. J. Cell Biol. 1985, 100, 965–973. [Google Scholar] [CrossRef]
- Escorcia, W.; Ruter, D.L.; Nhan, J.; Curran, S.P. Quantification of Lipid Abundance and Evaluation of Lipid Distribution in Caenorhabditis Elegans by Nile Red and Oil Red O Staining. J. Vis. Exp. 2018, 133, e57352. [Google Scholar] [CrossRef]
- Nakamura, K.; Handa, S. Coomassie brilliant blue staining of lipids on thin-layer plates. Anal. Biochem. 1984, 142, 406–410. [Google Scholar] [CrossRef]
- Lee, J.; Durst, R.W.; Wrolstad, R.E.; Eisele, T.; Giusti, M.M.; Hach, J.; Hofsommer, H.; Koswig, S.; Krueger, D.A.; Kupina, S.; et al. Determination of Total Monomeric Anthocyanin Pigment Content of Fruit Juices, Beverages, Natural Colorants, and Wines by the PH Differential Method: Collaborative Study. J. AOAC Int. 2005, 88, 1269–1278. [Google Scholar] [CrossRef]
- Wu, X.; Prior, R.L. Systematic Identification and Characterization of Anthocyanins by HPLC-ESI-MS/MS in Common Foods in the United States: Fruits and Berries. J. Agric. Food Chem. 2005, 53, 2589–2599. [Google Scholar] [CrossRef]
- Nosov, A. V.; Titova, M. V.; Fomenkov, A.A.; Kochkin, D. V.; Galishev, B.A.; Sidorov, R.A.; Medentsova, A.A.; Kotenkova, E.A.; Popova, E. V.; Nosov, A.M. Callus and Suspension Cell Cultures of Sutherlandia Frutescens and Preliminary Screening of Their Phytochemical Composition and Antimicrobial Activity. Acta Physiol. Plant. 2023, 45, 42. [Google Scholar] [CrossRef]
- Nagata, T.; Nemoto, Y.; Hasezawa, S. Tobacco BY-2 Cell Line as the “HeLa” Cell in the Cell Biology of Higher Plants. Int. Rev. Cytol. 1992, 132, 1–30. [Google Scholar] [CrossRef]
- Fomenkov, A.A.; Nosov, A. V.; Rakitin, V.Y.; Sukhanova, E.S.; Mamaeva, A.S.; Sobol’kova, G.I.; Nosov, A.M.; Novikova, G. V. Ethylene in the Proliferation of Cultured Plant Cells: Regulating or Just Going Along? Russ. J. Plant Physiol. 2015, 62, 815–822. [Google Scholar] [CrossRef]
- Nosov, A.M. Application of Cell Technologies for Production of Plant-Derived Bioactive Substances of Plant Origin. Appl. Biochem. Microbiol. 2012, 48, 609–624. [Google Scholar] [CrossRef]
- Titova, M. V.; Popova, E. V.; Konstantinova, S. V.; Kochkin, D. V.; Ivanov, I.M.; Klyushin, A.G.; Titova, E.G.; Nebera, E.A.; Vasilevskaya, E.R.; Tolmacheva, G.S.; et al. Suspension Cell Culture of Dioscorea Deltoidea — A Renewable Source of Biomass and Furostanol Glycosides for Food and Pharmaceutical Industry. Agronomy 2021, 11, 394. [Google Scholar] [CrossRef]
- Glagoleva, E.S.; Konstantinova, S. V.; Kochkin, D. V.; Ossipov, V.; Titova, M. V.; Popova, E. V.; Nosov, A.M.; Paek, K.-Y. Predominance of Oleanane-Type Ginsenoside R0 and Malonyl Esters of Protopanaxadiol-Type Ginsenosides in the 20-Year-Old Suspension Cell Culture of Panax Japonicus C.A. Meyer. Ind. Crops Prod. 2022, 177, 114417. [Google Scholar] [CrossRef]
- Kochkin, D. V.; Demidova, E. V.; Globa, E.B.; Nosov, A.M. Profiling of Taxoid Compounds in Plant Cell Cultures of Different Species of Yew (Taxus Spp.). Molecules 2023, 28, 2178. [Google Scholar] [CrossRef] [PubMed]
- Gemmrich, A.R.; Schraudolf, H. Fatty Acid Composition of Lipids from Differentiated Tissues and Cell Cultures of Euonymus Europaeus. Chem. Phys. Lipids 1980, 26, 259–264. [Google Scholar] [CrossRef]
- Bonneau, L.; Beranger-Novat, N.; Monin, J. Somatic Embryogenesis and Plant Regeneration in a Woody Species: The European Spindle Tree (Euonymus Europaeus L.). Plant Cell Rep. 1994, 13, 135–138. [Google Scholar] [CrossRef]
- Woo, H.-A.; Ku, S.S.; Jie, E.Y.; Kim, H.; Kim, H.-S.; Cho, H.S.; Jeong, W.-J.; Park, S.U.; Min, S.R.; Kim, S.W. Efficient Plant Regeneration from Embryogenic Cell Suspension Cultures of Euonymus Alatus. Sci. Rep. 2021, 11, 15120. [Google Scholar] [CrossRef]
- Fett-Neto, A.G.; DiCosmo, F.; Reynolds, W.F.; Sakata, K. Cell Culture of Taxus as a Source of the Antineoplastic Drug Taxol and Related Taxanes. Nat. Biotechnol. 1992, 10, 1572–1575. [Google Scholar] [CrossRef]
- Miklaszewska, M.; Zienkiewicz, K.; Inchana, P.; Zienkiewicz, A. Lipid Metabolism and Accumulation in Oilseed Crops. OCL 2021, 28, 50. [Google Scholar] [CrossRef]
- Weber, N.; Taylor, D.C. Biosynthesis of Triacylglycerols in Plant Cell and Embryo Cultures Their Significance in the Breeding of Oil Plants. In Progress in Plant Cellular and Molecular Biology. Current Plant Science and Biotechnology in Agriculture; Nijkamp, H.J.J., Van Der Plas, L.H.W., Van Aartrijk, J., Eds.; Springer: Dordrecht, Netherlands, 1990; pp. 324–331. [Google Scholar]
- Radetzky, R.; Langheinrich, U. Induction of Accumulation and Degradation of the 18.4-KDa Oleosin in a Triacylglycerol-Storing Cell Culture of Anise (Pimpinella Anisum L.). Planta 1994, 194, 1–8. [Google Scholar] [CrossRef]
- Weselake, R.J.; Byers, S.D.; Davoren, J.M.; Laroche, A.; Hodges, D.M.; Pomeroy, M.K.; Furukawa-Stoffer, T.L. Triacylglycerol Biosynthesis and Gene Expression in Microspore-Derived Cell Suspension Cultures of Oilseed Rape. J. Exp. Bot. 1998, 49, 33–39. [Google Scholar] [CrossRef]
- Marchev, A.; Georgiev, M. Plant Cell Bioprocesses. In Current Developments in Biotechnology and Bioengineering; Larroche, C., Sanromán, M.Á., Du, G., Pandey, A., Eds.; Elsevier: Amsterdam, Netherlands, 2017; pp. 73–95. [Google Scholar]
- Leeggangers, H.A.C.F.; Rodriguez-Granados, N.Y.; Macias-Honti, M.G.; Sasidharan, R. A Helping Hand When Drowning: The Versatile Role of Ethylene in Root Flooding Resilience. Environ. Exp. Bot. 2023, 213, 105422. [Google Scholar] [CrossRef]
- Azevedo, H.; Castro, P.H.; Gonçalves, J.F.; Lino-Neto, T.; Tavares, R.M. Impact of Carbon and Phosphate Starvation on Growth and Programmed Cell Death of Maritime Pine Suspension Cells. Vitr. Cell. Dev. Biol. - Plant 2014, 50, 478–486. [Google Scholar] [CrossRef]
- Malerba, M.; Cerana, R. Plant Cell Cultures as a Tool to Study Programmed Cell Death. Int. J. Mol. Sci. 2021, 22, 2166. [Google Scholar] [CrossRef] [PubMed]
- Rebeille, F.; Bligny, R.; Douce, R. Role de l’oxygene et de La Temperature Sur La Composition En Acides Gras Des Cellules Isolees d’Erable (Acer Pseudoplatanus L.). Biochim. Biophys. Acta - Lipids Lipid Metab. 1980, 620, 1–9. [Google Scholar] [CrossRef]
- Brown, D.J.; Beevers, H. Fatty Acids of Rice Coleoptiles in Air and Anoxia. Plant Physiol. 1987, 84, 555–559. [Google Scholar] [CrossRef]
- Klinkenberg, J.; Faist, H.; Saupe, S.; Lambertz, S.; Krischke, M.; Stingl, N.; Fekete, A.; Mueller, M.J.; Feussner, I.; Hedrich, R.; et al. Two Fatty Acid Desaturases, STEAROYL-ACYL CARRIER PROTEIN Δ 9 -DESATURASE6 and FATTY ACID DESATURASE3, Are Involved in Drought and Hypoxia Stress Signaling in Arabidopsis Crown Galls. Plant Physiol. 2014, 164, 570–583. [Google Scholar] [CrossRef] [PubMed]
- Xie, L.-J.; Zhou, Y.; Chen, Q.-F.; Xiao, S. New Insights into the Role of Lipids in Plant Hypoxia Responses. Prog. Lipid Res. 2021, 81, 101072. [Google Scholar] [CrossRef]
- Titova, M. V.; Kochkin, D. V.; Sobolkova, G.I.; Fomenkov, A.A.; Sidorov, R.A.; Nosov, A.M. Obtainment and Characterization of Alhagi Persarum Boiss. et Buhse Callus Cell Cultures That Produce Isoflavonoids. Appl. Biochem. Microbiol. 2021, 57, 20–30. [Google Scholar] [CrossRef]
- Tjellström, H.; Yang, Z.; Allen, D.K.; Ohlrogge, J.B. Rapid Kinetic Labeling of Arabidopsis Cell Suspension Cultures: Implications for Models of Lipid Export from Plastids. Plant Physiol. 2012, 158, 601–611. [Google Scholar] [CrossRef]
- Meï, C.; Michaud, M.; Cussac, M.; Albrieux, C.; Gros, V.; Maréchal, E.; Block, M.A.; Jouhet, J.; Rébeillé, F. Levels of Polyunsaturated Fatty Acids Correlate with Growth Rate in Plant Cell Cultures. Sci. Rep. 2015, 5, 15207. [Google Scholar] [CrossRef]
- Batsale, M.; Bahammou, D.; Fouillen, L.; Mongrand, S.; Joubès, J.; Domergue, F. Biosynthesis and Functions of Very-Long-Chain Fatty Acids in the Responses of Plants to Abiotic and Biotic Stresses. Cells 2021, 10, 1284. [Google Scholar] [CrossRef] [PubMed]
- Zhukov, A.; Popov, V. Synthesis of C20–38 Fatty Acids in Plant Tissues. Int. J. Mol. Sci. 2022, 23, 4731. [Google Scholar] [CrossRef]
- Batsale, M.; Alonso, M.; Pascal, S.; Thoraval, D.; Haslam, R.P.; Beaudoin, F.; Domergue, F.; Joubès, J. Tackling Functional Redundancy of Arabidopsis Fatty Acid Elongase Complexes. Front. Plant Sci. 2023, 14. [Google Scholar] [CrossRef]
- Qi, W.; Lu, H.; Zhang, Y.; Cheng, J.; Huang, B.; Lu, X.; Sheteiwy, M.S.A.; Kuang, S.; Shao, H. Oil Crop Genetic Modification for Producing Added Value Lipids. Crit. Rev. Biotechnol. 2020, 40, 777–786. [Google Scholar] [CrossRef]
- Liu, F.; Wu, R.; Ma, X.; Su, E. The Advancements and Prospects of Nervonic Acid Production. J. Agric. Food Chem. 2022, 70, 12772–12783. [Google Scholar] [CrossRef]
- Zheng, H.; Rowland, O.; Kunst, L. Disruptions of the Arabidopsis Enoyl-CoA Reductase Gene Reveal an Essential Role for Very-Long-Chain Fatty Acid Synthesis in Cell Expansion during Plant Morphogenesis. Plant Cell 2005, 17, 1467–1481. [Google Scholar] [CrossRef]
- Nobusawa, T.; Okushima, Y.; Nagata, N.; Kojima, M.; Sakakibara, H.; Umeda, M. Synthesis of Very-Long-Chain Fatty Acids in the Epidermis Controls Plant Organ Growth by Restricting Cell Proliferation. PLoS Biol. 2013, 11, e1001531. [Google Scholar] [CrossRef]
- León, J.; Castillo, M.C.; Gayubas, B. The Hypoxia–Reoxygenation Stress in Plants. J. Exp. Bot. 2021, 72, 5841–5856. [Google Scholar] [CrossRef]
- Li, Y.; Zheng, G.; Jia, Y.; Yu, X.; Zhang, X.; Yu, B.; Wang, D.; Zheng, Y.; Tian, X.; Li, W. Acyl Chain Length of Phosphatidylserine Is Correlated with Plant Lifespan. PLoS One 2014, 9, e103227. [Google Scholar] [CrossRef]
- Breygina, M.; Voronkov, A.; Ivanova, T.; Babushkina, K. Fatty Acid Composition of Dry and Germinating Pollen of Gymnosperm and Angiosperm Plants. Int. J. Mol. Sci. 2023, 24, 9717. [Google Scholar] [CrossRef]
- Belwal, T.; Singh, G.; Jeandet, P.; Pandey, A.; Giri, L.; Ramola, S.; Bhatt, I.D.; Venskutonis, P.R.; Georgiev, M.I.; Clément, C.; et al. Anthocyanins, Multi-Functional Natural Products of Industrial Relevance: Recent Biotechnological Advances. Biotechnol. Adv. 2020, 43, 107600. [Google Scholar] [CrossRef]
- Zhang, P.; Zhu, H. Anthocyanins in Plant Food: Current Status, Genetic Modification, and Future Perspectives. Molecules 2023, 28, 866. [Google Scholar] [CrossRef] [PubMed]
- Lin, Y.; Li, C.; Shi, L.; Wang, L. Anthocyanins: Modified New Technologies and Challenges. Foods 2023, 12, 1368. [Google Scholar] [CrossRef] [PubMed]
- LaFountain, A.M.; Yuan, Y. Repressors of Anthocyanin Biosynthesis. New Phytol. 2021, 231, 933–949. [Google Scholar] [CrossRef] [PubMed]
- Araguirang, G.E.; Richter, A.S. Activation of Anthocyanin Biosynthesis in High Light – What Is the Initial Signal? New Phytol. 2022, 236, 2037–2043. [Google Scholar] [CrossRef] [PubMed]
- Bae, R.-N.; Kim, K.-W.; Kim, T.-C.; Lee, S.-K. Anatomical Observations of Anthocyanin Rich Cells in Apple Skins. HortScience 2006, 41, 733–736. [Google Scholar] [CrossRef]
- Yoshida, K.; Toyama-Kato, Y.; Kameda, K.; Kondo, T. Sepal Color Variation of Hydrangea Macrophylla and Vacuolar PH Measured with a Proton-Selective Microelectrode. Plant Cell Physiol. 2003, 44, 262–268. [Google Scholar] [CrossRef] [PubMed]
- Poobathy, R.; Zakaria, R.; Murugaiyah, V.; Subramaniam, S. Autofluorescence Study and Selected Cyanidin Quantification in the Jewel Orchids Anoectochilus Sp. and Ludisia Discolor. PLoS One 2018, 13, e0195642. [Google Scholar] [CrossRef] [PubMed]
- Hall, R.D.; Yeoman, M.M. Temporal and Spatial Heterogeneity in the Accumulation of Anthocyanins in Cell Cultures of Catharanthus Roseus (L.) G.Don. J. Exp. Bot. 1986, 37, 48–60. [Google Scholar] [CrossRef]
- Miyanaga, K.; Seki, M.; Furusaki, S. Quantitative Determination of Cultured Strawberry-Cell Heterogeneity by Image Analysis: Effects of Medium Modification on Anthocyanin Accumulation. Biochem. Eng. J. 2000, 5, 201–207. [Google Scholar] [CrossRef]
- Simões-Gurgel, C.; Cordeiro, L. da S.; de Castro, T.C.; Callado, C.H.; Albarello, N.; Mansur, E. Establishment of Anthocyanin-Producing Cell Suspension Cultures of Cleome Rosea Vahl Ex DC. (Capparaceae). Plant Cell, Tissue Organ Cult. 2011, 106, 537–545. [Google Scholar] [CrossRef]
- Jezek, M.; Allan, A.C.; Jones, J.J.; Geilfus, C. Why Do Plants Blush When They Are Hungry? New Phytol. 2023, 239, 494–505. [Google Scholar] [CrossRef]
- Saw, N.M.M.T.; Riedel, H.; Cai, Z.; Kütük, O.; Smetanska, I. Stimulation of Anthocyanin Synthesis in Grape (Vitis Vinifera) Cell Cultures by Pulsed Electric Fields and Ethephon. Plant Cell, Tissue Organ Cult. 2012, 108, 47–54. [Google Scholar] [CrossRef]
- Wang, N.; Zhang, Z.; Jiang, S.; Xu, H.; Wang, Y.; Feng, S.; Chen, X. Synergistic Effects of Light and Temperature on Anthocyanin Biosynthesis in Callus Cultures of Red-Fleshed Apple (Malus Sieversii f. Niedzwetzkyana). Plant Cell, Tissue Organ Cult. 2016, 127, 217–227. [Google Scholar] [CrossRef]
- Avula, B.; Katragunta, K.; Osman, A.G.; Ali, Z.; John Adams, S.; Chittiboyina, A.G.; Khan, I.A. Advances in the Chemistry, Analysis and Adulteration of Anthocyanin Rich-Berries and Fruits: 2000–2022. Molecules 2023, 28, 560. [Google Scholar] [CrossRef]
- Zhong, J.; Seki, T.; Kinoshita, S.; Yoshida, T. Effect of Light Irradiation on Anthocyanin Production by Suspended Culture of Perilla Frutescens. Biotechnol. Bioeng. 1991, 38, 653–658. [Google Scholar] [CrossRef]
- Ishikura, N. Anthocyanin Pattern in the Genera Ilex and Euonymus. Phytochemistry 1971, 10, 2513–2517. [Google Scholar] [CrossRef]
- Ishikura, N. A Further Survey of Anthocyanins and Other Phenolics in Ilex and Euonymus. Phytochemistry 1975, 14, 743–745. [Google Scholar] [CrossRef]
- Erb, M.; Kliebenstein, D.J. Plant Secondary Metabolites as Defenses, Regulators, and Primary Metabolites: The Blurred Functional Trichotomy. Plant Physiol. 2020, 184, 39–52. [Google Scholar] [CrossRef]
- Khare, S.; Singh, N.B.; Singh, A.; Hussain, I.; Niharika, K.; Yadav, V.; Bano, C.; Yadav, R.K.; Amist, N. Plant Secondary Metabolites Synthesis and Their Regulations under Biotic and Abiotic Constraints. J. Plant Biol. 2020, 63, 203–216. [Google Scholar] [CrossRef]
- Sohn, S.-I.; Pandian, S.; Rakkammal, K.; Largia, M.J.V.; Thamilarasan, S.K.; Balaji, S.; Zoclanclounon, Y.A.B.; Shilpha, J.; Ramesh, M. Jasmonates in Plant Growth and Development and Elicitation of Secondary Metabolites: An Updated Overview. Front. Plant Sci. 2022, 13. [Google Scholar] [CrossRef]
- Świa̧tek, A.; Lenjou, M.; Van Bockstaele, D.; Inzé, D.; Van Onckelen, H. Differential Effect of Jasmonic Acid and Abscisic Acid on Cell Cycle Progression in Tobacco BY-2 Cells. Plant Physiol. 2002, 128, 201–211. [Google Scholar] [CrossRef]
- Kamińska, M. Role and Activity of Jasmonates in Plants under in Vitro Conditions. Plant Cell, Tissue Organ Cult. 2021, 146, 425–447. [Google Scholar] [CrossRef]
- Nakamura, M.; Takeuchi, Y.; Miyanaga, K.; Seki, M.; Furusaki, S. High Anthocyanin Accumulation in the Dark by Strawberry (Fragaria Ananassa) Callus. Biotechnol. Lett. 1999, 21, 695–699. [Google Scholar] [CrossRef]
- Hennayake, C.K.; Takagi, S.; Nishimura, K.; Kanechi, M.; Uno, Y.; Inagaki, N. Differential Expression of Anthocyanin Biosynthesis Genes in Suspension Culture Cells of Rosa Hybrida Cv. Charleston. Plant Biotechnol. 2006, 23, 379–385. [Google Scholar] [CrossRef]
- Curtin, C.; Zhang, W.; Franco, C. Manipulating Anthocyanin Composition in Vitis Vinifera Suspension Cultures by Elicitation with Jasmonic Acid and Light Irradiation. Biotechnol. Lett. 2003, 25, 1131–1135. [Google Scholar] [CrossRef] [PubMed]
- Raffaele, S.; Vailleau, F.; Léger, A.; Joubès, J.; Miersch, O.; Huard, C.; Blée, E.; Mongrand, S.; Domergue, F.; Roby, D. A MYB Transcription Factor Regulates Very-Long-Chain Fatty Acid Biosynthesis for Activation of the Hypersensitive Cell Death Response in Arabidopsis. Plant Cell 2008, 20, 752–767. [Google Scholar] [CrossRef] [PubMed]
- Goldhaber-Pasillas, G.; Mustafa, N.; Verpoorte, R. Jasmonic Acid Effect on the Fatty Acid and Terpenoid Indole Alkaloid Accumulation in Cell Suspension Cultures of Catharanthus Roseus. Molecules 2014, 19, 10242–10260. [Google Scholar] [CrossRef] [PubMed]
- Han, P.; Zhou, J.; Yuan, Y. Analysis of Phospholipids, Sterols, and Fatty Acids in Taxus Chinensis Var. Mairei Cells in Response to Shear Stress. Biotechnol. Appl. Biochem. 2009, 54, 105–112. [Google Scholar] [CrossRef] [PubMed]
- Pucker, B.; Selmar, D. Biochemistry and Molecular Basis of Intracellular Flavonoid Transport in Plants. Plants 2022, 11, 963. [Google Scholar] [CrossRef]
- Go, Y.S.; Kim, H.; Kim, H.J.; Suh, M.C. Arabidopsis Cuticular Wax Biosynthesis Is Negatively Regulated by the DEWAX Gene Encoding an AP2/ERF-Type Transcription Factor. Plant Cell 2014, 26, 1666–1680. [Google Scholar] [CrossRef]
- Zhao, H.; Kosma, D.K.; Lü, S. Functional Role of Long-Chain Acyl-CoA Synthetases in Plant Development and Stress Responses. Front. Plant Sci. 2021, 12. [Google Scholar] [CrossRef]
- Ye, Y.; Nikovics, K.; To, A.; Lepiniec, L.; Fedosejevs, E.T.; Van Doren, S.R.; Baud, S.; Thelen, J.J. Docking of Acetyl-CoA Carboxylase to the Plastid Envelope Membrane Attenuates Fatty Acid Production in Plants. Nat. Commun. 2020, 11, 6191. [Google Scholar] [CrossRef]
- Millar, A.A.; Wrischer, M.; Kunst, L. Accumulation of Very-Long-Chain Fatty Acids in Membrane Glycerolipids Is Associated with Dramatic Alterations in Plant Morphology. Plant Cell 1998, 10, 1889–1902. [Google Scholar] [CrossRef]
- Sasaki, Y.; Nagano, Y. Plant Acetyl-CoA Carboxylase: Structure, Biosynthesis, Regulation, and Gene Manipulation for Plant Breeding. Biosci. Biotechnol. Biochem. 2004, 68, 1175–1184. [Google Scholar] [CrossRef]
- Figueroa-Balderas, R.E.; García-Ponce, B.; Rocha-Sosa, M. Hormonal and Stress Induction of the Gene Encoding Common Bean Acetyl-Coenzyme A Carboxylase. Plant Physiol. 2006, 142, 609–619. [Google Scholar] [CrossRef]
- Saito, K.; Yonekura-Sakakibara, K.; Nakabayashi, R.; Higashi, Y.; Yamazaki, M.; Tohge, T.; Fernie, A.R. The Flavonoid Biosynthetic Pathway in Arabidopsis: Structural and Genetic Diversity. Plant Physiol. Biochem. 2013, 72, 21–34. [Google Scholar] [CrossRef] [PubMed]
- Ma, Y.; Ma, X.; Gao, X.; Wu, W.; Zhou, B. Light Induced Regulation Pathway of Anthocyanin Biosynthesis in Plants. Int. J. Mol. Sci. 2021, 22, 11116. [Google Scholar] [CrossRef] [PubMed]
- Dong, N.; Lin, H. Contribution of Phenylpropanoid Metabolism to Plant Development and Plant–Environment Interactions. J. Integr. Plant Biol. 2021, 63, 180–209. [Google Scholar] [CrossRef] [PubMed]
Figure 1.
Plant and the cell cultures of Euonymus maximowiczianus Prokh. (а) Ripe opened capsules and seeds coated by orange arils. (b) Schematic view of E. max. fruit transverse section, which was between the stage I (the globular embryo stage) and stage II (the stage of a mature embryo and unripe fruit). (c) Four-week primary aril-derived callus. (d,g) The E. max. suspension-cultured cells in 2013 stained with Nile red; (d) bright-field image; (g) epifluorescence image with excitation 545/25 and 475/30 nm, emission 605/70 and 550/100 nm for visualization of membrane (orange-red) or neutral (yellow-green) lipids, respectively. (e,h) The Em-D suspension-cultured cells in 2023 stained with Nile red; (e) bright-field image; (h) epifluorescence image with the same as above parameters. (f) The Arabidopsis thaliana NFC-0 suspension-cultured cells stained with Nile red; (f, left part) bright-field image; (f, right part) epifluorescence image with the same as above parameters. (i) The E. max. suspension-cultured cells in 2013; bright-field color image. (j) The Em-D suspension-cultured cells in 2023; bright-field color image. (k) The Em-L suspension-cultured cells in 2023; bright-field color image. (l) The Em-D (left) and Em-L (right) suspension cell cultures at the end of subcultivation.
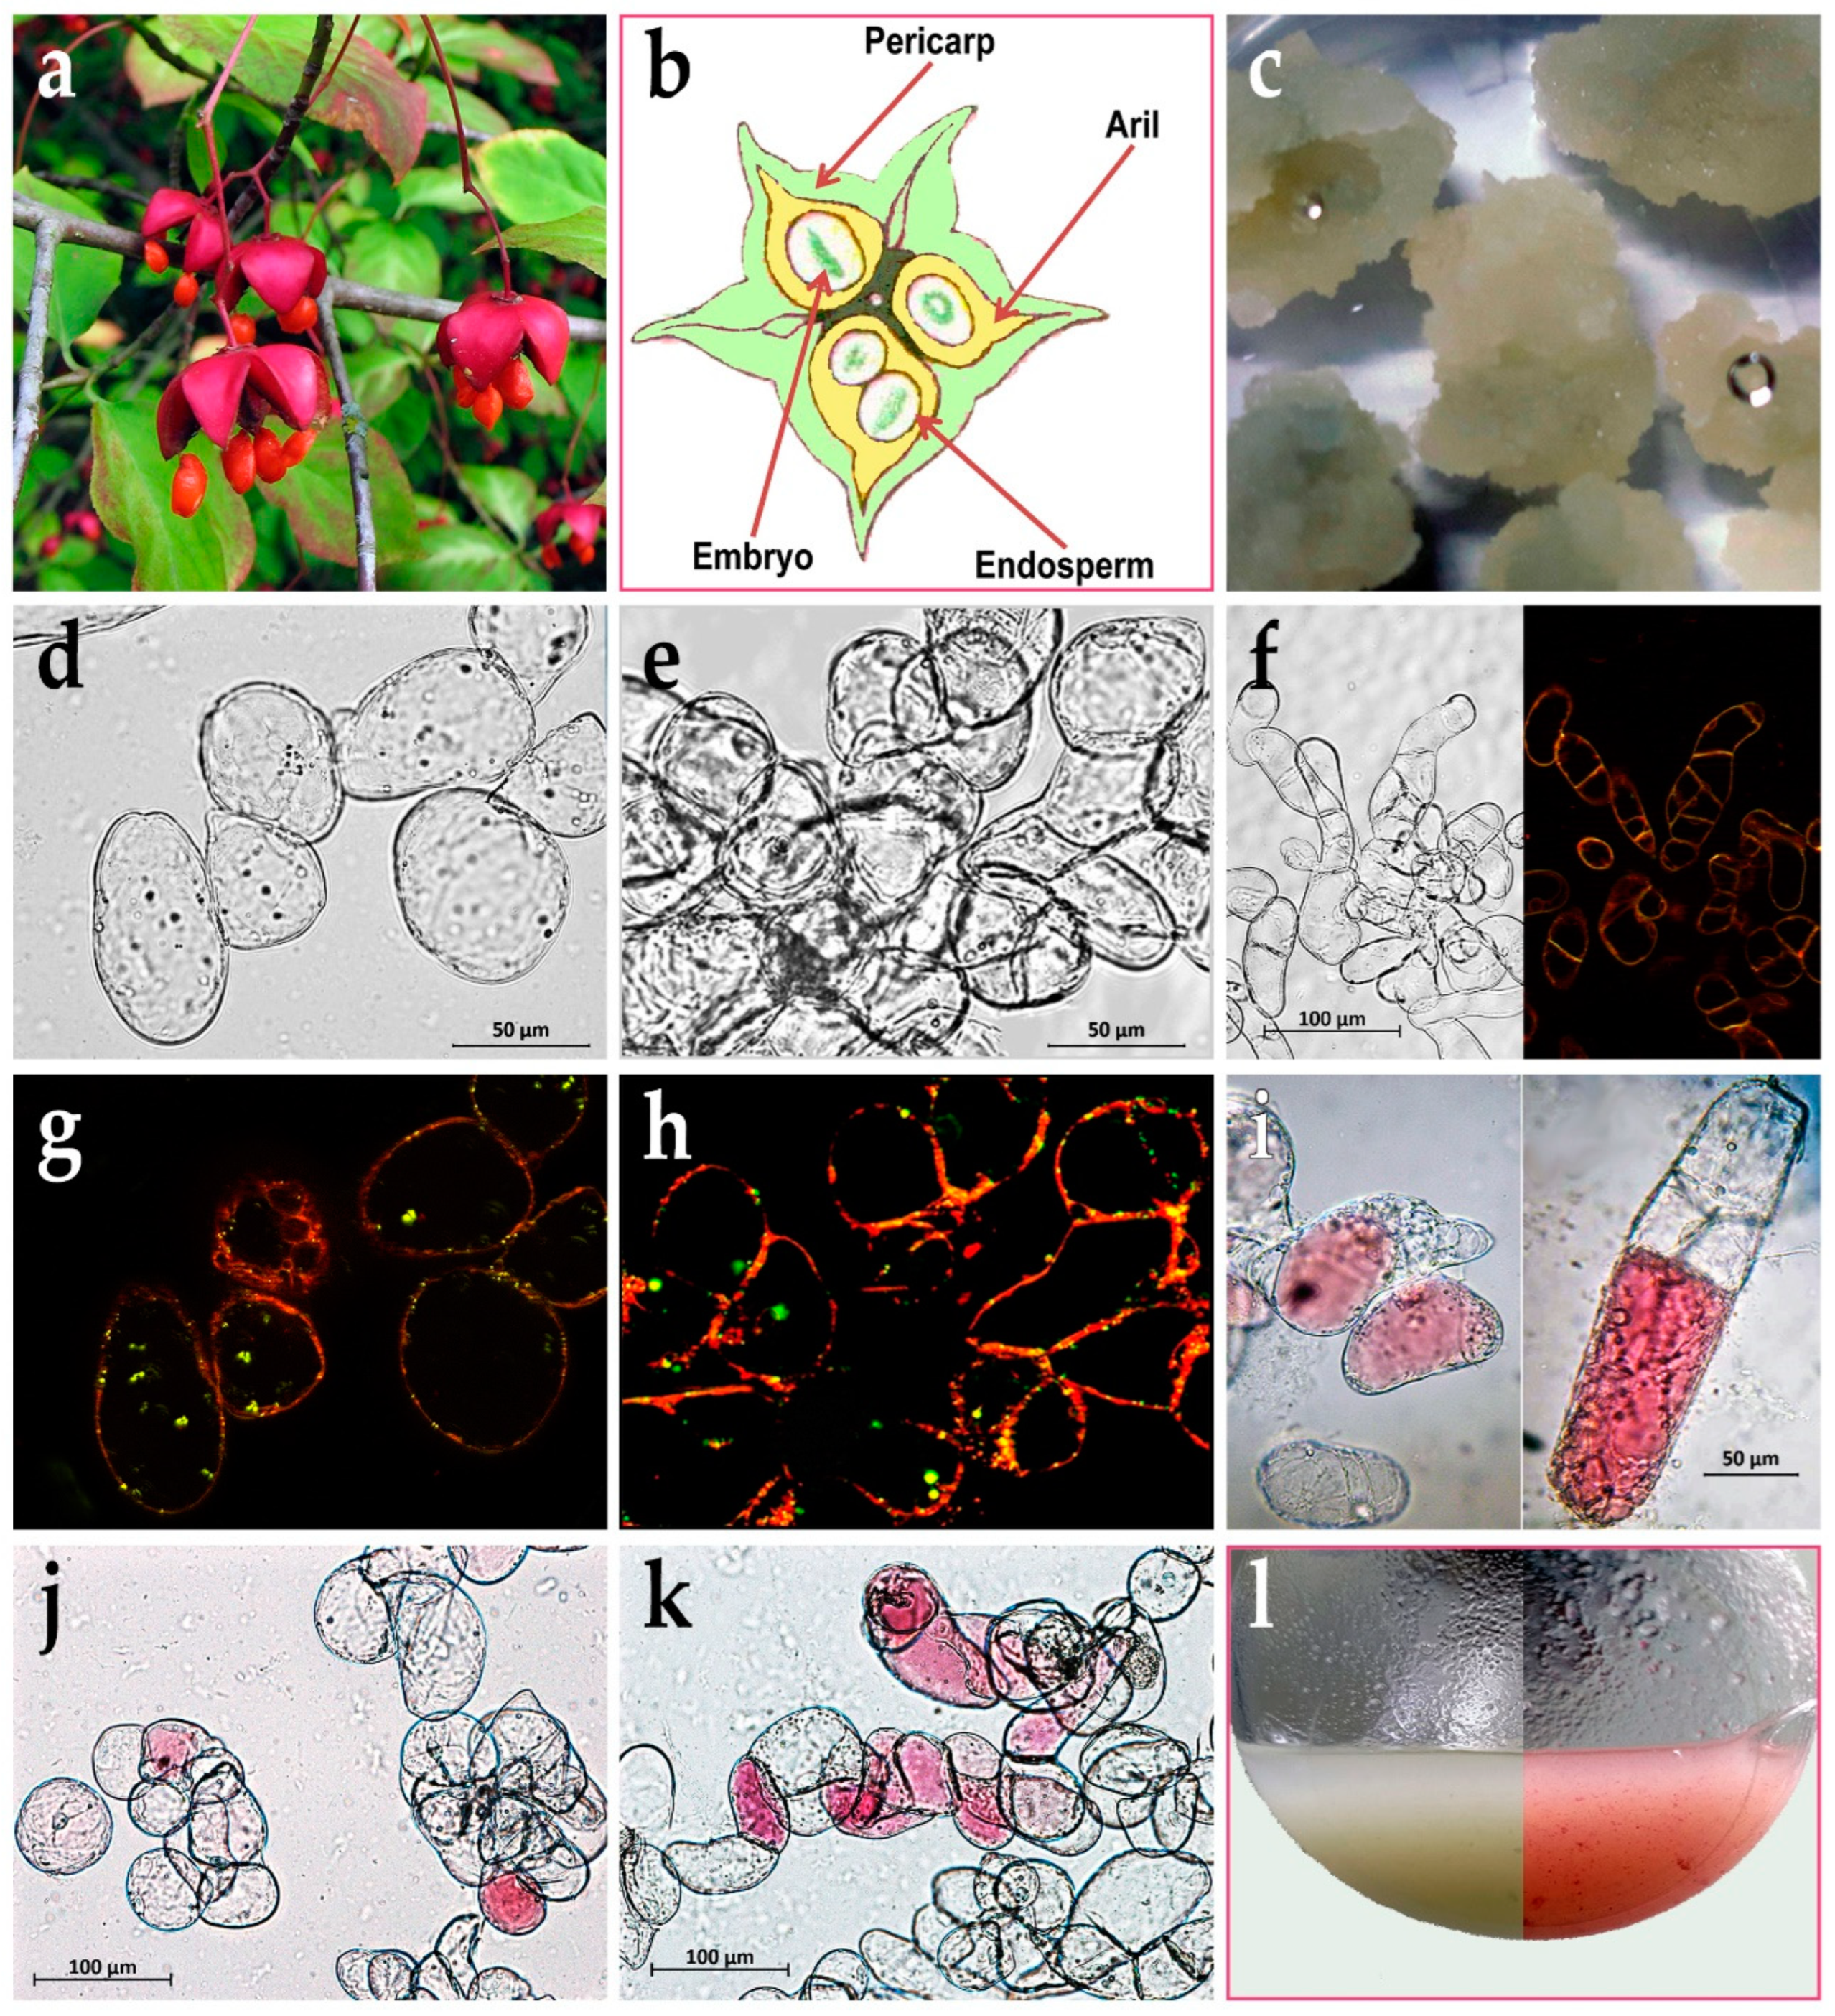
Figure 2.
Growth dynamics of the aril-derived suspension cell cultures of Euonymus maximowiczianus; the initial cell culture (E. max.) in 2013 and the cell cultures growing in the dark (Em-D) and in the light (Em-L) in 2023. (a) Dynamics of the fresh weight growth. (b) Dynamics of the dry weight growth. Different lowercase letters indicate significant differences (p ≤ 0.05) between the values inside of each cell culture based on one-way ANOVA with a Holm-Sidak all pairwise multiple comparison method.
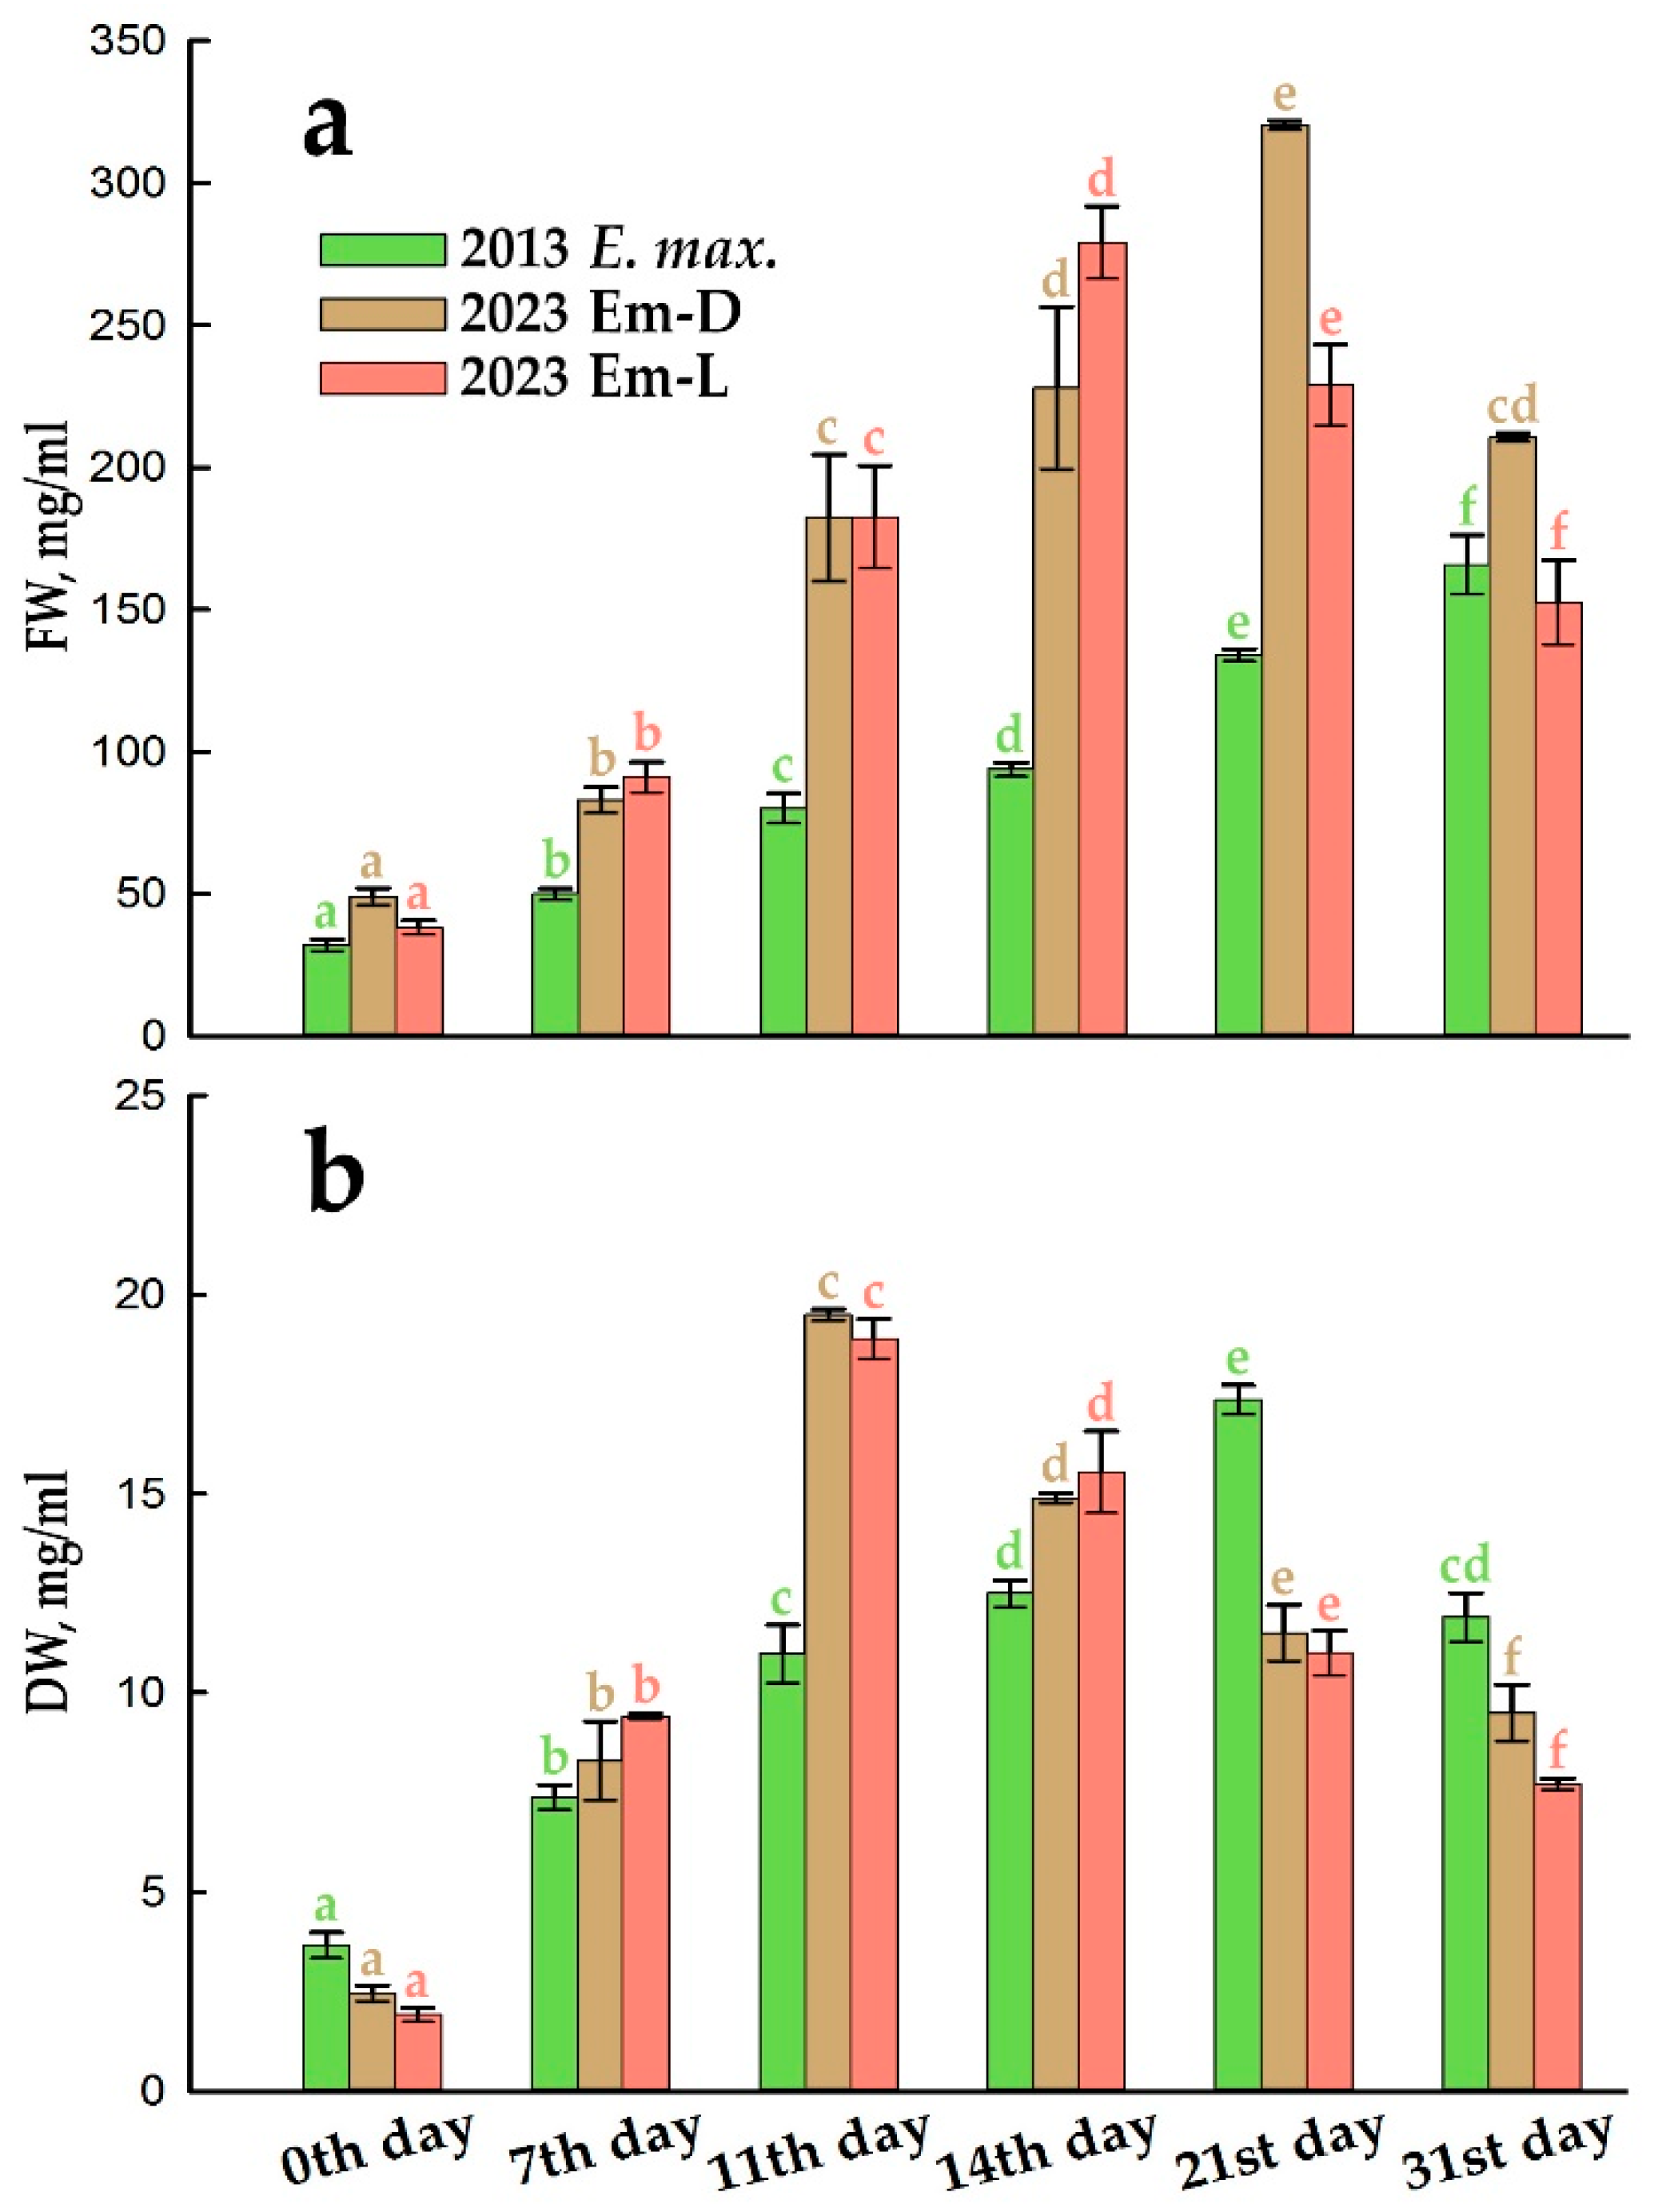
Figure 3.
Triacylglycerol (TAG) content of dry weight (DW) in the initial suspension cell culture (E. max.) in 2013 and in the Em-D and Em-L cell cultures in 2023 during subcultivation. Different lowercase letters indicate significant differences (p ≤ 0.05) between values inside of each cell culture based on one-way ANOVA with a Holm-Sidak all pairwise multiple comparison method.
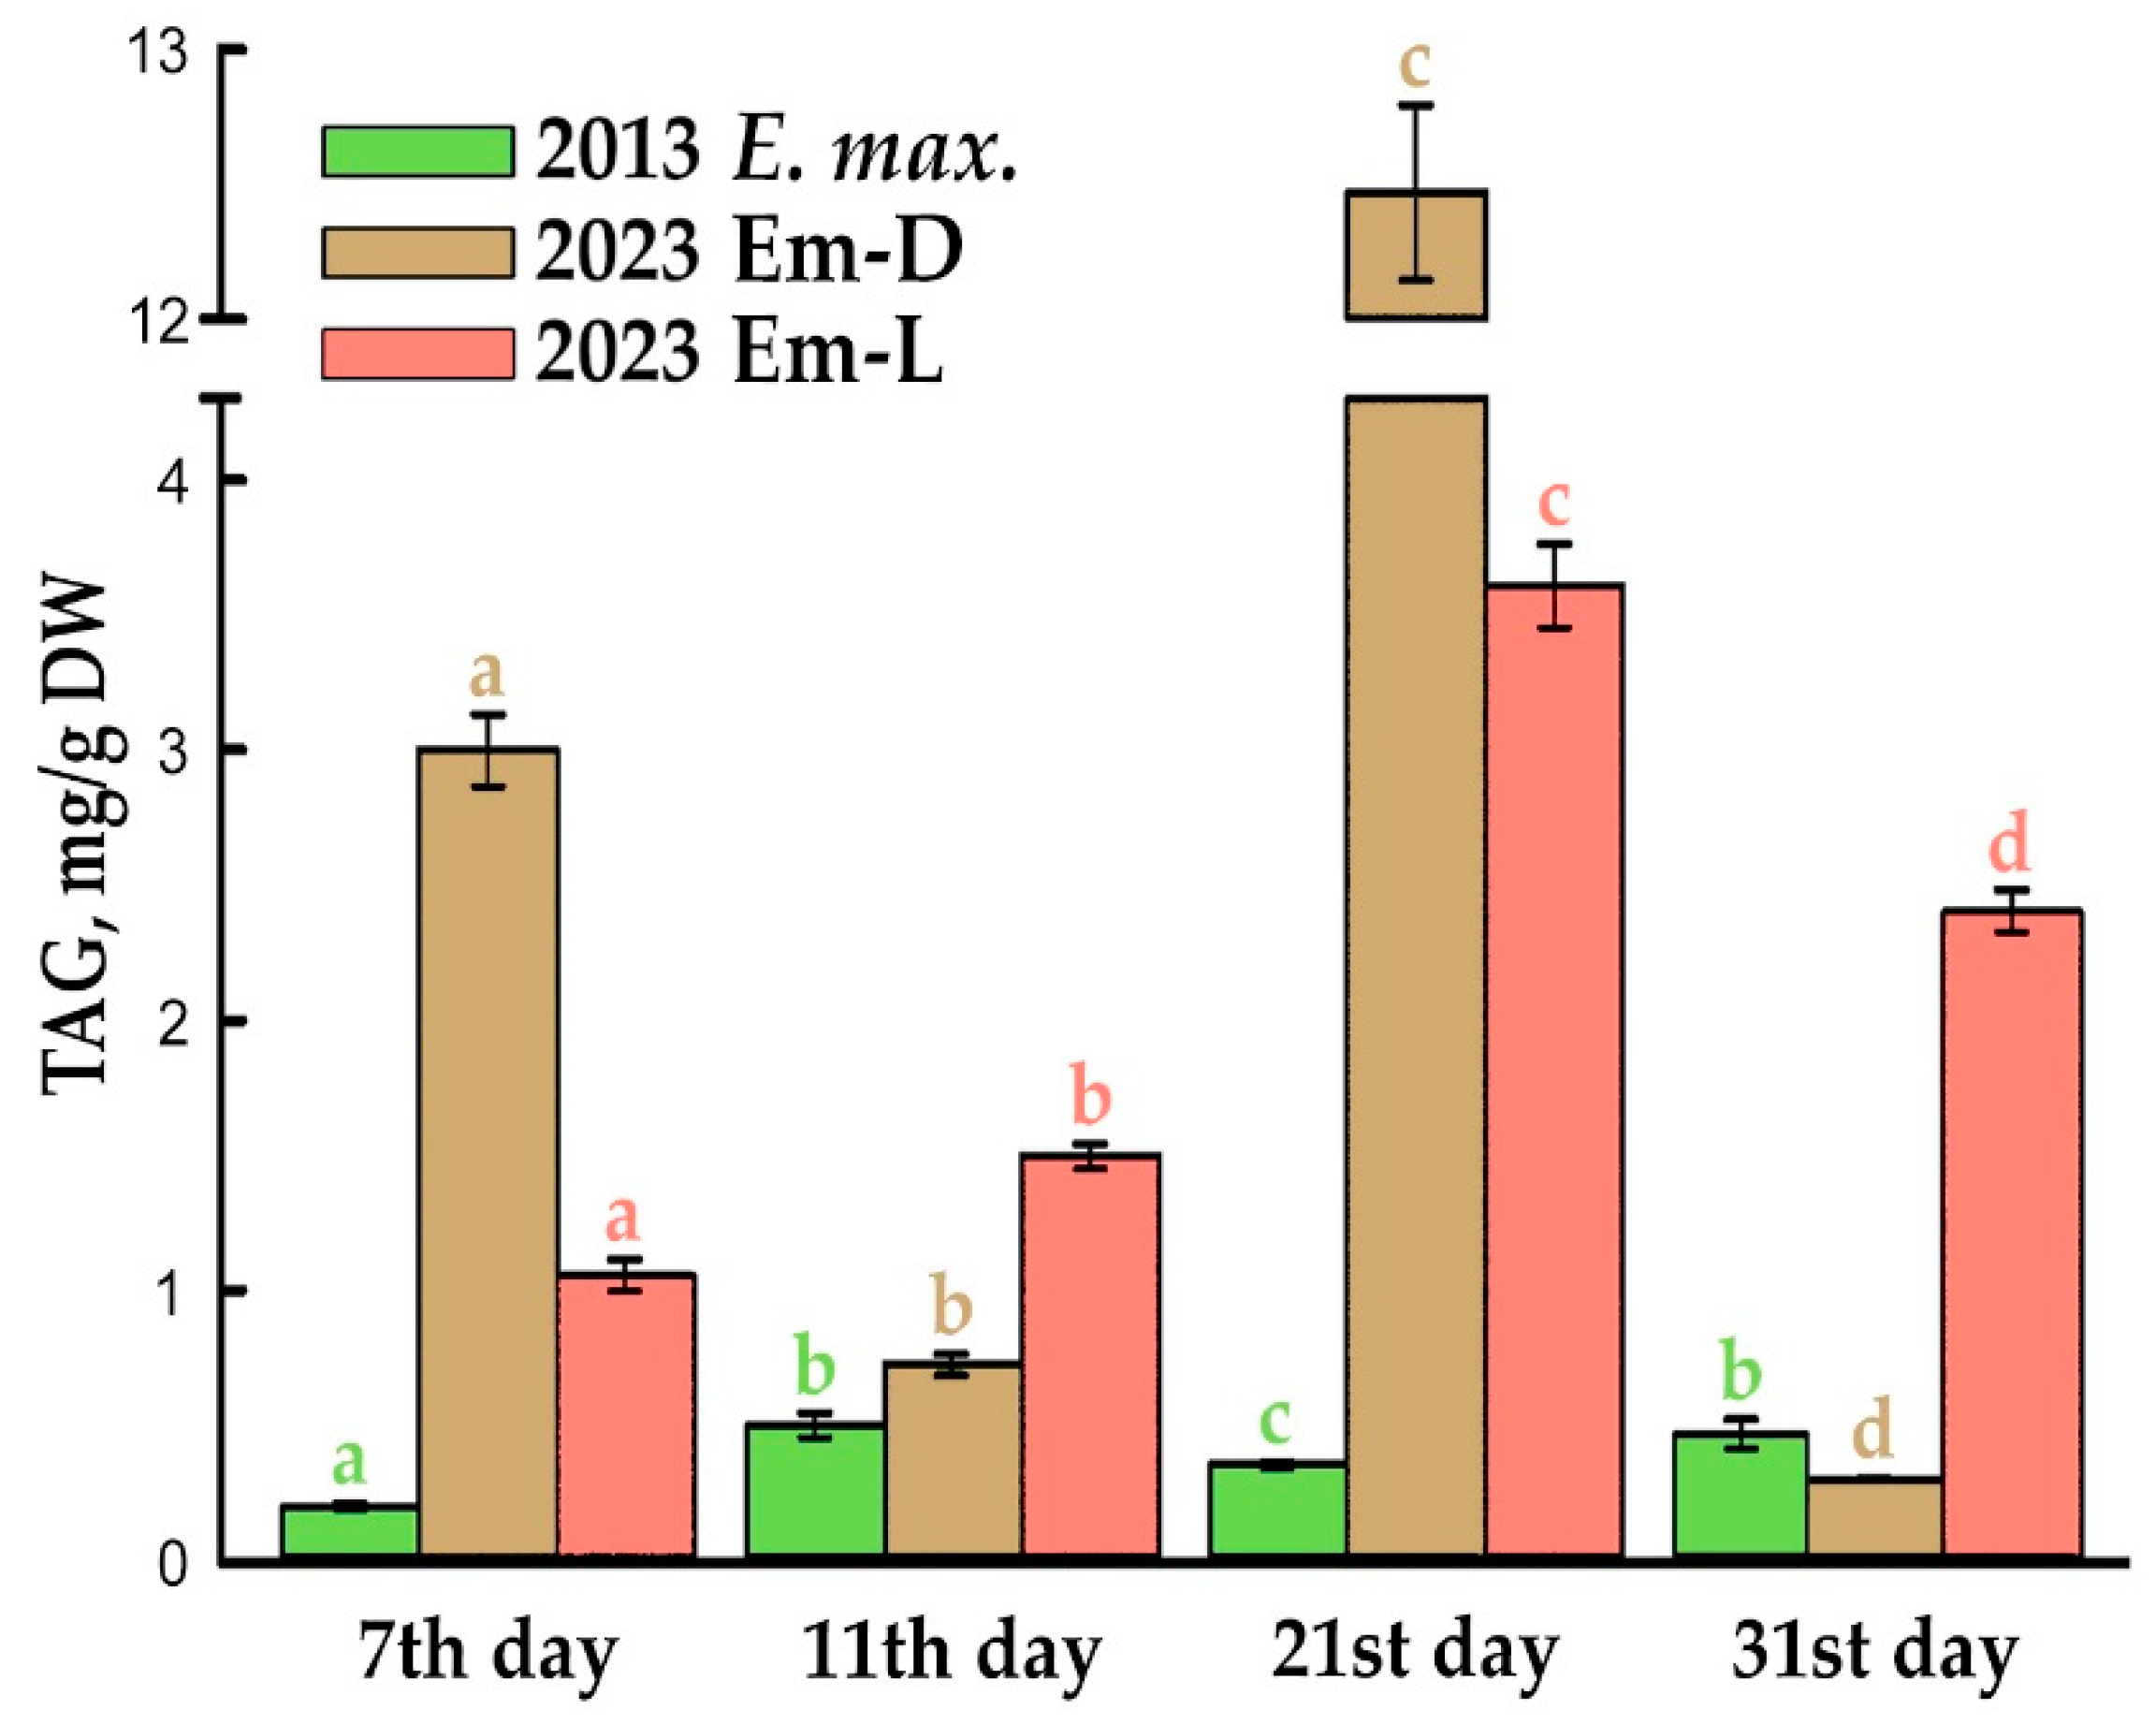
Figure 4.
Five major fatty acids (FAs) of total lipids proportion during subcultivation of the suspension cell cultures. (a) The initial suspension cell culture (E. max.) in 2013. (b) The Em-D suspension cell culture in 2023. (c) The Em-L suspension cell culture in 2023. Different lowercase letters indicate significant differences (p ≤ 0.05) between values of one parameter inside of each cell culture based on one-way ANOVA with a Holm-Sidak all pairwise multiple comparison method. The background color “pale purple” stands for DW linear growth period (associated with cell proliferation) and “fresh air” stands for stationary stage of growth.
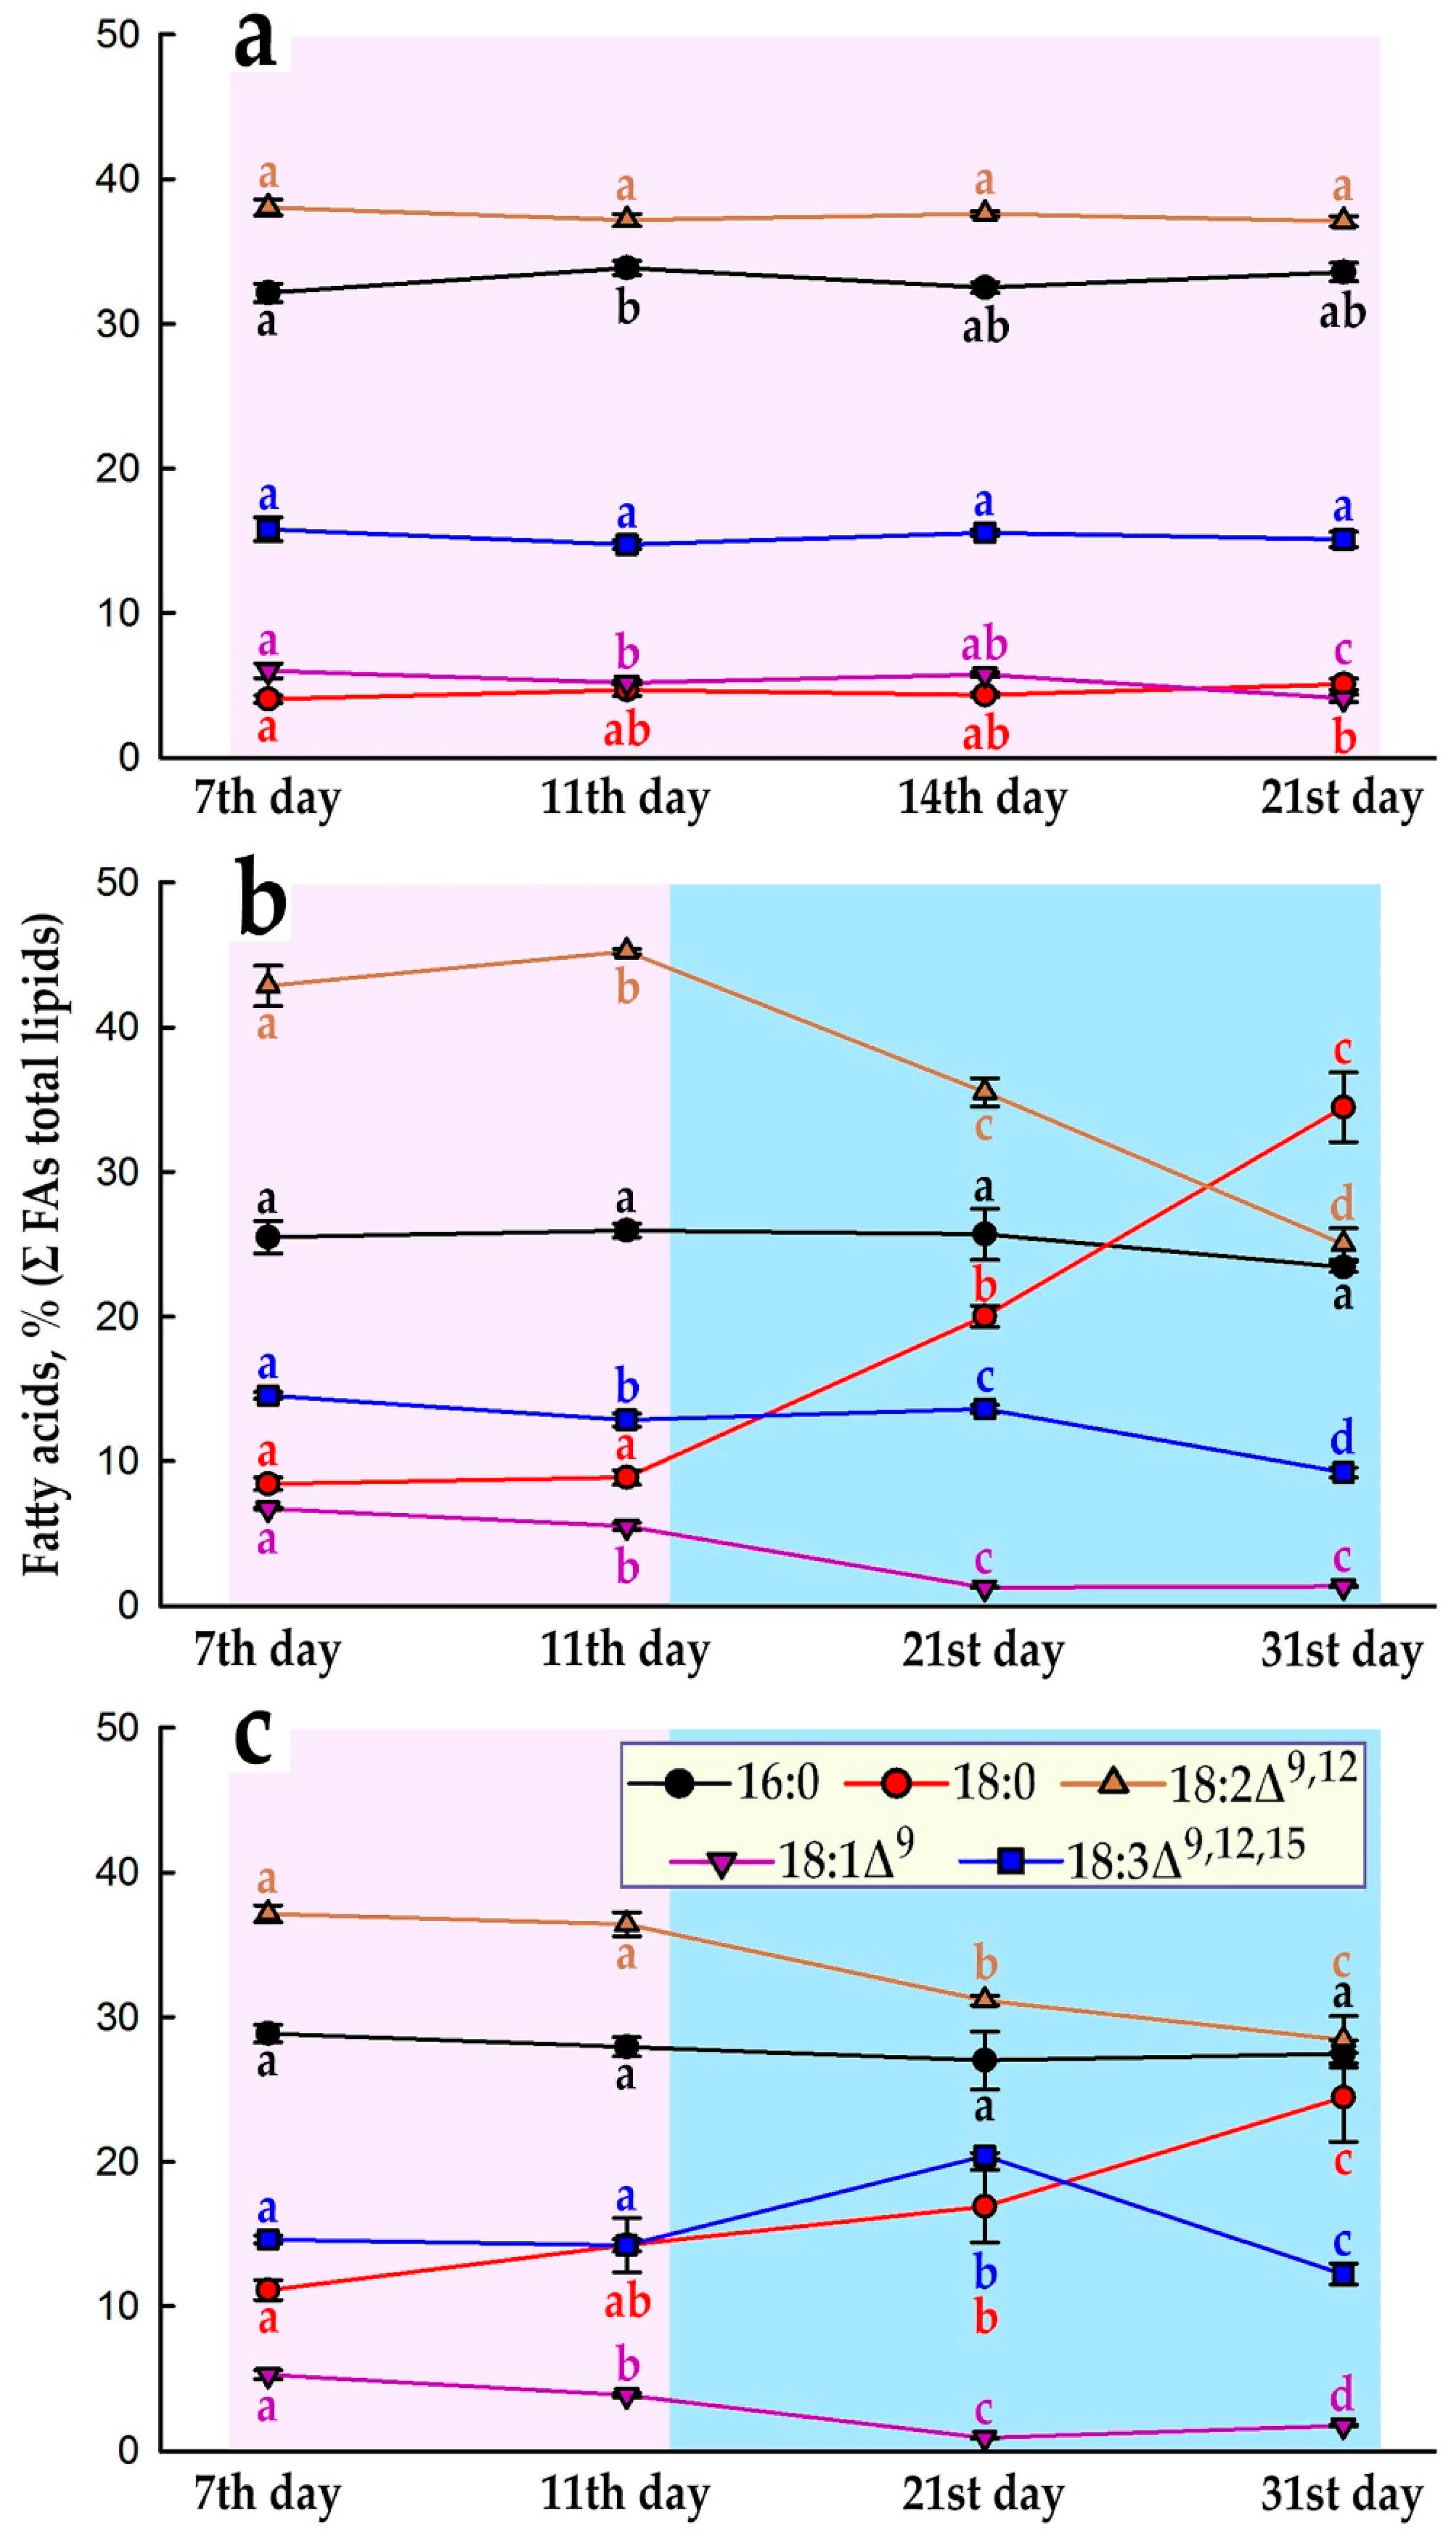
Figure 5.
The sum of very-long-chain FAs (VLCFAs) proportion of total lipids in the initial suspension cell culture (E. max.) in 2013 and in the Em-D and Em-L cell cultures in 2023 during subcultivation. Different lowercase letters indicate significant differences (p ≤ 0.05) between values inside of each cell culture based on one-way ANOVA with a Holm-Sidak all pairwise multiple comparison method.
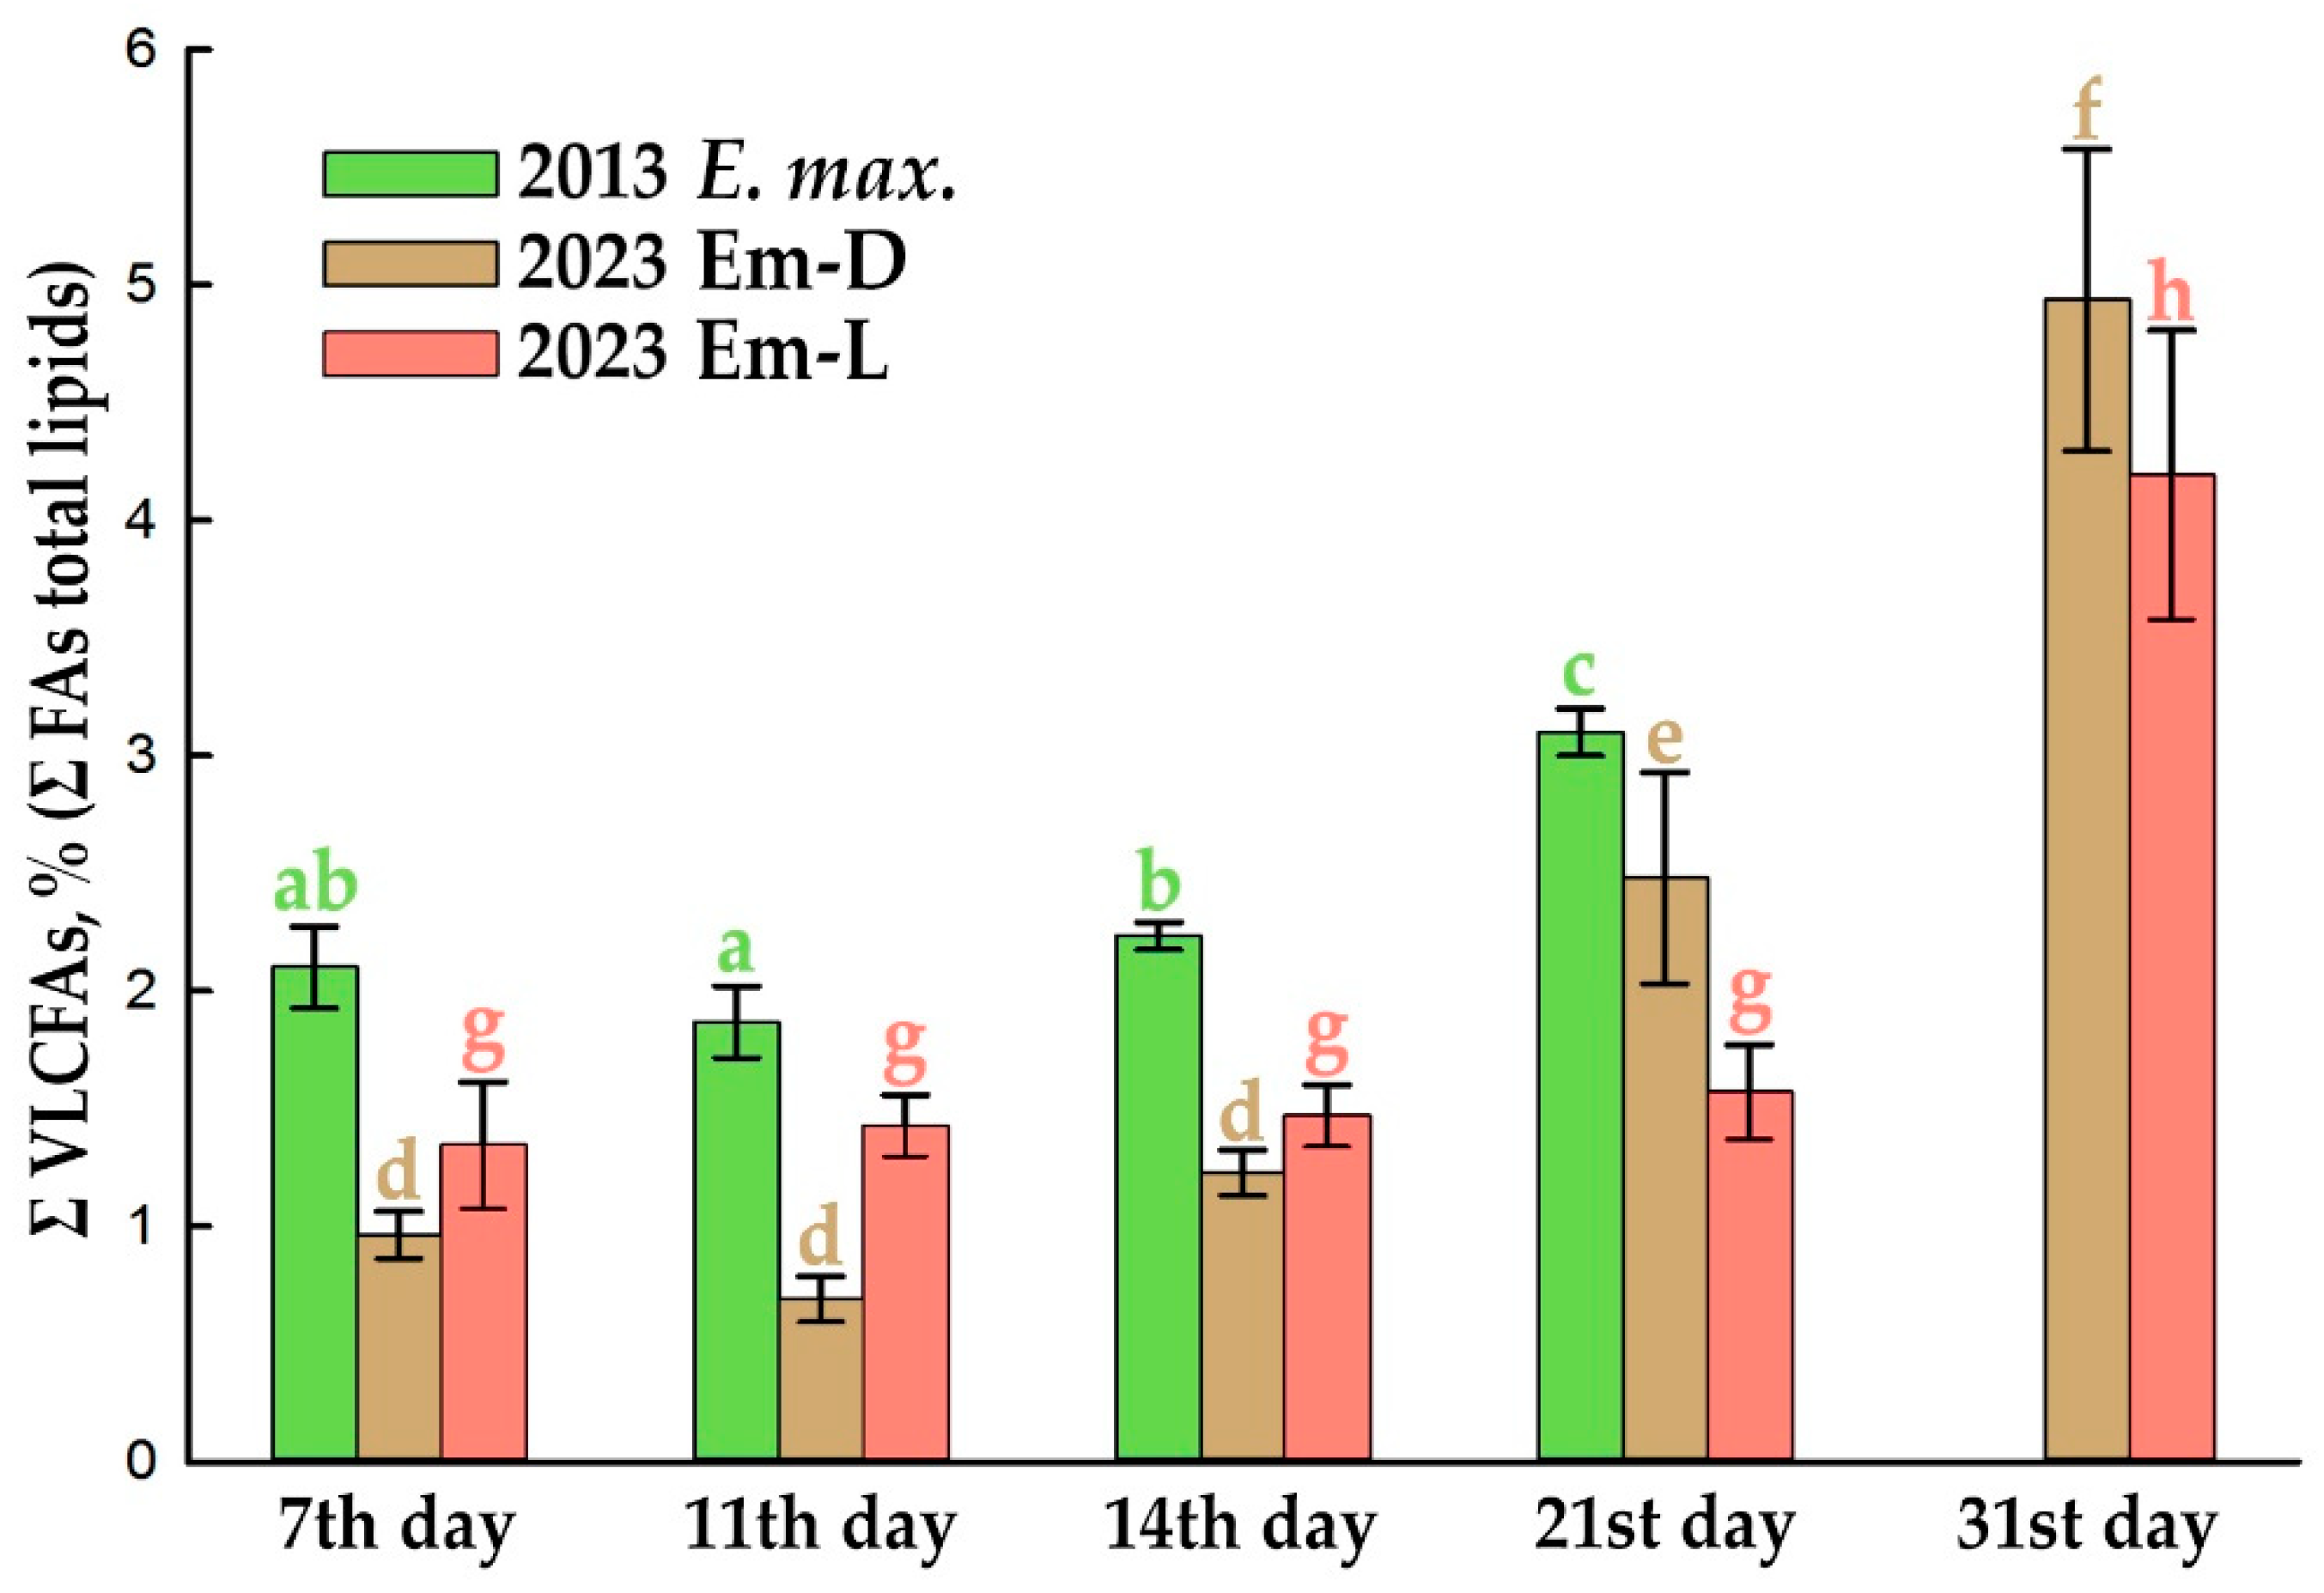
Figure 6.
The proportion of detected individual VLCFAs of total lipids in the Em-D (a) and Em-L (b) cell cultures during subcultivation. Different lowercase letters indicate significant differences (p ≤ 0.05) between values of one parameter inside of each cell culture based on one-way ANOVA with a Holm-Sidak all pairwise multiple comparison method.
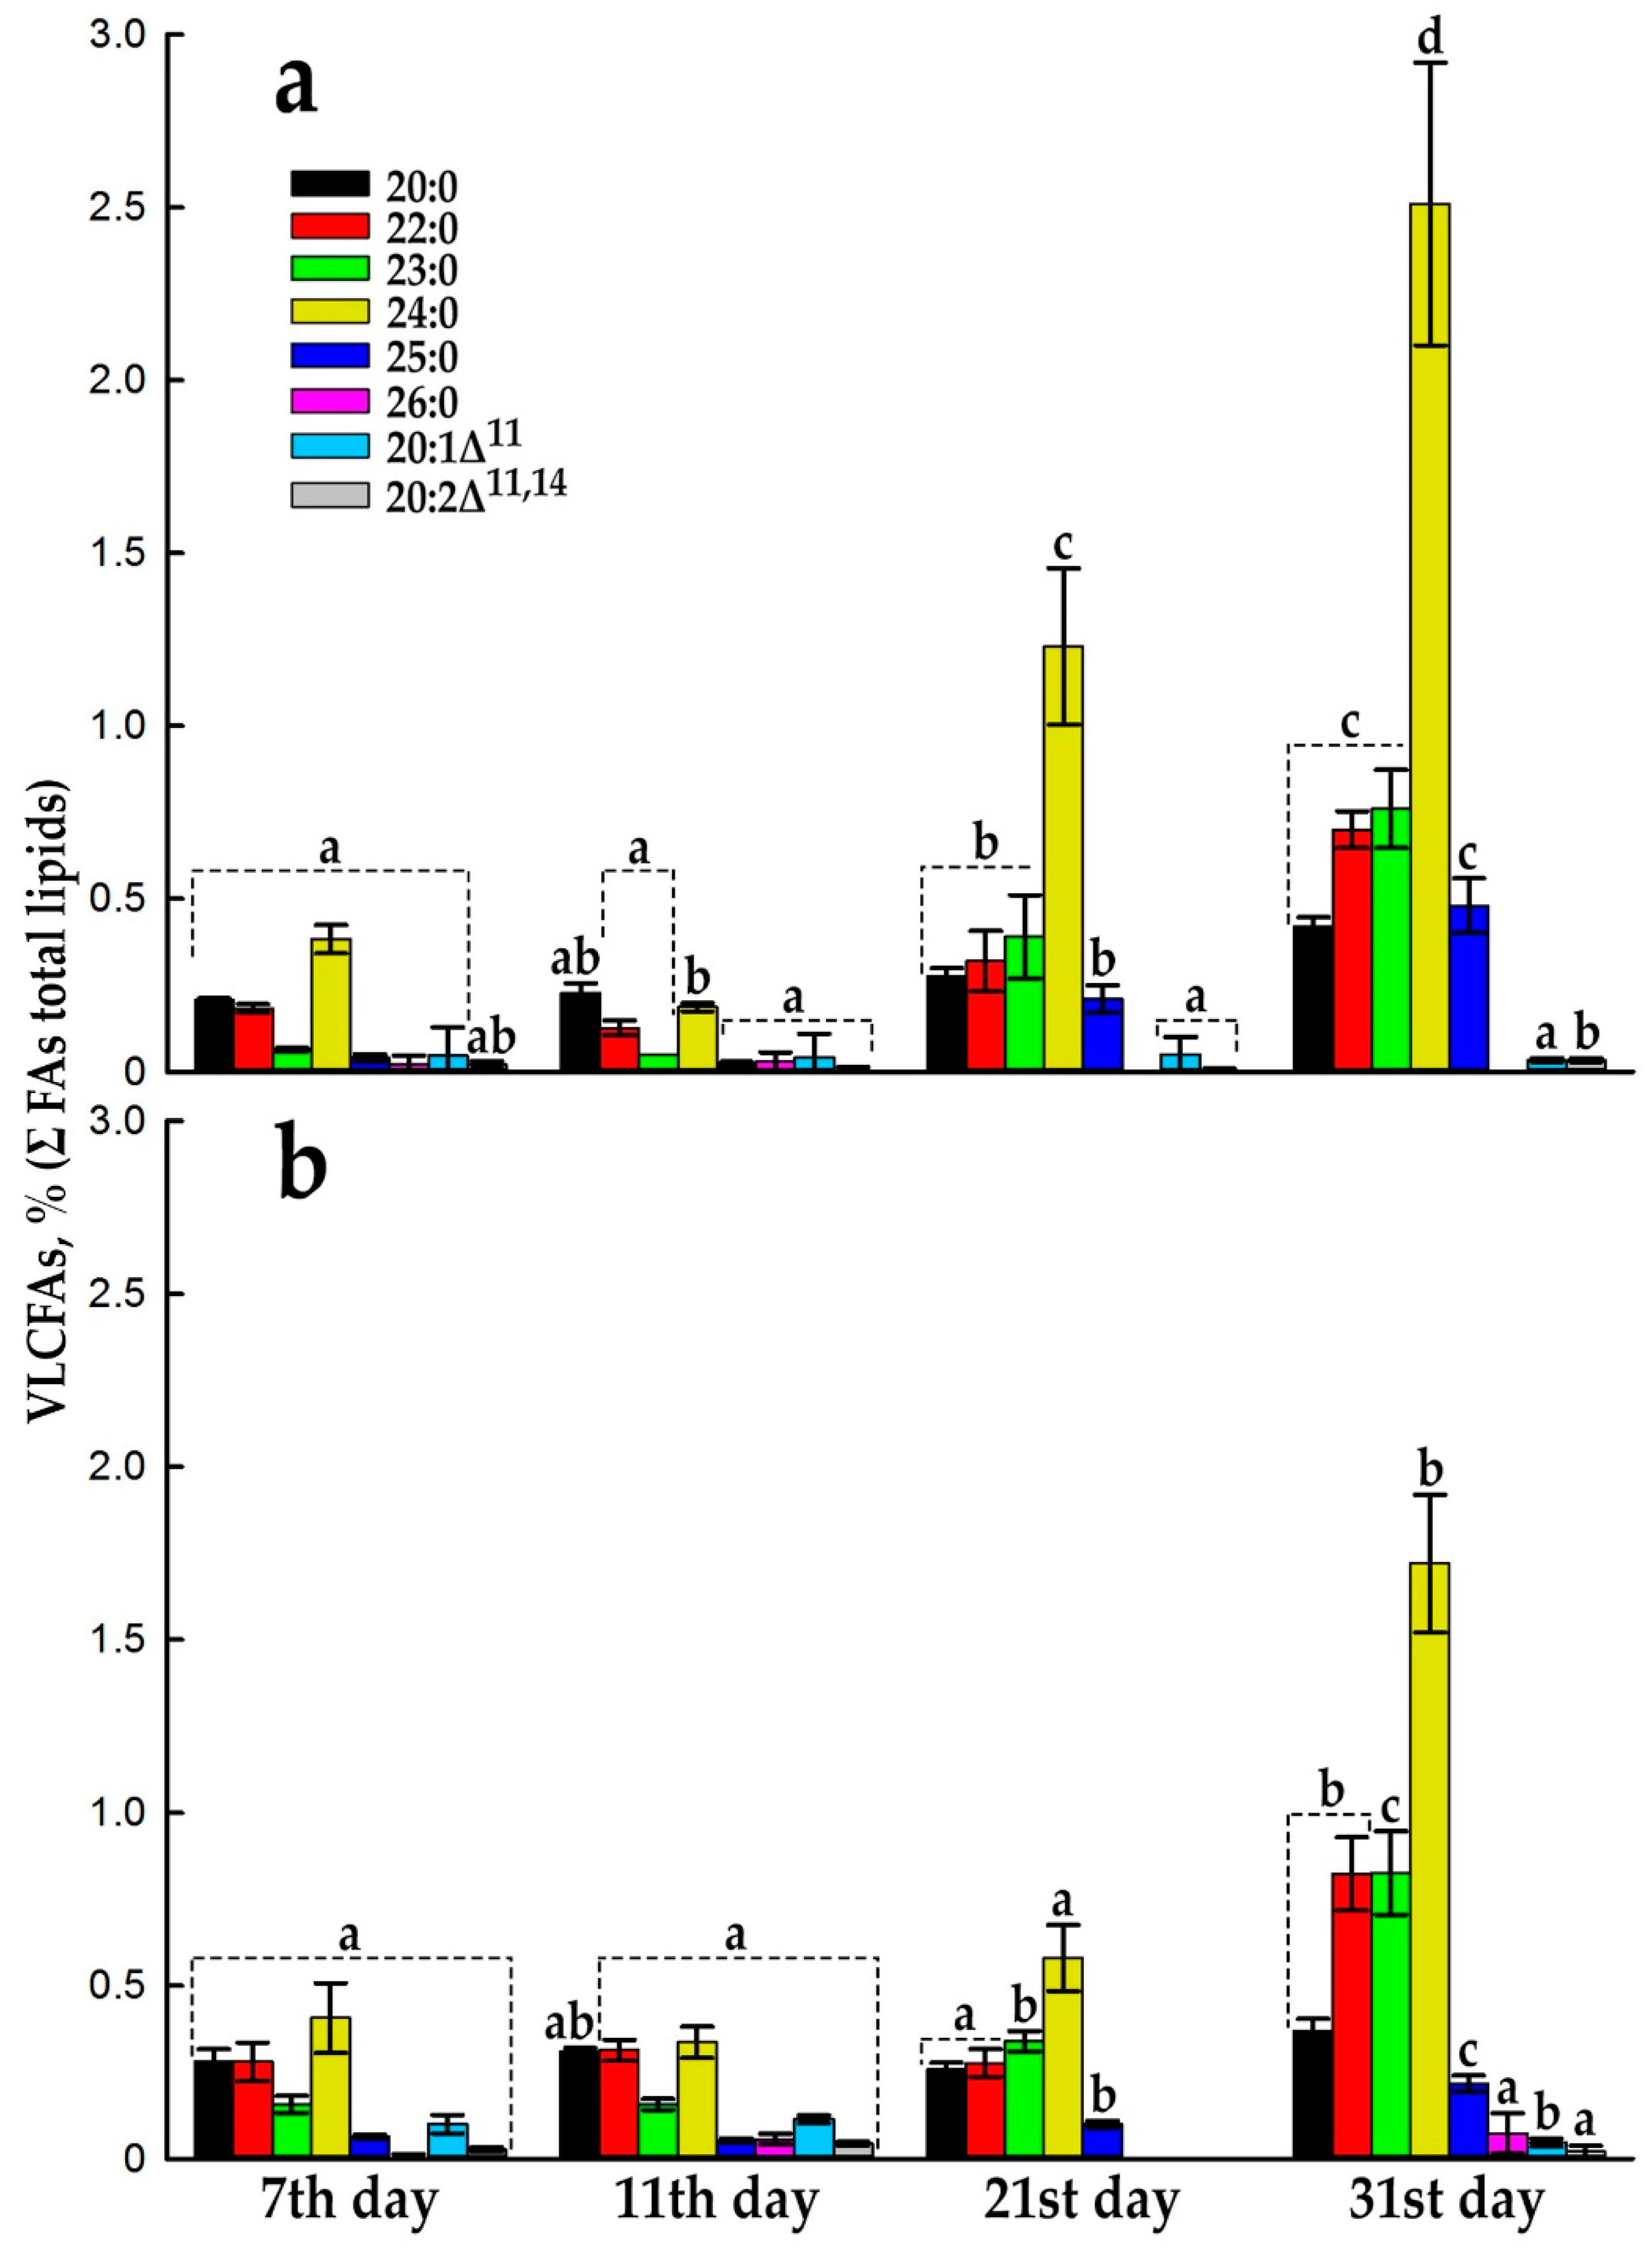
Figure 7.
Total anthocyanin content of DW in the Em-D and Em-L cell cultures during subcultivation. Different lowercase letters indicate significant differences (p ≤ 0.05) between values based on one-way ANOVA with a Holm-Sidak all pairwise multiple comparison method.
Figure 7.
Total anthocyanin content of DW in the Em-D and Em-L cell cultures during subcultivation. Different lowercase letters indicate significant differences (p ≤ 0.05) between values based on one-way ANOVA with a Holm-Sidak all pairwise multiple comparison method.
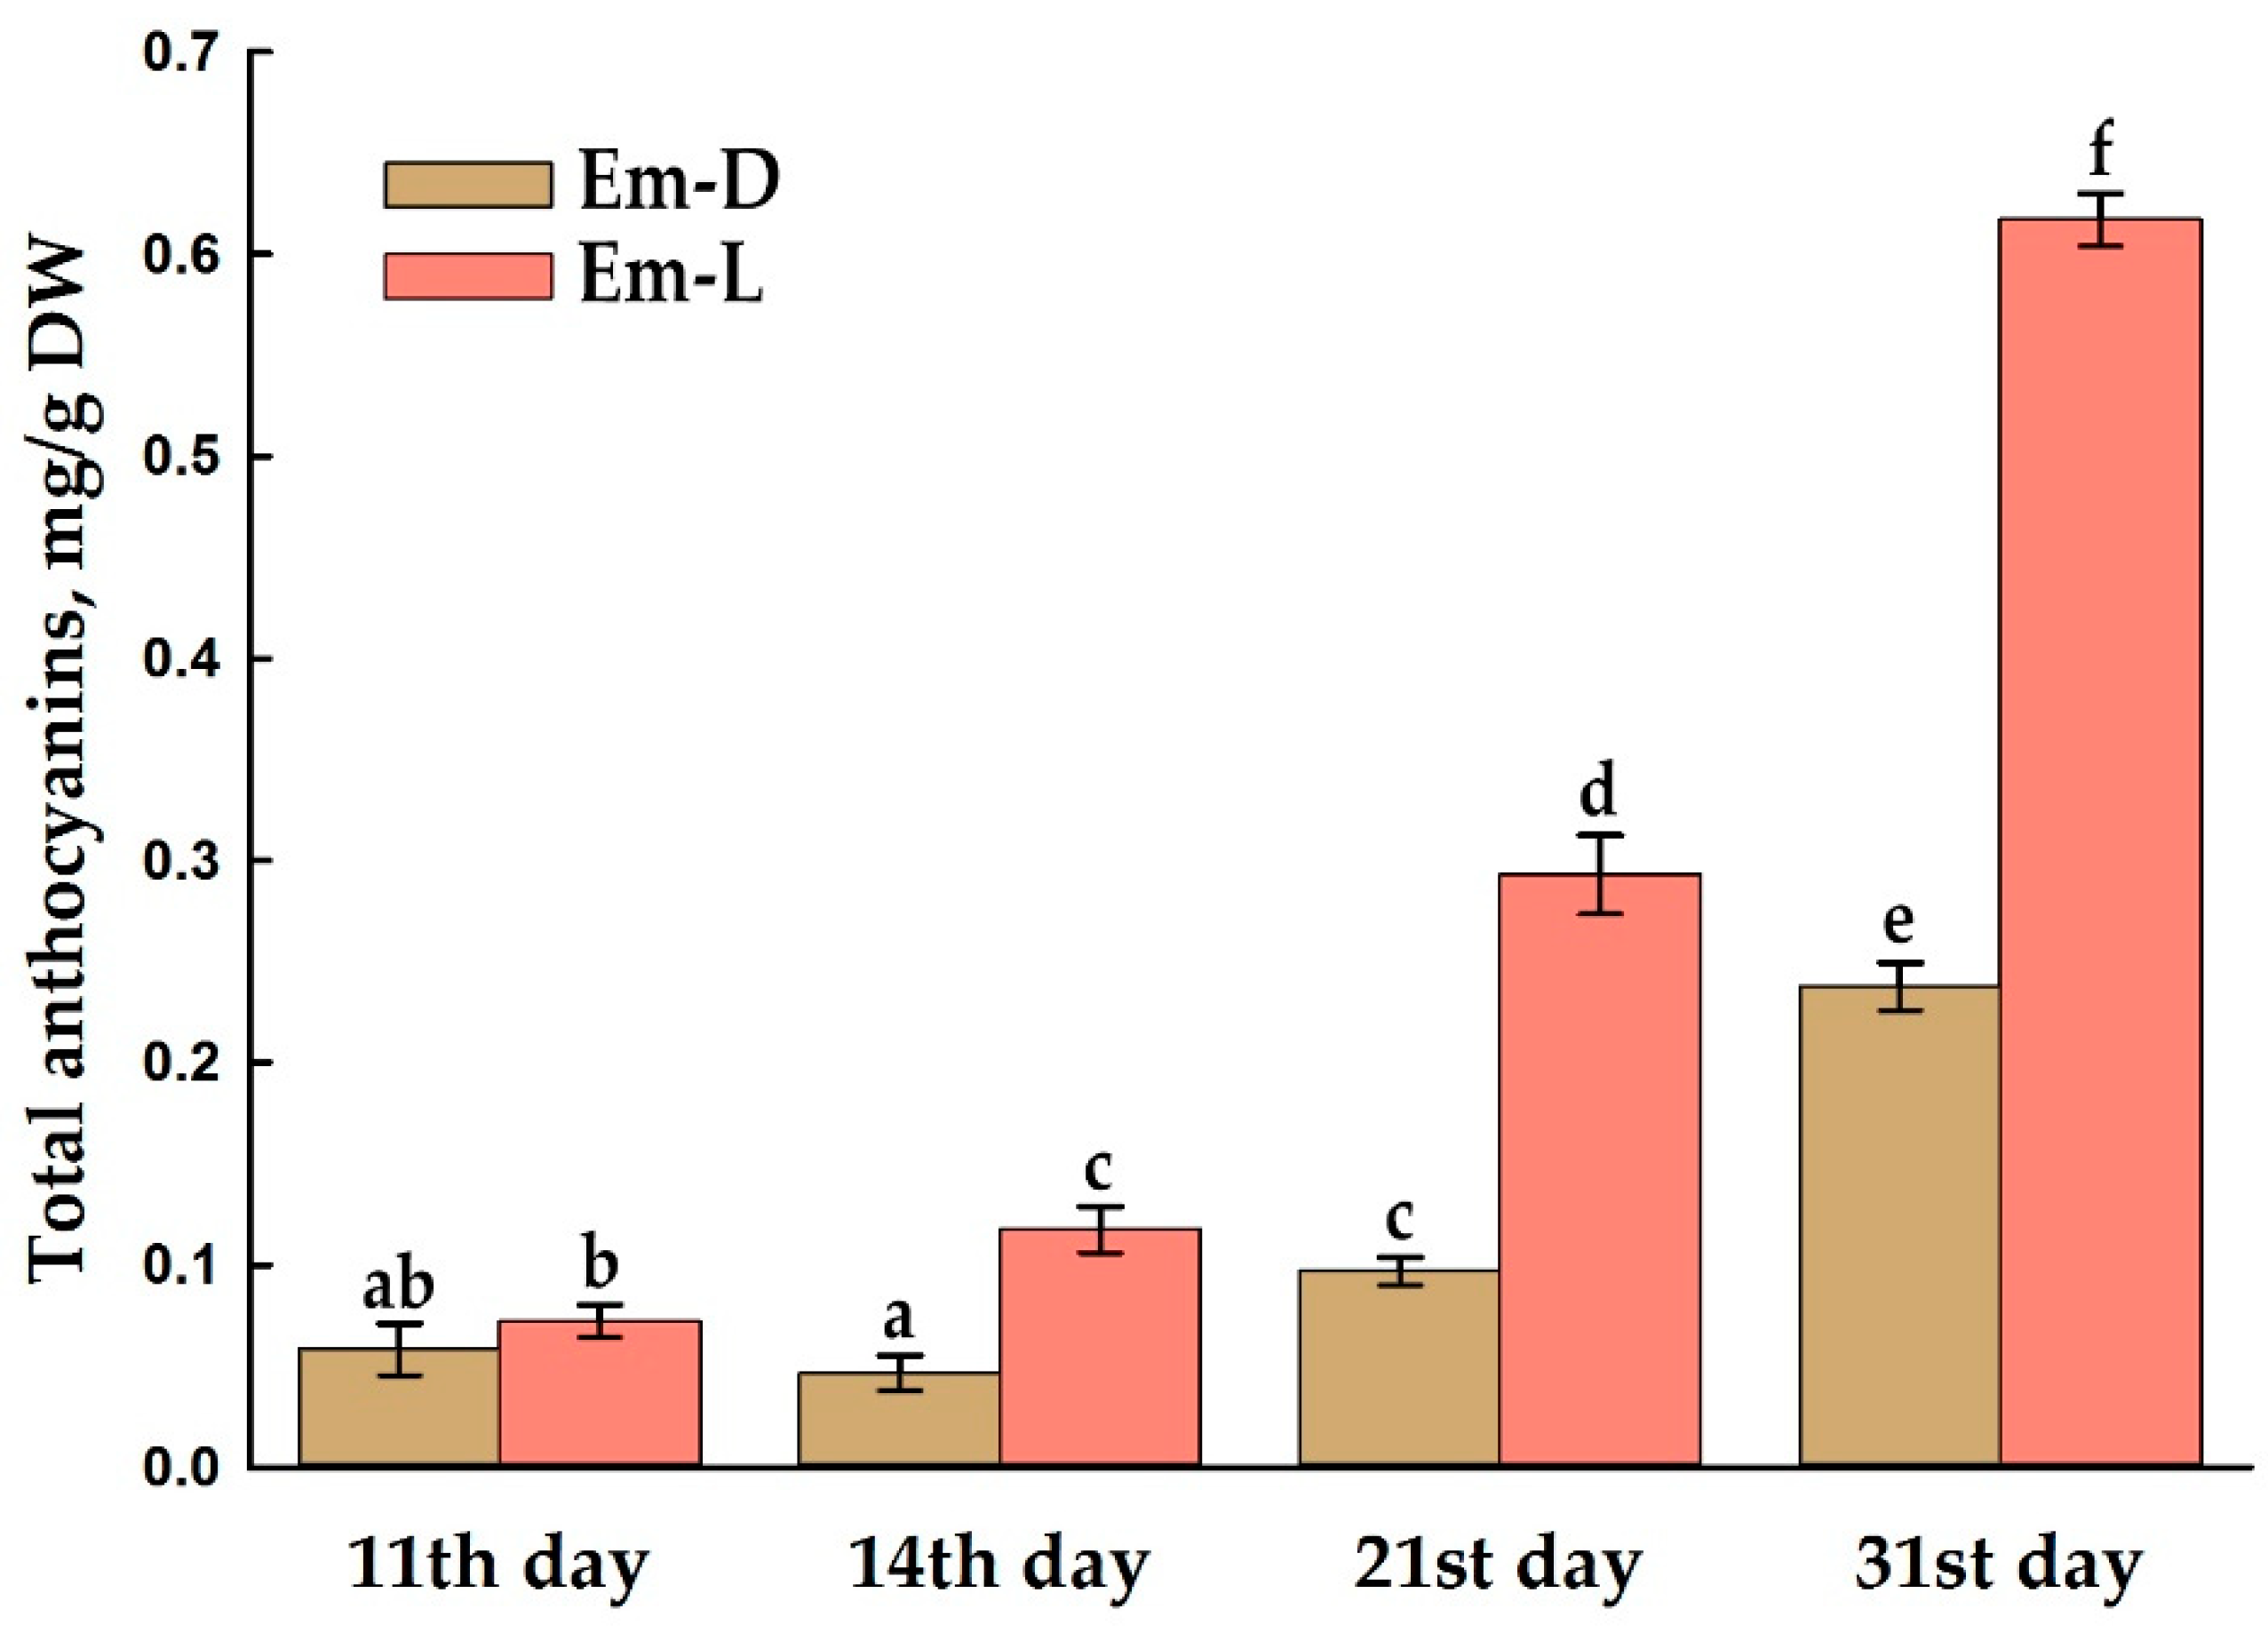
Figure 8.
Typical mass-spectrometric identification of the three anthocyanins found in the cultured cells and mature capsules of Euonymus maximowiczianus. (a) HPLC-DAD chromatogram of the methanolic extract of the Em-L suspension-cultured cells taken at the end of subcultivation; anthocyanin profile was detected at 520 nm. (b-d) ESI-MS spectra of three peaks i.e., I-III, respectively. (e-g) MS-MS spectra of the maximal abundant ions with m/z 465, 449, and 463, respectively.
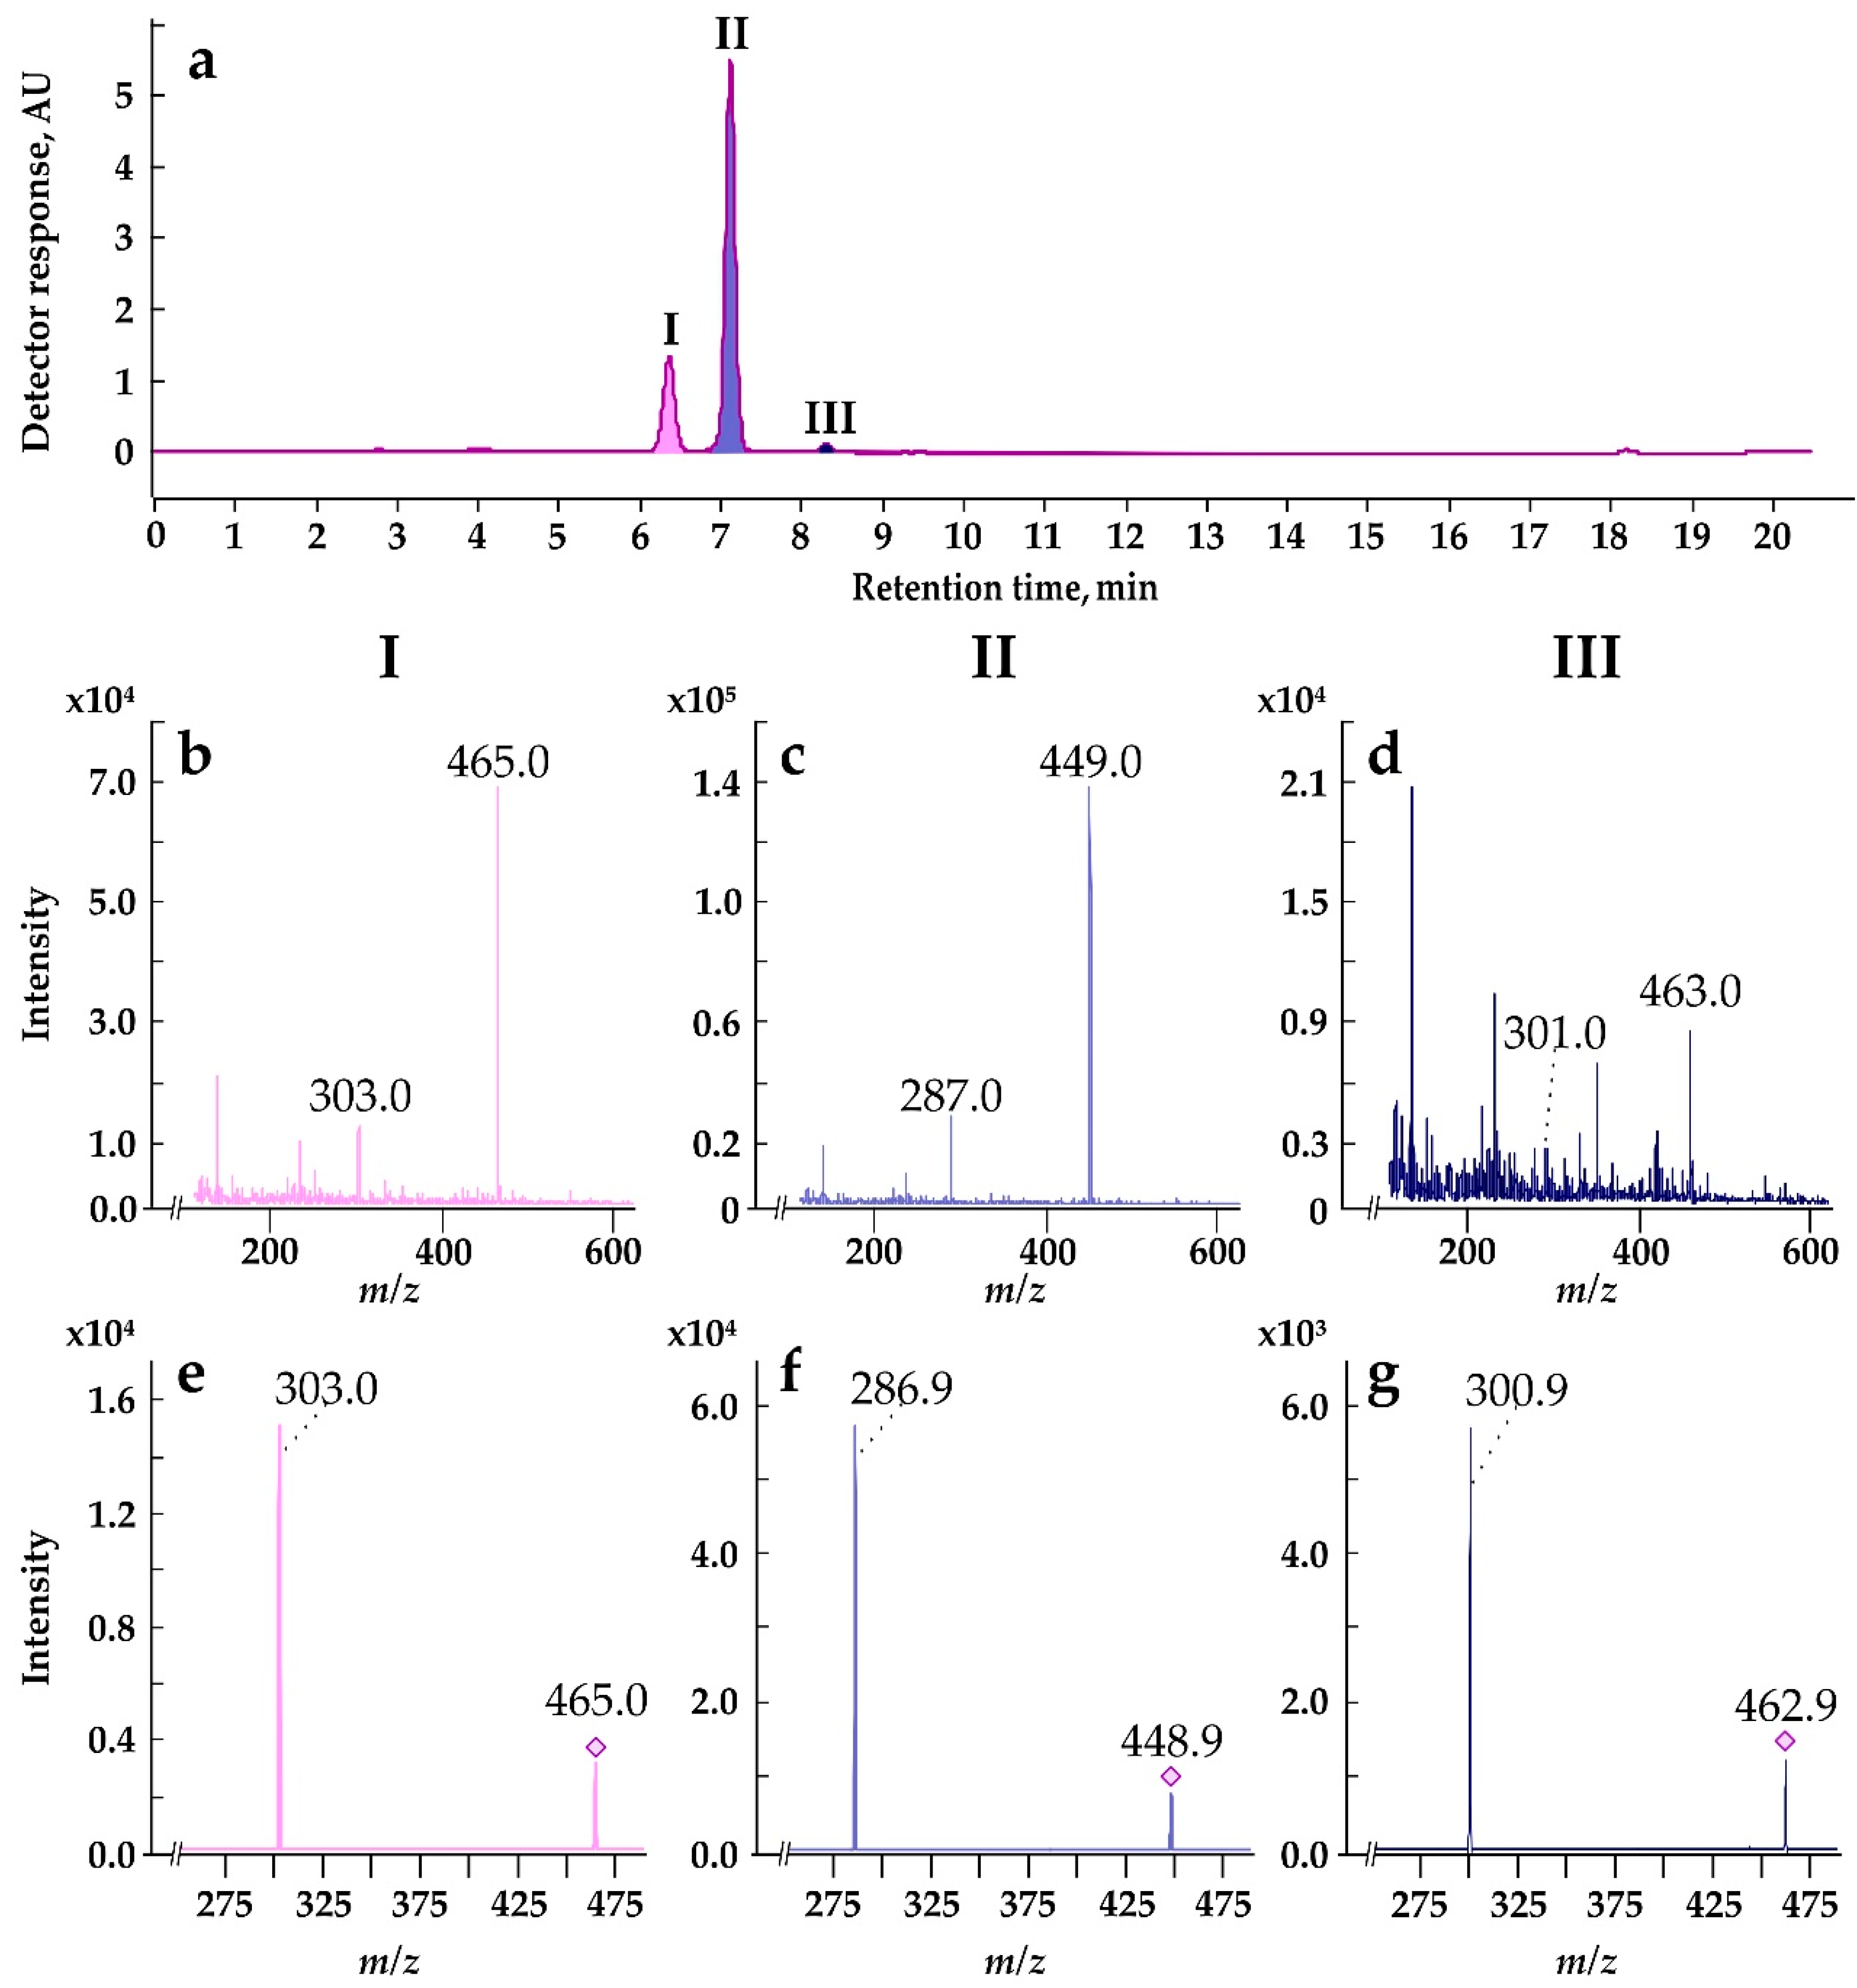
Figure 9.
Effect of MeJa treatment on total anthocyanin content in the Em-D and Em-L cell cultures. (a) External view of the control and methyl jasmonate-treated Em-D and Em-L cell cultures. (b) Total anthocyanin content in the control and methyl jasmonate-treated Em-D and Em-L cell cultures. Different lowercase letters indicate significant differences (p ≤ 0.05) between values based on one-way ANOVA with a Holm-Sidak all pairwise multiple comparison method.
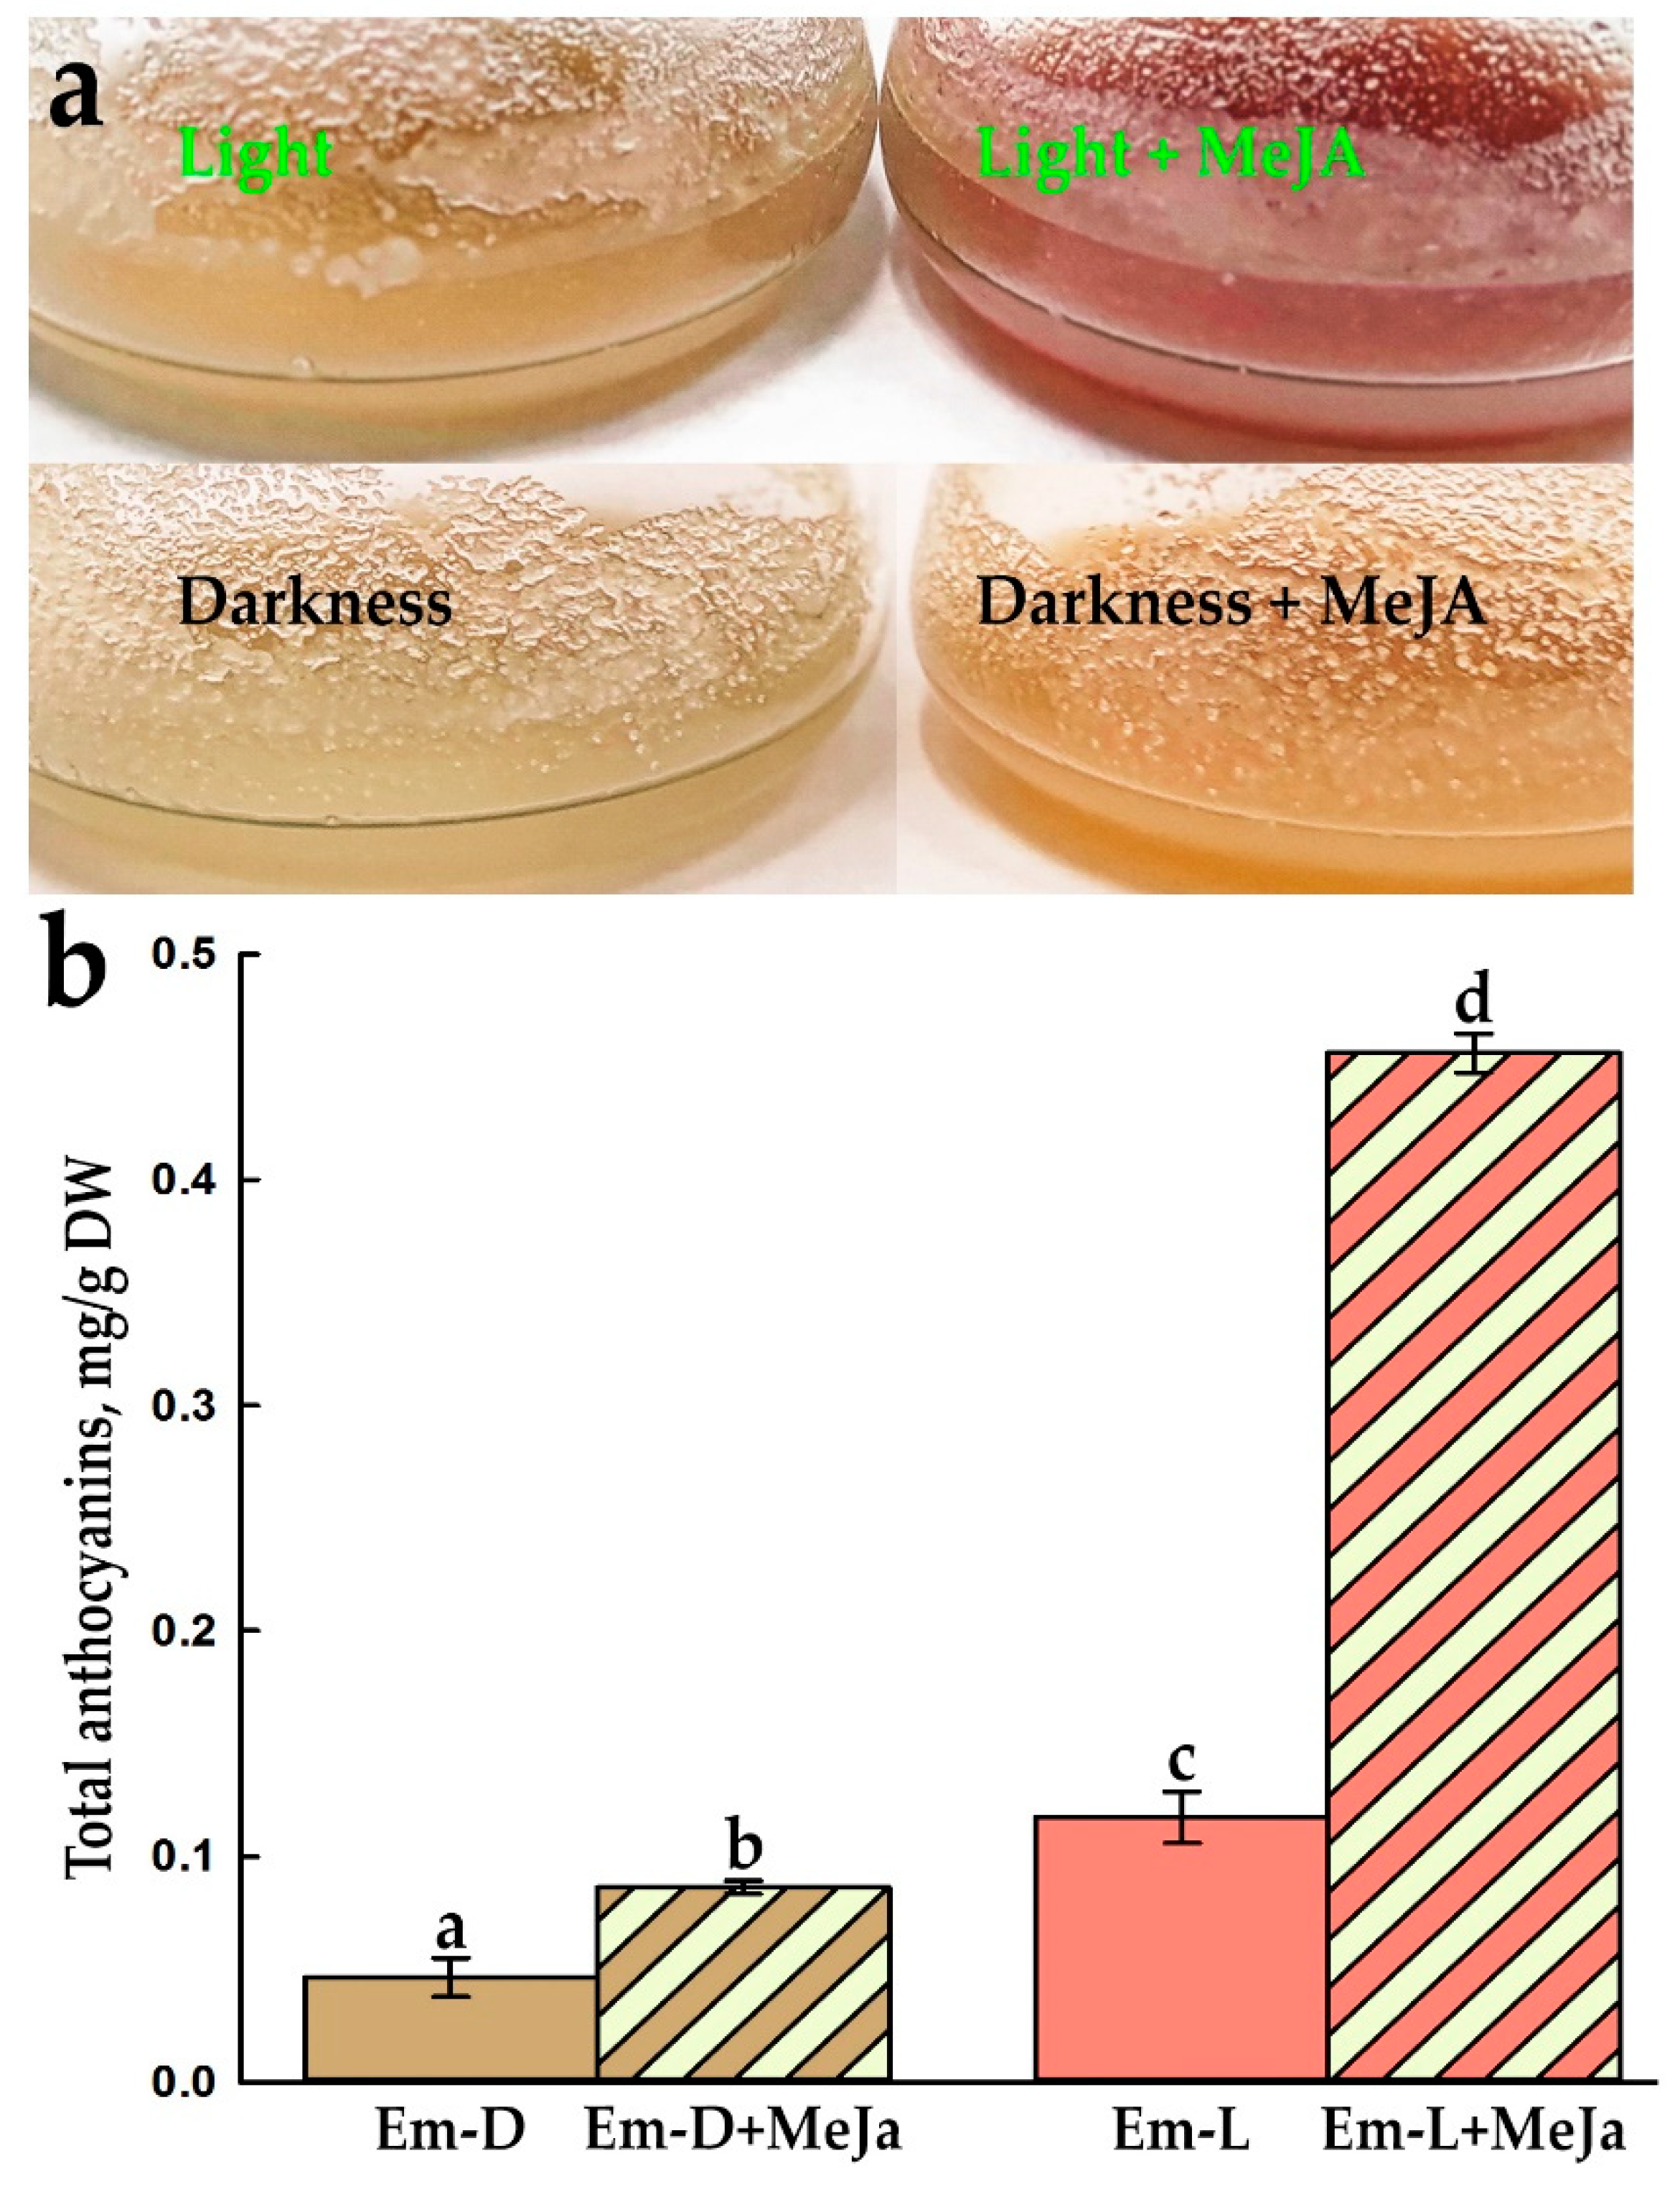
Figure 10.
Effect of MeJa treatment on total VLCFA content and proportion of individual VLCFA of total lipids in the Em-D and Em-L cell cultures. (a) Total VLCFA content of DW. (b) Proportion of individual VLCFAs of total lipid FAs. Different lowercase letters indicate significant differences (p ≤ 0.05) between values based on one-way ANOVA with a Holm-Sidak all pairwise multiple comparison method.
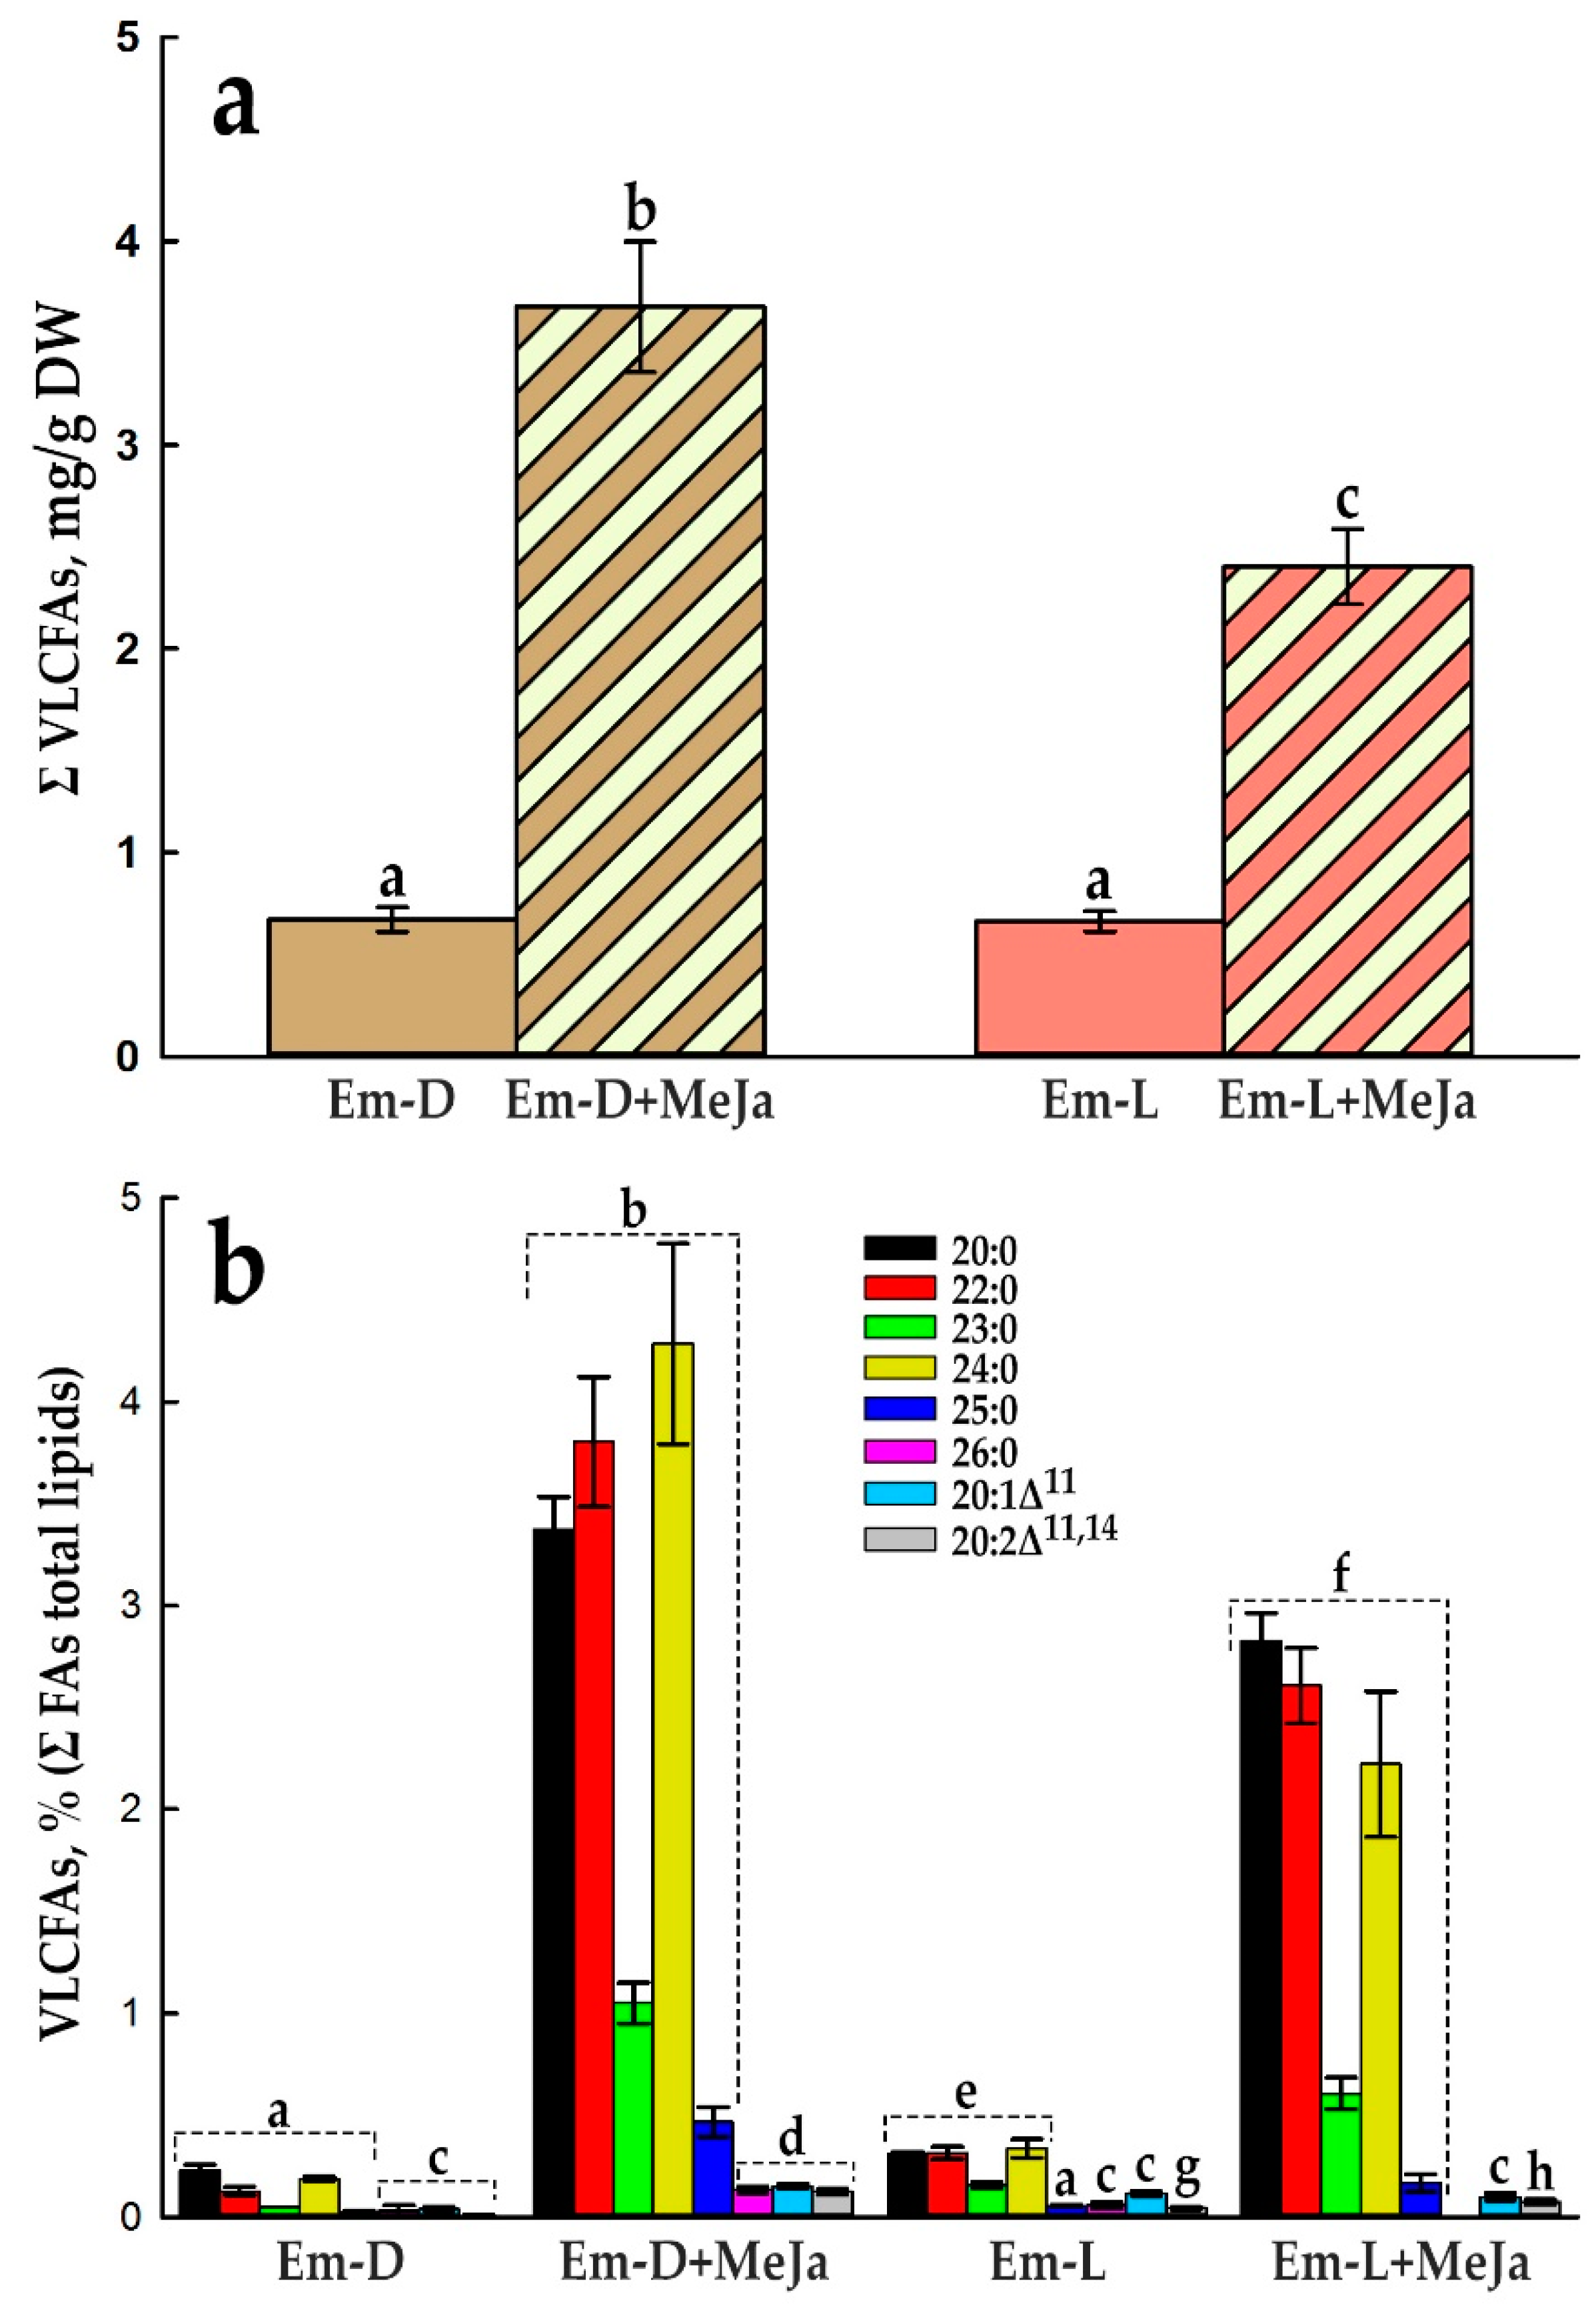
Figure 11.
Typical total ion current chromatogram of GC-MS separation of FA methyl esters (FAMEs) obtained from total lipids of the control and MeJa-treated suspension cell cultures. (a) The untreated (control) Em-D cell culture at the 14th day of subcultivation. (b) The Em-D cell culture at the 14th day of subcultivation after 5-day treatment with MeJa.
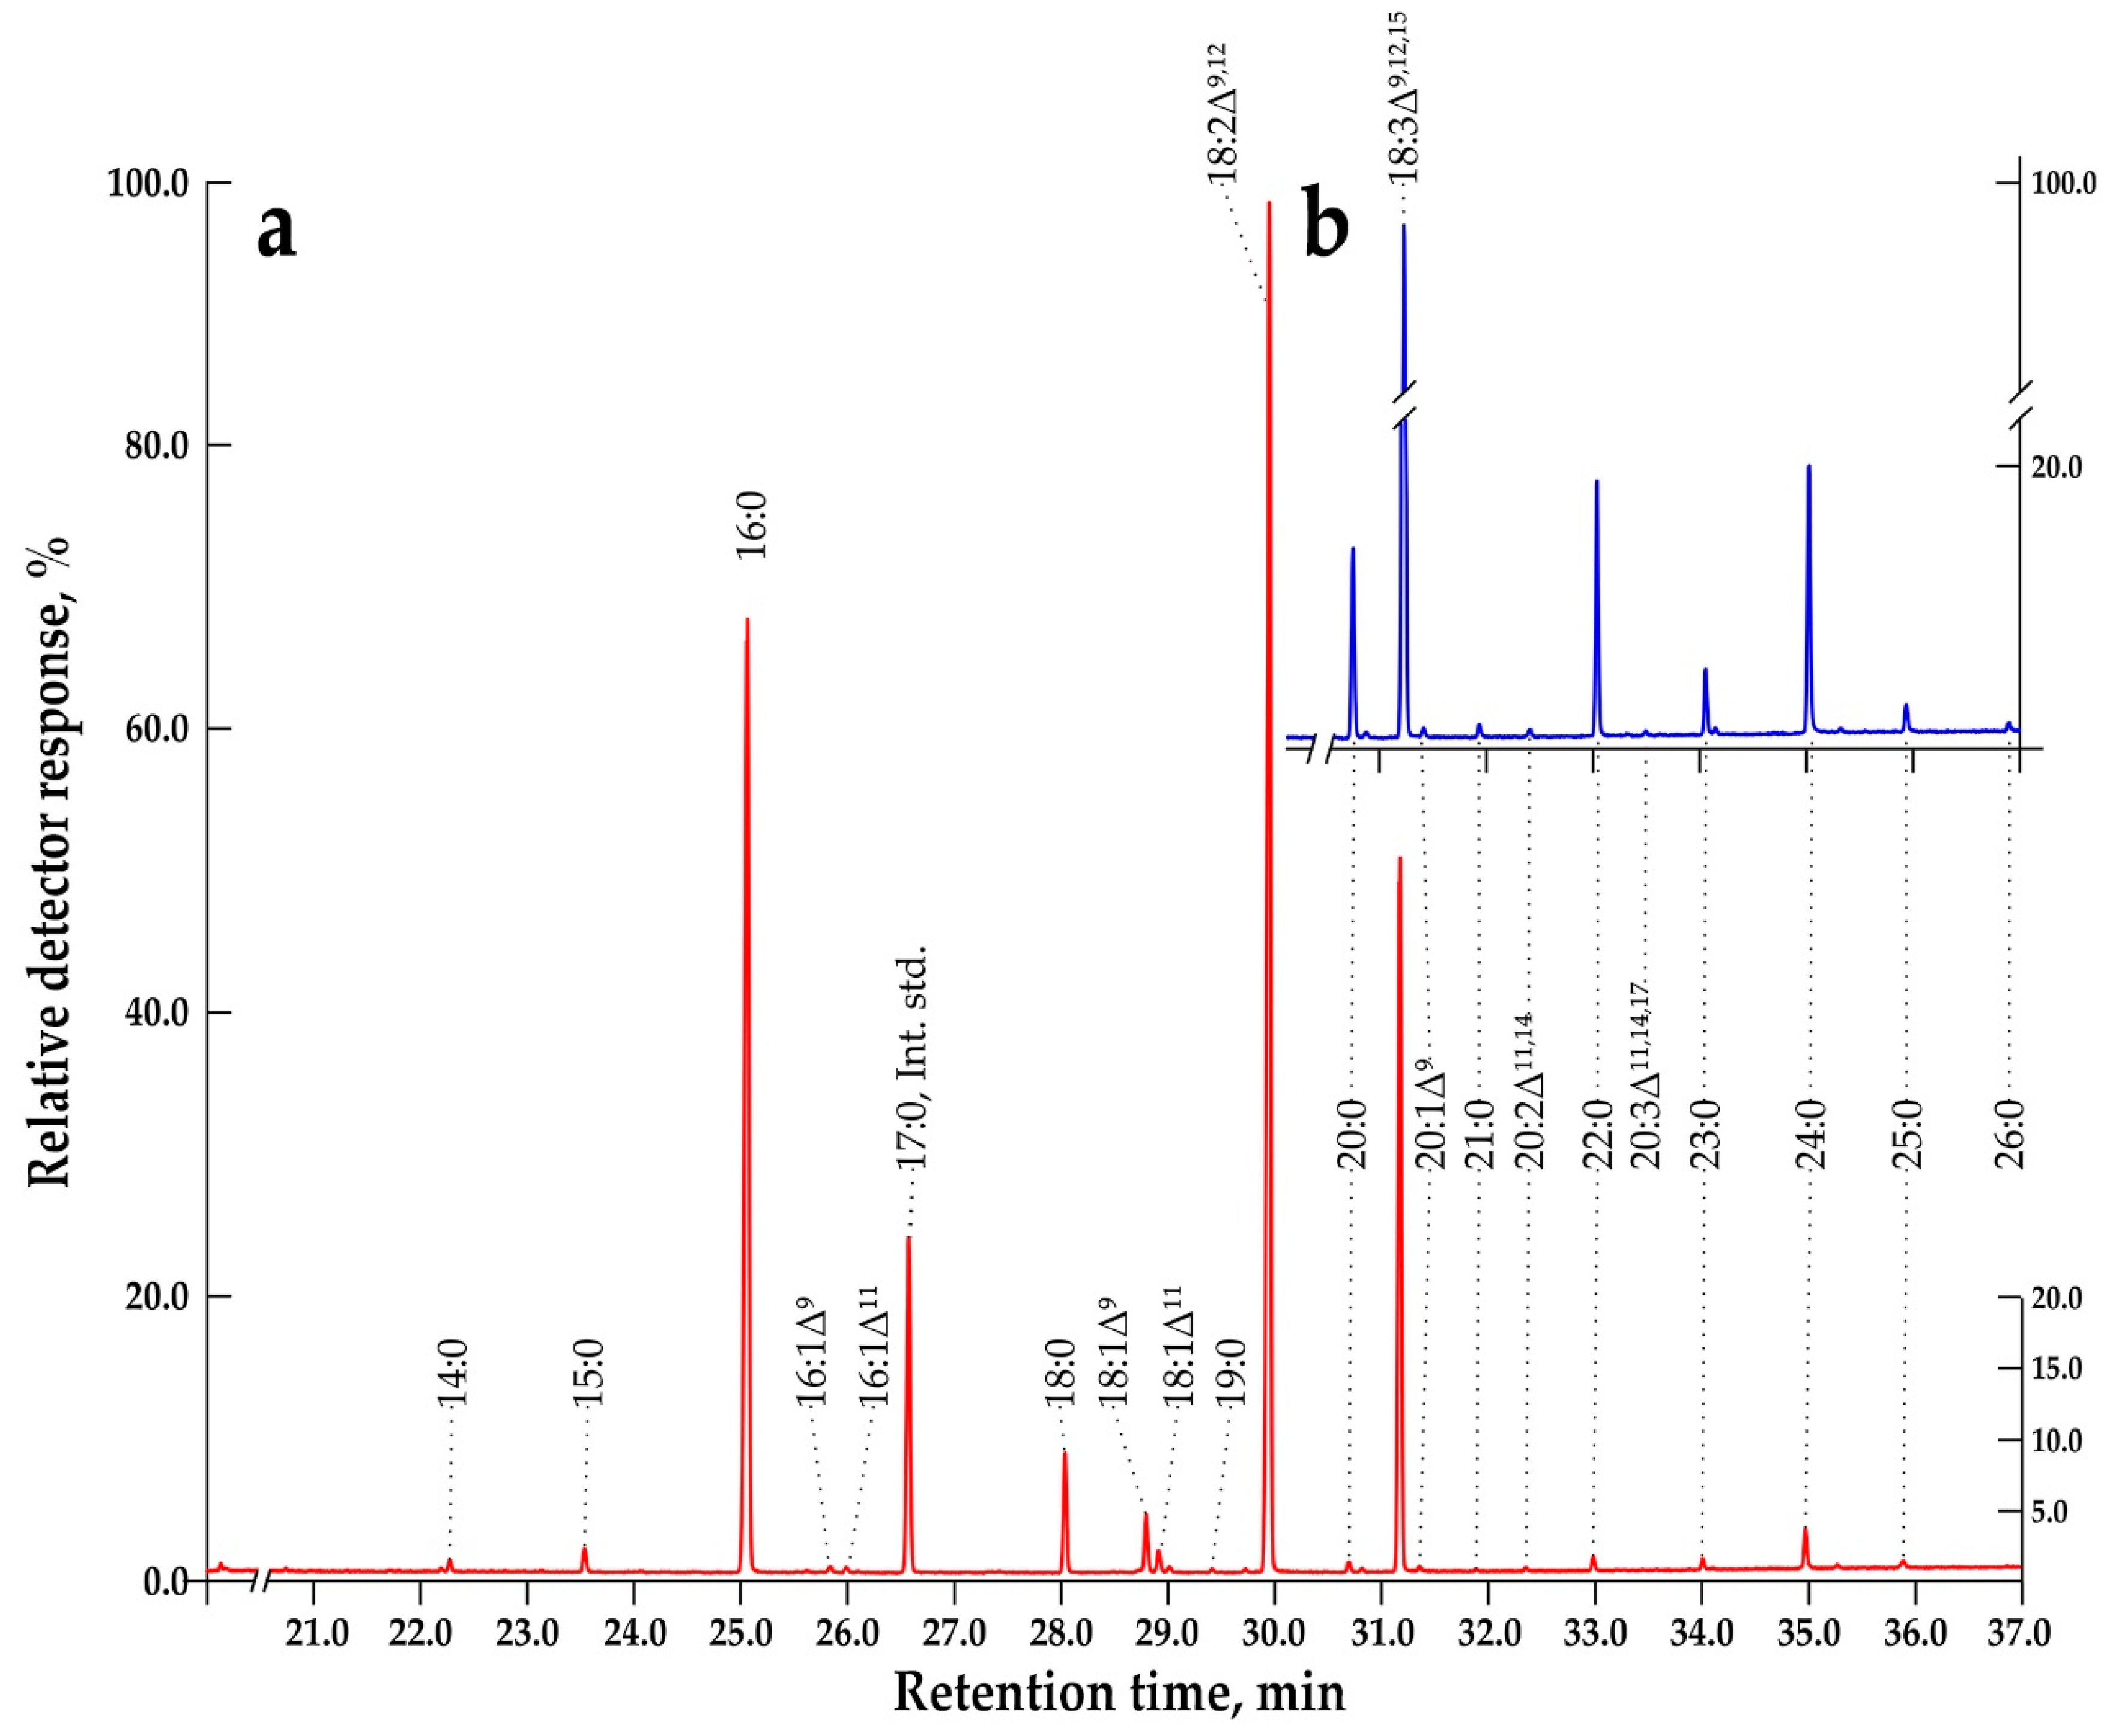
Figure 12.
Production cross-ratio of VLCFAs and anthocyanins in the control and MeJa-treated Em-D and Em-L suspension cell cultures. (a) The ratio of total VLCFAs to total anthocyanins. (b) The ratio of total anthocyanins to total VLCFAs. Different lowercase letters indicate significant differences (p ≤ 0.05) between values based on one-way ANOVA with a Holm-Sidak all pairwise multiple comparison method.
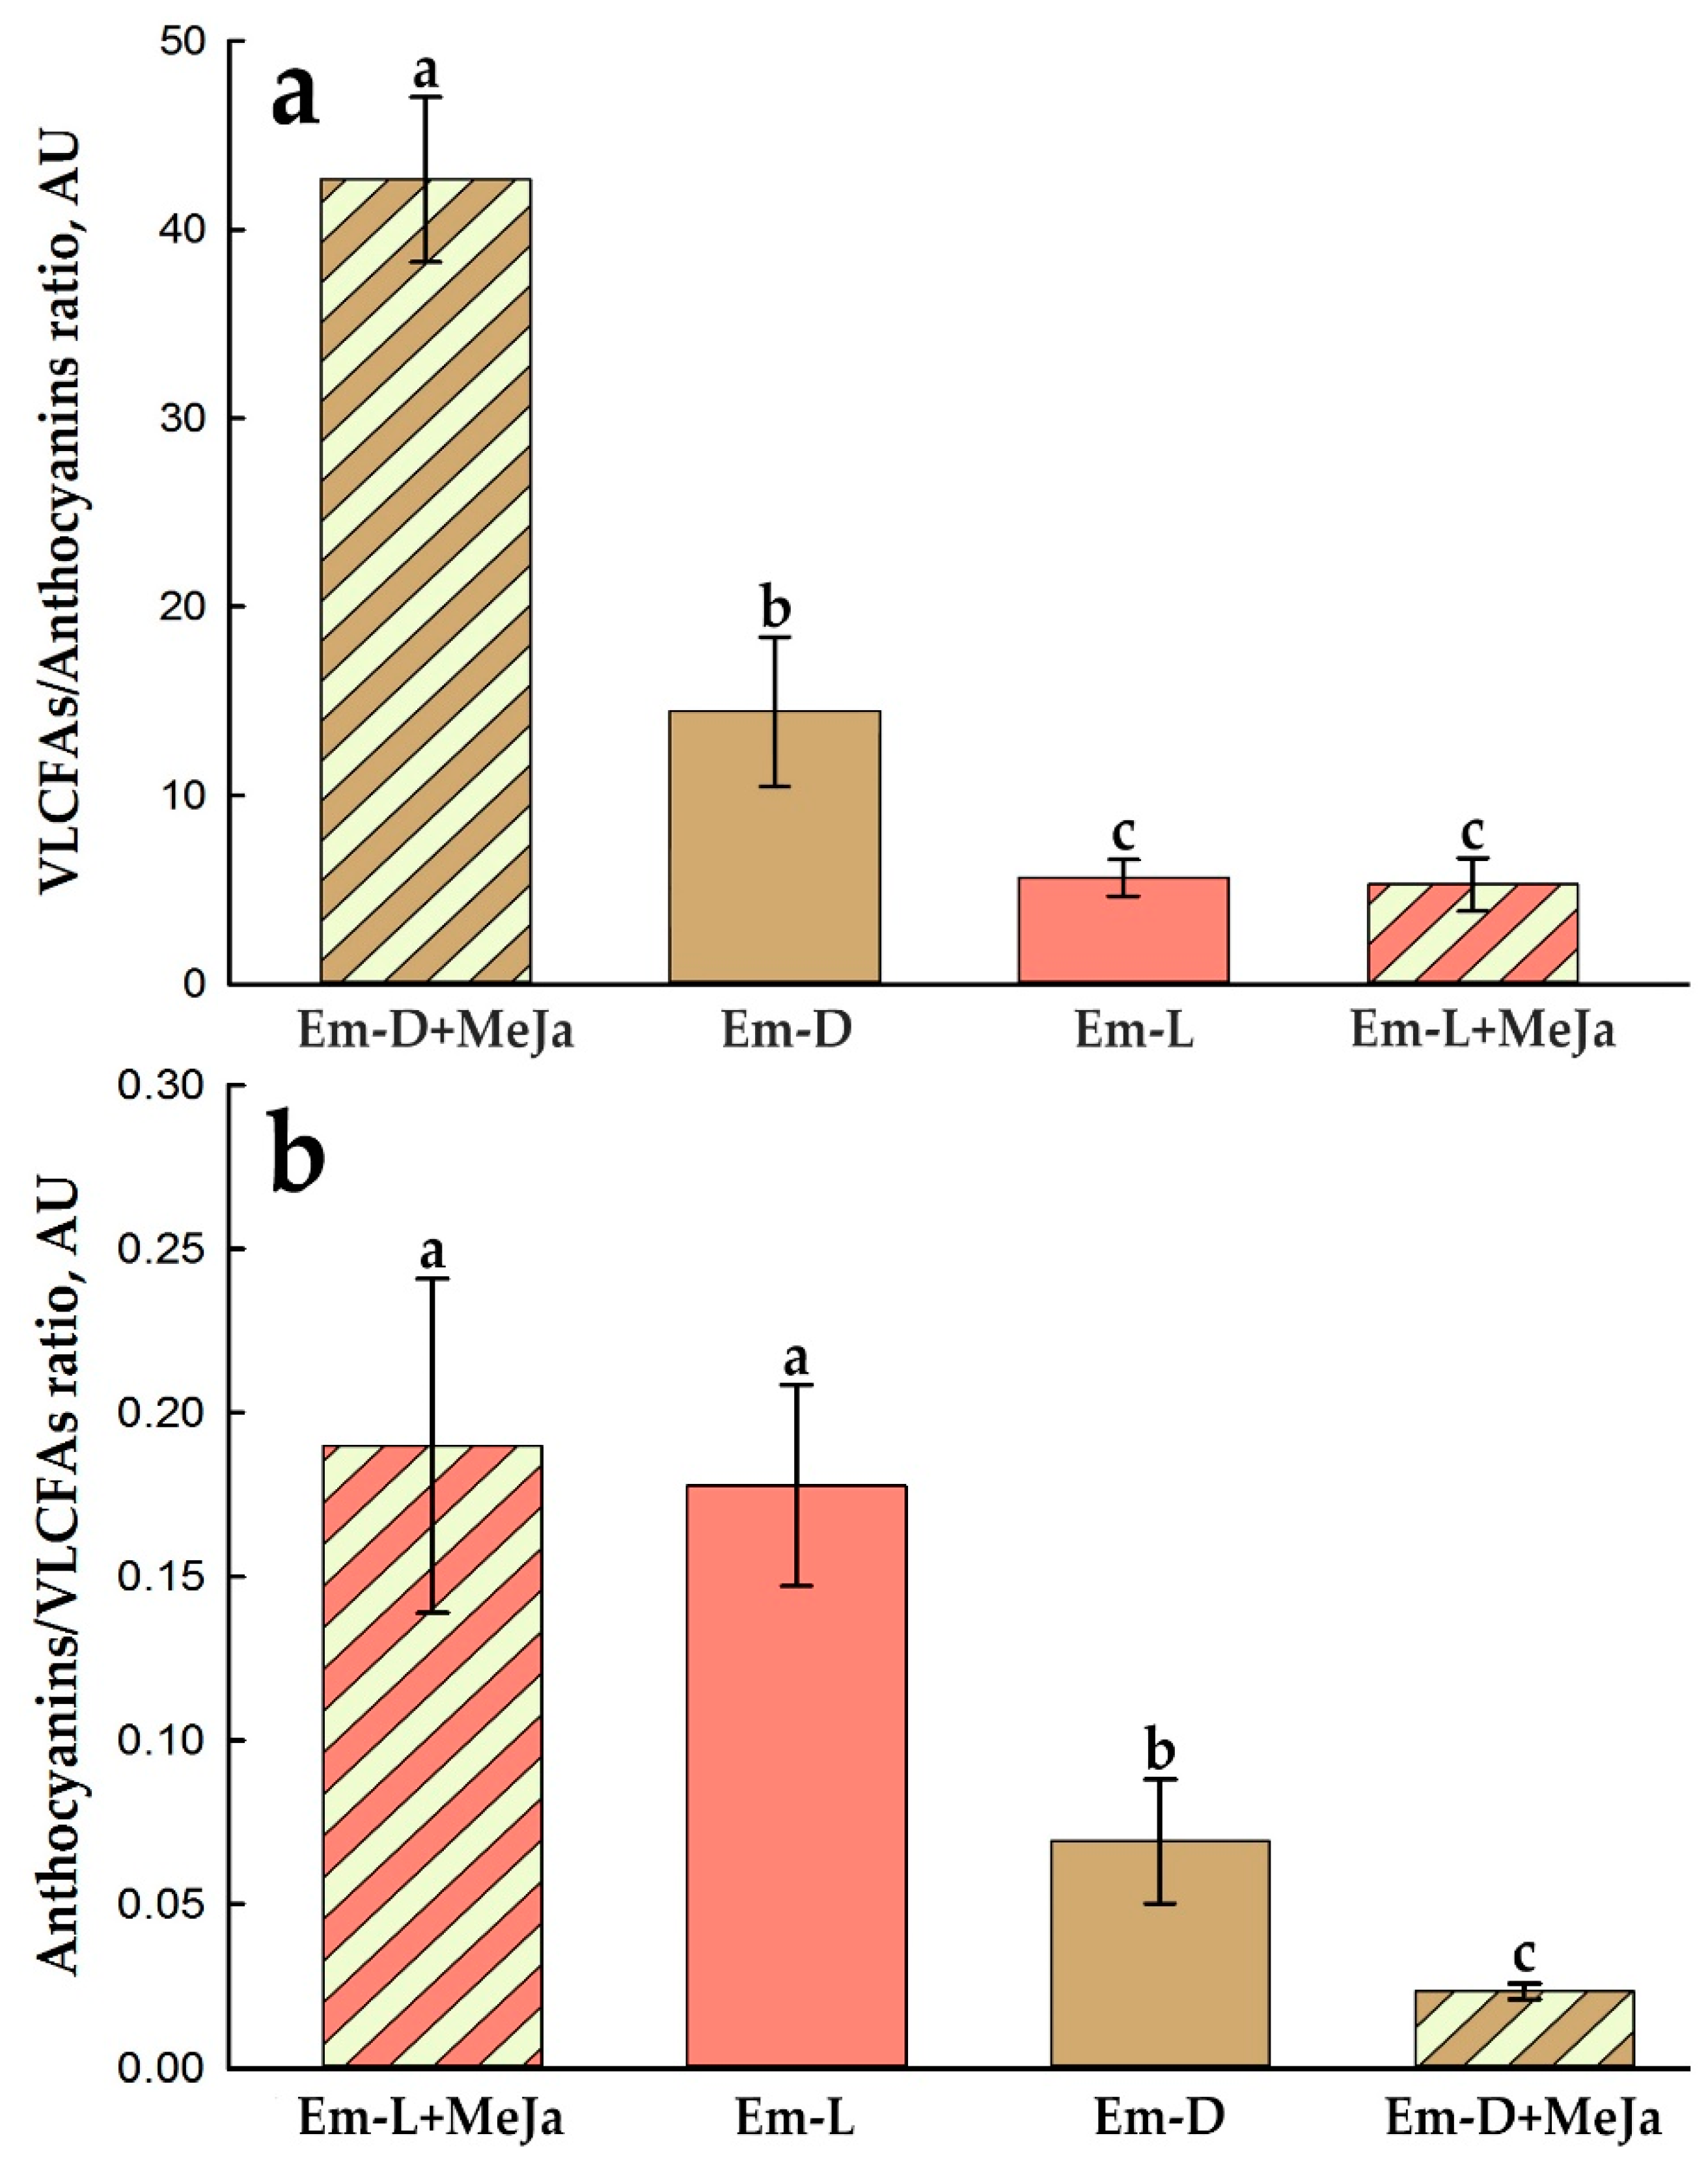
Figure 13.
Simplified short scheme of interconnections between pathways of flavonoid and VLCFA biosynthesis. Synthesis of saturated or monounsaturated long-chain (LC) FAs (C16 and C18) in the plastid is provided by heteromeric acetyl-CoA carboxylase (ACC heteromeric form), fatty acid synthase (FAS) multienzyme complex, acyl-ACP desaturases (AAD), acyl-ACP thioesterases (TES), and long-chain acyl-CoA synthetases (LACS). LC-acyl-CoAs fuel the synthesis of VLCFAs. Malonyl-CoA, other indispensable participant in VLCFA synthesis, produces by cytosolic acetyl-CoA carboxylase (ACC homomeric form). VLCFAs are synthesized as VLC-acyl-CoAs by the endoplasmic reticulum-localized FA elongase multiprotein complexes consisting of β-ketoacyl-CoA synthase (KCS), β-ketoacyl-CoA reductase (KCR), β-hydroxyacyl-CoA dehydratase (HCD), and enoyl-CoA reductase (ECR). The anthocyanin synthesis begins from phenylpropanoid pathway through the transformation of phenylalanine by phenylalanine ammonia-lyase (PAL), cinnamic acid 4-hydroxylase (C4H), and 4-coumarate CoA ligase (4CL) into 4-coumaroyl-CoA. Then works chalcone synthase (CHS), which produces naringenin chalcone using one molecule of 4-coumaroyl-CoA and three molecules of malonyl CoA. Further, the activity of chalcone isomerase (CHI), flavanone 3-hydroxylase (F3H), flavonoid 3’-hydroxylase (F3’H) and flavonoid 3’,5’-hydroxylase (F3’5’H), dihydroflavonol 4-reductase (DFR), anthocyanidin synthase (ANS) catalyzes the synthesis of colored anthocyanidins, which can be further modified by UDP-dependent glycosyltransferases (UGT) and O-methyltransferases (OMT) to produce anthocyanins, transported into the central vacuole with the help of, e.g., ATP-binding cassette transporters (ABC) subfamily C (ABCC), multidrug and toxin extrusion transporter (MATE). See text for details. The pictograms mean: MeJa, Light - stimulation of gene expression, enzyme activity and product synthesis; Light↓ – light-dependent but photosynthesis-independent inhibition; Light↑, negative regulation of gene expression in the dark; Meja? – positive regulation is questionable.
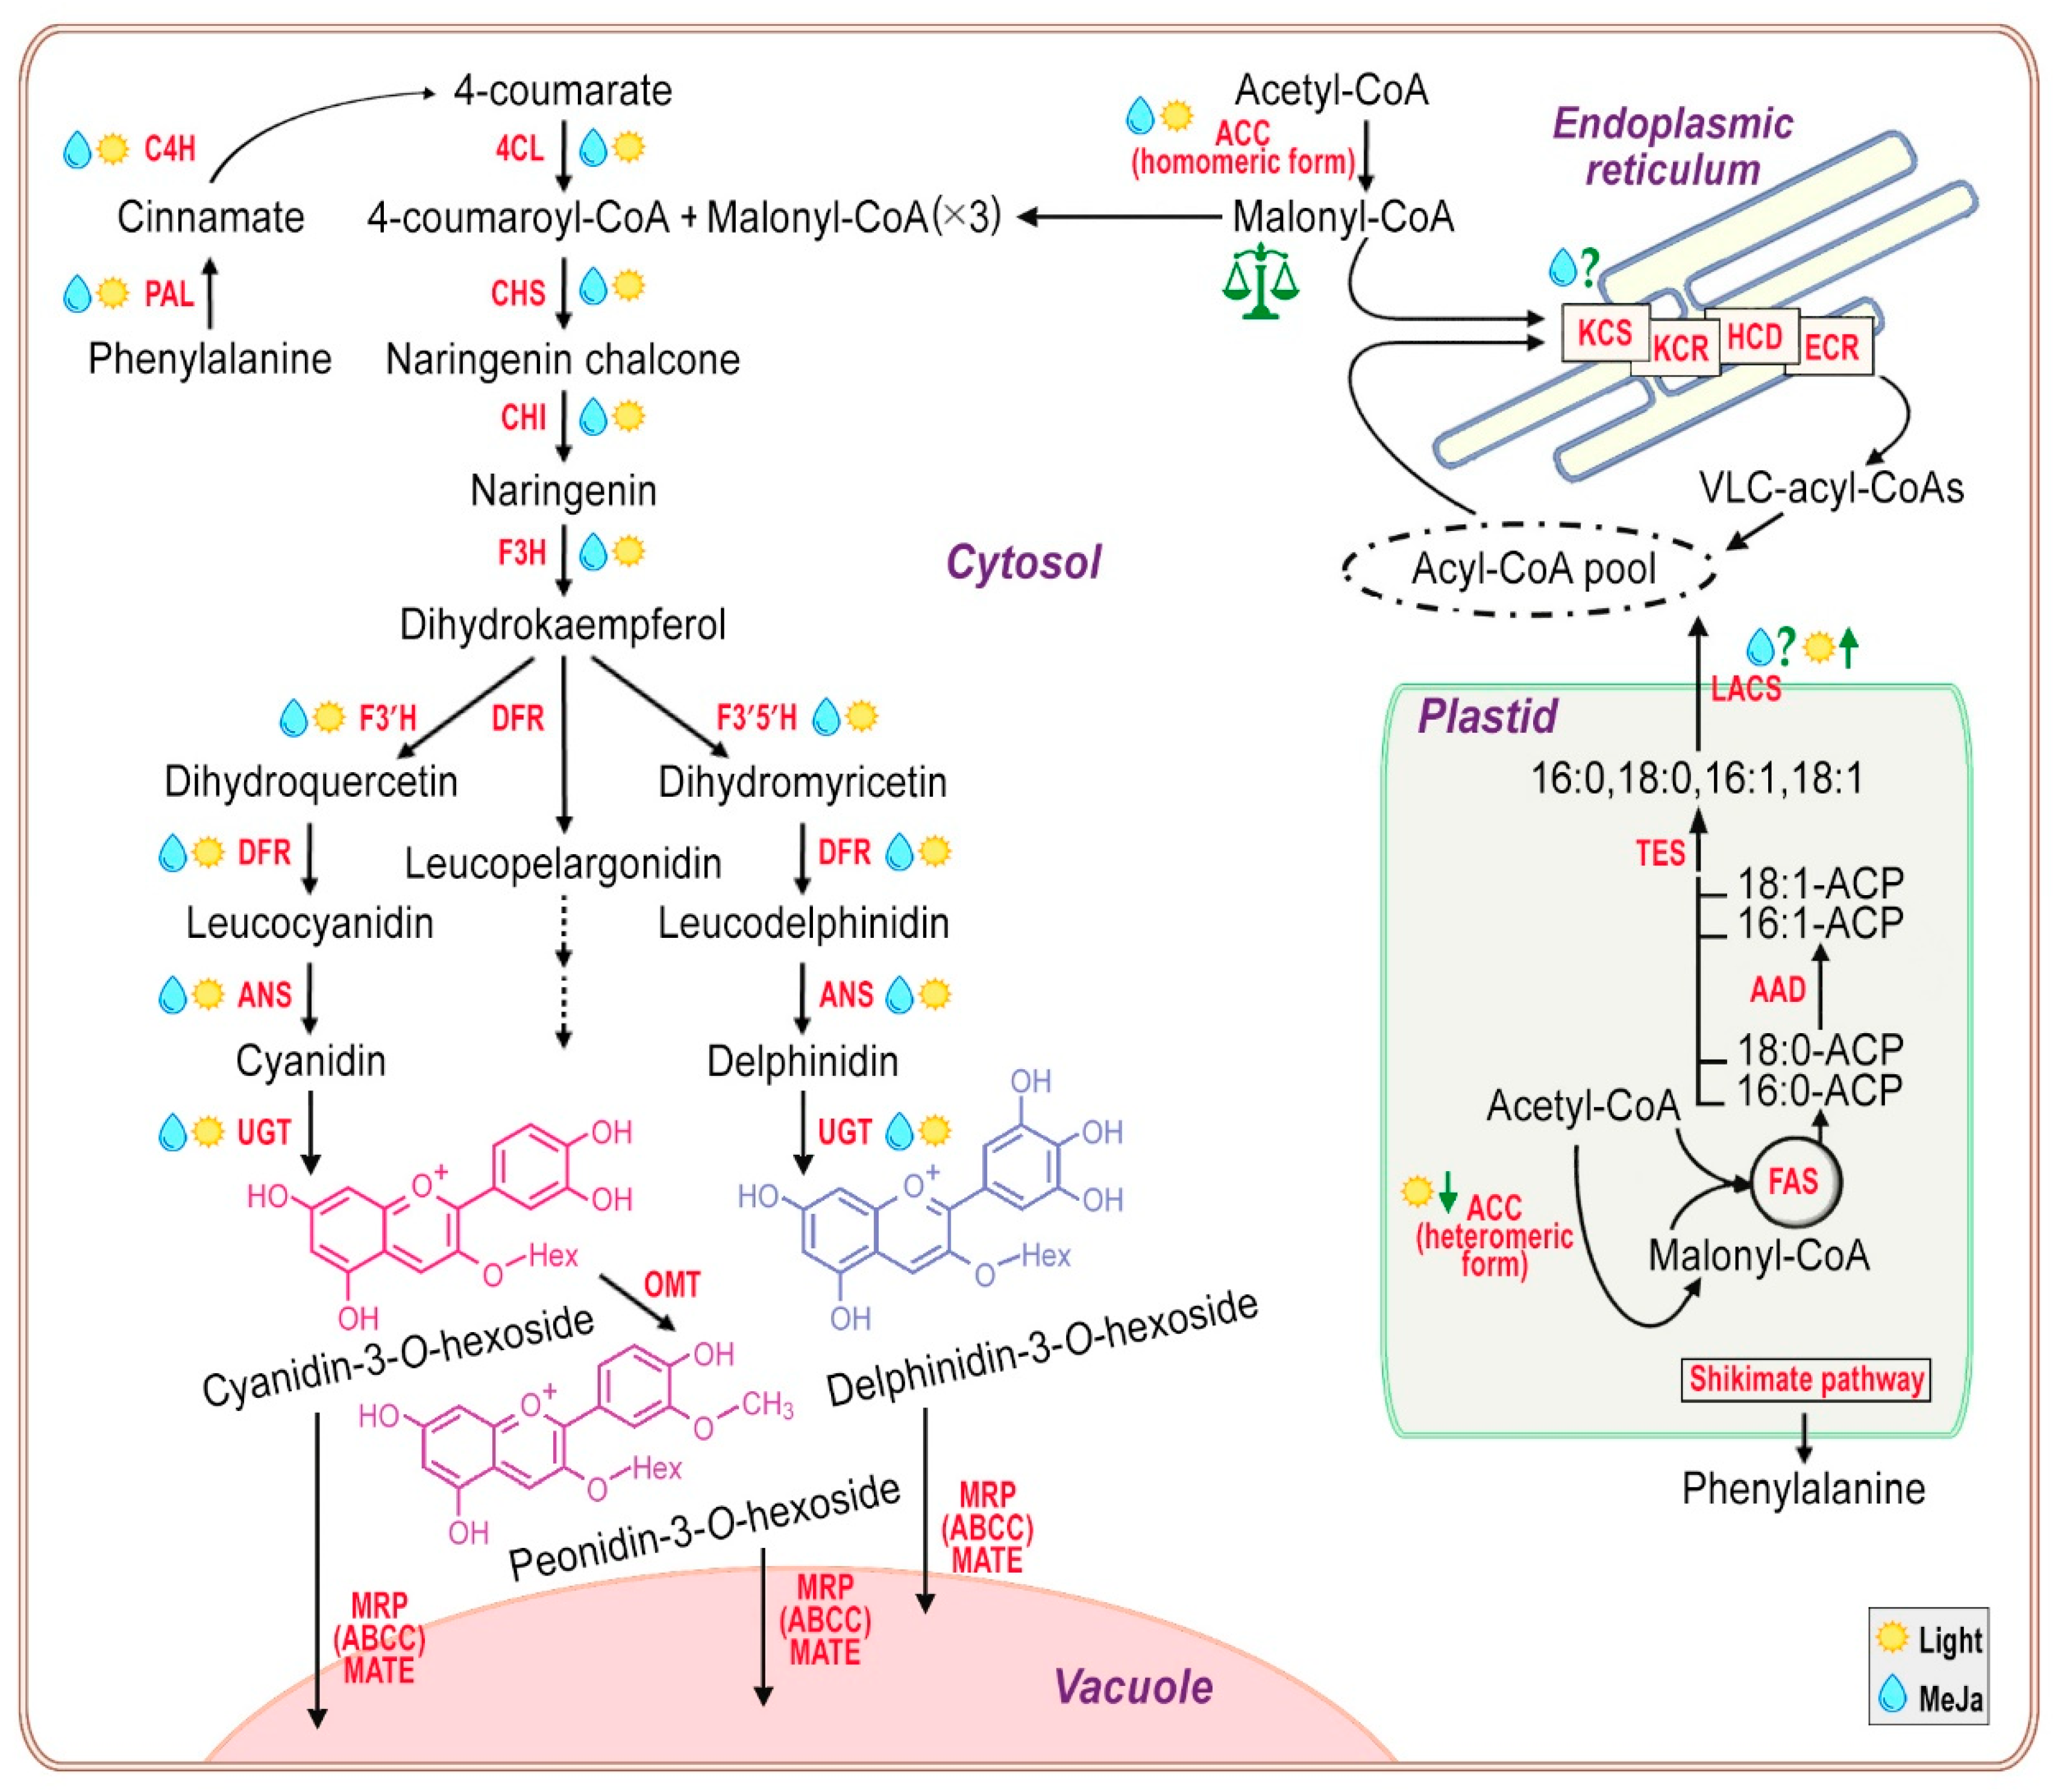

Table 1.
Growth parameters of Euonymus maximowiczianus suspension cell cultures. Different lowercase letters indicate significant differences (p ≤ 0.05) between the same parameters based on one-way ANOVA with a Holm-Sidak all pairwise multiple comparison method.
Table 1.
Growth parameters of Euonymus maximowiczianus suspension cell cultures. Different lowercase letters indicate significant differences (p ≤ 0.05) between the same parameters based on one-way ANOVA with a Holm-Sidak all pairwise multiple comparison method.
| Parameter | 2013 | 2023 | |
|---|---|---|---|
| E. max.* | Em-D* | Em-L** | |
| Maximum growth index, IFW | 5.18 ± 0.64 a | 6.54 ± 0.43 b | 7.31 ± 0.8 b |
| Maximum growth index, IDW | 4.75 ± 0.51 a | 7.96 ± 0.71 b | 9.89 ± 1.14 c |
| Specific growth rate, μFW (day–1) | 0.119 ± 0.01 a | 0.197 ± 0.03 b | 0.174 ± 0.03 b |
| Specific growth rate, μDW (day–1) | 0.099 ± 0.01 a | 0.214 ± 0.02 b | 0.175 ± 0.01 c |
| Doubling time, τFW (day) | 5.82 | 3.52 | 3.98 |
| Doubling time, τDW (day) | 7.00 | 3.24 | 3.96 |
| Maximum DW accumulation, g/L | 17.37 ± 0.36 a | 19.50 ± 0.14 b | 18.90 ± 0.5 b |
| Water content on the 7th, 11th, 14th, and 21st day, % | 85, 86, 86, 87 | 90, 89, 95, 96 | 90, 90, 94, 95 |
| Average viability in subculture, % | 84 ± 7 a | 87 ± 6 a | 83 ± 8 a |
* Cell line is grown in the darkness. **Cell line is grown under light.
Disclaimer/Publisher’s Note: The statements, opinions and data contained in all publications are solely those of the individual author(s) and contributor(s) and not of MDPI and/or the editor(s). MDPI and/or the editor(s) disclaim responsibility for any injury to people or property resulting from any ideas, methods, instructions or products referred to in the content. |
© 2024 by the authors. Licensee MDPI, Basel, Switzerland. This article is an open access article distributed under the terms and conditions of the Creative Commons Attribution (CC BY) license (https://creativecommons.org/licenses/by/4.0/).
Copyright: This open access article is published under a Creative Commons CC BY 4.0 license, which permit the free download, distribution, and reuse, provided that the author and preprint are cited in any reuse.


