
Submitted:
26 August 2023
Posted:
30 August 2023
You are already at the latest version
Abstract
This study aimed to assess the prognostic significance of total leukocyte count (TLC) and hemoglobin (Hb) levels upon admission for patients with acute pulmonary embolism (PE), considering the European Society of Cardiology (ESC) model for mortality risk. 1622 patients from a regional PE registry were included. Decision tree statistics were employed to evaluate TLC and Hb's prognostic value, both independently and in conjunction with the ESC model. Results indicated all-cause and PE-related in-hospital mortality rates of 10.7% and 6.5% respectively. Subgrouping patients based on TLC cutoff values (≤11.2, 11.2-16.84, >16.84 x10^9/L) revealed increasing all-cause mortality risks (7.0%, 11.8%, 30.2%). Incorporating Hb levels (≤126 g/L or above) further stratified the lowest risk group into two strata with all-cause mortality rates of 10.1% and 4.7%. Similar trends were observed for PE-related mortality. Notably, TLC improved risk assessment for intermediate-high risk patients within the ESC model, while Hb levels enhanced mortality risk stratification for lower risk PE patients in the ESC model for all-cause mortality. In conclusion, TLC and Hb levels upon admission can refine the ESC model's mortality risk classification for patients with acute PE, providing valuable insights for improved patient management.
Keywords:
pulmonary embolism
; mortality
; total leukocyte counts
; hemoglobin
1. Introduction
The management of acute pulmonary embolism (PE) depends on the mortality risk estimation as soon as the diagnosis of acute PE is established and during treatment (1). The best tool for risk stratification is the European Society of Cardiology mortality risk assessment where patients are stratified into four risk strata with different strategies for diagnosis and therapy [1,2]. High-risk patients are hypotensive because of acute PE and need prompt reperfusion therapy to increase their chances of surviving. Patients with right ventricle (RV) dysfunction and elevated blood cardiac troponin (cTn) levels are the second step on the risk scale, and they need close hemodynamic monitoring for several days and reperfusion therapy in case of deterioration. Patients with intermediate-low risk have simplified Pulmonary Embolism Score Index (sPESI) [3] 1 or higher may have either RV dysfunction or cTn increased in blood level. Low-risk patients have sPESI 0, and they are normotensive without RV dysfunction and increased cTn. All patients should be treated with anticoagulation and low-risk patients are candidates for early discharge [1]. However, fine-tuning risk assessment is needed. Some prediction signs before the hemodynamic crush should be easy to obtain and applicable to wide clinical settings.
Total leukocyte blood cell count (TLC) represents the individual, non-specific, inflammatory response to acute illness. It is unknown whether white blood cell increase is only a bystander event associated with a general neuro-inflammatory response, or it directly contributes to some pathophysiology processes which can impact the outcome [4,5,6]. TLC is associated with higher short-term mortality in acute PE, myocardial infarction, stroke, and sepsis [7,8,9]. The possible use of TLC together with the ESC mortality risk stratification, aiming to create a more precise clinical decision tool, was not studied before.
Anemia also has a prognostic value for patients with acute PE [10]. It is commonly related to some important comorbidities, represents the hypo-coagulable state per se, or is a marker of ongoing occult bleeding which can seriously complicate the treatment of acute PE patients [11].
This study aims to evaluate the prognostic value for short-term all-cause and PE-related death of TLC and hemoglobin concentration measured at admission to the hospital of patients with acute PE respecting the ESC mortality risk stratification.
2. Materials and Methods
Data for this investigation was obtained from the Regional PE registry (REPER), a multicenter, international registry of hospitalized patients diagnosed with acute PE using multidetector computed tomography pulmonary angiography (MDCT-PA). The registry was founded in 2015 and included data from five university clinics (Military Medical Academy Belgrade, Institute for Pulmonary Diseases Vojvodina, Clinical Centers Zemun, Nis, and Kragujevac), one general hospital (Pancevo) in Serbia, and three university cardiology clinics from Banja Luka (Bosnia and Herzegovina), Podgorica (Montenegro) and Skopje (North Macedonia). A total of 1622 patients had all relevant data for the analysis and was included in the study.
All-cause hospital death and PE-related death (the cause of death was most probable PE) are co-primary outcomes of the study.
The criteria for risk stratification were defined by the 2019 European Society of Cardiology acute PE guidelines [1], where high-risk PE patients have a systolic arterial blood pressure of less than 90 mmHg despite the fluid challenge. Intermediate-high-risk PE patients have RV dysfunction, determined by MDCT-PA RV/LV ratio of ≥ 1 or with echocardiography criteria described in the pulmonary embolism thrombolysis trial (PEITHO study), and also have increased cTn level in blood. Intermediate low-risk patients had sPESI ≥ 1, with or without RV dysfunction or increased cTn blood levels [12]. Low-risk patients are normotensive, have sPESI=0, and neither RV dysfunction nor cTn blood level increased.
Complete blood count, including TLC and Hb level, and cTn, as an urgent analysis, were measured from the venous blood of all patients at admission to the hospital using standard methods. Brain natriuretic peptide or NT-proBNP and C-reactive protein were measured during the first 24 hours from admission, using various standard methods. Upper normal range limits of BNP, NT-proBNP, and cTn level, were obtained from the laboratories of all hospitals enrolled in the study.
Statistics
Description analysis was presented through three subgroups of patients, survivors, all-cause hospital death, and PE-related hospital death. Basic characteristics of the patients were presented as mean values with standard deviations (age) and as frequencies. Total blood leukocyte counts and Hb are presented as median values with an interquartile range. The Chi-square test is used for testing the significant difference in the distribution of sex and comorbidities between survivors and patients who died during hospitalization. Total leukocyte counts, Hb, and other biomarkers are presented as medians and interquartile ranges, and the difference among these parameters in survivors versus all-cause death and PE-related death subgroups are calculated with the Mann-Whitney test. For the determination of cut-off values for TLC, Hb, and other biomarkers, decision tree statistics were used with the Chi-square automatic interaction detection (CHAID) method for the classification of patients’ risk regarding all-cause and PE-related hospital death.
Univariate and multivariate regression binary analysis was performed using all variables which have significantly different distribution between survivals and deceased patients. For the regression analysis TLC and Hb levels were used as categorical variables with cut-off values calculated from the decision tree statistics. Receiver operating characteristics curve analysis for TLC and Hb levels for the prediction of all-cause and PE related death with areas under the curves, 99% confidence intervals, p values and optimal cut-off values and their sensitivity, specificity, negative predictive values and positive predictive values were done and presented in the supplementary material. P less than 0.05 was considered significant for the differences in various parameters between subgroups of patients.
Statistical analysis was performed using statistical software IBM SPSS statistics for Windows, version 20.0 (Armonk, NY, IBM Corp.), and ROC curves and statistics were performed using MedCalc version 19.2.6 (MedCalc Software Ltd).
3. Results
The mean age of the study patients was 64 (SD 16) years and 53.3% were women. The basic characteristics of the patients are presented in Table 1 regarding survival status and cause of hospital death. The rates of all-cause hospital death and PE-related hospital death were 10.7% and 6.5%, respectively. Different comorbidities were more often presented in patients who died during hospitalization. Therefore, chronic obstructive pulmonary disease (COPD) (p=0.006), chronic heart failure (CHF) (p<0.001), history of coronary disease (p=0.007), diabetes mellitus (DM) (p=0.001), active malignant disease in the last 6 months (0.004), stroke (p<0.001) and renal failure with glomerular filtration rate less than 60 ml/min (p<0.001) were significantly more often present in patients with all-cause hospital death as compared with PE patients who survived. For PE-related hospital death, a significant difference was present for CHF (p=0.04), coronary disease (p=0.01), DM (p=0.011), stroke (p<0.001) and chronic renal failure (p<0.001). There was no difference in the distribution of sex, major surgery, and arterial hypertension between survivors and those with all-cause or PE-related death.
Both TLC and Hb levels were significantly different between survivors and all-cause or PE-related death subgroups (Table 1). TLC was about 2x10⁹/L higher in all-cause and PE-related death as compared with the survivors’ subgroup (p<0.001 for both comparisons). Contrary, Hb levels were slightly, but significantly lower in all-cause death (p=0.001) and PE-related death (p=0.002) subgroups as compared with the survivors.
Using decision tree statistics for the determination of optimal cut-off values of investigated parameters for the prediction of all-cause and PE-related hospital death, our study revealed that both TLC and Hb level at hospital admission could be used either alone or together with the ESC mortality risk stratification (Figure 1, Figure 2, Figure 3 and Figure 4).
According to TLC, patients can be stratified into 3 subgroups where those who have total leukocyte counts ≤11.2x10⁹/L had the lowest all-cause mortality rate of 7.0%, those with TLC between 11.2-16.84x10⁹ had 11.8% mortality rate, and the subgroup with TLC higher than 16.84x10⁹/L had the highest mortality rate of 30.2% (p<0.001). The first subgroup was further split into two groups using the Hb level at admission. Consequently, the group with the admission Hb levels of ≤126 g/L had mortality rate for all-cause mortality 10.1%. Mortality rate in the group with Hb level of >126 g/L was 4.7% (p=0.009). Regarding the PE-related mortality, discriminative levels of TLC and Hb levels for the “risk” distribution, were similar to all-cause mortality (Fig 2).
Using decision tree statistics on the ESC mortality risk model, significant discriminative power has been achieved between four risk groups such as low risk, intermediate-low risk, intermediate-high risk, and high-risk patients reaching mortality rate of 2.6%, 5.8%, 14.1% and 33.2%, respectively (p<0.001) (Fig 3). Furthermore, patients at the lowest risk were further allocated into two risk subgroups using Hb cutoff level of 131 g/L, where mortality rate was 0.7% for patients with Hb >131g/L, and 4.7% for patients with Hb ≤ 131 g/L (p=0.042). Using cut-off level of 16.84x10⁹/L for TLC we split intermediate-high risk subgroup into two risk levels, where patients with total leukocyte TLC of >16.84x10⁹/L had all-cause mortality of 33.3%, and those with ≤16.84x10⁹/L had a mortality of 11.2% (p<0.001) (Fig 3). Regarding the PE-related mortality in our cohort of patients, the ESC mortality risk model had strong discriminatory power, putting low risk and intermediate-low risk patients in the same discriminatory node with PE-related mortality rate of 1.0%. PE-related mortality rates for intermediate-high and high-risk patients were 8.9% and 28.6%, respectively. In addition, having the TLC cut off value of 16.5x10⁹/L, intermediate-high risk group PE patients were divided into two subgroups were patients with TLC > 16.5x10⁹/L had PE-related mortality rate of 22.6%, and those with TLC ≤ 16.5x10⁹/L had PE-mortality of 7.0% (p=0.001) (Fig 4.).
Univariate and multivariate binary regression analysis for the prediction of all-cause and PE related hospital death is presented in Table 2. Tested variables were significantly different between patients who survived and patients who died, either from all-causes or from PE. In the multivariate analysis only variables which have significant independent association with all-cause and PE related death are presents. In the multivariate regression model TLC > 16.5x10⁹/L had independent predictive values for all-cause death (OR 3.141, 95%CI 2.062-4.784, p<0.001) and PE related death (OR 2.738, 95%CI 1.606-4.667, p<0.001) (Table 2). Furthermore, Hb level > 125 g/L also had independent predictive value for all-cause death (OR 1.775, 95%CI 1.246-2.530, p<0.001) and PE related death (OR 2.050, 95%CI 1.301-3.320, p=0.002) (Table 2).
Brain natriuretic peptide (BNP) and NT-pro-BNP presented as x upper range limit improved the risk stratification in the decision tree statistics of ESC model (Supplementary Figure S1). Hence, the PE-related mortality rates of high-risk PE patients were 14.6% and 39.1% for BNP (or NTpro-BNP) levels of ≤8.072xURL and >8.072xURL,respectively (p=0.004).
Receiver operating characteristics curve analysis was presented in the supplementary analysis (figures S2 a and b and S3 a and b). TLC has area under the curve of 0.649 (p<0.001) for the prediction of all-cause death, and 0.679 (p<0.001) for the prediction of PE related death. The Hb levels has area under the curve of 0.580 (p=0.001) for the prediction of all-cause death, and 0.593 (p=0.003) for the prediction of PE related death.
4. Discussion
This study showed that two commonly determined, widely used parameters, such as TLC and Hb level at hospital admission, can be used for the risk stratification of acute PE patients as an addition to the ESC suggested mortality risk model and therefore enhance the treatment decision. Both TLC and Hb admission levels had significant independent association for all-cause and PE related hospital death in the multivariate analysis adjusted to ESC mortality risk, creatinine clearance, stroke, and the presence of diabetes mellitus type 2 only for all-cause death. The results showed that using a cut-off level of 16.5x10⁹/L of TLC can additionally allocate the patients within intermediate-high risk PE into the lower risk subgroup for TLC value equal or lower than the cut-off who had PE-related mortality rate of 7.0% and the highest risk subgroup, with mortality rate of 22.3% (TLC higher than the cut-off), similar to the mortality rate of high-risk patients in our study. Contrary, Hb cut-off level of 131 g/L can be used for the risk stratification of the low-risk PE patients where patients with lower Hb levels had almost 5 times higher all-cause mortality (4.7% vs 0.7%) than patients with Hb level above the cut-off value. From the clinical point of view, these results might have two important consequences. The first is that subgroup of patients with intermediate-high risk PE with TLC higher than 16.5x10⁹/L at admission should be considered as higher risk and treated with reperfusion therapy if there are no contraindications. The second is that patients with low-risk PE and Hb levels at admission under 131 g/L should be hospitalized and carefully evaluated because of the increased risk for all-cause mortality.
Regarding the routine complete blood cells analysis, TLC, neutrophil to lymphocyte ratio, mean platelets volume, and anemia are the most studied markers of poor prognosis in patients with PE and other acute vascular disorders [5,6,10,13,14,15]. Leukocytosis in acute PE may be caused by local inflammation derived from pulmonary infarction in peripheral PE, however, this kind of leukocytosis has no predictive value for mortality, especially for PE-related mortality [4]. However, in patients with intermediate-high and high-risk PE, leukocytosis is part of the systemic inflammatory response and catecholamine surge as compensatory mechanisms for severe acute disease [16]. Hence, leukocytosis is a part of the response to acute PE, but with an unknown role in the pathophysiology of the disease. Our study has revealed that leukocytosis is especially important for the prognosis of intermediate-high risk patients where the therapeutic approach is the most difficult and where we need more simple and reliable markers for early prognosis.
Moreover, lower Hb level in acute PE is a consequence of various comorbidities, with or without bleeding. Several reports suggest that anemia and particularly persistent anemia are important risk factors for poor outcomes in acute PE. In our study, we have shown that anemia may be served as an additional risk for dying in patients with otherwise low-risk PE.
We tested three other biomarkers with decision tree statistics and found that neither CRP nor cTn has additional predictive value to the ESC model. However, BNP and NT-proBNP increase in relation to the laboratory determined upper normal limit range has significant value for the prediction of PE-related mortality in high-risk PE patients. However, cTn is already incorporated in the ESC mortality risk model. Several biomarkers have a strong predictive value for mortality risk in normotensive PE patients, however, their prognostic value in high-risk patients is not defined [17]. The possible value of this finding might be important since 40% of high-risk patients had BNP or NT-proBNP values less than 8 times above the ULR and the mortality rate was very similar to intermediate-high-risk PE patients.
Limitations of the study
A relatively low proportion of patients (about 10%) in intermediate-high PE group, had TLC level above the threshold of 16x109/L. The classification of PE-related death is arbitrary, and, in some patients, a significant uncertainty exists regarding the real cause of death. We also did not use BNP/NT-proBNP levels for the multivariate models since there were a high number of missing values and different assays used for this marker in our study.
5. Conclusions
TLC and Hb level in acute PE on admission to the hospital have a significant value for the prediction of hospital death in addition to the ESC mortality risk model. Those parameters could be used in clinical practice during the decision-making process for the treatment of low-risk and intermediate-high-risk PE patients.
Supplementary Materials
The following supporting information can be downloaded at: Preprints.org, Figure S1: Decision tree using ESC mortality risk model, TLC, and BNP or NTproBNP x URL, Figure S2: ROC curves for TLC for the prediction of all-cause (panel a) and PE related (panel b) hospital death. TLC level of >11.78x10⁹/L has PPV=17,6% and NPV = 93% for all-cause death and PPV=12,1% and NPV = 96% for PE related hospital death, Figure S3: ROC curves for Hb levels for the prediction of all-cause (panel a) and PE related (panel b) hospital death. TLC level of >11.78x10⁹/L has PPV=17,6% and NPV = 93% for all-cause death and PPV=12,1% and NPV = 96% for PE related hospital death.
Author Contributions
Conceptualization, S.O. and B.D.; methodology S.O. and B.D.; formal analysis, S.B.; investigation, S.O., B.D., B.S., S.S., M.J., B.M., K.T., K.A., M.I., M.V., J.E. and A.N.; data curation, S.O. and B.D.; writing—original draft preparation, S.O.; writing—review and editing, S.O., B.D., B.S. and A.N.; All authors have read and agreed to the published version of the manuscript.
Funding
This research received no external funding.
Institutional Review Board Statement
The study was conducted in accordance with the Declaration of Helsinki, and approved by Ethical Committee of the Military Medical Academy Belgrade approved the constitution of the PE registry and the protocol of data management under the REPER. Local Review Boards made permissions for each institution for participation in REPER and use of data.
Informed Consent Statement
Patient consent was waived given the study's retrospective data collection. During hospitalization, patients were informed about registry inclusion without personal data utilization. Verbal consent was obtained for privacy and ethical adherence. This aligns with non-invasive retrospective data collection. The ethics review board endorsed this method, prioritizing patient comfort and data protection.
Data Availability Statement
Data will be available on reasonable request.
Acknowledgments
We extend our heartfelt appreciation to all the participating institutions that contributed to this study's success through their collaboration and support. Our gratitude also extends to the dedicated researchers who were involved in the data collection and analysis processes. This study would not have been possible without the combined efforts and commitment of all those who contributed. Your valuable contributions have significantly enriched the outcomes of this research.
Conflicts of Interest
The authors declare no conflict of interest.
References
- Konstatinides SV, Meyer G, Becattini C, Bueno H, Geersing GJ, Harjola VP, et al. 2019 ESC Guidelines for the diagnosis and management of acute pulmonary embolism developed in collaboration with the European Respiratory Society (ERS). Eur Heart J 2020;41:543-603. [CrossRef]
- Becattini C, Agnelli G, Lankeit M, Masotti L, Pruszczyk P, Casazza F, et al. Acute pulmonary embolism: mortality prediction by the 2014 European Society of Cardiology risk stratification model. Eur Respir J 2016;48:780-6. [CrossRef]
- Jimenez D, Aujesky D, Lisa Moores L, Gomez V, Lobo L, Uresandi F, et al. Simplification of the pulmonary embolism severity index for prognostication in patients with acute symptomatic pulmonary embolism. Arch Intern Med. 2010;170:1383-9. [CrossRef]
- Afzal A, Noor HA, Gill SA, Brawner C, Stein PD. Leukocytosis in Acute Pulmonary Embolism. Chest 1999; 115:1329–32. [CrossRef]
- Huang C-M, Lin Y-C, Lin Y-J, Chang S-L, Lo L-W, Hu Y-F, et al. Risk stratification and clinical outcomes in patients with acute pulmonary embolism. Clinical Biochemistry 2011;44:1110–5. [CrossRef]
- Leukocytes and systemic inflammatory response syndrome as prognostic factors in pulmonary embolism patients Jun Yeon Jo1, Mi Young Lee2, Jin Wook Lee1, Byung Hak Rho3, and Won-Il Choi. BMC Pulmonary Medicine 2013;13:74.
- Xiaowei Zheng X, Zeng N, Wang A, Zhu Z, Zhong C, Xu T, et al. Prognostic value of white blood cell in acute ischemic stroke patients. Curr Neurovasc Res 2018;15(2):151-7.
- Dragu R, Huri S, Zukermann R, Suleiman M, Mutlak D, Agmon Y, et al. Predictive value of white blood cell subtypes for long-term outcome following myocardial infarction. Atherosclerosis 2008;196:405-12. [CrossRef]
- Agnello L, Giglio RV, Bivona G, Scazzone C, Gambino CM, Iacona A, et al. The value of a complete blood count (CBC) for sepsis diagnosis and prognosis. Diagnostics 2021;11:1881. [CrossRef]
- Jimenez D, Escobar C, Martí D, Diaz G, Cesar J, Garcia-Avello A, et al. Association of anemia and mortality in patients with acute pulmonary embolism. Thromb Haemost 2009; 102: 153–8.
- Alamin AA. The Role of Red Blood Cells in Hemostasis. Semin Thromb Hemost 2021;47:26-31. [CrossRef]
- Meyer G, Vicaut E, Danays T, Agnelli G, Becattini C, Beyer-Westendorf J, et al. Fibrinolysis for patients with intermediate-risk pulmonary embolism. New Engl J Med 2014;370:1402-11. [CrossRef]
- Wang Q, MA J, ANG ZJJ, Ming F. Prognostic value of neutrophil-to-lymphocyte ratio and platelet-to-lymphocyte ratio in acute pulmonary embolism: a systematic review and meta-analysis. International Angiology 2018 February;37(1):4-11.
- Kostrubiec M, Łabyk A, Pedowska-Włoszek J, Hrynkiewicz-Szymanska A, Pacho S, Jankowski K, et al, Mean platelet volume predicts early death in acute pulmonary embolism. Heart 2010;96:460-5. [CrossRef]
- Chow W, Wong C, Lau JK, Chow V, Kritharides L, Ng ACC. Impact of persistent anaemia on mortality in patients hospitalized with acute pulmonary embolism: an Australian retrospective observational study. BMJ Open 2019;9:e027112.
- Benshop RJ, Rodriguez-Feurhahn M, Scheldowski M. Catecholamine-induced leukocytosis: early observations, current research, and future directions. Brain Behavior and Immun 1996;10:77-91.
- Nithianandana H, Reillya A, Tritschlera T, Wells P. Applying rigorous eligibility criteria to studies evaluating prognostic utility of serum biomarkers in pulmonary embolism: A systematic review and meta-analysis. Thromb Res 2020;195:195–208.
Figure 1.
Decision tree for all-cause hospital death in acute PE using blood total leukocyte count and Hb concentration at admission. .
Figure 1.
Decision tree for all-cause hospital death in acute PE using blood total leukocyte count and Hb concentration at admission. .
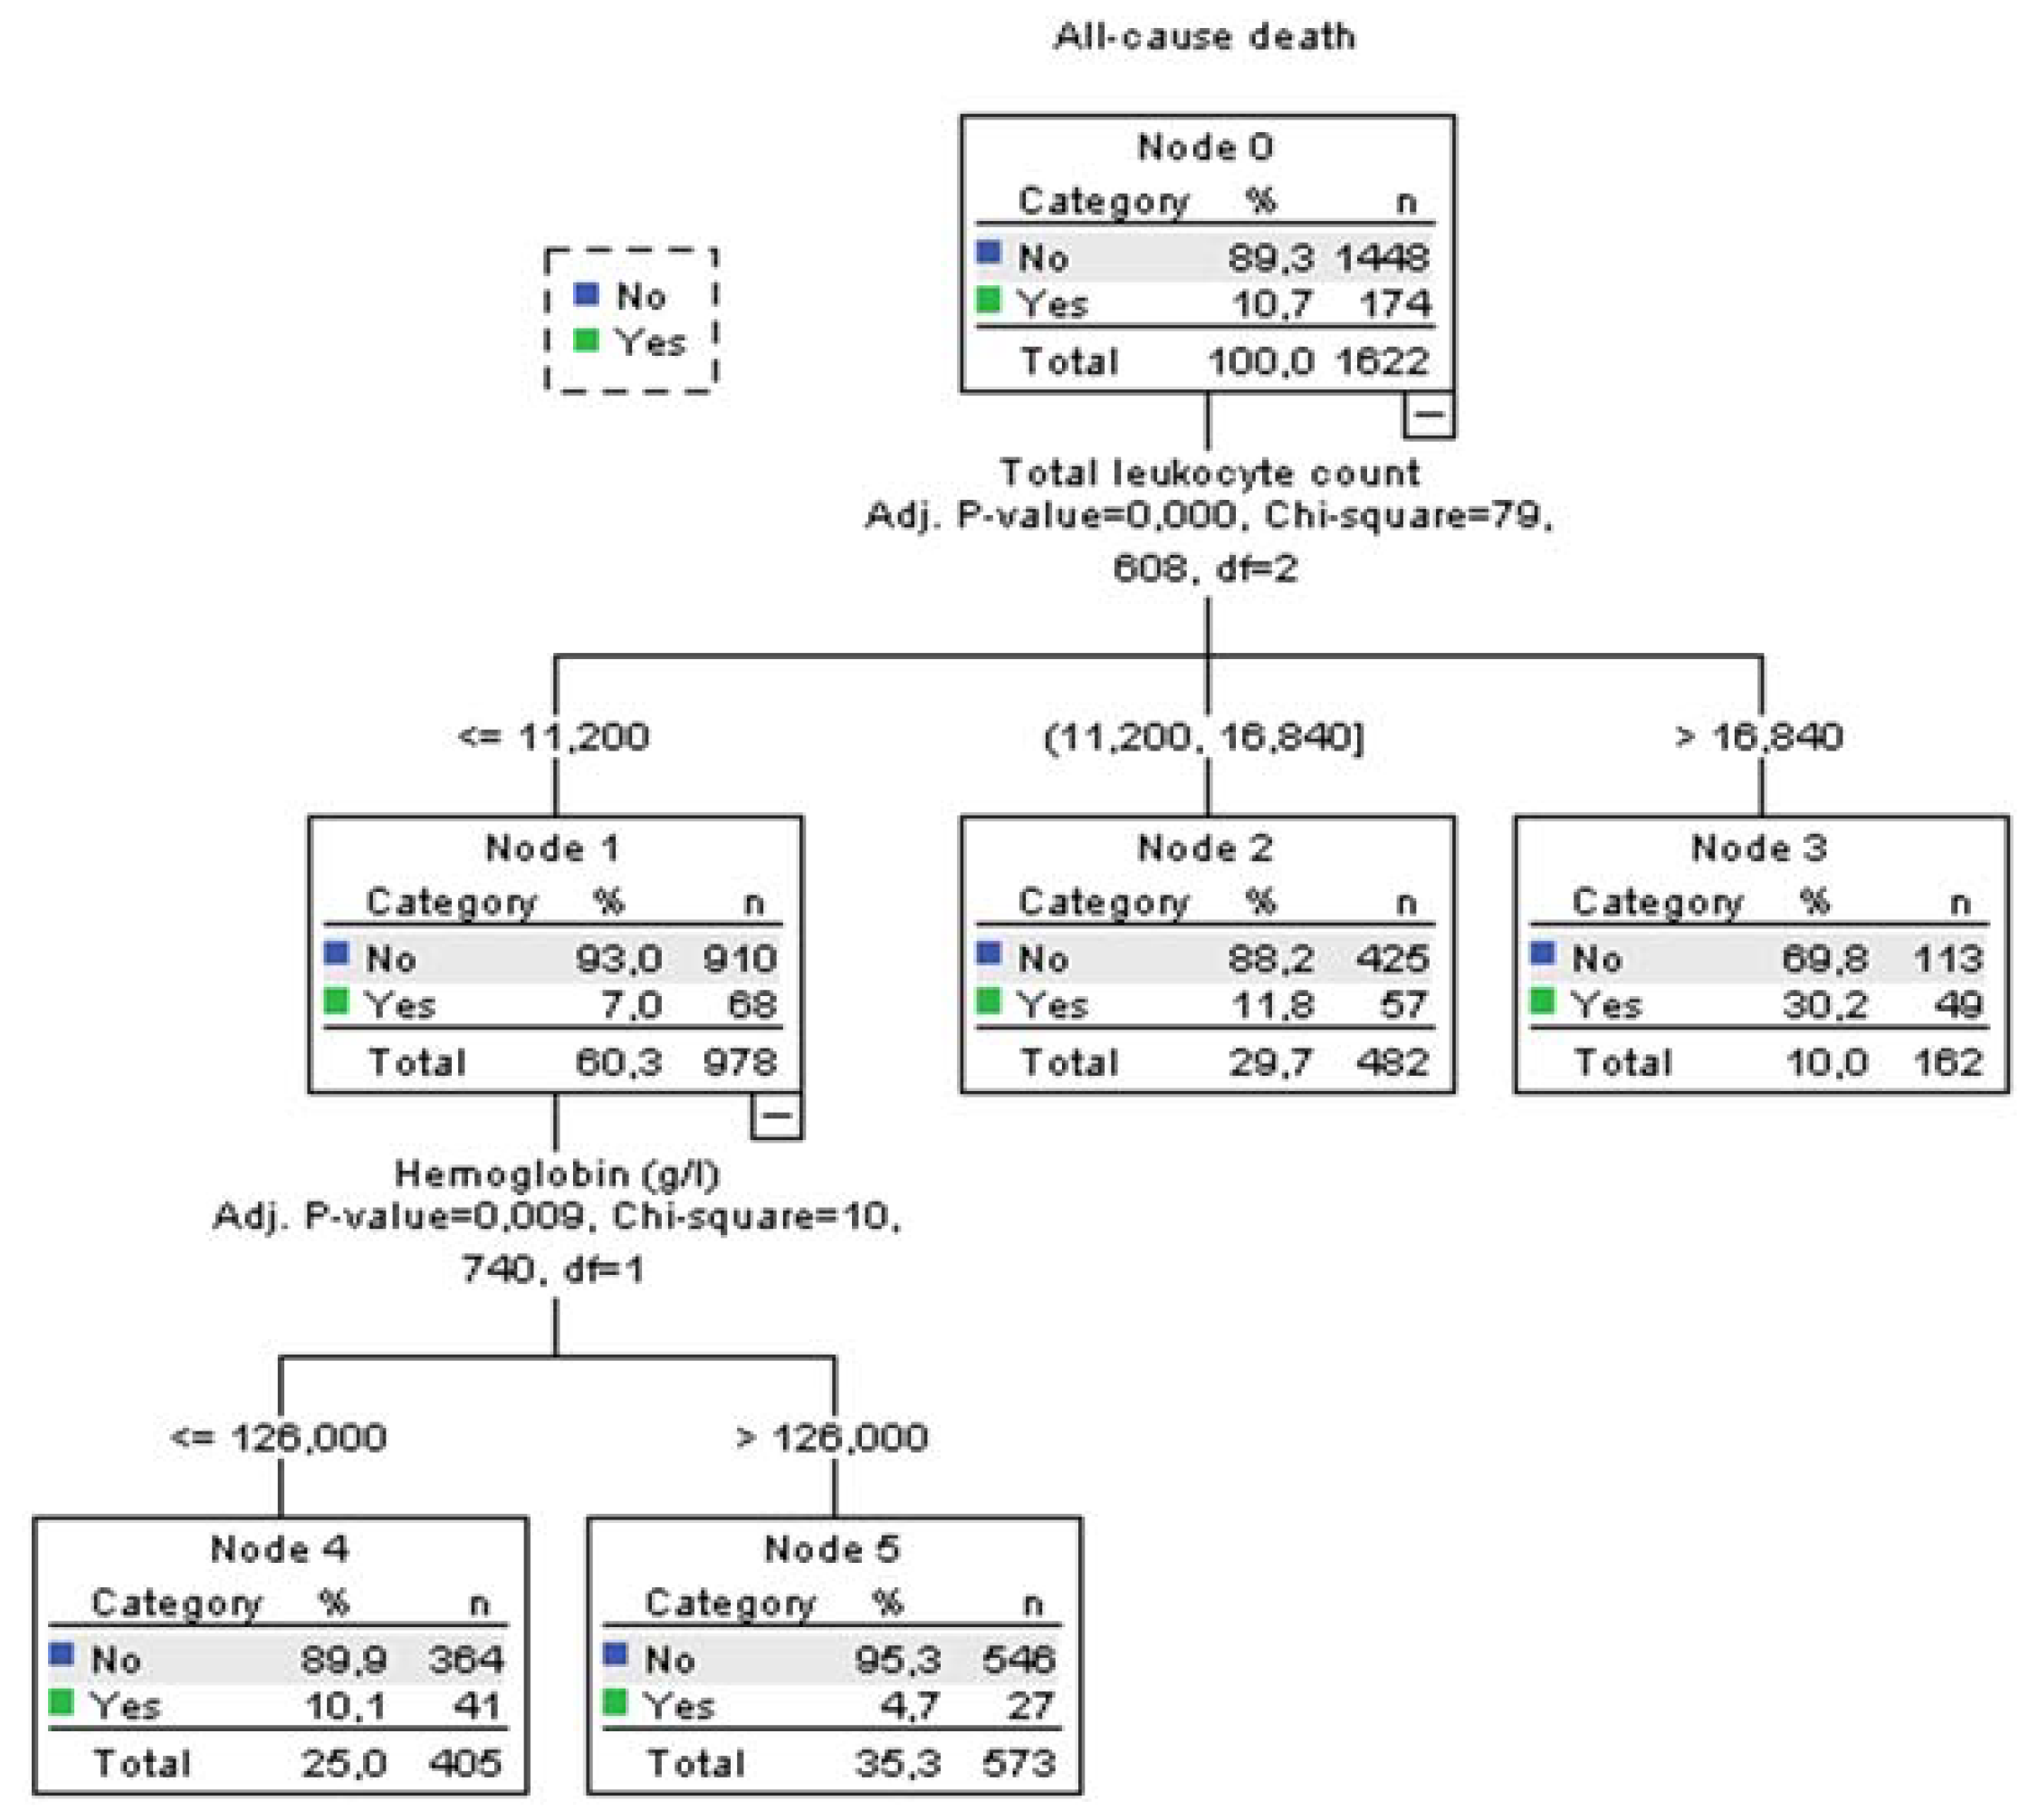
Figure 2.
Decision tree for PE-related hospital death in acute PE using blood total leukocyte count and Hb concentration at admission. .
Figure 2.
Decision tree for PE-related hospital death in acute PE using blood total leukocyte count and Hb concentration at admission. .
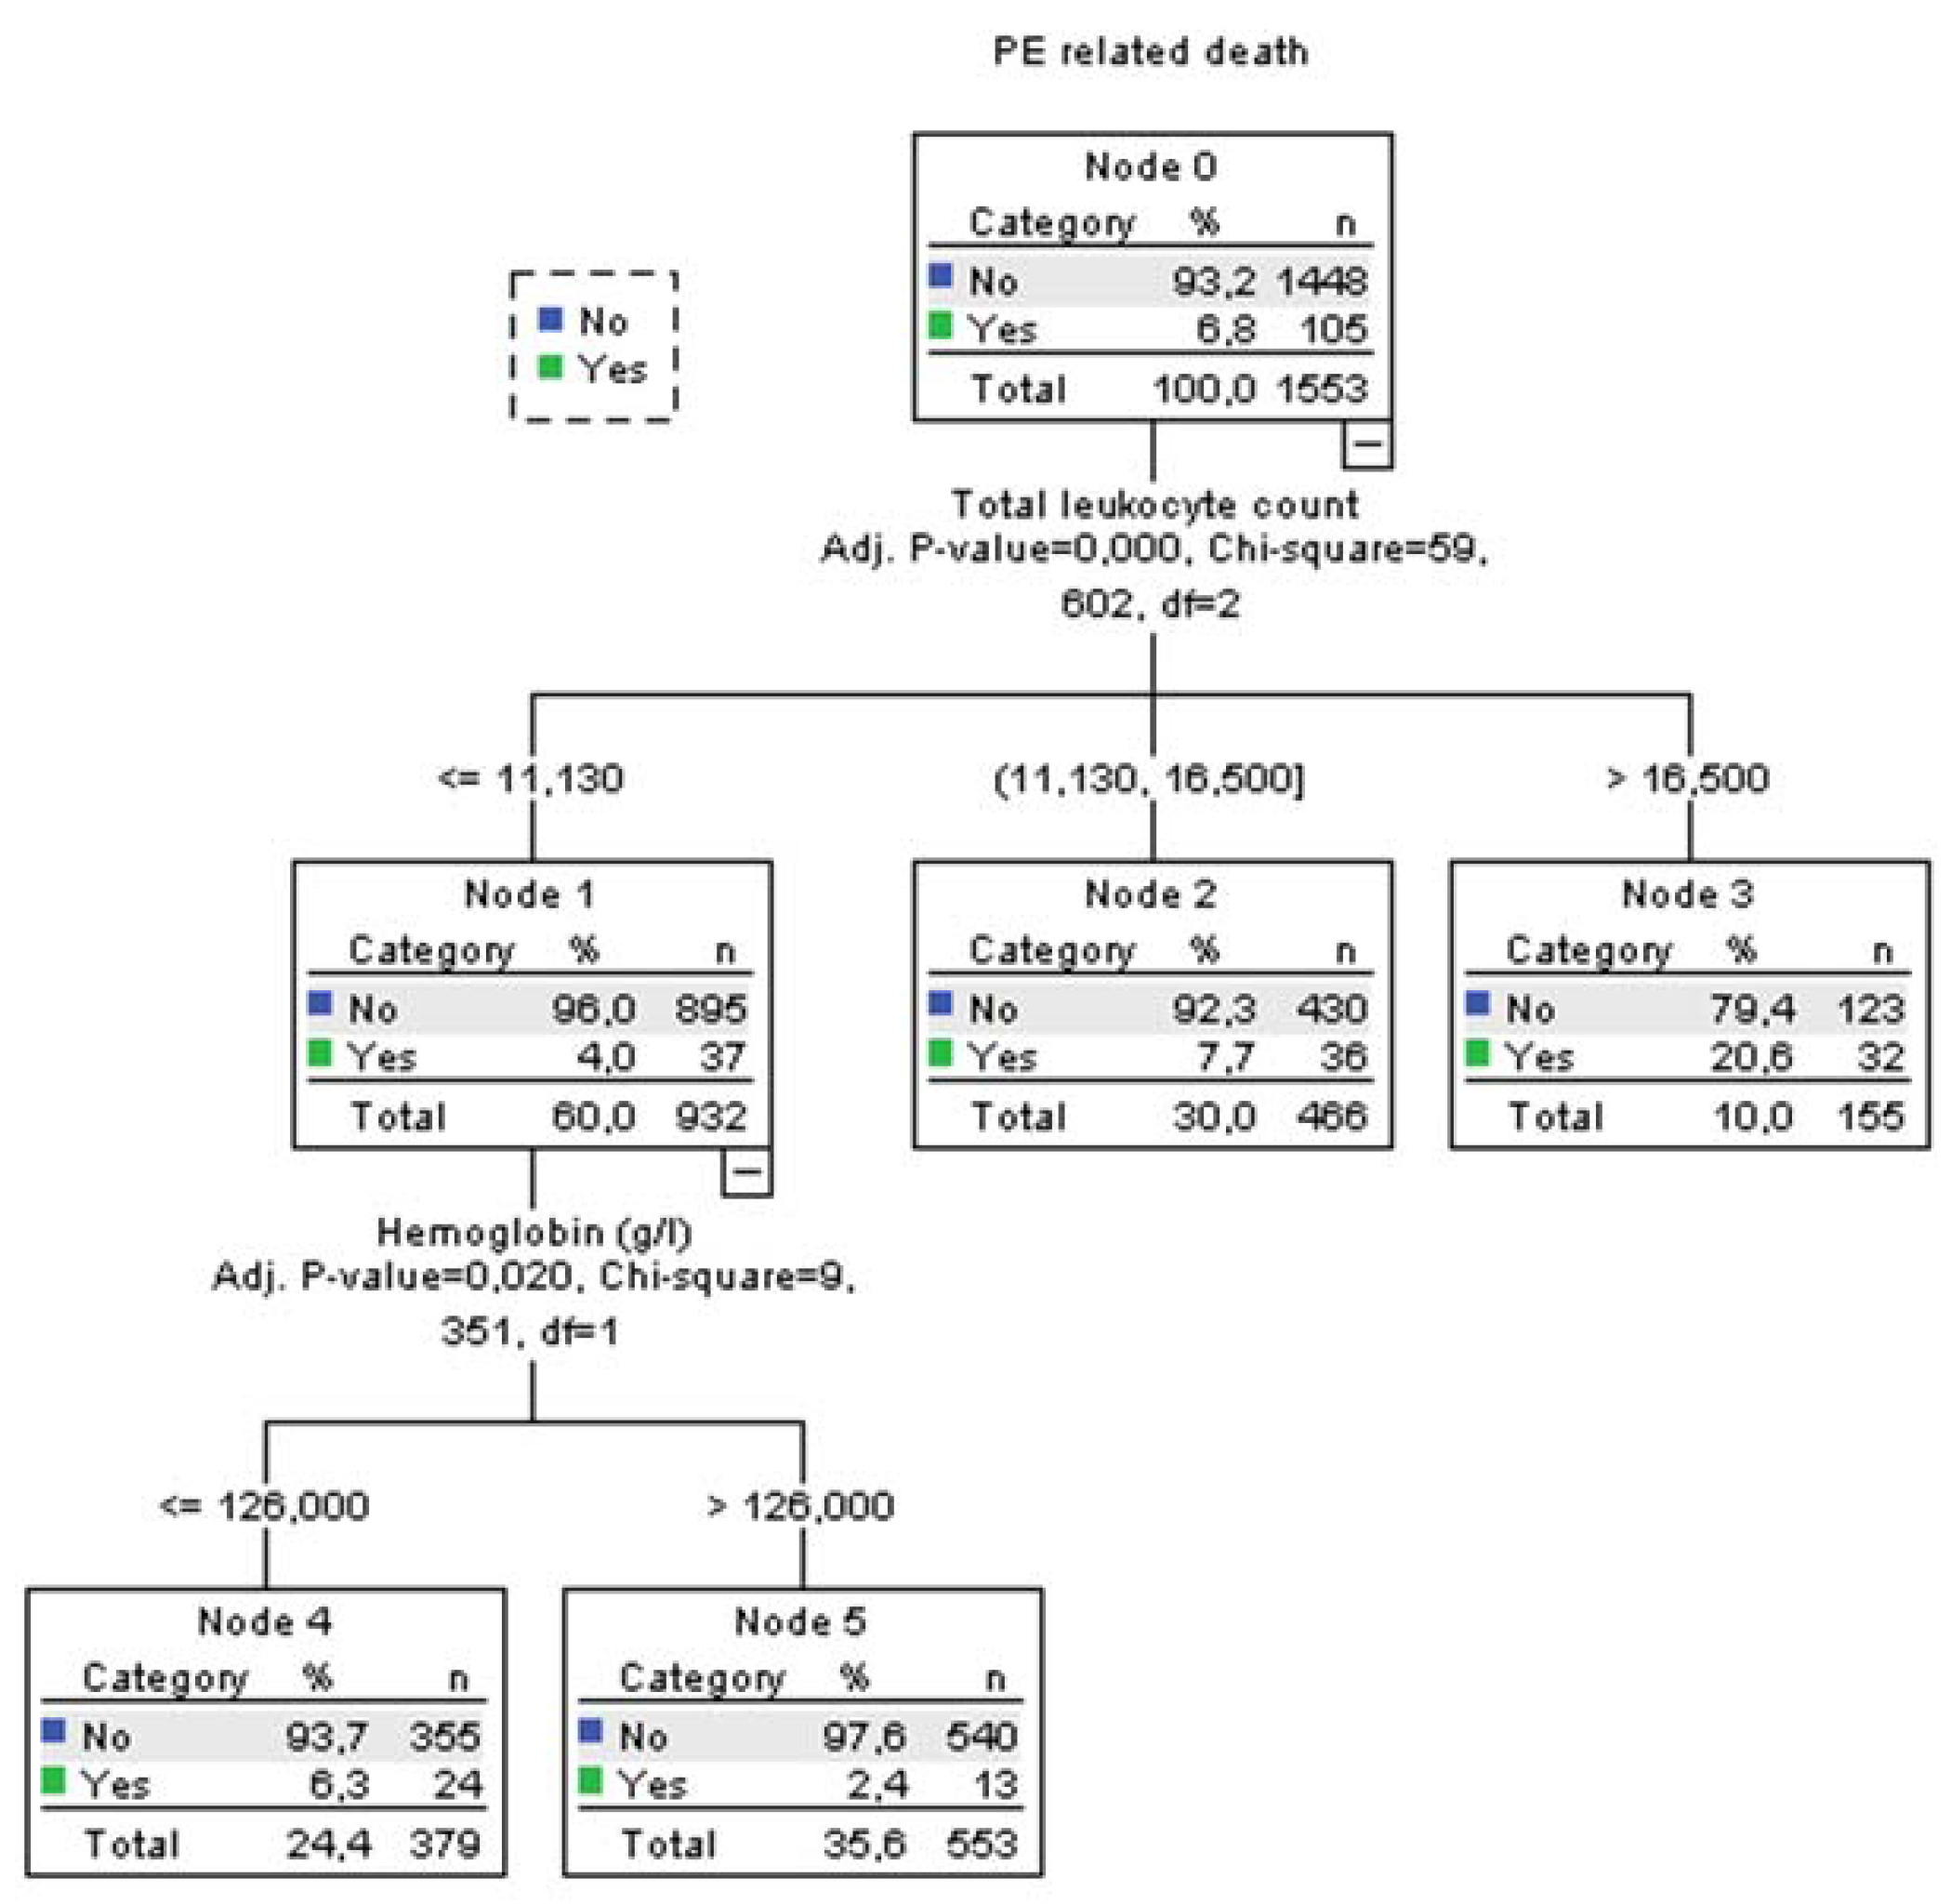
Figure 3.
Decision tree for A death in acute PE using blood total leukocyte count and Hb concentration and ESC mortality risk stratification at admission. .
Figure 3.
Decision tree for A death in acute PE using blood total leukocyte count and Hb concentration and ESC mortality risk stratification at admission. .
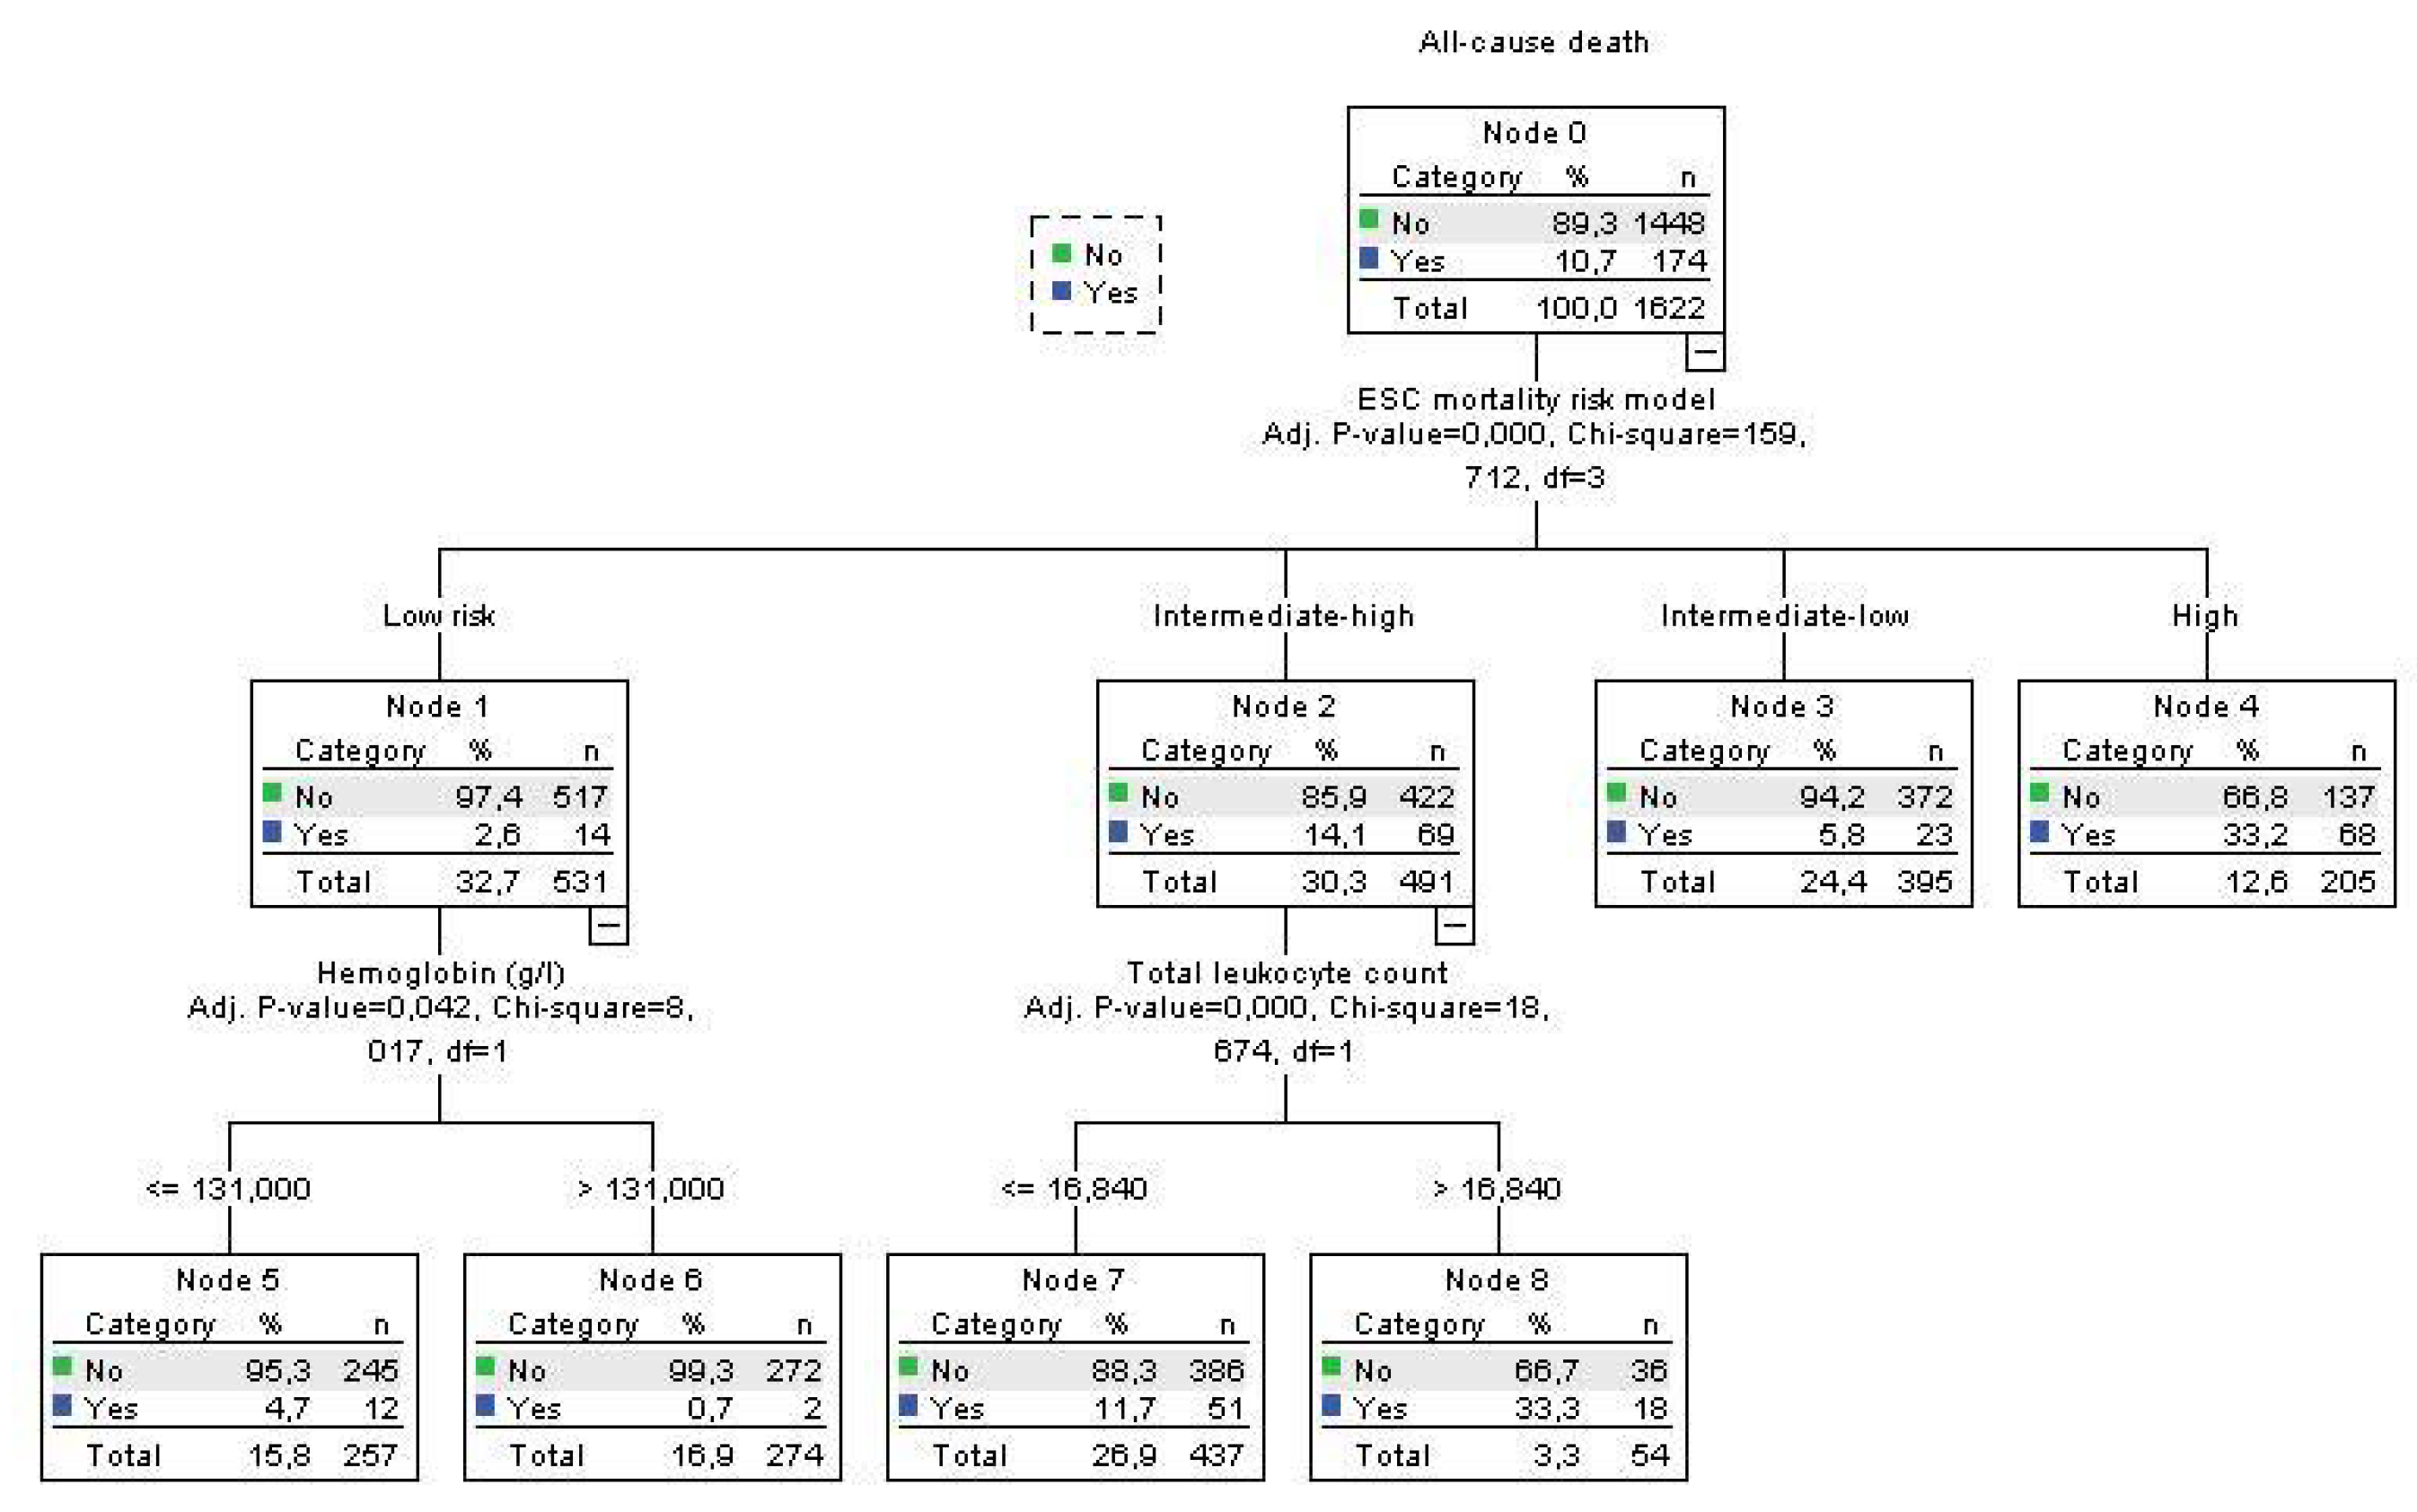
Figure 4.
Decision tree for PE-related death in acute PE using blood total leukocyte count and Hb concentration and ESC mortality risk stratification at admission. .
Figure 4.
Decision tree for PE-related death in acute PE using blood total leukocyte count and Hb concentration and ESC mortality risk stratification at admission. .
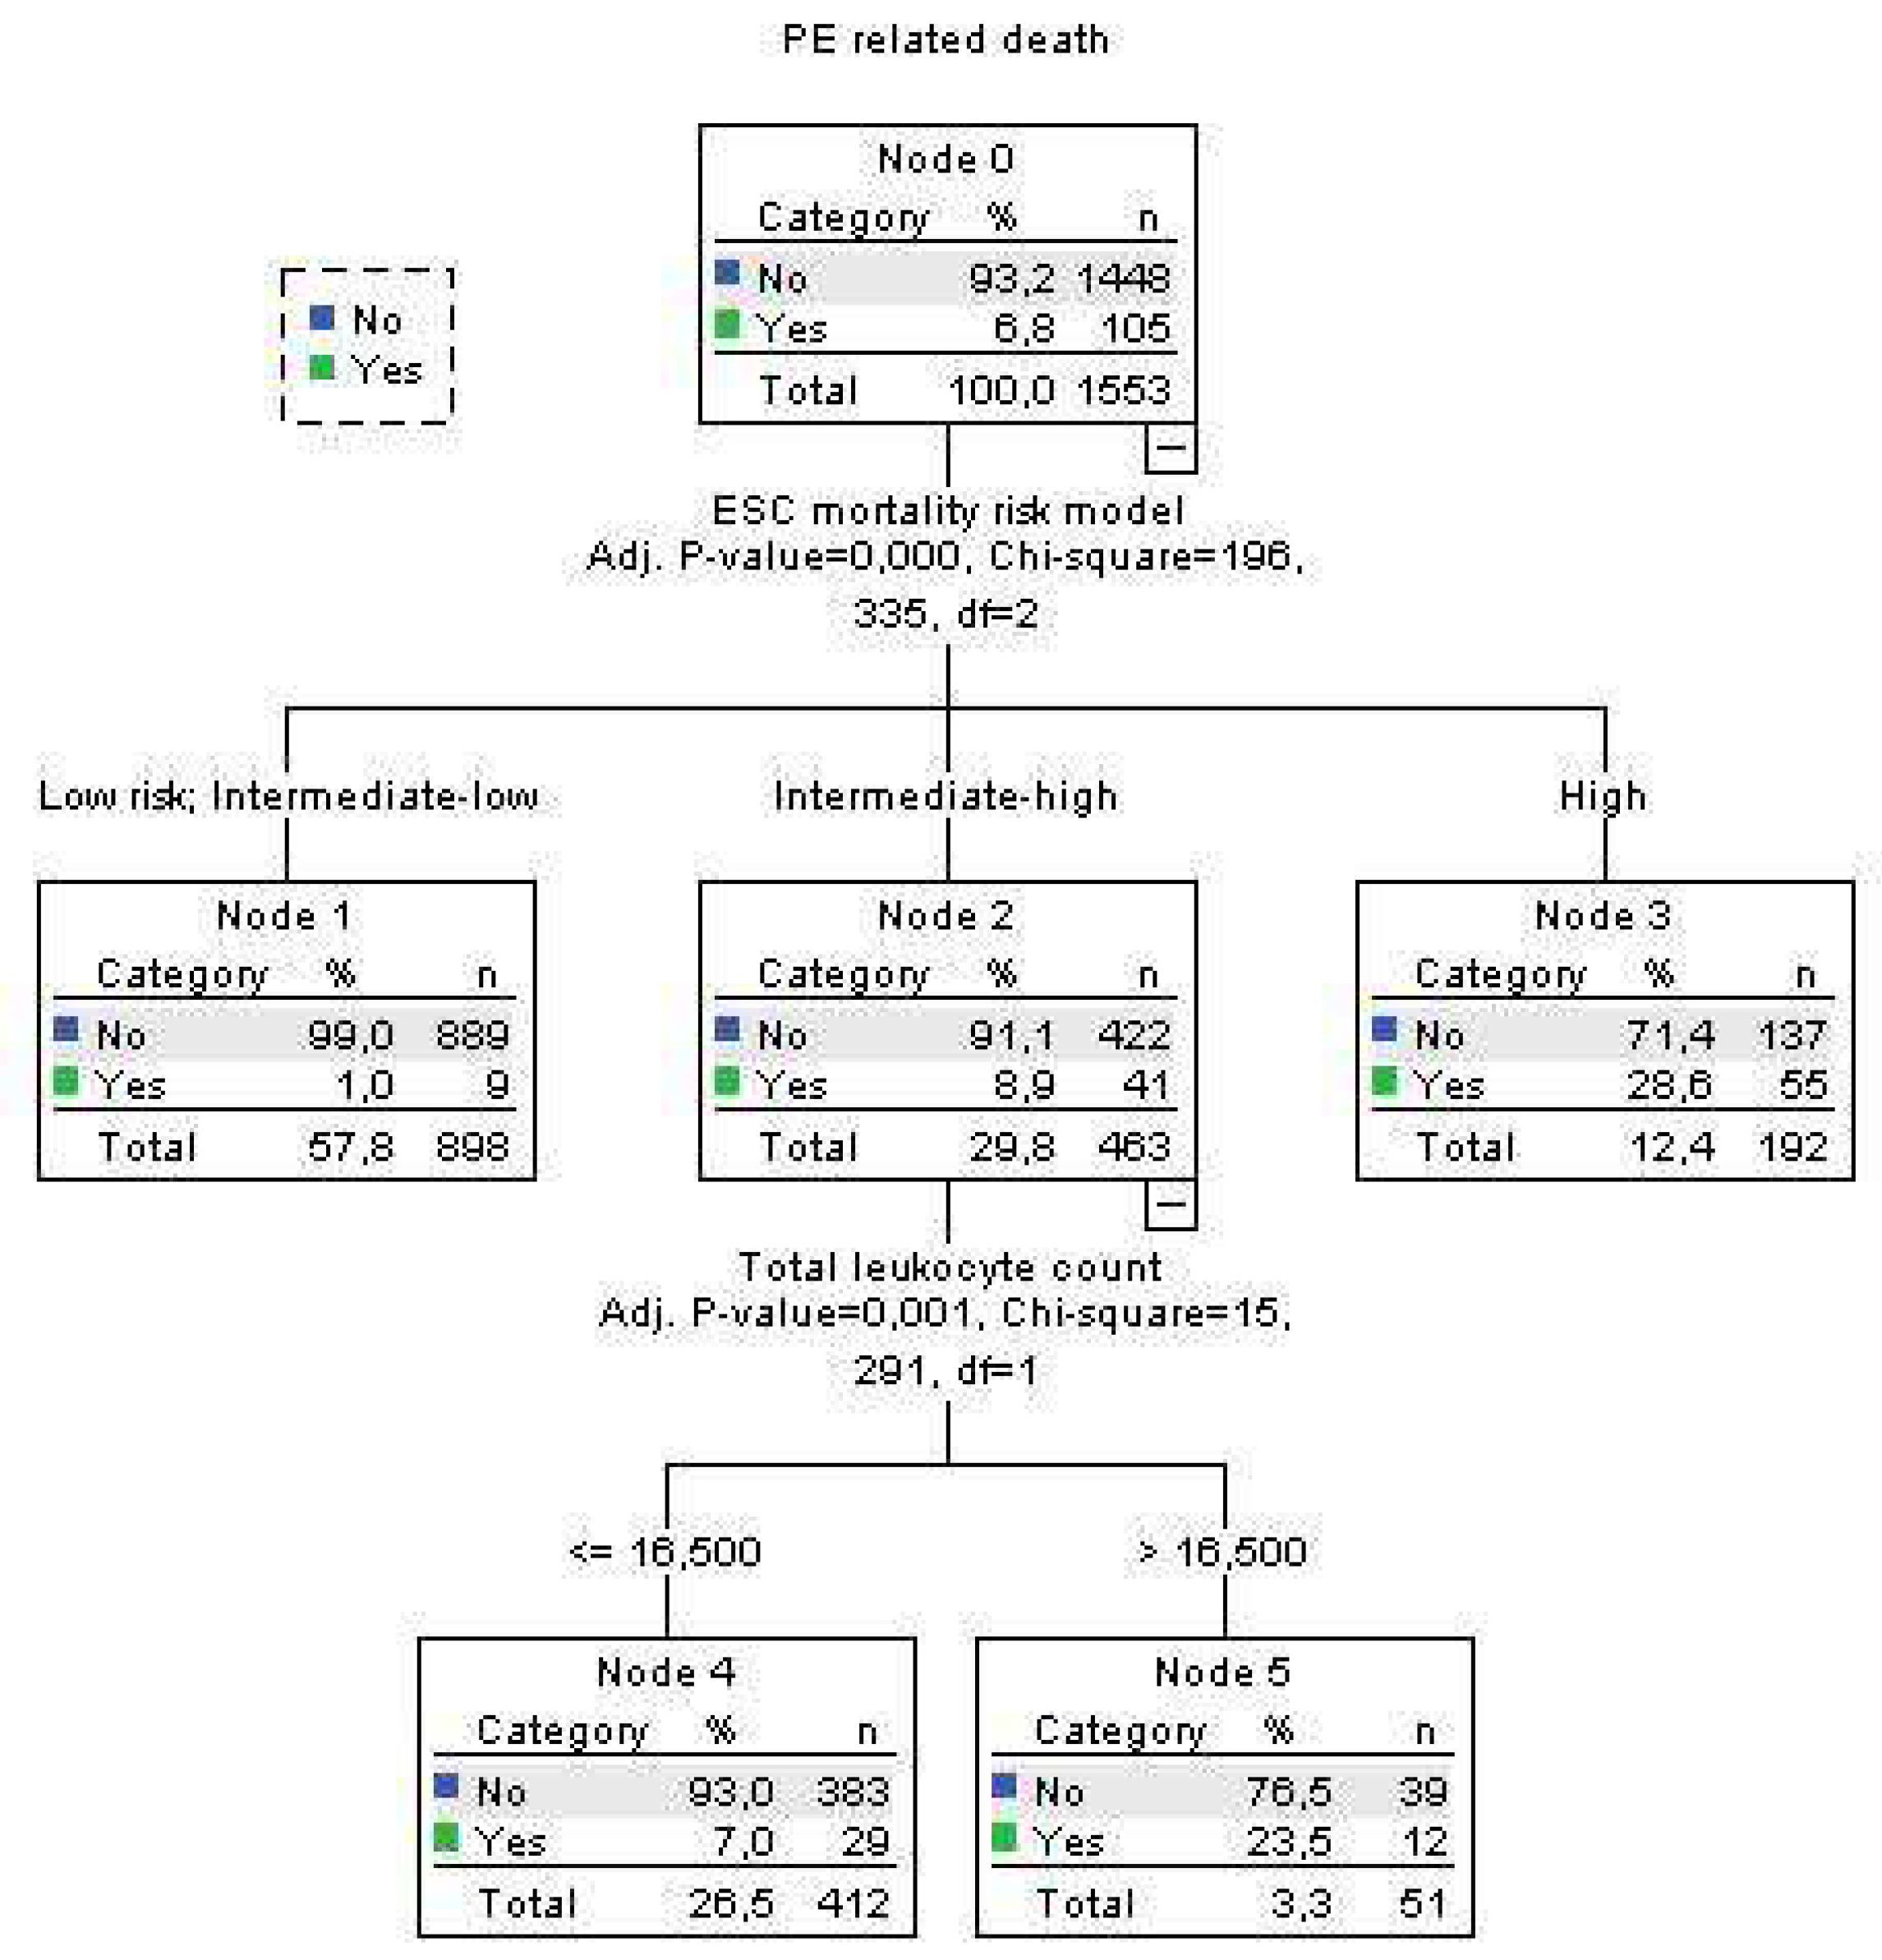

Table 1.
Basic characteristics of patients at admission to hospital.
| Survivors N=1448 |
All-cause death N=174 |
PE-related death N=105 |
|
|---|---|---|---|
| Age, y mean±SD Female – n, % COPD – n, % CHF – n, % Malignant dis. – n, % Surgery – n, % Diabetes – n, % Coronary dis. – n, % Stroke – n, % GRF<60ml/min – n, % sPESI>0 – n, % ESC mortality risk Low Intermediate-low Intermediate-high High TLC x109/l median (25th-75th) Hb g/l median (25th-75th) BNP or NT-proBNP (xUNRL) cTn (xUNRL) CRP mg/L (25th-75th) |
63±16 767, 53.0 142, 9.8 195, 13.5 181, 12.5 224, 15.5 274, 18.9 157, 10.9 89, 6.2 474, 33.0 970, 67.0 517, 35.7 372, 25.7 422, 29.1 137, 9.5 10.0 (7.9-12.7) 133 (118-145) 1.86 (0.58-5.85) 2.0 (0.32-9.06) 41.6 (16.1-89.85) |
70±14 94, 55.7 30, 17.2 45, 25.9 36, 20.7 25, 14.4 53, 30.5 31, 18.5 27, 15.6 115, 66.5 159, 91.4 14, 8.0 23, 13.2 69, 39.7 68, 39.1 12.1 (9.3-17.6) 125 (110-141) 6.8 (2.56-17.02) 4.87 (1.57-16.16) 80.50 (44.30-163.6) |
69±15 58, 55.2 13, 12.4 22, 21.0 18, 17.1 14, 13.3 31, 29.5 20, 19.8 17, 16.2 76, 72.4 96, 91.4 5, 4.8 4, 3.8 41, 39.0 55, 52.4 12.4 (9.8-17.6) 123 (107-140) 7.33 (3.52-18.80) 5.06 (2.0-18.3) 78.05 (45.85-164.6) |
COPD – chronic obstructive pulmonary disease, CHF – chronic heart failure, GRF – glomerular filtration rate, TLC – total leukocyte count, Hb – hemoglobin, BNP and NT-proBNP – brain natriuretic peptide, and N terminal brain natriuretic peptide, UNRL – upper normal range limit, cTn – cardiac troponin, CRP – C-reactive protein.
Table 2.
Univariate and multivariate regression analysis for the prediction of all-cause and PE-related hospital death, using total leukocyte count as categorical variable with cut-off < 16.5x10⁹/L and Hb blood concentration <125 g/dl. In the multivariable analysis adjustment was done with variables which have significantly different distribution between survivors and deceased patients. In the multivariate adjusted analysis, only variables with independent significant association with death are presented.
| All-cause death | Univariate analysis OR (95%CI, p) |
Multivariate analysis OR (95%CI, p) |
|---|---|---|
| Age Chronic obstructive pulmonary diseaseChronic heart failure Diabetes mellitus type 2 Malignant disease Coronary disease Stroke Chronic renal failure (CrCl<60 ml/min)ESC mortality risk model Intermediate-low Intermediate-high high Total leukocyte count (cut-off 16.5x10⁹/L) Hb (cut-off 125 g/L) |
1.033 (1.021-1.046, <0.001) 1.916 (1.247-2.945, 0.003) 2.242 (1.546-3.250, <0.001) 1.877 (1.324-2.660, <0.001) 1.903 (1.281-2.826, 0.001) 1.858 (1.216-2.838, 0.004) 2.822 (1.776-4.484, <0.001) 4.032 (2.877-5.633, <0.001) - compare to low risk 2.283 (1.159-4.496, 0.017) 6.038 (3.351-10.879, <0.001) 18.330 (10.007-33.575, <0.001) 4.591 (3.160-6.670, <0.001) 1.816 (1.323-2.490, <0.001) |
- - - 1.537 (1.039-2.274, 0.031) - - 2.110 (1.237-3.599, 0.006) 2.549 (1.773-3.665, <0.001) - compare to low risk 2.441 (1.206-4.945, 0.013) 5.506 (2.963-10.229, <0.001) 13.760 (7.239-26.156, <0.001) 3.141 (2.062-4.784, <0.001) 1.775 (1.246-2.530, <0.001) |
| PE-related death | ||
| Age Chronic heart failure Diabetes mellitus type 2 Coronary disease Stroke Chronic renal failure (CrCl<60 ml/min)ESC mortality risk model Intermediate-low Intermediate-high high Total leukocyte count (cut-off 16.5x10⁹/L) Hb (cut-off 125 g/L) |
1.030 (1.014-1.045, <0.001) 1.703 (1.040-2.790, 0.034) 1.795 (1.157-2.785, 0.009) 2.027 (1.209-3.398, 0.007) 2.948 (1.681-5.170, <0.001) 5.330 (3.427-8.290, <0.001) - compare to low risk 1.112 (0.297-4.168, 0.875) 10.046 (3.935-25.648, <0.001) 41.511 (16.302-105.70, <0.001) 4.722 (2.997-7.441, <0.001) 2.108 (1.412-3.1.47, <0.001) |
- - - - 2.091 (1.083-4.035, 0.028) 3.138 (1.940-5.076, <0.001) - compare to low risk 1.112 (0.297-4.239, 0.865) 8.341 (3.233-21.518, <0.001) 29.497 (11.414-76.230, <0.001) 2.738 (1.606-4.667, <0.001) 2.050 (1.301-3.320, 0.002) |
C-reactive protein level and cardiac troponin level did not influence the risk assessment adding to the ESC mortality risk model for either all-cause or PE-related hospital death. Brain natriuretic peptide of NT-proBNP was measured on 980 out of 1662 patients and since that, this variable was not included in the multivariable and ROC curve analysis.
Disclaimer/Publisher’s Note: The statements, opinions and data contained in all publications are solely those of the individual author(s) and contributor(s) and not of MDPI and/or the editor(s). MDPI and/or the editor(s) disclaim responsibility for any injury to people or property resulting from any ideas, methods, instructions or products referred to in the content. |
© 2023 by the authors. Licensee MDPI, Basel, Switzerland. This article is an open access article distributed under the terms and conditions of the Creative Commons Attribution (CC BY) license (http://creativecommons.org/licenses/by/4.0/).
Copyright: This open access article is published under a Creative Commons CC BY 4.0 license, which permit the free download, distribution, and reuse, provided that the author and preprint are cited in any reuse.


