

Submitted:
29 August 2023
Posted:
29 August 2023
You are already at the latest version
Abstract
By using the Black-Derman-Toy (BDT) model, we predict the future trend of the riskless rate, and then we build an equation that relates the market price of zero-coupon bonds and the theoretical price of zero-coupon bonds calculated using a binomial option pricing model. Based on this, we can find the implied daily return μ, implied natural upturn probability p, and implied daily volatility σ with respect to different time-to-maturity values of zero-coupon bonds. With these results, we can give some suggestions to bond traders.
Keywords:
BDT model
; zero-coupon bond
; implied daily return
; implied natural upturn probability
; implied daily volatility
1. Introduction
In this paper, we will explore the relationships between a zero-coupon bond’s implied daily return , implied natural upturn probability p, and implied daily volatility and the zero-coupon bond’s time to maturity. Additionally, based on the data visualization, we will obtain a general conclusion, and thus we can give bond traders some suggestions.
First, we will provide the theoretical support of this research, so that readers can understand the foundational theorems that we will use. Additionally, two important ideas are described in the next section: first, we consider a zero-coupon bond as a European contingent claim (ECC), so that we can use the binomial option pricing algorithm to calculate its theoretical fair value, and second, we explain that we cannot just assume that the risk-neutral probability , since this will lead to an unrealistic natural probability ; a detailed explanation of this can be found in [1]. Thus, we need to calculate the real risk-neutral probability by building an equation that relates the market value of a zero-coupon bond and the theoretical value of the zero-coupon bond.
Second, we will perform empirical research. Before doing this, we will do some preparation—we need to extract the values of the related parameters from the raw data we obtained from the internet. Then, we will follow the form of the Black-Derman-Toy (BDT) model to find new coefficients to calibrate the model. After completing these steps, we can find the implied daily return, implied natural upturn probability, and implied daily volatility with respect to the zero-coupon bond’s time to maturity.
Lastly, we will provide a general conclusion about the three relationships described above and give some suggestions to bond traders.
2. Theoretical Support
2.1. Underlying Asset
Consider a Black-Scholes-Merton market model consisting of a risky asset , a riskless bank account , and an ECC that has as the underlying asset. We also assume that is the current time and is the terminal time of the ECC.
Now, we will divide the time period into N intervals, where and 1, so that . If 2 represents the risky asset’s price at time , then based on the binomial model, the randomness of the price is given by
Next, we define the arithmetic stock return in the sub-time period :
Then, we let the mean of be , where is the instantaneous mean return. We let the variance of be , where is the instantaneous variance. Thus, we will have the following:
Based on (4),
2.2. European contingent claim
In [2], we can find a basic type of binomial option pricing algorithm. If we let represent the price of the ECC at time , then the recursive pricing algorithm will be
where and represent two possible prices of the ECC at time , r is the riskless rate, and is the upturn risk-neutral probability.
In the previous subsection, we do not have any information about the risk-neutral probability, and thus we hope to find a connection between the natural probability and risk-neutral probability. Suppose that we want to construct a riskless portfolio
From [2], we can find that
By combining (10) and (7), we find that the relationship between the natural upturn probability p and risk-neutral upturn probability is
Observe that we can consider the zero-coupon bond as a kind of ECC with a final payoff of $1 regardless of the path in the binomial tree.3 Thus, the recursive pricing algorithm for the zero-coupon bond should be
3. Empirical Research
3.1. Preparation
The main purpose of this research is to find the implied values of the daily return , upturn probability p, and volatility . To do this, we need to build an equation that relates the theoretical value of the zero-coupon bond and the market value of the zero-coupon bond for different time-to-maturity values.
To calculate the market value of the zero-coupon bond, we can use the formula given in [3], where the value of the yield to maturity satisfies
Based on (13),
and from (14), we can easily obtain the market values of zero-coupon bonds with different time-to-maturity values since the parameters in (14) can be found on the internet.4
To obtain the theoretical value of the zero-coupon bond, we can use the recursive algorithm in (12). With different time-to-maturity values, we expect to get different values of the risk-neutral upturn probability , and based on (11), the theoretical value can be written as .
To find the implied , p, and values, we should let
and fix the other two parameters. In this research, we chose data concerning the SPDR S&P 500 ETF Trust (SPY) from June 16, 2022 to June 16, 2023 (this time period has exactly 252 business days) as a sample.5 The initial estimates for , p, and are , , and , respectively.
Because we cannot consider the riskless rate r to be constant, especially for a long period of time, we will use the BDT model6 to predict the future riskless rate. In this process, we set June 16, 2023, as the start date and use 252 days of back data7 to find the coefficient sequences and to calibrate the model. Figure 1 shows the fitting effect of the BDT model.
The mathematical expression of this model, if we consider June 16, 2023, to be the start date, is
where , H indicates that the riskless rate is strictly increasing, T indicates that the riskless rate is decreasing, and is the number of periods in which the riskless rate is strictly increasing.
3.2. Data Visualization and Explanation
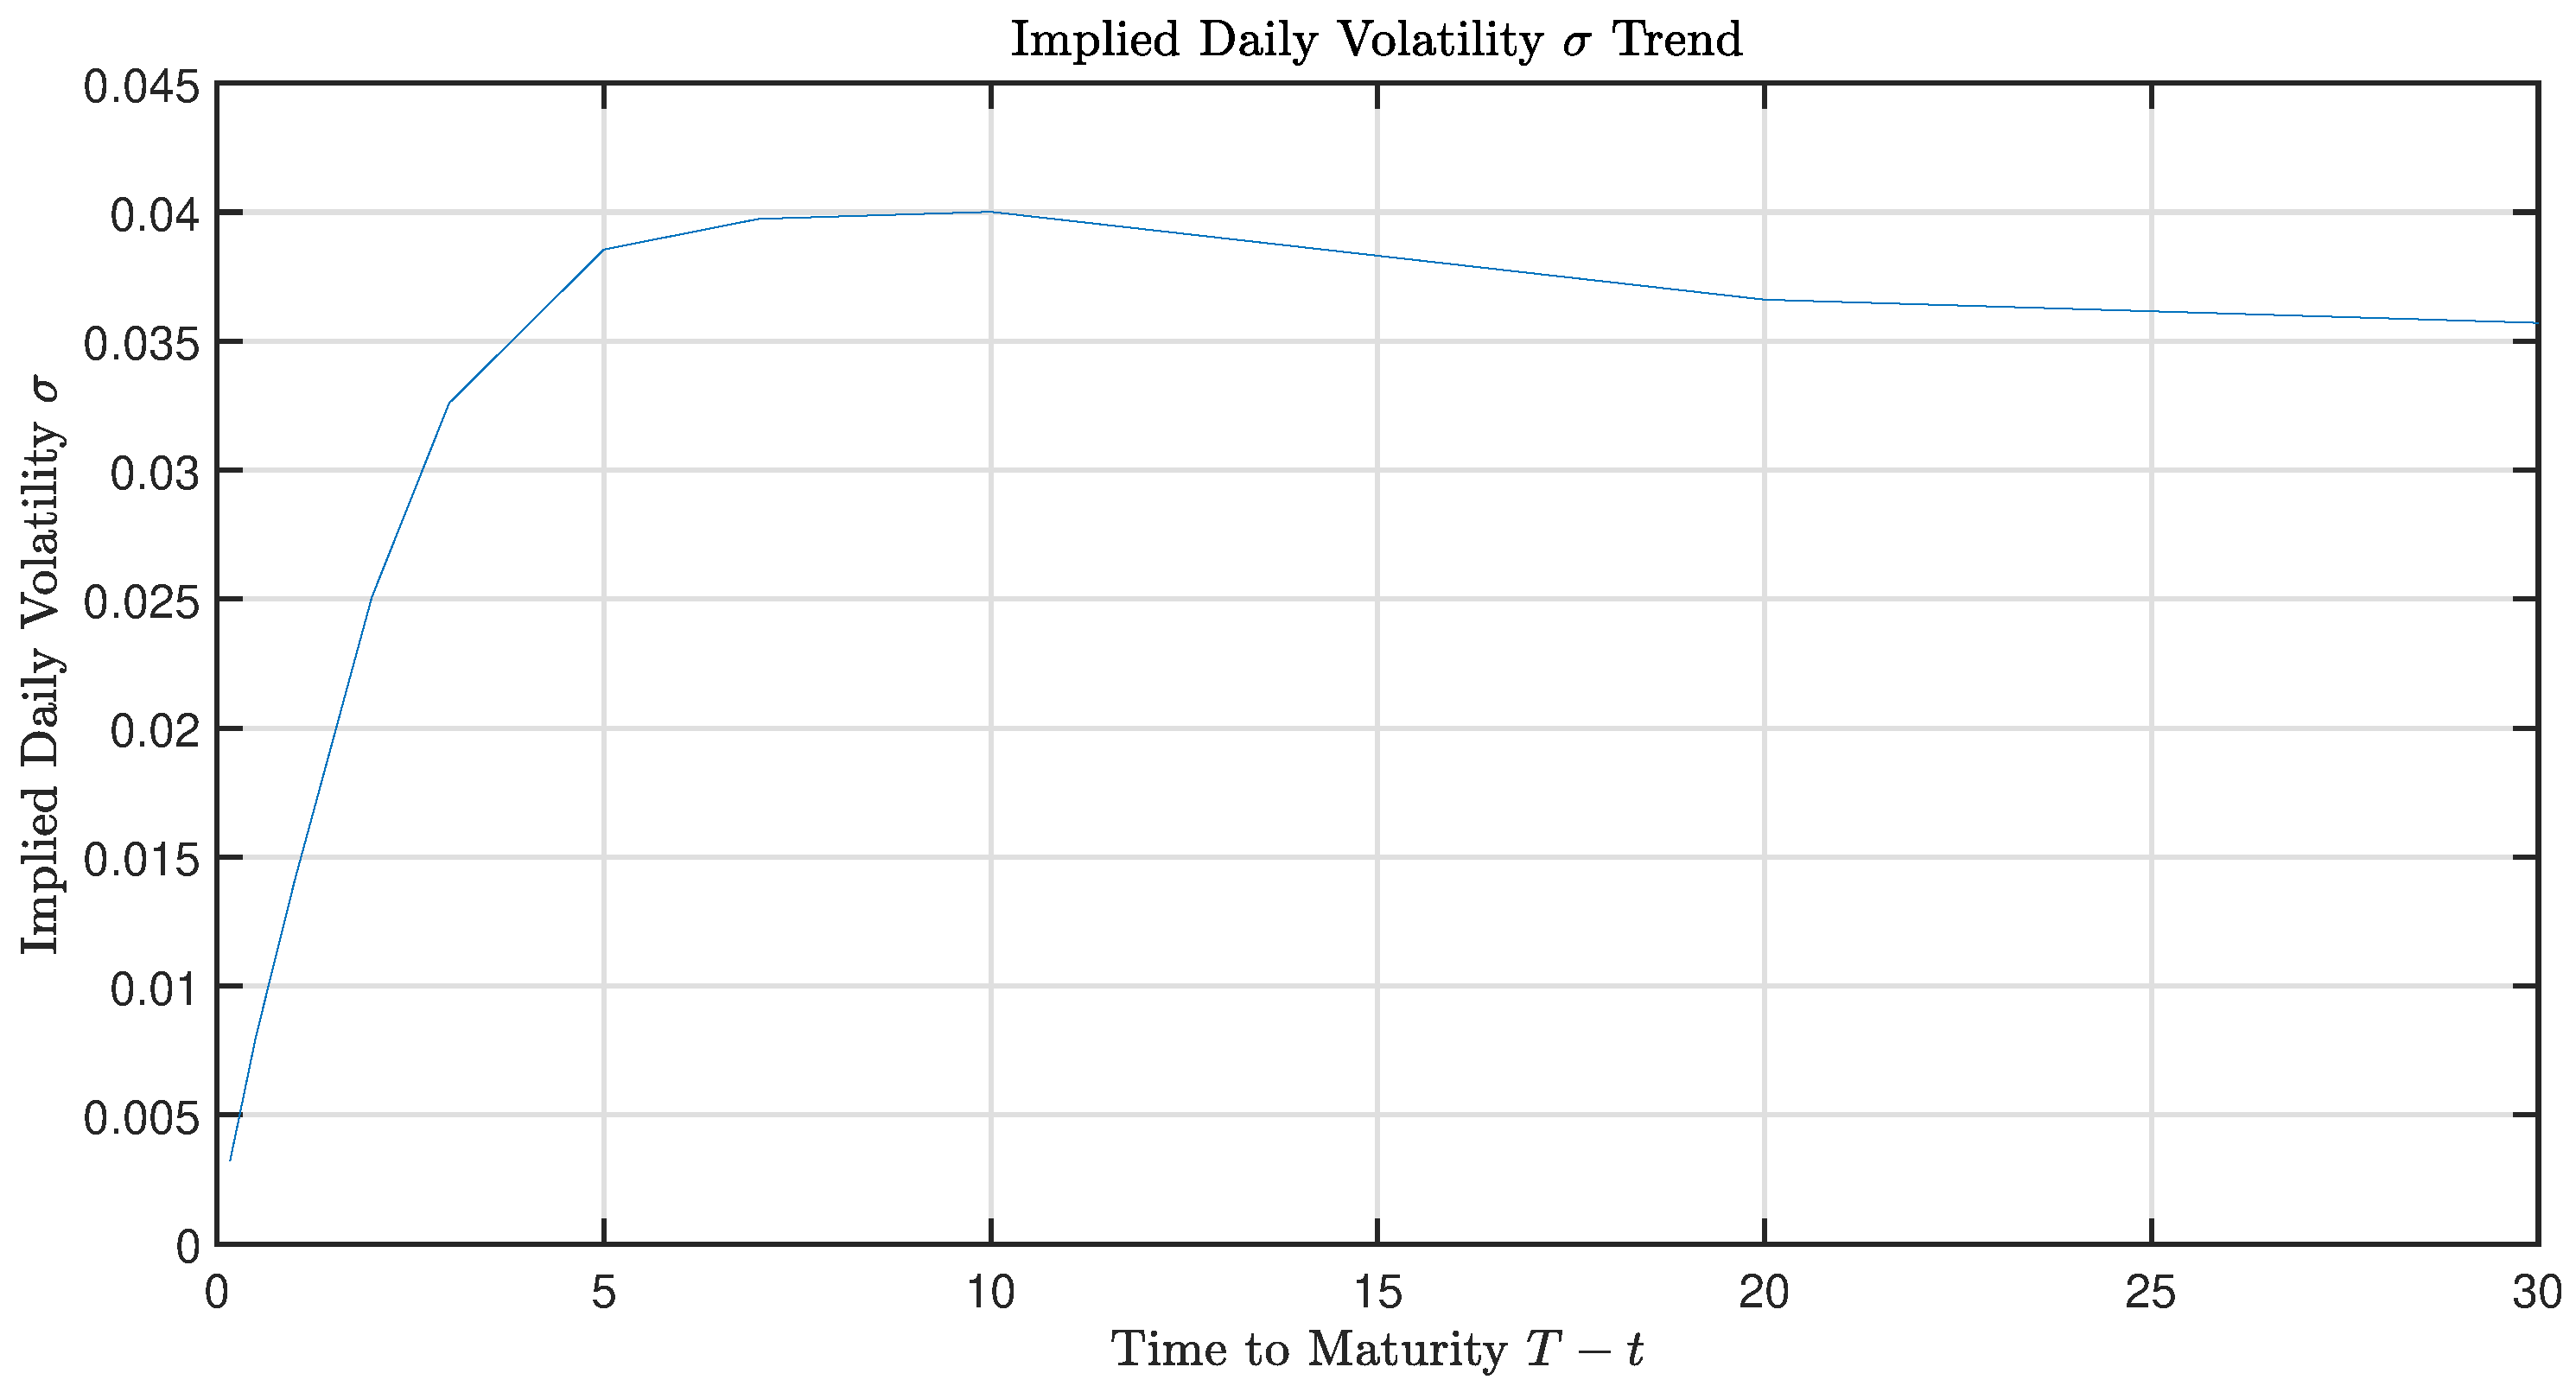
As we have previously stated, we will treat June 16, 2023, as the start date, and we choose different time-to-maturity values8 for the zero-coupon bonds to find the implied , p, and values. Figure 2, Figure 3, and Figure 4 show the implied , p, and values, respectively.
Based on these figures, we can obtain the following observations:
- In Figure 2, we can see that the value of the implied daily return increases sharply at first, from about -0.11, and then it begins to increase more slowly; finally, the value converges to about 0.025.
- In Figure 3, we can see that the value of the implied daily upturn probability decreases sharply at first, from about 0.9, and then it begins to decrease more slowly; finally, the value converges to about 0.62.
- In Figure 4, we can see that the daily volatility will increase at first and attain its peak value of 0.04 in year 10; then, the value of the daily volatility will slightly decrease to about 0.035.
4. Conclusion
Based on the three graphs that we constructed, it is clear that if the time to maturity is short, even if the natural upturn probability is high and the daily volatility is low, the daily return is strictly negative. However, the daily return will become positive quickly, and then its value will converge to a constant. Similarly, the natural upturn probability and daily volatility will change sharply in a short amount of time, but on a longer time scale, they will attain stable levels. Thus, based on the graphs, our suggestion to bond traders is to focus on zero-coupon bonds with a time to maturity of about 2 years, since at this level, the bond trader has a large probability of obtaining a high return, the upturn probability is about 65%, and the daily volatility is also not very high (at least, it does not attain its peak).
Of course, there are many factors that should affect bond traders’ choices. They cannot rely only on the factors that we analyze in this paper when they make decisions; they also need to consider other factors.
Author Contributions
Conceptualization, S.R.; methodology, S.R., Y.F.H., and Y.H.; software, Y.F.H. and Y.H.; formal analysis, Y.F.H.; investigation, Y.F.H.; resources, S.R. and Y.F.H.; data curation, Y.F.H.; writing—original draft preparation, Y.F.H.; writing—review and editing, Y.F.H. and S.R.; visualization, Y.F.H.; supervision, S.R.; project administration, S.R. All authors have read and agreed to the published version of the manuscript.
Funding
This research received no external funding.
Conflicts of Interest
The authors declare no conflict of interest.
Abbreviations
The following abbreviations are used in this manuscript:
| BDT model | Black-Derman-Toy model |
| ECC | European Contigent Claim |
Appendix A. Implied Daily Return, Natural Upturn Probability, and Daily Volatility Data

Table A1.
The related data we use in this paper.
| Indicators | p | |||
|---|---|---|---|---|
| Time to Maturity | ||||
| 2 mo. | -0.1067 | 0.9092 | 0.0032 | |
| 3 mo. | -0.0677 | 0.8313 | 0.0044 | |
| 4 mo. | -0.0451 | 0.7833 | 0.0056 | |
| 6 mo. | -0.0202 | 0.7282 | 0.0080 | |
| 1 yr. | 0.0047 | 0.6716 | 0.0141 | |
| 2 yr. | 0.0192 | 0.6378 | 0.0251 | |
| 3 yr. | 0.0235 | 0.6277 | 0.0326 | |
| 5 yr. | 0.0257 | 0.6255 | 0.0386 | |
| 7 yr. | 0.0260 | 0.6217 | 0.0397 | |
| 10 yr. | 0.0261 | 0.6215 | 0.0400 | |
| 20 yr. | 0.0250 | 0.6240 | 0.0366 | |
| 30 yr. | 0.0247 | 0.6248 | 0.0357 | |
References
- Hu Y., Lindquist W.B., Rachev S.T., Shirvani A., Fabozzi F.J. Market complete option valuation using a Jarrow-Rudd pricing tree with skewness and kurtosis. Journal of Economic Dynamics and Control, Volume 137, 2022, 104345, ISSN 0165-1889. [CrossRef]
- Shreve S. Stochastic Calculus for Finance I: The Binomial Asset Pricing Model. Springer Science & Business Media, 2004.
- Chalasani P., Jha S. Steven Shreve: Stochastic Calculus and Finance. Lecture Notes, October 1997.
| 1 | We assume that every calendar year has 252 business days. |
| 2 | For convenience, we will write ; the same applies in the following. |
| 3 | For a zero-coupon bond , t represents the current time, T represents the terminal time, and . |
| 4 | The relevant data can be found at https://home.treasury.gov/. |
| 5 | The relevant data can be found at https://finance.yahoo.com/quote/SPY/history?p=SPY. |
| 6 | See the detailed explanation in [2]. |
| 7 | We will treat the 10-year U.S. Treasury yield as the riskless rate, and the relevant data can be found at https://home.treasury.gov/. |
| 8 | The different time-to-maturity values that we choose are 2 months, 3 months, 4 months, 6 months, 1 year, 2 years, 3 years, 5 years, 7 years, 10 years, 20 years, and 30 years. |
Figure 1.
Comparison between the market value and BDT model value.
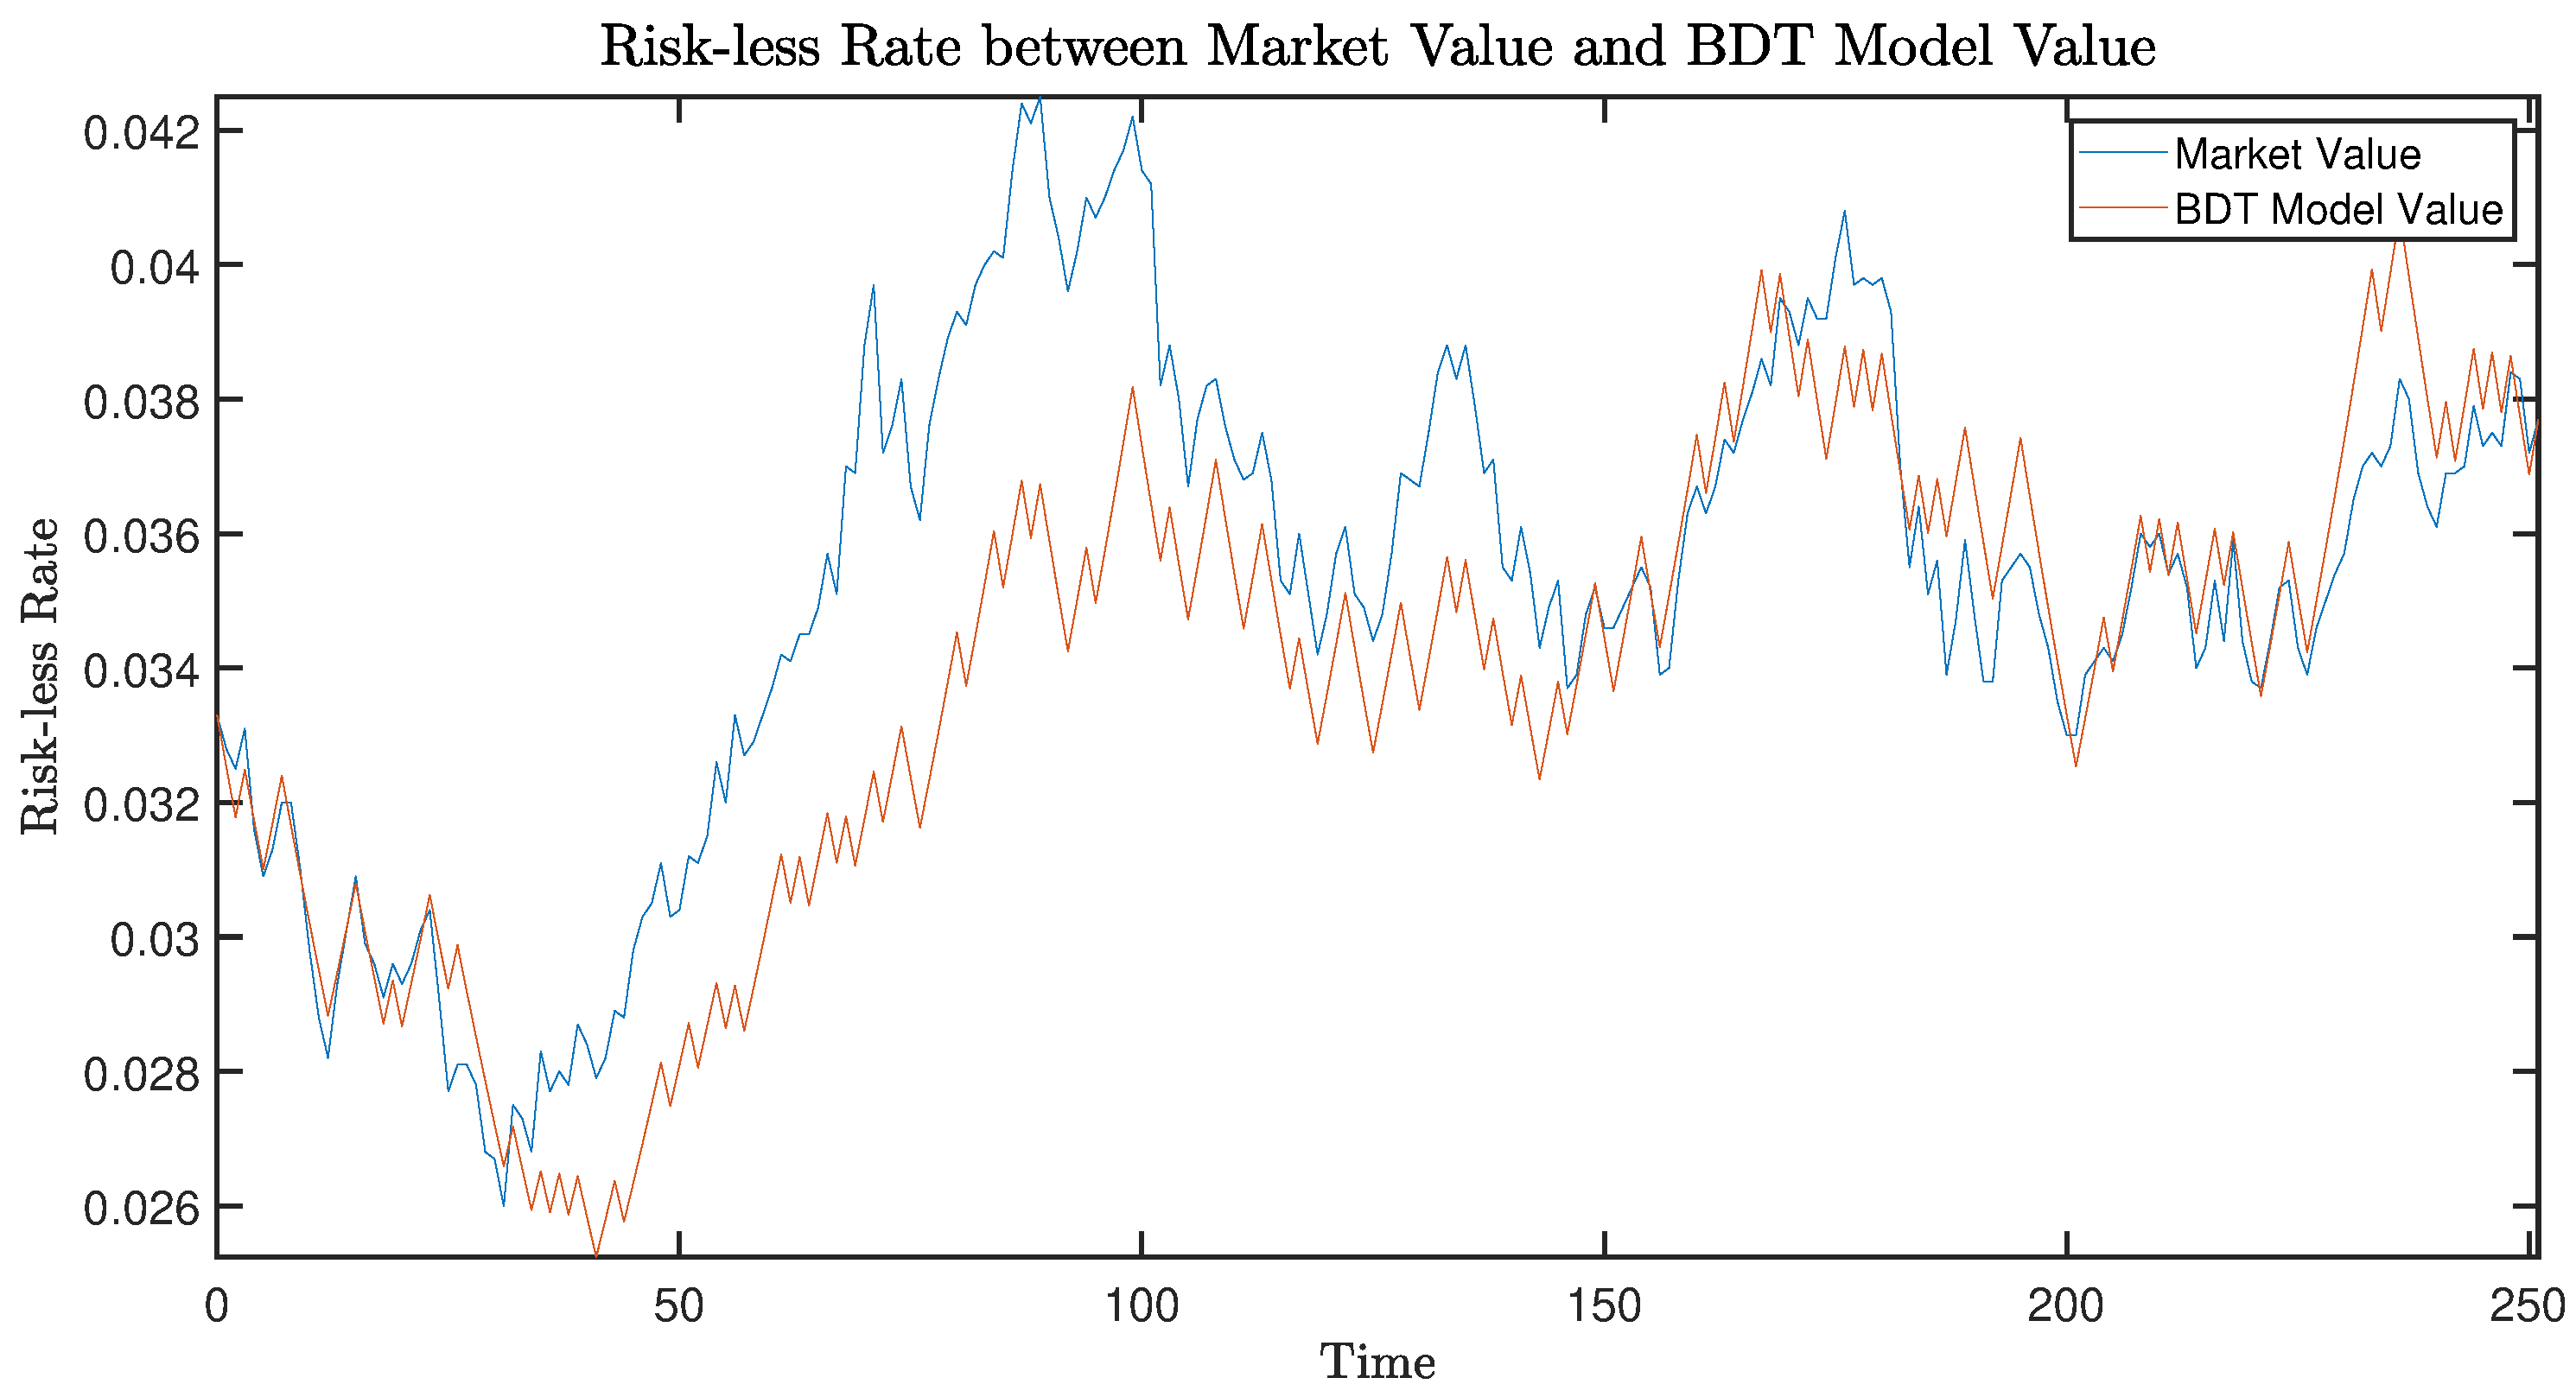
Figure 2.
Trend of the implied daily return.

Figure 3.
Trend of the implied daily upturn probability.
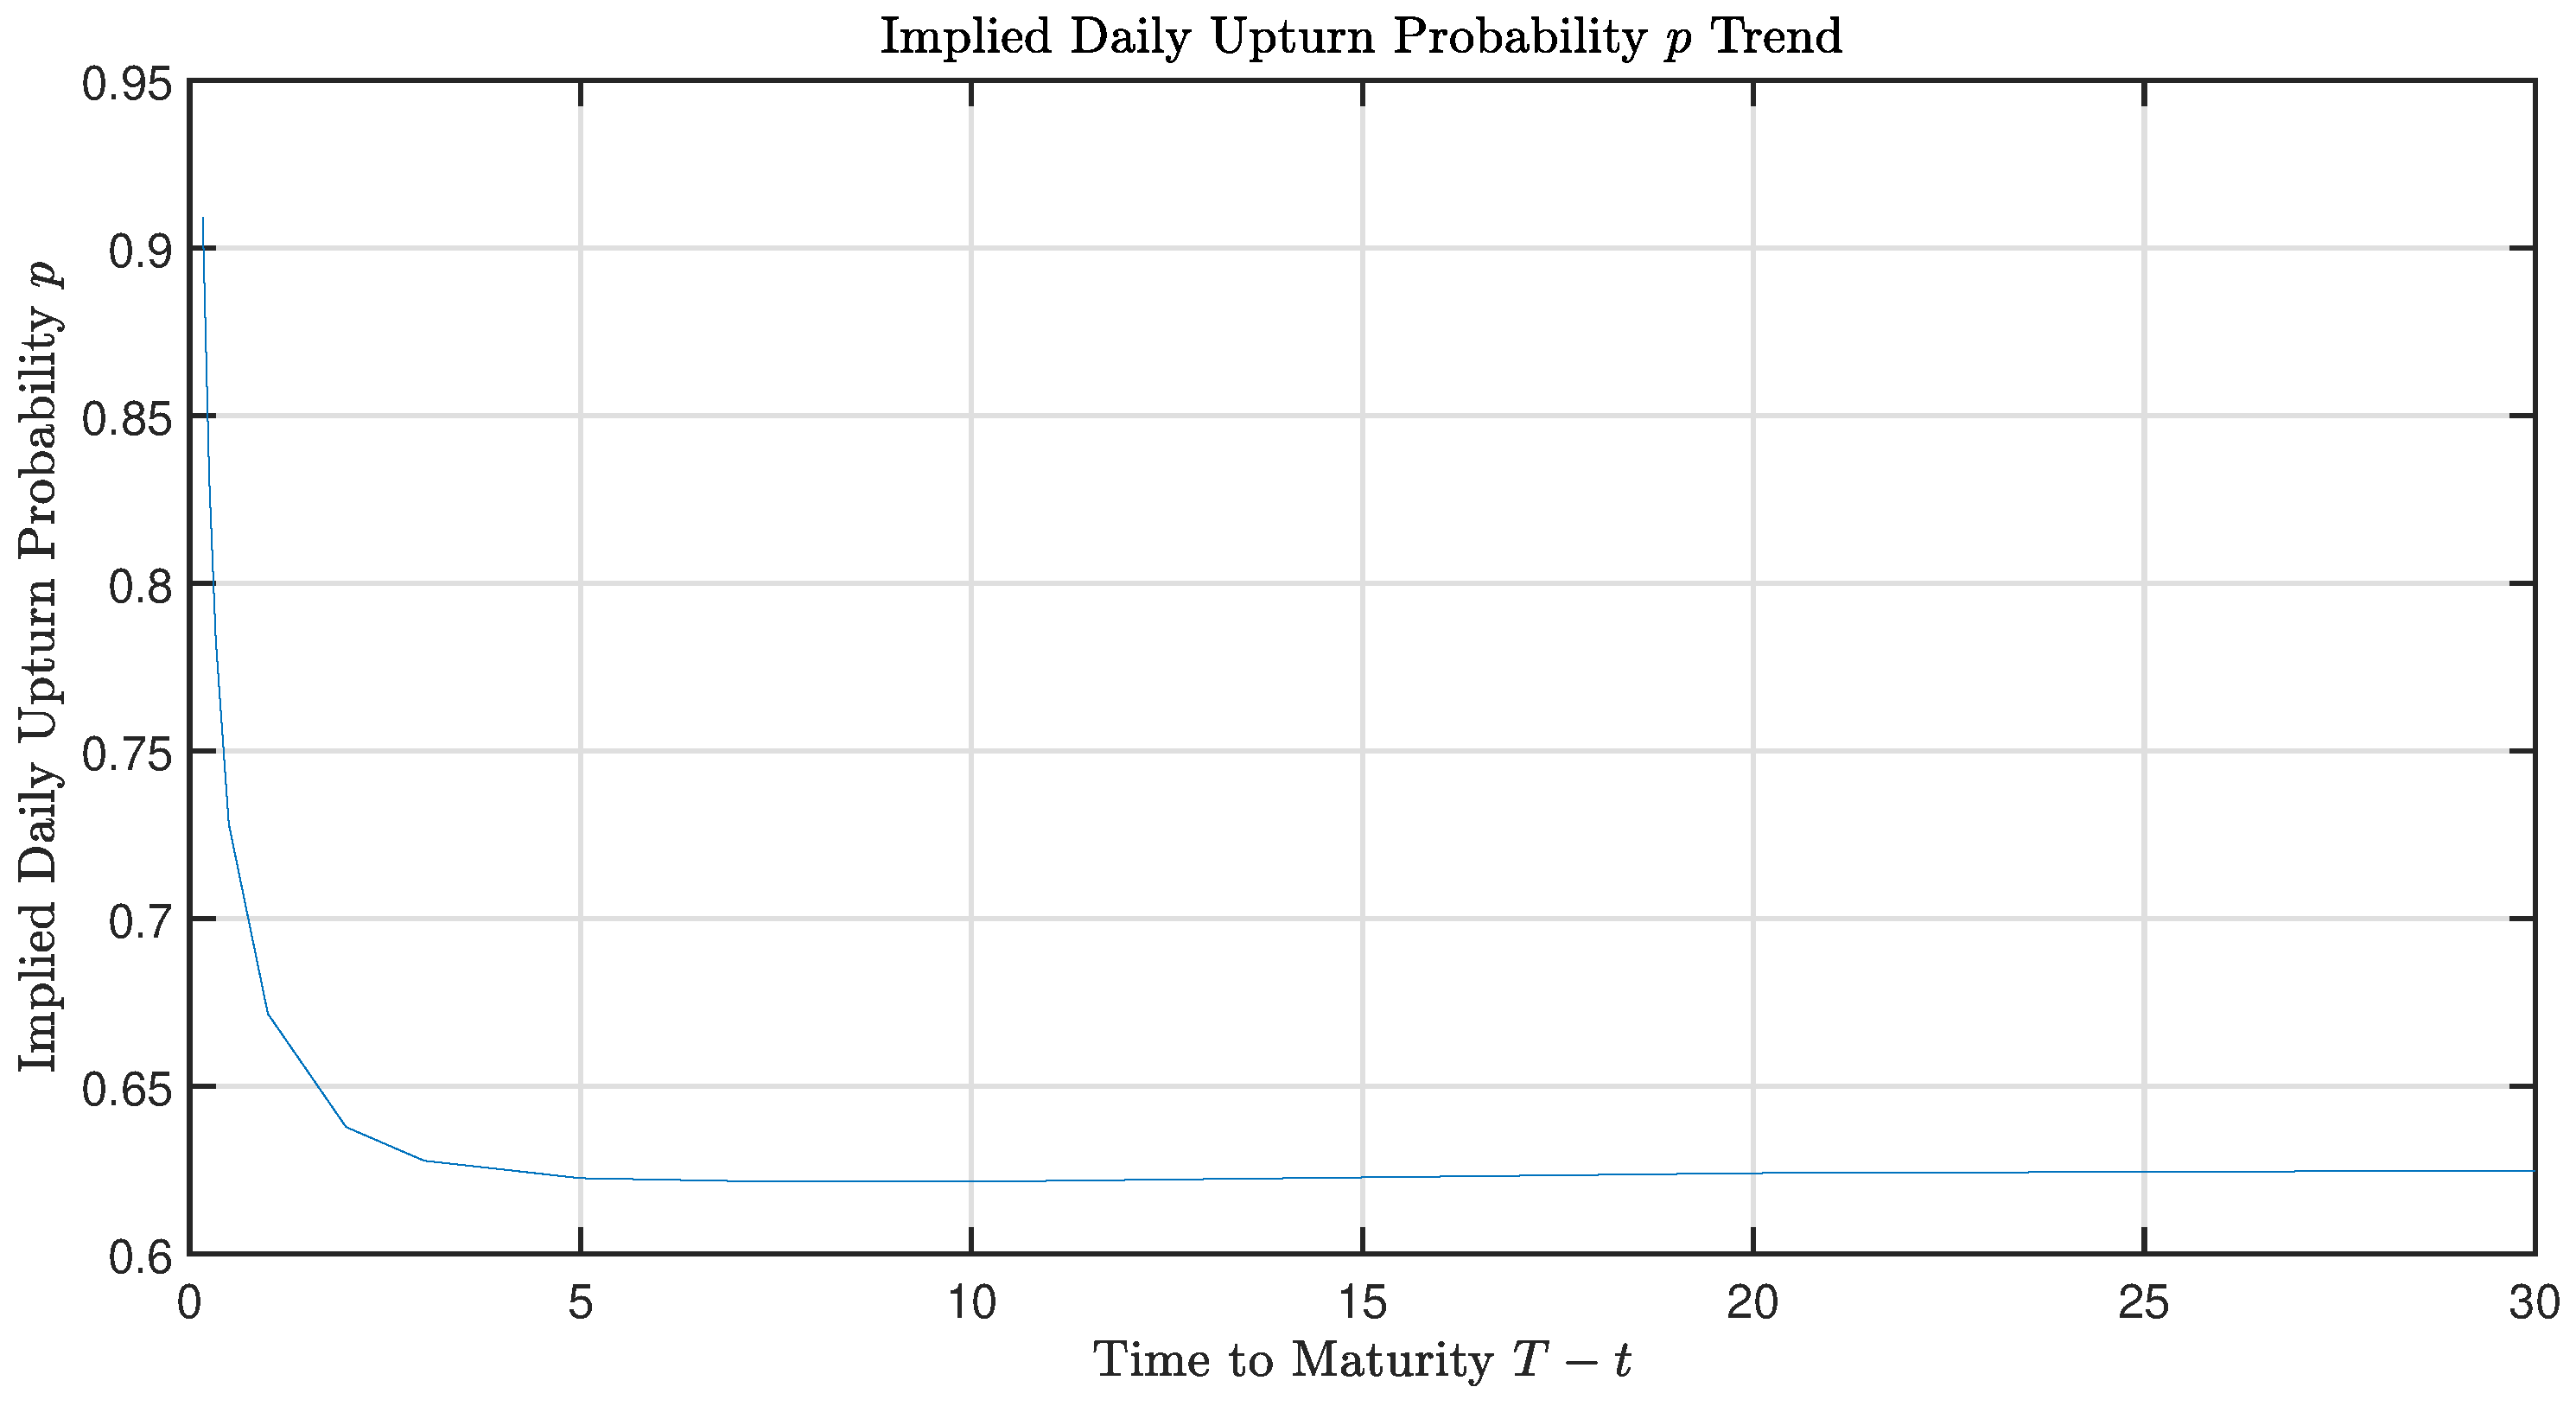
Figure 4.
Trend of the implied daily volatility.
Disclaimer/Publisher’s Note: The statements, opinions and data contained in all publications are solely those of the individual author(s) and contributor(s) and not of MDPI and/or the editor(s). MDPI and/or the editor(s) disclaim responsibility for any injury to people or property resulting from any ideas, methods, instructions or products referred to in the content. |
© 2023 by the authors. Licensee MDPI, Basel, Switzerland. This article is an open access article distributed under the terms and conditions of the Creative Commons Attribution (CC BY) license (http://creativecommons.org/licenses/by/4.0/).
Copyright: This open access article is published under a Creative Commons CC BY 4.0 license, which permit the free download, distribution, and reuse, provided that the author and preprint are cited in any reuse.


