Submitted:
28 August 2023
Posted:
29 August 2023
You are already at the latest version
Abstract
Due to its economic benefits and the ability to reduce carbon emissions on a large scale, the CCUS-EOR project has been widely promoted and implemented globally. By using carbon dioxide flooding, oil water transition zone reservoirs that were once considered worthless may have new potential for development because of its rich geological reserves and high quality carbon sequestration conditions. Unlike water flooded layer, the oil in the TZ is unsaturated rather than residual oil after water flooding, which would lead to special oil-water seepage law of initial oil saturation. It is necessary to clarify special oil-water seepage law of oil-water transition zone to evaluate its production & storage potential. In this paper, we present a series of experiments to characterize the relationship between residual oil saturation and initial oil saturation. Cores in four different permeability and oil in four different viscosity are used to simulate different reservoir conditions, and that CO2 immiscible flooding experiments for each cores permeability and oil viscosity are performed with four different initial oil saturation. A total of 36 sets of CO2 flooding experiment data are used to draw the initial oil saturation & residual oil saturation chart. The results show that the residual oil saturation depends on the initial oil saturation rather than constant under certain conditions of core and oil. Under the condition of low permeability and high oil viscosity, the influence of initial oil saturation on residual oil saturation is relatively strong. The initial oil saturation & residual oil saturation chart can accurately calculate the residual oil saturation, initial water cut and final recovery based on the core permeability, oil viscosity and the initial oil saturation which is the first time to put forward this kind of chart and of the great significance to evaluate the recovery potential of the TZ.
Keywords:
transition zone
; initial oil saturation
; residual oil saturation
; permeability
; oil viscosity
1. Introduction
Under the continental sedimentary background, oil reserves in reservoirs in the oil-water transition zones (TZ) in China are rich. According to the preliminary estimation, the geological reserves of 54 blocks are more than 820 million tons in China. In the past 30 years, with the development of conventional oil reservoirs by water injection, more than 90% of the oilfields have entered into the high water cut stage. Examples of oil reservoirs such as Weyburn in Canada and Jilin in China have shown that CO2 flooding can significantly improve oil recovery and increase crude oil production on the basis of water flooding. The TZ has the same water content and more enclosed storage space as the reservoir after water flooding, which can be an important strategic resource for CCUS-EOR. However, at the initial development stage, it is difficult to evaluate the development potential of such resources due to the high water cut. Therefore, such resources have not been effectively developed for a long time. It is urgent to make clear about the main controlling factors of residual oil saturation in reservoirs in the oil-water transition zone and clarify the oil-water seepage regularity in order to make clear about the exploitation potential of such resources.
In conventional oil-saturated oil reservoirs, the main influence factors on oil-water seepage and distribution of residual oil saturation are permeability and viscosity [1,2,3,4]. For the unsaturated crude oil in the oil-water transition zone, some scholars at home and abroad have verified that the initial oil saturation has certain influence on the oil-water seepage regularity and the residual oil saturation, but no quantitative study has been made on the influence law of the initial oil saturation on the residual oil saturation [5,6]. In this study, based on the results of a series of orthogonal Carbon dioxide(CO2)flooding experiments, considering the three main controlling factors of permeability, viscosity and initial oil saturation, the influence factor chart of initial oil saturation & residual oil saturation has been drawn. The chart can quantify the influence of initial oil saturation on oil-water seepage in unsaturated oil reservoirs, which can be used to calculate the key development parameters, such as the recovery factor, initial water cut and final recovery factor in original low-saturated reservoirs. According to the current search of literature, this is the first time that this chart is proposed at home and abroad. It is of great significance for evaluation of the exploitation potential of the reserves in the oil-water transition zone.
1. Experimental method
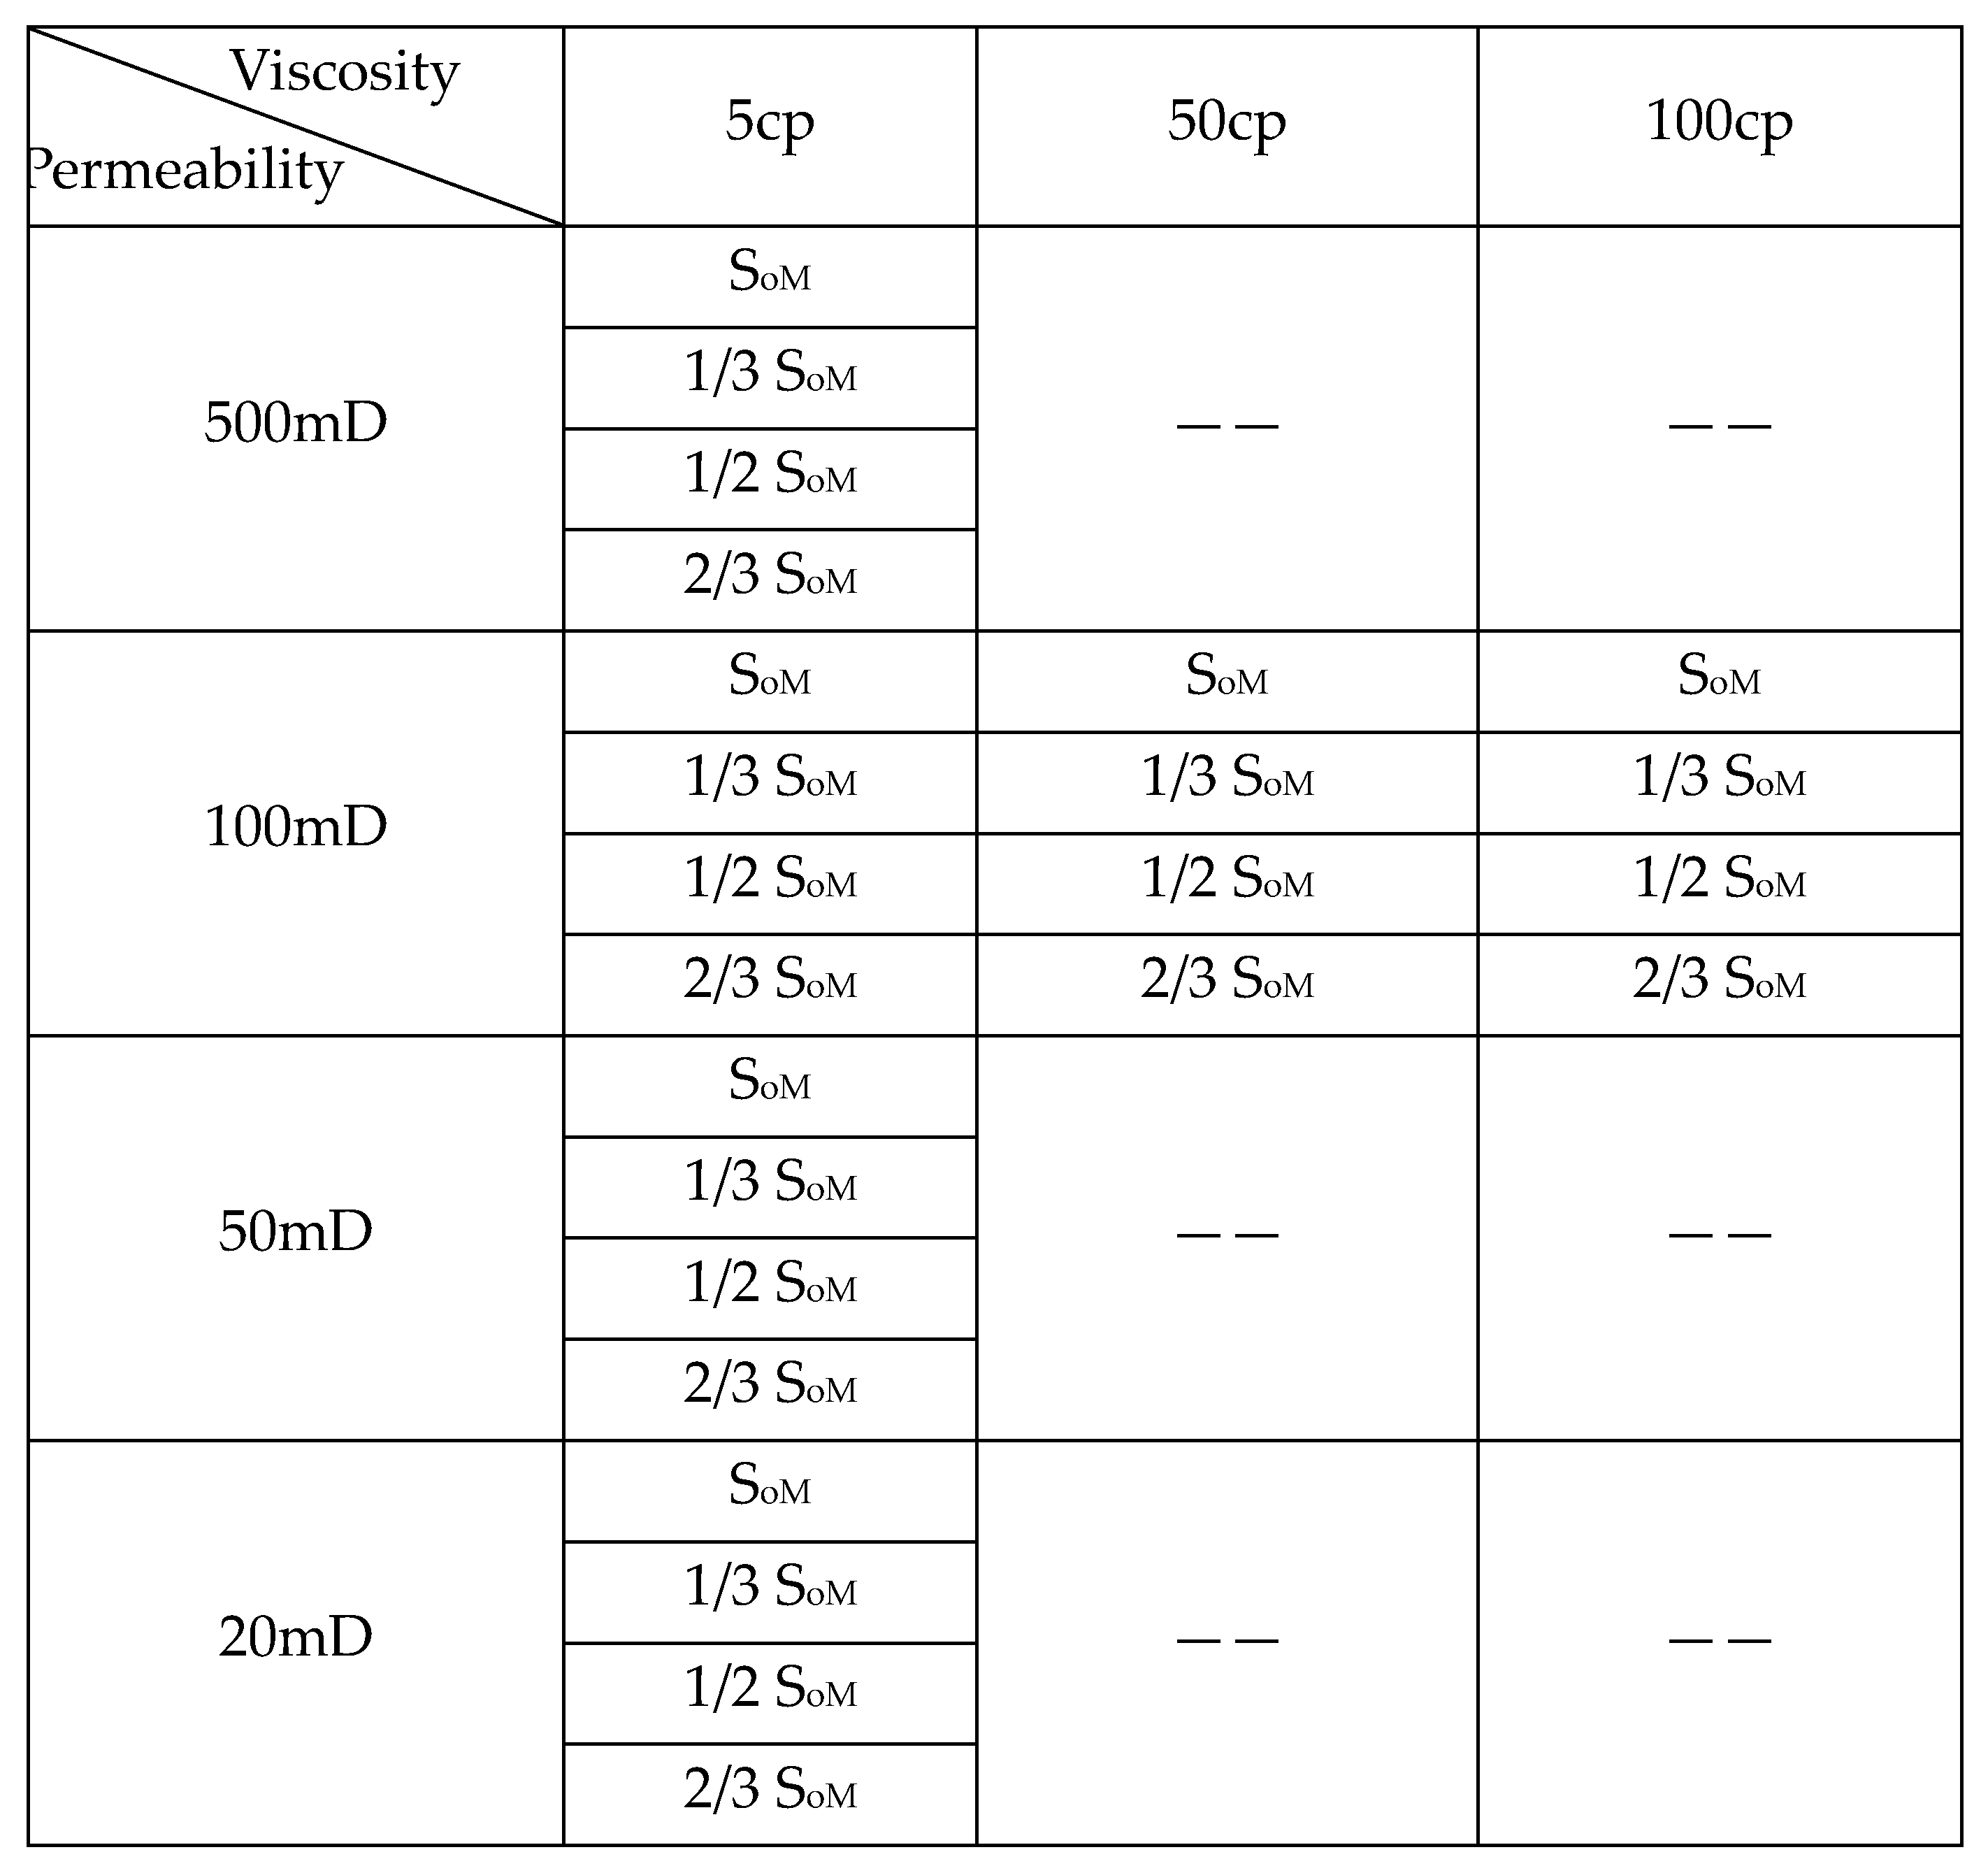
Compared with the conventional oil reservoirs at the top, the reservoirs in the oil-water transition zones are different in reservoir permeability and crude oil viscosity. Therefore, core permeability, crude oil viscosity, and initial oil saturation have been taken as three experimental variables. The core permeability was designed as 500mD, 100mD, 50mD, and 20mD; the crude oil viscosity was designed as 100cp, 50cp, and 5cp; the initial oil saturation was designed as complete saturation (SoM), half of the maximum oil saturation (1/2 SoM), one-third of the maximum oil saturation (1/ 3 SoM), and two-thirds of the maximum oil saturation (2/3 SoM). The specific experiment arrangement is as follows:

Table 1.
Experimental design for study on seepage regularity of unsaturated crude oil.
2. Simulation method
In the oil-water transition zone, the formation mechanism of the oil saturation distribution can be described as follows: due to the capillary force of the reservoir, the area between the pure oil zone of the reservoir and the free water interface is an interval of oil layers, with oil saturations decreased gradually, rather than an abrupt interface. According to the principle of capillary force, after simplifying the reservoir into a capillary model, the smaller the pore radius of the rock, the higher the water column would be formed, leading to the results that the crude oil in the oil-water transition zone mainly exists in larger pore spaces [7,8,9,10].
In this study, the core of the experiment is the simulation of the state of unsaturated crude oil in the core. When using the crude oil saturation method of conventional flooding, the injected crude oil is often concentrated at the injection end. In order to be more consistent with the occurrence of crude oil in the oil-water transition zone, the entire core should be uniformly unsaturated with crude oil, and the crude oil should mainly be distributed in larger pore spaces. In this study, with the principle of capillary force, through repeated experimental verification, a core centrifugal saturation method has been proposed. The initial oil saturation of the core is controlled by the size of the centrifugal force.
The results of CT scanning (Figure 1) have verified that with the centrifugal saturation method, the saturation state of crude oil with different initial oil saturations in the core can be obtained more uniformly, and the crude oil is mainly contained in larger pore spaces, which is consistent with the real state of the reservoirs in the oil-water transition zone.
3. Experimental results
Due to the increase of heavy components in the TZ crude oil, which makes it difficult to mix with CO2, CO2 immiscible flooding is chosen as the displacement method. By comparing the results of a series of experiments, it has been found from Figure 2 that the unsaturated crude oil has a larger movable oil interval during CO2 flooding. Under the same permeability condition, the residual oil saturation decreases with the decrease of the initial oil saturation, rather than a constant value. Moreover, the lower the permeability, the stronger the influence of initial oil saturation on residual oil saturation. This may be related to the proportion of dominant seepage pore space in the overall pore space. Crude oil will preferentially saturate dominant seepage pores in the process of saturation, and the CO2 drive efficiency of dominant seepage pores is also relatively higher. Therefore, in contrast to the fully saturated crude oil state, the unsaturated crude oil state has a greater proportion of crude oil saturated in the dominant seepage pores and the oil displacement efficiency is correspondingly higher. When the initial oil saturation is lower than 40%, the viscosity of crude oil has little influence on the residual oil saturation, and the residual oil saturation basically does not change with the initial oil saturation. When the initial oil saturation is greater than 40%, under the same crude oil viscosity conditions, the higher the initial oil saturation, the higher the residual oil saturation.
Based on the above experimental results, it can be inferred that during the development process by CO2 injection, with the decreasing in initial oil saturation, the residual oil saturation in the oil-water transition zone will decrease accordingly. When calculating the production potential, the recovery factor should be dynamic variables, determined by the initial oil saturation and reservoir conditions. If constant residual oil saturation is used to calculate the recoverable reserves in the transition zone, the exploitation potential will be underestimated. Compared with the conventional oil reservoirs saturated with crude oil at the top, the reservoirs in the oil-water transition zone have relatively higher crude oil viscosity. Many scholars believe that the residual oil saturation is higher in the transition zone than that of conventional oil-saturated reservoirs as the viscosity is higher. In this paper, through a series of scientific comparison experiments, it is proved that when the viscosity of crude oil is between 1 and 100 cp and the initial oil saturation is lower than 40%, the viscosity has little influence on the residual oil saturation. Under the conditions of low permeability and high viscosity conditions, the control degree of initial oil saturation over residual oil saturation is relatively strong. Therefore, the influence of initial oil saturation on CO2 flooding efficiency should be fully considered when calculating the recovery factor.
4. Calculation chart of residual oil saturation in the oil-water transition zone
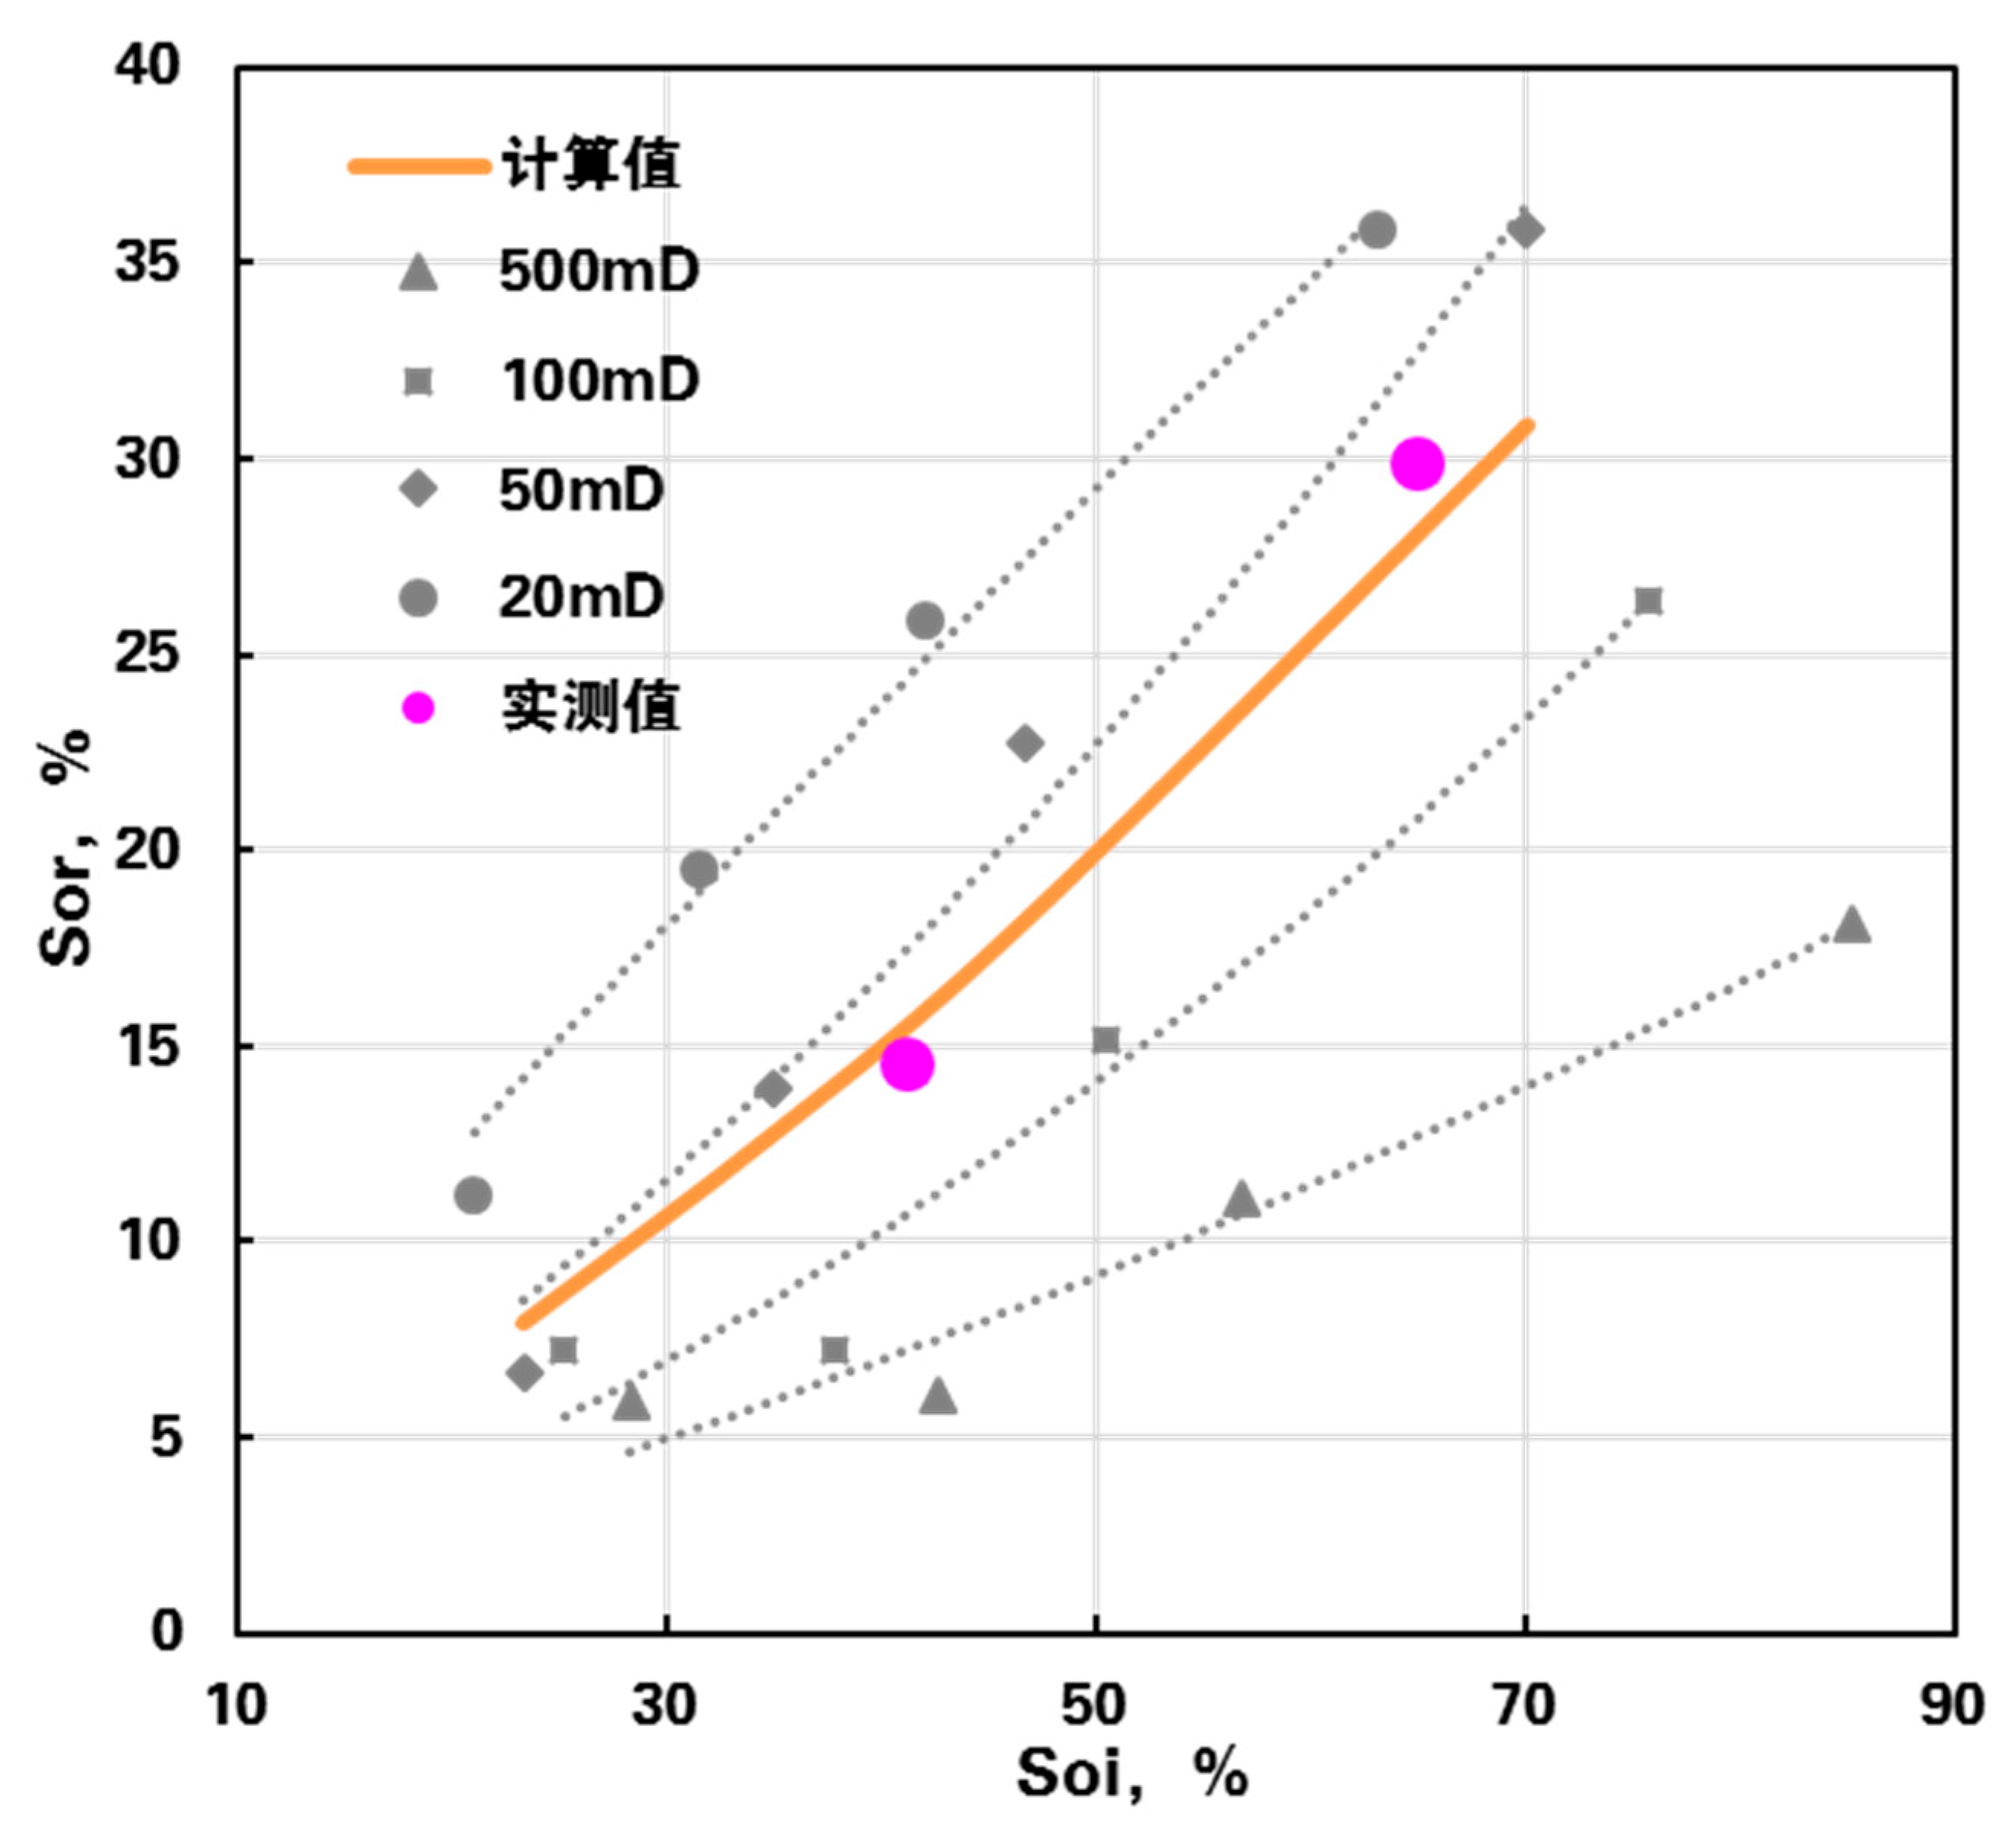
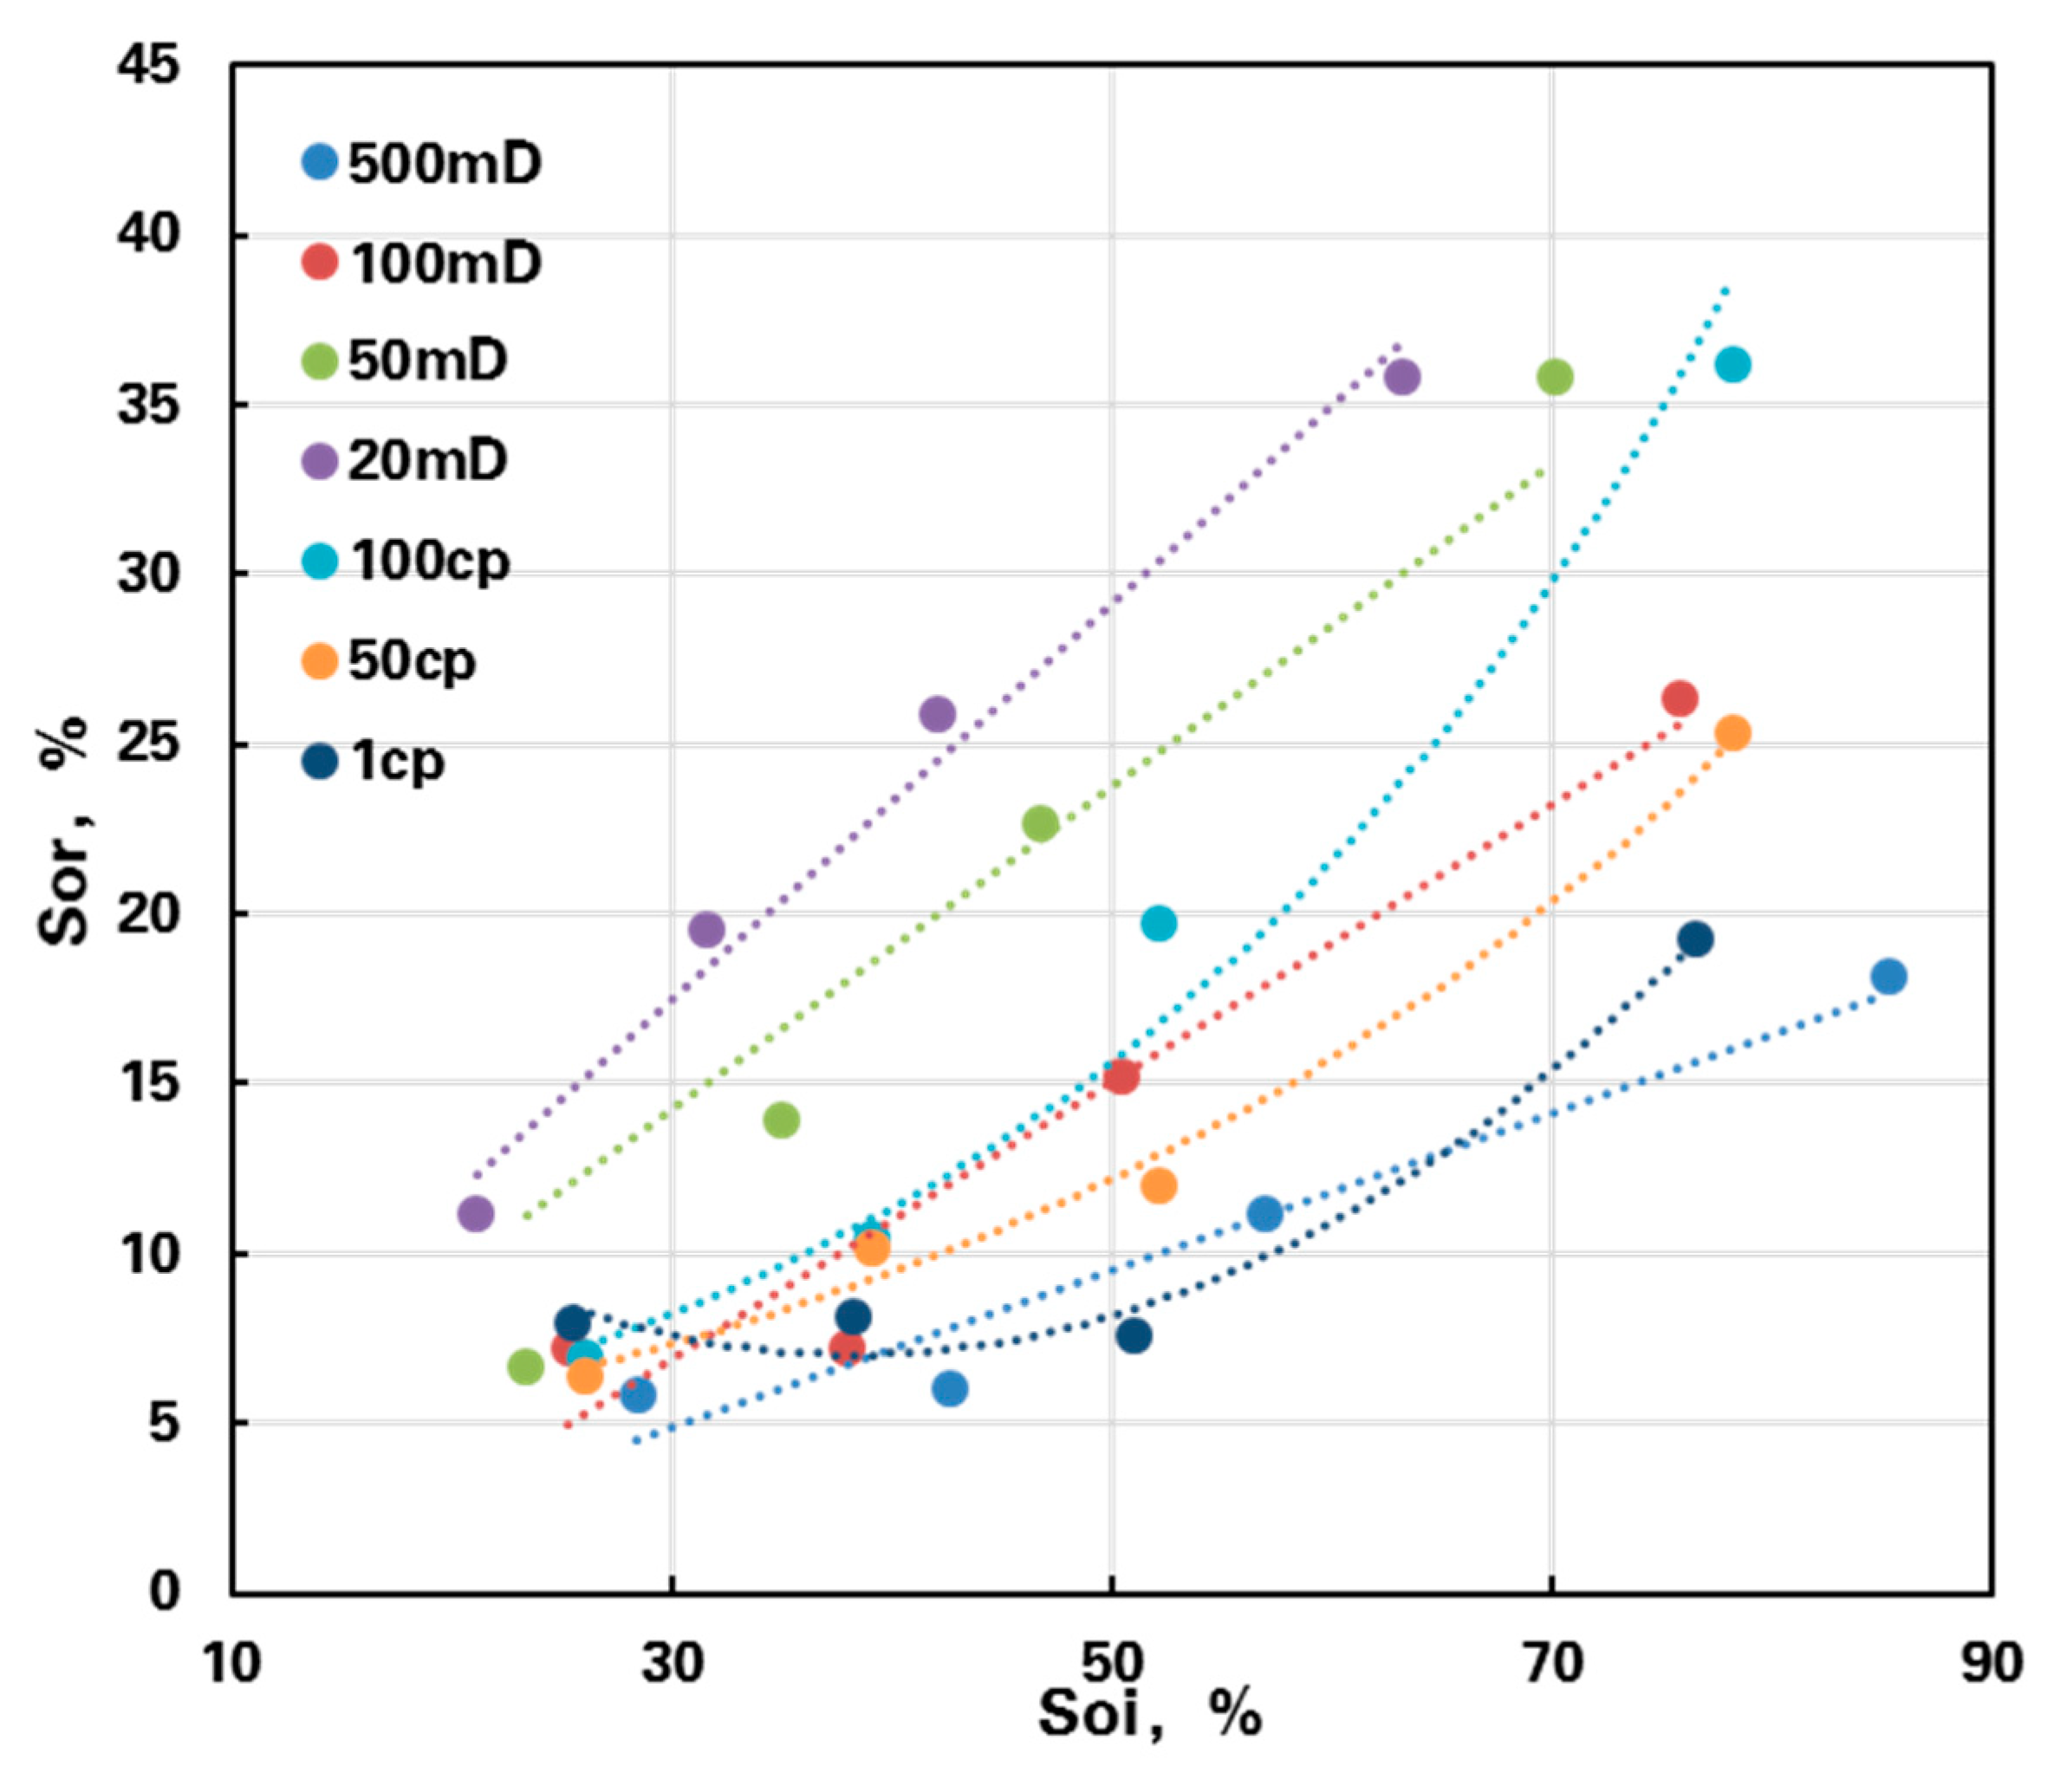
Based on the results of the above 28 sets of CO2 flooding experiments, the initial oil saturation & residual oil saturation calculation chart in the oil-water transition zone has been drawn (see Figure 4) by considering the three main controlling factors of permeability, viscosity, and initial oil saturation. This chart can be used to calculate the key development parameters, including the recovery factor, initial water cut, and final recovery factors of various reservoirs with low initial oil saturation. According to the situation of literature searching, this is the first time that this chart is proposed at home and abroad, which is of great significance for evaluation of the production potential of such reserves. By using the core and oil test data of Daqingzi Reservoir in Jilin to verify the accuracy of this chart, the prediction accuracy of core residual oil saturation is above 90%
The residual oil saturation is divided into two parts controlled by permeability and viscosity respectively. By determining the permeability, viscosity and initial oil saturation, data are fitted with different calculation methods, such as using difference and empirical parameters according to the shape of the experimental data curve. The fitting formula established is as follows:
In the formula, Sor refers to the residual oil saturation, %; θ refers to the fitting coefficient of viscosity difference, mPa•s-1; α refers to the viscosity control coefficient, which is dimensionless; β refers to the permeability control coefficient, mD; Soi refers to the initial oil saturation, %; k refers to permeability, mD; μ refers to crude oil viscosity, mPa•s.
With the oil-water transition zone of the Daqingzijing oil reservoir in Jilin as an example, two natural cores in the target reservoir were obtained, with the permeability of 53.3mD and 52mD, and the crude oil viscosity under formation conditions was 5cp. CO2 flooding experiments were carried out under reservoir conditions. The initial oil saturation was 41.2% and 65.2%, and the residual oil saturation after CO2 flooding was 14.6% and 29.9%. The calculated residual oil saturation was 15.6% and 32.6%, and the fitting accuracy was 92%. In the traditional calculation method, unified residual oil saturation was used to calculate the recoverable reserves in the oil-water transition zone. By using the chart to conduct the dynamic correlation between the initial oil saturation and the residual oil saturation, the recoverable reserves in the oil-water transition zone can be calculated by clarifying the relationship between the initial oil saturation and the residual oil saturation. In this way, the exploitation potential of such reserves can be re-understood, which is worthy of promotion.
Figure 5.
Verification of the prediction accuracy of the influence factors of Jilin core (K=53.3mD and 52mD).
Figure 5.
Verification of the prediction accuracy of the influence factors of Jilin core (K=53.3mD and 52mD).

5. Conclusion
- With the centrifugal saturation method, the saturation state of crude oil with different initial oil saturation in the oil-water transition zone can be restored to the greatest extent through the relationship between centrifugal force and crude oil saturation, and the crude oil is mainly contained in larger pore spaces.
- In unsaturated oil reservoirs, the residual oil saturation is not a constant value. With the decreasing in initial oil saturation, the residual oil saturation will become lower. The lower the permeability, the greater influence the initial oil saturation has on the residual oil saturation. When the initial oil saturation is lower than 40%, the viscosity of crude oil has little influence on the residual oil saturation. When the initial oil saturation is greater than 40%, under the same crude oil viscosity, the higher the initial oil saturation, the greater the residual oil saturation.
- Based on the capillary force-phase permeability fractal model, a key variable, initial oil saturation, was added to establish the chart evaluation method of residual oil saturation, forming a three-dimensional control model based on the core permeability, oil viscosity, and the initial oil saturation. Based on 36 sets of CO2 flooding experiment results, the chart has been drawn, which can be used to calculate the residual oil saturation and evaluate the production potential of typical reservoirs.
References
- Loahardjo N, Xie S X, Winoto W, et al. Oil Recovery by Sequential Waterflooding: the Influences of Aging at Residual Oil and Initial Water Saturation. Tulsa, Oklahoma, USA: Society of Petroleum Engineers, 2012.
- El Din Saad Ibrahim A S. Investigation of the Mobilization of Residual Oil Using Micromodels. Society of Petroleum Engineers, 129515-STU, 2009.
- Thomas E C, Ausburn B E. Determining Swept-Zone Residual Oil Saturation in a Slightly Consolidated Gulf Coast Sandstone Reservoir. Society of Petroleum Engineers, 5803-PA, 1979.
- Hicks, P.J., Jr.; Deans, H.A.; Narayanan, K. Distribution of Residual Oil in Heterogeneous Carbonate Cores Using X-Ray CT. SPE Formation Evaluation 1992, 7, 235–240. [Google Scholar] [CrossRef]
- Shehadeh, K. High oil recoveries from transition zones. Society of petroleum engineers 2000. 2000.
- Liu Bolin. Study on genesis and seepage characteristics of low oil saturation reservoir. 2008.
- Koperna G J, Melzer L S, Kuuskraa V A. Recovery of Oil Resources From the Residual and Transitional Oil Zones of the Permian Basin. San Antonio, Texas, USA. Society of Petroleum Engineers, 2006.
- Masalmeh S K. High Oil Recoveries from Transition Zones. Society of Petroleum Engineers, 87291-MS, 2000.
- Gao, H.; Sun, W.; Gao, J.; et al. Characteristics of microscopic pore throat and movable fluid in ultra-low permeability sandstone reservoir. Petroleum Geology and Development in Daqing 2011, 30, 89–93. [Google Scholar]
- Chen, J.; Wada, N. A New Technique for Visualizing the Distribution of Oil, Water, and Quartz Grains in a Transparent, Three-Dimensional, Porous Medium. SPE Formation Evaluation 1986, 1, 205–208. [Google Scholar] [CrossRef]
Figure 1.
CT verification results of centrifugal saturation method (core permeability is 100mD).
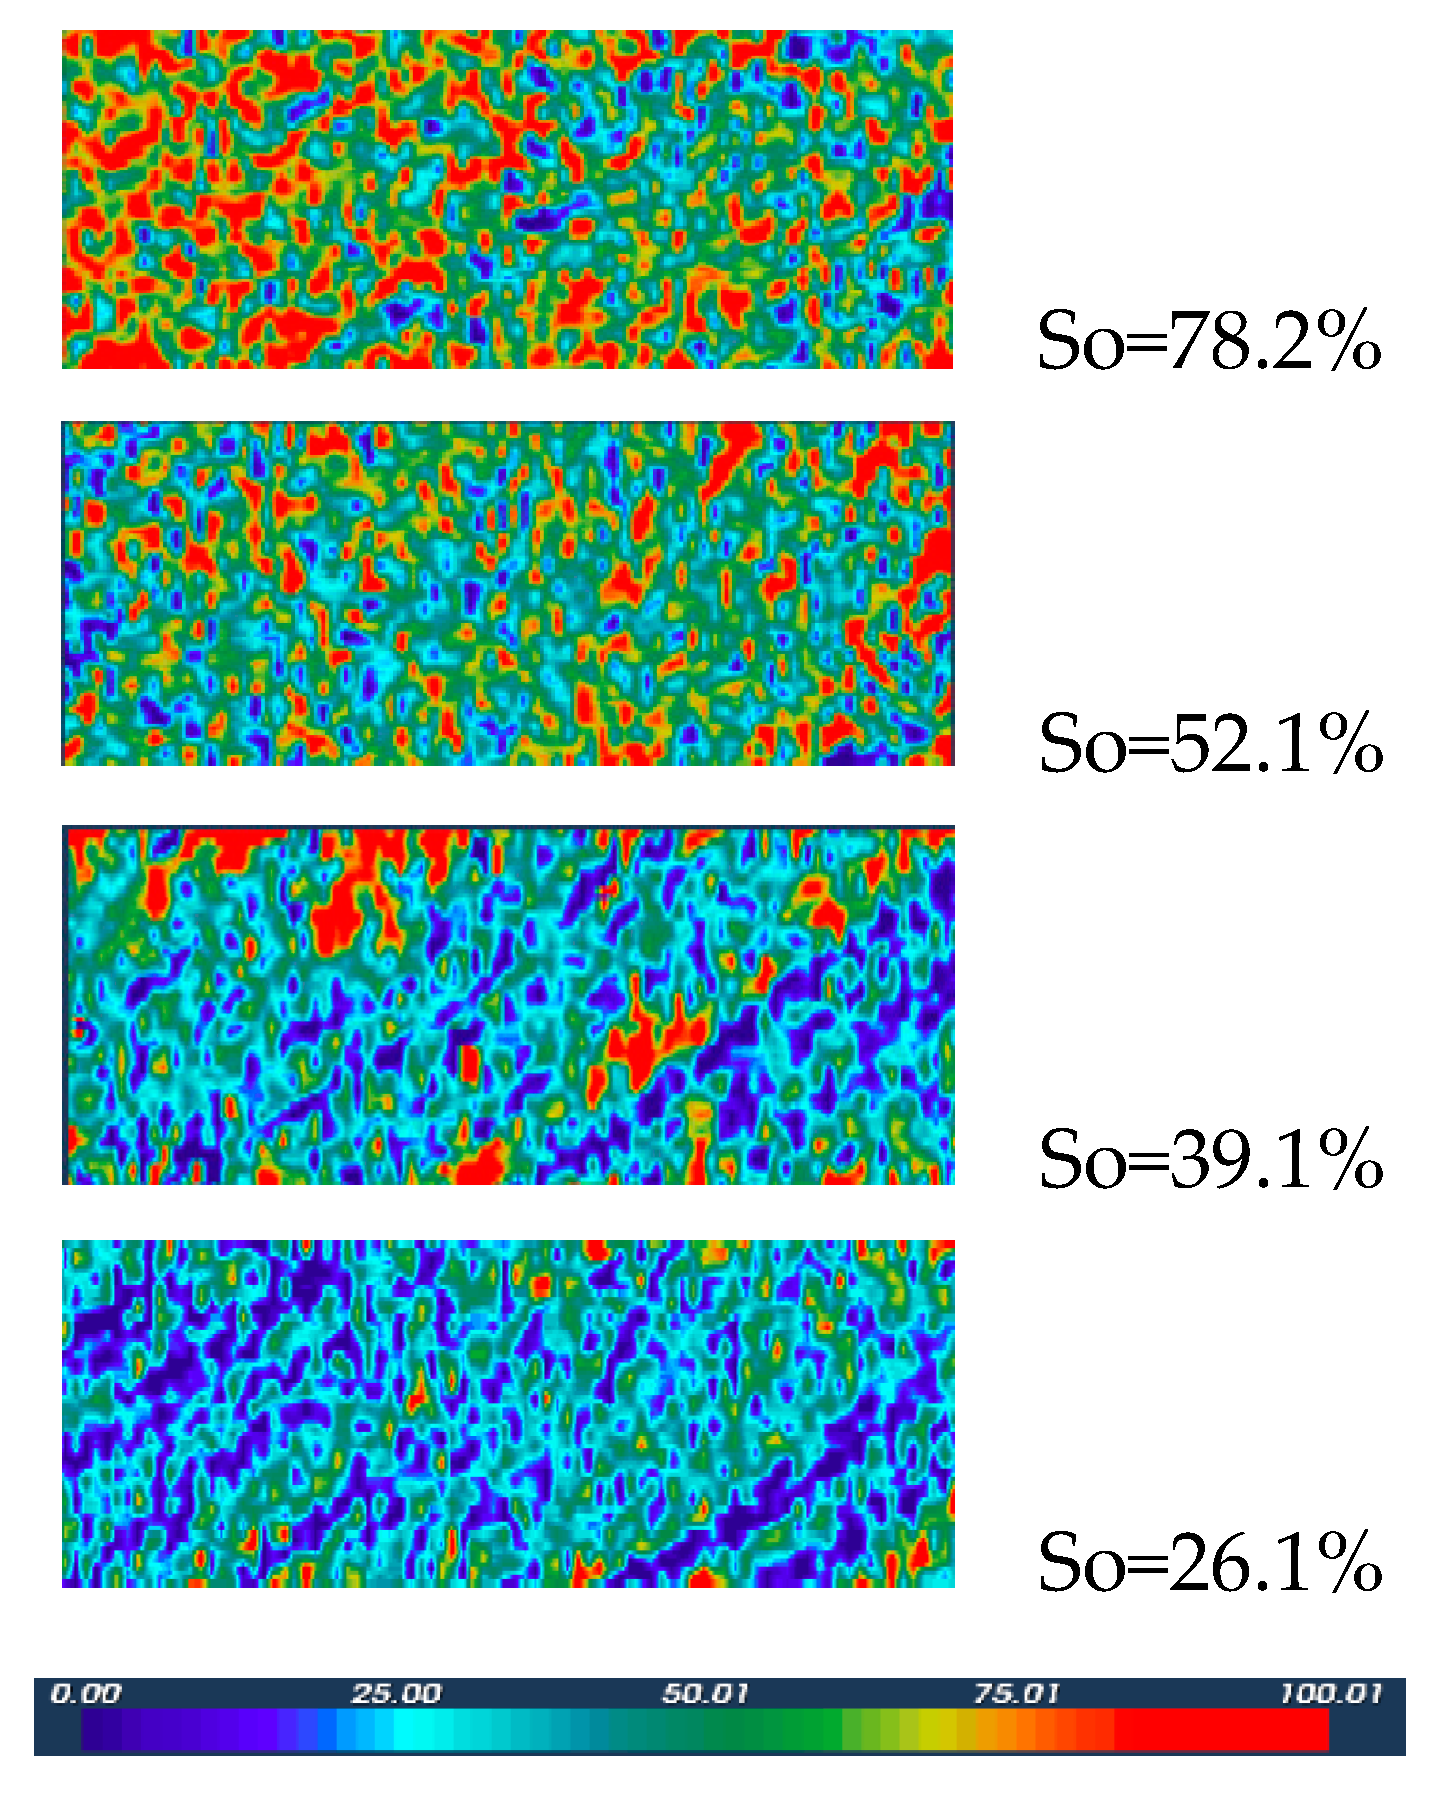
Figure 2.
The influence of permeability and initial oil saturation on residual oil saturation after CO2 flooding.
Figure 2.
The influence of permeability and initial oil saturation on residual oil saturation after CO2 flooding.
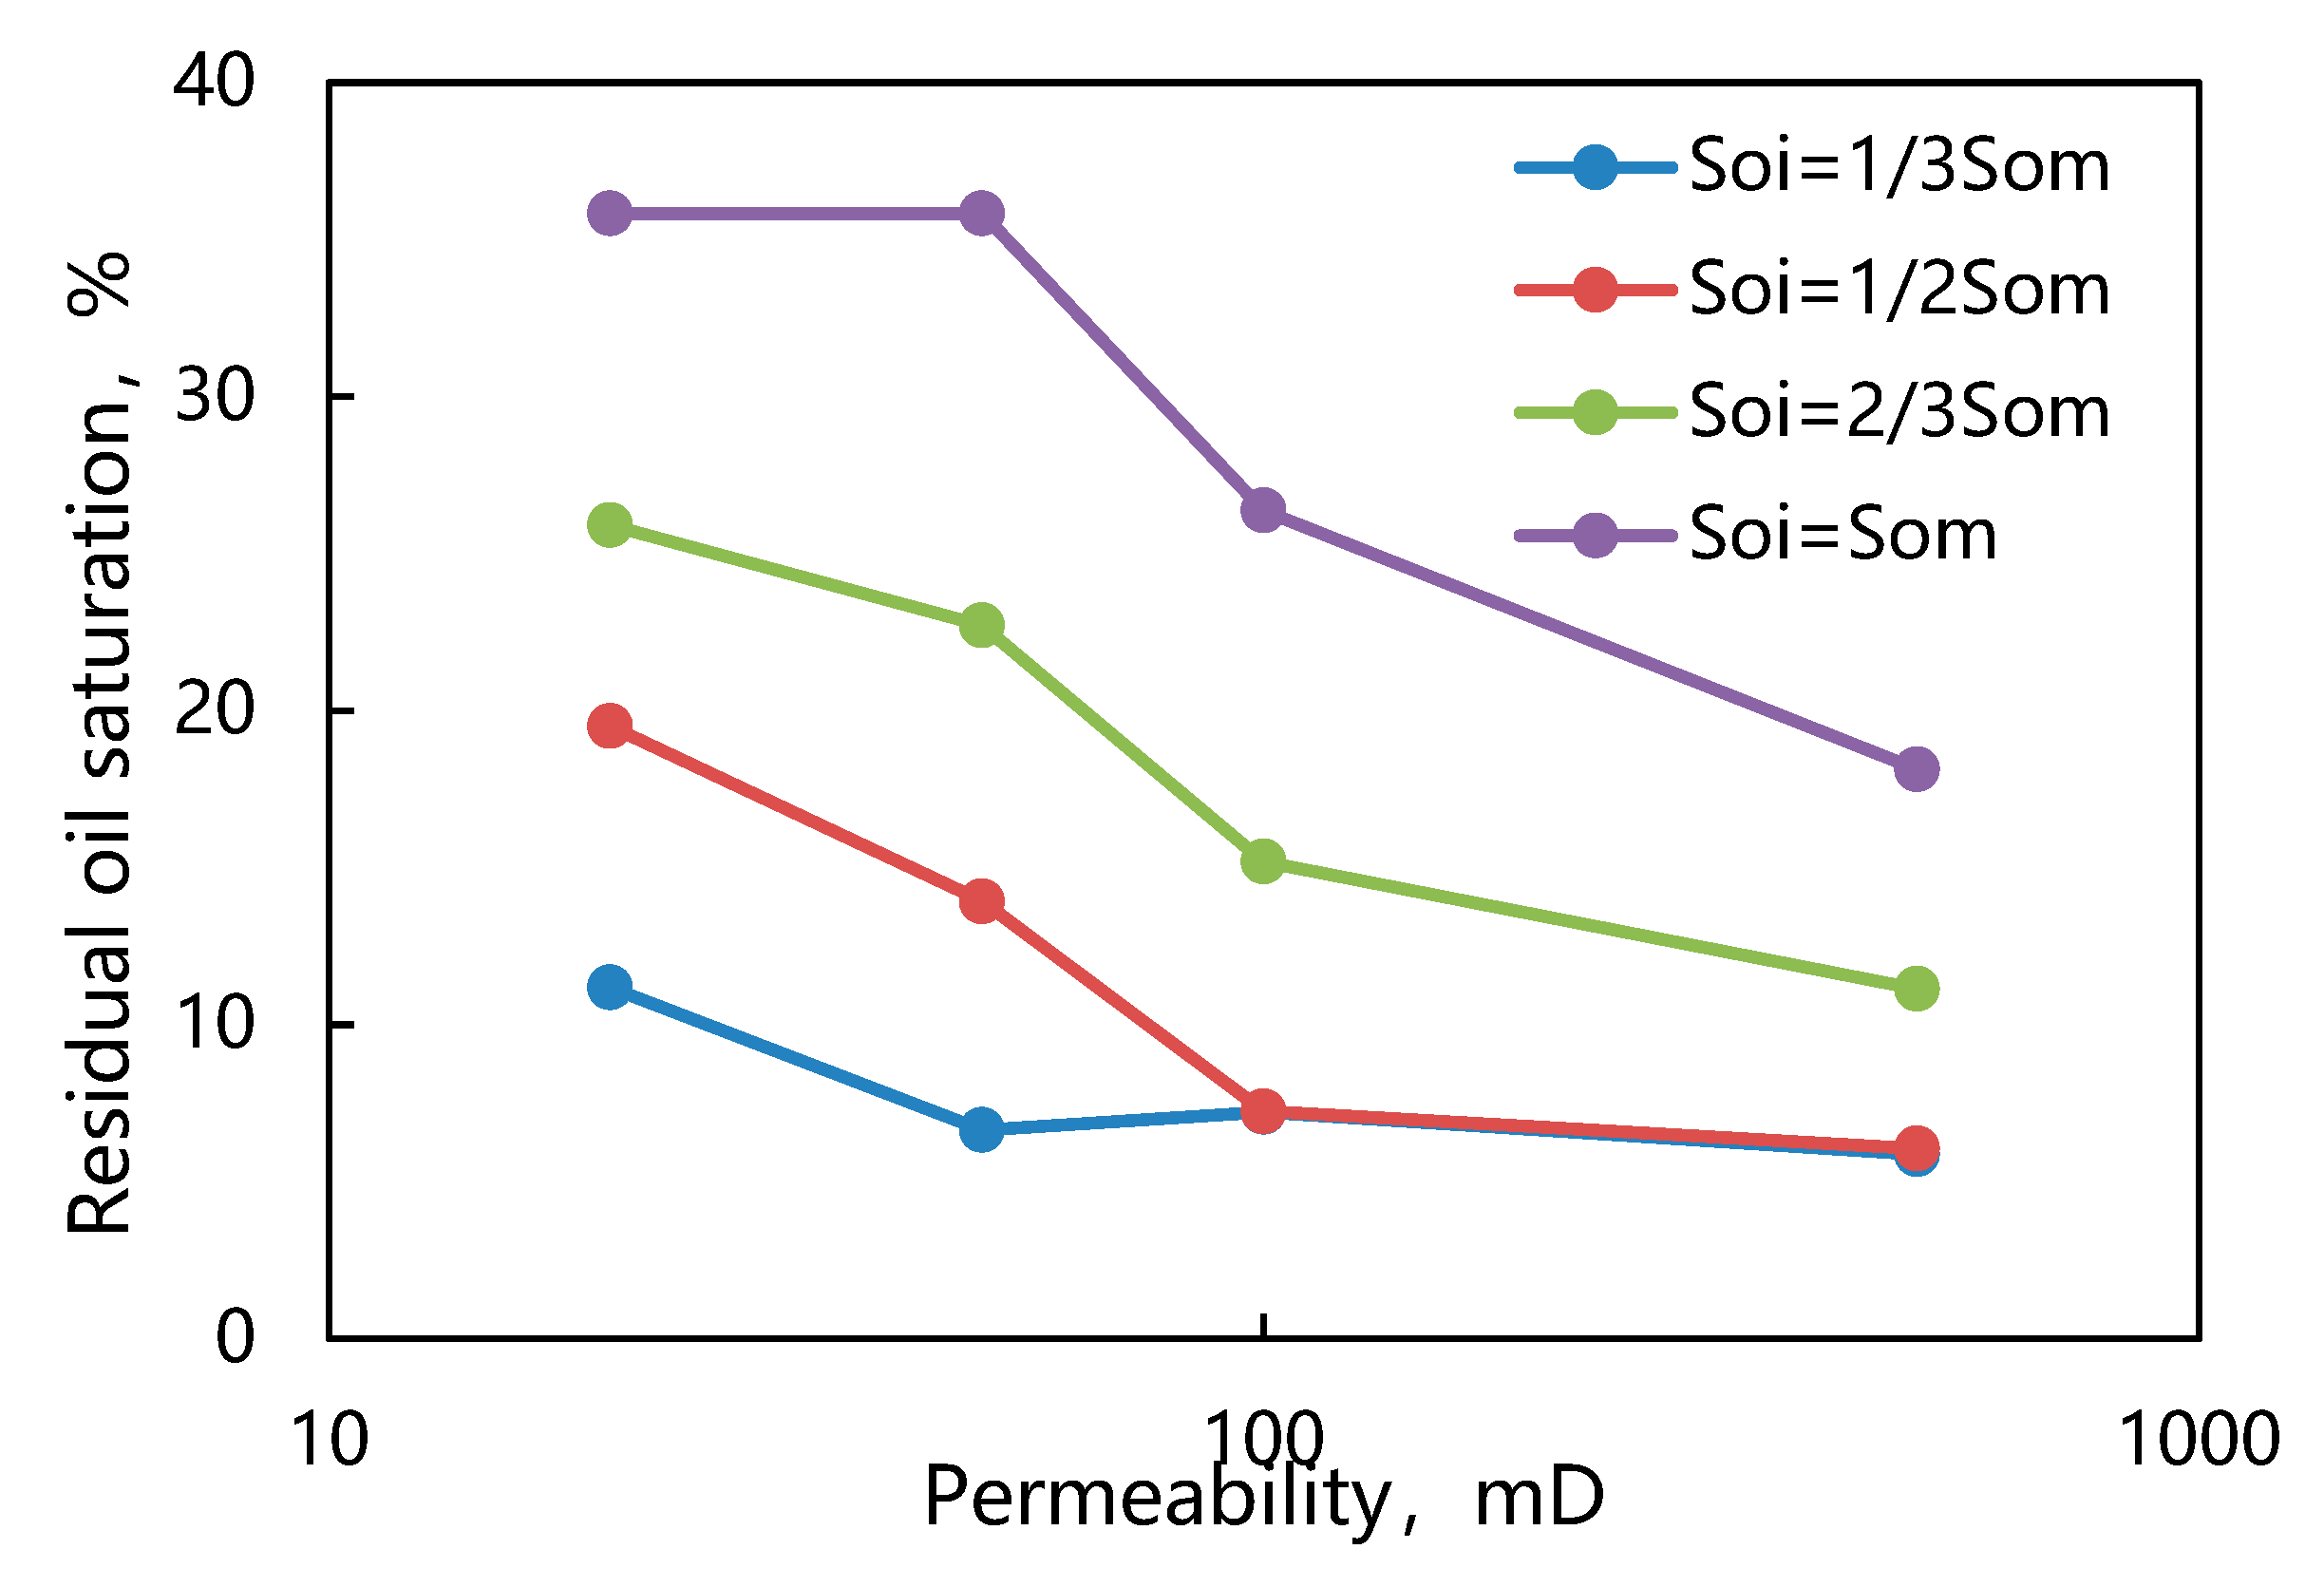
Figure 3.
The influence of viscosity and initial oil saturation on residual oil saturation after CO2 flooding.
Figure 3.
The influence of viscosity and initial oil saturation on residual oil saturation after CO2 flooding.
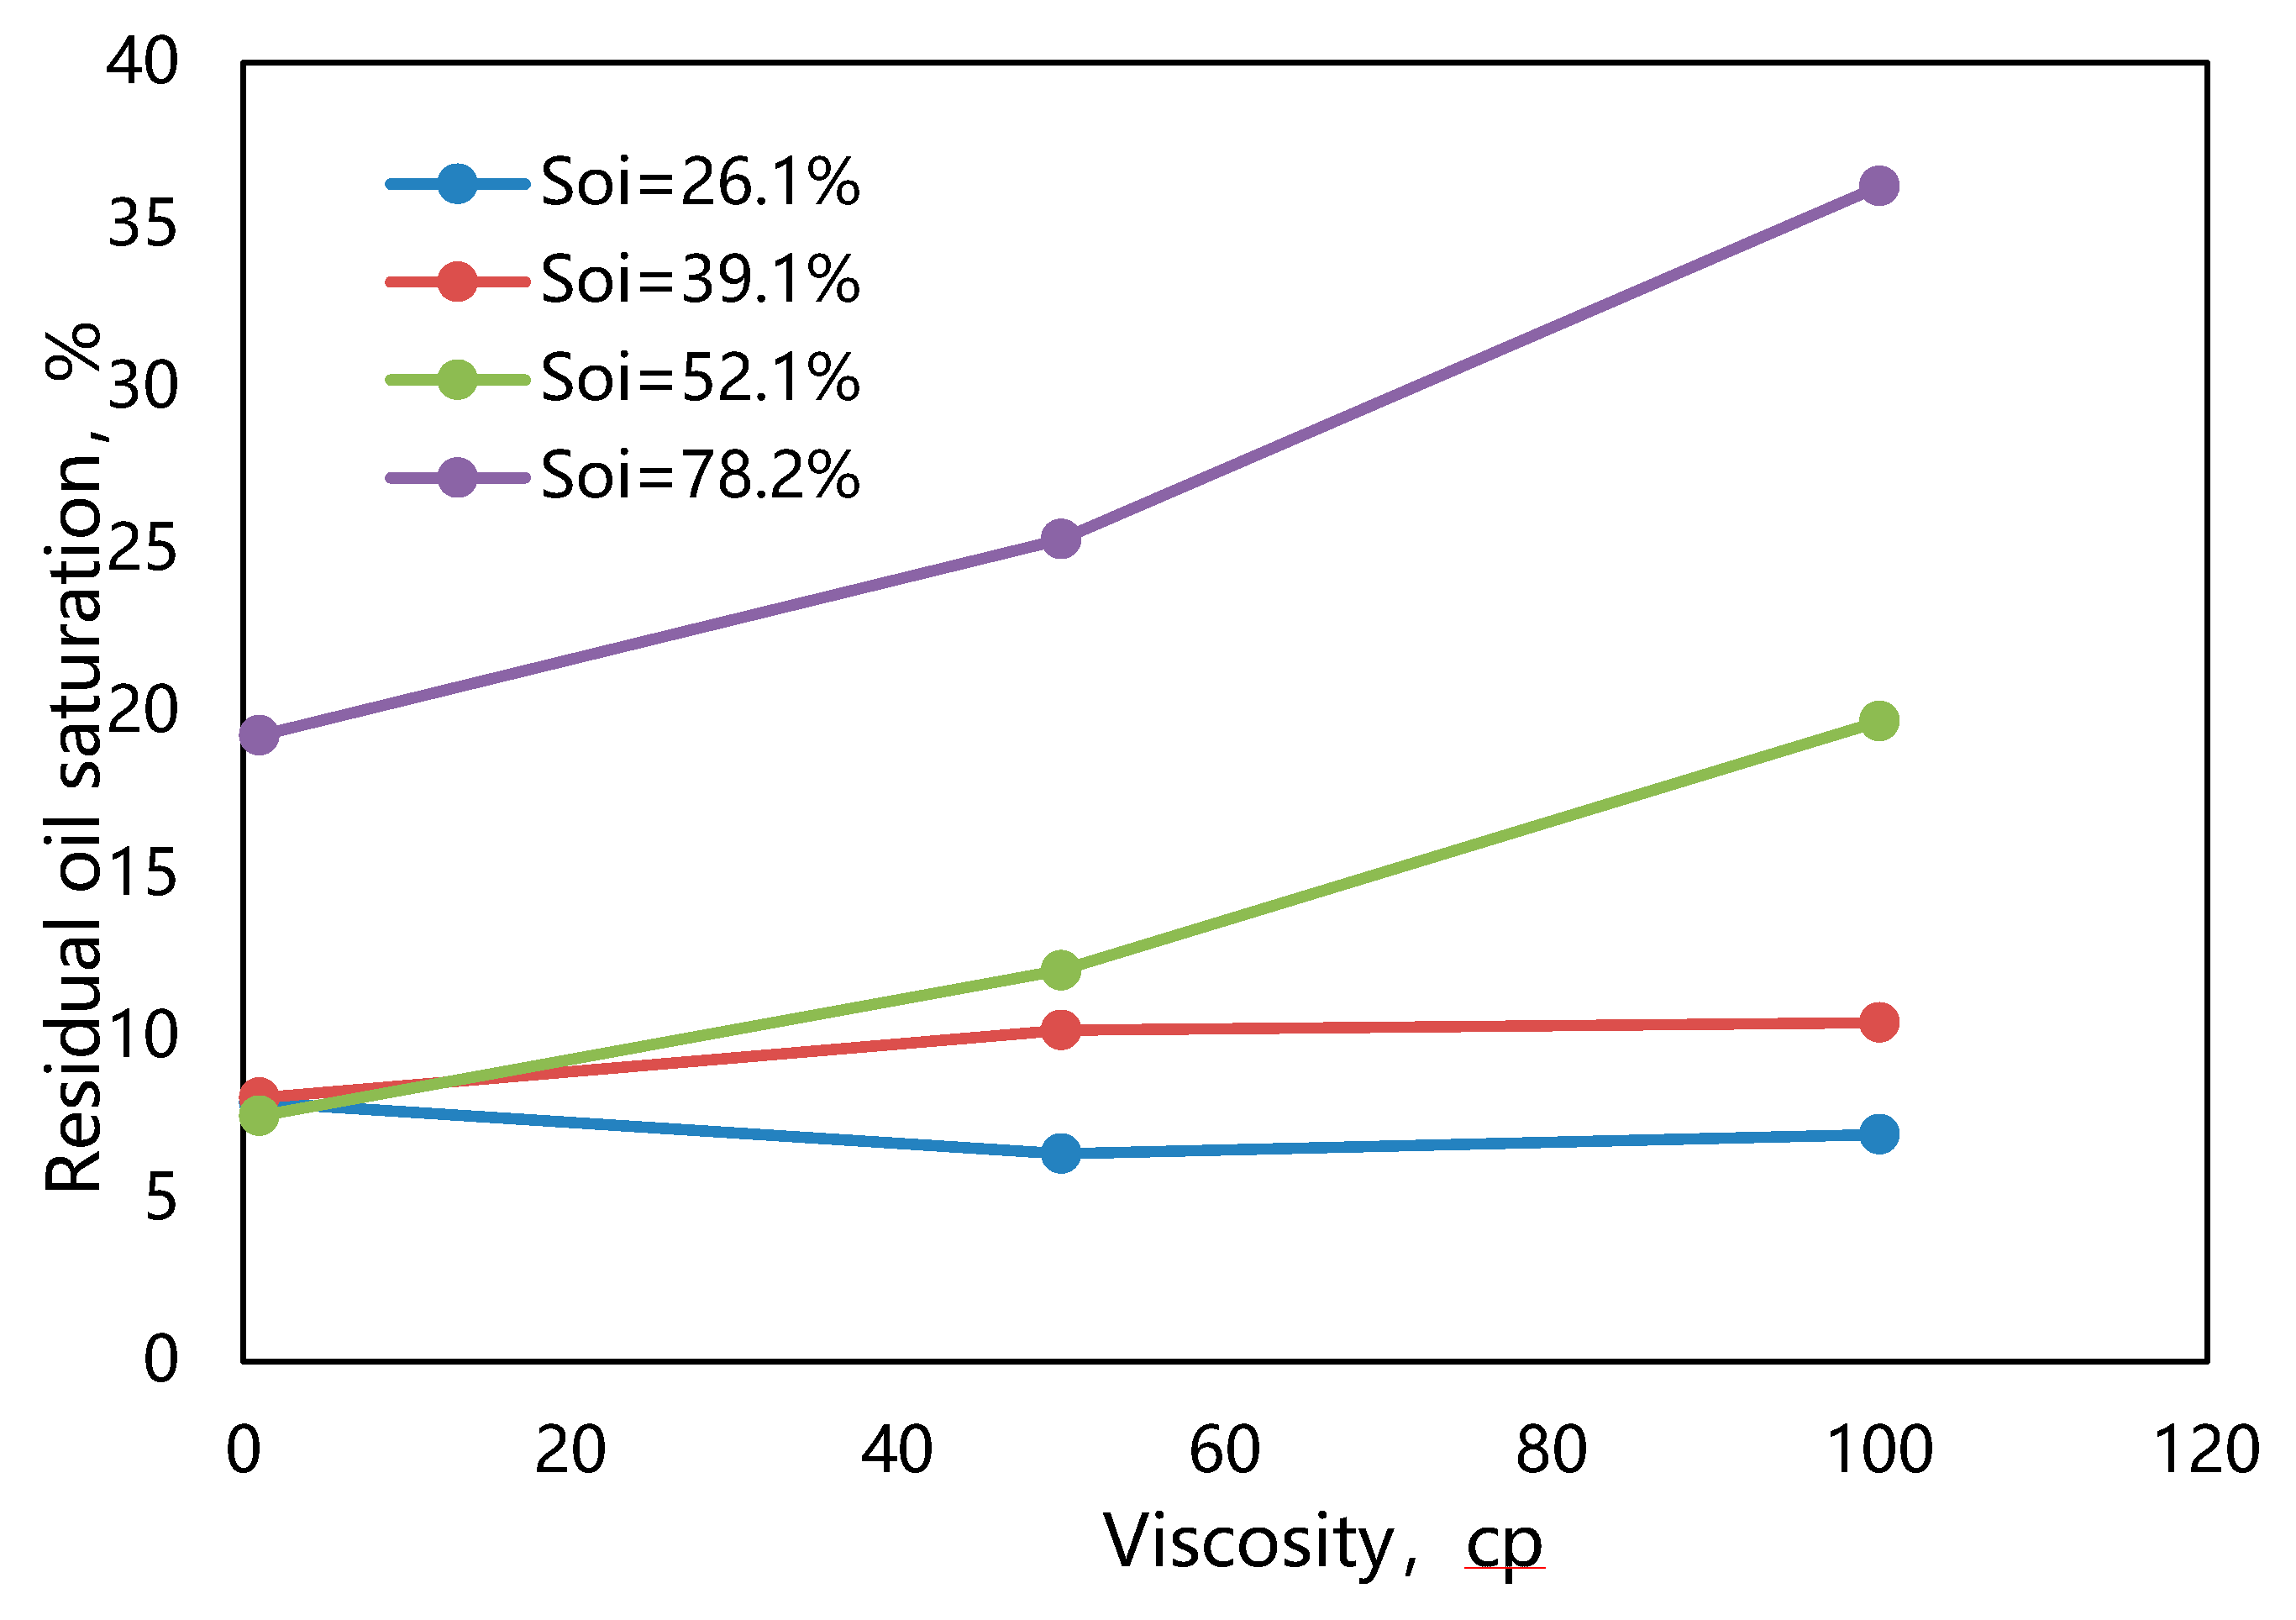
Figure 4.
The calculation chart of residual oil saturation in the oil-water transition zone.
Disclaimer/Publisher’s Note: The statements, opinions and data contained in all publications are solely those of the individual author(s) and contributor(s) and not of MDPI and/or the editor(s). MDPI and/or the editor(s) disclaim responsibility for any injury to people or property resulting from any ideas, methods, instructions or products referred to in the content. |
© 2023 by the authors. Licensee MDPI, Basel, Switzerland. This article is an open access article distributed under the terms and conditions of the Creative Commons Attribution (CC BY) license (http://creativecommons.org/licenses/by/4.0/).
Copyright: This open access article is published under a Creative Commons CC BY 4.0 license, which permit the free download, distribution, and reuse, provided that the author and preprint are cited in any reuse.


