Submitted:
21 August 2023
Posted:
22 August 2023
You are already at the latest version
Preprints on COVID-19 and SARS-CoV-2
Abstract
Abstract: A prevalence boundary (PB) marks the point in prevalence where the false omission rate, RFO=FN/(TN+FN), exceeds the tolerance limit for missed diagnoses. Objectives were to mathematically analyze rapid antigen test (RAgT) performance, determine why PBs are breeched, and evaluate the merits of testing three times over five days, now required by the US Food and Drug Administration for asymptomatic persons. Equations were derived to compare test performance patterns, calculate PBs, and perform recursive computations. An independent July 2023 FDA-university-commercial evaluation of RAgTs provided performance data used in theoretical calculations. Tiered sensitivity/specificity comprise: Tier-1) 90%, 95%; Tier-2) 95%, 97.5%; and Tier-3) 100%, ≥99%, respectively. Repeating a T2 test improves the PB from 44.6% to 95.2% (RFO 5%). In the FDA-university-commercial evaluation, RAgTs generated sensitivity of 34.4%, which improved to 55.3% when repeated, then 68.5% with the third test. With RFO=5%, PBs were 7.37/10.46/14.22%, respectively. PB analysis suggests RAgTs should achieve clinically proven sensitivity of 91.0-91.4%. When prevalence exceeds PBs, missed diagnoses can perpetuate virus transmission. Repeating low-sensitivity RAgTs delays diagnosis. In homes, high-risk settings, and hotspots, PB breaches may prolong contagion, defeat mitigation, facilitate new variants, and transform outbreaks into endemic disease. Molecular diagnostics can help avoid these potential vicious cycles
Keywords:
Coronavirus disease-2019 (COVID-19)
; Emergency Use Authorization (EUA)
; false negative (FN)
; false omission rate (RFO)
; point-of-care testing (POCT)
; prevalence boundary (PB)
; rapid antigen test (RAgT)
; repeated testing
; sensitivity and specificity
; tier
1. Introduction
The high specificity of Coronavirus disease-19 (COVID-19) rapid antigen tests (RAgTs) helps minimize false positives, although at very low prevalence (e.g., <2%), they may appear [1]. However, RAgTs typically fail to reliably rule out infections because poor clinical sensitivity produces false negative results [1,2,3]. The prevalence boundary (PB) is defined as the prevalence at which the rate of false omissions, RFO = FN/(TN+FN), exceeds a specified threshold, such as 5% or 1 in 20 diagnoses missed because of false negatives [2].
The objectives are to mathematically reveal patterns of RAgT performance, to understand intrinsic limitations imposed on RAgT performance, to determine why PBs are breeched, and to evaluate the merits of repeating RAgTs twice at intervals of 48 hours over 5 days for a total of 3 tests, which is the temporal protocol now required by the US Food and Drug Administration (FDA) for people who are asymptomatic. The overall goal is to develop a sound mathematical basis for improving RAgTs well in advance of the next pandemic
2. Methods
2.1. Viewpoint
The viewpoint here is “post hoc” Bayesian conditional probability, that is, the perspective of the healthcare provider or self-testing layperson who must judge whether a positive COVID-19 test result is believable, and likewise, decide whether or not to trust a negative test result. For quantitative 2 x 2 tables illustrating how prevalence affects test performance and generates false negatives, please see Table 3, Table 4, Table 5 and Table 6 in reference [1].
2.2. Tiers and Mathematical Foundations
Table 1 presents the performance tiers and quantitates the effects of repeating tests on prevalence boundaries when RFO is 5% [1,2,3]. Tier 2 performance produces a PB of 95.2% upon repeating a test, numerically about the same as the sensitivity of 95%. A Tier 3 test has clinical sensitivity [TP/(TP + FN)] of 100% and thus, no false negatives (FN). It does not need to be repeated unless it is necessary to rule out a false positive.

Table 1.
Diagnostic Performance Tiers with Systematic Prevalence Boundaries for Repeated Tests.
| Tier | Performance Level | Sensitivity [%] | Specificity [%] | Prevalence Boundary for RFO of 5% 1st Test [%] 2nd Test [%] ∆PB [%] |
||
|---|---|---|---|---|---|---|
| 1 | Low | 90 | 95 | 33.3 | 82.6 | 49.3 |
| 2 | Marginal | 95 | 97.5 | 50.6 | 95.2 | 44.6 |
| 3 | High | 100 | ≥ 99 | No Boundary | No Boundary | — |
Abbreviations: PB, prevalence boundary; ∆PB, the gain in PB from repeating the test; and RFO, the rate of false omissions (missed diagnoses).
Table 2 lists the equations, dependent variables, and independent variables used to graph RFO versus prevalence [Eq. 21] and the gain in PB (∆PB) [Eq. 26] following repetition of a test versus its sensitivity. Please note that the righthand side of Eq. 26 for ∆PB does not depend on prevalence, per se. A graph based on Eq. 26 shows how ∆PB changes with sensitivity.
Table 2 also lists the equations used to determine the RFO for a repeated test (RFO/rt) [Eq. 22], the PB for one test given the RFO [Eq. 24], and the PB for a repeated test (PBrt) given the RFO [Eq. 25]. Eqs. 22, 25, and 26 were newly derived and verified for this research.
Table 2.
Fundamental Definitions, Derived Equations, Ratios, Rates, Predictive Value. Geometric Mean-squared, Prevalence Boundary, Recursion, and Special Cases
Table 2.
Fundamental Definitions, Derived Equations, Ratios, Rates, Predictive Value. Geometric Mean-squared, Prevalence Boundary, Recursion, and Special Cases
| Eq. No. | Category and Equations | Dep. Var. | Indep. Var. |
|---|---|---|---|
| Fundamental Definitions | |||
| 1 | x = Sens = TP/(TP + FN) | x | TP, FN |
| 2 | y = Spec = TN/(TN + FP) | y | TN, FP |
| 3 | s = PPV = TP/(TP + FP) | s | TP, FP |
| 4 | t = NPV = TN/(TN + FN) | t | TN, FN |
| 5 | p = Prev = (TP + FN)/N | p | TP, FN, N |
| 6 | N = TP + FP + TN + FN | N | TP, FP, TN, FN |
| Derived Equations | |||
| 7 | PPV = [Sens•Prev]/[Sens•Prev + (1-Spec)(1-Prev)], ors = [xp]/[xp + (1-y)(1-p)] — symbolic version of the equation above | s | x, y, p |
| 8 | p = [s(y-1)]/[s(x + y - 1) - x] | p | x, y, s |
| 9 | x = [s(p-1)(y-1)]/[p(s-1)] | x | y, p, s |
| 10 | y = [sp(x-1) + s - px]/[s(1-p)] | y | x, p, s |
| 11 | NPV = [Spec•(1-Prev)]/[Prev•(1–Sens) + Spec•(1–Prev)], or t = [y(1–p)]/[p(1–x) + y(1–p)] | t | x, y, p |
| 12 | p = [y(1-t)]/[t(1 - x - y) + y] | p | x, y, t |
| 13 | x = [pt + y(1-p)(t-1)]/[pt] | x | y, p, t |
| 14 | y = [pt(x-1)]/[t(1-p) – 1 +p] | y | x, p, t |
| Ratios | |||
| 15 | TP/FP = PPV/(1-PPV) = [Sens•Prev]/[(1-Spec)(1-Prev)], or [xp]/[(1-y)(1-p)] | TP/FP Ratio | x, y, p |
| 16 | FP/TP = (1-PPV)/PPV = [(1-y)(1-p)]/(xp) | FP/TP Ratio | x, y, p |
| 17 | FN/TN = (1-NPV)/NPV = [p(1-x)]/[y(1-p)] | FN/TN Ratio | x, y, p |
| Rates | |||
| True positive (RTP), false positive (RFP), & positive (RPOS) | |||
| 18 | RTP = TP/(TP + FN) = x | RTP | TP, FN |
| 19 | RFP = FP/(TN + FP) = 1 – Spec = 1- y | RFP | TN, FP |
| 20 | RPOS = (TP + FP)/N | RPOS | TP, FP, N |
| False Omission (RFO) | |||
| 21 | RFO = FN/(TN + FN) = 1 – NPV = 1- t = [p(1-x)]/[p(1-x) + y(1-p)] | RFO | x, y, p |
| RFO with repeated test (rt) | |||
| 22 | RFO/rt = [p(1-x)2]/[p(1-x)2 + y2(1-p)] | RFO/rt | x, y, p |
| Predictive value geometric mean-squared (range 0 to 1) | |||
| 23 | PV GM2 = PPV•NPV = s•t = {[xp]/[xp + (1-y)(1-p)]}• {[y(1–p)]/[p(1–x) + y(1–p)]} | PV GM2 | x, y, p |
| Prevalence Boundary | |||
| Prevalence boundary for one test given RFO | |||
| 24 | PB = y(1-t)/[(1-x) - (1-t)(1-x-y)] = [yRFO]/[(1-x) -RFO(1-x-y)] = [yRFO]/[RFO(x+y-1) + (1-x)] | PB | x, y, t orx, y, RFO |
| Prevalence boundary for repeated test (PBrt) given RFO | |||
| 25 | PBrt = [y2RFO]/[RFO(y2-x2+2x-1) + (x-1)2] | PBrt | x, y, RFO |
| Improvement in prevalence boundary (∆PB) when test second time given RFO | |||
| 26 | ∆PB = {y2RFO/[RFO(y2-x2+2x-1) + (x-1)2]}-{yRFO/[RFO/[(x+y-1) + (1-x)]} | ∆PB | x, y, RFO |
| Recursion | |||
| Recursive formulae for PPV (si+1) and NPV (ti+1) | |||
| 27 | si+1 = [xpi]/[xpi + (1-y)(1-pi)], where the index, i = 1, 2, 3… | si+1 | x, y, pi |
| 28 | ti+1 = [y(1-pi)]/[pi(1-x) + y(1-pi)] | ti+1 | x, y, pi |
| Special Cases | |||
| PPV when sensitivity is 100% | |||
| 29 | PPV = [Prev]/[Prev + (1-Spec)•(1-Prev)], ors = [p]/[p + (1-y)(1-p)] | s | y, p |
| Prevalence when sensitivity is 100% (i.e., FN = 0) | |||
| 30 | Prev = 1 – [(1 – N+/N)/Spec], or p = 1- [(1-POS%)/y] | p | POS%, y |
| Sensitivity when given specificity, RFO, and PB (no repeat) | |||
| 31 | x = [PB-RFO(y+PB-y•PB)]/[PB(1-RFO)] | x | y, RFO, PB |
| Sensitivity, given RFO and PB, when specificity (y) is 100% | |||
| 32 | x = (PB-RFO)/[PB(1-RFO)] | x | RFO, PB |
| Accuracy (not recommended – see note) | |||
| 33 | A = (TP + TN)/N = Sens•Prev(dz) + Spec•Prev(no dz) | A | TP, TN, N |
Abbreviations: Dep. Var., dependent variable; Indep. Var., independent variable(s); Eq., equation; i, an index from 1 to 3 or more — the number of testing events; N, total number of people tested; N+, number of positives (TP + FP) in the tested population; N-, number of negatives (TN + FN) in the tested population; PB, prevalence boundary; ∆PB, improvement in prevalence boundary; PBrt, prevalence boundary for repeated test; POS%, (N+/N), percent positive of the total number tested (same as RPOS); NEG%, (N-/N), percent negative of total number tested; Prev, prevalence (p); Prev(dz), same as p; Prev(no dz), prevalence of no disease; PPV, positive predictive value (s); NPV, negative predictive value (t); PV GM2, square of the geometric mean of positive and negative predictive values, (PPV•NPV), expressed as a fraction from 0 to 1 ; pi+1, pi, indexed partition prevalence in the recursive formula for PPV and NPV; RFO, the rate of false omissions; RFO/rt, rate of false omission with repeated test (rt); RFP, false positive rate, aka false positive alarm — probability that a false alarm will be raised or that a false result will be reported when the true value is negative; RPOS, positivity rate; RTP, true positive rate, the same as sensitivity; Sens, sensitivity (x); Spec, specificity (y); TP, true positive; FP, false positive; TN, true negative; FN, false negative; Notes: Sens, Spec, PPV, NPV, and Prev are expressed as percentages from 1 to 100%, or as decimal fractions from 0 to 1 by dividing by 100%. PV GM2 was created for visual logistics comparisons of performance curves of diagnostic tests, not for point comparisons. If the denominators of derived equations become indeterminate, then revert to the fundamental definitions, Eqs. 1-6. The use of the formula for accuracy [Eq. 33] is not recommended, because of duplicity of values with complementary changes in sensitivity and specificity.
2.3. Prevalence Boundaries
A prevalence boundary is encountered where the RFO curve (as a function of prevalence) intersects the threshold for missed diagnoses. This paper illustrates the effects of RFO thresholds of 5%, 10%, 20%, and 33%. Eq. 21 is used to calculate the RFO, and Eq. 22, the RFO/rt when a test is repeated. Please note that ∆PB [Eq. 26], the gain in PB from repeating a test, depends only on the sensitivity, specificity, and RFO.
2.4. FDA, NIH, University, and Industry RAgT Field Evaluation (“Collaborative Study”)
RAgT results for an asymptomatic “DPIPP 0-6” group in a Collaborative Study conducted by Soni et al. were published in a preprint in 2022 [4] and in July 2023 in a peer-reviewed journal [5]. The Collaborative Study, conducted from October 18, 2021 to January 31, 2022, included subjects over two years of age, and was funded by the Rapid Acceleration and Diagnostics (RADx) initiative of the NIH.
The Collaborative Study involved 7,361 participants with 5,609 deemed eligible for analysis in the preprint [4] and 5,353 in the peer-reviewed paper [5]. People self-tested and self-interpreted RAgT results during the spread of SARS-CoV-2 Delta and Omicron variants. The results, which reflected the first week of testing, were used here to analyze repeated RAgT performance.
Institutions that participated in the Collaborative Study comprised the US FDA, National Institute of Biomedical Imaging and Bioengineering at the NIH, University of Massachusetts Chan Medical School, Johns Hopkins School of Medicine, and Northwestern University. Quest Diagnostics and CareEvolution also joined the study.
2.5. Rapid Antigen Tests in the Collaborative Study
The RAgTs used in the Collaborative Study under FDA Emergency Use Authorizations [6] (EUAs) included the a) Abbott BinaxNOW Antigen Self Test [EUA positive percent agreement (PPA), 84.6%; negative percent agreement (NPA), 98.5%], b) Quidel QuickVue OTC COVID-19 Test [PPA, 83.5%; NPA, 99.2%], and 3) BD Veritor At-Home COVID-19 Test [PPA, 84.6%; NPA, 99.8%]. The EUA NPA range from 98.5 to 99.8% has a narrow span of only 1.3%.
The Collaborative Study preprint [4] did not report clinical specificity results. The peer-reviewed paper stated that 3.4% (1,182) of same-day RT-PCR negative results “were missing a corresponding Ag-RDT result”[5]. Then, the authors estimated the clinical specificity [TN/(TN + FP)] to be 99.6%. Rather than using the estimated specificity, the median EUA NPA of 99.2% was used here for mathematical analyses.
In a study of COVID-19 test performance [7], the median NPA of EUA manufacturer claims for home RAgTs was 99.25% (range 97-100%), which is nearly identical to the 99.2% used here for math computations. For commercial NPA details, please see “Table S1, Part I. Antigen tests, Statistics” [8] in the supplement to reference [7].
2.6. FDA Directive for Rapid Antigen Tests
The Collaborative Study preprint [4] was followed by a letter from the US FDA titled, “Revisions Related to Serial (Repeat) Testing for the EUAs (Emergency Use Authorizations) of Antigen IVDs” [9] published November 1, 2022. Appendix A states “1) Where a test was previously authorized for testing of symptomatic individuals (e.g., within the first [number specific to each test] days of symptom onset), the test is now authorized for use at least twice over three days with at least 48 hours between tests.”, and “2) Where a test was previously authorized for testing of asymptomatic individuals (e.g., individuals without symptoms or other epidemiological reasons to suspect COVID-19), the test is now authorized for use at least three times over five days with at least 48 hours between tests.”
Intended use EUA documents describing RAgTs must now declare that, “negative results are presumptive,” and no longer specify that testing should be performed at least twice over 2-3 days with 24-36 hours between tests. Product labeling must be updated along with instructions for users and other manufacturer documents. This research focuses on the interpretation of test results for asymptomatic subjects (FDA no. 2 above).
2.7. Software and Computational Design
Desmos Graphing Calculator [https://www.desmos.com/calculator], which is free multivariate open access software, was used to generate illustrations so that readers could duplicate the graphical results and explore his or her analytic goals at no expense. Mathematica [Wolfram, https://www.wolfram.com/mathematica/] was used to confirm the (x, y) coordinates of graphical intersections and other analytical results.
2.8. Human Subjects
Human subjects were not involved. Sensitivity and specificity data were obtained from public domain sources.
3. Results
Figure 1 shows changes in false omission rates, RFO, as a function of prevalence from 0 to 100%. The red curves reflect the results of testing three times for asymptomatic home self-testers participating in the Collaborative Study. Please see the inset table for details.
Repeating RAgTs improved sensitivity from an initial 34.4% to 55.3% on the first repetition and 68.5% on the second repetition when singleton RT-PCR positives were included. The initial PB was 7.37% (red dot). However, subsequent PBs (10.46%, 2nd test; 14.22%, 3rd test) did not improve as theoretically predicted for successive repetitions.
In community settings and hotspots with prevalence >7.37%, the RFO curves predict that more than 1 in 20 diagnoses will be missed with the first test, while with the second and third tests, RFO breeches will occur at 10.46% and 14.22% prevalence, respectively.
Relaxation of the RFO threshold to 10%, 20%, and 33.3% for the third test generates unacceptable levels of missed diagnoses (1 in 10, 1 in 5, and 1 in 3, respectively) as the PB moves up and to the right at 25.9, 44.1, and 61.2% prevalence, indicated by the red symbols (see inset table) on the exponentially increasing red curve for the third test.
The second repetition of the RAgTs (third RAgT) did not achieve the World Health Organization (WHO) performance criteria [10] (blue dot and curve) for RAgT sensitivity of at least 80% and generated a PB of only 14.22% (RFO = 5%), which is 69.9% of the PB (20.34%) calculated (using Eq. 24) for the WHO specifications.
The highest levels of performance in Figure 1 were attained by the home molecular loop-mediated isothermal amplification (LAMP, purple curve) assay median performance [11] (sensitivity 91.7%, specificity 98.2%, and PB 38.42%), the mathematically predicted performance of a Tier 2 test (PB 50.6%, green curve), and the Tier 2 repeated test (PB 95.2%, large green dot). Tier 2 sensitivity is 95%; for RFO = 5%, the predicted PB would increase by 44.6% to 95.2% when the test is repeated.
Figure 1.
False Omission Rates Increase Exponentially with Prevalence. The median performance of a home molecular diagnostic test (HMDx LAMP, purple curve) performed only once beats that for three serial RAgTs in the Collaborative Study. A repeated Tier 2 test (green curve rising on the right) will not miss more than 1 in 500 diagnoses until the prevalence exceeds 43.8%, then 1 in 200 up to 65.9% prevalence, and subsequently 1 in 100 up to 79.4%, 1 in 50 up to 88.6%, and 1 in 20 (large green dot) up to 95.24%. Abbreviations: HMDx, home molecular diagnostic; LAMP, loop-mediated isothermal amplification; NPA, negative percent agreement; PB, prevalence boundary; RAgT, rapid antigen test; RFO, rate of false omissions; and WHO, World Health Organization.
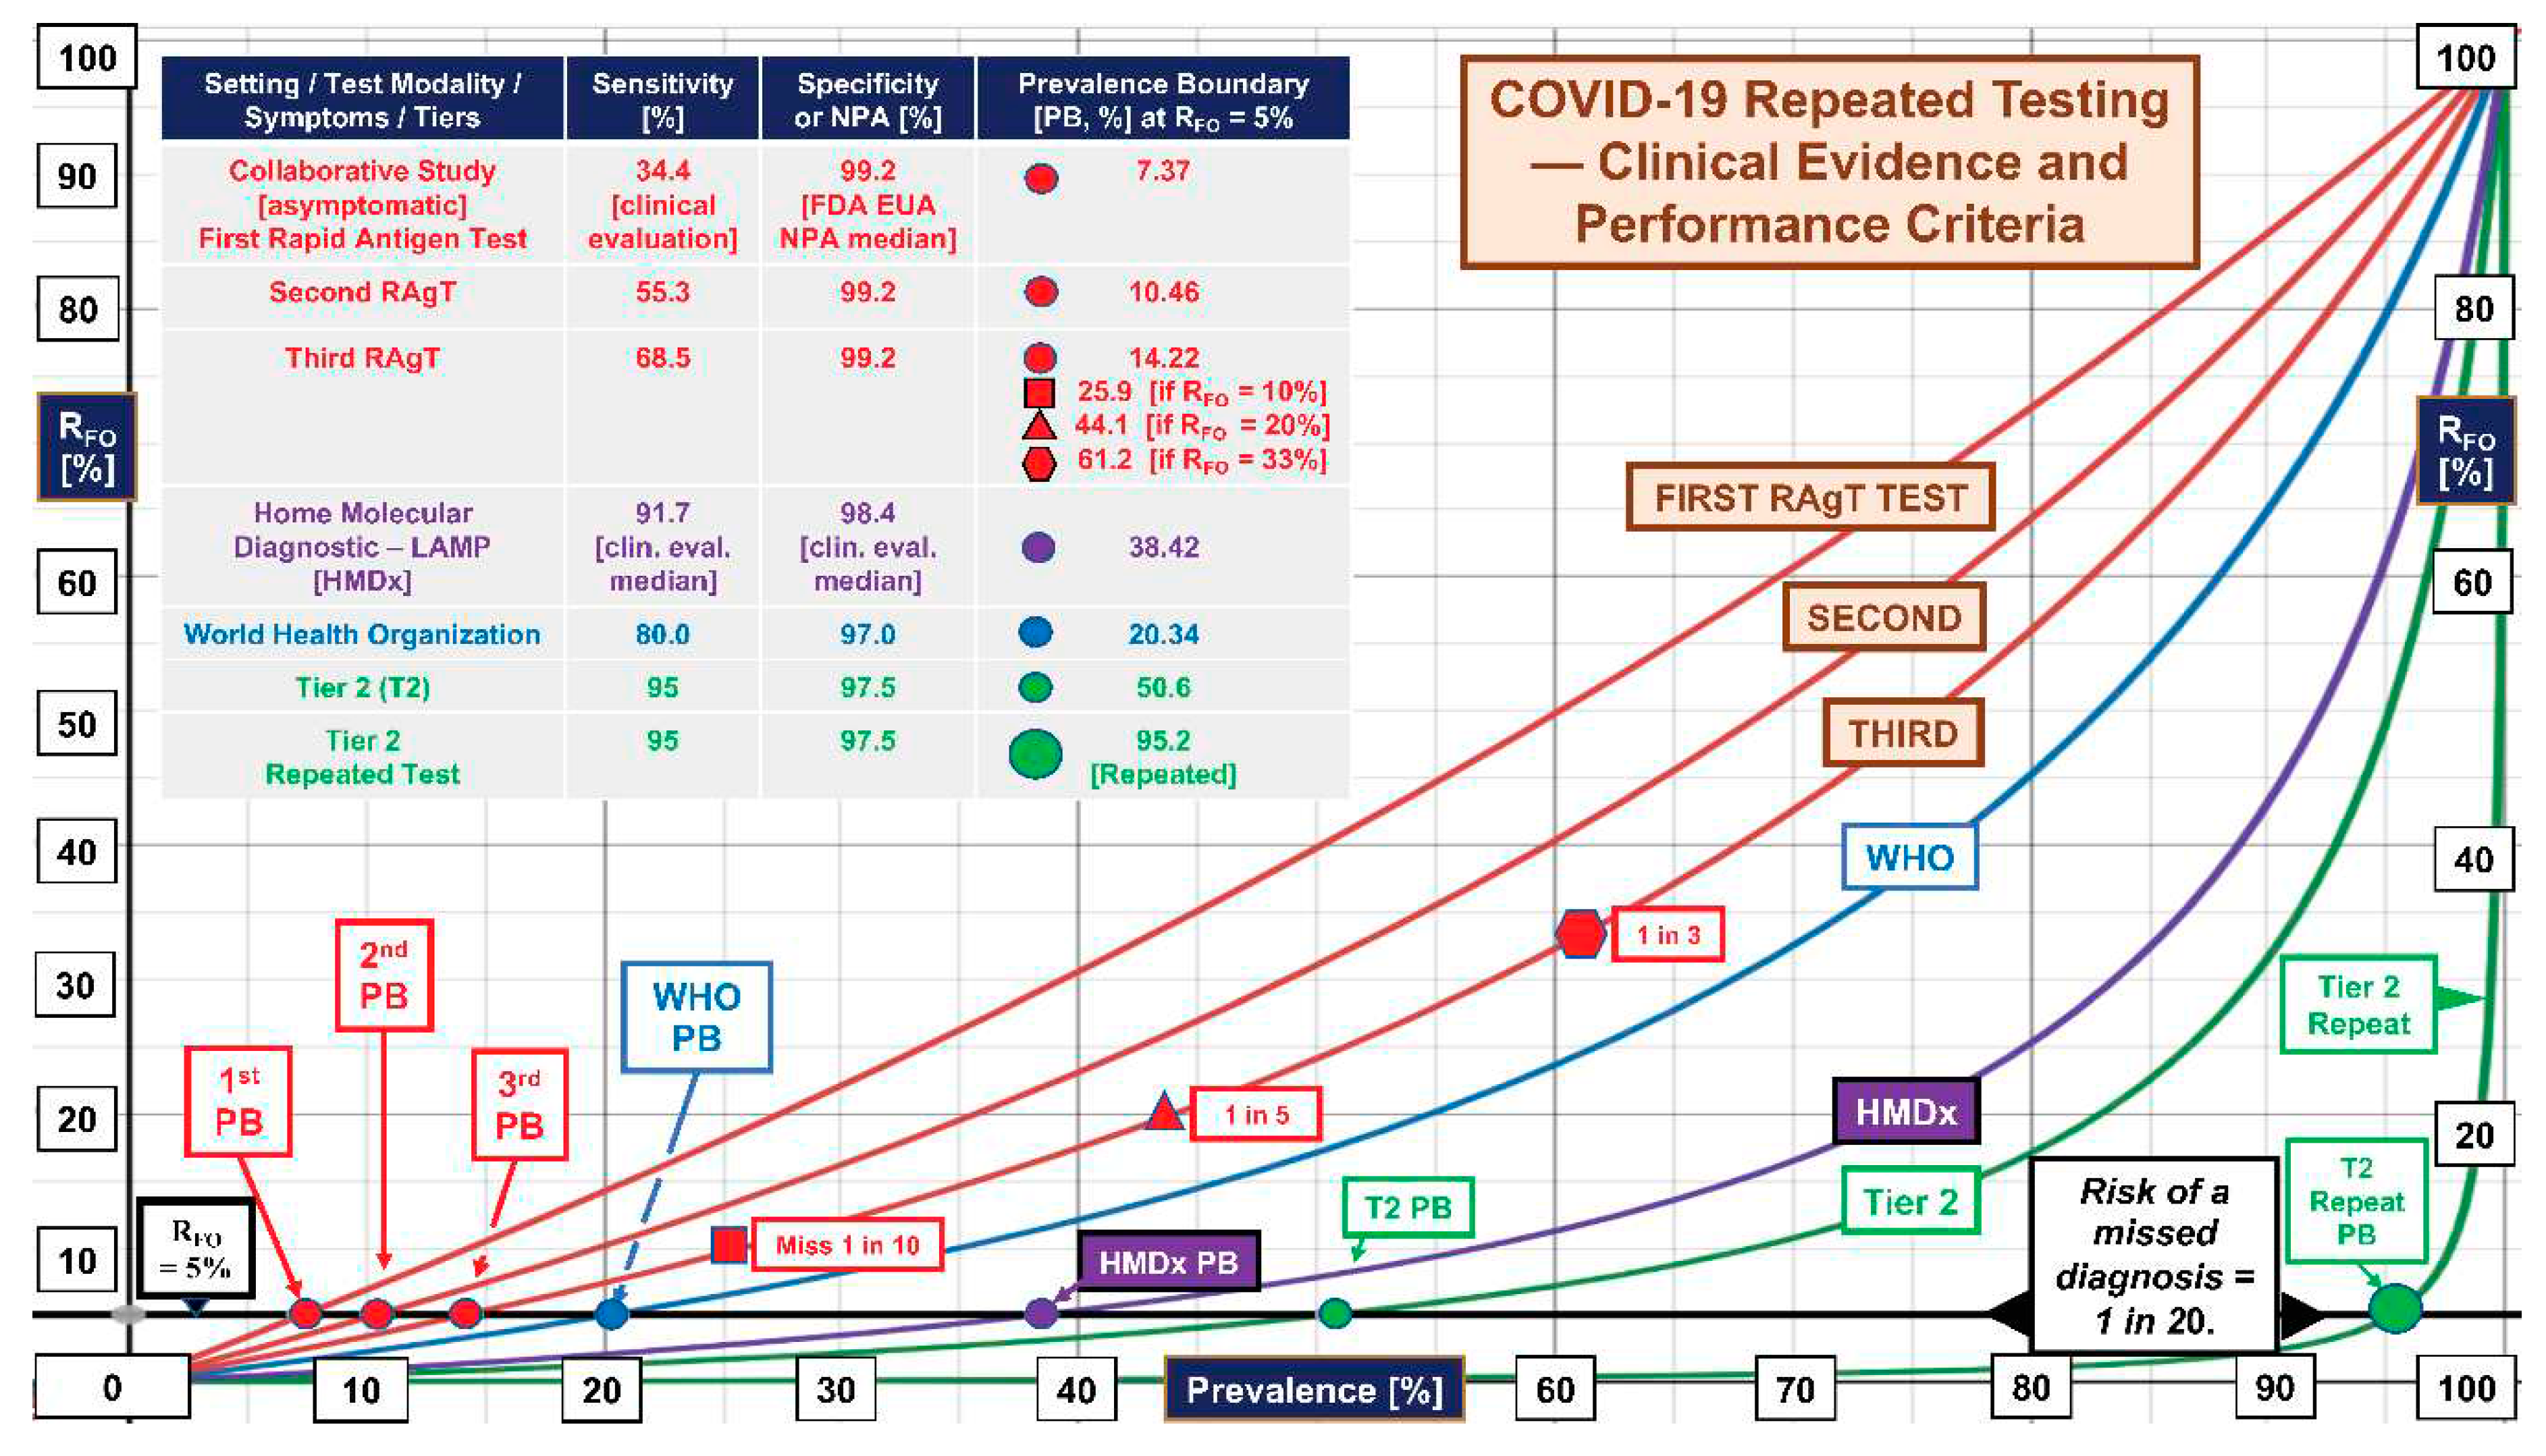
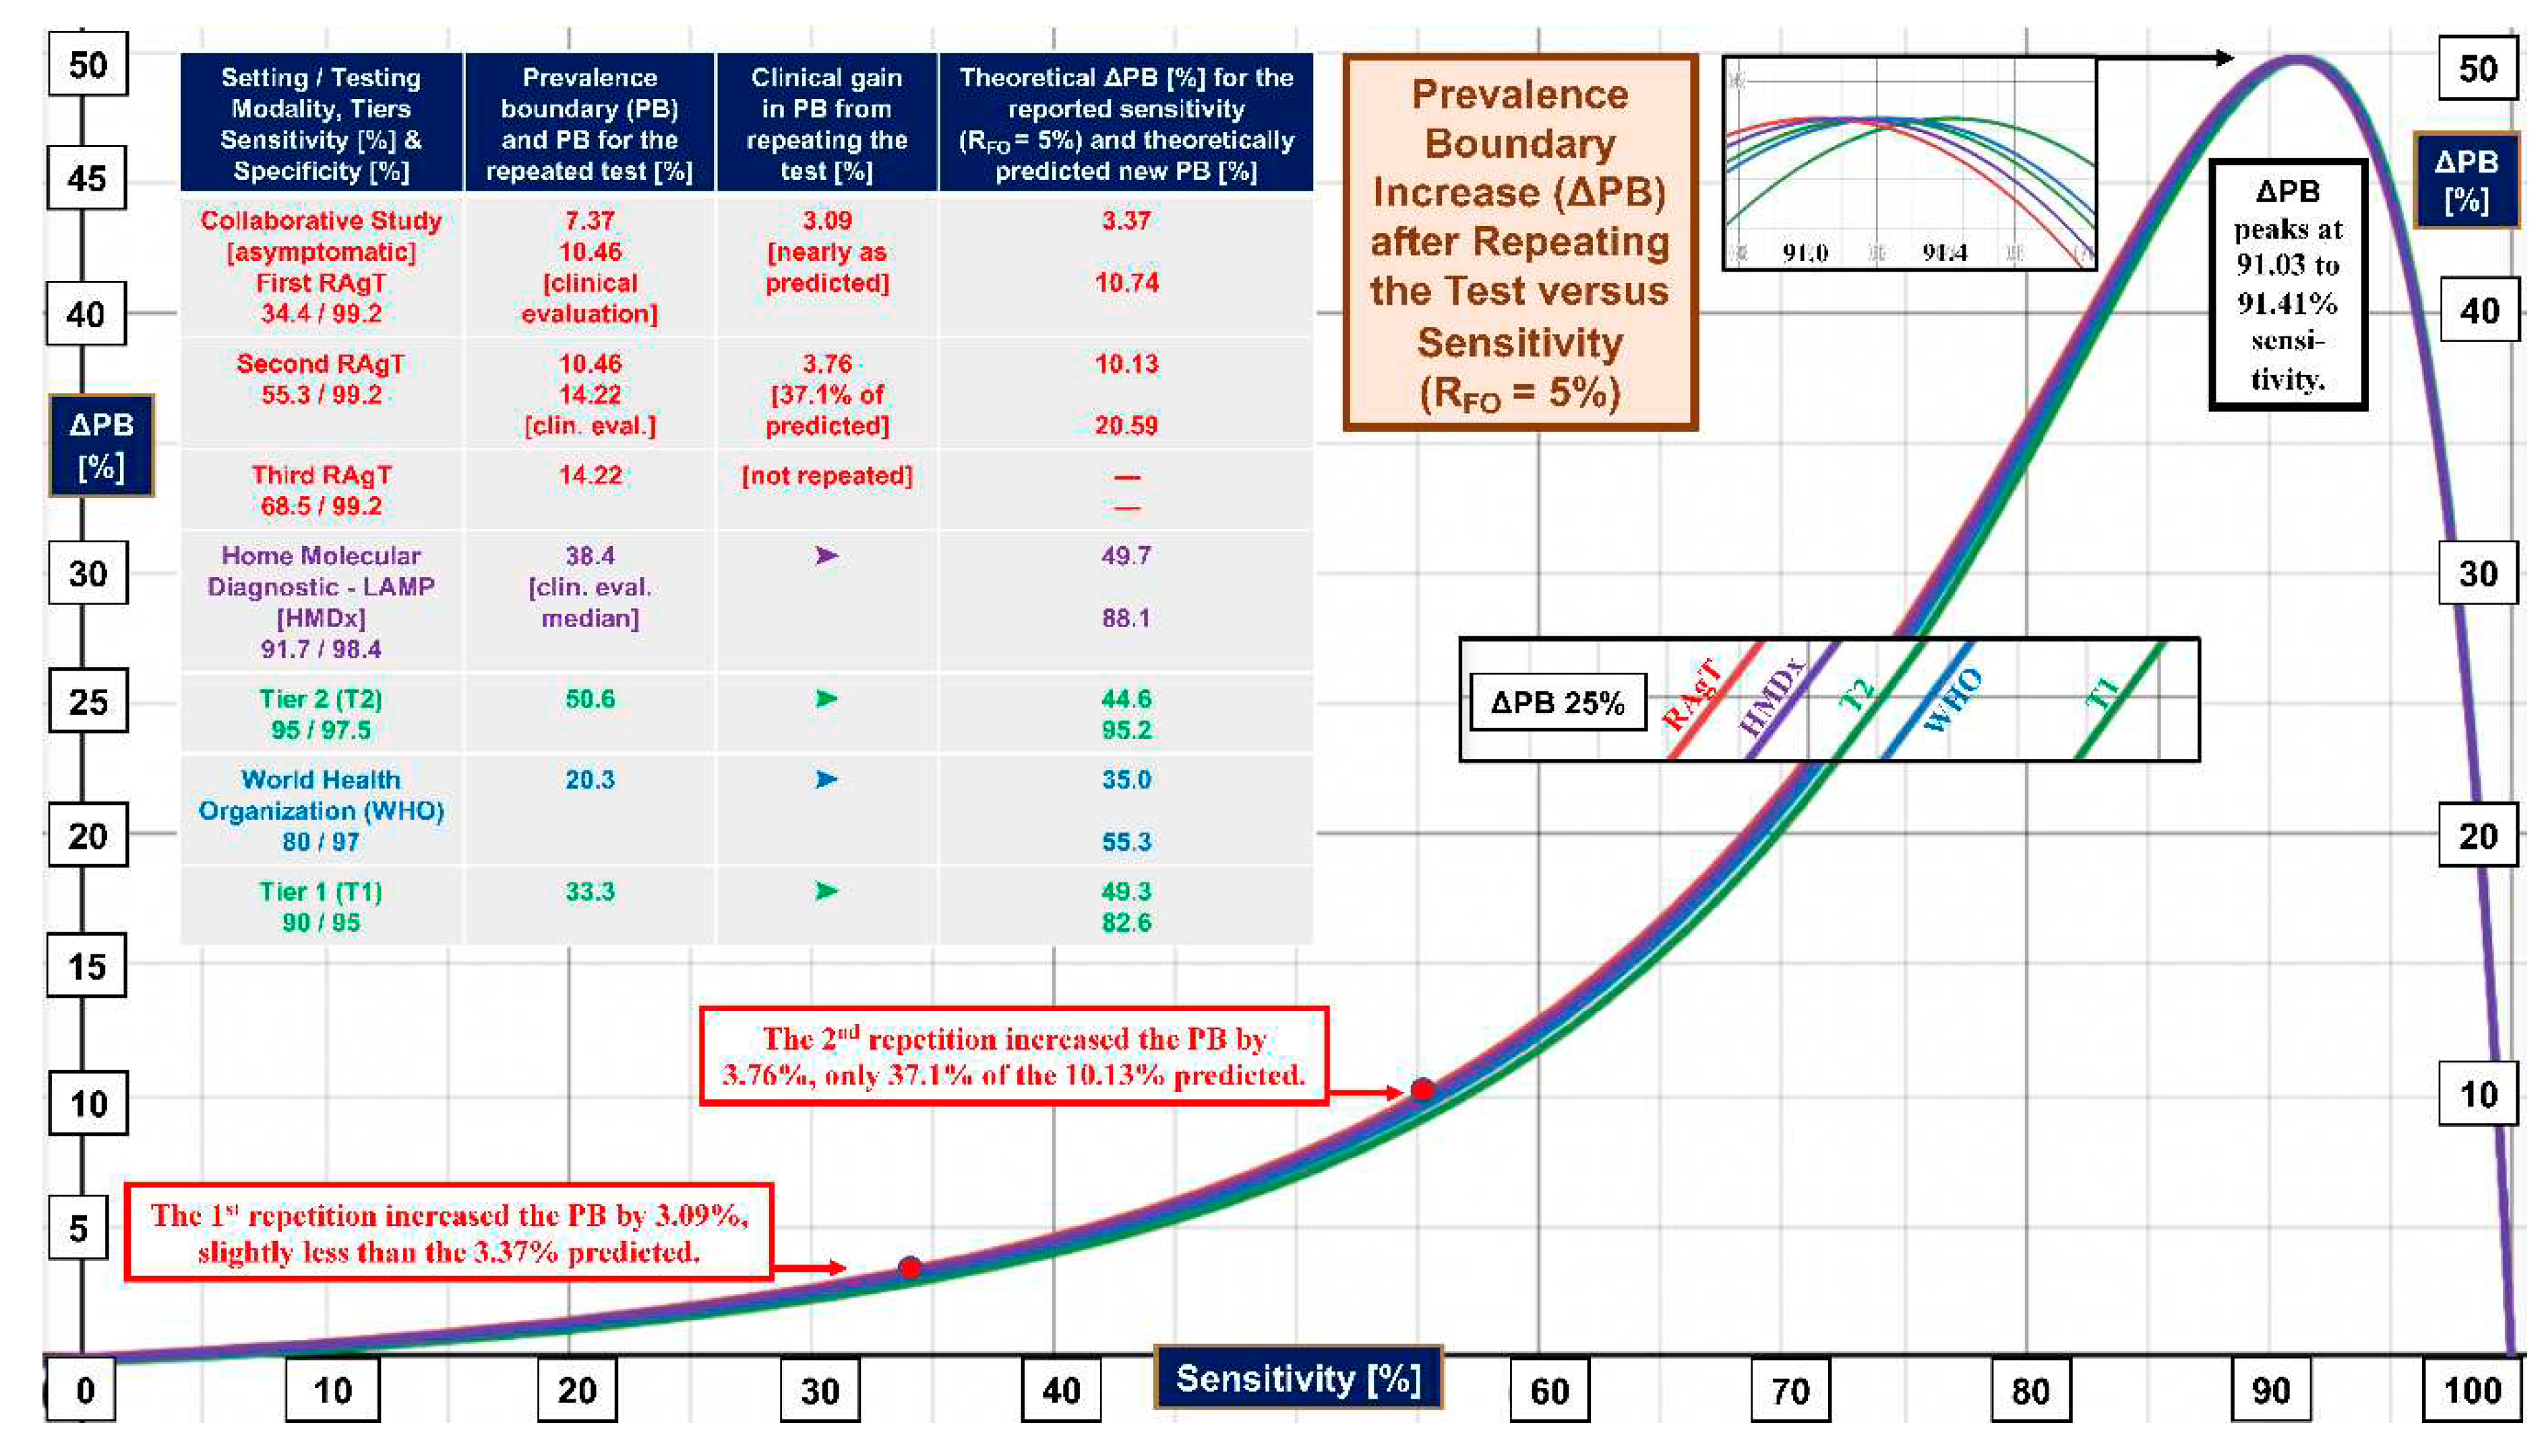
Figure 2 displays gain in the prevalence boundary, ∆PB, on the vertical (y) axis versus sensitivity of the test on the horizontal (x) axis. Initially, the ∆PB curve is relatively shallow. As prevalence increases, it peaks at 91.0 to 91.4% (see the magnifier at the top). The curves cluster together because of the small span in specificity (please see the left column of the inset table). The magnifier at 25% ∆PB shows that the relative order within the cluster is the same as the ranking by specificity in the inset table.
The righthand columns of the inset table in Figure 2 list actual PBs and theoretical predictions. For the Collaborative Study, the gain in PB obtained with the first repeated test, 3.09%, approximated that predicted, 3.37%. Upon testing twice, the gain in PB of 3.76% was only 37.1% of the 10.13% predicted. There is no clear explanation for the meager improvement.
The PBs for the second and third tests, 10.46% and 14.22%, respectively, lagged behind the theoretical predictions of 10.74% and 20.59%, respectively. The two red boxes show where the repetition points lie on the red ∆PB curve and explain the progression of PBs. The arrows point to the coordinates of ∆PB (y axis) and sensitivity (x axis).
Looking back at Figure 1, we see that for RFO = 5%, the median of home molecular diagnostic LAMP tests (HMDx, purple curve) performs better with just one test than three serial RAgTs and beats WHO performance by positioning itself between the Tier 1 and Tier 2 RFO curves. In general, the plot of ∆PB versus sensitivity in Figure 2 reveals that when one tolerates 1 in 20 missed diagnoses, repeating a test will not increase the PB maximally unless the sensitivity is 91.03-91.41%.
In Figure 2 the curves cluster together (see magnifiers) in the right-skewed peak shape because specificity is uniformly high (95-99.2%), and its range is small. The rate of gain in ∆PB depends primarily on sensitivity (x axis) and follows the slope of the curve cluster. The slope is highest from about 75-85%, which implies test performance has the most to gain there. This mathematical analysis is not exclusive to COVID-19 testing. It applies to other positive/negative qualitative diagnostic tests for infectious diseases and can help optimize future assay design.
Figure 2.
Gain in Prevalence Boundary as a Function of Test Sensitivity. This figure illustrates three key findings: 1) The curves cluster together because of the narrow range in clinical specificity (95% to 99.2%), which means that the primary driver of the increase in prevalence boundary (∆PB) is sensitivity; 2) The shallow shape of the curves on the left emphasizes how little is gained by repeating RAgTs tests that start with low sensitivity; and 3) Only when sensitivity is 91.0-91.4% will a repeated test maximally increase the prevalence boundary as show by the peaks on the right, making the tests more useful in settings of different prevalence because missed diagnoses are minimized. Please see the inset table for performance metrics. The curves were created using Eq. 26. Abbreviations: ∆PB, the increase in PB with repeated testing; PB, prevalence boundary; RAgT, rapid antigen test; RFO, rate of false omissions; T1, Tier 1, T2, Tier 2; and WHO, World Health Organization.
4. Discussion
Clinical evaluations show that the specificity of COVID-19 RAgTs is high [7]. In Figure 2 the ∆PB curves cluster together because the range of specificity (95-99.2%) is narrow. Therefore, the degree to which a repeated RAgT increases the PB depends primarily on the test sensitivity. Investigators have addressed the sensitivity of RAgTs in various settings.
In hospitalized patients, Kweon et al. [12] found that for RT-PCR cycle thresholds of 25-30, point-of-care antigen test sensitivity ranged from 34.0% to 64.4% with higher sensitivity within the first week. Hirotsu et al. [13] reported antigen testing exhibited 55.2% sensitivity and 99.6% specificity in 82 nasopharyngeal specimens from seven hospitalized patients tested serially.
In twenty community clinical evaluations of asymptomatic subjects, RAgT sensitivity ranged from 37% to 88% (median 55.75%) and specificity, from 97.8% to 100% (median 99.70%) [8]. During a nursing home outbreak, Mckay et al. [14] documented a RAgT sensitivity of 52% with asymptomatic patients.
In correctional facilities, Lind et al. [15] showed that serial RAgTs had higher but diminishingly different sensitivities for symptomatic versus asymptomatic residents. In a university setting, Smith et al. [16] found that serial testing multiple times per week increased the sensitivity of RAgTs. Wide variations in sensitivity in these studies and others indicate that for RAgTs to rule out disease, performance should be improved and also more consistent with less uncertainty [2].
Asymptomatic infections highlight the need to moderate false negatives, that is, curtail missed diagnoses and assure that repeating RAgTs shifts PBs to the right to mitigate spread of disease. The schematic in Figure 3 illustrates how missed diagnoses might trigger dysfunctional outcomes. Starting in the top left, highly specific tests may generate false positives when prevalence is very low (e.g., <2%) [1]. For graphs of false positive to true positive ratios versus prevalence, please see Figure 1 in reference [1].
Figure 3.
Potential Vicious Cycle Fueled by Repeating Poorly Performing Rapid Antigen Tests. Poorly performing RAgTs can perpetuate virus transmission by missing diagnoses, more so as prevalence increases and the weighting of test performance shifts from specificity (top left) to sensitivity (top right). In high-risk settings and hotspots, prevalence breaches and evolving variants may compound an outbreak to generate an epidemic. Repeating the RAgTs consumes valuable time. Asymptomatic people may unknowingly spread disease to family, friends, workers, and clients creating a vicious cycle. Abbreviation: RAgTs, rapid antigen tests.
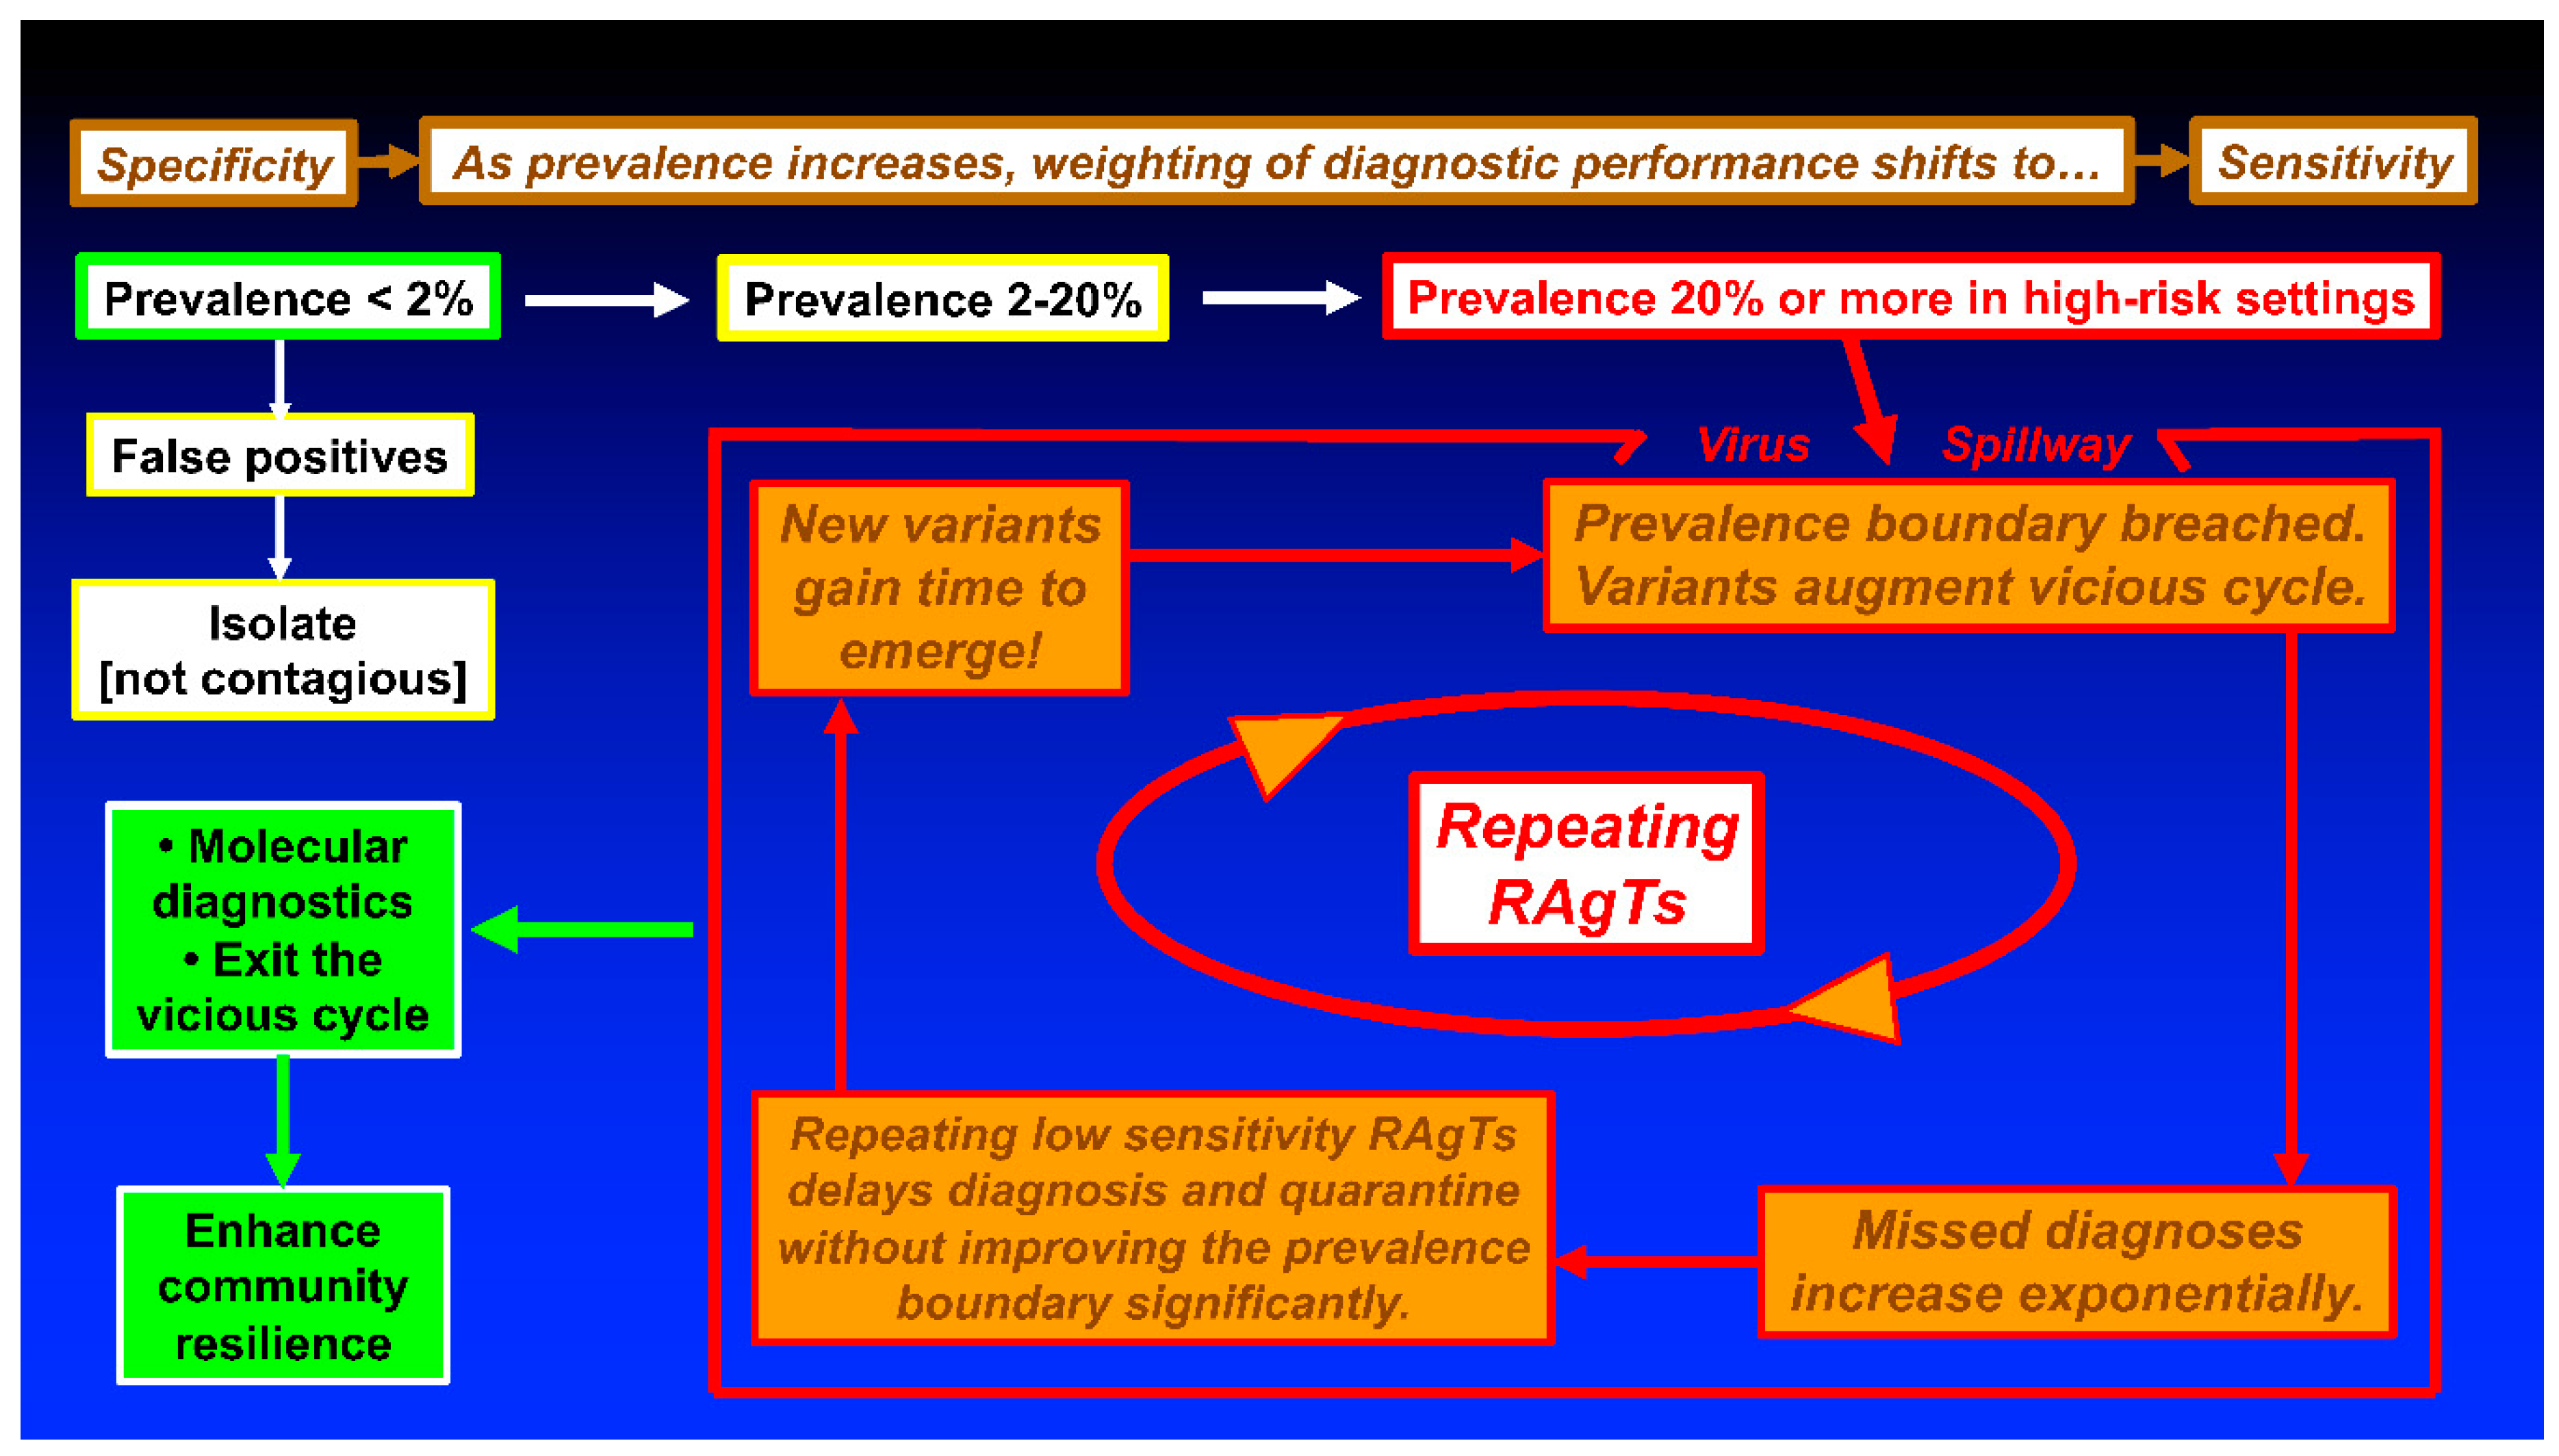
Patients with false positive COVID-19 test results generally will be isolated (upper left, Figure 3) and cannot spread disease because they are not infected with SARS-CoV-2. The prevalence in the Collaborative Study was in the range of 2.39 to 2.75% (134/5,609 to 154/5,609) in late 2021 and early 2022 when data were collected [4]. The singleton RT-PCR positives reported by the investigators may have been false positive RT-PCR reference test results; to avoid bias in the present study, singletons were not excluded.
As prevalence increases, the weighting of RAgT performance shifts from specificity to sensitivity (top sequences in Figure 3). A vicious cycle may develop as diagnoses are missed. Repeating low-sensitivity RAgTs does not advance PBs substantially (see Figure 2). False negatives will increase exponentially (see Figure 1) as prevalence hits double digits. Pollan et al. [17] reported seroprevalence >10% in Madrid in 2020. Gomez-Ochoa et al. [18] reported healthcare worker prevalence of 11% with 40% asymptomatic.
In 2020 Kalish et al. [19] documented 4.8 undiagnosed infections for every case of COVID-19 in the United States. The 2022 meta-analysis of Dzinamarira et al. [20] found 11% prevalence of COVID-19 among healthcare workers. In a 2021 meta-analysis, Ma et al. [21] discovered that asymptomatic infections were common among COVID-19 confirmed cases, specifically 40.5% overall, 47.5% in nursing home residents or staff, 52.9% in air or cruise travelers, and 54.1% in pregnant women.
Prevalence can be estimated from positivity rates using Eq. 30 when high sensitivity RT-PR testing is used. For example, if the positivity rate is 5%, sensitivity is 100%, and specificity is 99% (Tier 3), estimated prevalence will be ~4%, and if the positivity rate is 20% and specificity 97.5% with 100% sensitivity, then ~18%. Cox-Ganser et al. [22] documented test positivity percentages of up to 28.6% in high-risk occupations. In 2020 the median New York City positivity was 43.6% (range 38-48.1 across zip codes) [23]; estimated prevalence is 43.0%.
Thus, RAgTs and other COVID-19 diagnostic tests must perform well over wide ranges of prevalence that vary geographically and in time. Higher sensitivity point-of-care molecular diagnostics (left in Figure 3), such as LAMP assays [11] with EUAs for home testing or other portable molecular diagnostics, offer a way out of the vicious cycle. Exiting the vicious cycle with highly sensitive and highly specific molecular testing will decrease community risk and enhance resilience [24,25].
Time spent testing is important too. Delaying diagnosis increases the risk of infecting close contacts (see the inner feedback loop in Figure 3). Asymptomatic people carrying SARS-CoV-2 may unknowingly spread disease to family, friends, workers, and patients as viral loads increase during the protracted 3-test, 5-day protocol now mandated by the US FDA for RAgTs. Delays allow new variants to emerge, which in turn, increase prevalence. The Eris variant, EG.5 (a descendent lineage of XBB.1.9.2) currently threatens well-being, especially elderly.
The US FDA now requires RAgT labeling to state that results are “presumptive.” RT-PCR or other COVID-19 molecular diagnostic tests should be used to confirm negative RAgT results. The WHO and the US declared an end to the pandemic, but people still need to test [26,27]. For the week ending July 29th, 9,056 new US hospitalizations were reported, ER cases doubled, and the positivity rate rose to 8.9% for tests reported to the CDC [28].
There are limitations to this work. First, Bayesian theory was not proven during the pandemic, although it appears to explain testing phenomena. Second, self-testing in the Collaborative Study was not controlled and the reference test comparison was incomplete. Third, QC was omitted and reagents may have degraded. Fourth, layperson testing technique may have been faulty or inconsistent. Fifth, manufacture PPA and NPA specifications may have been overstated in the small studies submitted to the FDA to obtain EUAs.
Further, there was no comparison LAMP molecular assay included in the Collaborative Study for parallel self-testing at points of care. Nonetheless, these limitations do not obviate the need for higher performance standards and upgrading of RAgT and other diagnostic assays that will be needed for future threats. Timely diagnosis of COVID-19 is important, especially for children this fall. Mellou et al. [29] found that 36% of children who self-tested were asymptomatic, the median lag to testing positivity was two days, and early diagnosis “…probably decreased transmission of the virus…”.
5. Conclusions and Recommendations
Speed and convenience are two of the primary reasons people seek COVID-19 self-testing [11]. Repeating RAgTs three times over five days defeats the purpose of rapid point-of-care testing, does not inform public health in a timely manner, could complicate contact tracing, and may not be cost-effective. Missed diagnoses can perpetuate virus transmission, exponentially more so when prevalence exceeds PBs. Tolerances limits for missed diagnoses have not been established nor have they been tied to different levels of prevalence. The ∆PB [Eq. 26] does not depend on prevalence, per se, and should be optimized if tests are repeated.
No precise temporal trend maps of COVID-19 prevalence in different countries are available for comparison, so the impact of prevalence, per se, is uncertain, although prevalence is known to have been very high in COVID-19 hotspots and high-risk settings [30]. Breaches of RAgT PBs may have generated vicious cycles, adversely transformed outbreaks into endemic disease, prolonged contagion, defeated mitigation, allowed new variants to arise, and fueled the pandemic, as Figure 3 illustrates.
The FDA allowed manufacturers to support RAgT serial screening claims with new clinical evaluations [9]. Upgraded performance should be demonstrated in multicenter trials with large numbers of subjects. To decrease missed diagnoses with a repeated test, mathematical analysis suggests that RAgT sensitivity should be 91.03 to 91.41% in actual clinical evaluations. The theory also shows that a test with Tier 2 clinical sensitivity of 95% will generate PB of 95.2% when only repeated once (see Table 2).
COVID-19 was shown to have positivity rates and/or prevalence as high as 75% or more [30,31], which creates potential for asymptomatic infections to spread silently. If superior RAgT performance is not attainable, the FDA should retire EUAs. New RAgTs for COVID-19 or future highly infectious disease threats should achieve high performance proven clinically to be at least the level of Tier 2 (95% sensitivity, 97.5% specificity), especially in high-risk settings and hotspots.
Funding
This research was supported in part by an Edward A. Dickson Emeritus Professorship, by the Point-of-Care Testing Center for Teaching and Research (POCT•CTR), and by Dr. Kost, its Director, who held a US Fulbright Scholar Award, ASEAN Program during the early development of the project and derivation of the mathematical equations.
Acknowledgements
The author thanks the creative students, research assistants, and faculty colleagues who participated in the POCT•CTR COVID-19 research, lecturing, and outreach program during the pandemic. Figures and tables are provided courtesy and permission of Knowledge Optimization, Davis, California.
References
- Kost, GJ. Designing and interpreting COVID-19 diagnostics: Mathematics, visual logistics, and low prevalence. Arch Pathol Lab Med. 2021, 145, 291–307. [Google Scholar] [CrossRef] [PubMed]
- Kost, GJ. The impact of increasing prevalence, false omissions, and diagnostic uncertainty on Coronavirus Disease 2019 (COVID-19) test performance. Arch Pathol Lab Med. 2021, 145, 797–813. [Google Scholar] [CrossRef] [PubMed]
- Kost, GJ. Diagnostic strategies for endemic Coronavirus Disease 2019 (COVID-19) Rapid antigen tests, repeated testing, and prevalence boundaries. Arch Path Lab Med. 2022, 146(1), 16–25. [Google Scholar] [CrossRef] [PubMed]
- 4. Soni A, Herbert C, Pretz C, Stamegna P, Filippaios A, Shi Q, et al. Finding a needle in a haystack: Design and implementation of a digital site-less clinical study of serial rapid antigen testing to identify symptomatic SARS-CoV-2 infection. medRxiv. [CrossRef]
- 5. Soni A, Herbert C, Lin H, Yan Y, Pretz C, Stamegna P, et al. Performance of rapid antigen tests to detect symptomatic and asymptomatic SARS-CoV-2 Infection: A prospective cohort study. Ann Intern Med.
- 6. Food and Drug Administration. In Vitro Diagnostics EUAs - Antigen Diagnostic Tests for SARS-CoV-2. Individual EUAs for Antigen Diagnostic Tests for SARS-CoV-2. 18 August 2019.
- Kost, GJ. The Coronavirus disease 2019 spatial care path: Home, community, and emergency diagnostic portals. Diagnostics. 2022, 12(1216), 1–16. [Google Scholar]
- Kost, GJ. Table S1. COVID-19 Tests with FDA Emergency Use Authorization for Home Self-testing. Part I. Antigen Tests (pp. 1-2), and Table S2. COVID-19 Rapid Antigen Tests for Symptomatic and Asymptomatic Subjects in Community Settings. Part I. Point-of-care Testing (pp. 3-7). Diagnostics. /: Supplementary Materials. https, 18 August 1216. [Google Scholar]
- 9. Food and Drug Administration. Revisions Related to Serial (Repeat) Testing for the EUAs of Antigen IVDs, 18 August 1627.
- World Health Organization. Antigen-detection in the diagnosis of SARS-CoV-2 infection. Interim guidance. , 2021. file:///Users/m1/Downloads/WHO-2019-nCoV-Antigen-Detection-2021.1-eng.pdf (accessed on August 18, 2023). 6 October.
- Kost, GJ. Changing diagnostic culture calls for point-of-care preparedness — Multiplex now, open prevalence boundaries, and build community resistance. 21st Century Pathology. 2022, 129), 1–7. [Google Scholar]
- 12. Kweon OJ, Lim YK, Kim HR, Choi Y, Kim MC, Choi SH, et al. Evaluation of rapid SARS-CoV-2 antigen tests, AFIAS COVID-19 Ag and ichroma COVID-19 Ag, with serial nasopharyngeal specimens from COVID-19 patients. PLoS One, 0249. [CrossRef]
- 13. Hirotsu Y, Maejima M, Shibusawa M, Nagakubo Y, Hosaka K, Amemiya K, et al. Comparison of automated SARS-CoV-2 antigen test for COVID-19 infection with quantitative RT-PCR using 313 nasopharyngeal swabs, including from seven serially followed patients. Int J Infect Dis.
- 14. McKay SL, Tobolowsky FA, Moritz ED, Hatfield KM, Bhatnagar A, LaVoie SP, et al. Performance evaluation of serial SARS-CoV-2 rapid antigen testing during a nursing home outbreak. Ann Intern Med.
- 15. Lind ML, Schultes OL, Robertson AJ, Houde AJ, Cummings DAT, Ko AI, et al. Testing frequency matters: An evaluation of the diagnostic performance of a severe acute respiratory syndrome Coronavirus 2 (SARS-CoV-2) rapid antigen test in US correctional facilities. Clin Infect Dis.
- 16. Smith RL, Gibson LL, Martinez PP, Ke R, Mirza A, Conte M, et al. Longitudinal assessment of diagnostic test performance over the course of acute SARS-CoV-2 infection. J Infect Dis.
- 17. Pollán M, Pérez-Gómez B, Pastor-Barriuso R, Oteo J, Hernán MA, Pérez-Olmeda M, et al. Prevalence of SARS-CoV-2 in Spain (ENE-COVID): a nationwide, population-based seroepidemiological study. Lancet, 0250.
- 18. Gómez-Ochoa SA, Franco OH, Rojas LZ, Raguindin PF, Roa-Díaz ZM, Wyssmann BM, et al. COVID-19 in health-care workers: A living systematic review and meta-analysis of prevalence, risk factors, clinical characteristics, and outcomes. Am J Epidemiol.
- 19. Kalish H, Klumpp-Thomas C, Hunsberg S, Baus HA, Fay MP, Siripong N, et al. Undiagnosed SARS-CoV-2 seropositivity during the first 6 months of the COVID-19 pandemic in the United States. Sci Trans Med, 3982.
- 20. Dzinamarira T, Murewanhema G, Mhango M, Iradukunda PG, Chitungo I, Mashora M, et al. COVID-19 prevalence among healthcare workers. A systematic review and meta-analysis. Int J Environ Res Public Health.
- 21. Ma Q, Liu J, Liu Q, Kang L, Liu R, Jing W, et al. Global percentage of asymptomatic infections among the tested population and individuals with confirmed COVID-18 diagnosis. A systematic review and meta-analysis. JAMA Network Open. 2137.
- 22. Cox-Ganser JM, Henneberger PK, Weissman DN, Guthrie G, Groth CP. COVID-19 test positivity by occupation using the Delphi US COVID-19 trends and impact survey, September-November 2020. Am J Ind Med, 20 November.
- Lamb MR, Kandula S, Shaman J. Differential COVID-19 case positivity in New York City neighborhoods: Socioeconomic factors and mobility. Influenza Other Respir Viruses. 2021.
- Kost, GJ. Home, community, and emergency spatial care paths — Diagnostic portals for COVID-19, critical care, and superstorms (and the prevalence boundary hypothesis). IFCC Live Webinar on POCT: Developing Community Resilience. , 2023. 18 January.
- Kost, GJ. The mathematics of COVID-19 diagnostics (including the prevalence boundary hypothesis) and novel strategies for new global threats. Nauresuan University Live Symposium, Bangkok, Thailand, , 2023. 8 May.
- World Health Organization. EG.5 initial Risk Evaluation. Geneva: WHO, , 2023. https://www.who.int/docs/default-source/coronaviruse/09082023eg.5_ire_final.pdf?sfvrsn=2aa2daee_1 (accessed on August 18, 2023). 9 August.
- 27. Abbott B, Kamp J, Hopkins J. Omicron subvariant “Eris” drives rise in Covid infections. Wall Street Journal.
- Grant K, McNamara D. It may be time to pay attention to COVID again. WebMD Health News. , 2023. https://www.webmd.com/covid/news/20230810/it-may-be-time-to-pay-attention-to-covid-again (accessed on August 18, 2023). 11 August.
- 29. Mellou K, Sapounas S, Panagoulias I, Gkova M, Papadima K, Andreopoulou A, et al. Time lag between COVID-19 diagnosis and symptoms onset for different population groups: Evidence that self-testing in schools was associated with timely diagnosis among children. Life (Basel).
- Kost, GJ. Moderate (20-70%) and high (70-100%) COVID-19 positivity rates and prevalence in different geographic regions. Arch Path Lab Med, /: Digital Content. 2021, 145, 797-813. file, 18 August 2021. [Google Scholar]
- Kost, GJ. Geospatial hotspots need point-of-care strategies to stop highly infectious outbreaks. Arch Pathol Lab Med. 2020, 144(10), 1166–1190. [Google Scholar] [CrossRef] [PubMed]
Disclaimer/Publisher’s Note: The statements, opinions and data contained in all publications are solely those of the individual author(s) and contributor(s) and not of MDPI and/or the editor(s). MDPI and/or the editor(s) disclaim responsibility for any injury to people or property resulting from any ideas, methods, instructions or products referred to in the content. |
© 2023 by the authors. Licensee MDPI, Basel, Switzerland. This article is an open access article distributed under the terms and conditions of the Creative Commons Attribution (CC BY) license (http://creativecommons.org/licenses/by/4.0/).
Copyright: This open access article is published under a Creative Commons CC BY 4.0 license, which permit the free download, distribution, and reuse, provided that the author and preprint are cited in any reuse.


