Submitted:
11 August 2023
Posted:
18 August 2023
You are already at the latest version
Abstract
This article is a logical continuation of the work of Nuritdinov et al. (2021). We analyzed space observations of the apparent surface density of 81 globular clusters (GCs) observed by GAIA DR2 and published in de Boer et al (2019). First, we studied the features of the quality of the GC surface density data, including comparing them with the HST data. Using our 3-parameter model, previously tested on the example of HST space observations, we found the values of the stellar concentration parameter towards the center of the cluster. As a result, we found good correlations of this parameter with the physical characteristics of the GCs. We have also found the corresponding empirical formulas for this parameter.
Keywords:
apparent surface density
; concentration parameter
; GAIA DR2
; globular clusters
; HST
; space observations
1. Introduction
Since globular clusters are among the oldest objects in our Galaxy, their in-depth study will help to better understand the evolution of not only the Milky Way, but also the Universe [1-3]. In the study of globular clusters, it is very important to study their internal mass distribution [4]. The most commonly used description of the mass distribution follows King's formula [5]. At the same time, ground-based methods of astrometry and stellar astronomy were initially used to determine the structural parameters of GCs (see, for example, [6-10] and references there). We are also interested in the classification of globular clusters according to the degree of concentration of stars to the center, which was first considered in in the work of Shapley and Sawyer [11]. Despite the fact that for almost a century after the work of [11] many authors [12,13,14,15,16,17,18,19,20,21,22,23,24] have carried out serious studies, unfortunately, a satisfactory solution to the Shapley–Sawyer problem has not been found. Since the stellar number density increases rapidly as we approach the center of the GC, it is difficult for ground-based telescopes to analyze their central region (for details, see, for example, in [25]), and CCD observations are necessary. In rare cases, several deep observations were performed for the surface density of concrete GCs [26]. To date, out of 157 GCs discovered in our Galaxy, space-based surface density observations are available for 26 GCs under the HST program [27] and 81 GCs under the GAIA DR2 program [28].
Nuritdinov et al. [29] found values of the concentration parameters representing the change in the degree of stellar concentration towards the center for 26 GCs given by Miocchi et al. [27], and for the first time proposed a classification of GCs that solves the Shapley-Sawyer problem [11]. The main differences between the GAIA DR2[1] and HST[2] observational data are studied in detail below. We have observations of apparent surface density for 81 GCs and use them for our analysis. Although the quality of the GAIA DR2 data is somewhat lower than that of the HST data, we have studied them in sufficient detail for each cluster. Analysis of the quality of observational data and the behavior of the surface density of GCs shows the need to divide them into two groups (see Section 2 below). It turned out that only for one of them it makes sense to determine the values of the GC concentration degree parameter and the corresponding empirical formulas for the dependence of this parameter on the main physical characteristics of the clusters. The values of the correlation coefficients between the concentration parameter and individual physical characteristics obtained from observations, including those with the GC mass (M), absolute magnitude (Mv), King parameter (c), Kukarkin index (index of richness) (IR) and values r0 associated with the cluster core radius rc.
2. Analysis of GC Surface Density Observations of GCs
Within the framework of the GAIA DR2 observations of the apparent surface density of the GC, we encountered serious problems in calculating the values of the free parameters of different models. First, the values of the free parameters calculated for some of the 81 GCs had no physical meaning. Secondly, correlations ware not found between the free parameters calculated for 81 GCs and any physical GC parameters. Therefore, we had to carefully analyze each cluster observed by GAIA DR2, and as a result of the analysis, classify the clusters into classes.
Observational data on the surface density of GCs obtained by space telescopes within the framework of two programs (GAIA DR2 and HST) differ significantly from each other in quality. Below we will try to list these differences in order. The authors of [28] note that their observational data were supplemented by ground-based telescopes and partly by HST observations. The surface density profiles of most GCs obtained from different space telescopes clearly differ in stellar density, data homogeneity, apparent surface density smoothness, and accuracy of observations of the central part. It is known that the concentration of stars in globular clusters should increase almost uniformly towards the center. However, 8 out of 81 globular clusters observed by GAIA DR2 (NGC 5139, NGC 6144, NGC 6366, NGC 7492, Pal 1, Pal 11, Pal 12, Terzan 8) have very uneven density profiles towards the center, while these non-uniformities are almost absent in the observational data made within the framework of the HST. This can be seen in the example of NGC 7492 (Figure 1). This situation creates serious difficulties in the analysis of such GCs.
Further, we note that in the observations of several GCs using GAIA DR 2 (NGC 5139, NGC 5466, NGC 5897, NGC 6121, NGC 6144, NGC 6366, NGC 6809, PAL 11, PAL 14), the central part is absent and has a complex and physically explainable density profile picture.
In addition, most GCs have surface density profiles starting from the value lg(r'') ~ - 0.5. We see this in NGC 6934 (Figure 2). At the same time, this profile shows a relative decrease in the density of stars in the central part (in the interval [-0.5; 0.5]). The GC density profiles that do not have density values in the central part start at a distance lg(r'') ~ + 0.4 from the center. We clearly see this in the case of NGC 6254. (Figure 3). Density fluctuations in the central region and on the periphery also create difficulties in calculating the degree of concentration. At the same time, the absence of a density value in the center seriously affects the value of the concentration parameter.
Note that, although the GC density profiles obtained by HST sometimes have relatively few observation points compared to the GAIA DR2 data, the concentration in the first case increases uniformly towards the center, and in the second case, non-uniformity is observed both in the distance from the center, and by the value of the surface density itself. These differences are shown in the example of NGC 6809 (Figure 4).
Differences between the GAIA DR and HST data also exist in terms of star density and observation intervals. The apparent stellar density shown by HST in one GC (for example, NGC 6121) is up to 10 times greater than that shown by GAIA DR2 (Figure 5). Although these factors do not greatly affect the value of our concentration parameter in calculations, they cause difficulties in calculating the values of other free parameters.
The negative properties of the data listed above cause serious problems in calculating the GC concentration parameter.
Thus, we are forced to divide the clusters into at least two groups:
- GCs with wavy density profiles towards the center and no density values in the central part (their total number is 41);
- clusters for which the observed density profile is fairly uniform and smooth almost
everywhere, especially in the central region (there are 40 of them in total).
As can be seen, only those clusters that are included in the second group deserve to determine the values of the concentration parameter for them. It is for them that we find the relationship between the concentration parameter and the main physical characteristics of the GCs.
3. Determination of the Concentration Parameter
As noted above, Nuritdinov et al. [29] analyzed the degree of concentration in 26 GCs in their work, the observational data of which are given in the work of Miocchi et al. [27]. To do this, they first generalized the King model (σ ~ (1+r2/r02 )(-1) in the following form:
where γ, r0, and σ0 are free parameters, and γ is the degree of star concentration towards the cluster center (concentration parameter), r0 is related to the cluster core radius rc, and σ0 is the surface density at the GC center. Nuritdinov et al. [29] calculated the above free parameters for 26 GCs and found good correlations between concentration parameter and the observed main physical parameters of the clusters. As a logical continuation of the work of Nuritdinov et al. [30], we calculated free GC parameters based on model (1) using surface density data for a sample of 40 GCs noted in the previous section of this article. When calculating the parameters, it was used the χ-squared minimization method:
σ(r,γ,r0,σ0 )=σ0(1+(r/r0 )2)(-γ),
χ2=∑n|σobs(n)-σ(rn,σ0,r0,γ)|2/(σ(rn,σ0,r0,γ)).
The calculated free parameters and the errors in their determination are given in Table. 1.
Table 1 shows that the values of the concentration parameter fluctuate in the range [0.49; 2.07], and this is very close to the γ range of Nuritdinov et al. [29] [0.67; 2.13]. Nuritdinov et al. [30] found the values of the free parameters γ, r0, and σ0 for 26 GCs, with average percentage errors of 36.8%, 44.7%, and 24.9%, respectively. For the free parameters we found, the average errors were 30.8%, 35.7%, and 13.9%, respectively.
We also looked for a correlation between the parameter γ and the main physical characteristics of the GCs. In this case, obviously, only 40 GCs were taken into account, which are given in Table 1. Next, the corresponding correlation coefficients were calculated and the empirical dependences of γ on the main physical characteristics were found, the values of which were taken from the catalogs of Harris [31] and Baumgardt [32]. The values of the index of richness (IR) are given in the work of Kukarkin [13].
(a). Relationship between γ and the absolute value of MV. The correlation coefficient between these values is 0.63. The corresponding empirical formula has the form
or vice versa
γ = 0.24(±0,05)MV + 3,01(±0,39),
MV = 1,64(±0,33)γ - 9,91(±0,37).
(b). Dependence of the parameter γ on the King parameter "c". Here the correlation coefficient is quite good and equals -0.69. The empirical relationship looks like this
or vice versa
γ = - 0,55(±0,10)c + 1,98(±0,16),
c = - 0,85(±0,15)γ + 2,56(±0,16).
(c). Relationship between γ and GC mass. The correlation coefficient is - 0.62. Empirical formula:
or vice versa
γ = - 0,58(±0,12)lg M/M⊙ + 4,22(±0,65),
lg M/M⊙ = - 0.67(±0,14)γ + 6,18(±0,15).
(d). Dependence of the parameter γ on the Kukarkin index "IR". We found a correlation equal to -0.60. The empirical formula looks like:
or vice versa
γ = - 1,06(±0,23)IR + 1,69(±014),
IR = - 0,33(±0,07)γ + 0,93(±0,08).
(e). The relationship between γ and r0, the value is related to the cluster core radius rc. We found a satisfactory correlation of 0.60. Empirical dependence:
or vice versa
γ = 0.007(±0,001)r0 + 0.89(±0.06),
r0 = 52.00(±11.26)γ - 27.73(±12.62).
Note that the coefficients and their errors in the empirical formulas (3) – (12) we found do not differ significantly from the results of Nuritdinov et al. [29].
4. Conclusion
Thus, we have analyzed the observational data on the apparent surface density of 81 GCs obtained within the framework of the GAIA DR2 space program. A comparison of the observational results shows that the quality of the GAIA DR2 observational data is slightly lower than that of the HST data. Based on the results of a qualitative analysis of observational data and a number of physical considerations on surface density profiles, we classified GCs into 2 classes, and then investigated the issues of modeling apparent surface density as a function of distance. The concentration parameters for 40 GCs, selected according to the properties of the profiles, were found using the three-parameter model (1) by the ꭕ-square minimization method. We calculated the correlation coefficients of the concentration parameter γ with the main physical characteristics of the GCs known from observations (MV, lgM, IR, c) and found the corresponding empirical formulas between them. The found values of γ are in the range (0.49; 2.07), which indicates the validity of the previous GC classification developed by us in [29] based on the results of the analysis of HST observational data.
References
- Peebles, P. J. E. and Dicke, R. H. Origin of the Globular Star Clusters. Astrophys. J. 1968, 154, p. 891. [CrossRef]
- Chernin, A. D. PHYSICS OF OUR DAYS: Dark energy and universal antigravitation. Phys. Usp. 2008, 51, p. 253. [CrossRef]
- Zel’dovich, Ya. B. and Novikov, I. D. Relativistic Astrophysics, 2: The Structure and Evolution of the Universe. (Nauka, Moscow, 1975; Univ. of Chicago Press, 1983). [CrossRef]
- Ninkovi´c, S. and Valjarevi´c, A. On the density and surface brightness profiles in globular star clusters, Serb. Astron. J. 2007, 174, pp. 43 – 46. [CrossRef]
- Ivan, R. King, The Structure of Star Clusters. III. Some Simple Dynamical Models, The astronomical journal 1996, 71, p. 1. [CrossRef]
- Grillmair, J. Carl et al., Globular Clusters with Tidal Tails: Deep Two-Color Star Counts, The Astronomical Journal, 1995, 109, p. 2553. 109,. [CrossRef]
- Lehmann, I. and Scholz, R. D. Tidal radii of the globular clusters M 5, M 12, M 13, M 15, M 53, NGC 5053 and NGC 5466 from automated star counts, Astron. Astrophys., 1977, 320, p. 776–782.
- Testa, V. et al., Use of DPOSS data to study globular cluster halos: an application to M 92. arXiv:astro-ph/0002280v1, 2000, 356, pp. 127-133. arXiv:astro-ph/0002280v1, 2000, 356, pp. 127-133.
- Mowbray A., G. The Diameters of Globular Clusters. Sov. Astron. 1946, 104, pp. 47-53. [CrossRef]
- King, I. R.; Hedemann, E. J.; Hodge, S. M. and White, R. E. The Structure of Star Clusters. V. Star Counts in 54 Globular Clusters. Astron. J. 1968, 73, p. 456. [CrossRef]
- Shapley, H.; Sawyer H., B. A classification of globular clusters. Harvard Observ Bull. 1927, 849, pp. 11-14.
- Hartwick, F. D. Two-Dimensional Classification for Galactic Globular Clusters. ApJ. 1968, 154, pp. 475-479. [CrossRef]
- Kukarkin, B. V. The Concentration Classes of Globular Clusters. Sov. Astron, 1971. 15, pp. 89-94.
- Mironov, A. V. Chemical Composition of Globular-Cluster Stars and the Form of the Horizontal Branch. Sov. Astron. 1973, 17, pp. 16-23. 17.
- Mironov, A. V. and Samus, N. N. On the chemical composition and the origin of the globular clusters of our Galaxy. Perem. Zvezdy, Byull. 1974, 19, pp. 337-356.
- Mironov, A. V et al. Kinematic and dynamical differences between two groups of globular clusters. Sov. Astron. 1976, 20, pp. 656-659.
- Straizys, V. Two-Dimensional Classification of Globular Clusters. Astrophys Space Sci. 1982, 81, pp. 179-197. [CrossRef]
- Eigenson, A. M. and Yatsyk, O. S. Classification of Globular Clusters Using Cluster Analysis. Sov. Astron. 1989, 33, p. 280.
- Eigenson, A. M. and Yatsyk, O. S. Comparative classification of globular clusters in the Galaxy and M31 using cluster analysis Astron. Rep. 1995, 39, p. 569.
- Peykov, Z. I. and Rusev, R. M. The spatial structure of the globular cluster NGC 6535. Sov. Astron. 1988, 32, p. 161.
- Peykov, Z. I. and Rusev, R. M. Spatial Structure of the Globular Cluster NGC6171. Sov. Astron. 1990, 34, p. 349.
- Peykov, Z. I. and Rusev, R. M. The spatial structure of the globular cluster M92. Astron. Rep. 1999, 43, p. 445.
- M. E. Sharina, V. L. 23. M. E. Sharina, V. L.; Afanasiev, and T. H. Pusia, Ages, metallicities and [{\ensuremath{\alpha}}/Fe] ratios of globular clusters in NGC 147, 185 and 205. Mon. Not. R. Astron. Soc. 2006, 372, p. 1259.
- Tadjibaev, I. U. and Nuritdinov, S. N. Can Globular Clusters in the Galaxy Be Classified by the Velocity Anisotropy Parameter? Ukr. J. Phys. 2019, 64, p. 271.
- Carballo-Bello, A. Julio et al., Outer density profiles of 19 Galactic globular clusters from deep and wide-field imaging. Mon. Not. R. Astron. Soc. 2012, 419, pp. 14–28.
- Cecco, A. Di et al, On the density profile of the globular cluster M92, arXiv:1302.1714v1 [astro-ph.SR]. 2013, 145, p. 103.
- Miocchi, P. et al., Star count density profiles and structural parameters of 26 galactic globular clusters, The Astrophysical Journal, 2013, 774, p. 151. [CrossRef]
- de Boer, J.L. et al., Globular cluster number density profiles using Gaia DR2. MNRAS. 2019, 485, pp. 4906-4935.
- Nuritdinov, S. N.; Tadjibaev, I. U. and Rastorguev A. S. To the Globular Cluster Classification Problem. Calculating the Concentration of Stars for 26 Clusters. Astronomy Letters. 2021, 47, pp. 163-169. [CrossRef]
- Nuritdinov, S. N.; Rastorguev A., S. and Tadjibaev, I. U. Determination of the degree of star concentration in globular clusters based on space observation data. Open Astron. 2022; 31, pp. 1–4. [CrossRef]
- William E. Harris, A New Catalog of Globular Clusters in the Milky Way, arXiv:1012.3224 [astro-ph.GA], 2010. arXiv:1012.3224 [astro-ph.GA], 2010.
- Baumgardt, M. Hilker, A catalogue of masses, structural parameters and velocity dispersion profiles of 112 Milky Way globular clusters, arxiv.org/abs/1804.08359v2, 2018, 478, pp. 1520-1557.
| 1 |
| 2 |
Figure 1.
Observational data for NGC 7492 on GAIA DR2.
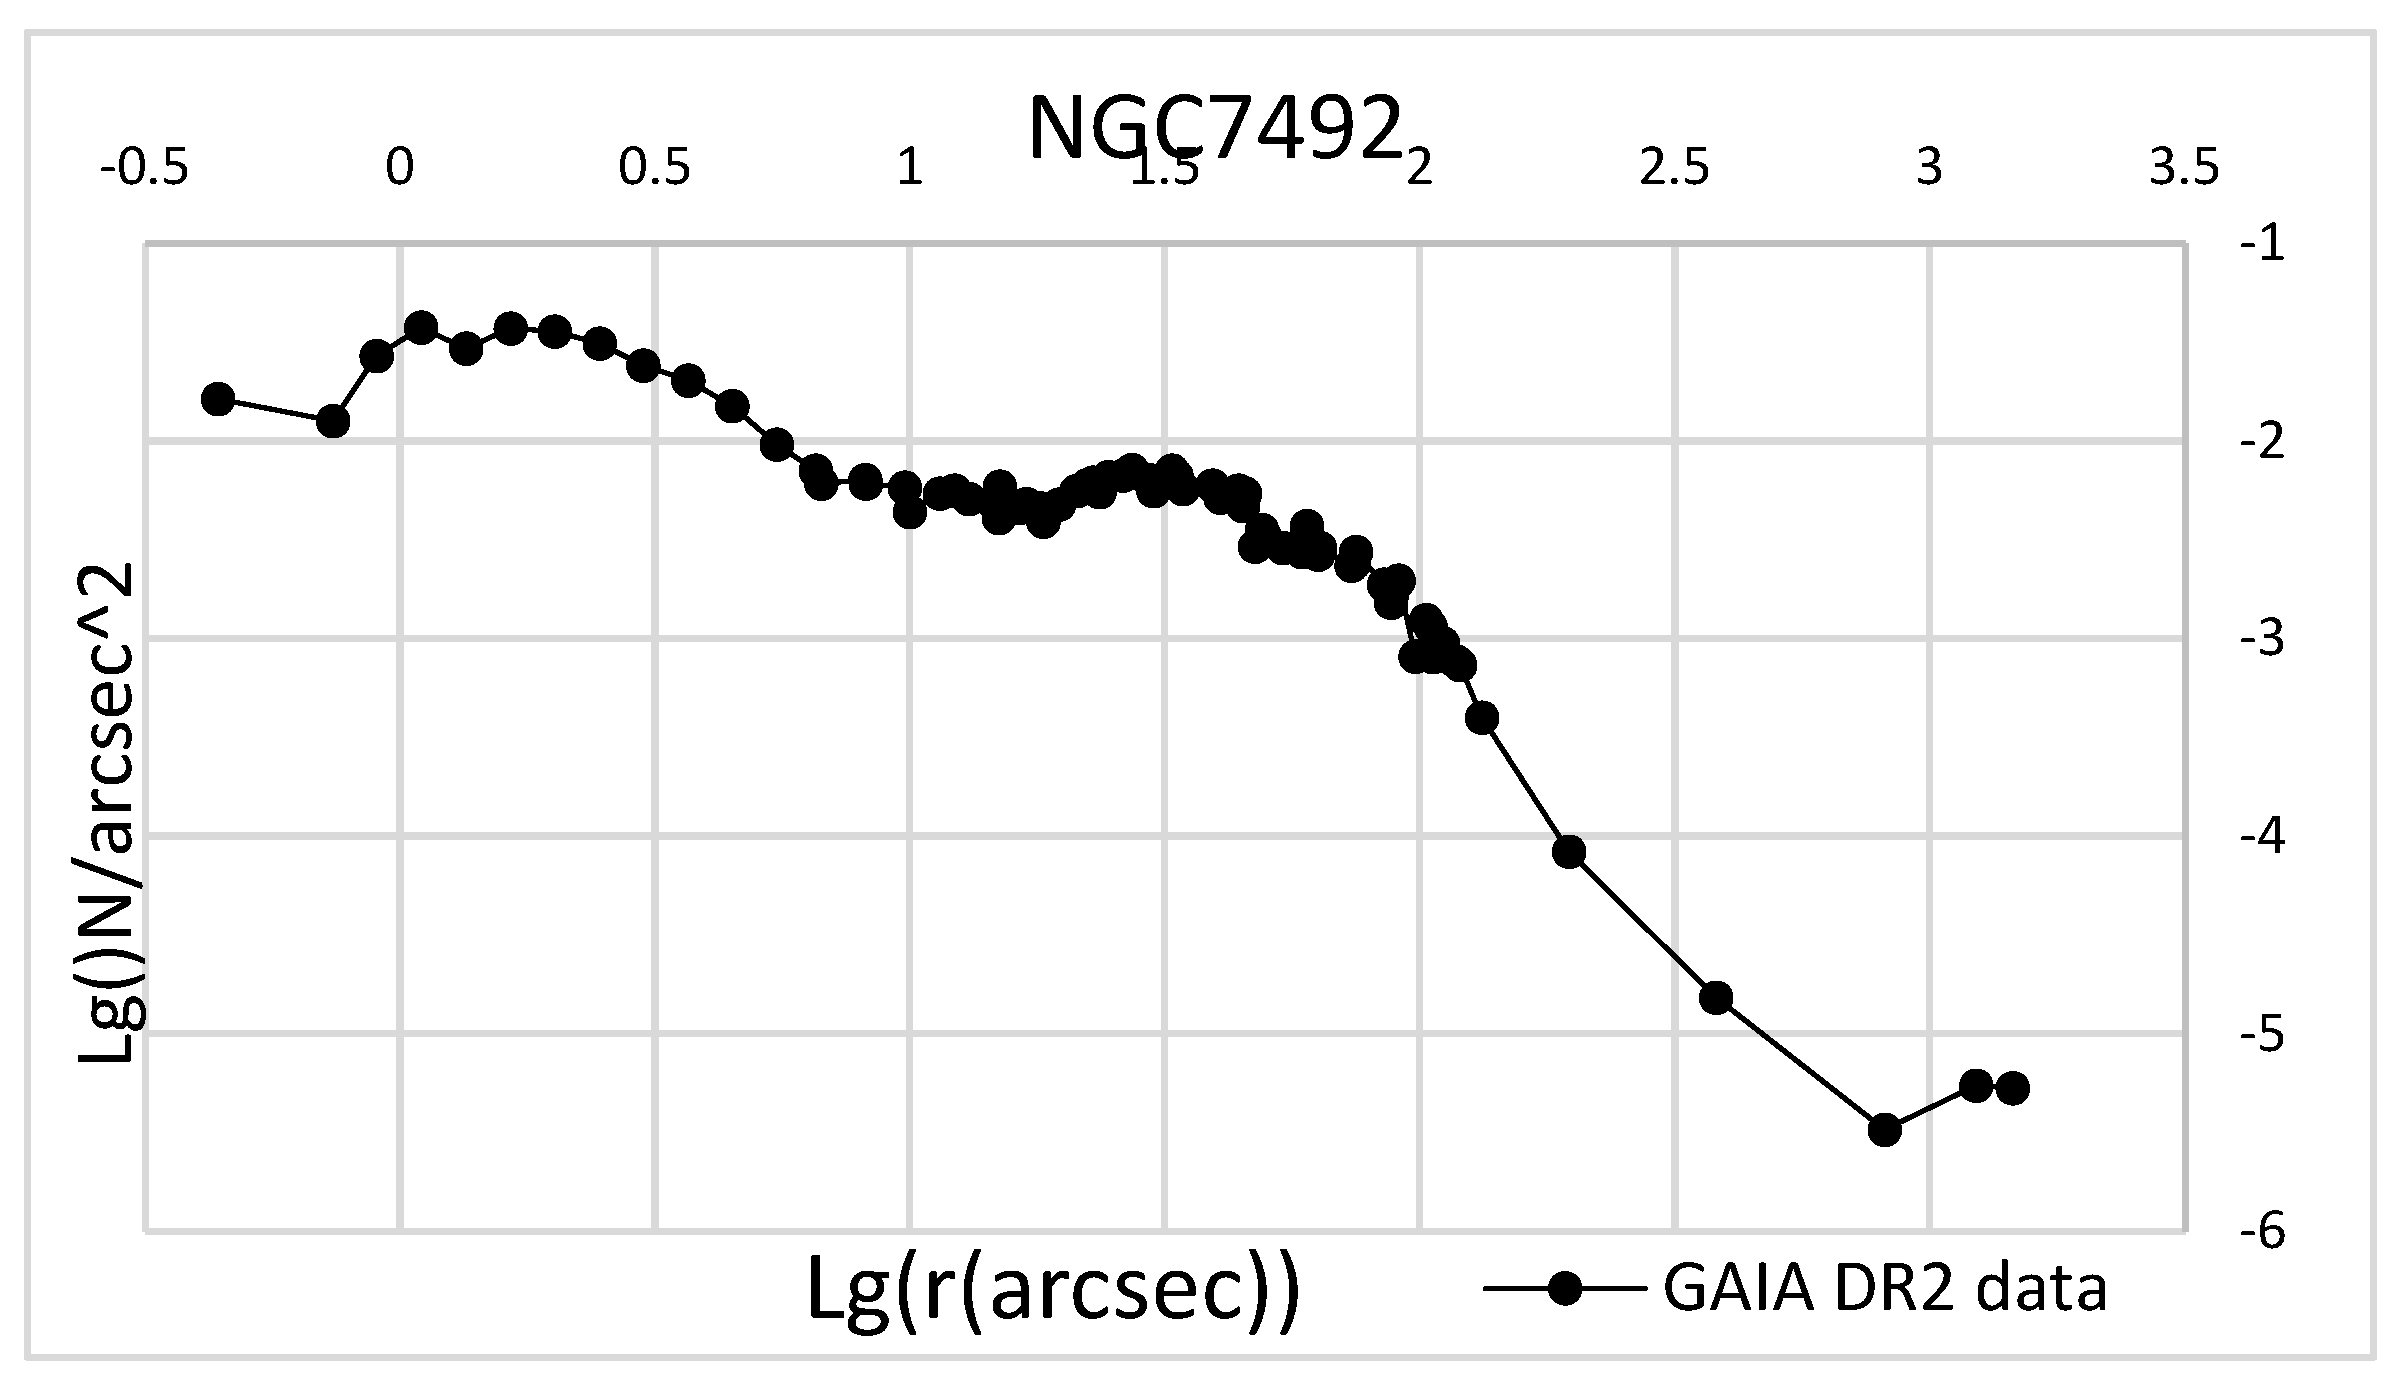
Figure 2.
Peculiarities of density decrease in the central region and on the periphery for NGC 6934.
Figure 2.
Peculiarities of density decrease in the central region and on the periphery for NGC 6934.
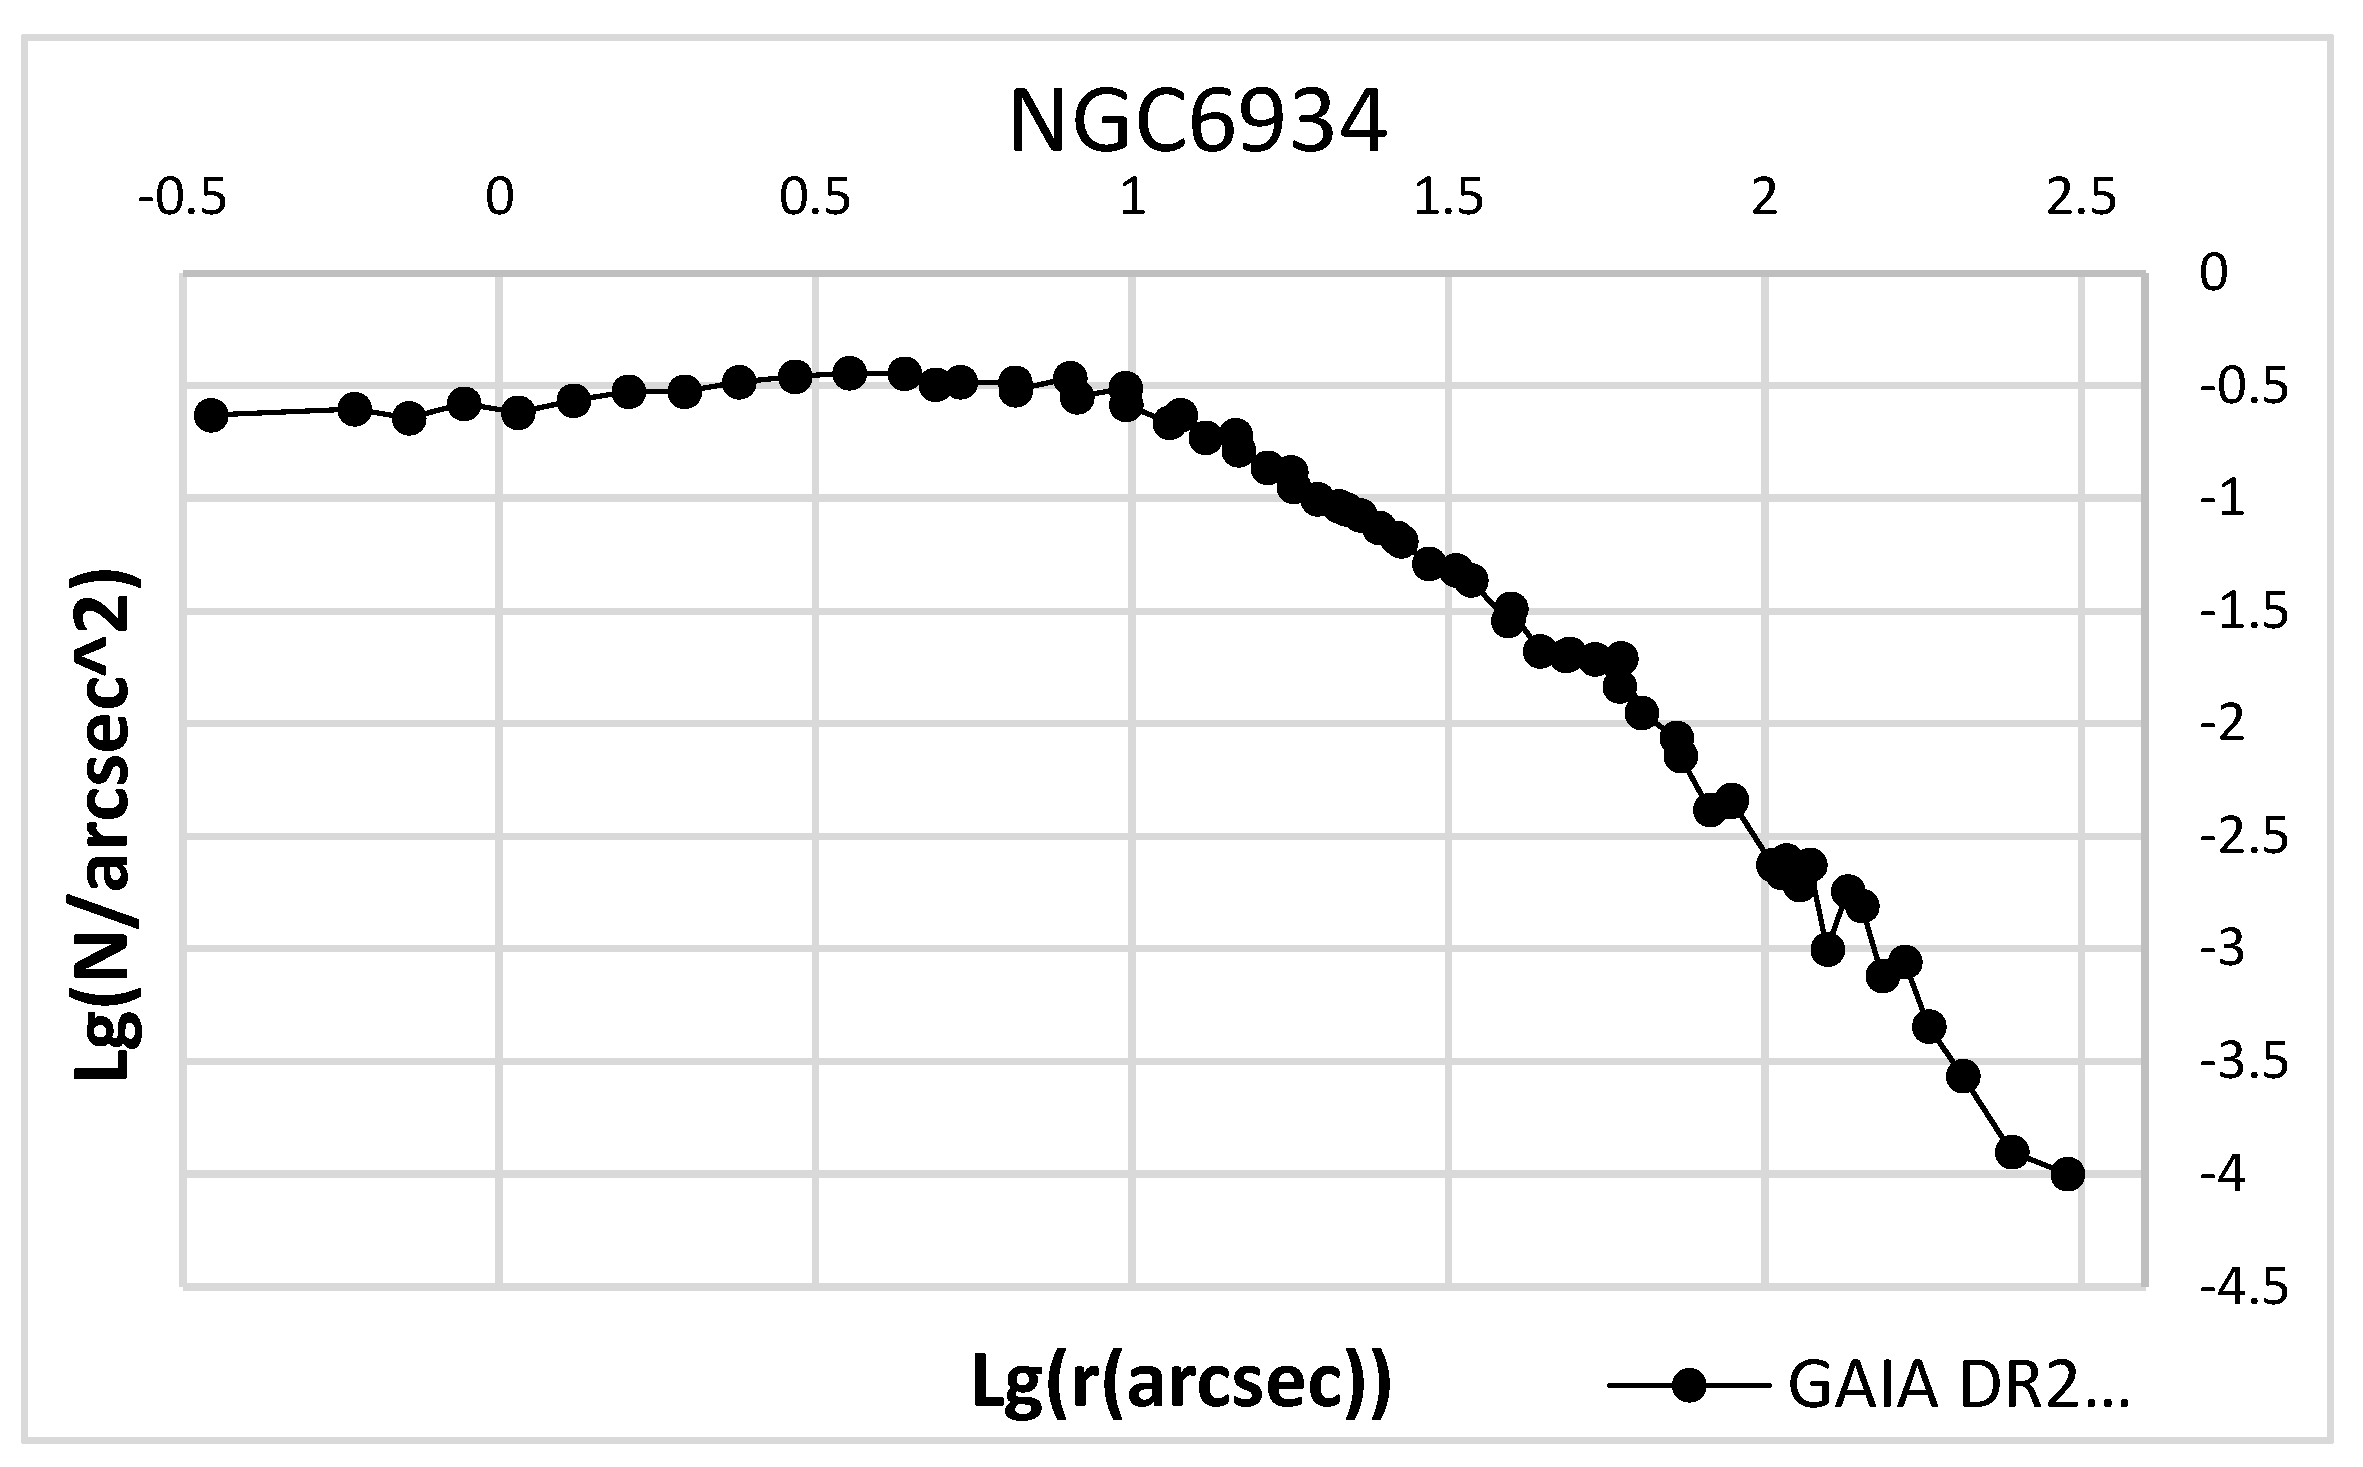
Figure 3.
Missing density values in the central part of the NGC 6254 profile.
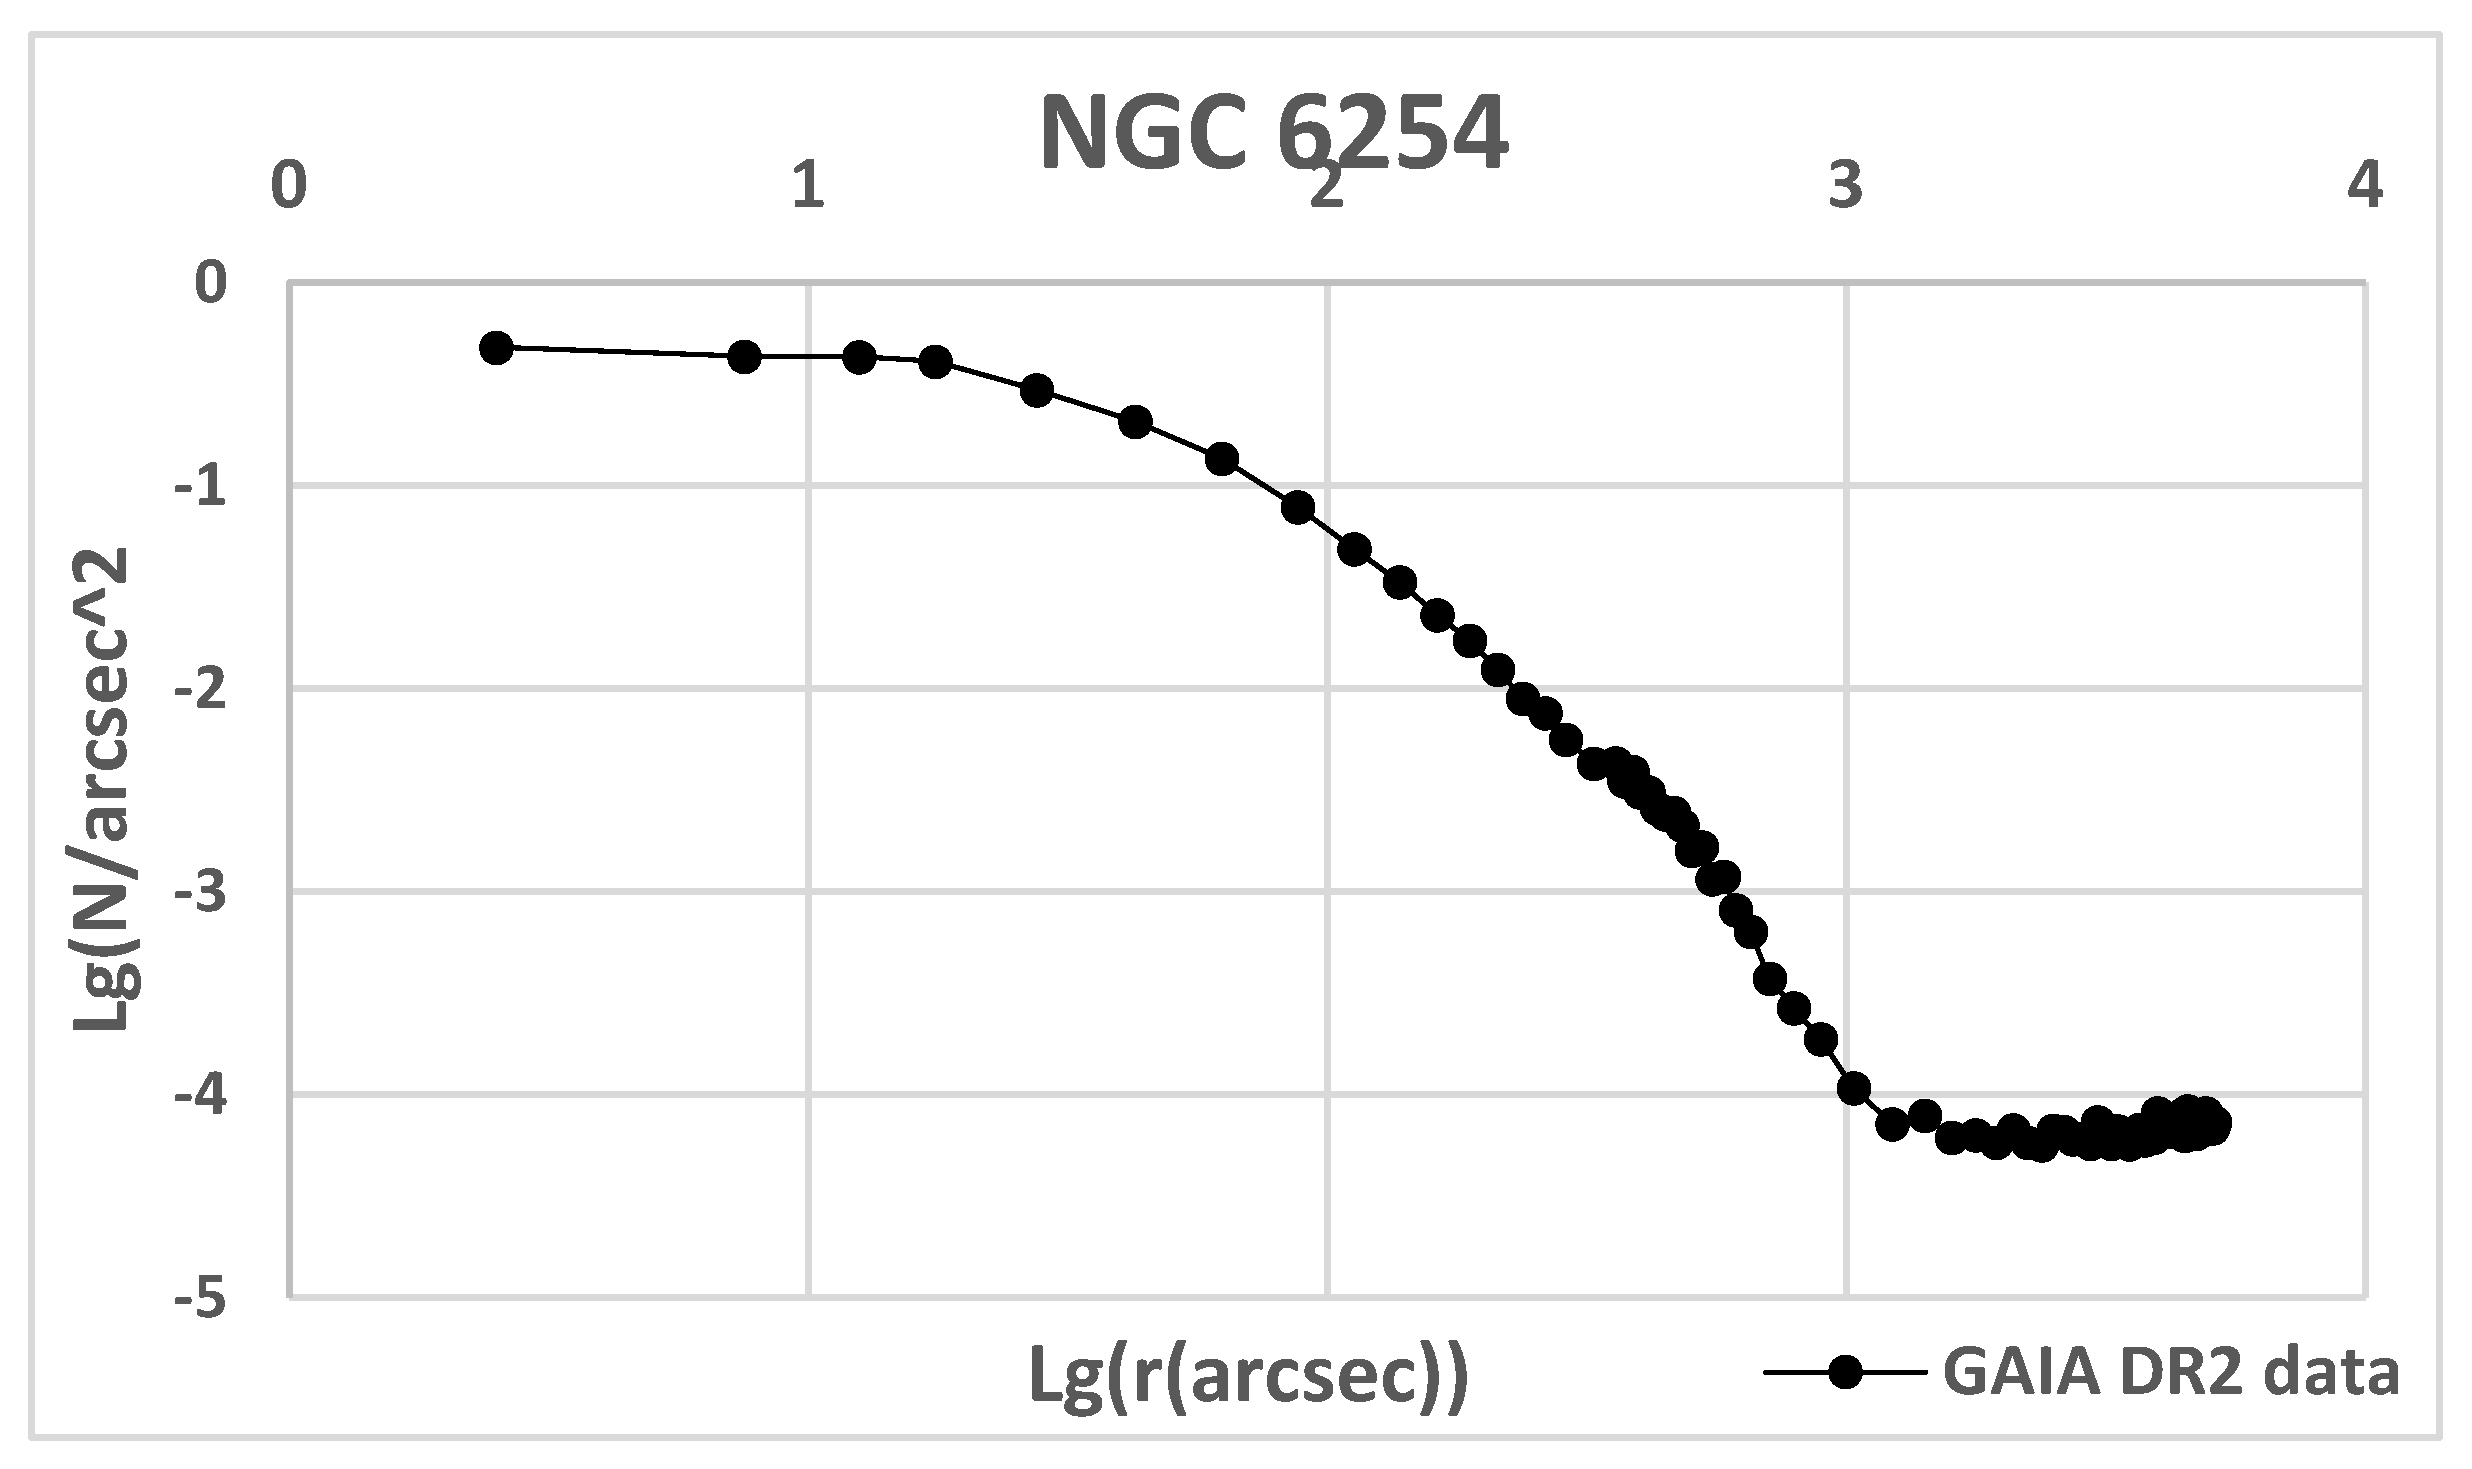
Figure 4.
Comparison of the density profiles of NGC 6809 obtained by the HST (circles) and GAIA (triangles) space telescopes.
Figure 4.
Comparison of the density profiles of NGC 6809 obtained by the HST (circles) and GAIA (triangles) space telescopes.
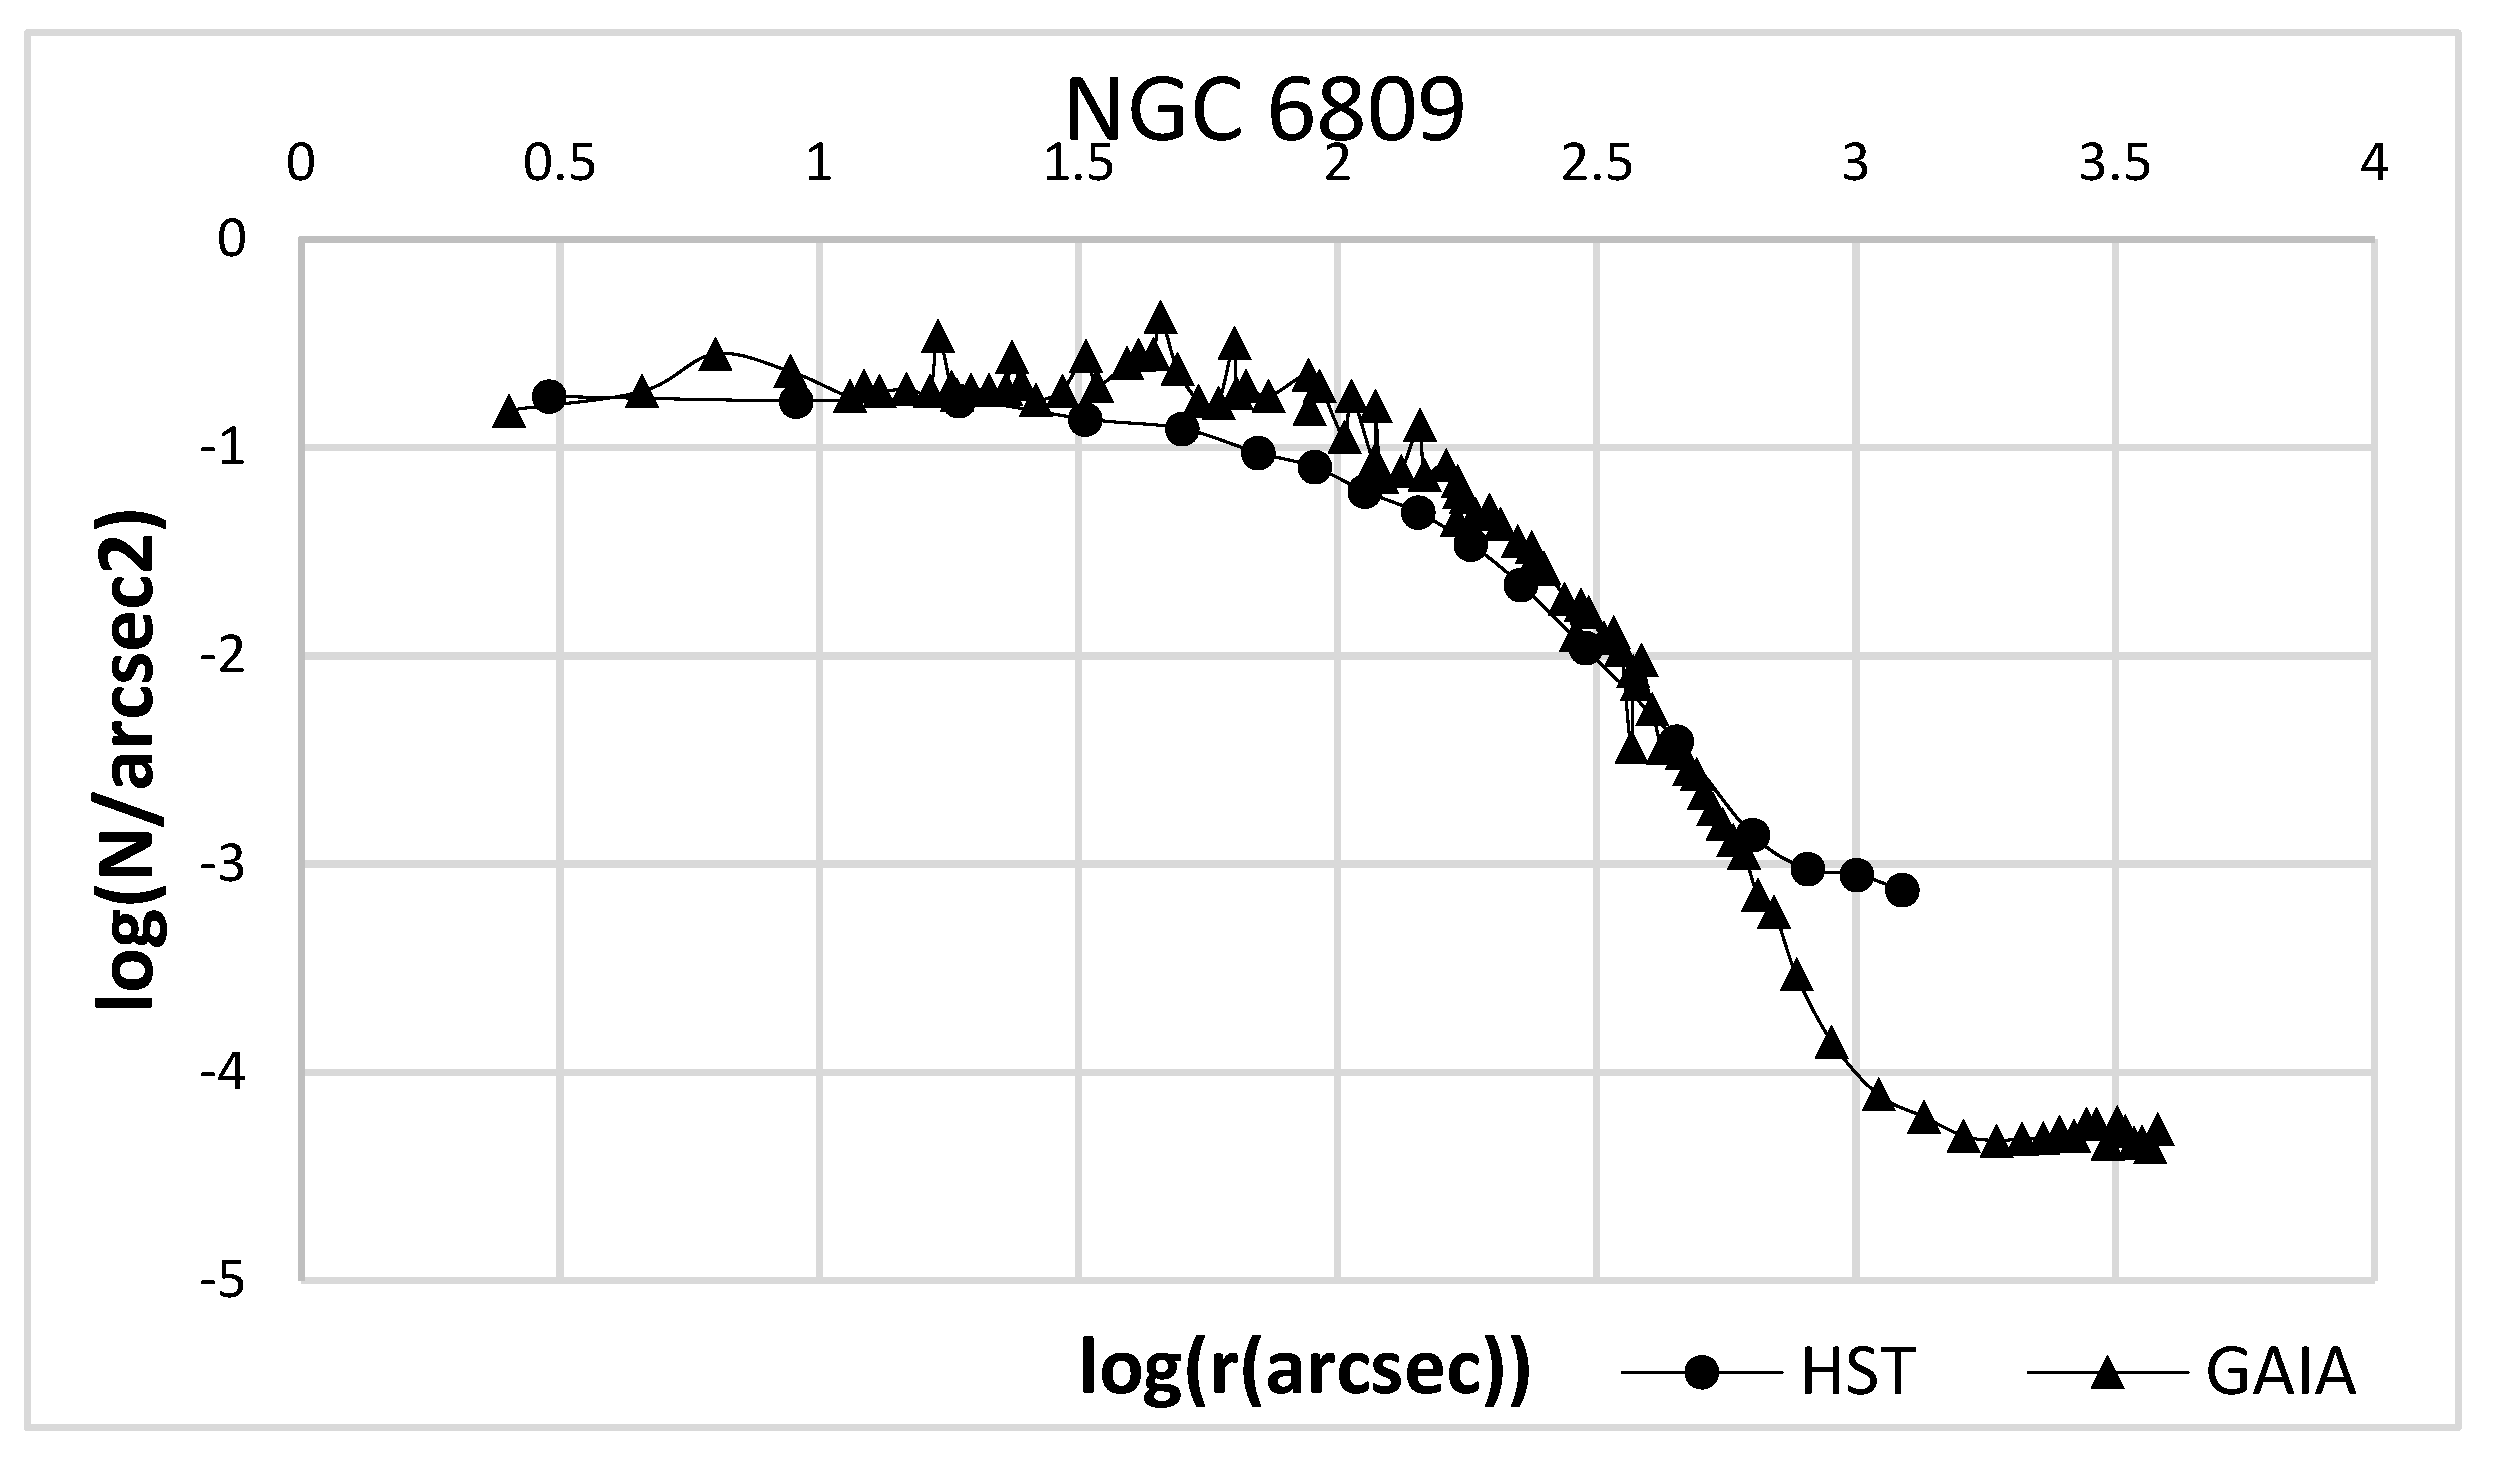
Figure 5.
Comparison of the density profiles of NGC 6121 obtained by the HST (circles) and GAIA (triangles) space telescopes.
Figure 5.
Comparison of the density profiles of NGC 6121 obtained by the HST (circles) and GAIA (triangles) space telescopes.
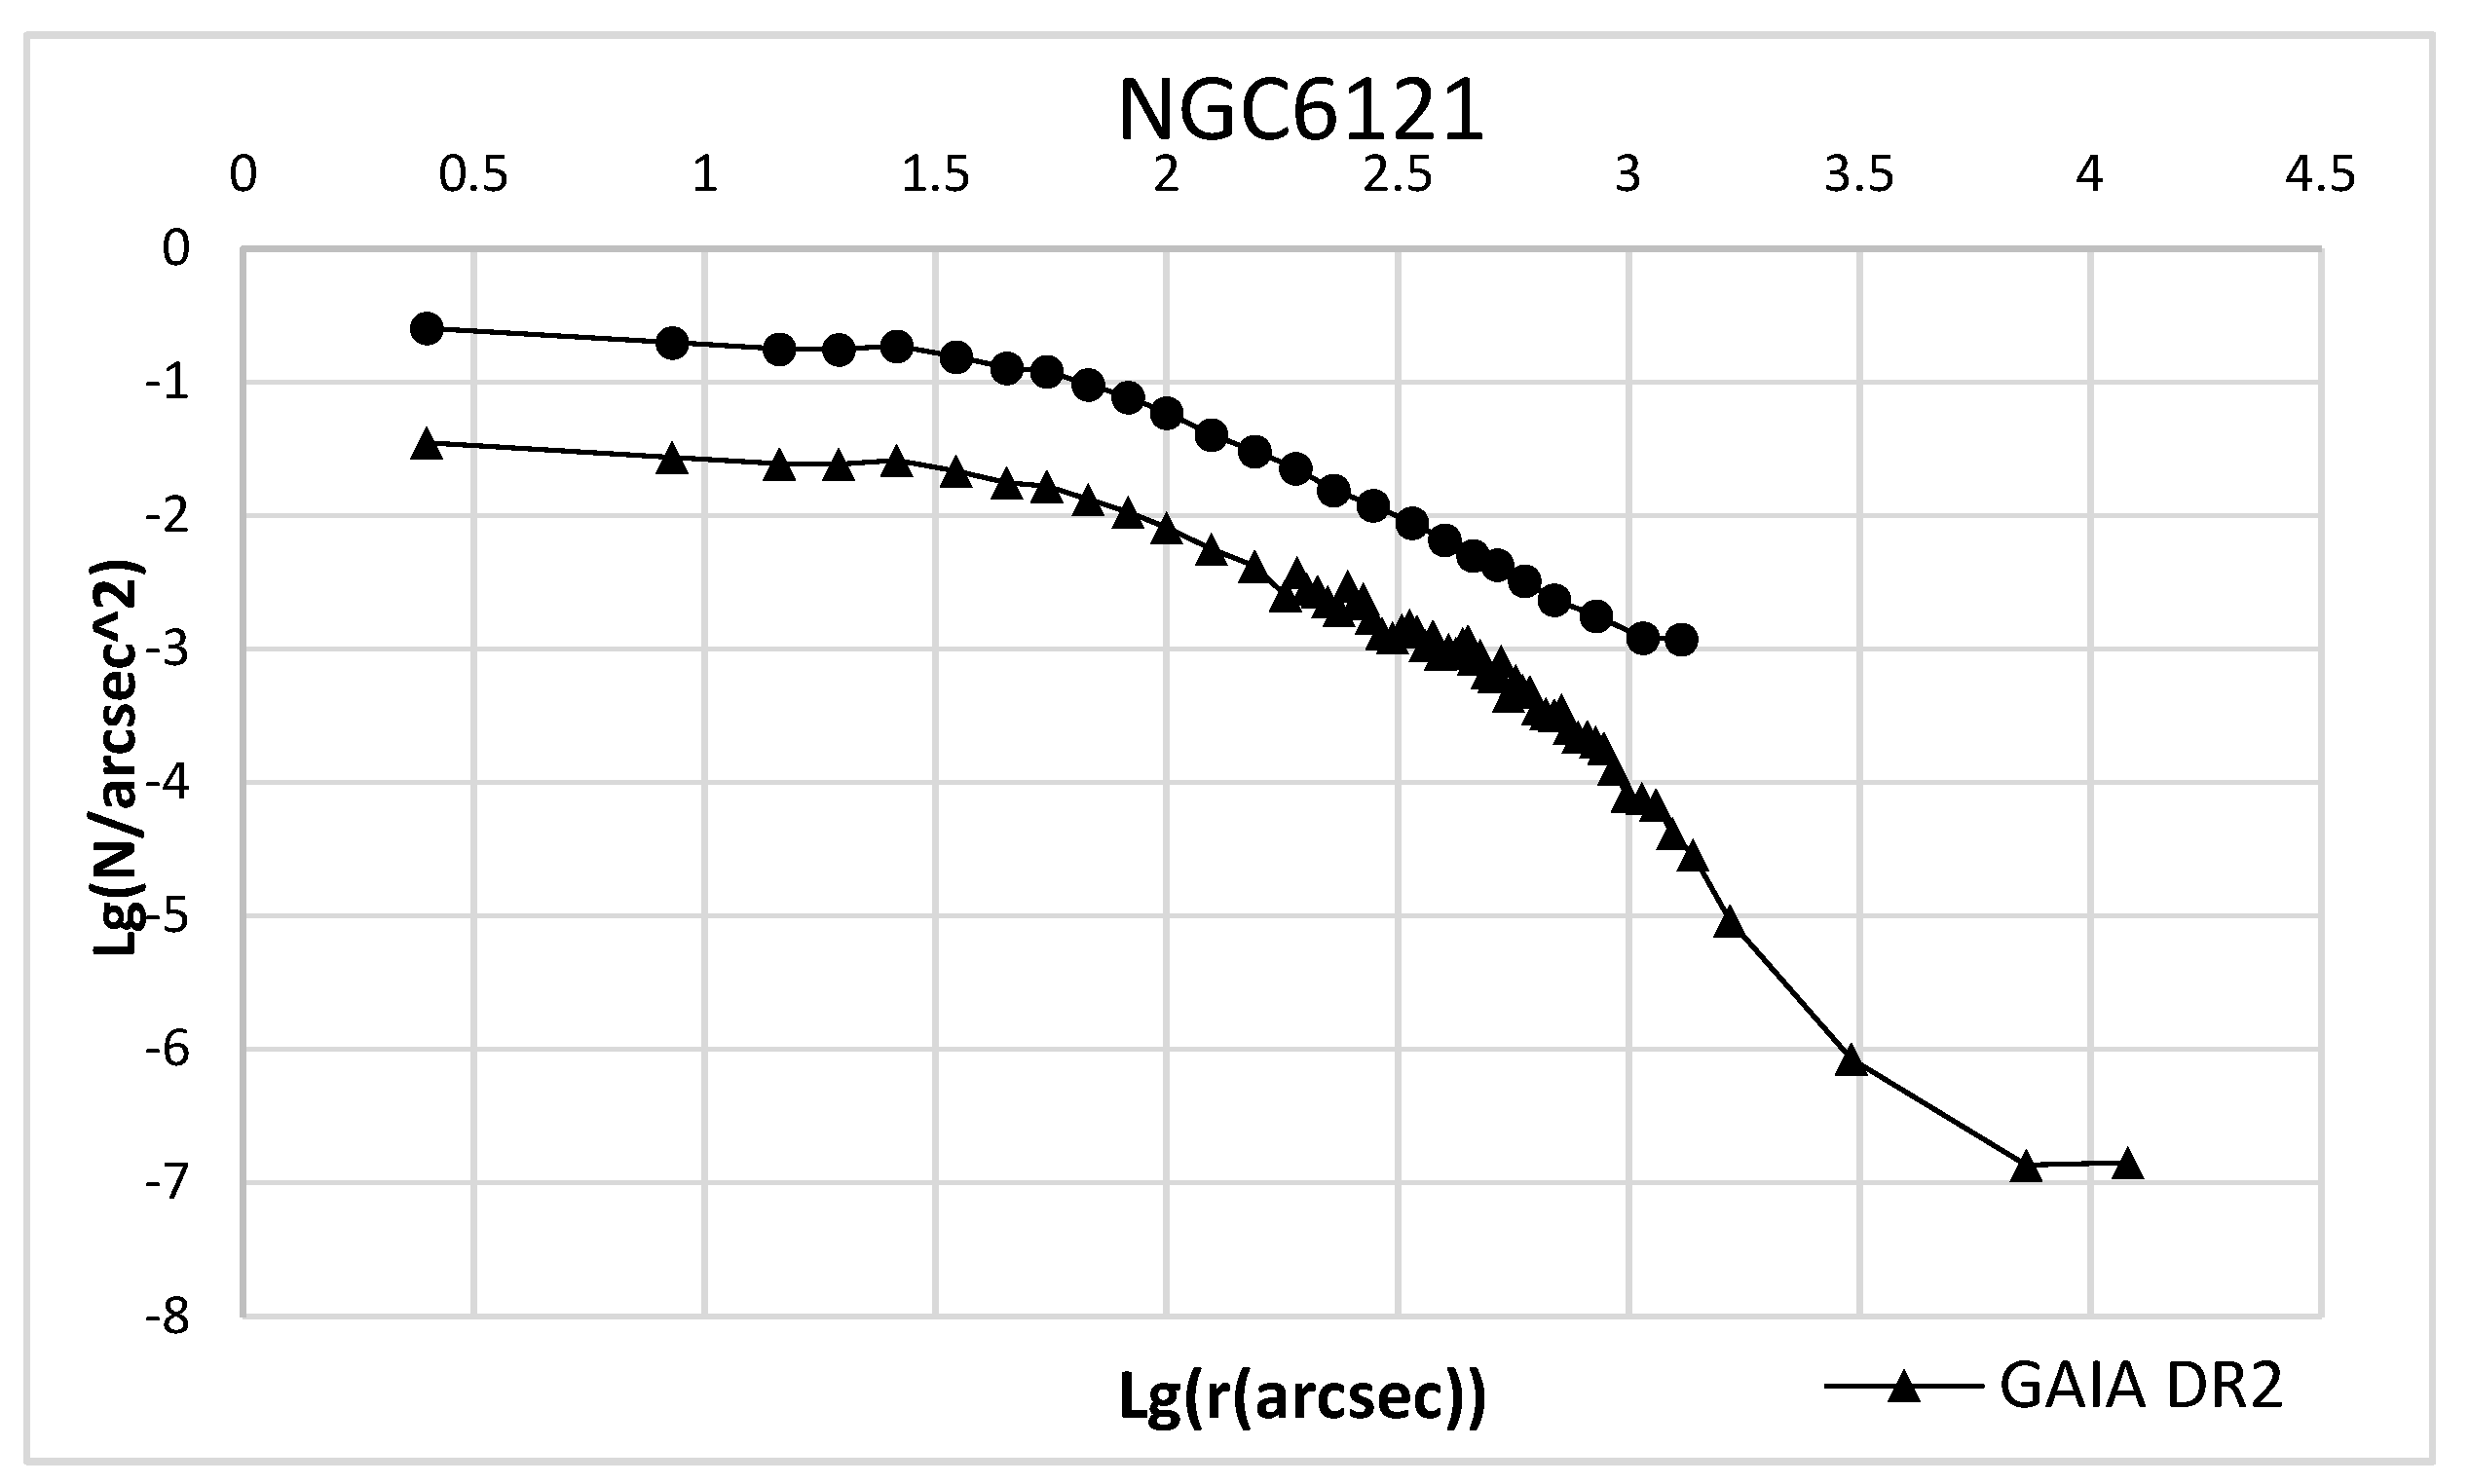

Table 1.
Values of free parameters of the GCs and errors of their determination.
| GC name | γ | ∆γ | r0 | ∆r0 | σ0 | ∆σ0 |
| NGC 104 | 0,97 | 0,15 | 22,03 | 4,01 | 7,37 | 0,4 |
| NGC 1261 | 1,02 | 0,23 | 18,2 | 5,1 | 1,47 | 0,13 |
| NGC 1851 | 1,26 | 0,68 | 5,39 | 2,75 | 23,52 | 2,08 |
| NGC 1904 | 1,02 | 0,4 | 8,65 | 4,67 | 4,38 | 1,2 |
| NGC 2808 | 0,87 | 0,06 | 12,51 | 1,05 | 11,9 | 0,28 |
| NGC 288 | 1,24 | 0,5 | 85,3 | 35,01 | 0,14 | 0,01 |
| NGC 362 | 0,82 | 0,11 | 7,88 | 1,26 | 13,63 | 0,56 |
| NGC 4590 | 1,32 | 0,44 | 43,17 | 13,64 | 0,63 | 0,06 |
| NGC 5024 | 1,07 | 0,31 | 23,93 | 8,98 | 0,37 | 0,05 |
| NGC 5053 | 1,26 | 1,04 | 109,92 | 86,95 | 0,008 | 0,002 |
| NGC 5272 | 1,12 | 0,67 | 25,24 | 17,69 | 1,55 | 0,41 |
| NGC 5286 | 1,24 | 0,38 | 18,38 | 5,1 | 1,48 | 0,07 |
| NGC 5466 | 1,5 | 0,6 | 107,18 | 44,3 | 0,02 | 0,002 |
| NGC 5634 | 0,79 | 0,17 | 3,26 | 1,04 | 0,86 | 0,13 |
| NGC 5694 | 0,93 | 0,14 | 3,34 | 0,63 | 1,25 | 0,07 |
| NGC 5824 | 0,94 | 0,09 | 3,25 | 0,49 | 6,65 | 0,44 |
| NGC 5904 | 0,73 | 0,25 | 16,32 | 8,62 | 2,22 | 0,41 |
| NGC 6093 | 1,01 | 0,23 | 7,44 | 2,17 | 6,94 | 0,99 |
| NGC 6101 | 1,61 | 0,62 | 79,53 | 30,3 | 0,06 | 0,01 |
| NGC 6171 | 1,3 | 0,44 | 36,32 | 10,81 | 0,3 | 0,02 |
| NGC 6205 | 1,12 | 0,3 | 45,29 | 13,66 | 1,81 | 0,15 |
| NGC 6229 | 1,16 | 0,61 | 9,1 | 5,09 | 0,72 | 0,16 |
| NGC 6235 | 2,07 | 1,36 | 32,23 | 15,98 | 0,18 | 0,02 |
| NGC 6254 | 1,1 | 0,5 | 40,95 | 24,15 | 0,52 | 0,15 |
| NGC 6266 | 0,61 | 0,07 | 5,7 | 1,17 | 2,98 | 0,24 |
| NGC 6273 | 0,92 | 0,13 | 22,36 | 3,61 | 1,22 | 0,08 |
| NGC 6284 | 0,57 | 0,06 | 2,38 | 0,63 | 0,1 | 0,01 |
| NGC 6341 | 1,17 | 0,63 | 16,58 | 10,35 | 2,49 | 0,73 |
| NGC 6388 | 0,63 | 0,08 | 4,35 | 0,95 | 2,15 | 0,17 |
| NGC 6496 | 1,73 | 0,8 | 70 | 29,91 | 0,03 | 0,01 |
| NGC 6541 | 0,51 | 0,08 | 3,91 | 1,26 | 3,37 | 0,31 |
| NGC 6569 | 1,36 | 0,3 | 24,61 | 4,97 | 0,08 | 0,01 |
| NGC 6626 | 0,93 | 0,18 | 12,13 | 2,49 | 0,57 | 0,03 |
| NGC 6637 | 1,55 | 0,33 | 27,8 | 4,73 | 0,4 | 0,01 |
| NGC 6656 | 1,17 | 0,34 | 80,92 | 23,29 | 0,19 | 0,01 |
| NGC 6715 | 0,91 | 0,06 | 5,35 | 0,42 | 4,4 | 0,09 |
| NGC 7078 | 0,49 | 0,05 | 1,77 | 0,7 | 17,73 | 3,7 |
| NGC 7089 | 0,99 | 0,46 | 14 | 8,34 | 4,6 | 1,36 |
| IC 1276 | 1,21 | 0,75 | 52,13 | 34,99 | 0,18 | 0,05 |
Disclaimer/Publisher’s Note: The statements, opinions and data contained in all publications are solely those of the individual author(s) and contributor(s) and not of MDPI and/or the editor(s). MDPI and/or the editor(s) disclaim responsibility for any injury to people or property resulting from any ideas, methods, instructions or products referred to in the content. |
© 2023 by the authors. Licensee MDPI, Basel, Switzerland. This article is an open access article distributed under the terms and conditions of the Creative Commons Attribution (CC BY) license (https://creativecommons.org/licenses/by/4.0/).
Copyright: This open access article is published under a Creative Commons CC BY 4.0 license, which permit the free download, distribution, and reuse, provided that the author and preprint are cited in any reuse.


