Submitted:
12 August 2023
Posted:
14 August 2023
Read the latest preprint version here
Abstract
Polymeric based nanoparticles are garnering significant interest for their potential in drug delivery. Specially, nanopolymers that have been functionalized with molecules, such as proteins or peptides, are a versatile vehicle for drug delivery. Curcumin (Cur) is one of the most commonly studied anticancer compounds and is widely acknowledged as having positive effects on human health. However, its insolubility and low bio-distribution greatly hinder the exploitation of its beneficial traits. In this study, our team created a nano delivery system which utilized a nanopolymer called PCL-PEG (poly(ε-caprolactone)-poly (ethylene glycol)). This system was functionalized with A6 peptide to enable targeted delivery of Cur. The system was designed with advantageous nanoparticles (NPs), including a stable zeta potential (–32.7), small size (54.3), uniform surface morphology, and high hydrophilicity (13.72°). In addition, targeted delivery systems exhibited high encapsulation efficacy (93 ± 0.89 %), and drug loading (16.7 ± 0.9 %), and were characterized by a slow and gradual release profile with a release of approximately 83.13 ± 0.12%. The MTT assay results showed that the formulation known as Cur-NPs-A6 caused a significant increase in cell death in MDA-MB-231 cancer cells (IC50 = 23.31 ± 0.85 µM). The designed delivery system did not cause any harm to the noncancerous MCF-10A cells (normal group). Furthermore, the results of both the RT-qPCR and invasion assays demonstrated that the designed system was able to effectively activate the apoptosis pathway and inhibit cell invasion. Our findings suggest that the use of the designed smart delivery system, which is functionalized with A6 peptide that has a high affinity for CD44 receptor - known to be upregulated in numerous malignant conditions, could be a highly efficient approach to treating cancer.
Keywords:
Targeted delivery
; A6 peptide
; PCL-PEG
; Nanoparticle
; Nanopolymer
; Curcumin
; Cancer
1. Introduction
Chemotherapy agents developed to treat cancer have many side effects [1]. Factors such as high dosage and low specificity are the two main factors in the side effects of chemotherapy drugs [2]. Using nanocarriers for targeted delivery [3], improving bio-distribution [4], and increasing the durability of effectiveness are the available solutions to reduce side effects and increase the efficiency of anti-cancer drugs [5]. Biocompatible and biodegradable polymers are a good candidate for targeted delivery of cancer chemotherapies [6]. Poly(caprolactone)–poly (ethylene glycol) (PCL-PEG) is a desirable polymer for drug delivery due to its good solubility, low production cost, high biocompatibility, and high bio-viability [7]. In a study conducted on ovarian cancer cells, it was found that PCL-PEG nanocarrier can increase the ability of Rutin to induce apoptosis in the studied cancer cells [8]. In another study, which was conducted to investigate the ability of the modified PCL-PEG nanoparticle to target colorectal cancer cells [9], it was found that this nanocarrier can increase the efficiency of Docetaxel in inhibiting the growth of cancer cells and its controlled release and uptaking by cells [10]. Also, in the study conducted on cells derived from glioblastoma, it was determined that PCL-PEG nanocarrier can improve the targeted delivery of 5-iodo 2′deoxyuridine [9].
Cur is a compound of plant origin whose anticancer properties have been investigated in many studies [11]. It is a diarylheptanoid found in Curcuma longa species [12]. Despite the many efforts that have been made so far, this compound has not shown good results in controlling cancer in clinical studies [13,14]. One of the factors that reduced the efficiency of Cur is its low solubility and bio-viability [15,16,17]. Therefore, the use of nanocarriers to improve Cur solubility can greatly help the performance of this agent [18]. It is also possible to improve its efficiency against cancer cells by using functionalized nanocarriers [13].
Peptides are one of the desirable compounds for functionalizing nanocarriers [19]. They are suitable therapeutic biomolecules due to their high binding affinity for target receptors and low-cost production [20]. Peptide A6 (AC-KPSSPPEE-NH2) is a peptide derived from urokinase protein, whose anti-invasive effects have been evaluated and confirmed in many studies [21]. This peptide has homology with a part of the CD44, and studies have identified this cell surface protein as the A6 receptor [22]. In addition to being used directly to inhibit tumor tissue invasion and angiogenesis [23], this peptide has also been used indirectly for functionalization of nanocarriers to target cancer cells, as CD44 expression is elevated in several types of cancer [24]. In a study that was conducted to target multiple myeloma, it was found that loading Carfilzomib in nanomicelle functionalized with A6 improves the performance of this drug and reduces its side effects [25]. Also, in another study that was conducted for targeted delivery of Epirubicin in multiple myeloma, it was shown that A6 functionalized nanocarriers significantly improve the performance of this drug [26].
The aim of the present study was the synthesis of PCL-PEG nanocarrier functionalized with A6 for targeted delivery of Cur against MDA-MB-231 cells. During this study, after nanoparticle synthesis and characterization of nanocarriers using tests such as MTT assay, RT-qPCR, and invasion assay, the efficiency of the designed nanocarrier for cancer cell targeting was evaluated. We observed that compared to free Cur, the designed nanocarrier has more potency in targeting cancer cells and its effects showed higher durability due to its controlled release.
2. Results
2.1. Characterization of NPs and NPs-A6
The Fourier-transform infrared (FTIR) spectrum of ε-Caprolactone provided information about the functional groups present in the molecule and its overall structure (Figure 1A). In the FTIR spectrum of caprolactone, several characteristic peaks were typically observed. A strong peak at around 1720 cm-1, which corresponded to the stretching vibration of the carbonyl (C=O) group in the lactone ring. The peak at around 1180 cm-1 corresponded to the stretching vibration of the C-O bond in the lactone ring. A peak at around 810 cm-1 showed the out-of-plane bending of the C-H bond in the lactone ring. Another peak at around 1450 cm-1 exhibited the bending vibration of the C-H bond in the lactone ring. Additionally, in the FTIR spectrum of ethylene glycol, several characteristic peaks were typically observed. A broad peak centered around 3400 cm-1, which corresponded to the stretching vibration of the hydroxyl (OH) group in ethylene glycol. Another peak at around 2900 cm-1 displayed the stretching vibration of the C-H bond in the molecule. A peak at around 1450 cm-1 demonstrated the bending vibration of the C-H bond in the molecule. A peak at around 1100 cm-1 corresponded to the stretching vibration of the C-O bond in the molecule. The intensity of the peak at 3400 cm-1 can be used as an indicator of the number of OH groups present in the molecule.
Moreover, the FTIR spectrum of polycaprolactone-Ethylene glycol (PCL-PEG) provided information about the functional groups present in the copolymer and the degree of interaction between PCL and PEG. A broad peak centered around 3400 cm-1 corresponded to the stretching vibration of hydroxyl (OH) groups in both PCL and PEG. A peak at around 2940 cm-1, showed the stretching vibration of aliphatic CH groups in PCL. A peak at around 1720 cm-1 corresponded to the stretching vibration of carbonyl (C=O) groups in PCL. A peak at around 1100 cm-1 corresponds to the stretching vibration of ether (C-O-C) linkages in both PCL and PEG. Also, the presence of peaks at both 1100 cm-1 and 2940 cm-1 suggested that PEG and PCL were well-mixed in the copolymer, with no significant phase separation. After the A6 peptide was conjugated to NPs the FTIR spectrum showed the strongly carbocyclic acid group around 1725 cm-1, which corresponded to the bond between peptide and PEG based on Stiglich reaction.
The 1H-NMR spectrum of PCL-PEG provided more information about the chemical structure of the copolymer and the distribution of its constituent monomers, poly(ε-caprolactone) (PCL) and poly (ethylene glycol) (PEG). In the 1H-NMR spectrum of PCL-PEG, several characteristic peaks were observed. A peak at around 4.1 ppm corresponds to the protons (H) in the methylene (CH2) group adjacent to the carbonyl group (C=O) in PCL. Another peak at around 2.3 ppm corresponds to the protons in the CH2 group of the PCL backbone. Also, the peak at 4.0 ppm corresponds to the protons in the CH2 group of the PEG backbone. The broader peak at the PCL methylene group (around 2.3 ppm) indicated a wider distribution of PCL chain lengths in the copolymer (Figure 1B). When the A6 peptide conjugated to NP, the 1H-NMR showed more peaks about the chemical structure and conformation of the NP-A6 (Figure 1C). A peak at 1.4 ppm corresponded to the protons in the proline side chain (-CH2-CH2-C=O), and the one around 3.2 ppm showed the protons in the serine side chain (-CH-OH). A peak at around 3.8 ppm explained the protons in the glutamic acid side chain (-CH2-COO-). A peak at around 7.3-7.5 ppm illustrated the protons in the aromatic rings of the tryptophan and tyrosine residues. Peaks between 0.8-1.2 ppm and 1.8-2.2 ppm correspond to the protons in the peptide backbone (-NH-CαH and -CαH-CO-NH-, respectively). Finally, the peak in the range of 10-13 ppm corresponds to the acidic proton on the carboxylic acid group, which is related to the bond between PEG and peptide as observed in the FTIR result (Figure 1D).
Furthermore, the size distribution and zeta potential (DLS and zeta sizer) of formulations were examined (Figure 2). The results of the DLS analysis showed that all the synthesized formulations were in the nano range, as the size of the PCL-PEG nanopolymer was 54.3 nm. Moreover, Cur-NPs and Cur-NPs-A6 sizes were 67.6 and 76.41 nm, respectively (Figure 2A, B, and C). According to the findings, the loading of Cur to the polymer chain led to an increase in the size of spherical nanoparticles. The NPs had a zeta potential of approximately -32.7 mv, but after the loading of Cur, the zeta potential of the NPs changed to -12.6 mv. Additionally, Cur-NPs-A6 had an average zeta potential of -13.8 mV (Figure 2D, E, and F).
Furthermore, the surface morphology of these nanoparticles was examined using a scanning electron microscope, which revealed an approximately spherical shape (Figure 3). The SEM images revealed that the presence of Cur and A6 caused the surface of the nanoparticles to become slightly uneven and deviate from their spherical shape. Based on the EDX analysis, it was observed that the NPs and Cur-NPs consisted of oxygen and hydrogen, whereas nitrogen was detected only when the peptide was conjugated to the surface of the nanoparticles.
Further, the hydrophilicity property of surfaces is another important feature of targeted delivery systems. Based on the results shown in Figure 4, the contact angles of samples were 13.72°, 39.14°, and 31.53° for NPs, Cur-NPs, and Cur-NPs-A6, respectively. It is evident that the hydrophilicity of the substances was affected by their structure and surface characteristics. Furthermore, it has been reported that the hydrophilicity level decreases when Cur is loaded in the core of the NPs.
2.2. Standard Concentration and Encapsulation Efficiency
The yield percentage of drug loading of the Cur-NPs and Cur-NPs-A6 were 15.6 ± 1.2 and 16.7 ± 0.9%, respectively. Moreover, the encapsulation efficiency presented by of the Cur-NPs was about 92 ± 1.1 % and Cur-NPs-A6 was 93 ± 0.89 %. It is clear that the nanoparticles we designed have significantly enhanced the solubility of Cur.
2.3. Drug Release Profile
To investigate the effect of nanoparticles on drug cytotoxicity, the UV spectroscopy method was used for conducting an in vitro release study of Cur in a pH 7.4 solution which was a crucial aspect of the design of nanoparticles.The release study was conducted on free Cur, Cur-NPs, and Cur-NPs-A6 in a PBS solution, examining the impact of biochemical and chemical parameters on the release profiles (Figure 5). The Cur-NPs system exhibited a release rate of approximately 75.1 ± 0.22 % over a period of 100h, with no significant burst release. In contrast, the free Cur system showed a burst release, with 40% of Cur released in the first 24h. Moreover, the Cur-NPs-A6 system had a better release profile than Cur-NPs, with a release of approximately 83.13 ± 0.12 %. It is worth noting that the targeted delivery systems demonstrated a controlled release for over 100h, and on the fourth day, released more Cur than the carrier-free system. The study found that the NPs exhibited desirable features, such as slow, controlled release, and high selectivity. Additionally, various models, including zero order, first order, Higuchi, and Korsmeyer-Peppas, were used for model fitting.
Based on the data, it appears that the Cur from Cur-NPs and Cur-NPs-A6 were released in a manner consistent with the Higuchi model. Also, the cumulative percentage of Cur release over time closely adhered to the Higuchi model, with high R2 coefficient values of 0.9817 for Cur-NPs (Figure 6).
In addition, the Higuchi model accurately tracked the cumulative percentage of Cur release as time passed for Cur-NPs-A6, with an impressive R2 coefficient value of 0.9852, as shown in Figure 7.
2.4. MTT Assay
To assess the cytotoxicity profiles of the designed delivery systems, MTT assays were performed on the human breast cancer cell line MD-MBA-231 and the human breast epithelial cell line MCF-10A for 48h. Free Cur, Cur-NPs, and Cur-NPs-A6 were tested at various concentrations (0-60 µM) (Figure 8). In accordance with Figure 8A, in comparison to Free Cur, Cur-NPs and Cur-NPs-A6 exhibited the most cytotoxicity effect on the MD-MBA-231 cells in a dose-dependent manner. Cur-NPs and Cur-NPs-A6 demonstrated 74.2 ± 0.13% and 82.9 ± 0.09% cytotoxicity (at a concentration of 60 μM), respectively. On the other hand, it was observed that Free Cur resulted in higher levels of cytotoxicity on MCF-10A cells as the dosage increased, and after 48h of incubation (as illustrated in Figure 8B). However, Cur-NPs-A6 exhibited minimal cytotoxicity on MCF-10A cells, indicating that this system reduced the non-specific toxicity caused by Cur. The IC50 values for the studied group are shown in Figure 8C.
2.5. Gene Expression Analysis
Cur has an impact on various biological pathways [27,28]. As shown in Figure 9, after 48h of treatment with delivery systems containing Cur, the gene expression of Bcl-2 and hTERT significantly decreased. Free Cur, Cur-NPs, and Cur-NPs-A6 increased Bax fold expression to 1.3, 2.8, and 2.3, respectively. The fold change of Bcl-2 for free Cur, Cur-NPs, and Cur-NPs-A6 were 0.65, 0.37, and 0.29, respectively. Also, the fold change in hTERT expression was observed to be 0.52, 0.54, and 0.61 for free Cur, Cur-NPs, and Cur-NPs-A6. Also, we found that free Cur and NPs have negative effects on the expression of MMP-2, MMP-9, and CD44. Cur-NPs-A6 significantly reduced CD44 expression to 0.3, while the fold change of Cur-NPs and free Cur were 0.44 and 0.7, respectively. A comparison of the designed carriers with control cells revealed that MMP-2 expression was 0.56-fold less in the Cur-NPs-A6 group, 0.62-fold less for Cur-NPs, and 0.71-fold less for free Cur-treated cells. Similarly, for MMP-9, Cur-NPs-A6 reduced its expression to 0.49, Cur-NPs to 0.51, and free Cur to 0.6 compared to control cells.
2.6. Invasion Assay
To examine the impact of Cur and NPs on the invasion of MDA-MB-231 cells, an invasion analysis was carried out (Figure 10). In this analysis, 7 snapshots were taken from each insert, and the average was calculated for all groups. The findings indicated that free Cur, Cur-NPs, and Cur-NPs-A6 all had an inhibitory effect on the invasion of tumor cells, which was consistent with the gene expression analysis results. Notably, the Cur-NPs-A6 group exhibited the strongest anti-invasion effect compared to the other treated groups. In the fields examined, the average number of cells were 139.3 ± 1.6 for the control group, 97.2 ± 2.23 for the free Cur group, 62.4 ± 1.08 for the Cur-NPs group, and 32.2 ± 4.12 for the Cur-NPs-A6 group.
3. Discussion
The FTIR and 1H-NMR spectra that were observed provided valuable insights into the material's purity and confirmed the successful synthesis of the polymer and peptide conjugation [29]. Upon examining the SEM results, it was noted that the polymers initially formed interconnected and stretched clusters before the nanoparticles were prepared [30]. However, after the nano preparation process, the polymers underwent a transformation into smooth and separate spheres. Also, the addition of peptide and Cur to the polymer spheres resulted in surface irregularities that caused a slight distortion in their spherical shape [31]. These irregularities gave rise to distinct chemical properties for each system, as evidenced by the Zeta results [32]. Initially, the nanoparticles exhibited a negative charge of -32.7. However, upon incorporating Cur and peptide into the system, the polarity of the Cur-NPs and Cur-NPs-A6 decreased to -12.6 and -13.8, respectively. This decrease in polarity can be attributed to the non-polar characteristics of Cur and peptide, which contribute to the formation of a less polar surface [33].
The inclusion of Cur and the peptide had a notable impact on the particle size. Upon peptide conjugation, the size of Cur-NPs increased to 76.41 nm, and with the introduction of a larger Cur molecule, the size decreased to 67.6 nm, thus corroborating the SEM findings. Conversely, the contact angle analysis provided confirmation of the nanoparticles' polarity. The inherent hydrophilicity of the particles resulted in a small angle with the surface, which was then amplified upon the addition of Cur. However, upon incorporating the peptide into the system, the angle decreased to 31.53°, still falling within the hydrophilic range. This indicates that both NPs and NPs-A6 serve as hydrophilic carriers, potentially enhancing the distribution of Cur in aqueous environments such as blood [30]. Consequently, the variations in size and surface properties prompted distinct biochemical attributes for each system, which played a pivotal role in drug loading, release profiles, and cellular analyses [31].
Given that Cur is a hydrophobic anticancer compound, it was anticipated that its loading and release in a PBS solution would be suboptimal [30]. As a result, a stock solution containing 20% ethanol and 80% PBS was employed to examine the encapsulation efficiency and release. The data revealed a significant loading rate of 15.6 ± 1.2 % for Cur in the nanoparticles (NPs). When the NPs were conjugated with the A6 peptide, the loading rate increased to 16.7 ± 0.9%, likely due to hydrogen bond formation between Cur and the NPs-A6 surface. Consequently, the encapsulation efficiency reached 92 ± 1.1 % with the help of a polymer matrix, and with the A6 peptide, it attained 93 ± 0.89 %, a negligible difference. The possibility of a significant discrepancy in loading and encapsulation outcomes is therefore dismissed [34]. Additionally, the Higuchi law was found to the release profile of Cur-NPs. According to the Higuchi equation, values of n = 0.5 and K = 0.9 were obtained, adhering to the Fickian model [35]. This suggests that diffusion predominantly governs the release of Cur [36].
Typically, free Cur delivery systems display a two-phase release graph characterized by a burst release phase, followed by a slow and sustained release phase [37]. In the case of free Cur, the release of Cur continued to rise after the burst release phase due to the concentration within the dialysis bag. However, while the initial burst release phase is crucial for delivering Cur, the sustained release is necessary to avoid the side effects associated with anticancer agents like Cur. Nevertheless, NPs exhibited a linear increase in Cur release over four days without any burst release. Additionally, the Cur diffusion rate exceeded the solvent transport rate.
The surfaces of Cur-NPs reached an absorption equilibrium quickly, resulting in time-dependent links and a diffusivity component in the kinetics of the phenomenon. The cumulative release of Cur-NPs and Cur-NPs-A6 after 100h was 75.1 ± 0.22 % and 83.13 ± 0.12 %, respectively. The surface area available for drug release played a crucial role in improving drug release in nanoparticle formulations [38]. Generally, Cur release from polymeric nanoparticles was smooth, slow, and showed promise with minimal dosage [39]. Based on the results of Cur release, the designed release systems were expected to have a more targeted effect. Since cytotoxicity of anticancer treatments are critical for further bio applications, MTT assays were conducted using MD-MBA-231 and MCF-10A cells. Thus, cytotoxicity experiments were performed against the human breast epithelial cell line MCF-10A and the breast cancer cell line MD-MBA-231 to validate the selective release profile of Cur from the novel Cur-NPs systems. Free Cur, Cur-NP, and Cur-NP-A6 were also investigated, and a significant difference was observed in the MTT results.
According to the results depicted in Figure 8, MCF-10A cells exhibited a dose-dependent cytotoxicity effect when treated with free Cur 48h. In contrast, minimal cytotoxicity was observed in MCF-10A cell lines treated with Cur-NPs and Cur-NPs-A6. These findings suggest that Cur-NPs and Cur-NPs-A6 significantly reduced non-specific cytotoxicity caused by Cur on the MCF-10A cells. Moreover, Cur-NPs and particularly Cur-NPs-A6, demonstrated stronger cytotoxicity against MB-MDA-231 cancer cells than free Cur. Cur's release profile indicates that by confining it within the hydrophobic core of the NPs, a more moderated and gradual release can be achieved [40]. So, there was evidence in the MTT results, particularly after 48h, where the Cur-NPs and Cur-NPs-A6' sustained presence in the medium leads to a higher level of effectiveness for Cur. Thus, the nanocarrier systems may explain the improved therapeutic effect on cancer cells [41].
In this study the expression of Bax, Bcl-2, hTERT, MMP-2, MMP-9, and CD44 genes were examined. The presence of free Cur led to an increase in Bax expression, but this increase was more significant in the groups treated with Cur-NP and Cur-NP-A6. This increase may be due to enhanced membrane penetration and slow release of Cur from nanoparticles, leading to a longer-lasting effect on the studied cells [42]. On the other hand, the designed systems showed a higher reduction in Bcl-2 and hTERT expression compared to free Cur. Additionally, the suppression of MMP-2, MMP-9, and CD44 expression was greater in the Cur-NPs and Cur-NPs-A6 groups than the free Cur group. As Bax, BCL-2, and hTERT play crucial roles in apoptosis induction [43], and CD44, MMP-2, and MMP-9 are linked to invasion and metastasis [44], it is anticipated that the designed systems can serve as suitable carriers for enhancing the anticancer effect of Cur.
4. Materials and Methods
4.1. Materials
The A6 peptide was synthesized by Peptide Chemistry Research Institute (K. N. Toosi University of Technology, Tehran, Iran) and purified by HPLC to ensure purity ≥ 99%. Polyethylene glycol (4kDa), ε-Caprolactone, 3-(4,5-dimethyl-2-thiazolyl)-2, 5-diphenyl-2-H-tetrazolium bromide (MTT), polyvinyl alcohol (PVA), Cur, 4-dimethylaminopyridine (DMAP), N-hydroxy-succinimide (NHS), N, N′-dicyclo-hexylcarbodiimide (DCC), succinic anhydride (SCA), and Diethyl ether were purchased from Sigma-Aldrich (St. Louis, MO). Dichloromethane (DCM), dimethylsulfoxide (DMSO), acetone, and ethanol (EtOH) were provided by Jinan Daigang Biomaterial Co., Ltd. Non-tumorigenic human breast epithelial cells (MCF-10A) and human breast cancer cells (MDA-MB-231) were provided by the Pasteur Institute (Tehran, Iran). Fetal bovine serum (FBS) and trypsin were purchased from Bioidea (Tehran, Iran), also DMEM/high-glucose was provided by DNAbiotech (Tehran, Iran).
4.2. Polymer Synthesis and Peptide Conjugation
The micellar copolymer PCL-PEG was synthesized through two steps as follows. Briefly, PEG-PCL copolymer was synthesized by ring-opening polymerization of ε-Caprolactone (ε-CL) and Polyethylene glycol (PEG) in the presence of SnOct2 as a catalyst [6]. For this purpose, 20 ml of ε-CL was added with 10 g of PEG. A solvent of DCM (40 ml) was utilized and the reaction balloon was adequately covered. The first stage was completed after 24h in an oil bath at 110°C on a stirrer with low speed at dark room. Is the second step, the obtained raw material was precipitated with diethyl ether and centrifuged with distilled water at 8000 rpm for three times. The synthesized polymer was lyophilized for 24h. Finally, DCC and DMAP were used to conjugate the A6 peptide to the freeze-dried polymer based on the Steglich reaction (Figure 11) [45].
4.3. Polymer Characterization
Hydrogen nuclear magnetic resonance (1H-NMR; Bruker Ac 500, Germany) in CDCL3 at 500 MHz and Fourier transform infrared (FT-IR; Nicolet 550 A, USA) were applied to characterize the formation of copolymer (PCL-PEG and PCL-PE-A6) [46].
4.4. Nanoparticle Preparation
The Nanoparticles (NPs) were prepared using the double emulsion (W/O/W) method [47]. Briefly, 40 mL DCM solution with a predetermined amount of PCL-PEG polymer was added dropwise into surfactant solution within 10 min under medium stirring at 40ºC. After 10 min of continuous stirring, the polymer self-assembled and formed NPs while the organic solvent evaporated. Following centrifugation at 8000 rpm, the NPs were washed three times with distilled water and then freeze-dried for 48h. Nanoparticles containing Cur were obtained through this method.
4.5. Nanoparticle Characterization
In the characterization of NPs, size and shape are two of the most significant parameters [48]. NPs may have different properties and possible applications depending on their size distribution and organic ligands. Hence, the surface chemistry and size distribution were measured by techniques such as Dynamic Light Scattering (DLS; Malvern Zeta sizer 3000HS, Malvern, UK), Scanning Electron Microscope (SEM, FEI, California, USA), Zeta potential (Malvern Zeta sizer 3000HS, Malvern, UK), and Contact angle (SDC100, Minder Hightech, China).
4.6. Preparation of Cur-Loaded NPs
The Cur-loaded NPs (Cur-NPs) were prepared using the double emulsion method [49]. In brief, 5 mL DCM containing 11 mg Cur was added drop-wise into 20 mL DCM containing 100 mg PCL-PEG copolymer (PCL-PEG/Cur at various w/w ratios 10:1), and then the mixture was located on stirrer for 180 s. Afterward, 3 mL of PVA as surfactant solution (3.2% w/v) was added drop-wise into the reaction probe to form a Water-Oil-Water (w/o/w) double emulsion, and next, remained on the stirrer for 15 min. Furthermore, Cur-NPs were centrifuged at 10.000 rpm for 15 min, washed with deionized water for three times, and lyophilized.
4.7. Evaluation of Encapsulation Efficiency
Cur was encapsulated during self-assembled in NPs within the hydrophobic cores. Therefore, to check the amount of drug loading in the NPs, a calibration Curve of concentration at 425 nm intensity was prepared by considering the peak at various concentrations of Cur [50]. Then, the graph was utilized to investigate drug loading and encapsulation efficiency. The concentration Curve with a correlation coefficient of R2 = 0.99 was linear in the range of 5-500 mM. To characterize the loading capacity (DL) and encapsulation efficiency (EE) of Cur-NPs and Cur-NPs-A6 [51], 5 mg of the Cur was dissolved in solvent (ethanol: water, 20:80 v/v) containing NPs. Then, the samples were centrifuged at 8000 rpm for 20 min, and the concentration of Cur in the supernatant of each sample was measured via UV-vis. Each intensity was related to the desired concentration using a calibration curve. Hence, the encapsulation efficiency (EE%) was determined using the formula (1):
×100
The weight of encapsulated Cur in NPs calculated using UV spectrophotometry (Varian, Cary 100 UV/Vis Spectrophotometer, USA) at 425nm. Additionally, another key parameter is drug loading (DL %), which was characterized as the ratio of incorporated Cur in the NPs to the total weight of NPs using formula (2):
4.8. In Vitro Release Study
Drug release behavior of Cur delivery systems was investigated using dialysis bag (molecular weight cutoff 12 kDa) diffusion. In order to create a sink condition, Cur-NPs and Cur-NPs-A6 were transferred to a dialysis bag in a receiver compartment (PBS: ETOH, 70:30) at pH 7.4. The sink condition was provided by an incubator shaker (Taitec, BR-42FL, Japan) at 100 rpm and 37°C. Moreover, the fresh solvent was replaced with the receiver solvent at intervals times (0.5, 1, 2, and 100h) after the samples were withdrawn. UV/Vis spectrophotometer was applied to characterize the released Cur value at 425nm.
4.9. Cell Culture
Human cancer cell lines (MDA-MB-231) and (MCF-10A) were cultured in Dulbecco's Modified Eagle Medium (DMEM) consisting of 1% pen/strep and 10% FBS. Further, the cultures were proliferation at 95% humidity, 37°C, and 5% CO2 to investigate the behavior of designed systems against studied cells.
4.10. Cell Viability Assay Methodology
The MTT technique was employed to study the effect of Cur in free, Cur-NPs, and Cur-NPs-A6 on MDA-MB-231 and MCF-10A cells. The cells were grown in 96 plates (7 × 10³ cells per well) for 24h, before being treated by free Cur, Cur-NPs and Cur-NPs-A6 for 48h at different concentrations (0-60 µM). Following that, media was removed and 20 µl of MTT solution (0.5 mg/ml) was added to each well [52]. After 4h of incubation, the formazan was dissolved in DMSO (60 µl) and the optical density was computed at 570 nm with a 650 nm reference by a microplate reader (ELISA Reader, MPRNM96, Latvia) [53]. Finally, cell viability was calculated using equation (3) [3]:
4.11. Gene Expression Analysis
Real-time PCR was used to measure the expression of target genes. For this purpose, MDA-MB-231 cells were cultured in 6 well plates (5 × 10⁵ cells per well) and treated with Cur, Cur-NPs, and Cur-NPs-A6 in IC50 concentration for 48h. RNA was extracted using Trizol (Sinaclon, Tehran, Iran) reagent according to the manufacturer's instructions [54]. An agarose gel electrophoresis procedure was used to determine the quality of the extracted RNA. Based on the manufacturer's instructions, complementary DNA (cDNA) was synthesized from RNA using cDNA synthesis kit (Pars-Tous, Mashhad, Iran). Amplification was done by using Amplicon SYBR Green master mix (Brighton, Sussex, UK). The amplification process was carried out using the following protocol: a preincubation step of 15 minutes at 95°C, followed by 40 cycles of 20 seconds each at 95°C, 60°C, and 72°C. PBS-treated cells were employed as the control group. In this study, the Glyceraldehyde-3 phosphate dehydrogenase (GAPDH) gene was used as a housekeeping gene for normalization [55]. The relative expression of target genes was computed using the 2-ΔΔCt method [56]. Designed primers for amplification target genes were listed in Table 1 [57].
4.12. Invasion Assay
The invasion assay is a laboratory technique used to evaluate the invasive potential of cells [58]. To prepare the transwell (SPL Life Sciences Co., Ltd. Pochon, Kyonggi-do, South Korea), PC inserts with a porous membrane (8 micrometers) were first placed into the 24 wells plate. Then, the PC membranes were coated with 50 µl Matrigel in each well (Corning, Life Sciences Corp., NY, USA). Next, cells (5 × 10⁴) were seeded in the upper chamber. The cells were suspended in a culture medium (180 µl) without FBS (starvation condition) to induce their invasion behavior [59]. The lower chamber was filled with 600 µl DMEM containing 10% FBS (without pen/strep). In this step, PBS-treated cells were used as control and other groups were treated by Cur, Cur-NPs, and Cur-NPs-A6 in IC50 values.
4.13. Statistical Analysis
5. Conclusions
Our research group introduced a stable and efficient PCL-PEG nanoparticle conjugated with A6-peptides as a delivery system for Cur. The engineered NPs exhibited good encapsulation and high drug-loading potency. Our designed carriers, PCL-PEG and PCL-PEG-A6, were found to reduce Cur toxicity on normal epithelial cells (MCF-10A) while increasing its negative effects on the MDA-MB-231 cancer cell line. Moreover, we demonstrated that the designed NPs effectively suppressed genes related to invasion and activated pathways that induce apoptosis. Therefore, the Cur-NPs have the potential to act as potent anticancer agents with higher controlled release and more selective delivery.
Author Contributions
Conceptualization, N.R., M.M.G., and V.N.U.; methodology, N.R. and H.N.; software, N.R., M.M.G., and H.N.; validation, A.M., S.S.E., and P.T.; formal analysis, A.G. and H.N.; investigation, N.R., A.G., H.N., Z.S., A.M., S.S.E., P.T., and M.M.G.; data curation, N.R., A.G., H.N., Z.S., A.M., S.S.E., P.T., and M.M.G.; writing—original draft preparation, N.R., A.G., H.N.; writing—review and editing, N.R., A.G., H.N., M.M.G., P.T., and V.N.U.; visualization, A.G.; supervision, V.N.U., P.T., and N.R. All authors have read and agreed to the published version of the manuscript.
Funding
This research received no external funding.
Institutional Review Board Statement
Not applicable.
Informed Consent Statement
Not applicable.
Data Availability Statement
The authors confirm that the data supporting the findings of this study are available within the article.
Acknowledgments
This work is dedicated to Dr. Maryam Mirzakhani.
Conflicts of Interest
The authors declare no conflict of interest. The funders had no role in the design of the study; in the collection, analyses, or interpretation of data; in the writing of the manuscript; or in the decision to publish the results.
References
- Abdouss, H.; Pourmadadi, M.; Zahedi, P.; Abdouss, M.; Yazdian, F.; Rahdar, A.; Diez-Pascual, A.M. Green synthesis of chitosan/polyacrylic acid/graphitic carbon nitride nanocarrier as a potential pH-sensitive system for curcumin delivery to MCF-7 breast cancer cells. Int J Biol Macromol 2023, 242, 125134. [CrossRef]
- Bardania, H.; Jafari, F.; Baneshi, M.; Mahmoudi, R.; Ardakani, M.T.; Safari, F.; Barmak, M.J. Folic Acid-Functionalized Albumin/Graphene Oxide Nanocomposite to Simultaneously Deliver Curcumin and 5-Fluorouracil into Human Colorectal Cancer Cells: An In Vitro Study. Biomed Res Int 2023, 2023, 8334102. [CrossRef]
- Rostami, N.; Gomari, M.M.; Abdouss, M.; Moeinzadeh, A.; Choupani, E.; Davarnejad, R.; Heidari, R.; Bencherif, S.A. Synthesis and Characterization of Folic Acid-Functionalized DPLA-co-PEG Nanomicelles for the Targeted Delivery of Letrozole. ACS Applied Bio Materials 2023, 6, 1806-1815. [CrossRef]
- Edis, Z.; Wang, J.; Waqas, M.K.; Ijaz, M.; Ijaz, M. Nanocarriers-Mediated Drug Delivery Systems for Anticancer Agents: An Overview and Perspectives. International journal of nanomedicine 2021, 16, 1313-1330. [CrossRef]
- Ciuca, M.D.; Racovita, R.C. Curcumin: Overview of Extraction Methods, Health Benefits, and Encapsulation and Delivery Using Microemulsions and Nanoemulsions. Int J Mol Sci 2023, 24. [CrossRef]
- Behl, A.; Solanki, S.; Paswan, S.K.; Datta, T.K.; Saini, A.K.; Saini, R.V.; Parmar, V.S.; Thakur, V.K.; Malhotra, S.; Chhillar, A.K. Biodegradable PEG-PCL Nanoparticles for Co-delivery of MUC1 Inhibitor and Doxorubicin for the Confinement of Triple-Negative Breast Cancer. J Polym Environ 2023, 31, 999-1018. [CrossRef]
- Luo, D.; Wang, X.; Zhong, X.; Chang, J.; He, M.; Wang, H.; Li, Y.; Zhao, C.; Luo, Y.; Ran, L. MPEG-PCL Nanomicelles Platform for Synergistic Metformin and Chrysin Delivery to Breast Cancer in Mice. Anticancer Agents Med Chem 2022, 22, 280-293. [CrossRef]
- Su, W.T.; Huang, C.C.; Liu, H.W. Evaluation and Preparation of a Designed Kartogenin Drug Delivery System (DDS) of Hydrazone-Linkage-Based pH Responsive mPEG-Hz-b-PCL Nanomicelles for Treatment of Osteoarthritis. Front Bioeng Biotechnol 2022, 10, 816664. [CrossRef]
- Nezir, A.E.; Bolat, Z.B.; Ozturk, N.; Kocak, P.; Zemheri, E.; Gulyuz, S.; Ozkose, U.U.; Yilmaz, O.; Vural, I.; Bozkir, A., et al. Targeting prostate cancer with docetaxel-loaded peptide 563-conjugated PEtOx-co-PEI(30%)-b-PCL polymeric micelle nanocarriers. Amino Acids 2023, 10.1007/s00726-023-03292-3. [CrossRef]
- Khodaverdi, E.; Tayarani-Najaran, Z.; Minbashi, E.; Alibolandi, M.; Hosseini, J.; Sepahi, S.; Kamali, H.; Hadizadeh, F. Docetaxel-Loaded Mixed Micelles and Polymersomes Composed of Poly (caprolactone)-Poly (ethylene glycol) (PEG-PCL) and Poly (lactic acid)-Poly (ethylene glycol) (PEG-PLA): Preparation and In-vitro Characterization. Iran J Pharm Res 2019, 18, 142-155.
- Doan, N.Q.H.; Nguyen, N.T.K.; Nguyen, N.B.; Tran, T.T.; Tran, Q.N.; Truong, T.N. Design, synthesis, in vitro and in silico evaluation of anti-colorectal cancer activity of curcumin analogues containing 1,3-diphenyl-1H-pyrazole targeting EGFR tyrosine kinase. Biochim Biophys Acta Gen Subj 2023, 1867, 130414. [CrossRef]
- Hsu, K.Y.; Ho, C.T.; Pan, M.H. The therapeutic potential of curcumin and its related substances in turmeric: From raw material selection to application strategies. J Food Drug Anal 2023, 31, 194-211. [CrossRef]
- Hussain, A.; Kumar, A.; Uttam, V.; Sharma, U.; Sak, K.; Saini, R.V.; Saini, A.K.; Haque, S.; Tuli, H.S.; Jain, A., et al. Application of curcumin nanoformulations to target folic acid receptor in cancer: Recent trends and advances. Environ Res 2023, 10.1016/j.envres.2023.116476, 116476. [CrossRef]
- Jang, S.Y.; Kim, J.; Hong, E.; Lee, K.; Na, Y.; Yeom, C.H.; Park, S. Curcumin inhibits human cancer cell growth and migration through downregulation of SVCT2. Cell Biochem Funct 2023, 10.1002/cbf.3824. [CrossRef]
- Mohebian, Z.; Babazadeh, M.; Zarghami, N. In Vitro Efficacy of Curcumin-Loaded Amine-Functionalized Mesoporous Silica Nanoparticles against MCF-7 Breast Cancer Cells. Adv Pharm Bull 2023, 13, 317-327. [CrossRef]
- Santhamoorthy, M.; Thirupathi, K.; Kumar, S.S.D.; Pandiaraj, S.; Rahaman, M.; Phan, T.T.V.; Kim, S.C. k-Carrageenan based magnetic@polyelectrolyte complex composite hydrogel for pH and temperature-responsive curcumin delivery. Int J Biol Macromol 2023, 244, 125467. [CrossRef]
- Wang, X.; Tian, Y.; Lin, H.; Cao, X.; Zhang, Z. Curcumin induces apoptosis in human hepatocellular carcinoma cells by decreasing the expression of STAT3/VEGF/HIF-1alpha signaling. Open Life Sci 2023, 18, 20220618. [CrossRef]
- Zhang, J.; Liu, Y.; Wang, X.; Wang, Z.; Xing, E.; Li, J.; Wang, D. Curcumin inhibits proliferation of hepatocellular carcinoma cells by blocking PTPN1 and PTPN11 expression. Oncol Lett 2023, 26, 307. [CrossRef]
- Berkenblit, A.; Matulonis, U.A.; Kroener, J.F.; Dezube, B.J.; Lam, G.N.; Cuasay, L.C.; Brunner, N.; Jones, T.R.; Silverman, M.H.; Gold, M.A. A6, a urokinase plasminogen activator (uPA)-derived peptide in patients with advanced gynecologic cancer: a phase I trial. Gynecol Oncol 2005, 99, 50-57. [CrossRef]
- Gold, M.A.; Brady, W.E.; Lankes, H.A.; Rose, P.G.; Kelley, J.L.; De Geest, K.; Crispens, M.A.; Resnick, K.E.; Howell, S.B. A phase II study of a urokinase-derived peptide (A6) in the treatment of persistent or recurrent epithelial ovarian, fallopian tube, or primary peritoneal carcinoma: a Gynecologic Oncology Group study. Gynecol Oncol 2012, 125, 635-639. [CrossRef]
- Gu, W.; Liu, T.; Fan, D.; Zhang, J.; Xia, Y.; Meng, F.; Xu, Y.; Cornelissen, J.; Liu, Z.; Zhong, Z. A6 peptide-tagged, ultra-small and reduction-sensitive polymersomal vincristine sulfate as a smart and specific treatment for CD44+ acute myeloid leukemia. J Control Release 2021, 329, 706-716. [CrossRef]
- Gu, W.; An, J.; Meng, H.; Yu, N.; Zhong, Y.; Meng, F.; Xu, Y.; Cornelissen, J.; Zhong, Z. CD44-Specific A6 Short Peptide Boosts Targetability and Anticancer Efficacy of Polymersomal Epirubicin to Orthotopic Human Multiple Myeloma. Adv Mater 2019, 31, e1904742. [CrossRef]
- Koh, H.J.; Cheng, L.; Bessho, K.; Jones, T.R.; Davidson, M.C.; Freeman, W.R. Intraocular properties of urokinase-derived antiangiogenic A6 peptide in rabbits. Journal of ocular pharmacology and therapeutics : the official journal of the Association for Ocular Pharmacology and Therapeutics 2004, 20, 439-449. [CrossRef]
- Piotrowicz, R.S.; Damaj, B.B.; Hachicha, M.; Incardona, F.; Howell, S.B.; Finlayson, M. A6 peptide activates CD44 adhesive activity, induces FAK and MEK phosphorylation, and inhibits the migration and metastasis of CD44-expressing cells. Mol Cancer Ther 2011, 10, 2072-2082. [CrossRef]
- Zhang, C.; Wang, X.; Cheng, R.; Zhong, Z. A6 Peptide-Tagged Core-Disulfide-Cross-Linked Micelles for Targeted Delivery of Proteasome Inhibitor Carfilzomib to Multiple Myeloma In Vivo. Biomacromolecules 2020, 21, 2049-2059. [CrossRef]
- Akiyama, Y.; Komiyama, M.; Nakamura, Y.; Iizuka, A.; Oshita, C.; Kume, A.; Nogami, M.; Miyata, H.; Ashizawa, T.; Yoshikawa, S., et al. Identification of novel MAGE-A6- and MAGE-A12-derived HLA-A24-restricted cytotoxic T lymphocyte epitopes using an in silico peptide-docking assay. Cancer Immunol Immunother 2012, 61, 2311-2319. [CrossRef]
- Araveti, P.B.; Srivastava, A. Curcumin induced oxidative stress causes autophagy and apoptosis in bovine leucocytes transformed by Theileria annulata. Cell Death Discovery 2019, 5, 100. [CrossRef]
- Wang, J.B.; Qi, L.L.; Zheng, S.D.; Wu, T.X. Curcumin induces apoptosis through the mitochondria-mediated apoptotic pathway in HT-29 cells. Journal of Zhejiang University. Science. B 2009, 10, 93-102. [CrossRef]
- Grossen, P.; Witzigmann, D.; Sieber, S.; Huwyler, J. PEG-PCL-based nanomedicines: A biodegradable drug delivery system and its application. Journal of Controlled Release 2017, 260, 46-60. [CrossRef]
- Moyano, D.F.; Goldsmith, M.; Solfiell, D.J.; Landesman-Milo, D.; Miranda, O.R.; Peer, D.; Rotello, V.M. Nanoparticle Hydrophobicity Dictates Immune Response. Journal of the American Chemical Society 2012, 134, 3965-3967. [CrossRef]
- Yao, Y.; Zhou, Y.; Liu, L.; Xu, Y.; Chen, Q.; Wang, Y.; Wu, S.; Deng, Y.; Zhang, J.; Shao, A. Nanoparticle-Based Drug Delivery in Cancer Therapy and Its Role in Overcoming Drug Resistance. Front Mol Biosci 2020, 7, 193. [CrossRef]
- Shuai, Q.; Cai, Y.; Zhao, G.; Sun, X. Cell-Penetrating Peptide Modified PEG-PLA Micelles for Efficient PTX Delivery. Int J Mol Sci 2020, 21. [CrossRef]
- Freire, J.M.; Domingues, M.M.; Matos, J.; Melo, M.N.; Veiga, A.S.; Santos, N.C.; Castanho, M.A. Using zeta-potential measurements to quantify peptide partition to lipid membranes. Eur Biophys J 2011, 40, 481-487. [CrossRef]
- Chen, J.; Dai, W.T.; He, Z.M.; Gao, L.; Huang, X.; Gong, J.M.; Xing, H.Y.; Chen, W.D. Fabrication and Evaluation of Curcumin-loaded Nanoparticles Based on Solid Lipid as a New Type of Colloidal Drug Delivery System. Indian J Pharm Sci 2013, 75, 178-184.
- Siepmann, J.; Peppas, N.A. Higuchi equation: derivation, applications, use and misuse. Int J Pharm 2011, 418, 6-12. [CrossRef]
- Weng, J.; Tong, H.H.Y.; Chow, S.F. In Vitro Release Study of the Polymeric Drug Nanoparticles: Development and Validation of a Novel Method. Pharmaceutics 2020, 12. [CrossRef]
- Bruschi, M.L. Mathematical models of drug release. In Strategies to Modify the Drug Release from Pharmaceutical Systems, Woodhead Publishing: 2015; pp. 63-86. [CrossRef]
- Grossen, P.; Witzigmann, D.; Sieber, S.; Huwyler, J. PEG-PCL-based nanomedicines: A biodegradable drug delivery system and its application. J Control Release 2017, 260, 46-60. [CrossRef]
- Madhavi, D.; Kagan, D. Bioavailability of a Sustained Release Formulation of Curcumin. Integr Med (Encinitas) 2014, 13, 24-30.
- Liu, D.; Chen, Z. The effect of curcumin on breast cancer cells. J Breast Cancer 2013, 16, 133-137. [CrossRef]
- Bhawana; Basniwal, R.K.; Buttar, H.S.; Jain, V.K.; Jain, N. Curcumin Nanoparticles: Preparation, Characterization, and Antimicrobial Study. Journal of Agricultural and Food Chemistry 2011, 59, 2056-2061. [CrossRef]
- Shishodia, S. Molecular mechanisms of curcumin action: gene expression. Biofactors 2013, 39, 37-55. [CrossRef]
- Elmore, S. Apoptosis: a review of programmed cell death. Toxicologic pathology 2007, 35, 495-516. [CrossRef]
- Chen, C.; Zhao, S.; Karnad, A.; Freeman, J.W. The biology and role of CD44 in cancer progression: therapeutic implications. Journal of hematology & oncology 2018, 11, 64. [CrossRef]
- Wang, Z.; Ma, W.; Wei, J.; Lan, K.; Yan, S.; Chen, R.; Qin, G. High-performance olfactory receptor-derived peptide sensor for trimethylamine detection based on Steglich esterification reaction and native chemical ligation connection. Biosens Bioelectron 2022, 195, 113673. [CrossRef]
- Kheiri Manjili, H.; Ghasemi, P.; Malvandi, H.; Mousavi, M.S.; Attari, E.; Danafar, H. Pharmacokinetics and in vivo delivery of curcumin by copolymeric mPEG-PCL micelles. Eur J Pharm Biopharm 2017, 116, 17-30. [CrossRef]
- Cohen-Sela, E.; Chorny, M.; Koroukhov, N.; Danenberg, H.D.; Golomb, G. A new double emulsion solvent diffusion technique for encapsulating hydrophilic molecules in PLGA nanoparticles. J Control Release 2009, 133, 90-95. [CrossRef]
- Patra, J.K.; Das, G.; Fraceto, L.F.; Campos, E.V.R.; Rodriguez-Torres, M.d.P.; Acosta-Torres, L.S.; Diaz-Torres, L.A.; Grillo, R.; Swamy, M.K.; Sharma, S., et al. Nano based drug delivery systems: recent developments and future prospects. Journal of Nanobiotechnology 2018, 16, 71. [CrossRef]
- Li, X.; Wang, Y.; Xu, F.; Zhang, F.; Xu, Y.; Tang, L.; Webster, T.J. Artemisinin Loaded mPEG-PCL Nanoparticle Based Photosensitive Gelatin Methacrylate Hydrogels for the Treatment of Gentamicin Induced Hearing Loss. International journal of nanomedicine 2020, 15, 4591-4606. [CrossRef]
- Zatorska-Płachta, M.; Łazarski, G.; Maziarz, U.; Foryś, A.; Trzebicka, B.; Wnuk, D.; Chołuj, K.; Karewicz, A.; Michalik, M.; Jamróz, D., et al. Encapsulation of Curcumin in Polystyrene-Based Nanoparticles—Drug Loading Capacity and Cytotoxicity. ACS Omega 2021, 6, 12168-12178. [CrossRef]
- Liu, Y.; Yang, G.; Jin, S.; Xu, L.; Zhao, C.X. Development of High-Drug-Loading Nanoparticles. Chempluschem 2020, 85, 2143-2157. [CrossRef]
- Khosropanah, M.H.; Dinarvand, A.; Nezhadhosseini, A.; Haghighi, A.; Hashemi, S.; Nirouzad, F.; Khatamsaz, S.; Entezari, M.; Hashemi, M.; Dehghani, H. Analysis of the Antiproliferative Effects of Curcumin and Nanocurcumin in MDA-MB231 as a Breast Cancer Cell Line. Iran J Pharm Res 2016, 15, 231-239.
- Koroth, J.; Nirgude, S.; Tiwari, S.; Gopalakrishnan, V.; Mahadeva, R.; Kumar, S.; Karki, S.S.; Choudhary, B. Investigation of anti-cancer and migrastatic properties of novel curcumin derivatives on breast and ovarian cancer cell lines. BMC Complementary and Alternative Medicine 2019, 19, 273. [CrossRef]
- Katta, S.; Srivastava, A.; Thangapazham, R.L.; Rosner, I.L.; Cullen, J.; Li, H.; Sharad, S. Curcumin-Gene Expression Response in Hormone Dependent and Independent Metastatic Prostate Cancer Cells. Int J Mol Sci 2019, 20. [CrossRef]
- Khanna, P.; Johnson, K.L.; Maron, J.L. Optimal reference genes for RT-qPCR normalization in the newborn. Biotechnic & histochemistry : official publication of the Biological Stain Commission 2017, 92, 459-466. [CrossRef]
- Bustin, S.A.; Benes, V.; Nolan, T.; Pfaffl, M.W. Quantitative real-time RT-PCR--a perspective. Journal of molecular endocrinology 2005, 34, 597-601. [CrossRef]
- Pfaffl, M.W. A new mathematical model for relative quantification in real-time RT-PCR. Nucleic Acids Res 2001, 29, e45. [CrossRef]
- Pijuan, J.; Barceló, C.; Moreno, D.F.; Maiques, O.; Sisó, P.; Marti, R.M.; Macià, A.; Panosa, A. In vitro Cell Migration, Invasion, and Adhesion Assays: From Cell Imaging to Data Analysis. Frontiers in cell and developmental biology 2019, 7, 107. [CrossRef]
- Li, Y.; Sun, W.; Han, N.; Zou, Y.; Yin, D. Curcumin inhibits proliferation, migration, invasion and promotes apoptosis of retinoblastoma cell lines through modulation of miR-99a and JAK/STAT pathway. BMC Cancer 2018, 18, 1230. [CrossRef]
- Ghasemi, M.; Turnbull, T.; Sebastian, S.; Kempson, I. The MTT Assay: Utility, Limitations, Pitfalls, and Interpretation in Bulk and Single-Cell Analysis. Int J Mol Sci 2021, 22. [CrossRef]
- Ranstam, J. Hypothesis-generating and confirmatory studies, Bonferroni correction, and pre-specification of trial endpoints. Acta Orthop 2019, 90, 297-297. [CrossRef]
Figure 1.
Characterization of systems. Transmittance FTIR spectra of ε-Caprolactone, Ethylene glycol, PCL-PEG and PCL-PEG-A6 (A); 1H-NMR spectrum of PCL-PEG in CDCl3 (B); 1H-NMR spectrum of A6 in CDCl3 (C); 1H-NMR spectrum of PCL-PEG-A6 in CDCl3 (D).
Figure 1.
Characterization of systems. Transmittance FTIR spectra of ε-Caprolactone, Ethylene glycol, PCL-PEG and PCL-PEG-A6 (A); 1H-NMR spectrum of PCL-PEG in CDCl3 (B); 1H-NMR spectrum of A6 in CDCl3 (C); 1H-NMR spectrum of PCL-PEG-A6 in CDCl3 (D).
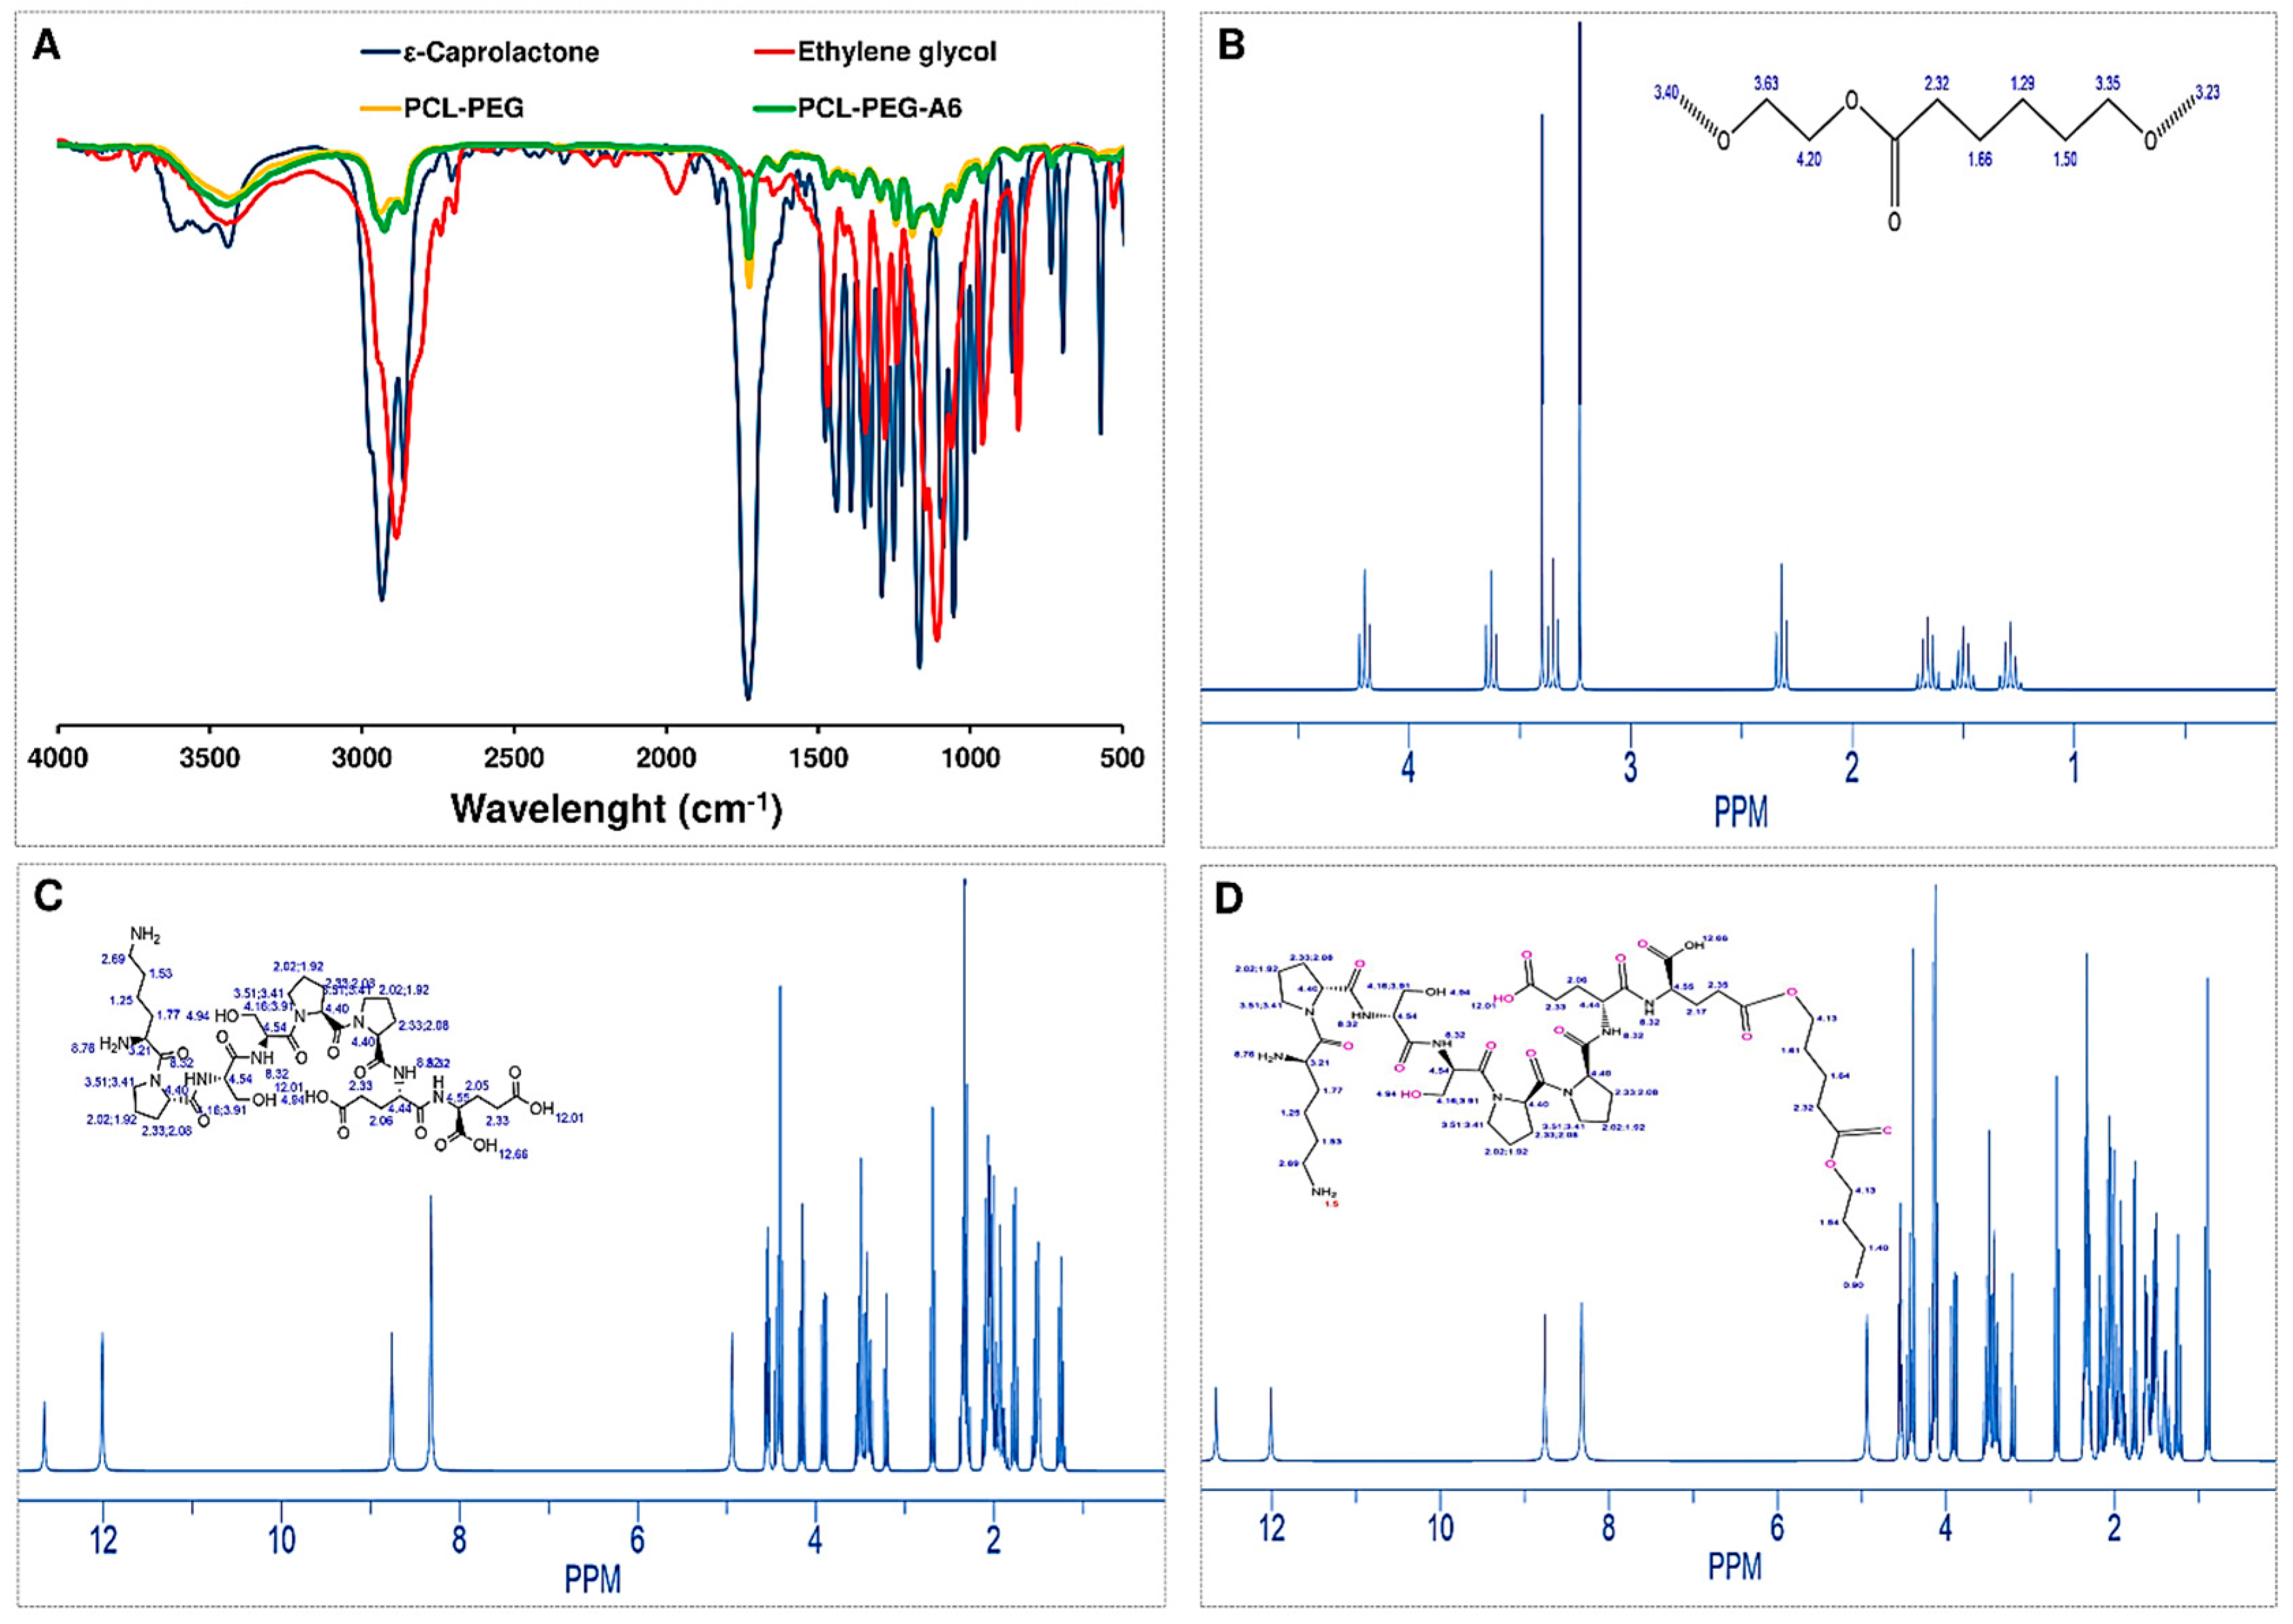
Figure 2.
Average particle size diameter and polydispersity index (PDI) of PCL-PEG (A), Cur-PCL-PEG (B), and Cur-PCL-PEG-A6 (C). ζ potential measurements of PCL-PEG (D), Cur-PCL-PEG (E), and Cur-PCL-PEG-A6 (F).
Figure 2.
Average particle size diameter and polydispersity index (PDI) of PCL-PEG (A), Cur-PCL-PEG (B), and Cur-PCL-PEG-A6 (C). ζ potential measurements of PCL-PEG (D), Cur-PCL-PEG (E), and Cur-PCL-PEG-A6 (F).
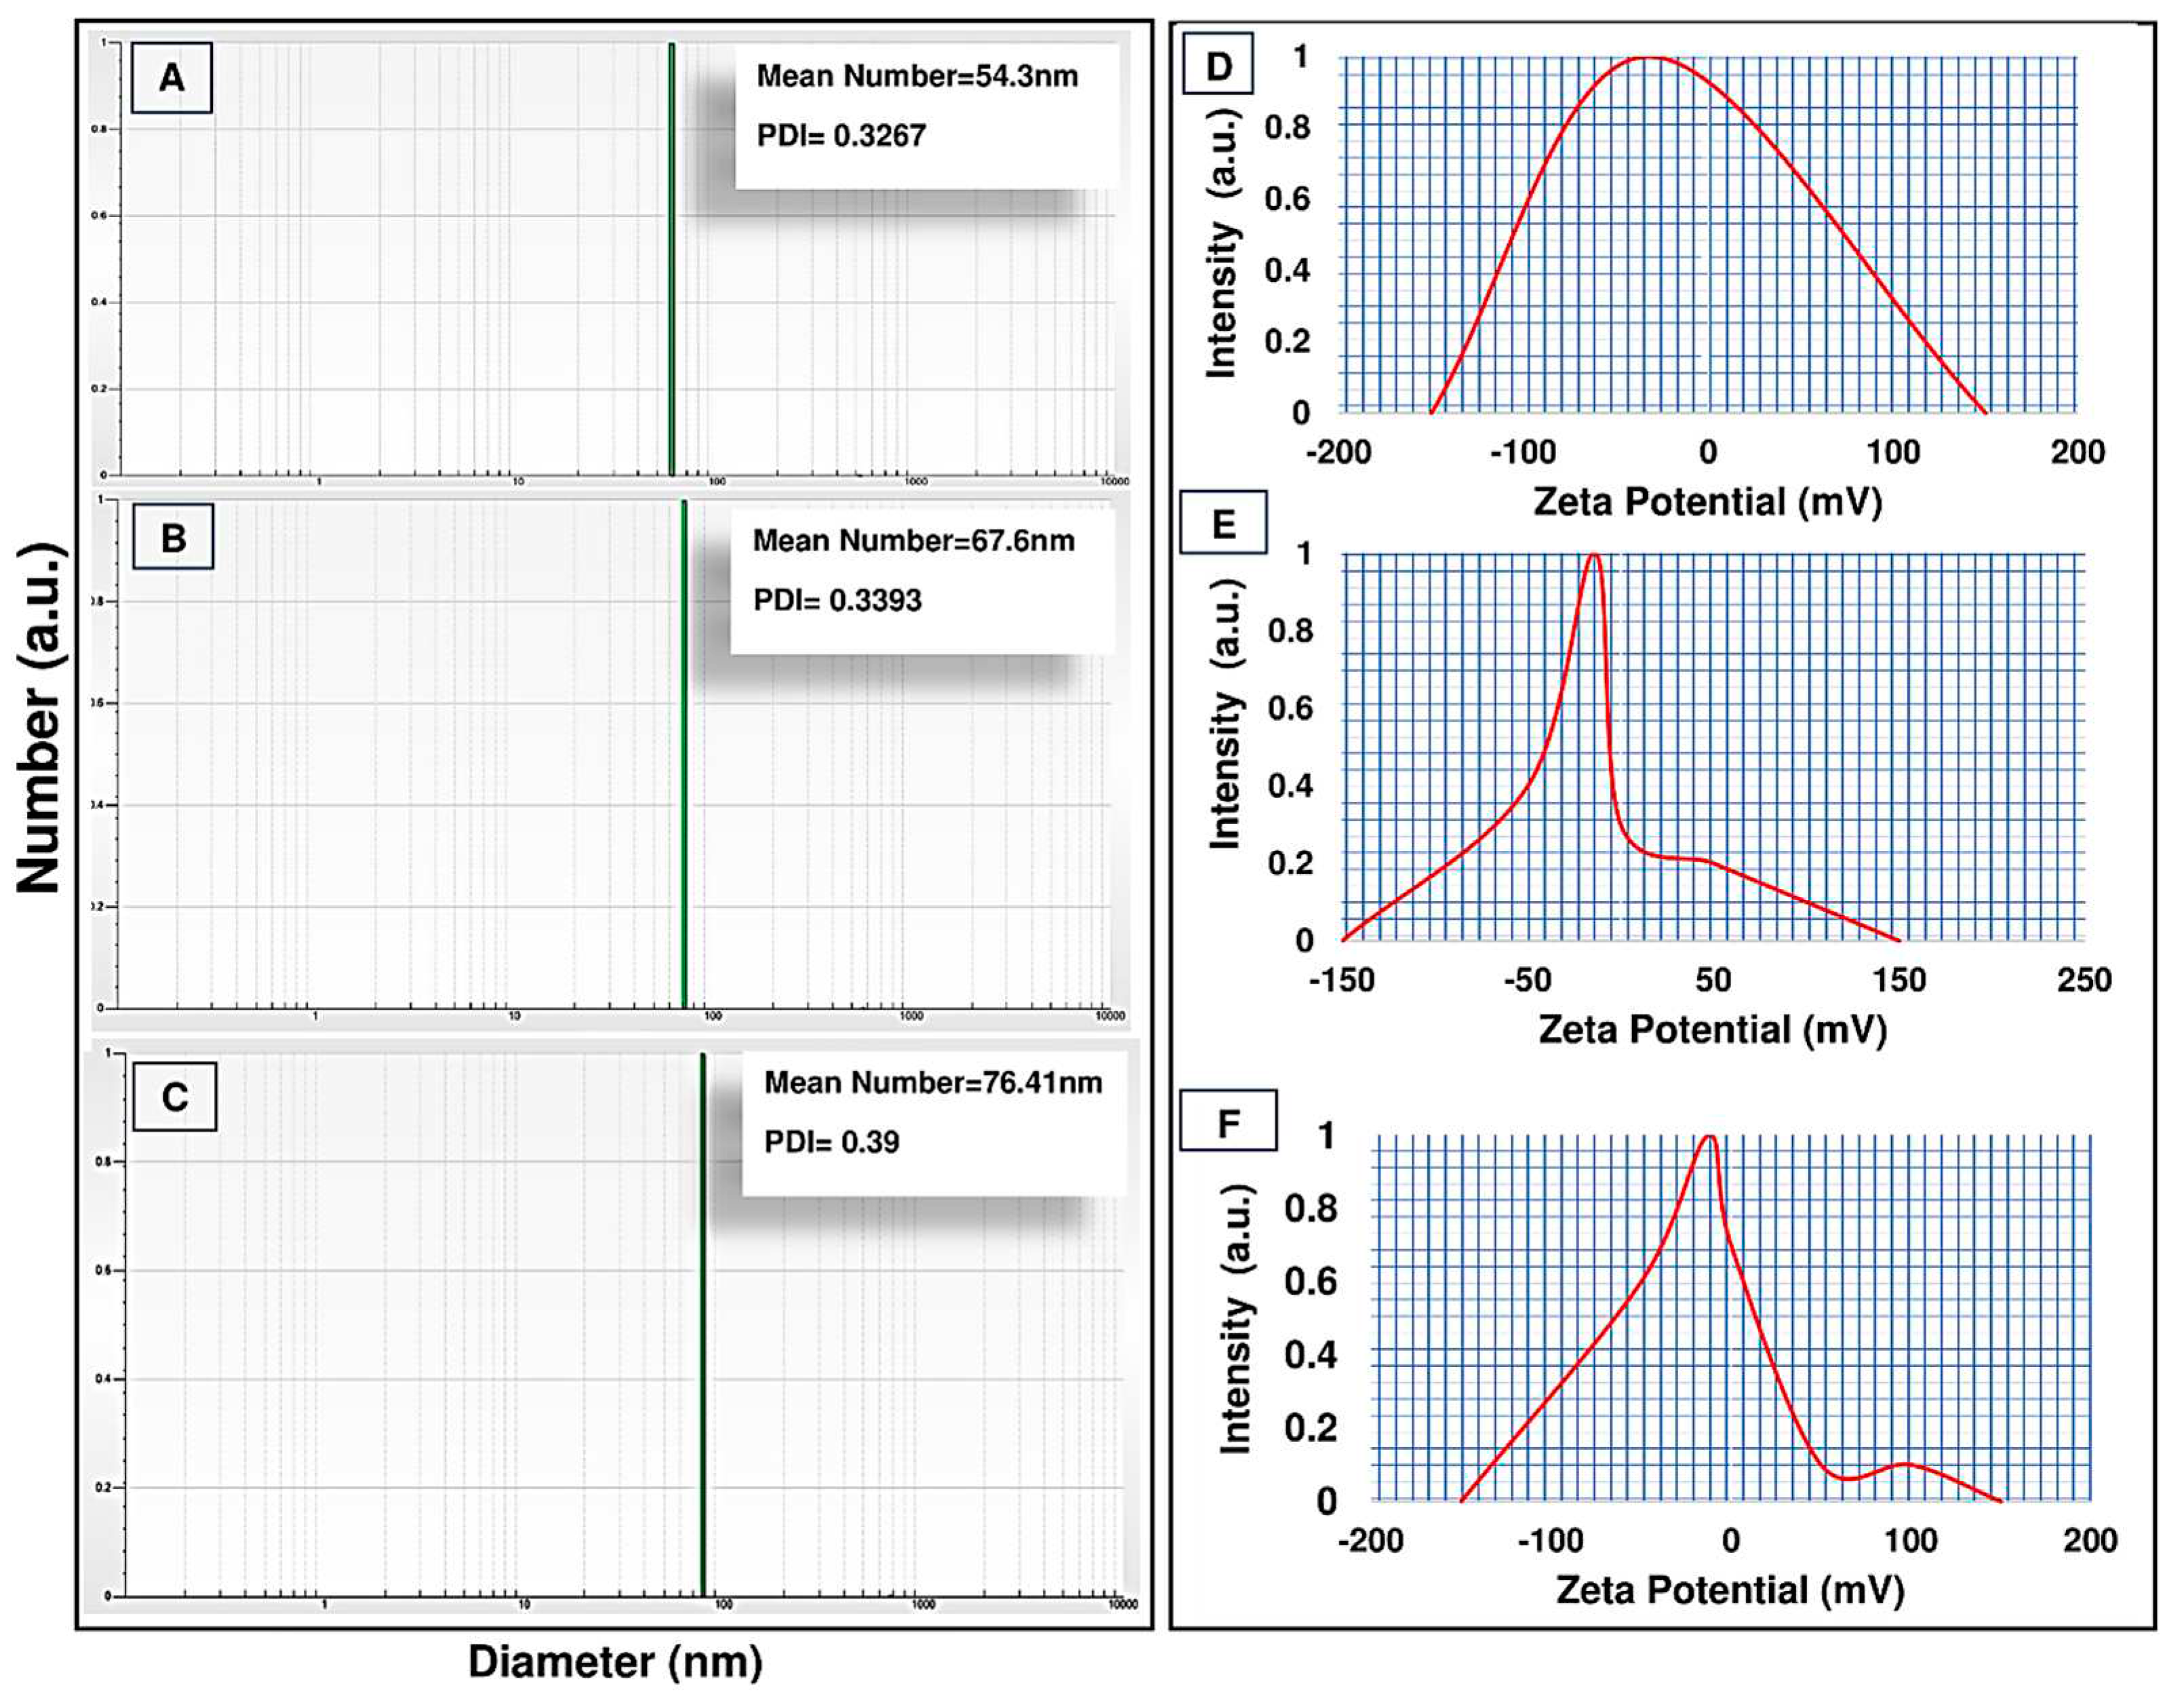
Figure 3.
SEM images and EDX of PCL-PEG (A), NPs (B), Cur-NPs (C), and Cur-NPs-A6 (D).
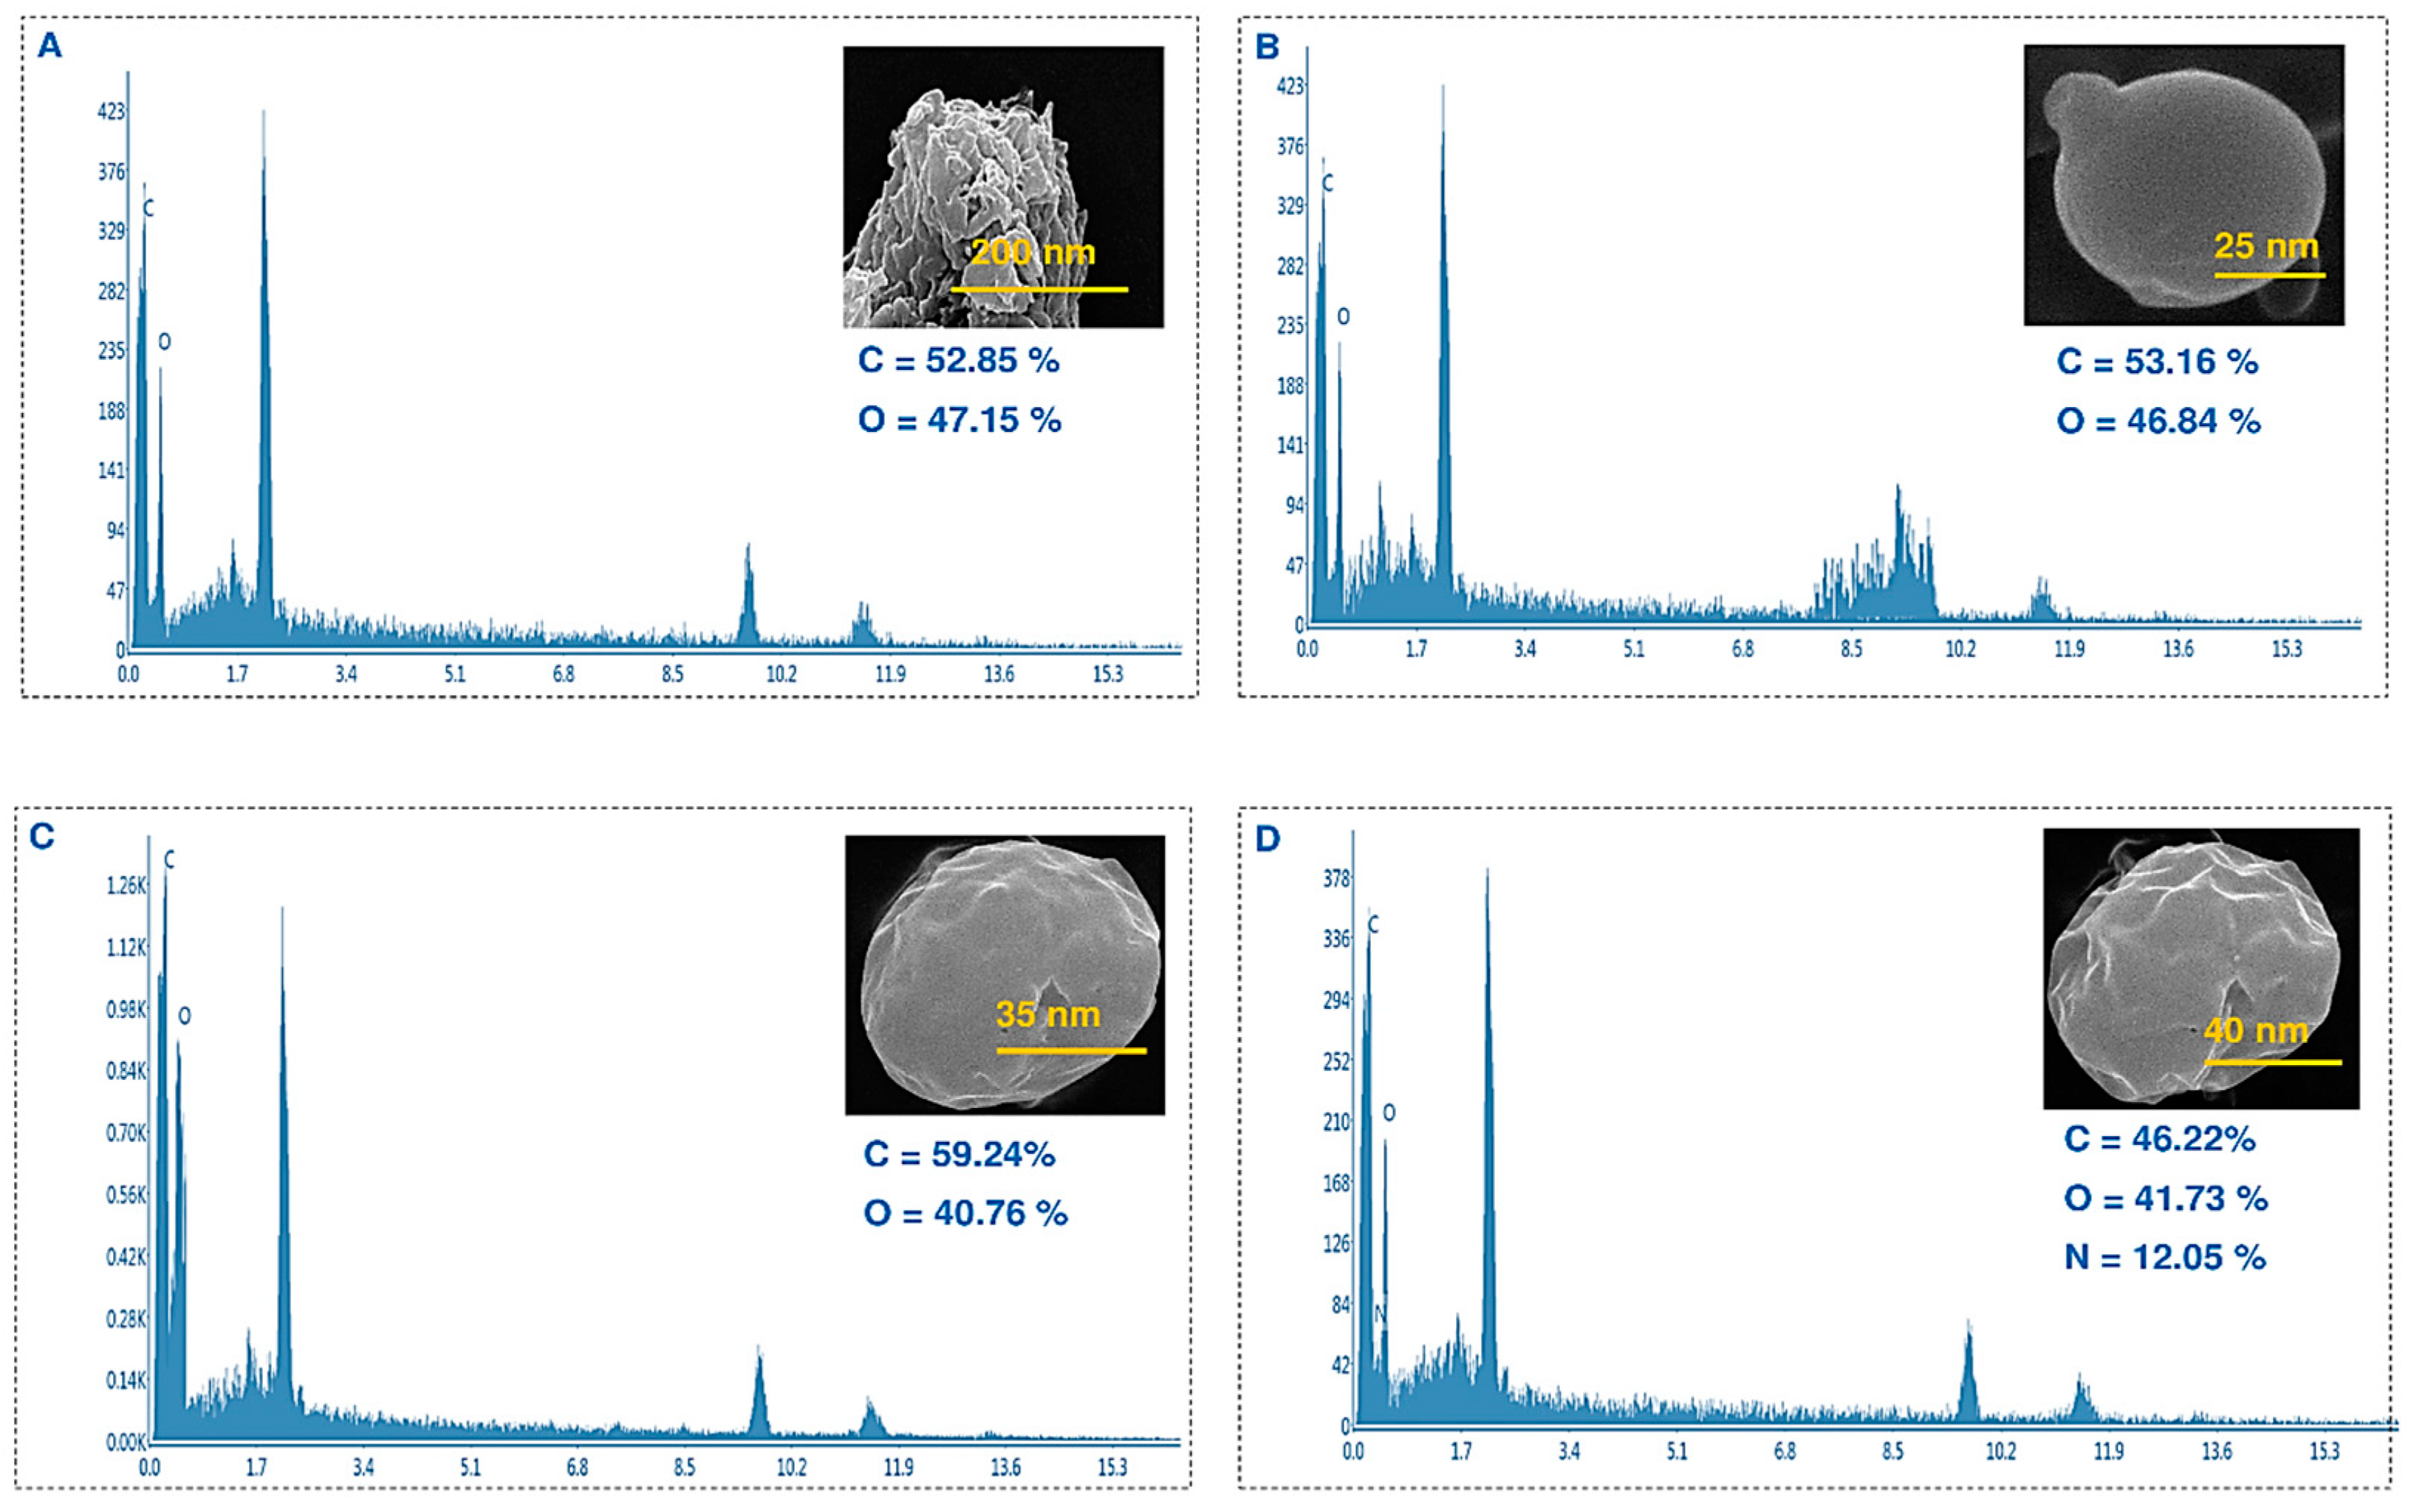
Figure 4.
Contact angle images of NPs (A), Cur-NPs (B), and Cur-NPs-A6 (C). Contact angle measurements of the NPs, Cur-NPs, and Cur-NPs-A6 (D). Values represent the mean ± SD, and the data were analyzed using one-way ANOVA (n = 3). p*** <0.001.
Figure 4.
Contact angle images of NPs (A), Cur-NPs (B), and Cur-NPs-A6 (C). Contact angle measurements of the NPs, Cur-NPs, and Cur-NPs-A6 (D). Values represent the mean ± SD, and the data were analyzed using one-way ANOVA (n = 3). p*** <0.001.
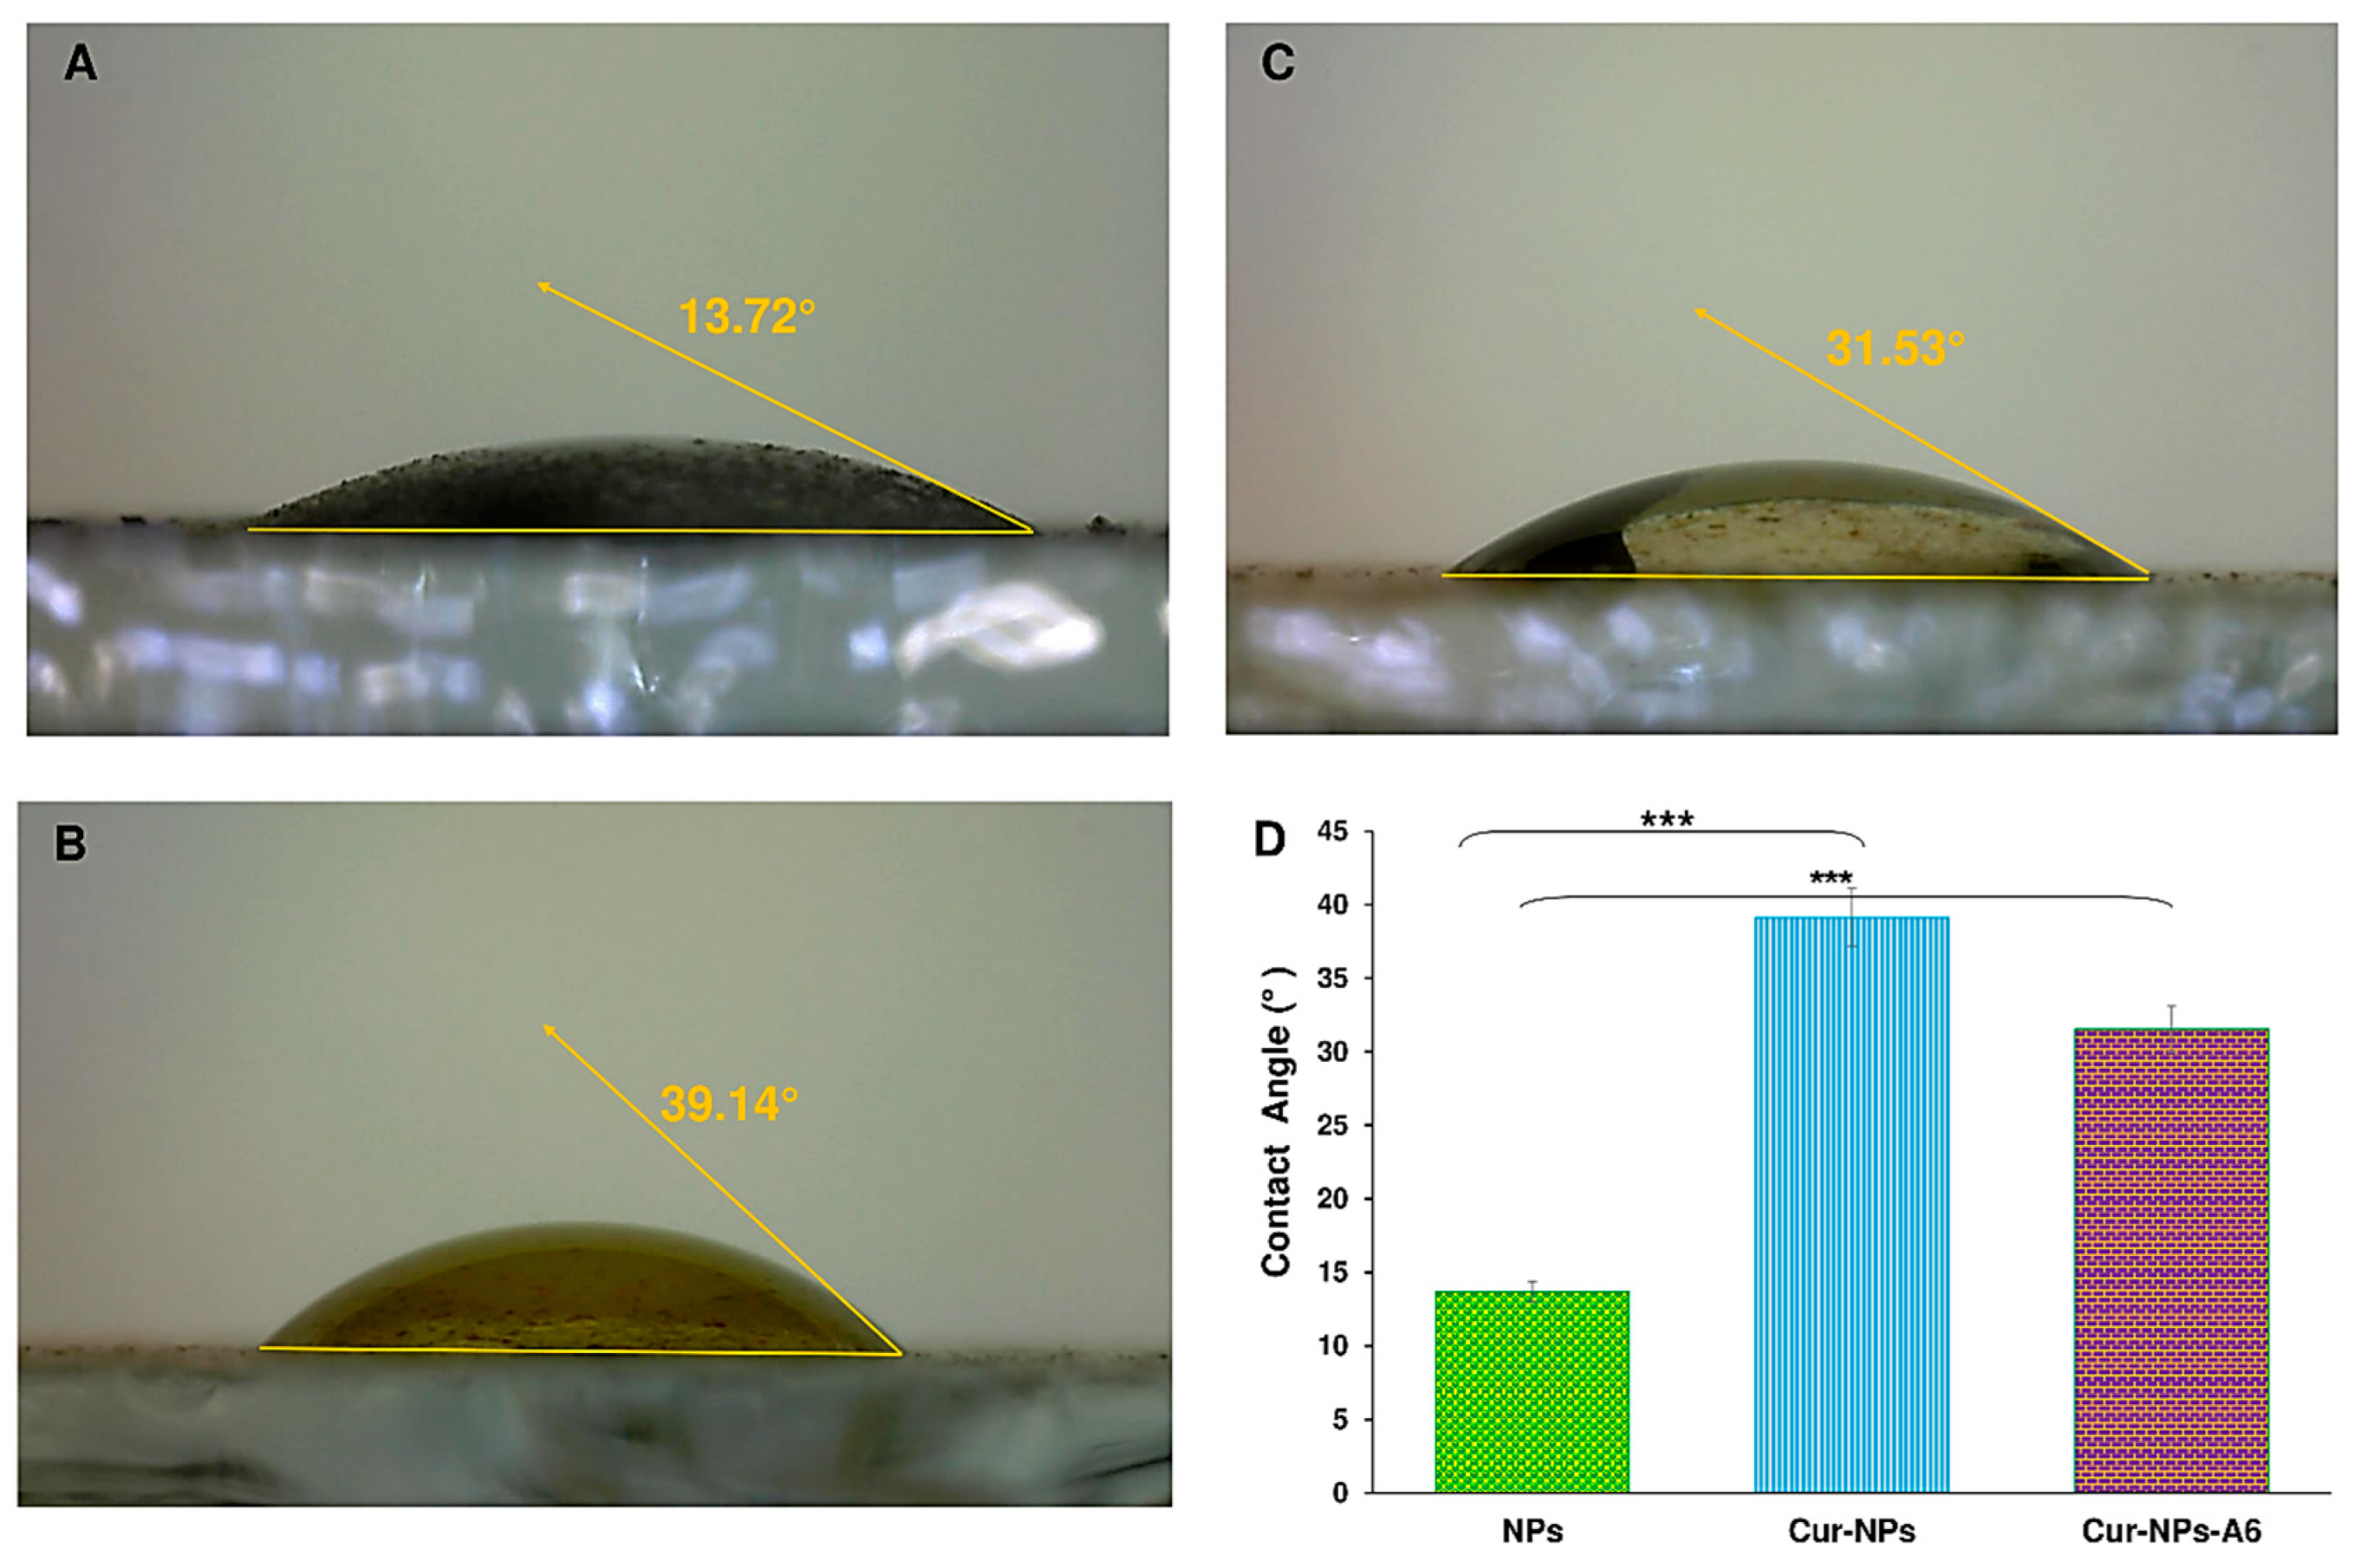
Figure 5.
Standard concentration Curve of Cur (A); In vitro cumulative release of Cur-NPs, Cur-NPs-A6, and free Cur in PBS (pH 7.5) at 37°C (B); Gradual release of Cur over four days in various platforms (C).
Figure 5.
Standard concentration Curve of Cur (A); In vitro cumulative release of Cur-NPs, Cur-NPs-A6, and free Cur in PBS (pH 7.5) at 37°C (B); Gradual release of Cur over four days in various platforms (C).
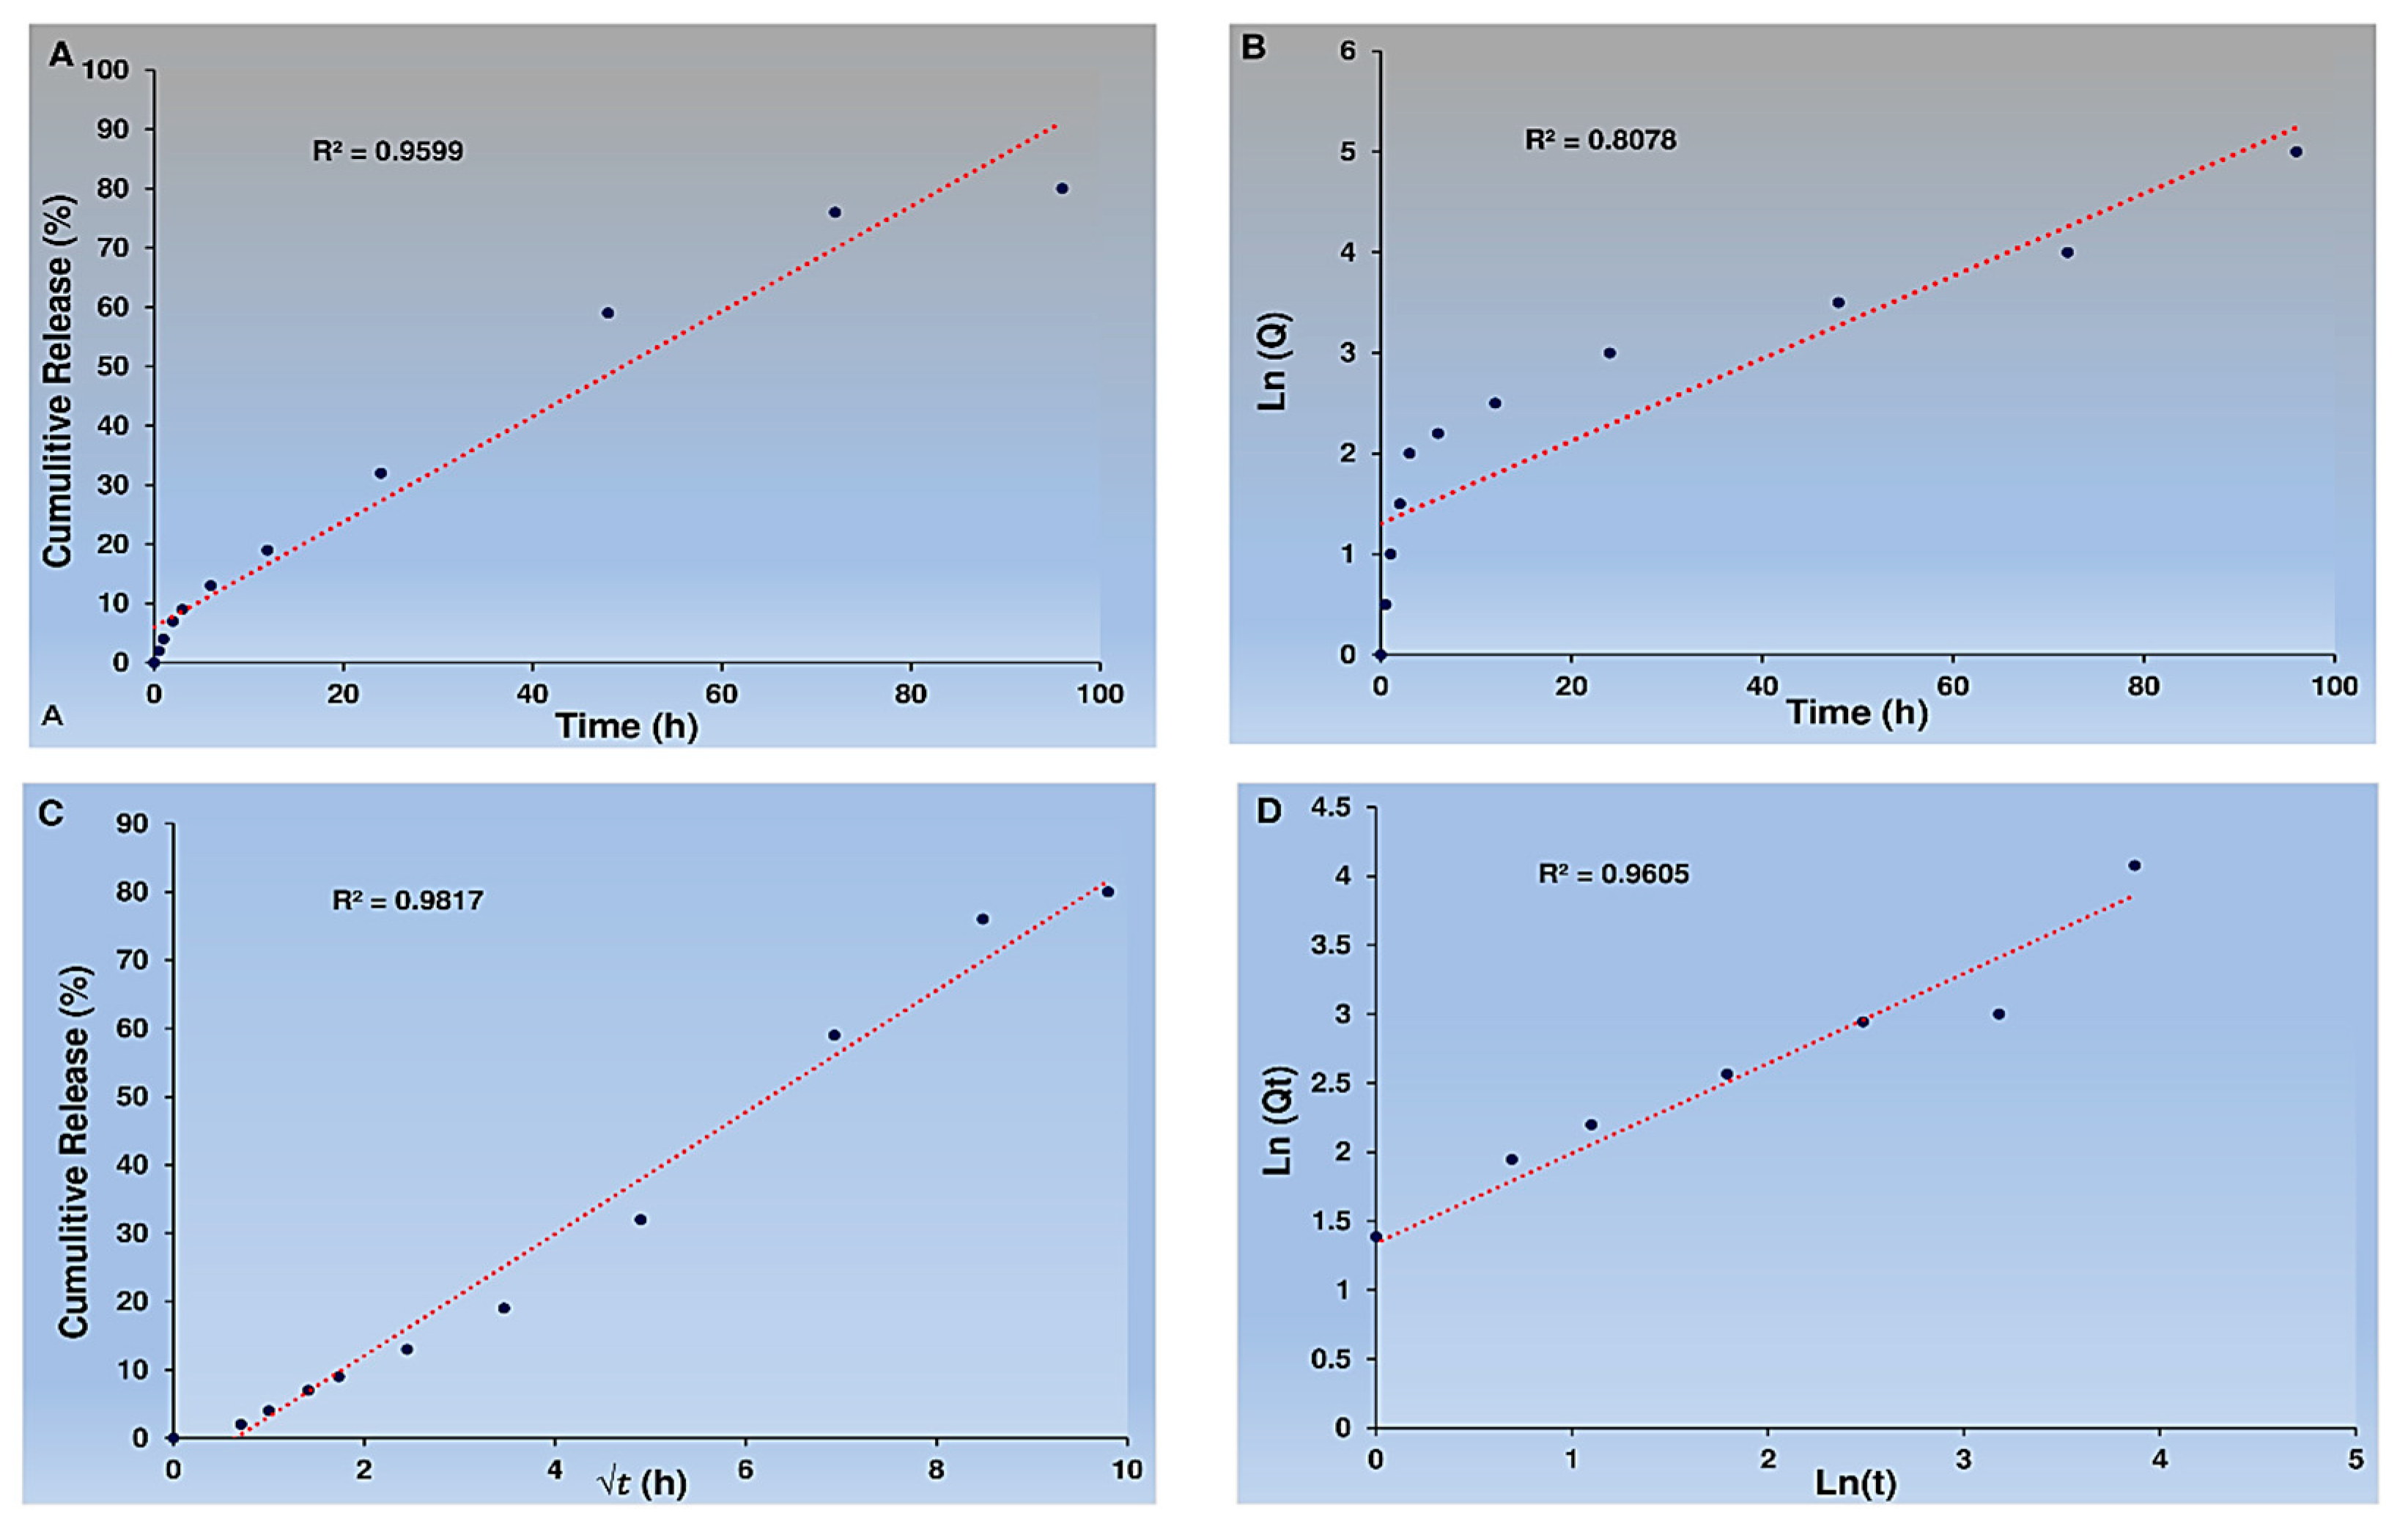
Figure 6.
Kinetics of Cur release. Zero-order kinetics (A), First-order kinetics (B), Higuchi model (C), and Peppas and Korsmeyer model (D) for Cur-NPs.
Figure 6.
Kinetics of Cur release. Zero-order kinetics (A), First-order kinetics (B), Higuchi model (C), and Peppas and Korsmeyer model (D) for Cur-NPs.
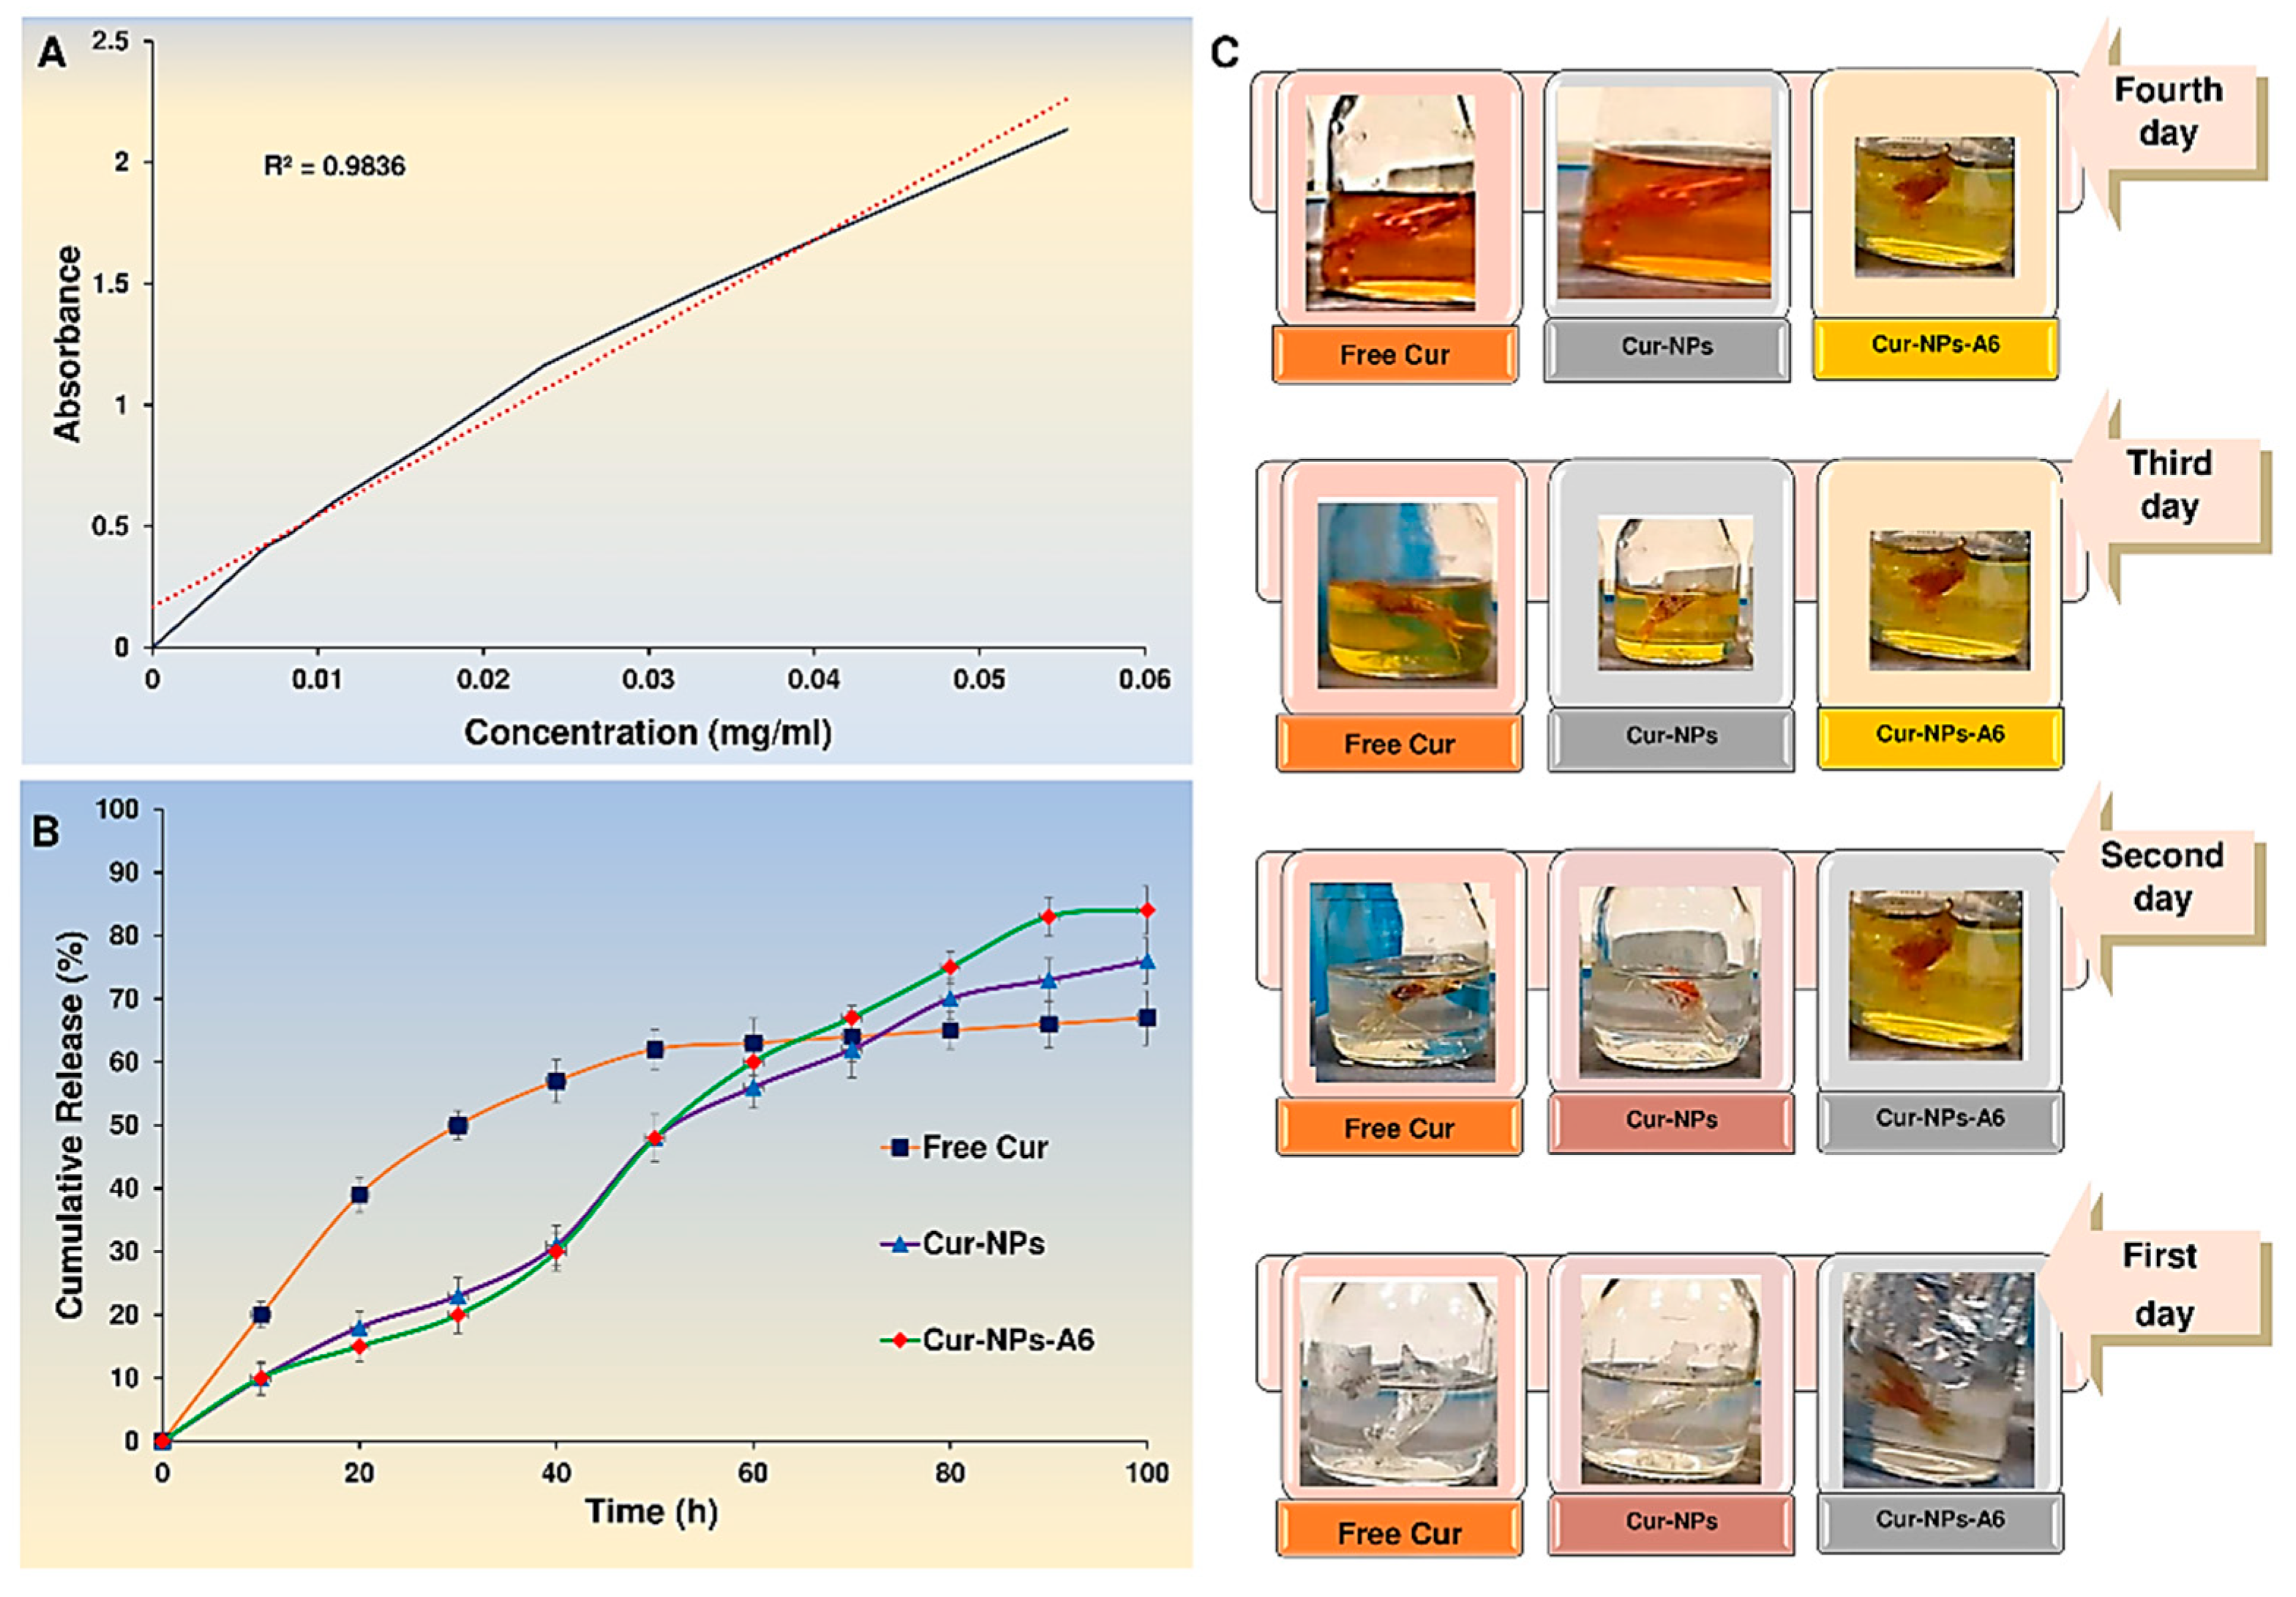
Figure 7.
Kinetics of Cur release. Zero-order kinetics (A), First-order kinetics (B), Higuchi model (C), and Peppas and Korsmeyer model (D) for Cur-NPs-A6.
Figure 7.
Kinetics of Cur release. Zero-order kinetics (A), First-order kinetics (B), Higuchi model (C), and Peppas and Korsmeyer model (D) for Cur-NPs-A6.
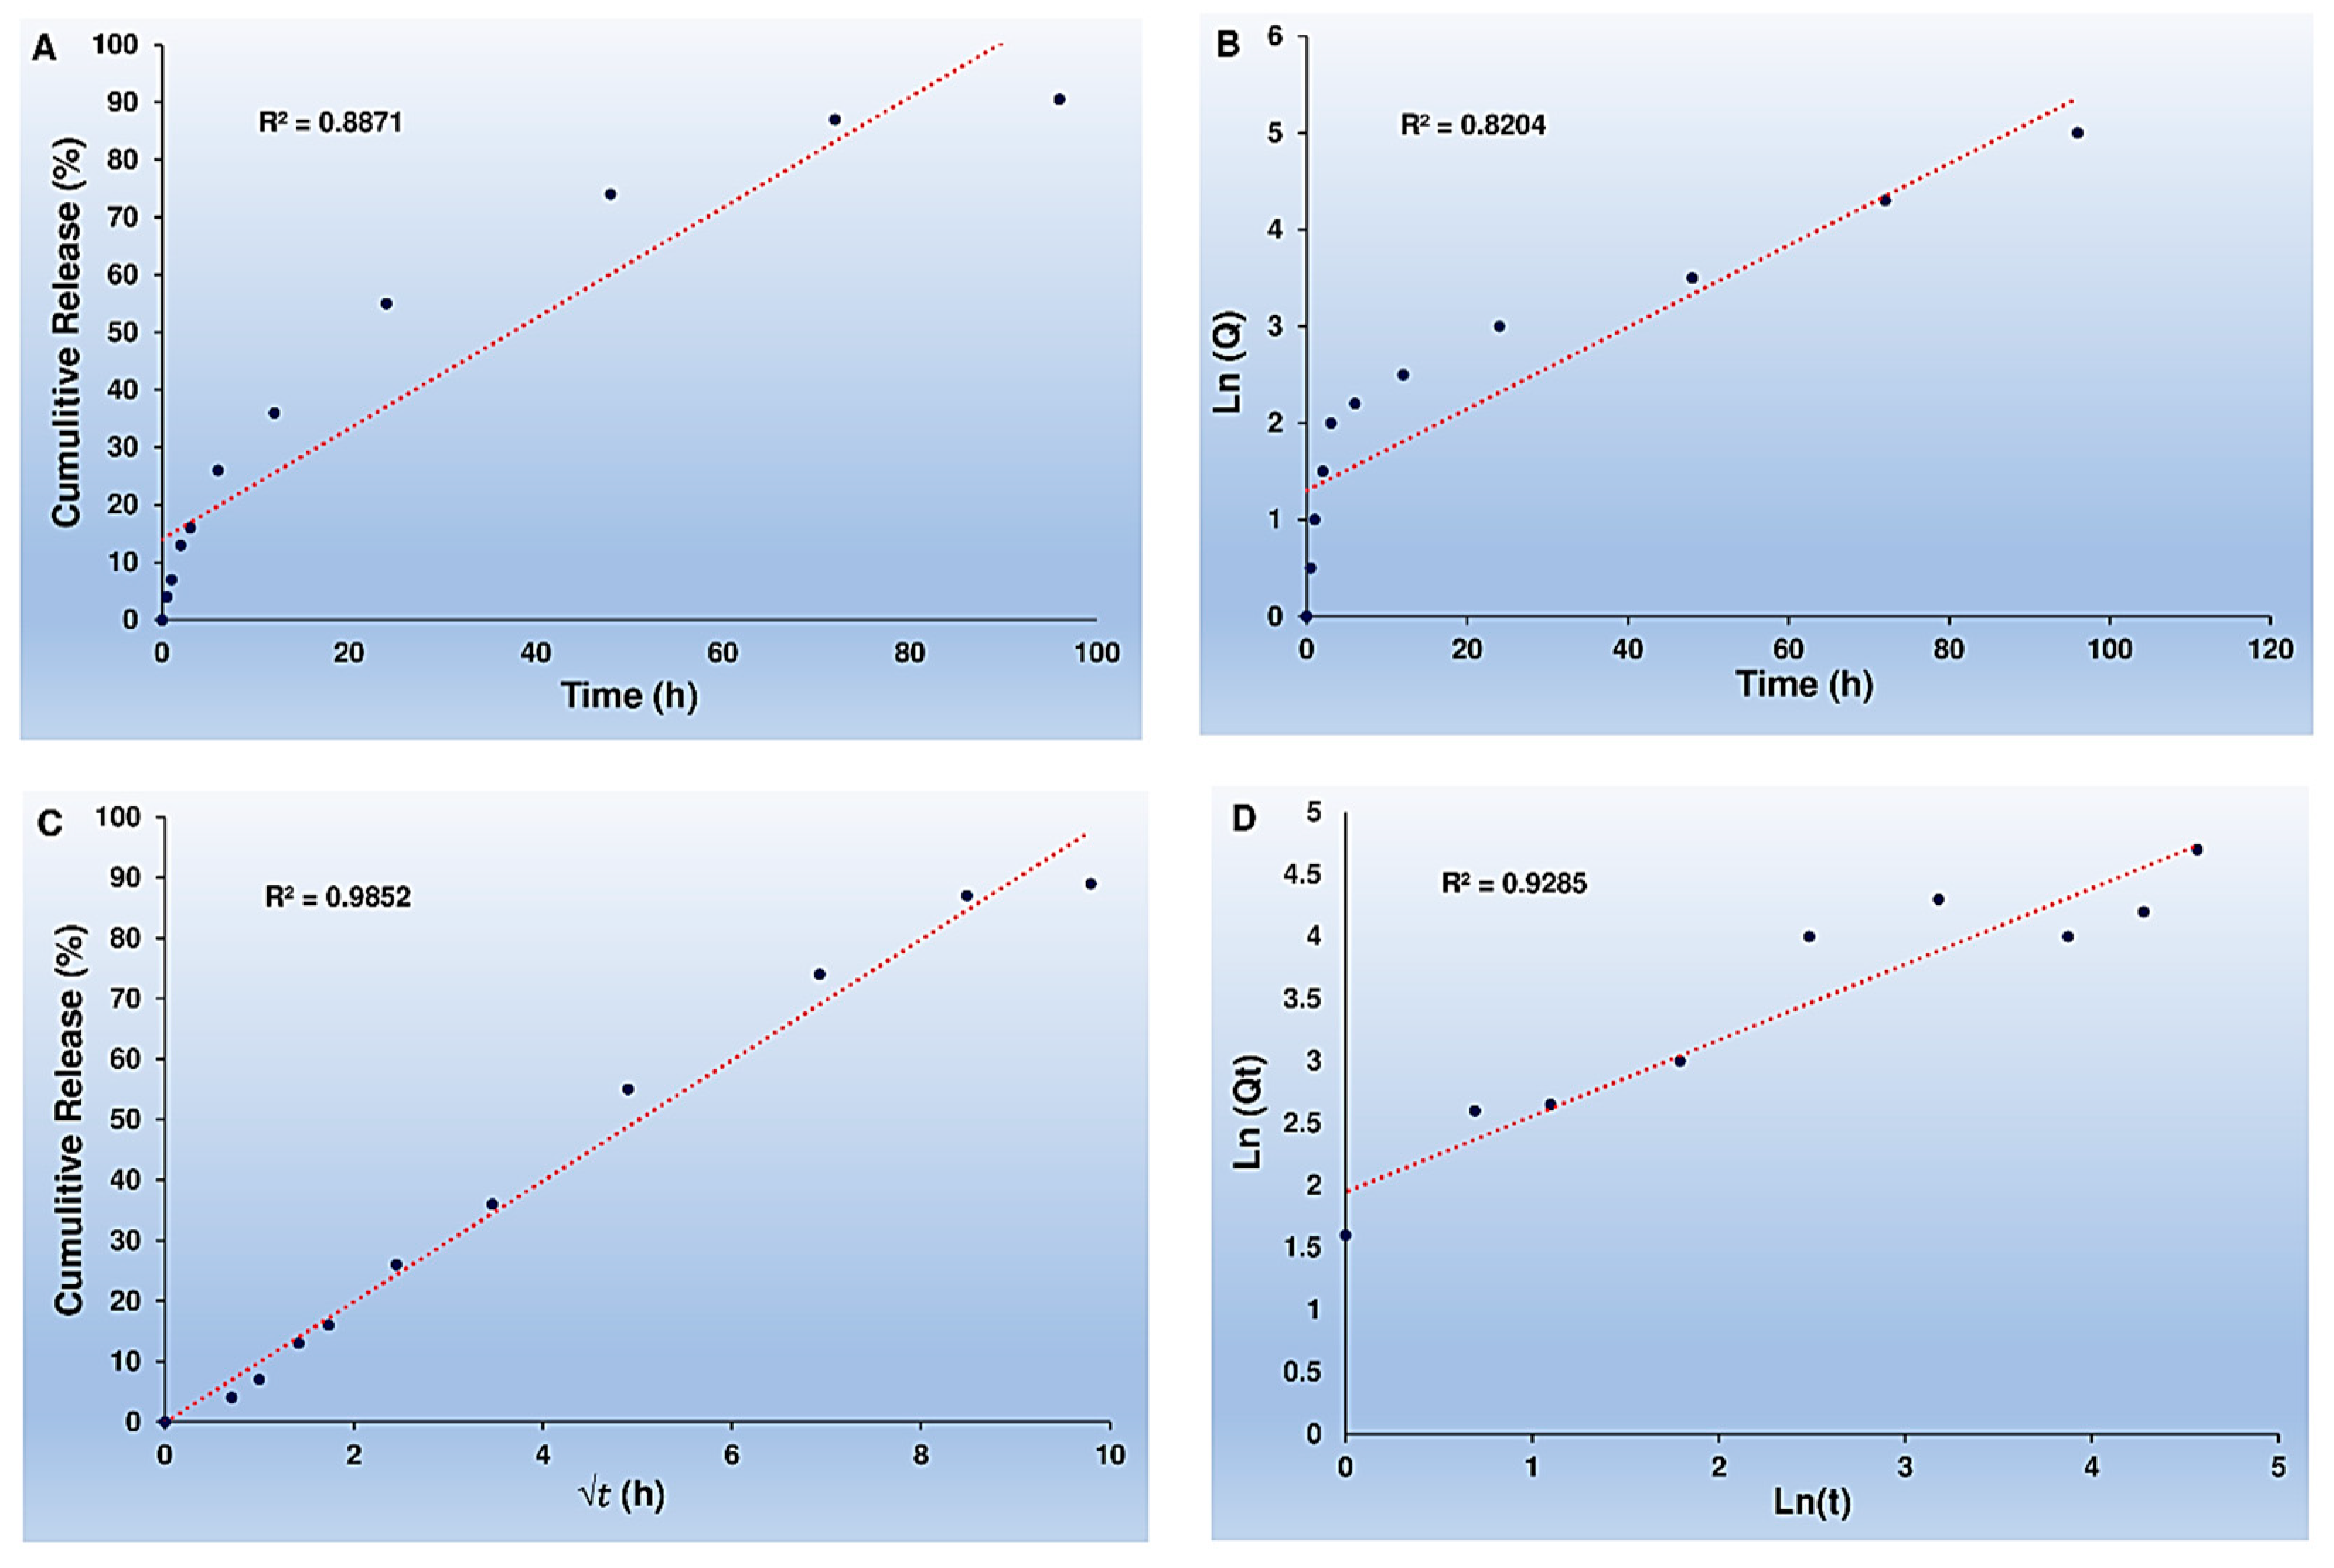
Figure 8.
Evaluating the cytotoxic effect of free Cur, Cur-NPs, Cur-NPs-A6, NPs, and NPs-A6 at various Cur concentrations against MD-MBA-231cells after 48h (A). Dose-dependent cytotoxicity of free Cur, Cur-NPs, Cur-NPs-A6, NPs, and NPs-A6 at various Cur concentrations against MCF-10A cells after 48h (B). IC50 values (C). The values represent the mean ± SD, and the data were analyzed using one-way ANOVA (n = 3, p* <0.05, p** <0.01, p*** <0.001).
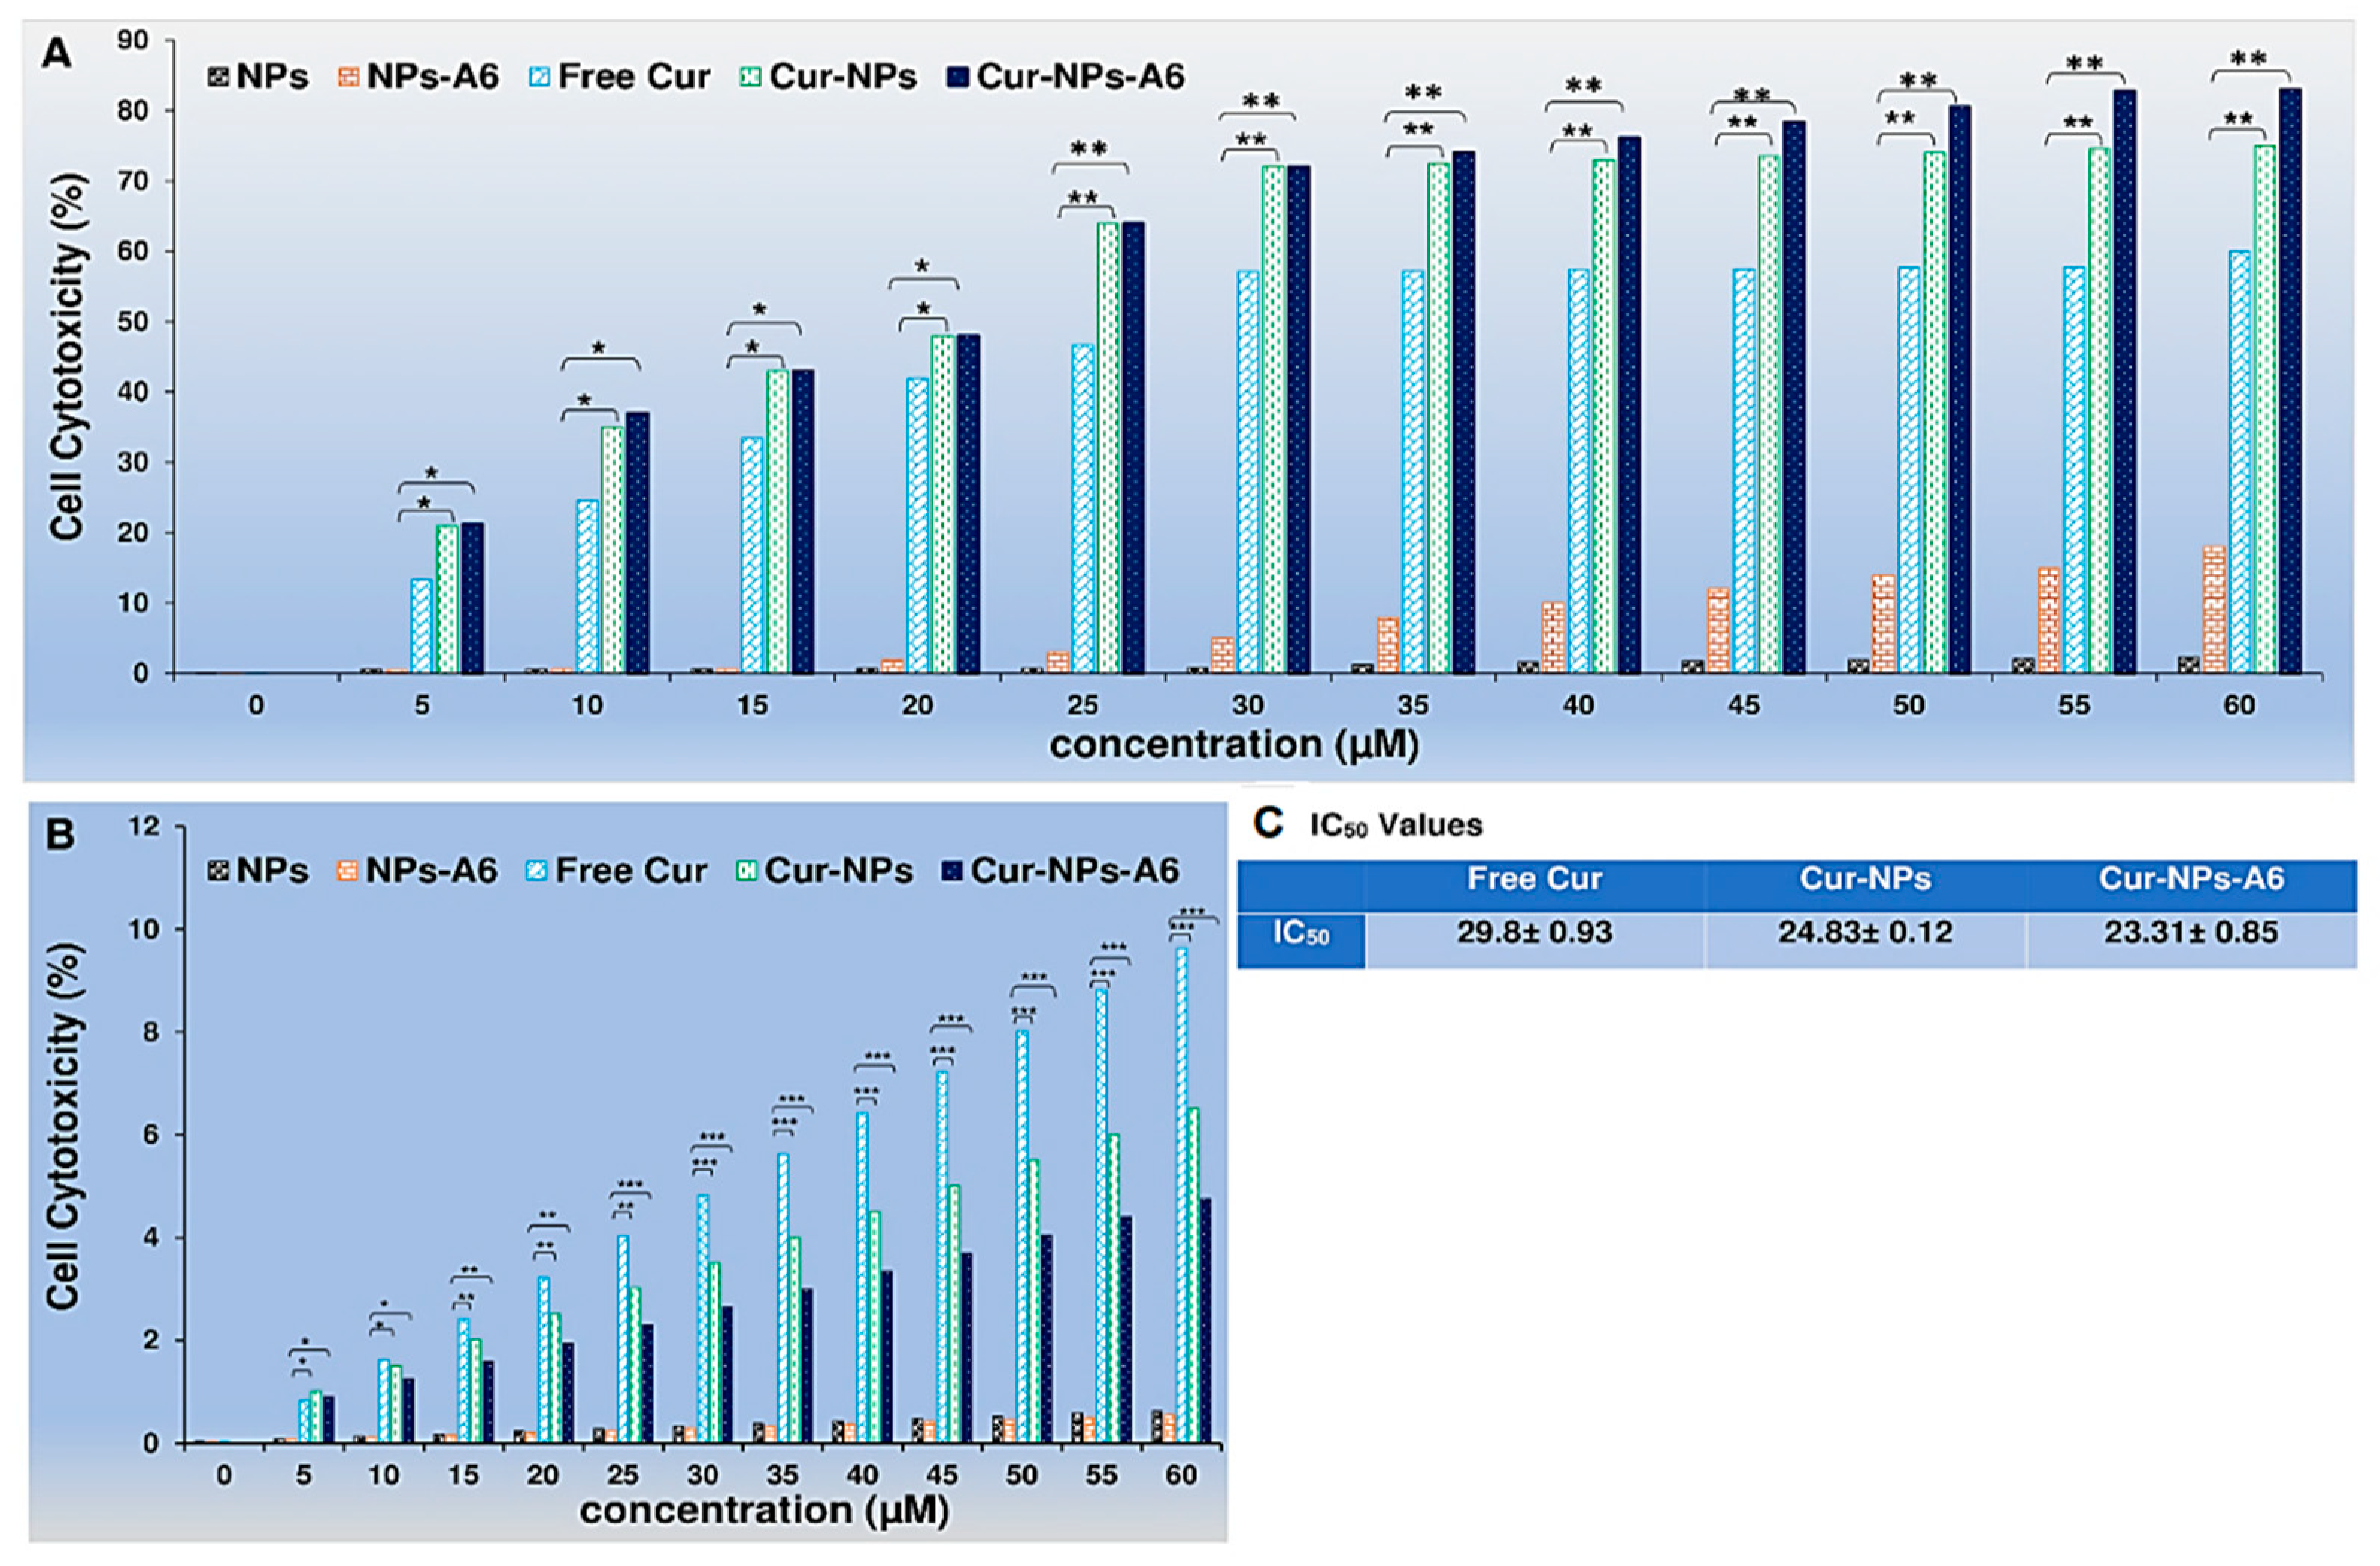
Figure 9.
Quantification of changes in Bax (A), Bcl-2 (B), hTERT (C), CD44 (D), MMP-2 (E), and MMP-9 (F) gene expression after treatment with Cur over a 48h time interval. Results represent the means ± SD of three different experiments (n=3, *P<0.05, **P<0.01, ***P<0.001).
Figure 9.
Quantification of changes in Bax (A), Bcl-2 (B), hTERT (C), CD44 (D), MMP-2 (E), and MMP-9 (F) gene expression after treatment with Cur over a 48h time interval. Results represent the means ± SD of three different experiments (n=3, *P<0.05, **P<0.01, ***P<0.001).
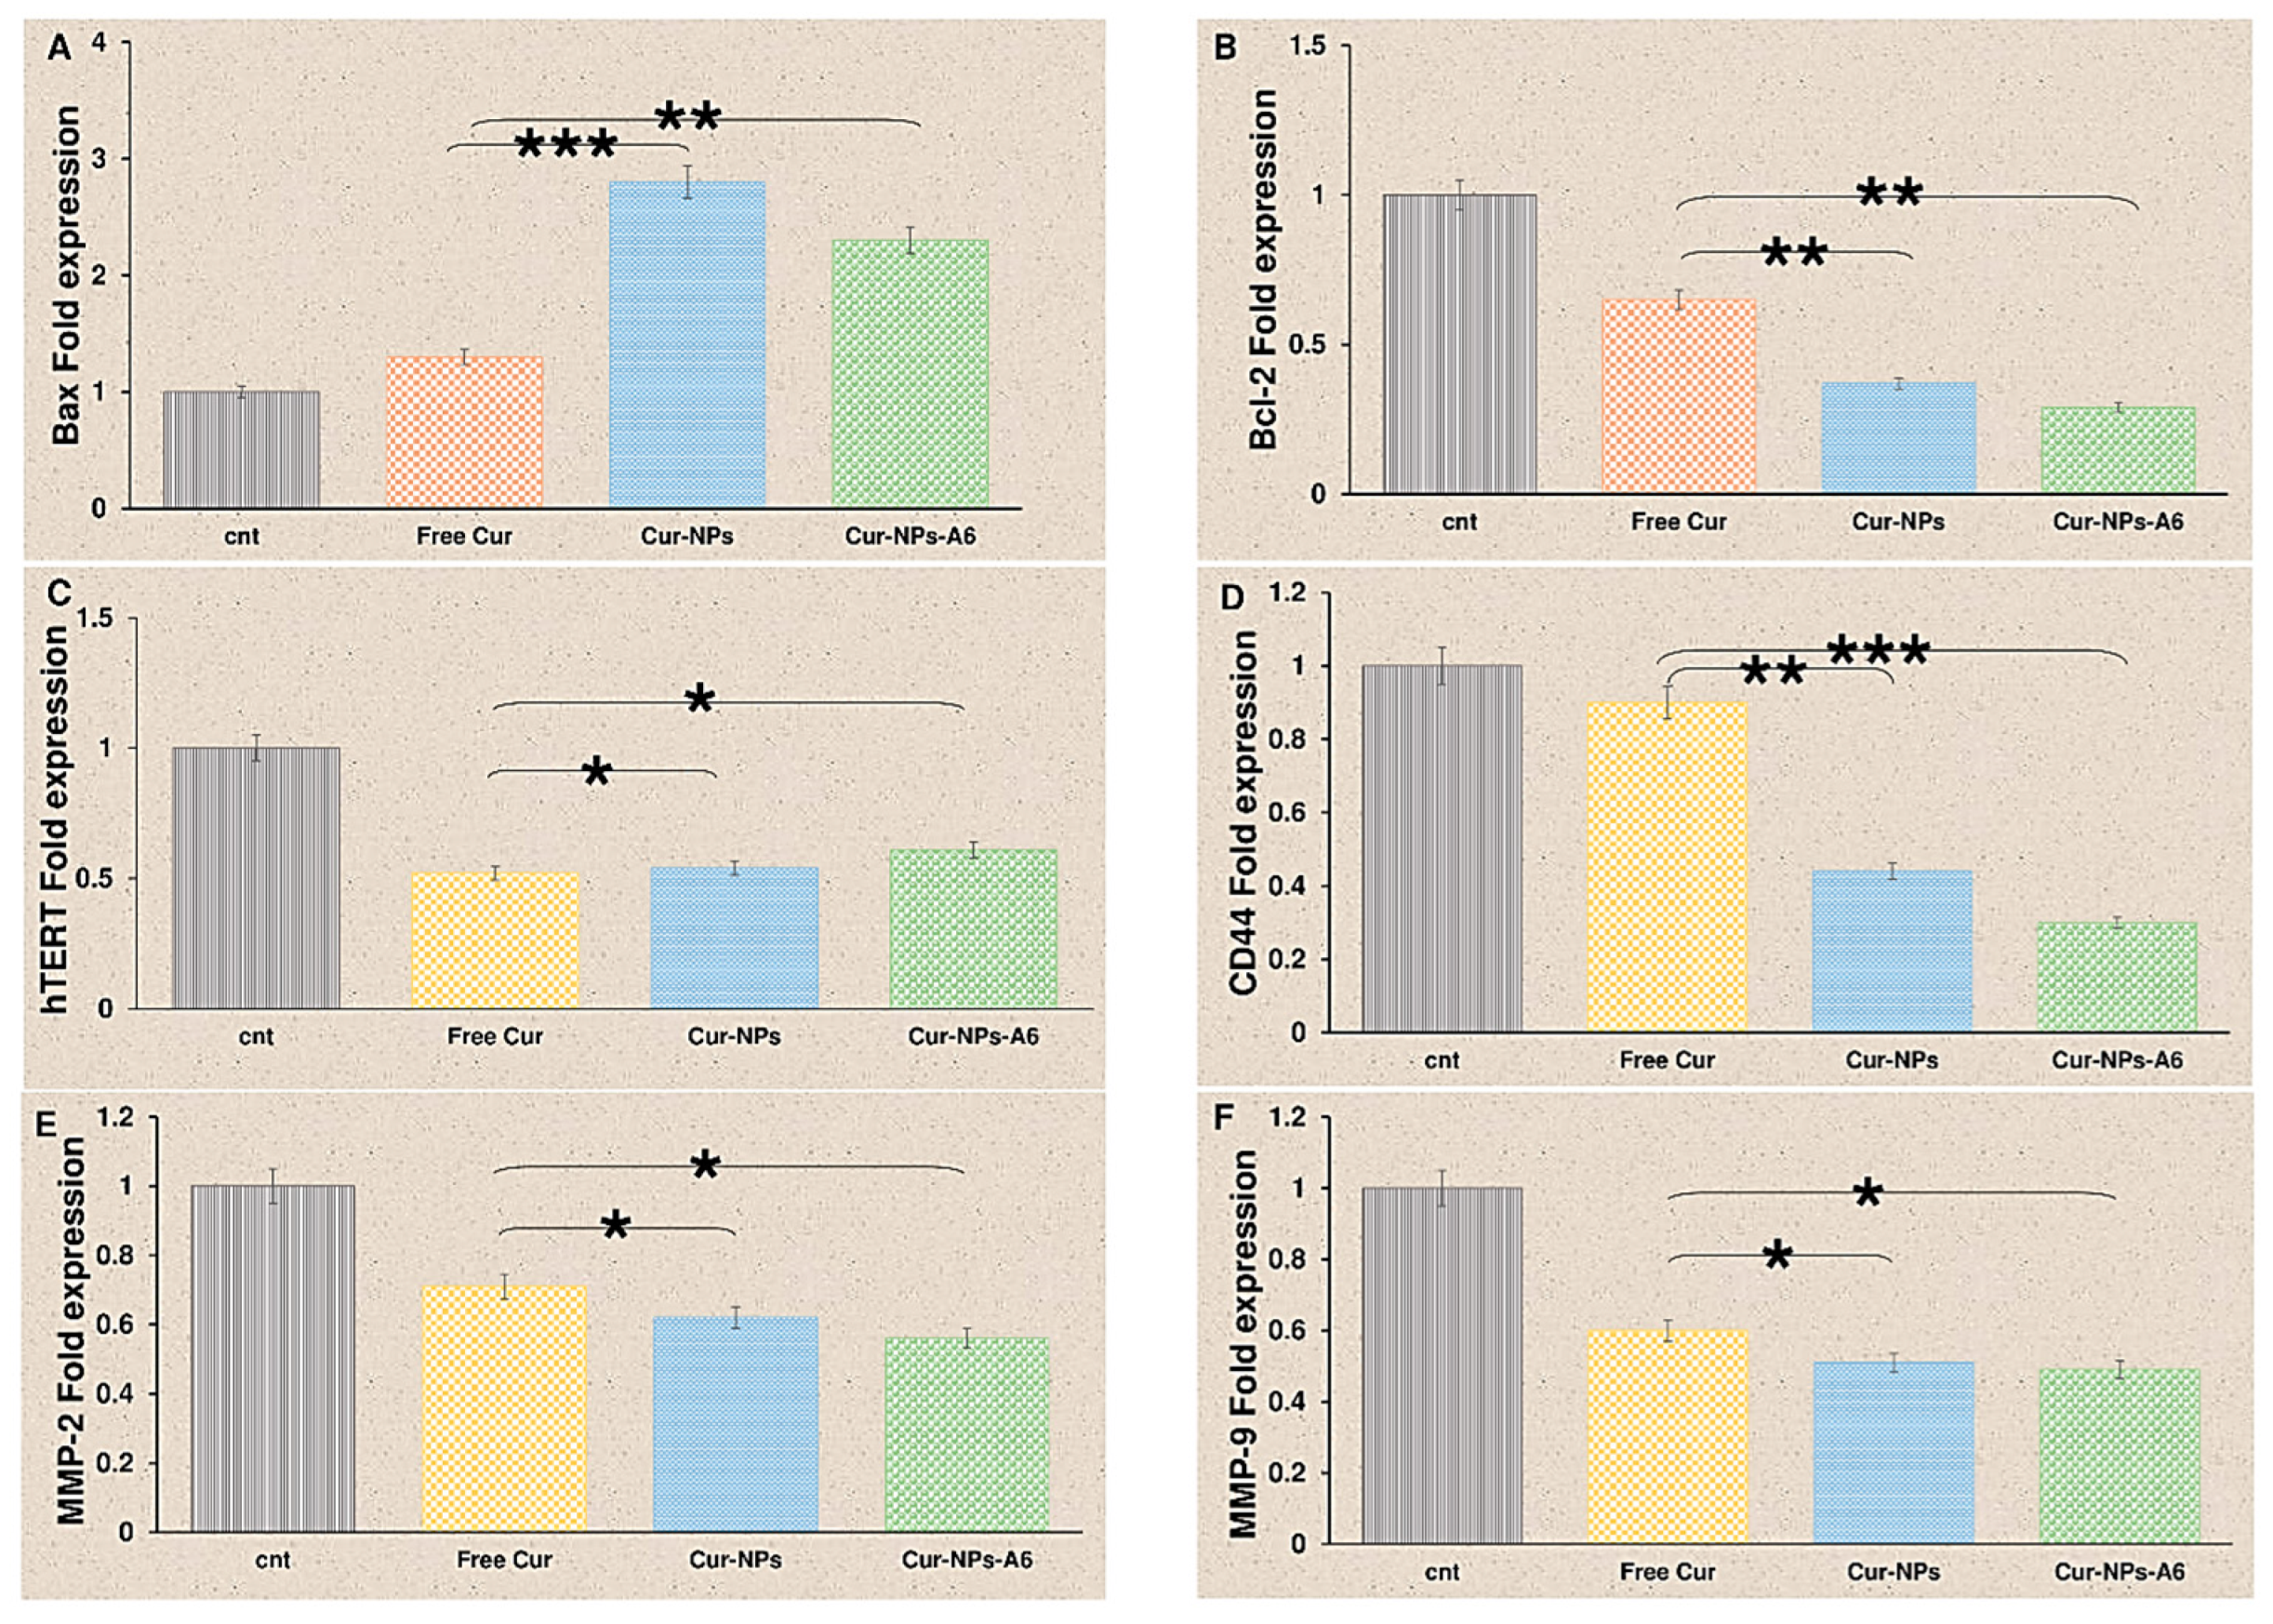
Figure 10.
The number of cells invaded per field for the studied group after 48h (A); Control (B), Free Cur group (C), Cur-NPs group (D), Cur-NPs-A6 group (E). Results represent the means ± SD of three different experiments (n=3, *P<0.05, **P<0.01, ***P<0.001).
Figure 10.
The number of cells invaded per field for the studied group after 48h (A); Control (B), Free Cur group (C), Cur-NPs group (D), Cur-NPs-A6 group (E). Results represent the means ± SD of three different experiments (n=3, *P<0.05, **P<0.01, ***P<0.001).
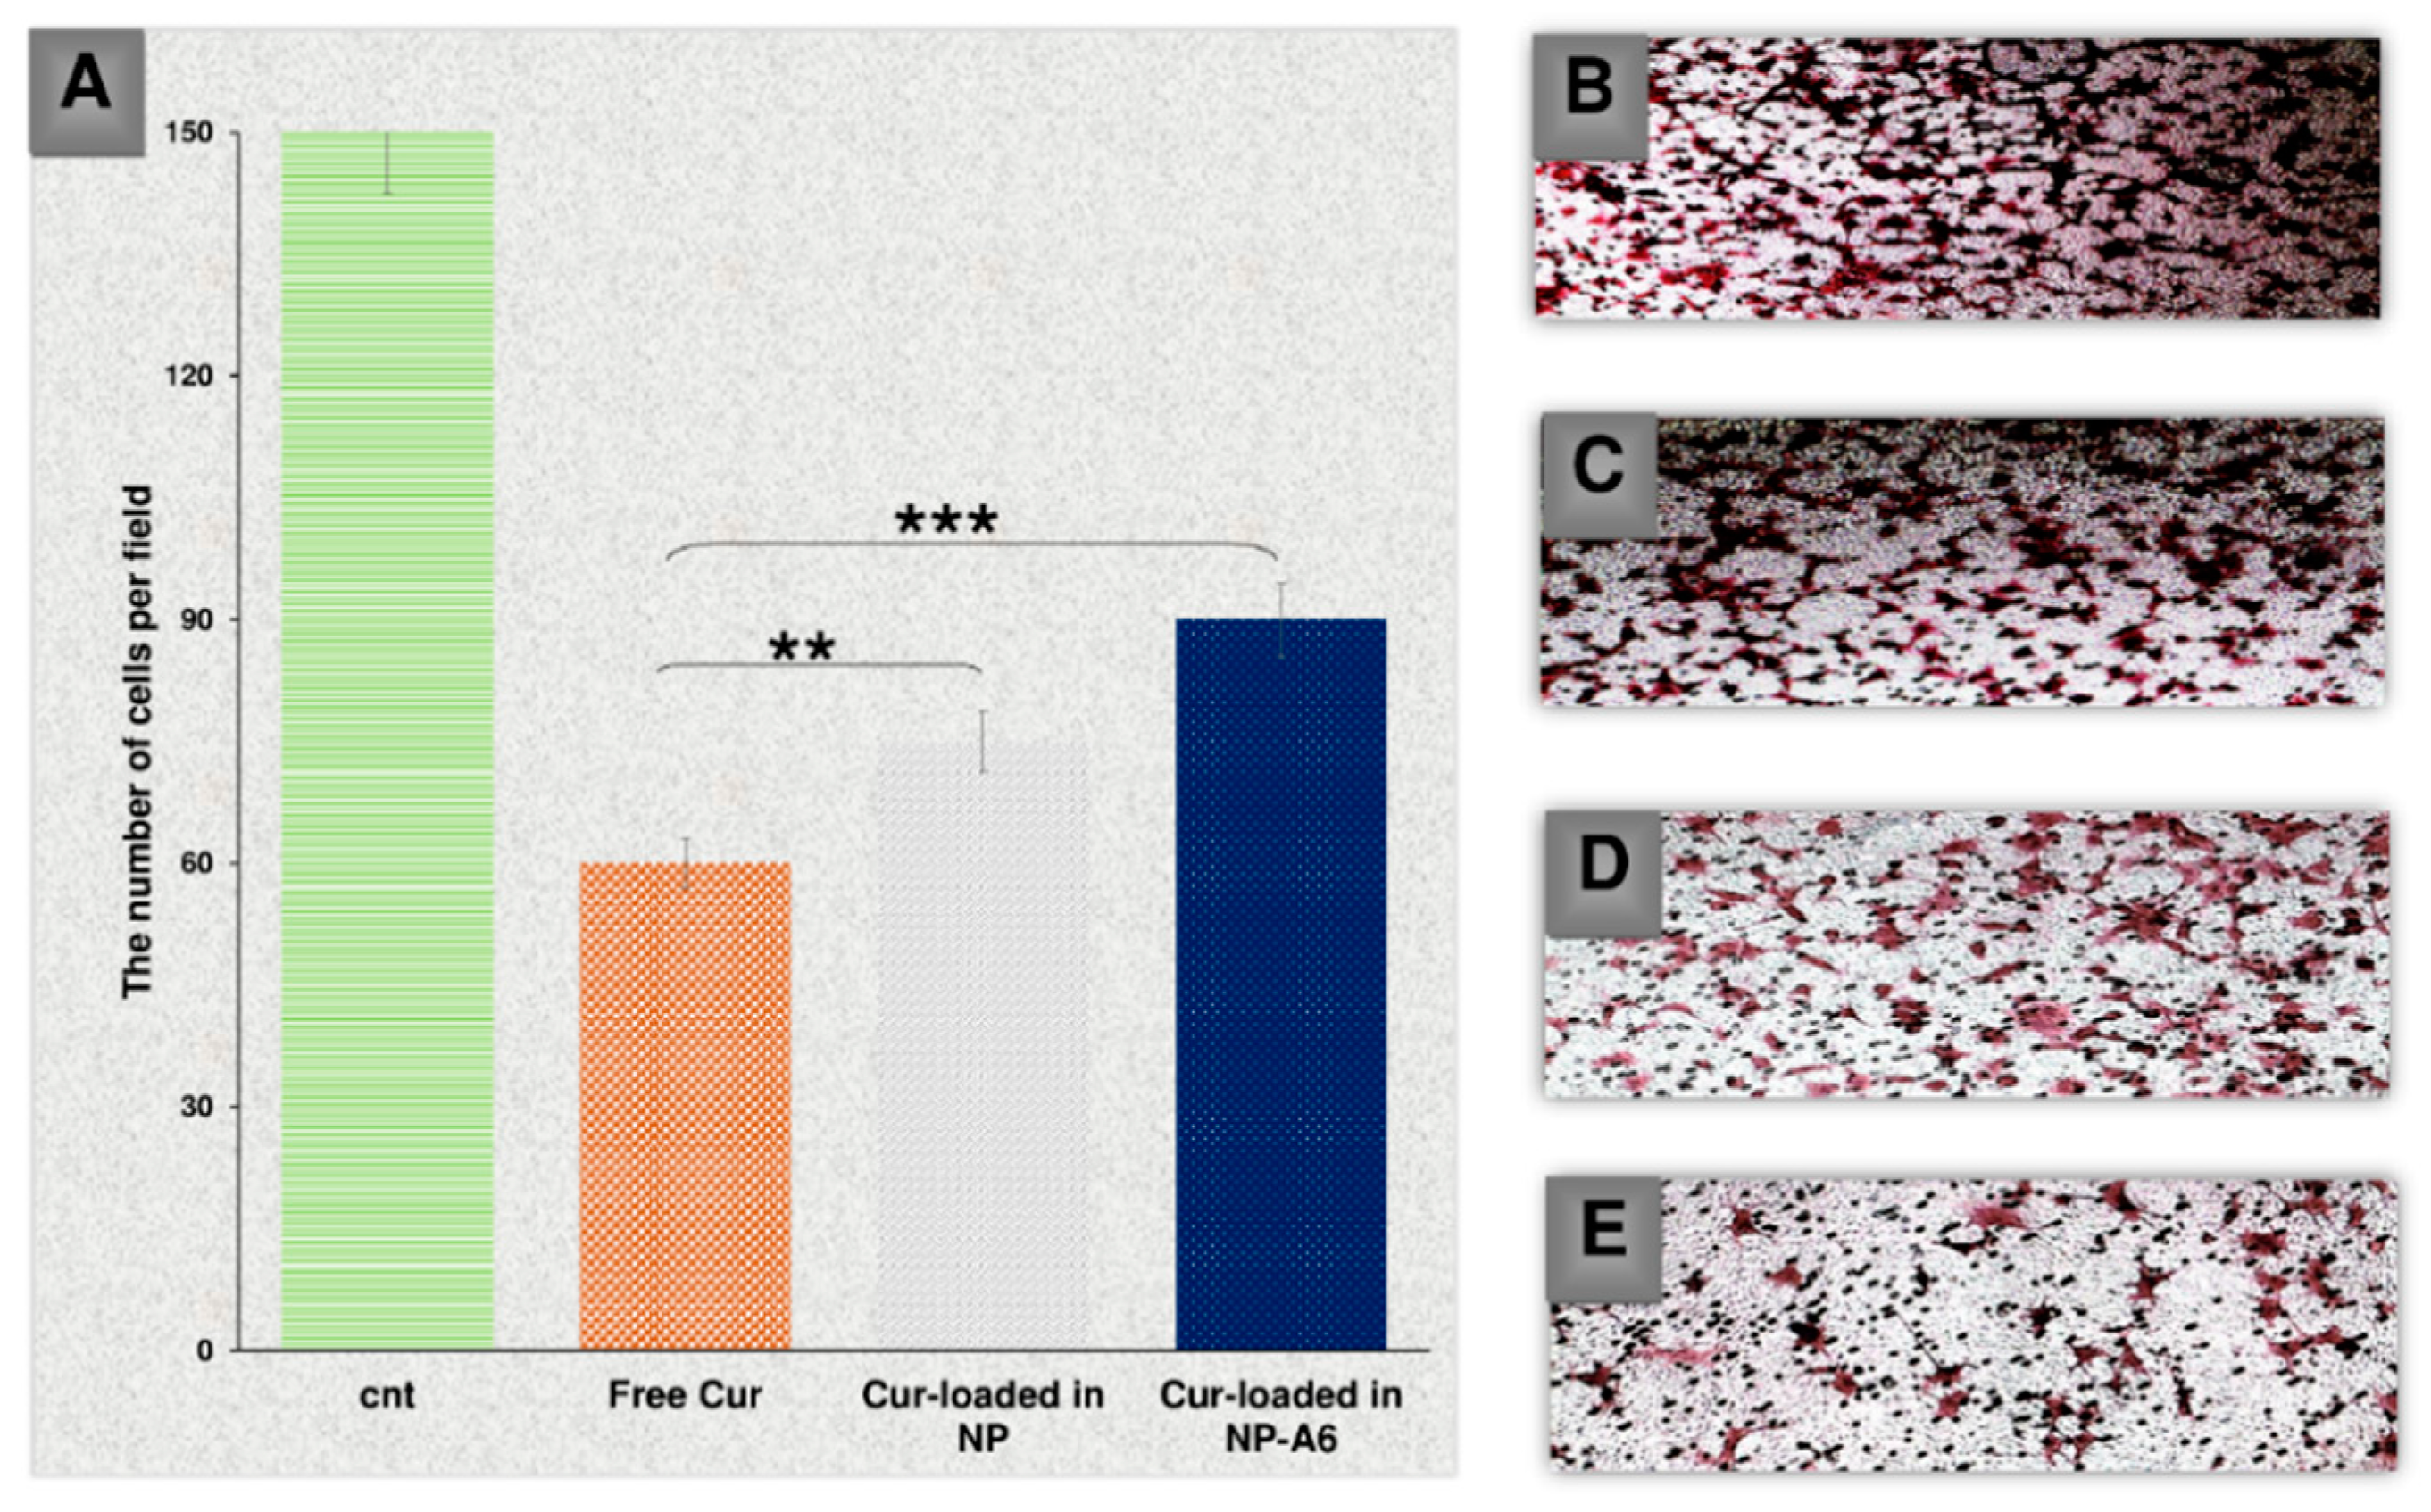
Figure 11.
Schematic representation of PCL-PEG and PCL-PEG-A6 synthesis workflow.
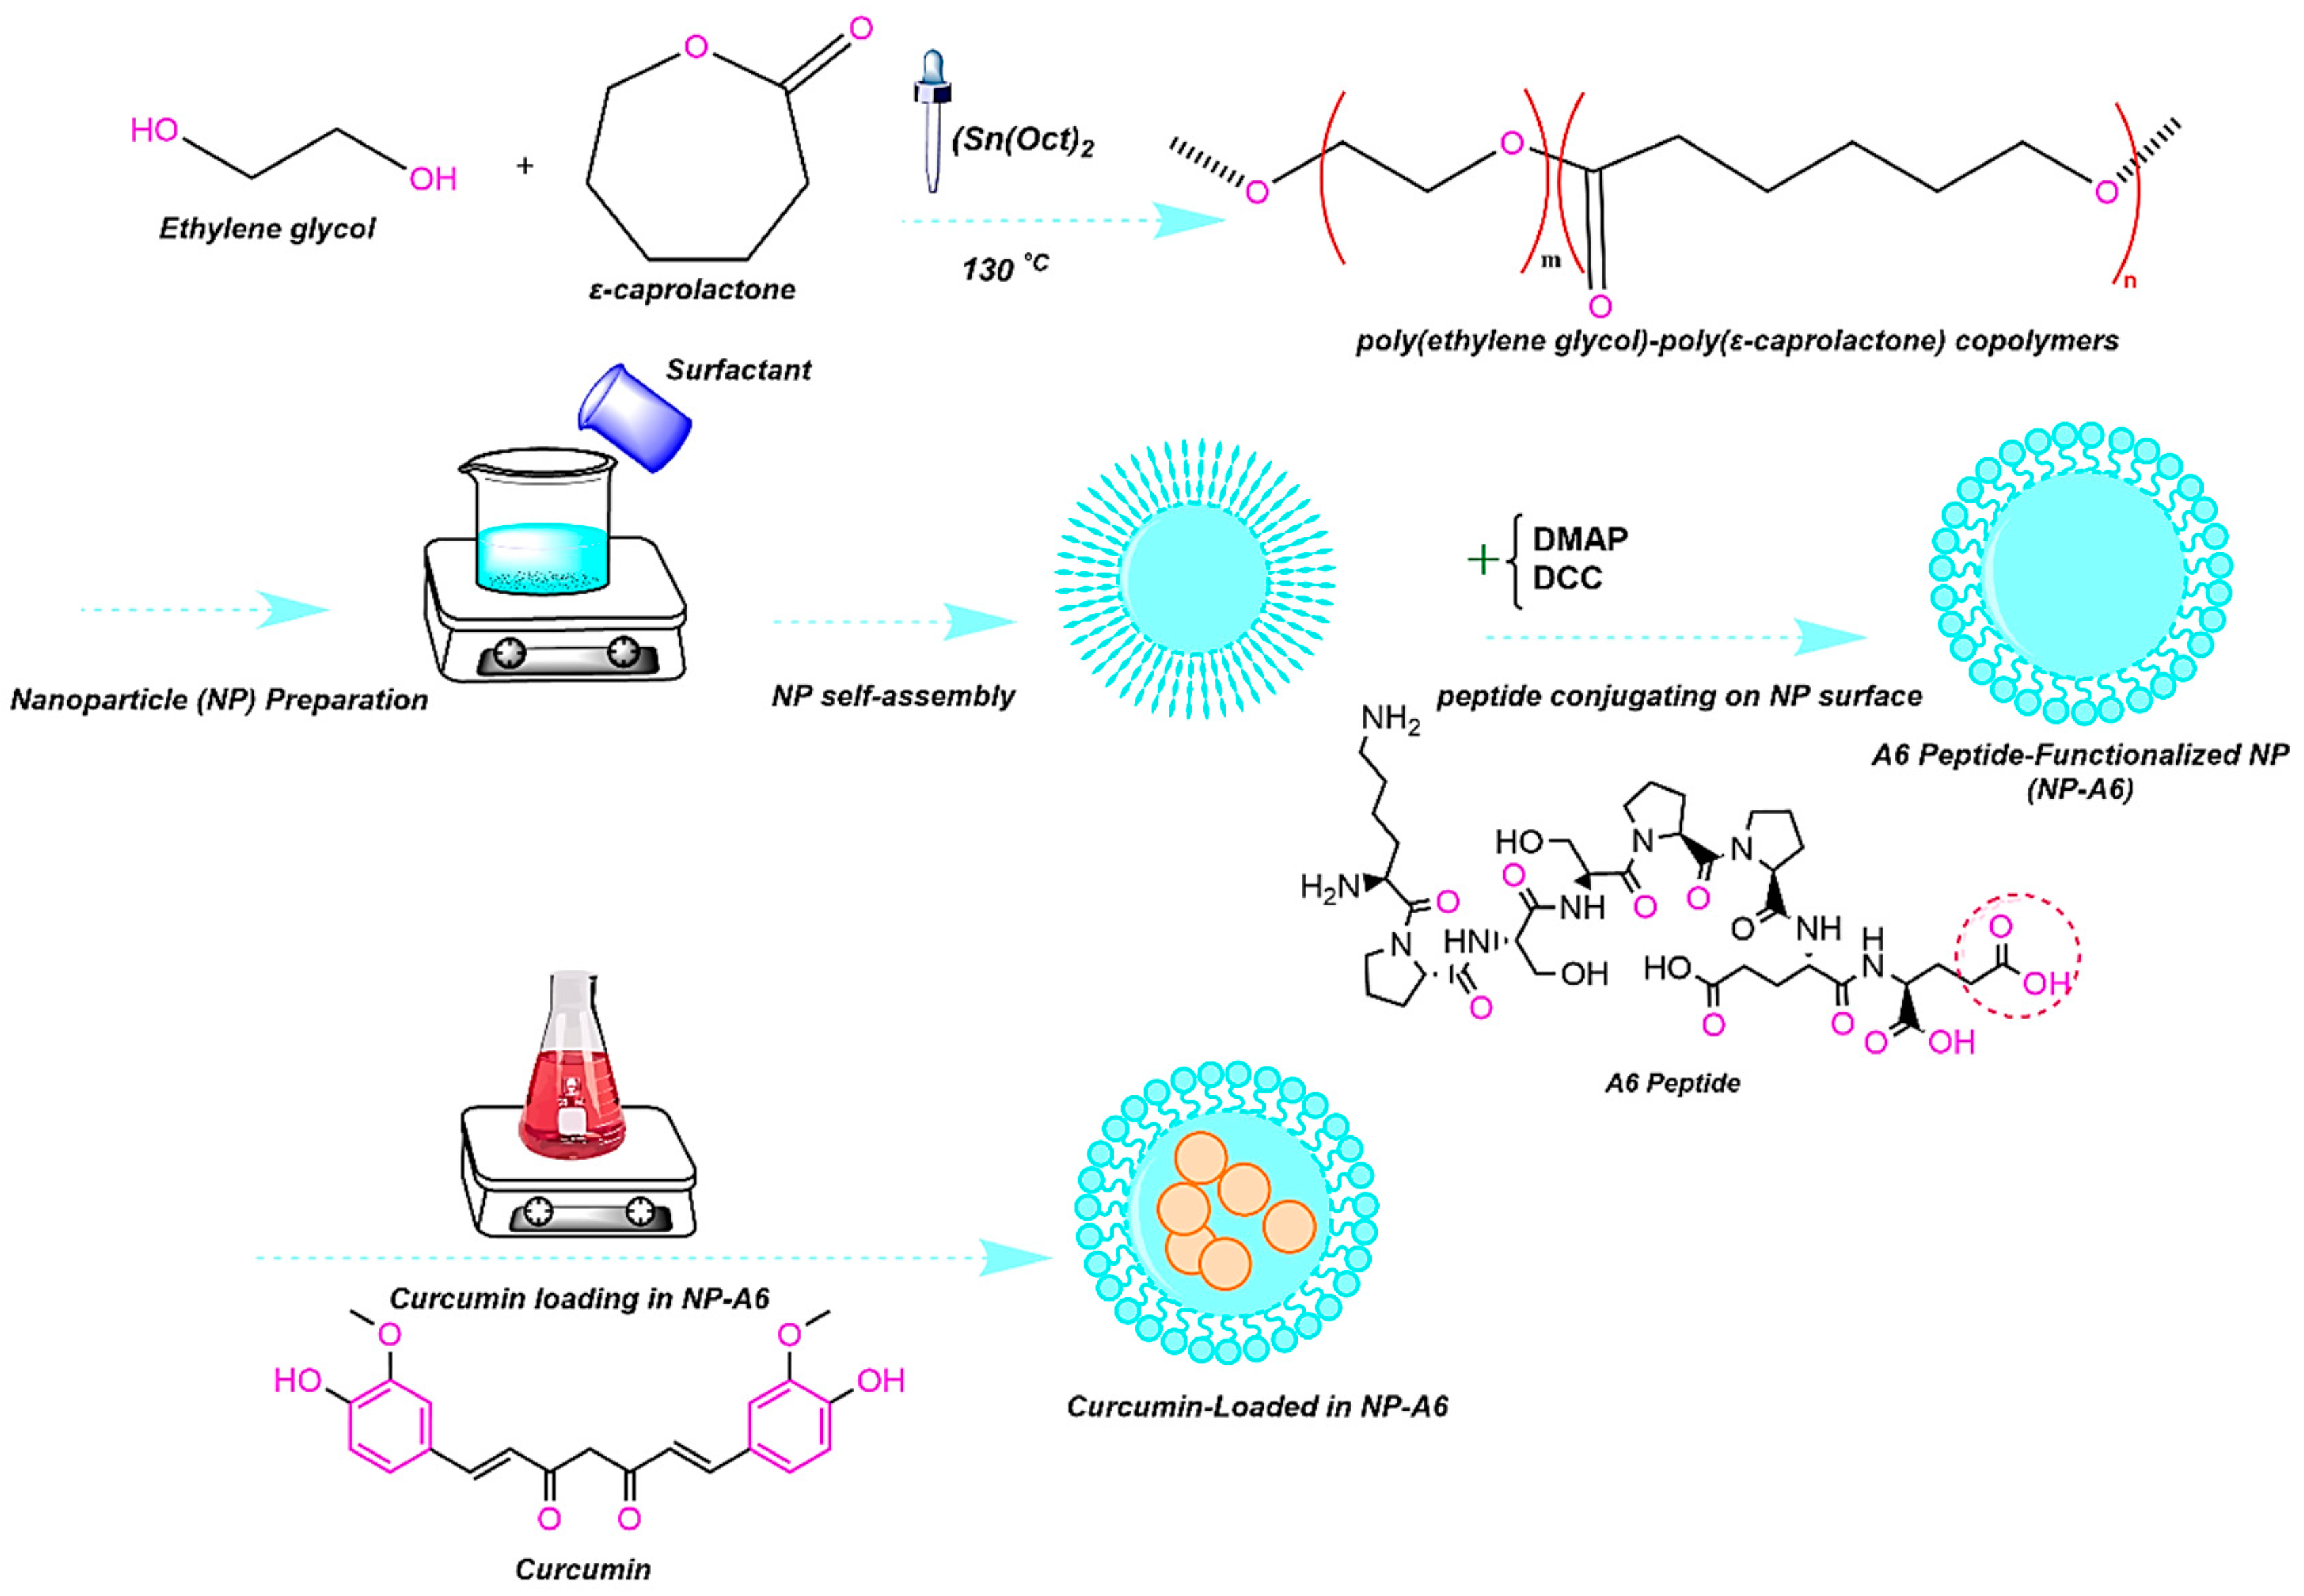

Table 1.
Designed primers for target genes.
| Gene Name | Primer Sequence | Strand | Product Size |
|---|---|---|---|
|
BCL-2 |
TGGGATCGTTGCCTTATGCA | Plus |
101 |
| GTCTACTTCCTCTGTGATGTTGT | Minus | ||
|
hTERT |
GTCTACTTCCTCTGTGATGTTGT | Plus |
128 |
| CCGGCATCTGAACAAAAGCC | Minus | ||
|
BAX |
AAACTGGTGCTCAAGGCCC | Plus |
81 |
| AGAGGCAGGGATGATGTTCT | Minus | ||
|
MMP-2 |
TGGATACCCCTTTGACGGTAAG | Plus |
137 |
| CATACTTCACACGGACCACTTG | Minus | ||
|
MMP-9 |
GATGCCTGCAACGTGAACAT | Plus |
88 |
| AGAATCGCCAGTACTTCCCATC | Minus | ||
|
CD44 |
GCTTCAATGCTTCAGCTCCA | Plus |
71 |
| TCCATCAAAGGCATTGGGCA | Minus |
Disclaimer/Publisher’s Note: The statements, opinions and data contained in all publications are solely those of the individual author(s) and contributor(s) and not of MDPI and/or the editor(s). MDPI and/or the editor(s) disclaim responsibility for any injury to people or property resulting from any ideas, methods, instructions or products referred to in the content. |
© 2023 by the authors. Licensee MDPI, Basel, Switzerland. This article is an open access article distributed under the terms and conditions of the Creative Commons Attribution (CC BY) license (http://creativecommons.org/licenses/by/4.0/).
Copyright: This open access article is published under a Creative Commons CC BY 4.0 license, which permit the free download, distribution, and reuse, provided that the author and preprint are cited in any reuse.


