
Submitted:
11 August 2023
Posted:
15 August 2023
You are already at the latest version
Abstract
Although the vegetation of the Cerrado biome is prone to fire, plant species composition can be altered according to its severity and frequency. Furthermore, many Cerrado plant species are resistant and can adapt to frequent fires. Little is known about how plant species of Cerrado environments respond to fire and the extent to which fire is beneficial for their conservation. The present study analyzed the responses of plant species of areas of campo sujo to fire and changes in floristics and vegetation structure at different post-fire intervals. Areas with frequent fires had a greater diversity of species, while the area with 10 years without burning had lower diversity and greater DBH. The distribution of species differed among the four the studied areas. We conclude that fire was beneficial for species diversity in the studied areas of Cerrado since it was able to promote the insertion and removal of species during intervals between fires.
Keywords:
Fire
; Floristics
; Cerrado
1. Introduction
Fires are often the main cause of vegetation interruption and regeneration and are responsible for changes in floristic composition and landscape structure [6]. Changes caused by fire depend on several factors such as level of severity, which in turn is controlled by several environmental factors and by factors that affect combustion, such as air temperature and humidity [15]. Changes in the structure of plant communities due to fire include changes in the intensity of flowering, population dynamics and competitiveness among species and make it possible to select plants with structures that are adaptive against fire [29].
Fire is a natural disorder in tropical savannas as it acts as a key component in defining physiognomy, composition and structure [1]. The Cerrado, Brazilian savanna, originally covered about 2 million km2 or 25% of the country’s territory [7]. The vegetation of the Cerrado biome is currently one of the most threatened in South America, with less than 7% of its current coverage under legal protection [1].
Fires, although frequent in the Cerrado, are capable of reducing the herbaceous-shrub and woody cover of the plant community [27]. However, post-fire biomass and Cerrado vegetation recovery can match fire-induced biomass loss [9] without a drastic alteration to the ecosystem.
Fire can also cause progressive change in the structure and floristic composition of tropical savanna communities over time [23], since it is considered a factor of important influence on vegetation structure and composition [12]. Although Cerrado plants have different responses to different types of fires [27], contact with fire has been responsible for the elimination of some sensitive species [16] and for reducing the number of individuals in communities [11].
An important consideration when analyzing the impacts of fire on vegetation is the functional approach to plant communities [22]. Functional groups are defined as sets of species that have similarities in terms of attributes [19] related to environmental disturbances [19]. In environments conducive to fire, such as that of Parque Nacional das Sempre Vivas, these different responses can facilitate the identification of sets of species that are more adaptable to fire, thus promoting an improvement in the conservation of species subjected to fire.
The extent to which fire spreads depends on native vegetation cover and how it is spatially distributed [8]. Besides having a great influence on the potential spread of fires, the spatial configuration of elements that make up a landscape can also alter the fire regime in the long-term [23]. Changing the spatial configuration of the landscape can cause fragmentation and, thus, change abiotic conditions, which in turn alters the distribution of species in an ecosystem [8].
Bearing in mind that frequent and unmanaged fire may be causing drastic changes in biotic and abiotic factors of Parque Nacional das Sempre Vivas, the present study aimed to identify alterations to vegetation composition and landscape configuration in four areas of campo sujo (a Cerrado phytophysiognomy) submitted to different fire intervals. The hypotheses tested were that (1) fire would alter the physical structure of the landscape and that (2) areas subjected more frequent fires would have greater diversity of plant species.
2. Materials and Methods
2.1. Study site
The vegetation of Parque Nacional das Sempre Vivas (PNSV) is classified into: (1) campo rupestre (rupestrian fields on rocky outcrops), (2) savannic formations and (3) forest (cerrado sensu strictu) (Figure 1) [21]. The first two types of vegetation are part of the open fields formations of the biome and are generally located at higher altitudes [21].
2.2. Selection of study areas
According to the classification of vegetation and the location of burning scars (Figure 2), four areas of campo sujo (savannic formation) in Parque Nacional das Sempre Vivas were selected to compare vegetation composition and structure and pre- and post-fire spatial configuration of the landscape.
2.3. Data collection and analysis
Two 200-m² transects were established in each study area with 10 2 x 10-m plots each. Plant species within each plot were identified when possible; for species that could not be identified, specimens were collected and stored in herbarium UFVJM for later identification. All live tree and shrub individuals in the plots were measured in the field for diameter at 0.3 m above the ground (DBH).
2.3.1. Floristic composition and structure of the plant community
The Braun-Blanquet or classic stigmatist method [4] was applied to identify plant communities in the study areas. Phytosociological analysis comprised two fundamental stages. The analytical stage integrates sample design, collection of plant material and identification of species, while the synthetic stage culminates with the comparison of data among sample units for classification [18]. It is in this stage that the identification and classification of floristics was carried out in the four study areas. Floristic diversity of the four post-fire study areas were compared by calculating Shannon’s diversity index (H’), Pielou’s equitability index (J’) [5] and first and second order jackknife estimators, last two of which estimate the total number of species based on the heterogeneity of the sample [20]. Shannon’s diversity indexes were compared using the Hutchenson t-test.
The sampled individuals were distributed in diameter classes per burned area, using intervals with increasing amplitudes to compensate for decreasing density for the larger: 0<10, 10<20 and 20<40. The importance value (IV) of the species was also calculated, which is given by the sum of the frequency, density and dominance, in relative terms [17].
The frequency of absolute coverage (FA) was calculated as the percentage of sample units in each plot with the occurrence of a specific species. It is expressed by the formula [10]:
where FAi = absolute frequency of species i (%); NPi = number of points with species i; and NTP = total number of sampled points.
FAi = (NPi/NTP) x 100;
Absolute vigor (AV) or density, is given by the number of touches registered by a species in relation to the total number of sampled points and, thus, reflects the stratification or vertical coverage of a species which depends on its life form and development. It can be used to indicate the dominance or notability of a species by height, coverage or density [14].
A Canonical Correspondence Analysis (CCA) was performed to determine whether the four study areas can be distinguished according to the distribution of species in plots [3]. This analysis used a matrix with species abundance and a matrix with a categorical variable corresponding to the sampling unit of each plot. The abundance data were log transformed (ln (x + 1)) to compensate for deviations caused by highly discrepant values.
2.3.2. Functional characterization of plant species
Functional groups were formed according to attributes related to fire disturbance [22]. The groups were defined according to life form (shrub, tree) and ability to sprout after fire (yes, no) [22]. Woody species can respond in different ways to fire damage. As a consequence of moderate damage or topkill (death of the aerial part), there may be regrowth in the basal part of the trunk or in underground organs [22].
2.3.3. Dynamic landscape configuration
Analysis of changes in landscape configuration of the four study areas required making vegetation maps of them for the years 2007, 2011, 2016 and 2017. The maps were made by selecting, georeferencing and classifying Landsat 5 and 8 ETM+ images of PNSV (orbit 180/point 072) in ArcMap 10.2.
For calculation of landscape metrics, the study areas were expanded and areas within them were classified as pre- and post-fire fragments. The following metrics at the landscape level were calculated to analyze landscape composition between 2007 and 2017: fragment density, edge density and total area [8]. The following metrics were calculated at the level of the total landscape for analysis of landscape configuration: edge, edge density, total core area and connectivity between fragments [8]. All metrics were calculated in Fragstats 4.0 with an edge depth of 100 meters and 200 meters between fragments.
3. Results
3.1. Vegetation analysis
A total of 1663 individuals were sampled with 258 from Area 1 (3 months without fire), 572 from Area 2 (27 months without fire), 440 from Area 3 (75 months without fire) and 393 from Area 4 (123 months without fire). The individuals were classified into 57 species belonging to 22 families: Area 1 with 12 families and 19 species; Area 2 with 19 and 34; Area 3 with 10 and 16; and Area 4 with 14 and 27, respectively. These values differed significantly among the four areas according to ANOVA (Table 1).
Area 2 had 39.75% of the total of sampled individuals and was richest in species and families. Species diversity evaluated by Shannon’s index ranged from 2.00 nats/individual in Area 3 to 2.46 nats/individual in Area 2 (Table 1). Pielou’s equitability varied form 0.70 in Area 2 to 0.84 in Area 4. The 1st order jackknife estimates indicated greater potential for richness in Area 2, followed by Area 3, Area 1 and Area 4.
Regarding IV, the species Erythroxylum deciduum, Myrsine guianensis and Kielmeyera lathrophyton were the most important species in Area 1; Myrsine guianensis, Salacia crossifolia and Kielmeyera coriácea in Area 2; Kielmeyera lathrophyton, Bauhinia holophylla (Steud.) and Dalbergia miscolobium in Area 3; and Persea indica, Eremanthus erythropappus and Vitex moronensis in Area 4 (Table 2).

| Family/Species | Area | Classification | ||||||||||
|---|---|---|---|---|---|---|---|---|---|---|---|---|
| 1 | 2 | 3 | 4 | Total | Life form | Post-fire growth capacity | ||||||
| Annonaceae | IV | Rank | IV | Rank | IV | Rank | IV | Rank | IV | Rank | ||
| Annona crassiflora | 22.04 | 6 | 0.00 | 4.56 | 11 | 3.27 | 11 | 5.24 | 13 | Tree | no | |
| Annona emarginata | 0.00 | 6.30 | 9 | 0.00 | 0.00 | 1.82 | 22 | Tree | ||||
| Apocynaceae | ||||||||||||
| Aspidosperma tomentosum | 0.00 | 0.00 | 0.00 | 9.87 | 7 | 3.09 | 18 | Tree | yes | |||
| Asteraceae | ||||||||||||
| Eremanthus erythropappus | 0 | 0 | 0 | 35.32 | 2 | 17.83 | 2 | Tree | ||||
| Baccharis dracunculifolia | 0.58 | 18 | 12.8 | 5 | 7.63 | 6 | 1.16 | 18 | 5.06 | 14 | Shrub | |
| Lychnophora ericoides | 0 | 0 | 6.84 | 7 | 0 | 1.48 | 24 | Shrub | ||||
| Lychnophora pinaster | 2.51 | 11 | 0 | 0 | 0 | 1.63 | 23 | Shrub | ||||
| Micania neurocaula | 0 | 1.50 | 18 | 0 | 0 | 0.42 | 37 | Shrub | ||||
| Bignoniaceae | ||||||||||||
| Jacaranda sp. | 0.00 | 0.64 | 26 | 0.00 | 0.00 | 0.18 | 48 | Tree | ||||
| Calophyllaceae | ||||||||||||
| Kielmeyera coriacea | 0.00 | 15.50 | 4 | 0.00 | 5.39 | 10 | 5.68 | 12 | Tree | yes | ||
| Kielmeyera lathrophyton | 30.74 | 2 | 1.05 | 22 | 52.04 | 1 | 3.11 | 12 | 15.82 | 6 | Tree | yes |
| Celastraceae | ||||||||||||
| Salacia crossifolia | 0.00 | 16.99 | 3 | 0.00 | 0.00 | 4.85 | 15 | Shrub | yes | |||
| Ericaceae | ||||||||||||
| Agarista olerifolia | 0.00 | 0.32 | 31 | 0.00 | 0.00 | 0.09 | 55 | Tree | ||||
| Erythroxylaceae | ||||||||||||
| Erythroxylum campestre | 0.00 | 5.26 | 11 | 1.42 | 13 | 0.00 | 1.88 | 21 | Tree | no | ||
| Erythroxylum deciduum | 32.75 | 1 | 8.86 | 6 | 0.00 | 0.00 | 8.34 | 9 | Tree | yes | ||
| Erythroxylum suberosum | 0.00 | 0.00 | 0.00 | 0.93 | 21 | 0.25 | 43 | |||||
| Erythroxylum tortuosum | 0.00 | 0.00 | 0.00 | 0.97 | 20 | 0.26 | 42 | |||||
| Fabaceae | ||||||||||||
| Acosmium dasycarpum | 0.00 | 0.00 | 0.00 | 20.00 | 4 | 7.71 | 10 | Tree | yes | |||
| Bauhinia holophylla | 4.47 | 10 | 0.00 | 34.19 | 3 | 11.29 | 6 | 12.11 | 7 | Shrub | ||
| Chamaecrista cathartica | 0.00 | 8.59 | 7 | 0.00 | 0.00 | 2.43 | 20 | Shrub | ||||
| Dalbergia miscolobium | 18.84 | 7 | 0.30 | 32 | 24.49 | 4 | 0.00 | 16.94 | 5 | Tree | yes | |
| Machaerium | 0.00 | 0.00 | 0.00 | 0.97 | 20 | 2.68 | 19 | Shrub/Tree | ||||
| Senna occidentalis | 0.00 | 0.00 | 0.60 | 15 | 19.72 | 5 | 0.15 | 51 | ||||
| Senna rugosa (Don) | 0.00 | 0.47 | 30 | 0.00 | 0.00 | 0.14 | 52 | Tree | ||||
| Stryphnodendron adstringens | 0.00 | 2.68 | 13 | 0.00 | 0.00 | 0.59 | 31 | Tree | yes | |||
| Lamiaceae | ||||||||||||
| Hyptis virgata | 18.84 | 7 | 0.30 | 32 | 24.49 | 0.00 | 0.09 | 57 | ||||
| Hyptis lanceolata | 11.36 | 8 | 0.26 | 33 | 5.44 | 9 | 1.46 | 15 | 3.61 | 17 | Shrub | |
| Vitex moronensis | 1.17 | 14 | 0.00 | 10.83 | 5 | 28.20 | 3 | 11.18 | 8 | Tree | ||
| Lauraceae | ||||||||||||
| Senna occidentalis | 4.47 | 10 | 0.00 | 34.19 | 3 | 11.29 | 6 | 0.26 | 41 | |||
| Persea indica | 0.00 | 0.00 | 0.00 | 41.50 | 1 | 17.22 | 4 | Tree | ||||
| Malpighiaceae | ||||||||||||
| Byrsonima crassifolia | 0.00 | 0.00 | 5.55 | 8 | 0.00 | 1.23 | 26 | Tree | ||||
| Byrsonima intermedia | 1.48 | 13 | 0.00 | 0.00 | 0.00 | 0.22 | 46 | |||||
| Byrsonima verbascifolia | 1.48 | 13 | 0.00 | 0.00 | 0.00 | 0.22 | 47 | Tree | no | |||
| Bysonima dealbata | 0.00 | 1.86 | 15 | 0.00 | 0.00 | 0.52 | 32 | Shrub | ||||
| Malpighiaceae tetrapteres | 0.92 | 15 | 0.00 | 0.00 | 0.00 | 0.14 | 53 | Shrub | ||||
| Peixotoa reticulata | 0.00 | 5.73 | 10 | 0.00 | 0.00 | 1.38 | 25 | |||||
| Tetrapterys microphylla | 0.00 | 0.57 | 28 | 0.00 | 0.00 | 0.17 | 49 | Shrub | ||||
| Melastomataceae | ||||||||||||
| Miconia albicans | 0.00 | 0.25 | 34 | 0.00 | 0.00 | 0.08 | 59 | |||||
| Miconia cabucu | 0.00 | 1.45 | 19 | 1.59 | 12 | 0.00 | 0.73 | 29 | Tree | |||
| Miconia elegans | 0.65 | 16 | 0.00 | 0.00 | 0.00 | 0.09 | 55 | Tree | ||||
| Moraceae | ||||||||||||
| Brosimum gaudichaudii | 0.00 | 0.00 | 0.00 | 1.17 | 17 | 0.46 | 35 | Tree | yes | |||
| Myrtaceae | ||||||||||||
| Myrcia eriocalyx | 0.00 | 1.67 | 16 | 0.00 | 0.00 | 0.51 | 33 | Tree | ||||
| Myrcia hartwegiana | 0.00 | 1.30 | 20 | 0.00 | 0.00 | 0.41 | 38 | Shrub | ||||
| Campomanesia xanthocarpa | 0.00 | 0.00 | 0.00 | 1.85 | 14 | 0.50 | 34 | Shrub | ||||
| Myrtaceae sp. 12 | 26.78 | 4 | 0.92 | 23 | 0.57 | 16 | 0.00 | 3.76 | 16 | |||
| Primulaceae | ||||||||||||
| Myrsine guianensis | 30.08 | 3 | 55.42 | 1 | 0.00 | 0.00 | 19.45 | 1 | Tree | yes | ||
| Proteaceae | ||||||||||||
| Roupala montana | 25.35 | 5 | 7.27 | 8 | 0.00 | 2.59 | 13 | 6.02 | 11 | Tree | yes | |
| Rubiaceae | ||||||||||||
| Cordieira microphylla | 0.00 | 2.53 | 14 | 0.00 | 0.00 | 0.75 | 28 | Shrub | ||||
| Genipa americana | 0.00 | 0.00 | 0.00 | 0.93 | 21 | 0.35 | 39 | Tree | ||||
| Palicourea rigida | 0.00 | 0.58 | 27 | 0.00 | 0.00 | 0.17 | 50 | Shrub | no | |||
| Rudgea viburnoides | 0.52 | 19 | 0.50 | 29 | 0.00 | 0.00 | 0.23 | 45 | Tree | |||
| Tocoyena formosa | 0.00 | 1.51 | 17 | 0.00 | 0.00 | 0.42 | 36 | Tree | yes | |||
| Sapindaceae | ||||||||||||
| Matayba marginata | 0.00 | 1.13 | 21 | 0.00 | 0.00 | 0.33 | 40 | Shrub | ||||
| Solanaceae | ||||||||||||
| Solanum lycocarpum | 0.00 | 3.08 | 12 | 0.00 | 0.00 | 0.69 | 30 | Shrub | yes | |||
| Verbenaceae | ||||||||||||
| Lippia L. | 0.00 | 0.77 | 24 | 0.00 | 0.00 | 0.23 | 44 | Shrub | ||||
| Vochysiaceae | ||||||||||||
| Qualea parviflora | 0.00 | 0.00 | 0.00 | 41.50 | 1 | 0.08 | 60 | |||||
| Qualea grandiflora | 0.00 | 0.00 | 5.09 | 10 | 0.00 | 1.13 | 27 | Tree | yes | |||
| Salvertia convallariodora | 0.00 | 0.00 | 0.60 | 15 | 19.72 | 5 | 17.65 | 3 | Tree | yes | ||
The distribution of diameters (Figure 4) revealed areas 1 and 2 to have similar behavior as evidenced by the proximity of the descriptive measures shown in Table 3, except for the case of the maximum, which was slightly higher in Area 2. Area 4 stands out for a greater recurrence of high values with the maximum diameter (21.13) and a dispersion with greater data dispersion. Area 3 had higher DBH values than areas 1 and 2. In general, DBH showed tendency to increase in the areas of campo sujo from Area 1 to Area 4.
The four study areas differed from each other in the distribution of species. Area 2 is at the left end of the graph with well-distributed plots along axis 2, explaining 31% of the data, while Area 4 had higher values in relation to axis 1, explaining 76%. Study areas 1 and 3, on the other hand, presented intermediate values in relation to axis 1 with Area 3, in particular, standing out for presenting well-grouped and poorly distributed plots (Figure 5).
Thus, we define areas 2 and 4 as being the most distinct (green and blue, respectively, in Figure 5. These areas are at separate ends of the graph, with areas 1 and 3 representing a transition between them, with Area 1, however, being is closer to Area 2 and Area 3 being closer to Area 4 (Figure 5).
3.2. Landscape analysis
According to the analyzed landscape metrics, areas 2, 3 and 4 experienced a change in the number of fragments, with Area 2 having the greatest change with a significant increase (Table 4). Areas 2 and 3 showed an increase in post-fire density while areas 1 and 4 showed a reduction in density in the post-fire period (Table 4). Area 2 showed greater variation in metrics with border effect (Table 4). There was no variation in richness in the study areas and connectivity varied only in Area 2 pre-fire and Area 4 post-fire (Table 4).
4. Discussion
Differences in fire interval among the study areas of campo sujo resulted in variation in the post-fire number of species among the areas. This variation may be related to vegetation types with different potential for post-fire recovery [1]. Area 2 had the greatest diversity, probably due to its greater heterogeneity of species [17] compared to the other areas. Areas 1 and 2 had a high number of individuals in just a short time after fire. This finding can be explained by the release of space after fire in these areas and the amount of nutrients available in the soil from the burning of organic matter, which would have benefited pioneer species in the colonization of the environment [2]. Recruitment due to the opening of clearings favors the entry of light, which favors the germination of pioneer species and can facilitate the entry of new individuals from other classes [26].
The high recruitment for areas 1 and 2 is also related to changes in the pre- and post-fire landscape. Area 2, which showed greater diversity, also showed greater fragmentation and greater edge effect in the post-fire area. A reduction of core area and an increase in edge promotes the edge effect which, consequently, favors the entry of new individuals at the edge, thus ensuring greater heterogeneity and variation in the distribution of species which, consequently, favors the entry of new individuals at the edge, thus ensuring greater heterogeneity and variation in the distribution of species [25].
Areas 3 and 4, both with more than six years since fire, showed little variation in the number of individuals. The species that stood out, with the exception of Bauhinia holophylla in Area 3, are large tree species. Certainly the greater absence of fire in these areas could have favored the prevalence of individuals of these species with tree structure, since the frequent use of fire favors the predominance of herbaceous species [24]. Structurally, the landscape of Area 4 stands out because it experienced a reduction in fragmentation and an increase in connectivity, indicating that the absence of fire may have favored the restoration of the landscape in the long-term.
Species richness was maintained over the years with fires so that some species remained in areas and others were excluded and/or inserted. This entry and exit of species is common in areas of Cerrado sensu stricto with changes in post-fire events [23]. Thus, it can be inferred that fires may have favored resistant species and eliminated the most sensitive ones, causing low dominance of some species and greater equitability. This explains the diversity of similar species in areas 1 and 2 and different species in areas 3 and 4, while at the same time maintaining the diversity of each area. Related to species richness, the density metric increased post-fire in areas 2 and 3 and decreased in areas 1 and 2. This variation corroborates the inclusion and exclusion of species in the study areas.
Fire interval is an important factor for savannic areas because it determines processes such as sowing, germination, fruiting and flowering [18]. Thus, it is concluded here that the vegetation in Area 1 is still in the process of regeneration and Area 2 is stabilized, suggesting a community formed by species of rapid regeneration and therefore resistant to fire. The species Myrsine guianensis, for example, is among the most abundant species of areas 1 and 2 and although considered as sensitive to fire [13], it is also quite resilient, being found in abundance in post-fire areas [23].
Changes in the frequency of fire can cause variation in vegetation composition and structure in savannic areas [1]. This variation was found mainly among species in Area 4, where the most abundant species were found only in these areas. This suggests that the species present in Area 4 are less resistant to fire and prevail in areas with less frequent fire. In addition, how these species respond to fire is unknown, whereas among the most abundant species in areas 1, 2 and 3, there are shrubs with the ability to regrow, which favors post-fire regeneration [27]. The species Dalbergia miscolobium, one of the most abundant species in Area 3, stands out for its high capacity for nodulation by Rhizobium, which promotes its presence in soils with low fertility, in addition to having a high capacity for post-fire regrowth and accumulation of nutritional reserves for survival [6].
There were also changes in the structure of the tree community during the different post-fire time intervals, with Area 4 having the highest DBH. The protection of this area from burning for 10 years certainly favored this increase, indicating that these species are less resistant to fire and, therefore, develop better in its absence.
An important factor about the difference, and increase, in DBH from Area 1 to Area 4 may be related to the intensity of fire. Although most of the species in Area 4 are arboreal, which alone is capable of explaining the difference in DBH, the species also have their trunks burned at a moderate height, and not reaching the entire structure of individuals of the species. Fire effects, such as burning height, can be indicators of fire severity and intensity in savannic areas [27]. Thus, the fact that fire did not reach high heights of the tree species may be due to low fire severity, which may have favored the survival of these species.
Differences in DBH can also be explained by differences in fire frequency. Frequent fires are capable of reducing wood cover yet frequent fires are not favored in areas with species of this structure since the accumulation of fuel is slower in drier savannas [27,28]. Thus, Area 4 may have had low fuel accumulation and, therefore, is an area that is less prone to fire compared to areas 1 and 2.
The low DBH value for areas 1 and 2 suggests that these areas may be prone to fire since regeneration, as discussed earlier, may have been rapid as indicated by the great diversity in these areas in the short post-fire period. Thus, it can be inferred that these areas have an accumulation of biomass due to the structure of the herbaceous-shrub vegetation.
5. Conclusion
The present work showed that the structure and floristics of savannic species changed in response to different fire intervals. With regard to regeneration, areas 1 and 2 were more favorable to rapid regeneration while areas 3 and 4 had species that were less resistant to fire.
It was noted that the landscape of the study areas strongly influenced species distribution and composition and that the absence of fire favored the restructuring of fragmented Area 4.
Fire management is expected to become more intense in areas 1 and 2, where fires are more frequent. However, since species in areas 3 and 4 may be less adapted and resistant to fire, greater conservation of these species in areas of frequent fires is expected.
Acknowledgments
This study was financed in part by the Coordenação de Aperfeiçoamento de Pessoal de Nível Superio—Brasil (CAPES)—Finance Code 001.
References
- Alvarado, S.T.; Fornazaria, T.; Cóstolaa, A.; Morellat, L.P.C.; Silva, T.S.F. Drivers of fire occurrence in a mountainous Brazilian cerrado savanna: Tracking long-term fire regimes using remote sensing. Ecological Indicators 2017, 78, 270–281. [Google Scholar] [CrossRef]
- Alvino-rayol, F.O.; Rayol, B.P. Efeito do fogo na vegetação espontânea em sistema agroflorestal, Pará, Brasil. Revista de Ciências Agroveterinárias 2020, 19, 1–7. [Google Scholar] [CrossRef]
- Braak, C.J.F. The analysis of vegetation environment relationships by canonical correspondence analysis. Vegetation 1987, 69, 69–77. [Google Scholar] [CrossRef]
- Braun-Blanquet, J. Fitosociologia: bases para el estudio de las comunidades vegetales, 3rd ed.; Aum. Blume: Madrid, Spain, 1979. [Google Scholar]
- Brower, J.E.; Zar, J.H.; Von Ende, C. Field & laboratory methods for general ecology; W.C. Brown Publishers: Boston, MA, USA, 1984. [Google Scholar]
- Costa, J.P.; Santos, L.C.S.; Rios, J.M.; Rodrigues, A.W.; Neto, O.C.D.; Prado-junior, J.; Vale, V.S. Estrutura e diversidade de trechos de Cerrado sensu stricto às margens de rodovias no estado de Minas Gerais. Ciência Florestal 2019, 29, 698–714. [Google Scholar] [CrossRef]
- Durigan, G.; Ratter, J.A. The need for a consistent fire policy for Cerrado conservation. Journal of Applied Ecology 2016, 53, 11–15. [Google Scholar] [CrossRef]
- Garcia, A.S.; Sawakuchi, H.O.; Ferreira, M.E.; Ballester, M.V.R. Landscape changes in a neotropical forest savanna ecotone zone in central Brazil: The role of protected areas in the maintenance of native vegetation. Journal of Environmental Management 2017, 187, 16–23. [Google Scholar] [CrossRef]
- Grady, J.M.; Hoffman, W.A. Caught in a fire trap: Recurring fire creates stable size equilibria in woody resprouters. Ecology 2012, 93, 2052–2060. [Google Scholar] [CrossRef]
- Goodall, D.W. Some considerations in the use of point quadrats for the analysis of vegetation. Australian Journal of scientific Research B. (In the Press), 1952.
- Hoffmann, W.A. Direct and indirect effects of fire on radial growth of cerrado savanna trees. Journal of Tropical Ecology 2002, 18, 137–142. [Google Scholar] [CrossRef]
- Libano, A.M.; Felfili, J.M. Mudanças temporais na composição florística e na diversidade de um cerrado sensu stricto do Brasil Central em um período de 18 anos (1985-2003). Acta Botanica Brasilica 2006, 20, 927–936. [Google Scholar] [CrossRef]
- Lopes, S.F.; Vale, V.S.; Schiavini, I. Efeito de queimadas sobre a estrutura e composição da comunidade vegetal lenhosa do cerrado sentido restrito em Caldas Novas, GO. Árvore 2009, 33, 695–704. [Google Scholar] [CrossRef]
- Matteucci, S.D.; Colma, A. Metodologia para el estudio de la vegetación. Washington: The General Secretarial of The Organization of American States. (Série Biologia – Monografia, n. 22), 1982.
- Messias, C.G.; Ferreira, M.C. Análise da distribuição espacial das queimadas no parque nacional da serra da canastra (mg), entre 1984 e 2017. Caminhos de Geografia 2019, 20, 52–71. [Google Scholar] [CrossRef]
- Moreira, A.G. Effects of fire protection on savanna structure in Central Brazil. Journal of Biogeography 2000, 27, 1021–1029. [Google Scholar] [CrossRef]
- Morel, J.D.; Pereira, J.A.A.; Santos, R.M.; Machado, E.L.M.; Marques, J.J. Diferenciação da vegetação arbórea de três setores de um remanescente florestal relacionada ao seu histórico de perturbações. Ciência Florestal 2016, 26, 81–93. [Google Scholar] [CrossRef]
- Morel, J.D.; Pereira, J.A.A.; Santos, R.M.; Aguiar-Campos, N.; Machado, E.L.M. Functional characterisation of an anthropised atlantic forest fragment. Journal of Tropical Forest Science 2018, 30, 537–545. [Google Scholar] [CrossRef]
- Muller, S.C.; Overbeck, G.E. Plant functional types of woody species related to fire disturbance in forest–grassland ecotones. Plant Ecology 2007, 189, 1–14. [Google Scholar] [CrossRef]
- Palmer, M.W. Estimating species richness: the second-order jackknife estimator reconsidered. Ecology 1991, 72, 1512–1513. [Google Scholar] [CrossRef]
- Ribeiro, J.F.; Walter, B.M.T. As principais fitofisionomias do Bioma Cerrado. In.: Sano, S.M.; Almeida, S.P.; Ribeiro, J.F. (Eds.), Ecologia e flora. Brasília: Embrapa, 2008, pp. 152–212.
- Rios, M.N.S.; Souza-Silva, J.C. Grupos funcionais em áreas com histórico de queimadas em Cerrado sentido restrito no Distrito Federal. Brazilian Journal of Forestry Research 2017, 37, 285–298. [Google Scholar] [CrossRef]
- Rios, M.N.S.; Souza-Silva, J.C.; Malaquias, J.V. Mudanças pós-fogo na florística e estrutura da vegetação arbóreo-arbustiva de um cerrado sentido restrito em planaltina – DF. Ciência Florestal 2018, 28, 469–482. [Google Scholar] [CrossRef]
- Salazar-Gáscon, R.E.; Ferreira, C.C.M. Influência do enos e amo entre 2003-2014 no clima e regimes de fogo na Gran Sabana, Parque Nacional Canaima, Guiana Venezuelana. Revista Brasileira de Climatologia 2018, 22, 55–75. [Google Scholar] [CrossRef]
- Salomão, N.V.; Machado, E.L.M.; Pereira, R.S.; Fernandes, G.W.; Gonzaga, A.P.D.; Mucida, D.P.; Silva, L.S. Structural analysis of a fragmented area in Minas Gerais State, Brazil. Annals of the Brazilian Academy of Sciences 2018, 90, 3353–3361. [Google Scholar] [CrossRef]
- Santos, F.B.; Camargo, P.B.; Junior, R.C.O. Estoque e dinâmica de biomassa arbórea em floresta ombrófila densa na Flona Tapajós: Amazônia oriental. Ciência Florestal 2018, 28, 1049–1059. [Google Scholar] [CrossRef]
- Schmidt, I.B.; Fonseca, C.B.; Ferreira, M.C.; Sato, M.N. Experiências Internacionais de Manejo Integrado do Fogo em Áreas Protegidas – Recomendações para Implementação de Manejo Integrado de Fogo no Cerrado. Biodiversidade Brasileira 2016, 6, 41–54. [Google Scholar]
- Smit. IP.J.; Asner, G.P.; Govender, N.; Kennedy-Bowdoin, T.; Jacobson, J.; Knapp, D. Effects of fire on woody vegetation structure in African savanna. Ecological Applications 2010, 20, 1865–1875. [Google Scholar] [CrossRef] [PubMed]
- Smit, I.PJ.; Asner, G.P.; Govender, N.; Vaughn, N.R.; Wilgen, B.W. An examination of the potential efficacy of highintensity fires for reversing woody encroachment in savannas. Journal of Applied Ecology 2016, 53, 1623–1633. [Google Scholar] [CrossRef]
Figure 1.
Vegetation map of the study area.
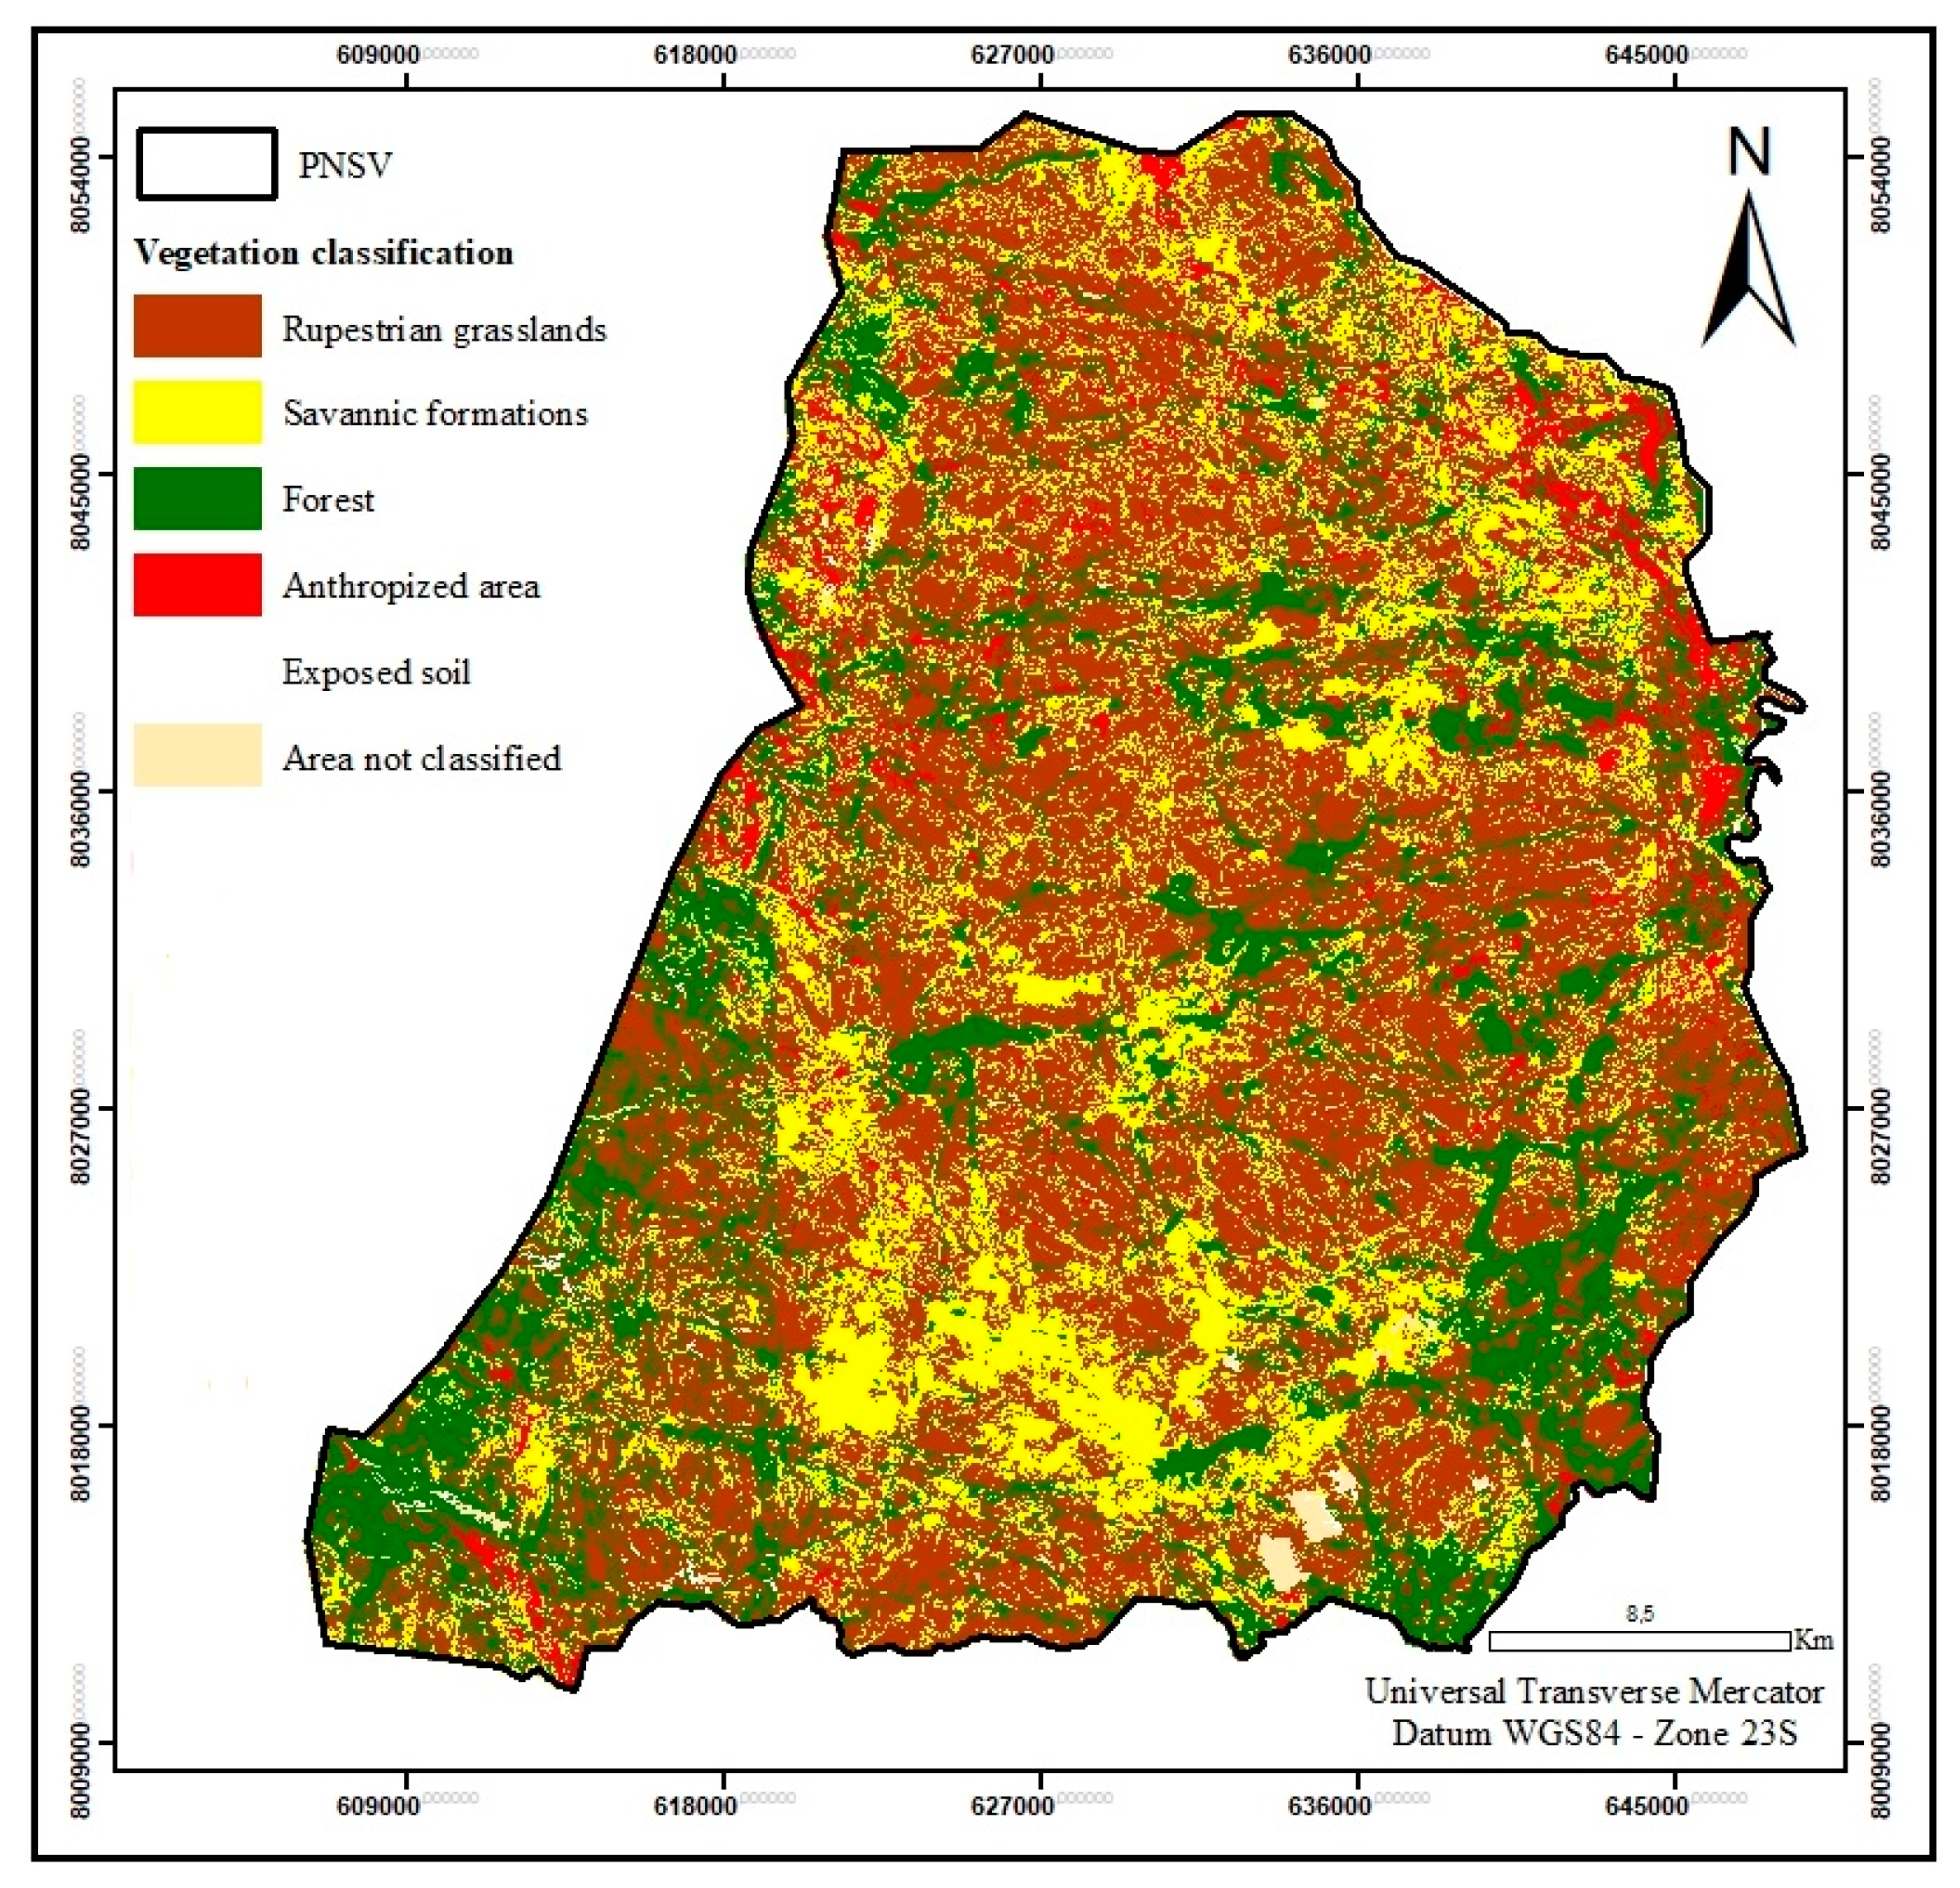
Figure 2.
Location of PNSV im Minas Gerais State and its savannic formations and burnings scars.
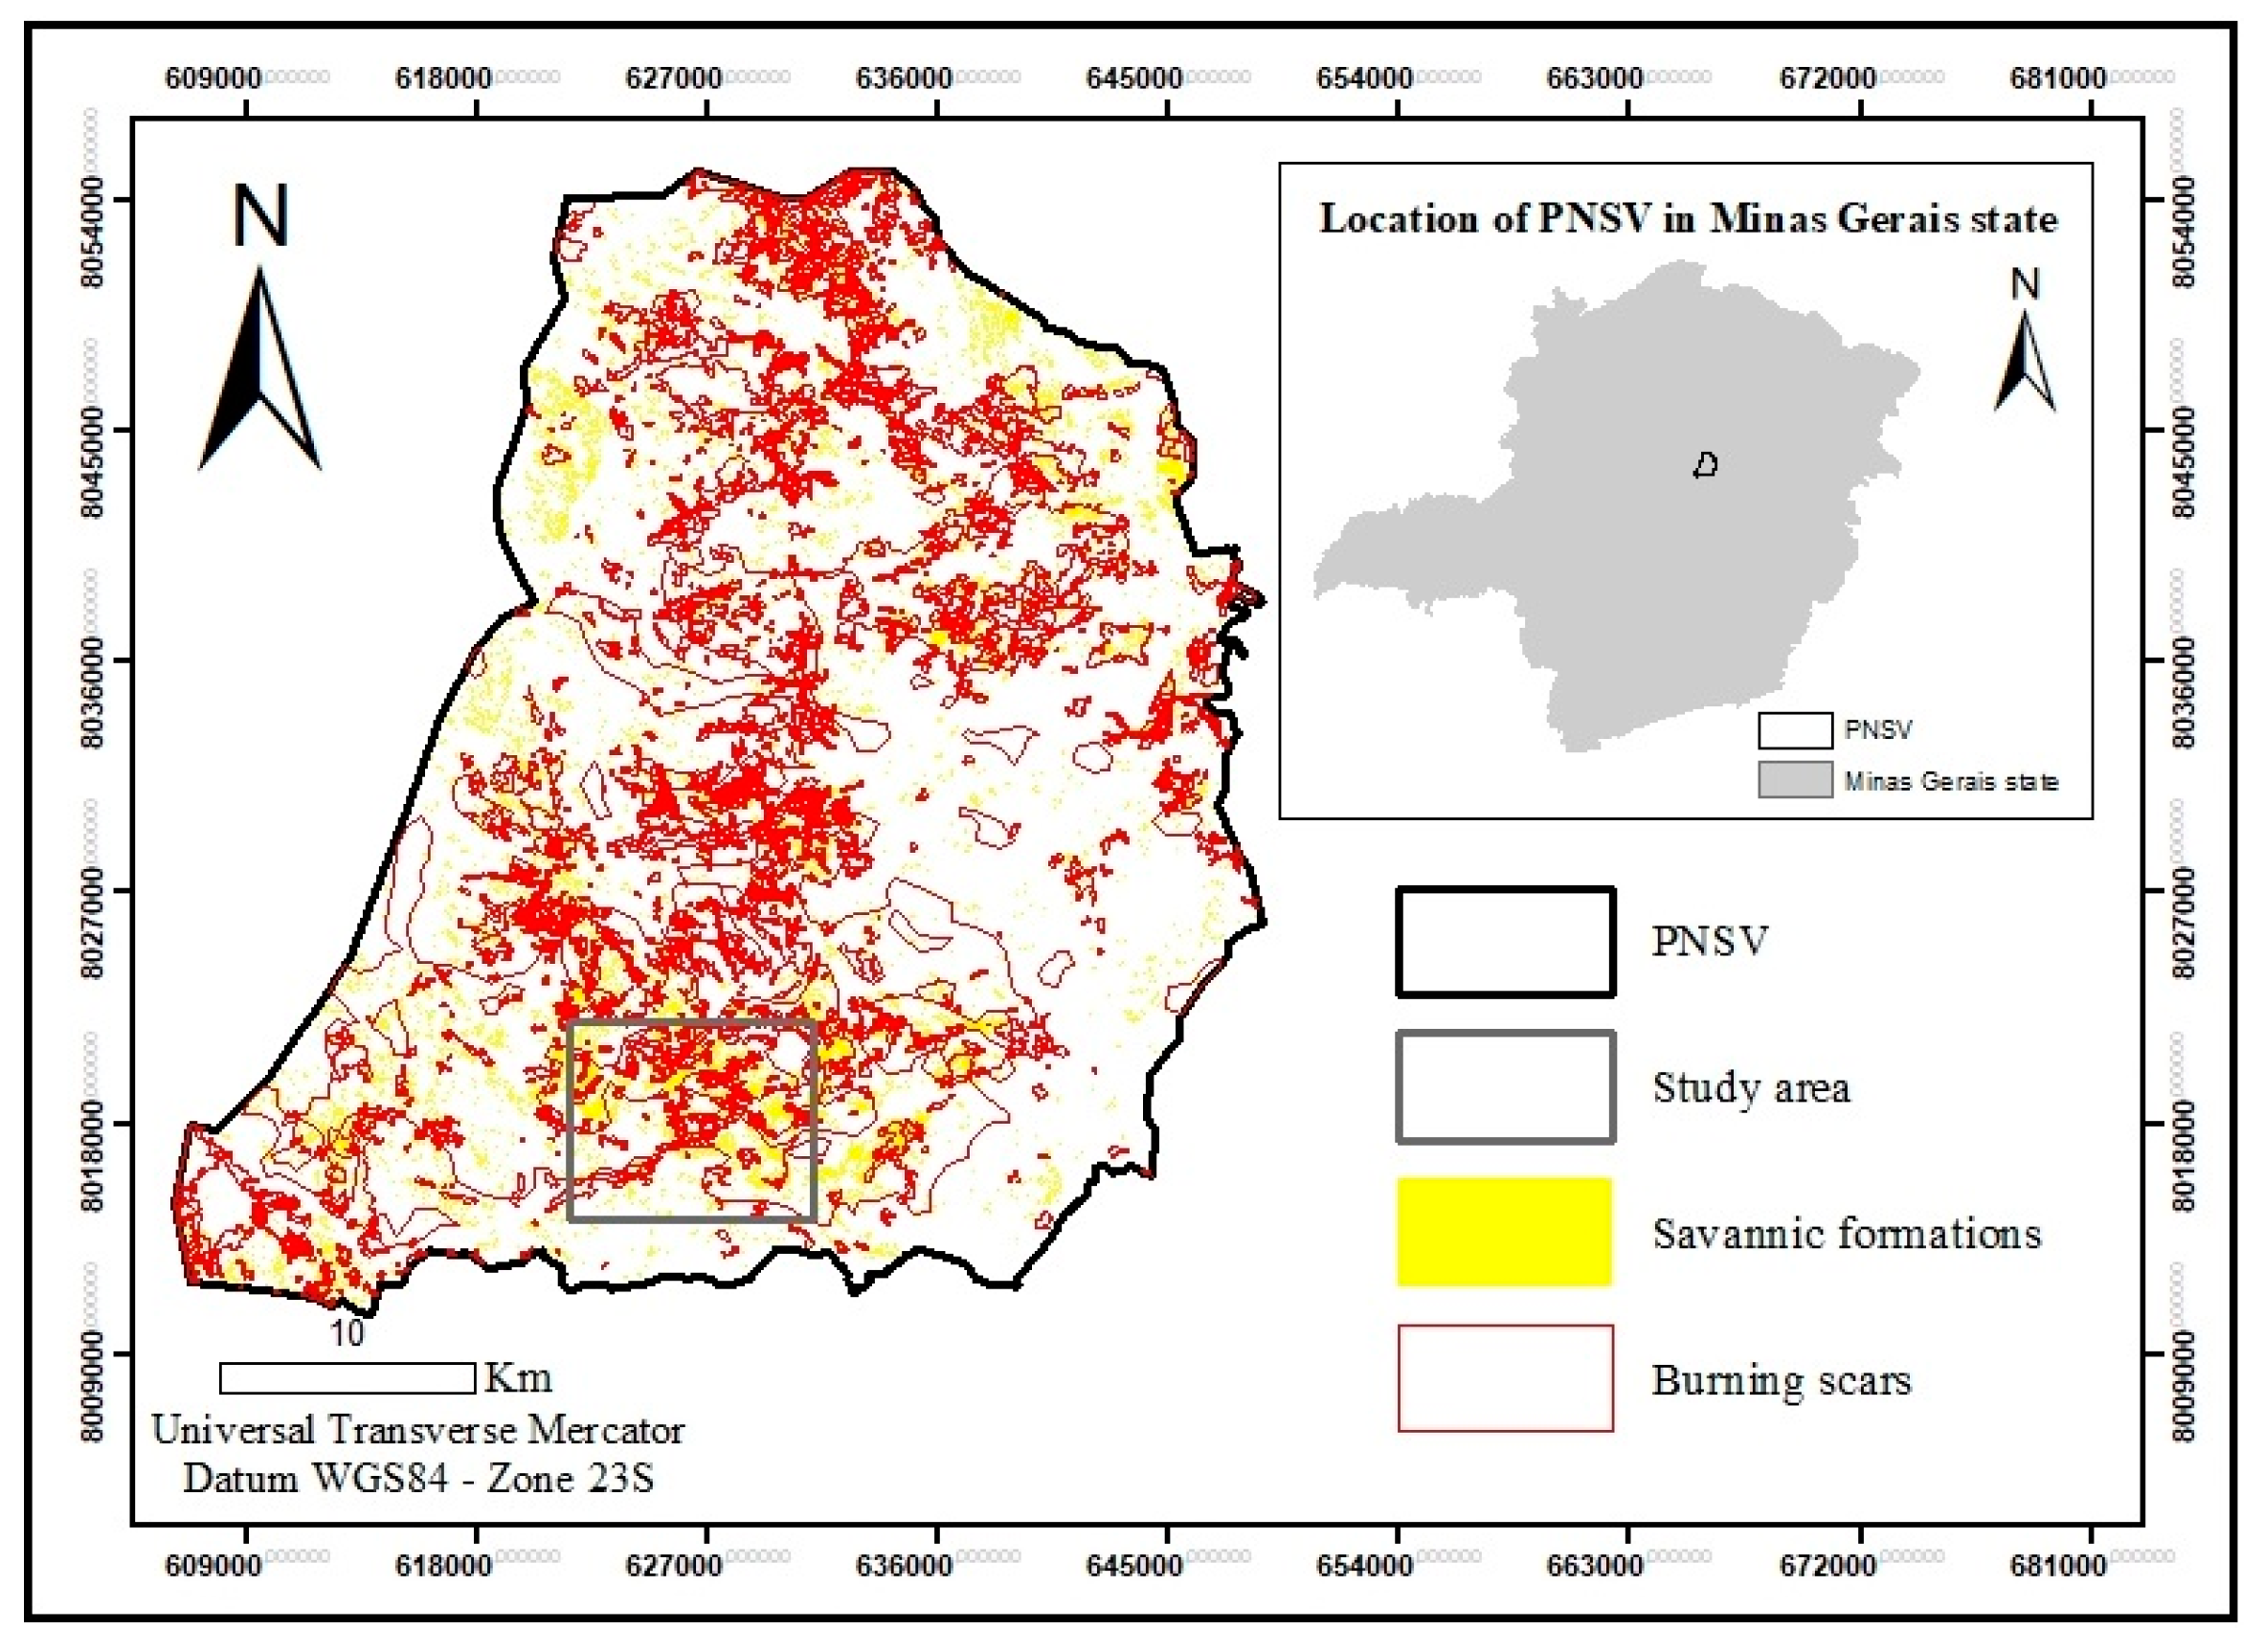
Figure 3.
Collection areas with different post-fire intervals: 3 months without fire (A); 27 months without fire (B); 75 months without fire (C); and 123 months without fire (D).
Figure 3.
Collection areas with different post-fire intervals: 3 months without fire (A); 27 months without fire (B); 75 months without fire (C); and 123 months without fire (D).
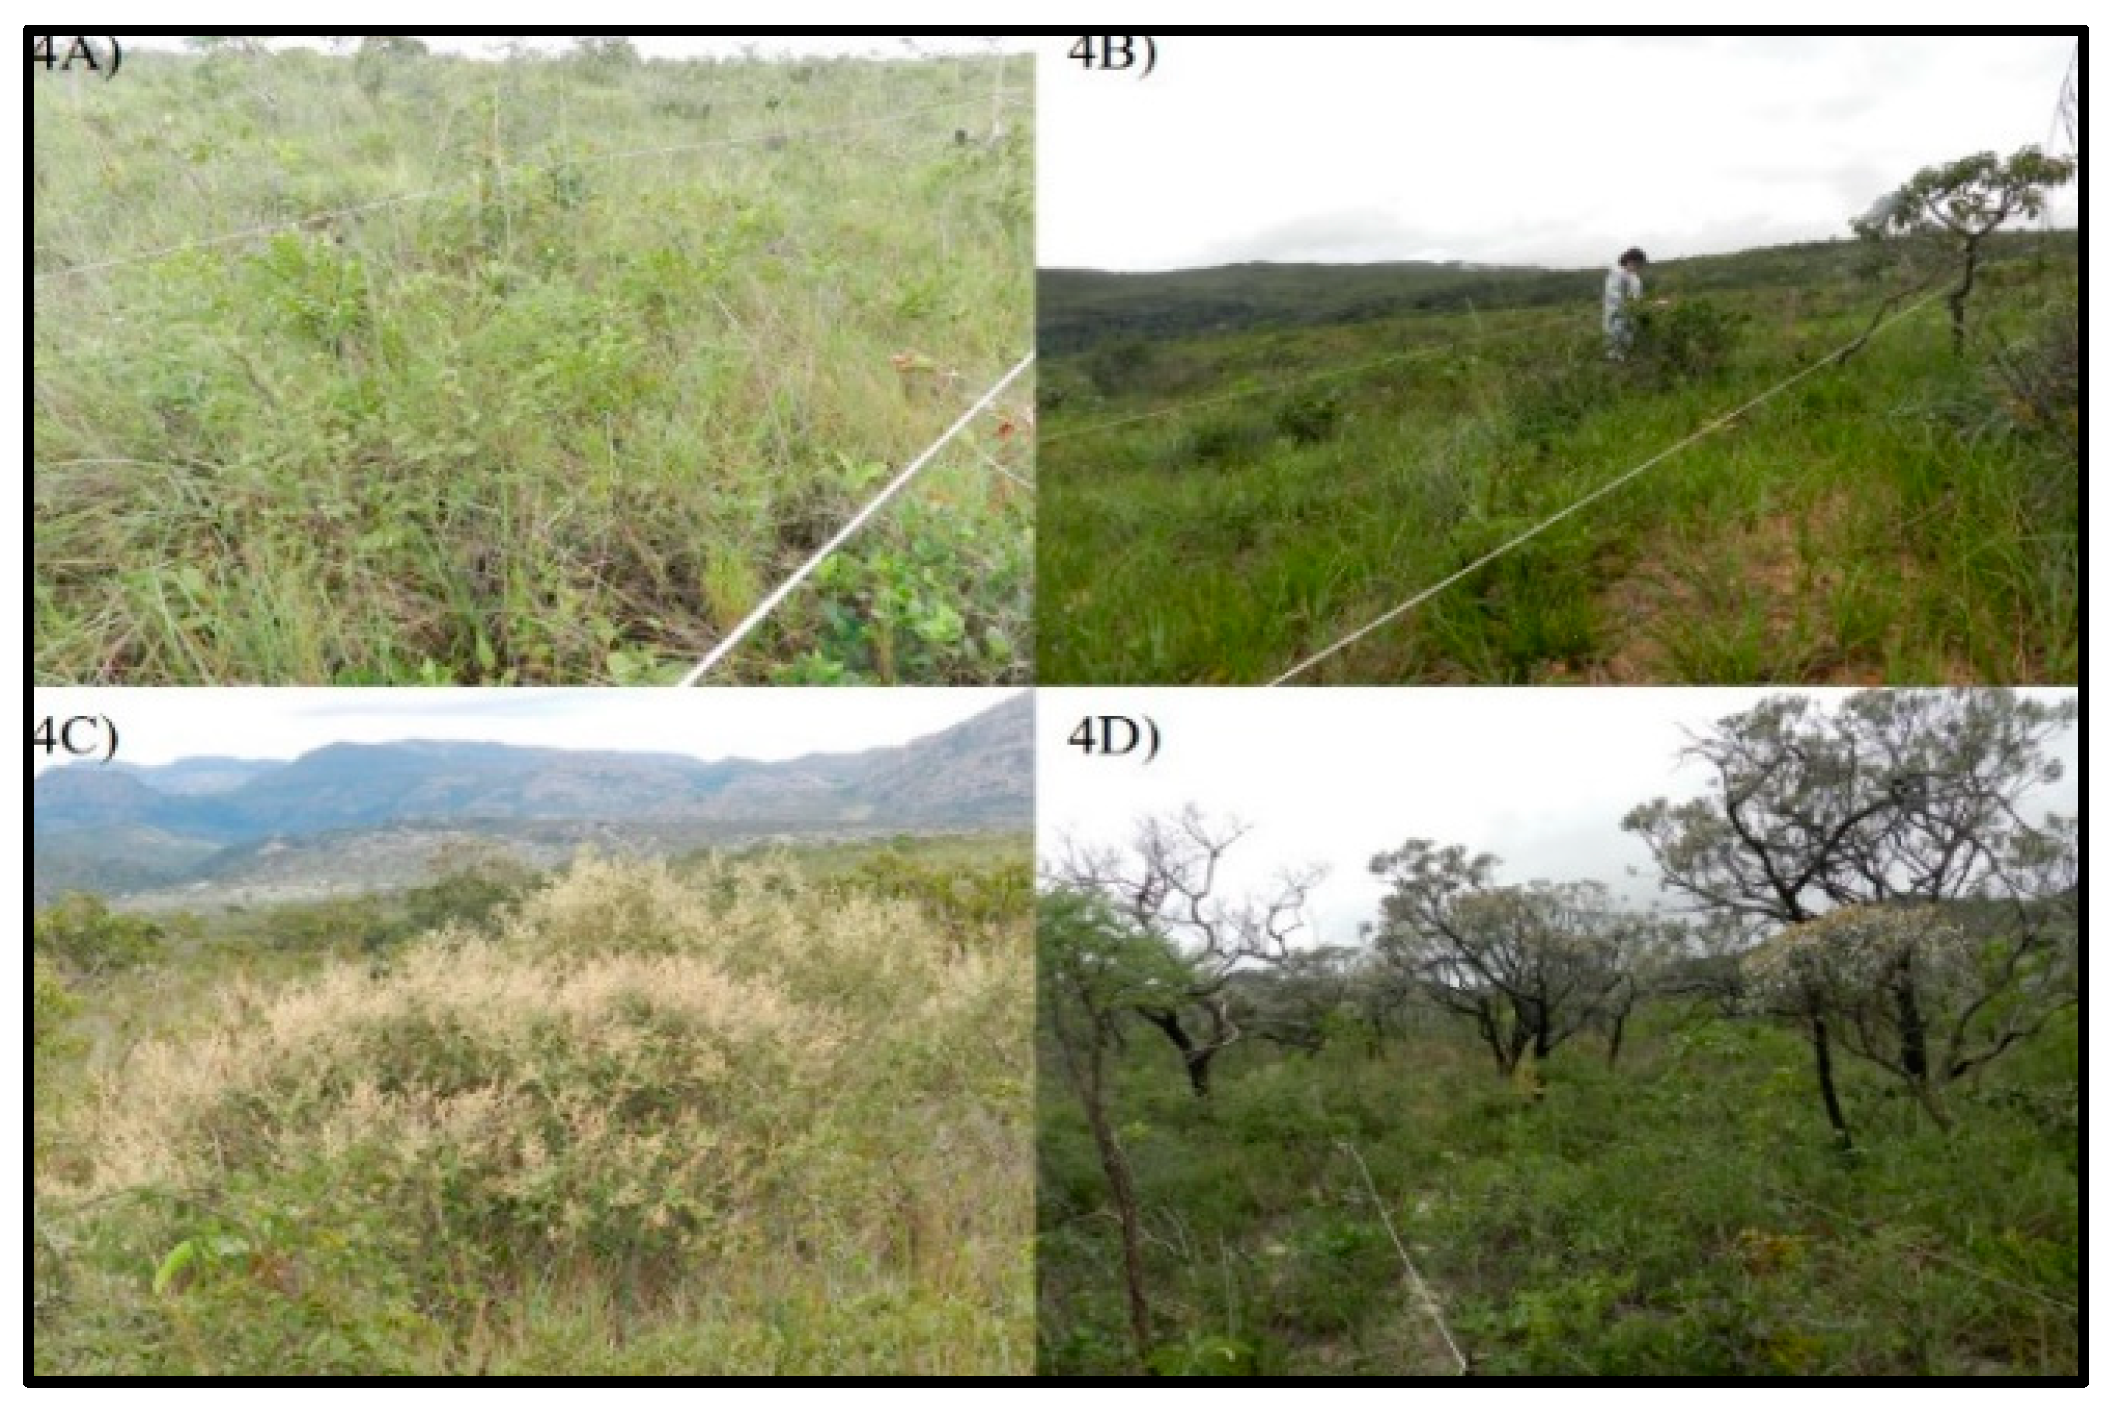
Figure 4.
Boxplots for the variable DBH for each study area.
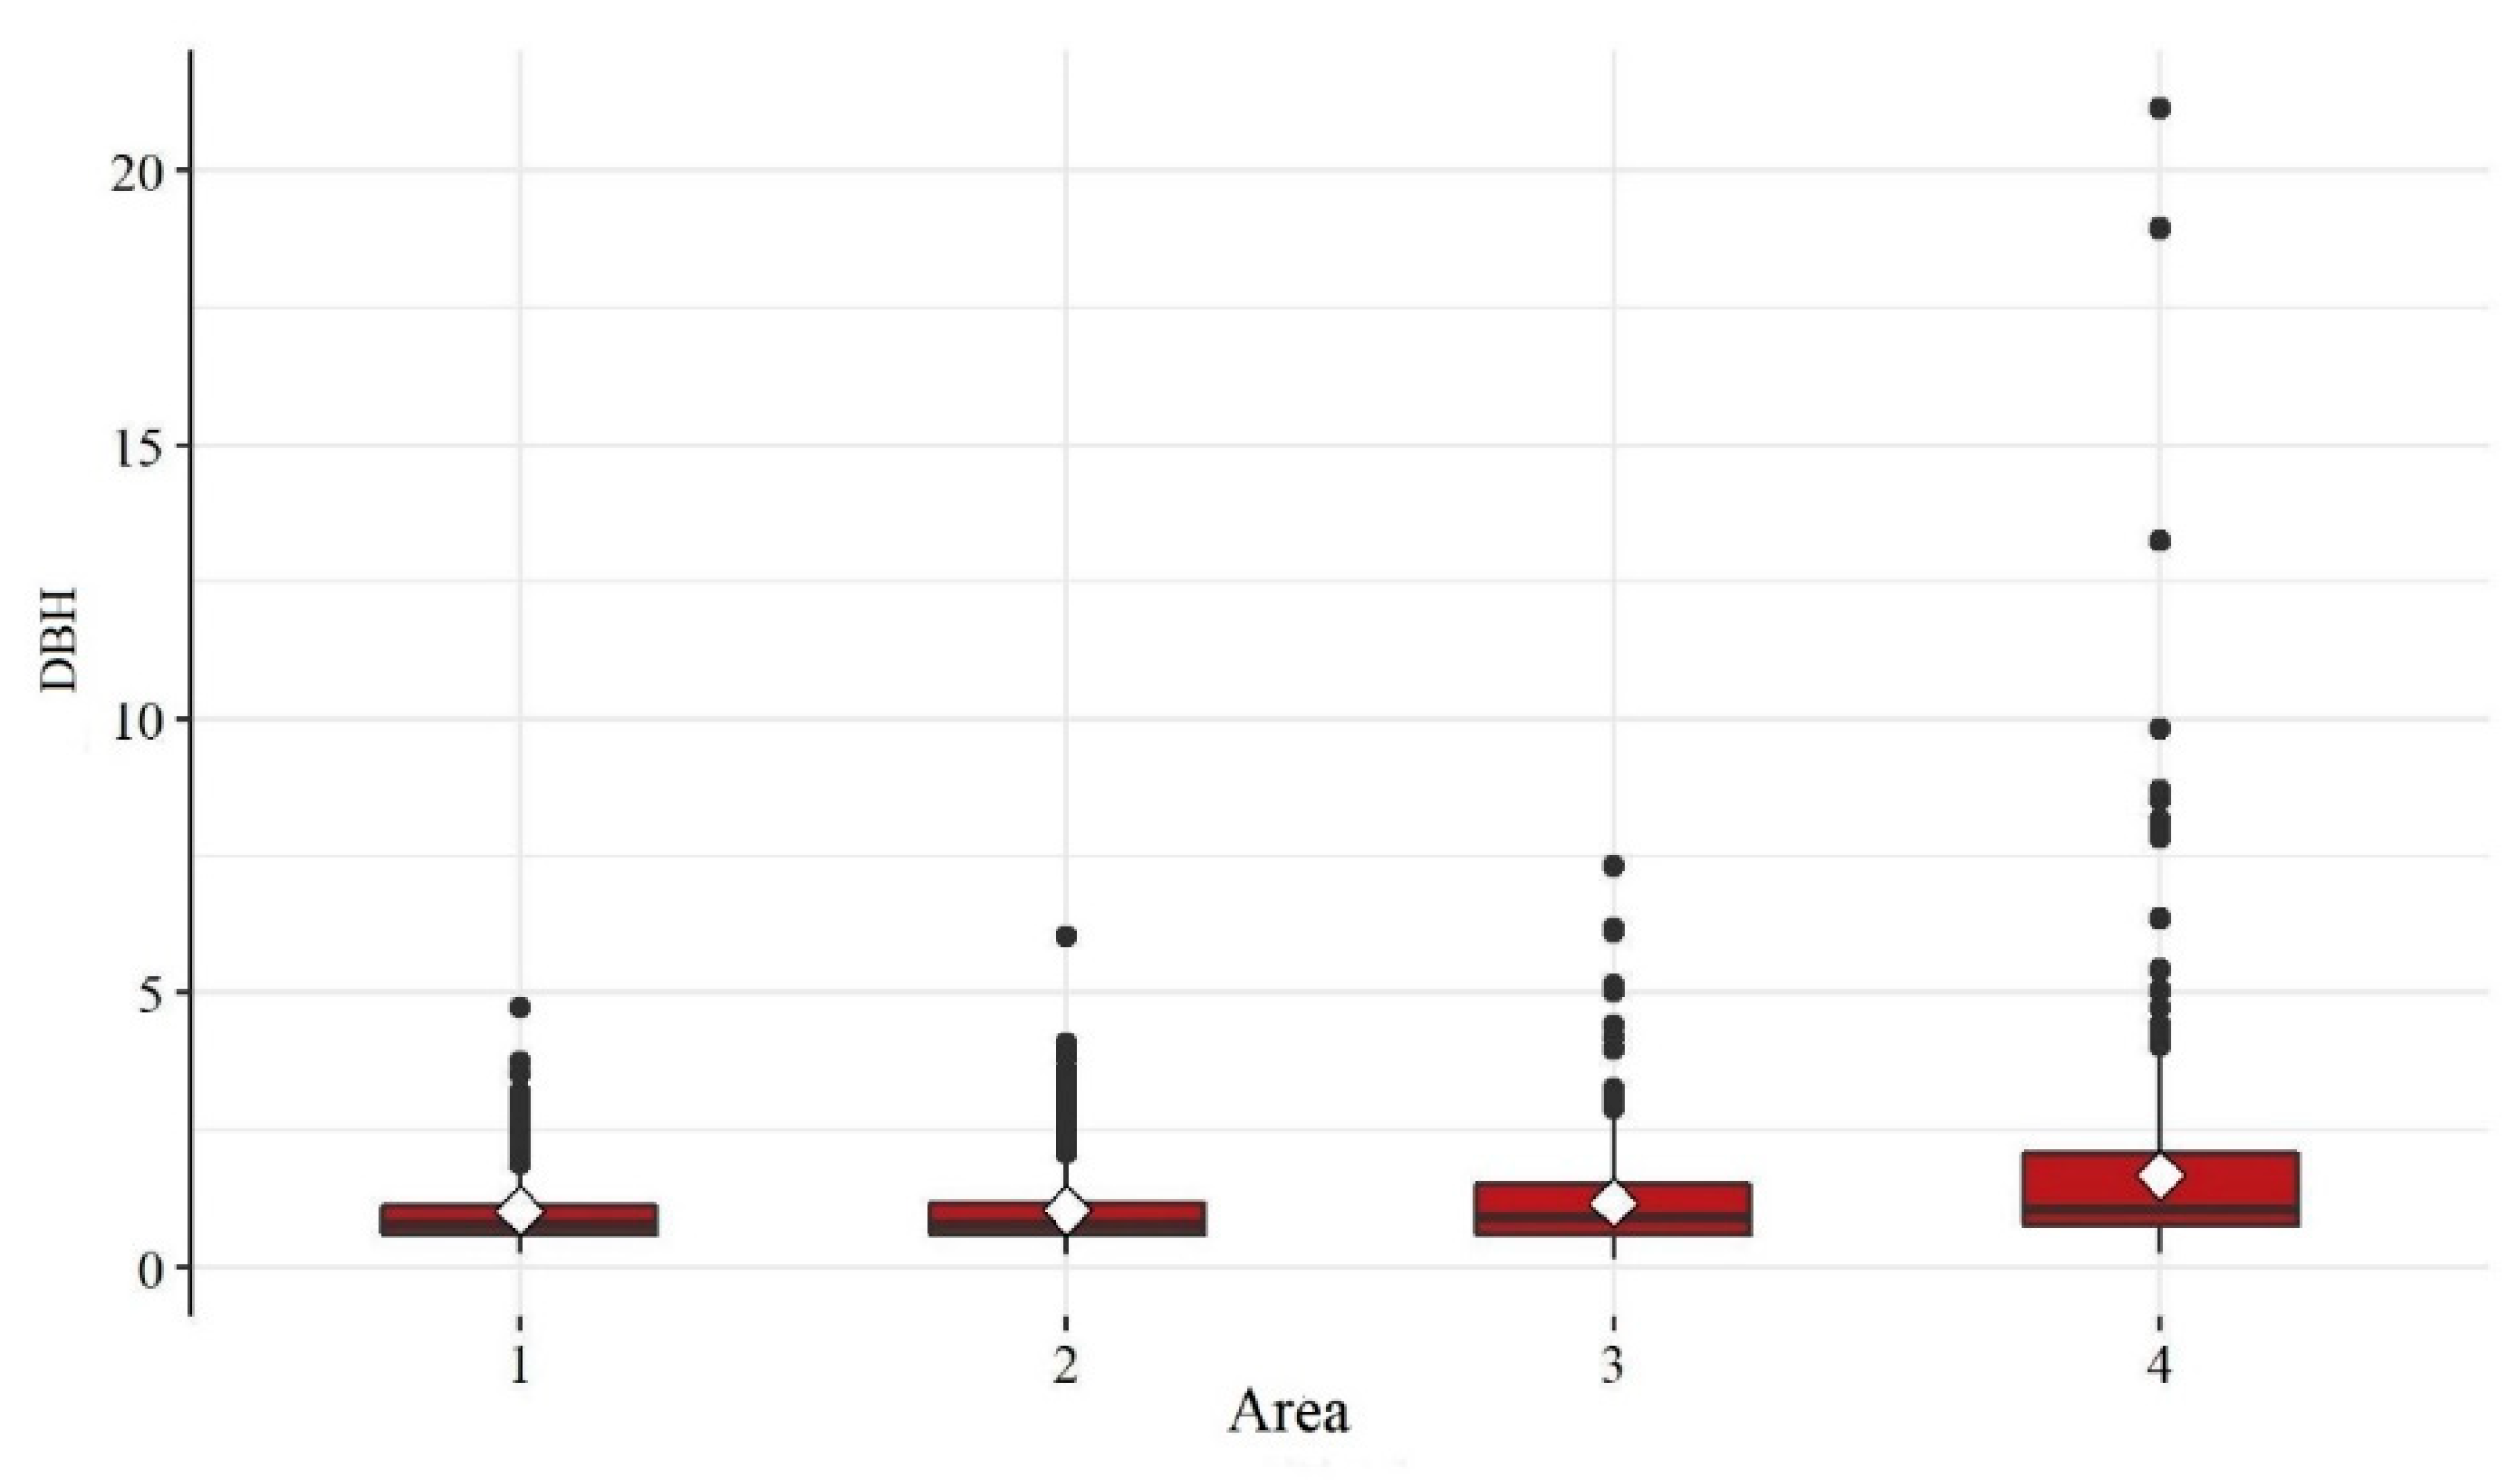
Figure 5.
CCA of the study areas.
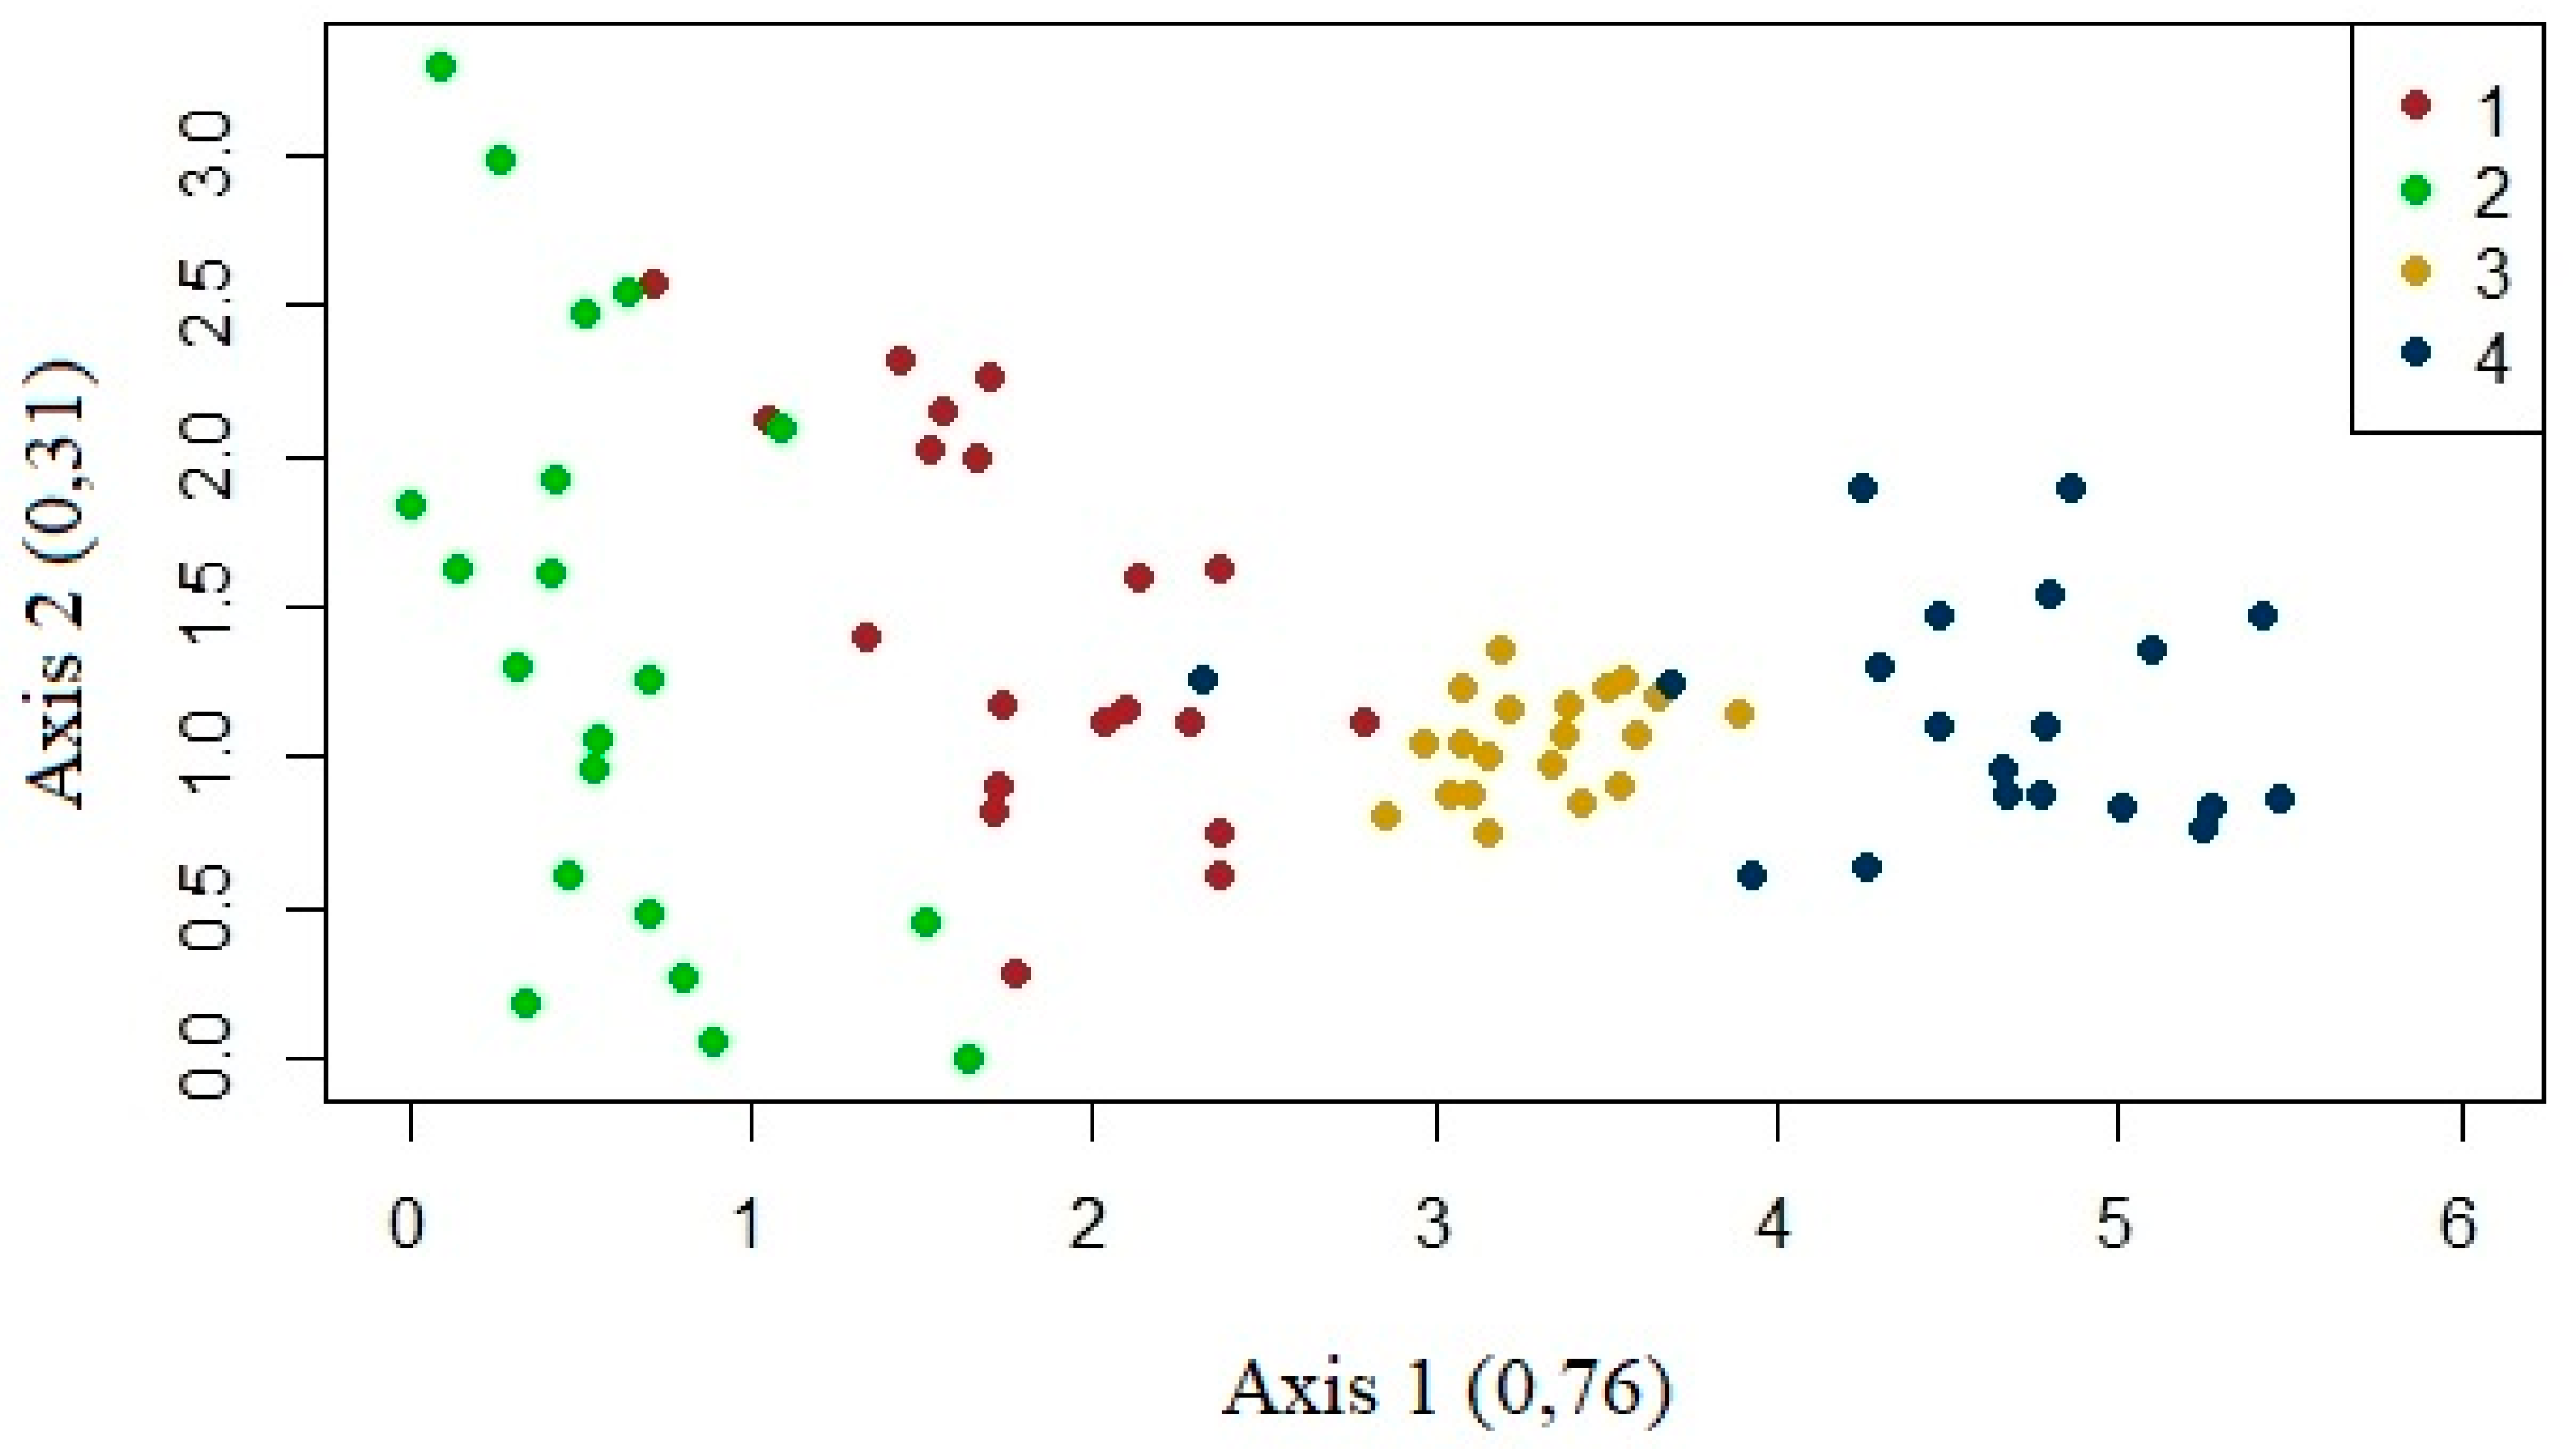
Table 1.
Mean number of individuals, families and species per study area and richness and diversity indexes for the four study areas.
Table 1.
Mean number of individuals, families and species per study area and richness and diversity indexes for the four study areas.
| Abundance | Diversity | |||||||
|---|---|---|---|---|---|---|---|---|
| Area | Mean | F | p | Index | Area | Value | ||
| Individuals | 1 | 12.90 | 14 | 10.28 | <0.001 | Shannon (H') | 1 | 2.33 |
| 2 | 28.60 | 23 | 2 | 2.46 | ||||
| 3 | 22.00 | 234 | 3 | 2.00 | ||||
| 4 | 19.65 | 134 | 4 | 2.43 | ||||
| Families | 1 | 4.25 | 1234 | 1.32 | 0.27 | Pielou (J') | 1 | 0.81 |
| 2 | 5.10 | 2 | 0.70 | |||||
| 3 | 4.45 | 3 | 0.74 | |||||
| 4 | 5.05 | 4 | 0.84 | |||||
| Species | 1 | 4.40 | 1234 | 2.37 | 0.08 | 1st order Jackknife estimator | 1 | 53.10 |
| 2 | 6.05 | 2 | 108.90 | |||||
| 3 | 5.30 | 3 | 57.95 | |||||
| 4 | 5.65 | 4 | 44.45 | |||||
| 2nd order jackknife estimator | 1 | 66.74 | ||||||
| 2 | 139.00 | |||||||
| 3 | 70.88 | |||||||
| 4 | 50.09 | |||||||
Table 3.
Summary measures of the variable DBH per study area.
| Statistic | Area 1 | Area 2 | Area 3 | Area 4 |
|---|---|---|---|---|
| Mean | 1.02 | 1.03 | 1.18 | 1.67 |
| Standard Deviation | 0.72 | 0.70 | 0.86 | 1.95 |
| Minimum | 0.25 | 0.22 | 0.15 | 0.25 |
| 1st Quartile | 0.60 | 0.60 | 0.60 | 0.76 |
| Median | 0.78 | 0.78 | 0.90 | 1.05 |
| 3rd Quartile | 1.11 | 1.17 | 1.50 | 2.06 |
| Maximum | 4.74 | 6.04 | 7.32 | 21.13 |
Table 4.
Distribution of landscape metrics pre- and post-fire in the study areas.
| Area | Tempo | TA (ha) | PD | TE | ED | TCA | PR | CONNECT |
|---|---|---|---|---|---|---|---|---|
| 1 | Pre-fire | 266 | 1.12 | 5.250 | 19.70 | 135 | 3.000 | 0 |
| 1 | Post-fire | 266 | 1.05 | 5.250 | 18.39 | 154 | 3.000 | 0 |
| 2 | Pre-fire | 447 | 1.34 | 10.560 | 23.61 | 239 | 3.000 | 16.66 |
| 2 | Post-fire | 447 | 2.17 | 17.010 | 36.98 | 189 | 3.000 | 0 |
| 3 | Pre-fire | 150 | 3.32 | 6.630 | 44.05 | 31 | 3.000 | 0 |
| 3 | Post-fire | 150 | 4.29 | 7.410 | 44.52 | 43 | 3.000 | 0 |
| 4 | Pre-fire | 369 | 2.16 | 6.900 | 18.68 | 206 | 3.000 | 0 |
| 4 | Post-fire | 269 | 1.51 | 7.470 | 22.69 | 1753 | 3.000 | 50.000 |
Disclaimer/Publisher’s Note: The statements, opinions and data contained in all publications are solely those of the individual author(s) and contributor(s) and not of MDPI and/or the editor(s). MDPI and/or the editor(s) disclaim responsibility for any injury to people or property resulting from any ideas, methods, instructions or products referred to in the content. |
© 2023 by the authors. Licensee MDPI, Basel, Switzerland. This article is an open access article distributed under the terms and conditions of the Creative Commons Attribution (CC BY) license (http://creativecommons.org/licenses/by/4.0/).
Copyright: This open access article is published under a Creative Commons CC BY 4.0 license, which permit the free download, distribution, and reuse, provided that the author and preprint are cited in any reuse.


