Submitted:
09 August 2023
Posted:
10 August 2023
You are already at the latest version
Abstract
This study aims to assess trends and significant changes in precipitation and river flow in the Senegal River basin and its upper basin over the period 1982-2021. Eight hydroclimate indicators, namely maximum river discharge (QMAX), standardized flow index, mean daily rainfall intensity index (SDII), maximum 5-day consecutive precipitation (RX5DAY), annual precipitation exceeding the 95th percentile (R95p), annual precipitation exceeding the 99th percentile (R99P), annual flows exceeding the 95th percentile (Q95p), and annual flows exceeding the 99th percentile (Q95p) were considered.. The modified Mann-Kendall test (MMK) was used to analyze trends in extremes while standard normal homogeneity and Pettit’s tests were employed to detect potential breakpoints in these trends. The results indicated an irregular precipitation pattern, with high values of extreme precipitation indices (R95p, R99p, SDII, and RX5DAY) in the southern part, while the northern part exhibits lower values. Inter-annual analysis revealed a significant increase in extreme precipitation events between 1982 and 2021, with a notable breakpoint around the years 2006 and 2007. This breakpoint marks a transition to a much wetter period starting from 2008. Regarding extreme flows, a significant increase was observed between 1982 and 2021. This study provides insights into past hydrological extremes in the study area and can serve as a basis for future research in this field.
Keywords:
trends
; extremes flow
; extremes rainfall
; Senegal river basin
; upper basin
1. Introduction
Human-induced climate change is an immense challenge for humanity, with the possibility of severe repercussions. Across the world, major disasters such as droughts, floods and frequent fires are caused by very extreme climate conditions. These extreme events have especially affected societies in developing nations. In West Africa, during the 2009 flooding episode , nearly 600,000 people were affected, while another 159 are reported to have lost their lives, mainly in Sierra Leone [1]. To understand the extreme events (drought and flood), many scientists have conducted intensive studies in Africa. In Tunisia, for example, [2] demonstrated that during 1981, Tunisia suffered a generalized drought. In Côte d’Ivoire, [3] shows both the northern and southern regions underwent a transition from a wet phase to dry conditions.
Furthermore, in Senegal, [4] showed high rainfall frequency with marked intensity in the south of the country compared to the middle and north parts. According to [5], during the period between 1918 and 2000, intra-seasonal rainfall events in Senegal demonstrated significant decadal fluctuations in both frequency and intensity. These variations were comparable to the mean seasonal rainfall patterns observed in the Sahel region throughout the 20th century and were found to be correlated with the Atlantic Multi-Decadal Variability (AMV). The recurrence of these extreme events observed in West Africa has consequences in many basins. Hence, several studies have already been conducted in the basin of the Senegal River in order to analyze the evolution of rainfall and flow. [6] The results of their study confirm a transition into a climatic era that is wetter than the 1970s and 1980s, starting around 1994 [7]. The examination of annual flow rates consistently reveals a prominent disruption in the basin during the early 1990s. Ref. [8] showed in 1969, a significant shift in annual rainfall, marking the onset of a drought period. Subsequently, in 1994, another noticeable shift occurred, indicating a partial but not statistically significant recovery of rainfall at the basin level compared to the period between 1969 and 1994 [9]. Demonstrates a continuous decline in rainfall over the decades of the 1970s, 1980s, and 1990s when compared to the preceding period of 1955-1964. According to their findings, drought generally maintains a moderate character and only rarely reaches extreme levels in the upper watershed. Previous authors have concentrated more precisely on analyses of flow rates and precipitation over the Senegal River Basin. They have examined climate changes as well as water level fluctuations in this specific region. However, they have not provided precise information regarding the severity of extreme events in recent periods, which is crucial for better planning and the adoption of mitigation approaches. The goal of our study is to analyze the trends and breakpoints of extreme rainfall and discharge over the Senegal River basin using extreme indices. The analysis will cover the period from 1982 to 2021.
2. Materials and Methods
2.1. Study Area
The Senegal River drains a catchment area of about 340.000 km2, shared among four West African countries: Senegal, Mali, Mauritania, and Guinea (Figure 1). It is formed by three main tributaries (Faleme, Bafing, and Bakoye), which have their sources in the Fouta Djalon highlands in Guinea. Bafing and Bakoye tributaries are in Mali, and the Faleme, which borders Senegal and Mali and sometimes flows through Senegalese territory. The basin has three main regions: the upper basin, the valley, and the delta. The Senegal River valley, including the delta, constitutes the terminal part and goes from Bakel to Saint-Louis over an area of 12,639 km2. From a climatic point of view, the rainy season occurs in four months in Bakel (June-September) and three months in Podor, Matam, and Saint-Louis (July-September) in downstream. For all stations, the maximum rainfall is recorded in August. From Bakel to Saint-Louis, the average annual rainfall decreased from 556 to 257 mm over the period 1981-2015. The upper basin, from Fouta Djallon to Bakel, possesses a drainage basin area of about 218,000 km2. These main tributaries supply more than 80% of its flow. It is characterized by average annual rainfall between 1,400-2,000 mm (southern area of the basin) and 500-1,400 mm (northern area) [9]. The main gauging hydrometric station, Bakel, allows us to determine the state of water conditions where the river receives contributions from most of its tributaries.
2.2. Data
Daily rainfall data from fifteen stations (Table 1) were used in this study; they were obtained from the National Agencies of Meteorology of Senegal, Mali and Guinea from 2001 to 2010. Given the limited period of available rainfall data, we extracted rainfall data from the Climate Hazards Group Infrared Precipitation (CHIRPS) at 5Km spatial resolution (https://data.chc.ucsb.edu/products/CHIRPS-2.0/).
Moreover, river discharge data used in the current work were obtained from the Direction of Water Management and Planning of Senegal. Initially, four stations, spatially distributed over the upper Senegal River basin, were selected (Table 2), but the main analyses were focused at the reference station (Bakel), due to the fact that up to 95% of the basin flow passes through it, according to [10]. These daily flows cover the period 1982 - 2021 for the upper basin at the Bakel station.
2.3. Methods
2.3.1. Comparison between Station and CHIRPS Rainfall Data
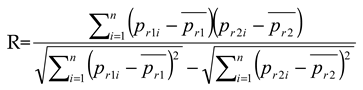
The quality of the CHIRPS data is first evaluated over the period 2001 to 2010 by comparing it with the rainfall data from 15 stations located along the Senegal River. Figure 2 shows the monthly variation of the satellite product and the various stations. Statistical indicators (Table 4) such as the Nash-Sutcliffe efficiency criterion [11]and the correlation coefficient (R) were used to evaluate the quality of CHIRPS data.
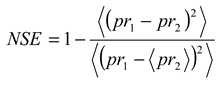
Pr1 is the observed rainfall from the station, Pr2 represents satellite rainfall, and ⟨ ⟩ represents the average. A NSE value of 1 indicates perfect agreement between the satellite and observations but if the value is equal to 0, this suggests that the mean square error of the product is comparable to utilizing the mean observed value alone as the predictor.
Figure 2 illustrates the seasonal variation of precipitation using satellite data and data from 15 stations located within the Senegal River basin. It demonstrates a strong correlation between these two datasets, with the highest precipitation observed in the month of August. This analysis is further supported by the results presented in Table 3, where statistical indicators (Equation (1), Equation (2) have values greater than 0.9, indicating a positive relationship between the satellite data and the station measurements.
2.3.2. Description of Selected Rainfall and River Discharge Extreme Indices
Extreme rainfall indices were computed over the period 1982 to 2021. The details of the selected extreme indices (Extremely wet day (R99P), very wet day (R95P), simple daily intensity (SDII), and maximum 5-day rainfall (RX5day)) are given in Table 4. Across the world, these indices have been used to study rainfall characteristics [12,13,14,15,16]. Furthermore, for river discharge, we used four indices to describe flow extremes: peak flow (Qmax), High flow days (Q95p), and very high flow days (Q99P), which were calculated in the period 1982 to 2021. It is well documented that these indices are relevant as they provide a suitable representation of the characteristics of floods and droughts [17,18].
The standardized flow index (Equation (3)) is also calculated in order to determine the deficit and surplus years in the flow. The following equation is used:
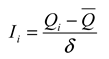 where the standardized flow index, is the annual flow of a particular year, and is the annual flow average over the period; is the standard deviation during the time.
2.3.3. Trend and Change Point Detection
- Tests for Trend Analysis
In this study, we implemented the Modified Mann–Kendall (MMK) trend test to evaluate the spatial and inter-annual extreme rainfall and flow trends from 1982 to 2021 over the whole Senegal River and over the upper basin, respectively.
Modified Mann–Kendall Test
-
The selection of MMK could be justified by its consideration of the autocorrelation effect present in the data. The principle is based on an adaptation of the statistic (S) used in the MK test. The modified MK was proposed by [19] with the aim of considering autocorrelation in the series: the statistics allow for adjusting the variance accordingly.
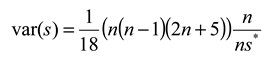 The parameter ns* is utilized to correct the effective number of observations, considering the autocorrelation in the data.
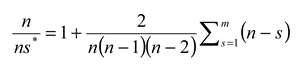 is a correction factor due to the autocorrelation present in the data
- 2.
- Change Point Detection Tests
- Pettit’s Test
Pettit's test is a statistical tool used to detect abrupt
changes in hydroclimate data series. It allows for the detection of noteworthy
and sudden shifts in climate data, indicating considerable alterations in
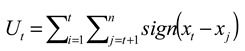
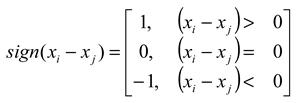
climatic conditions within a particular time period [20–25]. The non-parametric test statistics Ut for
this test can be characterized as follows:
The K test statistic and its related confidence level (ρ) for the specified sample size (n) can be elucidated as follows:
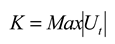
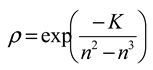
(p) Stands for the estimated significance probability concerning the change-point:

Standard Normal Homogeneity Test (SNHT)
- The test's sensitivity lies in its ability to detect breaks at both the start and end of the series. Moreover, it demonstrates insensitivity to potential missing values, making it relatively straight-forward yet highly effective compared to other tests. The SNHT test's application is based on the utilization of the following equation:
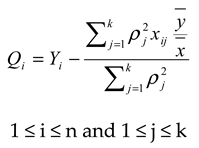
The base series has values represented by Yi for each year i, while the reference series j has observations denoted as Xij for each year i. The value ρj represents the correlation coefficient between the base series and the reference series j.
3. Results
3.1. Spatial Variation of Extreme Rainfall Indices over the Senegal River Basin
Figure 3 presents the spatial variation of extreme rainfall, calculated from SDII, RX5DAY, R95P, and R99P climate indices, for the rainy months of June, July, August, and September from 1982 to 2021 in the Senegal River. This figure reveals an irregular variation in extreme rainfall. Great values of the extreme indices observed in the south of the basin, while Lower values are observed in the northern part of the basin. These variations indicate an increased exposure to extreme rainfall in the upper basin compared to the river valley.
3.2. Trend and Significance of Extreme Indices
Spatial analysis of extreme indices in Figure 4 reveals irregular variability in space. Overall, a rise in intense rainfall is observed across most of Senegal River. However, negative values indicating a decrease have been observed in the northern part. The R95P index in Figure 4a highlights a positive and significant trend in very rainy days in the south, which is represented by black dots (p<0.05). For the R99P index, an increasing trend and high significance of extremely wet days are observed only in the central delta (Figure 4b). Similar observations are made for the maximum 5-day rainfall total (RX5DAY), but the significance is moderate (Figure 4c). The spatial variation of SDII represented (Figure 4d) shows an upward and meaningful trend in daily rainfall intensity in Bakel. However, this generally increasing trend is not remarkable in the northern zone or portions of the south.
3.3. Inter-Annual Variation and Trends in Rainfall Extremes Indices
Our analysis over several years of extreme rainfall revealed a significant increase (see Table 5). This rise in extreme precipitation shows significant statistical significance (p-value < 0.05%) according to the R95P, R99P, RX5DAY, and SDII indices. These indices respectively measure very wet days, extremely rainy days, total precipitation over a 5-day period, and daily precipitation intensity.
3.4. Breakpoint Detection on the Trends of Extremes Precipitations
The Table 6 summarizes the results of the breakpoint analysis calculated using the Pettit test for extreme rainfall indices over 1982-2021. A Breakpoint is detected in 2007 for very wet days and for the daily intensity of precipitation, while for extremely wet days and the maximum 5-day precipitation total, the breakpoint is observed in 2006. A Significant breakpoint (p-value < 0.05%) is observed for very wet days calculated with the R95p index. However, no significant breakpoints are found for extremely wet days, the daily intensity of rainfall, or the maximum 5-day rainfall total, where the p-value values are above 0.05%. These breakpoints, observed over the period 1982-2021, showed that the Senegal River basin experienced a much wetter phase from 2008-2021, as illustrated in Figure 5.
3.5. Characterization of Extreme Flows of the Basin
In this section, extreme indices are calculated for the upper basin in order to characterize extreme flows at the scale of the Senegal basin because the upper basin generates over 80% of the river's inflows at Bakel [26]. The latter, accepted as the key station of the whole Senegal basin, controls the inflows of the three major confluents and records 95% of the river’s water [10].
3.5.1. Inter-Annual Variation of Discharge
The inter-annual distribution of flows, as indicated by the normalized flow index, reveals two distinct periods of hydrological dynamics in the upper basin, as illustrated in Figure 6. From 1980 to 1993, the upper basin experienced a series of years marked by dry conditions. This period was followed by a series of years characterized by wet conditions, from 1994 to 2021. These results show that the Senegal River basin has experienced a wetter hydrological regime in recent years.
3.5.2. Trends and Inter-Annual Variability of Flow Extremes
Table 7 illustrates the significant and increasing evolution of extreme flow rates inside the upper basin from 1982 to 2021. By examining indicators such as High Flow Days (Q95p), Very High Flow Days (Q99p), and Peak Flow Rate Qmax, a notable increase in extreme flow rates has been observed over the years. This upward trend emphasizes the importance and significance of extreme flow rates during this period.
3.5.3. Breakpoint Detection on the Trends of Extremes Flow
Table 8 summarizes the breakpoints calculated using the Pettit test and SNHT to assess the inter-annual evolution of extreme flows in this part of the basin. These results reveal a significant breakpoint in 1993 for all extreme indices, Q95p, Q99p, and QMAX. This breakpoint in 1993 indicates an increase in extreme flows into the Senegal River since 1994, as illustrated in Figure 7.
4. Discussion
The paper demonstrates an increase in extreme rainfall from south to north in terms of spatial distribution. Overall, there is an upward pattern of extreme rainfall observed in the southern region; however, a slightly downward trend is noted in the northern region (Sahelian zone). A Significant evolution of extreme rainfall is observed in most regions for very wet days, as assessed by the R95p index. However, this trend is significant in the central zone and the river delta for the R99p, SDII, and RX5DAY indices. The spatial distribution of rainfall may be attributed to the strong spatial disparity of rainfall in this sector. These results are consistent with those of [27], who indicated a distinct upsurge in extreme rainfall, exceedingly heavy rainfall, and consecutive maximums over 1,2,3,5, and 10 days in the Oueme Delta (Benin) ;[28] noted that over the 39-year observation period, there was a significant increase in total rainfall on rainy days, as well as cumulative rainfall over 5 consecutive days in Nigeria (1975 – 2103) and [29] said a rising trend is noticed from the Sahel to the coast in southern West Africa for RX1day, RX5day.
From 1982 to 2021, a remarkable upward shift in extreme rainfall was recorded in the Senegal River basin on an inter-annual scale. Comparable findings have been documented in other river basins in West Africa by various researchers, for instance [30] in the Komadugu-Yobe basin, [31] over West Africa, [32],[33] over the Sahelian region, [34] in the upper Ouémé river valley, and [35] in Bamako (Mali). The increase in extreme precipitation events could result from the increasing levels of greenhouse gases resulting from human activities. Natural climate variability, including phenomena such as the El Niño-Southern Oscillation and the Atlantic Multidecadal Oscillation, also plays a role in short-term variations in precipitation. Furthermore, changes in atmospheric circulation systems and the presence of mountain ranges such as the Atlas and Fouta Djalon in the region also contribute to the intensification of precipitation. These results could have implications for water resource management, infrastructure planning, and flood risk preparedness.
The analysis of the period from 1982 to 2021 detected significant breakpoints in the patterns of extreme rainfall. Specifically, breakpoints were observed in 2006 for extremely wet days and for the maximum 5-day precipitation total. For the trends of very wet days and simple daily intensity, the breakpoint was detected in 2007 in the 1982-2021 data series. These results indicate a transition to a new period characterized by much wetter conditions starting in 2008. This observation is supported by the study of [36], which suggests that Senegal and Burkina Faso started encountering wetter weather conditions starting in 2008 and beyond. These breakpoints in the trends of extreme rainfall highlight the importance of monitoring long-term changes and fluctuations in precipitation patterns.
The results of our study regarding extreme flows reveal a rising trend in the upper basin based on the data from the reference station for the period 1982 to 2021. This trend is both rapid and significant, indicating an increase in extreme flows over time. The year 1993 is the breakpoint identified in the trend of extreme flows using the Pettit and standard normal homogeneity tests. These findings are in line with the findings of several past studies, like: [7] said the analysis of annual flow rates consistently shows the presence of a significant break in the early 1990s (specifically in 1993) when statistical tests are conducted on the data series from 1970 to 2014 in the Senegal River basin, and [37], [32], [38], [39], and [40] studies suggest that the Sahelian drought may have come to an end in the 1990s, which is consistent with our observation of a series break during that period. It should be noted that this series break can have two possible origins: on one hand, changes in climatic conditions such as drought or Global warming, on the other hand, the influence of large human developments such as hydraulic infrastructure [41]. It is essential to consider these two potential factors when interpreting series breaks and observed trends in extreme flows. Understanding the underlying mechanisms and their interactions is crucial for assessing the causes of hydrological changes and better anticipating future impacts on water resources and ecosystems.
5. Conclusions
The purpose of this study was to assess trends and significant changes in rainfall and flow extremes respectively, in the Senegal River basin and its upper basin from 1982 to 2021. To achieve this, daily rainfall data from CHIRPS with a resolution of 0.05, as well as daily flow data from the reference station in the basin (Bakel), provided by DGPRE, were used. Seven extreme indices (R95P, R99P, SDII, RX5ADY, Q95P, Q99P, and Qmax) and standardized flow indices were employed.
The results highlight an augmentation in extreme rainfall from south to north across the entire basin, with a rising trend in the southern region and a slight decline in the northern region. These observed trends are significant throughout the Senegal River basin for the R95P index, but are significant only in the middle and delta regions for the R99P, SDII, and RX5DAY indices. Over the inter-annual scale from 1982 to 2021, a considerable upward trend in extreme rainfall was detected in the Senegal River basin. Breakpoints were detected, particularly in 2006 and 2007, indicating a transition to much wetter conditions starting in 2008. These breakpoints in extreme precipitation trends underscore the need to monitor long-term variations and fluctuations in precipitation regimes as well as incorporate these changes into water resource coordination and governance. Regarding extreme flows, an upward trend was observed in the higher portion of the Senegal River. The year 1993 was identified as a breakpoint in this trend, which might be associated with the ending of the Sahelian drought. Understanding the underlying mechanisms and their interactions is crucial for assessing the causes of hydrological changes and anticipating future impacts on water resources and ecosystems.
In summary, this study emphasizes the importance of monitoring variations in rainfall and flow extremes, as well as implementing appropriate adaptation measures to address these changes. The results contribute to our understanding of hydrological dynamics in this field and provide valuable information for water resources control, infrastructure planning, and flood risk preparedness.
Author Contributions
Conceptualization, A.N; M.L.M and J.A; methodology, A.N. and M.L.M; software, A.N; writing original draft preparation, A.N; writing review and editing, A.N; A.E.L; J.A; M.L.M; visualization, A.E.L; supervision, A.E.L, M.C. and J.A. All authors have read and agreed to the published version of the manuscript.
Funding
This paper is part of a doctoral research initiative, generously funded by the German Federal Ministry of Education and Research (BMBF) through the West Africa Science Center of Climate Change and Adapted Land Use (WASCAL).
Acknowledgments
This research is a part of a Ph.D. study conducted under the auspices of the West African Science Service Center on Climate Change and Adapted Land Use (WASCAL) program.
Conflicts of Interest
The authors declare no conflict of interest.
References
- OCHA, “Afrique de l ’ Ouest • Inondations 2009,” 2009.
- M. Ben Abdelmalek and I. Nouiri, “Study of trends and mapping of drought events in Tunisia and their impacts on agricultural production,” Sci. Total Environ., vol. 734, p. 139311, 2020. [CrossRef]
- D. Konate et al., “Observed Changes in Rainfall and Characteristics of Extreme Events in C ô te d ’ Ivoire ( West Africa ),” 2023.
- Larbi, F. C. C. Hountondji, T. Annor, W. A. Agyare, J. M. Gathenya, and J. Amuzu, “Spatio-temporal trend analysis of rainfall and temperature extremes in the Vea catchment, Ghana,” Climate, vol. 6, no. 4, 2018. [CrossRef]
- Badji, J. Mignot, E. Mohino, M. Diakhaté, and A. T. Gaye, “Decadal variability of rainfall extreme events in Senegal over the 20th century : observations and modelling,” no. May, p. 8335, 2023.
- M. T. Cisse, S. Sambou, Y. Dieme, C. Diatta, and M. Bop, “Analysis of flow in the Senegal River basin from 1960 to 2008,” Rev. des Sci. l’Eau, vol. 27, no. 2, pp. 167–187, 2014. [CrossRef]
- C. Faye, “Impact Du Changement Climatique Et Du Barrage De Manantali Sur La Dynamique Du Régime Hydrologique Du Fleuve Sénégal À Bakel (1950-2014),” BSGLg., vol. 64, pp. 69–82, 2015.
- Bodian et al., “Recent trend in hydroclimatic conditions in the Senegal River basin,” Water (Switzerland), vol. 12, no. 2, pp. 1–12, 2020. [CrossRef]
- Faty, A. Kane, and A. L. Ndiaye, “Influence de la manifestation climatique sur les régimes pluviométriques saisonniers dans le haut bassin versant du Sénégal,” Rev. des Sci. l’Eau, vol. 30, no. 2, pp. 79–87, 2017. [CrossRef]
- Faye, “Méthode d’analyse statistique de données morphométriques : corrélation de paramètres morphométriques et influence sur l’écoulement des sous-bassins du fleuve Sénégal,” Cinq Cont., vol. 4, no. 10, pp. 80–108, 2014.
- J. E. Nash and J. V Sutcliffe, “River Flow Forecasting Through Conceptual Models - Part I - A Discussion of Principles,” J. Hydrol., vol. 10, no. 1970, pp. 282–290, 1970.
- J. Sillmann, V. V. Kharin, X. Zhang, F. W. Zwiers, and D. Bronaugh, “Climate extremes indices in the CMIP5 multimodel ensemble: Part 1. Model evaluation in the present climate,” J. Geophys. Res. Atmos., vol. 118, no. 4, pp. 1716–1733, 2013. [CrossRef]
- J. Sillmann, V. V. Kharin, F. W. Zwiers, X. Zhang, and D. Bronaugh, “Climate extremes indices in the CMIP5 multimodel ensemble: Part 2. Future climate projections,” J. Geophys. Res. Atmos., vol. 118, no. 6, pp. 2473–2493, 2013. [CrossRef]
- Avila-Diaz, G. Abrahão, F. Justino, R. Torres, and A. Wilson, “Extreme climate indices in Brazil: evaluation of downscaled earth system models at high horizontal resolution,” Clim. Dyn., vol. 54, no. 11–12, pp. 5065–5088, 2020. [CrossRef]
- Avila-Diaz, V. Benezoli, F. Justino, R. Torres, and A. Wilson, “Assessing current and future trends of climate extremes across Brazil based on reanalyses and earth system model projections,” Clim. Dyn., vol. 55, no. 5–6, pp. 1403–1426, 2020. [CrossRef]
- B. Wilson, A. Avila-Diaz, L. F. Oliveira, C. F. Zuluaga, and B. Mark, “Climate extremes and their impacts on agriculture across the Eastern Corn Belt Region of the U.S.,” Weather Clim. Extrem., vol. 37, no. February, p. 100467, 2022. [CrossRef]
- M. Hu, T. Sayama, W. Duan, K. Takara, B. He, and P. Luo, “Assessment of hydrological extremes in the Kamo River Basin, Japan,” Hydrol. Sci. J., vol. 62, no. 8, pp. 1255–1265, 2017. [CrossRef]
- F. Garcia, “Amélioration d ’ une modélisation hydrologique régionalisée pour estimer les statistiques d ’ étiage Florine Garcia To cite this version : HAL Id : tel-01624530 Université Pierre et Marie Curie Amélioration d ’ une modélisation hydrologique régionalisée p,” 2017.
- Ahmad et al., “Spatiotemporal analysis of precipitation variability in annual, seasonal and extreme values over upper Indus River basin,” Atmos. Res., vol. 213, pp. 346–360, 2018. [CrossRef]
- R. Sneyers, “On the statistical analysis of series of observations,” World Meteorol. Organ., vol. 415, p. 1990, 1990. [CrossRef]
- Tarhule and M. Woo, “Changes in rainfall characteristics in northern Nigeria,” Int. J. Climatol., vol. 18, no. 11, pp. 1261–1271, 1998.
- G. Verstraeten, J. Poesen, G. Demarée, and C. Salles, “Long-term (105 years) variability in rain erosivity as derived from 10-min rainfall depth data for Ukkel (Brussels, Belgium): Implications for assessing soil erosion rates,” J. Geophys. Res. Atmos., vol. 111, no. 22, 2006. [CrossRef]
- X. Mu, L. Zhang, T. R. McVicar, B. Chille, and P. Gau, “Analysis of the impact of conservation measures on stream flow regime in catchments of the Loess Plateau, China,” Hydrol. Process., vol. 21, no. 16, pp. 2124–2134, 2007. [CrossRef]
- S. Zhang and X. X. Lu, “Hydrological responses to precipitation variation and diverse human activities in a mountainous tributary of the lower Xijiang, China,” Catena, vol. 77, no. 2, pp. 130–142, 2009. [CrossRef]
- P. Gao, X. M. Mu, F. Wang, and R. Li, “Changes in streamflow and sediment discharge and the response to human activities in the middle reaches of the Yellow River,” Hydrol. Earth Syst. Sci., vol. 15, no. 1, pp. 1–10, 2011. [CrossRef]
- V. F. Decembre, “S d a g e d u f l e u v e s e n e g a l,” 2009.
- R. Hounguè, A. E. Lawin, S. Moumouni, and A. A. Afouda, “Change in climate extremes and pan evaporation influencing factors over Ouémé Delta in Bénin,” Climate, vol. 7, no. 1, 2019. [CrossRef]
- V. N. Dike, Z. H. Lin, and C. C. Ibe, “Intensification of summer rainfall extremes over nigeria during recent decades,” Atmosphere (Basel)., vol. 11, no. 10, pp. 10–12, 2020. [CrossRef]
- S. Diatta, C. W. Diedhiou, D. M. Dione, and S. Sambou, “Spatial variation and trend of extreme precipitation in west africa and teleconnections with remote indices,” Atmosphere (Basel)., vol. 11, no. 9, 2020. [CrossRef]
- OE, L. BL, L. AE, and S. IS, “Spatio-Temporal Precipitation Trend and Homogeneity Analysis in Komadugu-Yobe Basin, Lake Chad Region,” J. Climatol. Weather Forecast., vol. 05, no. 03, 2017. [CrossRef]
- S. E. Nicholson, B. Some, and B. Kone, “An analysis of recent rainfall conditions in West Africa, including the rainy seasons of the 1997 El Nino and the 1998 La Nina years,” J. Clim., vol. 13, no. 14, pp. 2628–2640, 2000.
- P. Ozer, M. Erpicum, G. Demarée, and M. Vandiepenbeeck, “The Sahelian drought may have ended during the 1990s,” Hydrol. Sci. J., vol. 48, no. 3, pp. 489–492, 2003. [CrossRef]
- B. Sarr and M. Camara, “Evolution Des Indices Pluviométriques Extrêmes Par L’analyse De Modèles Climatiques Régionaux Du Programme CORDEX: Les Projections Climatiques Sur Le Sénégal,” Eur. Sci. Journal, ESJ, vol. 13, no. 17, p. 206, Jun. 2017. [CrossRef]
- Attogouinon, A. E. Lawin, Y. N. T. M’Po, and R. Houngue, “Extreme precipitation indices trend assessment over the Upper Oueme river valley-(Benin),” Hydrology, vol. 4, no. 3, pp. 1–24, 2017. [CrossRef]
- M. Fofana et al., “Urban flash flood and extreme rainfall events trend analysis in Bamako, Mali,” Environ. Challenges, vol. 6, no. January, pp. 0–8, 2022. [CrossRef]
- Z. Nouaceur, “La reprise des pluies et la recrudescence des inondations en Afrique de l’Ouest sahélienne,” Physio-Géo, vol. 15, no. Volume 15, pp. 89–109, 2020. [CrossRef]
- S. Sene and P. Ozer, “Évolution Pluviométrique Et Relation Inondations – Événements Pluvieux Au Sénégal,” Bull. la Société géographique Liège, vol. 42, no. January 2002, pp. 27–33, 2002. 20 January.
- J. Niang, A. Ozer, and P. Ozer, “Fifty years of landscape evolution in Southwestern Mauritania by means of aerial photos,” J. Arid Environ., vol. 72, no. 2, pp. 97–107, 2008. [CrossRef]
- P. Ozer, Y. C. Hountondji, and O. Laminou Manzo, “Evolution des caractéristiques pluviométriques dans l’est du niger de 1940 a 2007,” Geo. Eco. Trop., vol. 33, pp. 11–30, 2009.
- G. Panthou, T. Vischel, and T. Lebel, “Recent trends in the regime of extreme rainfall in the Central Sahel,” Int. J. Climatol., vol. 34, no. 15, pp. 3998–4006, 2014. [CrossRef]
- S. Sambou, A. M. Badji, and E. N. Malanda-nimy, “Une Approche Statistique,” vol. 20, no. 1, pp. 104–111, 2009.
Figure 1.
Map of the study area.
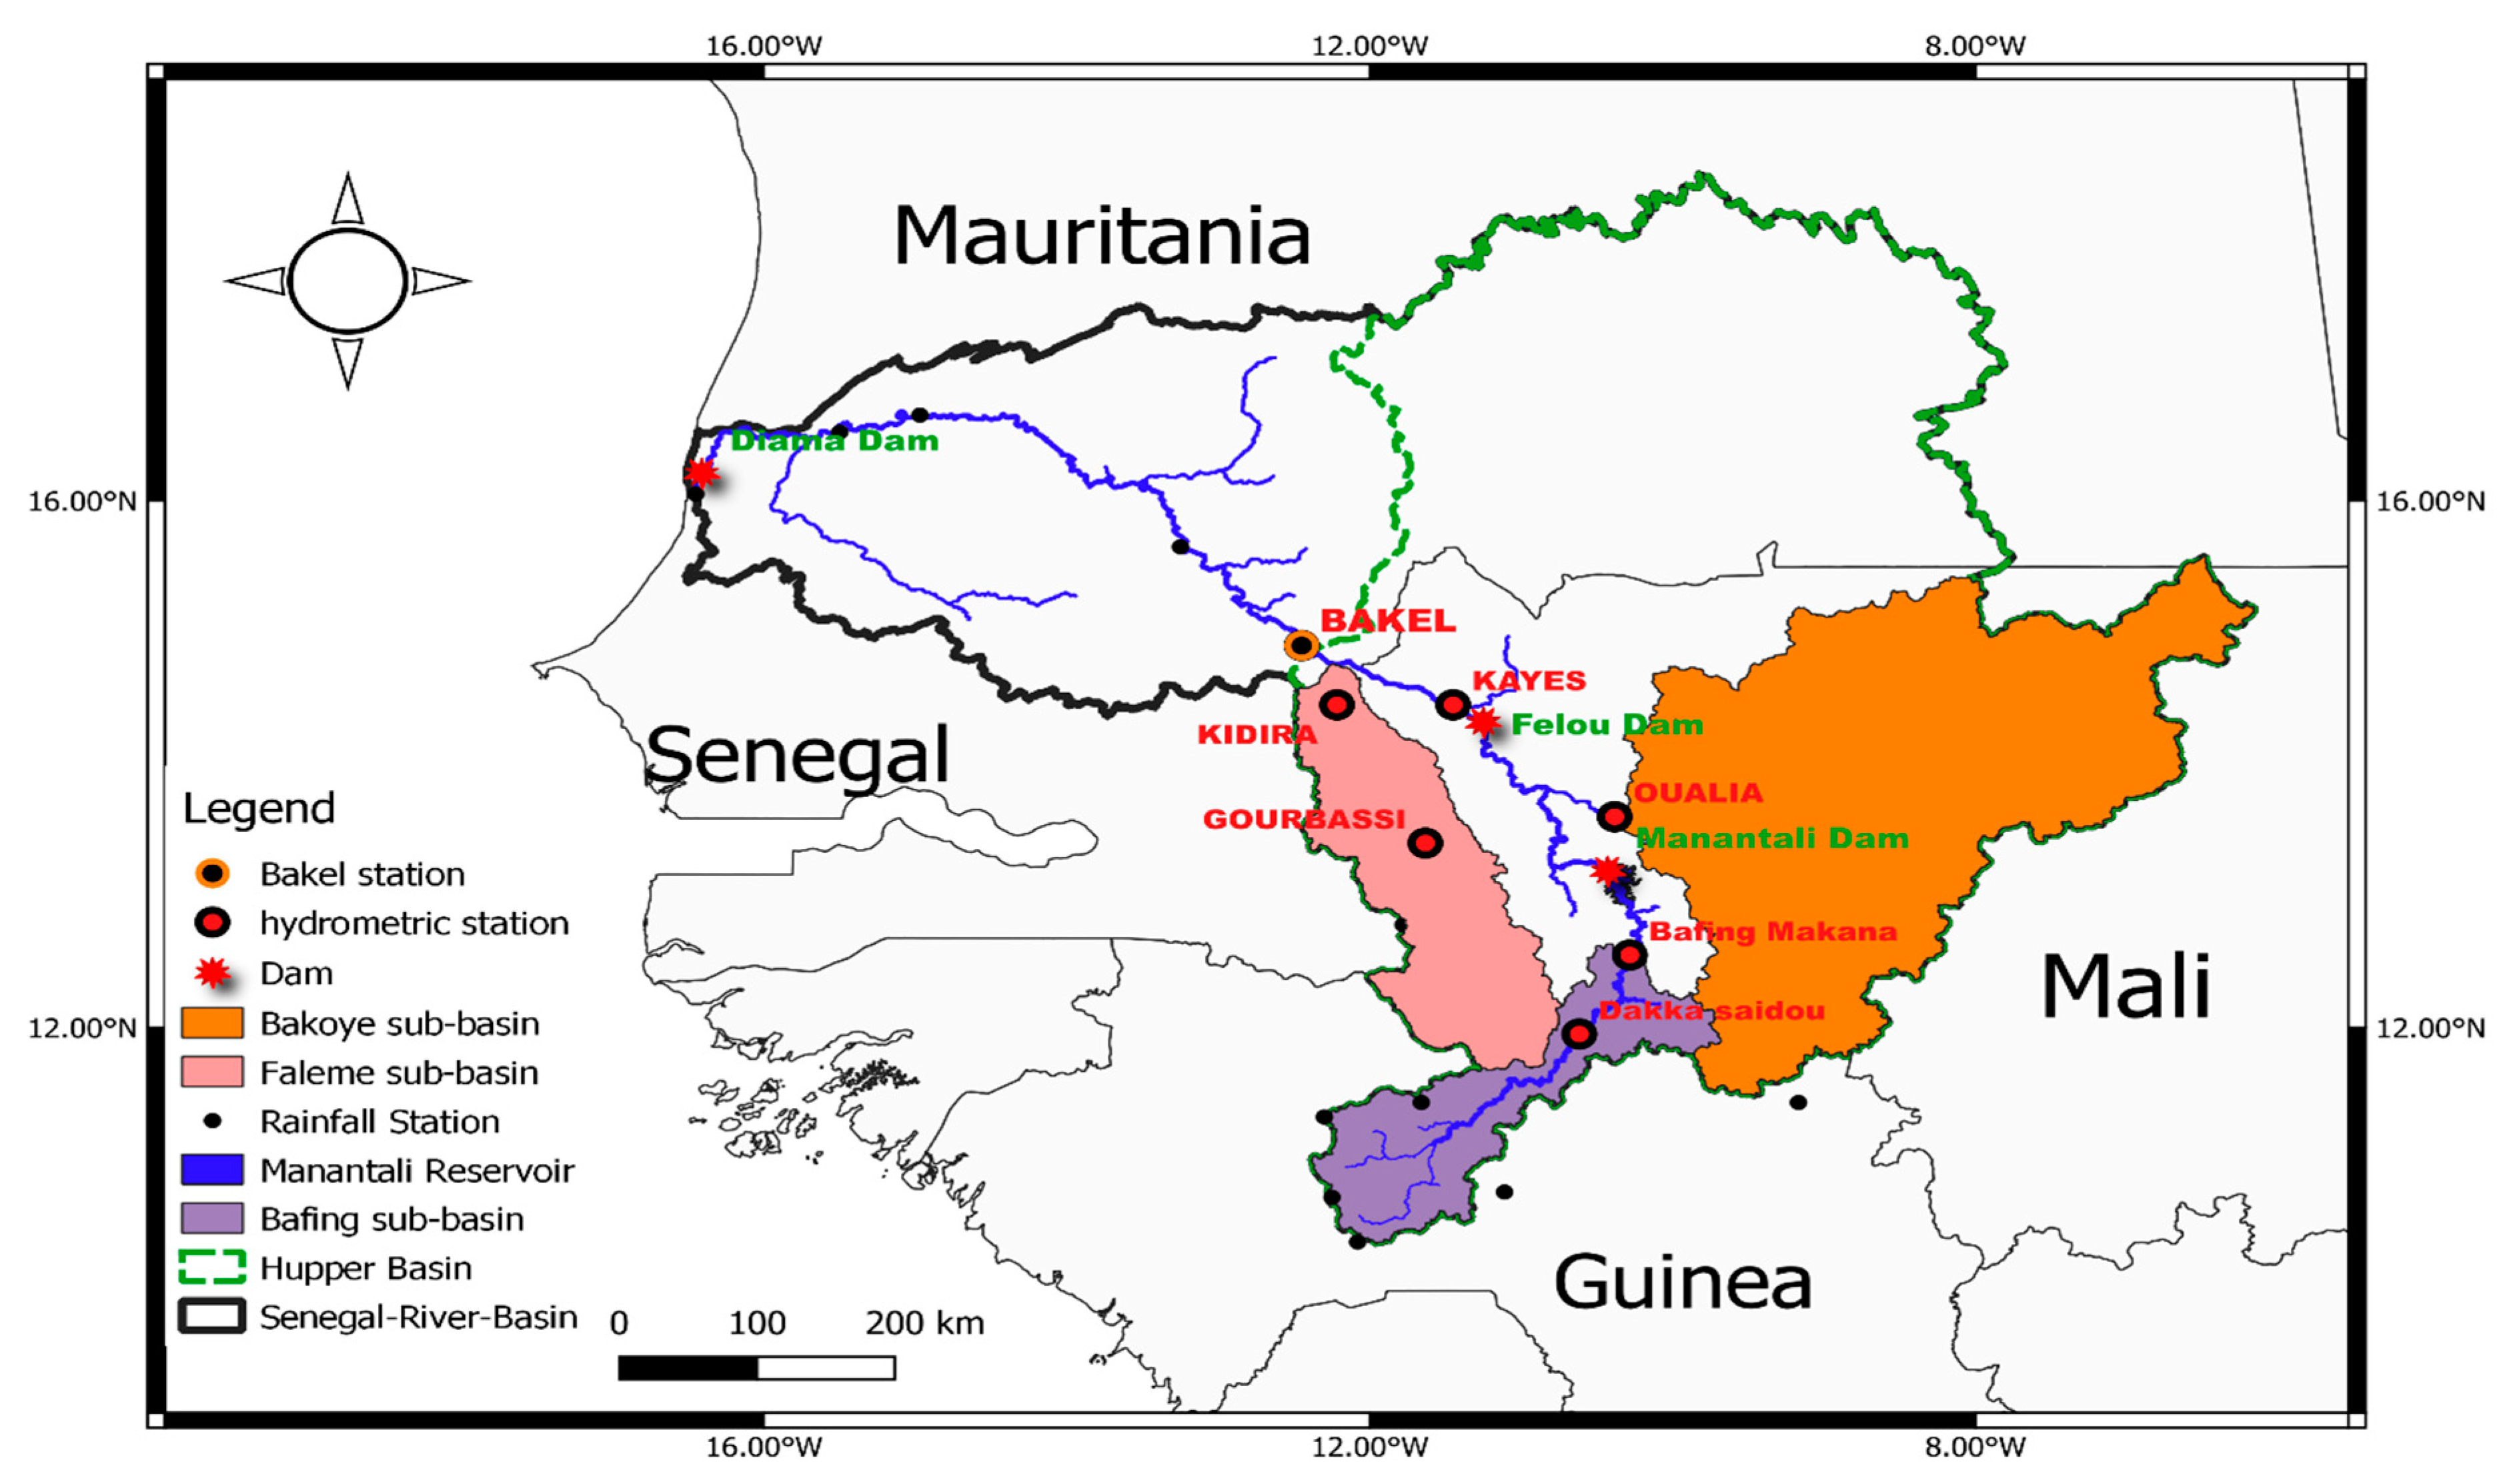
Figure 2.
Annual cycle of satellite and station rainfall during 2001–2010.
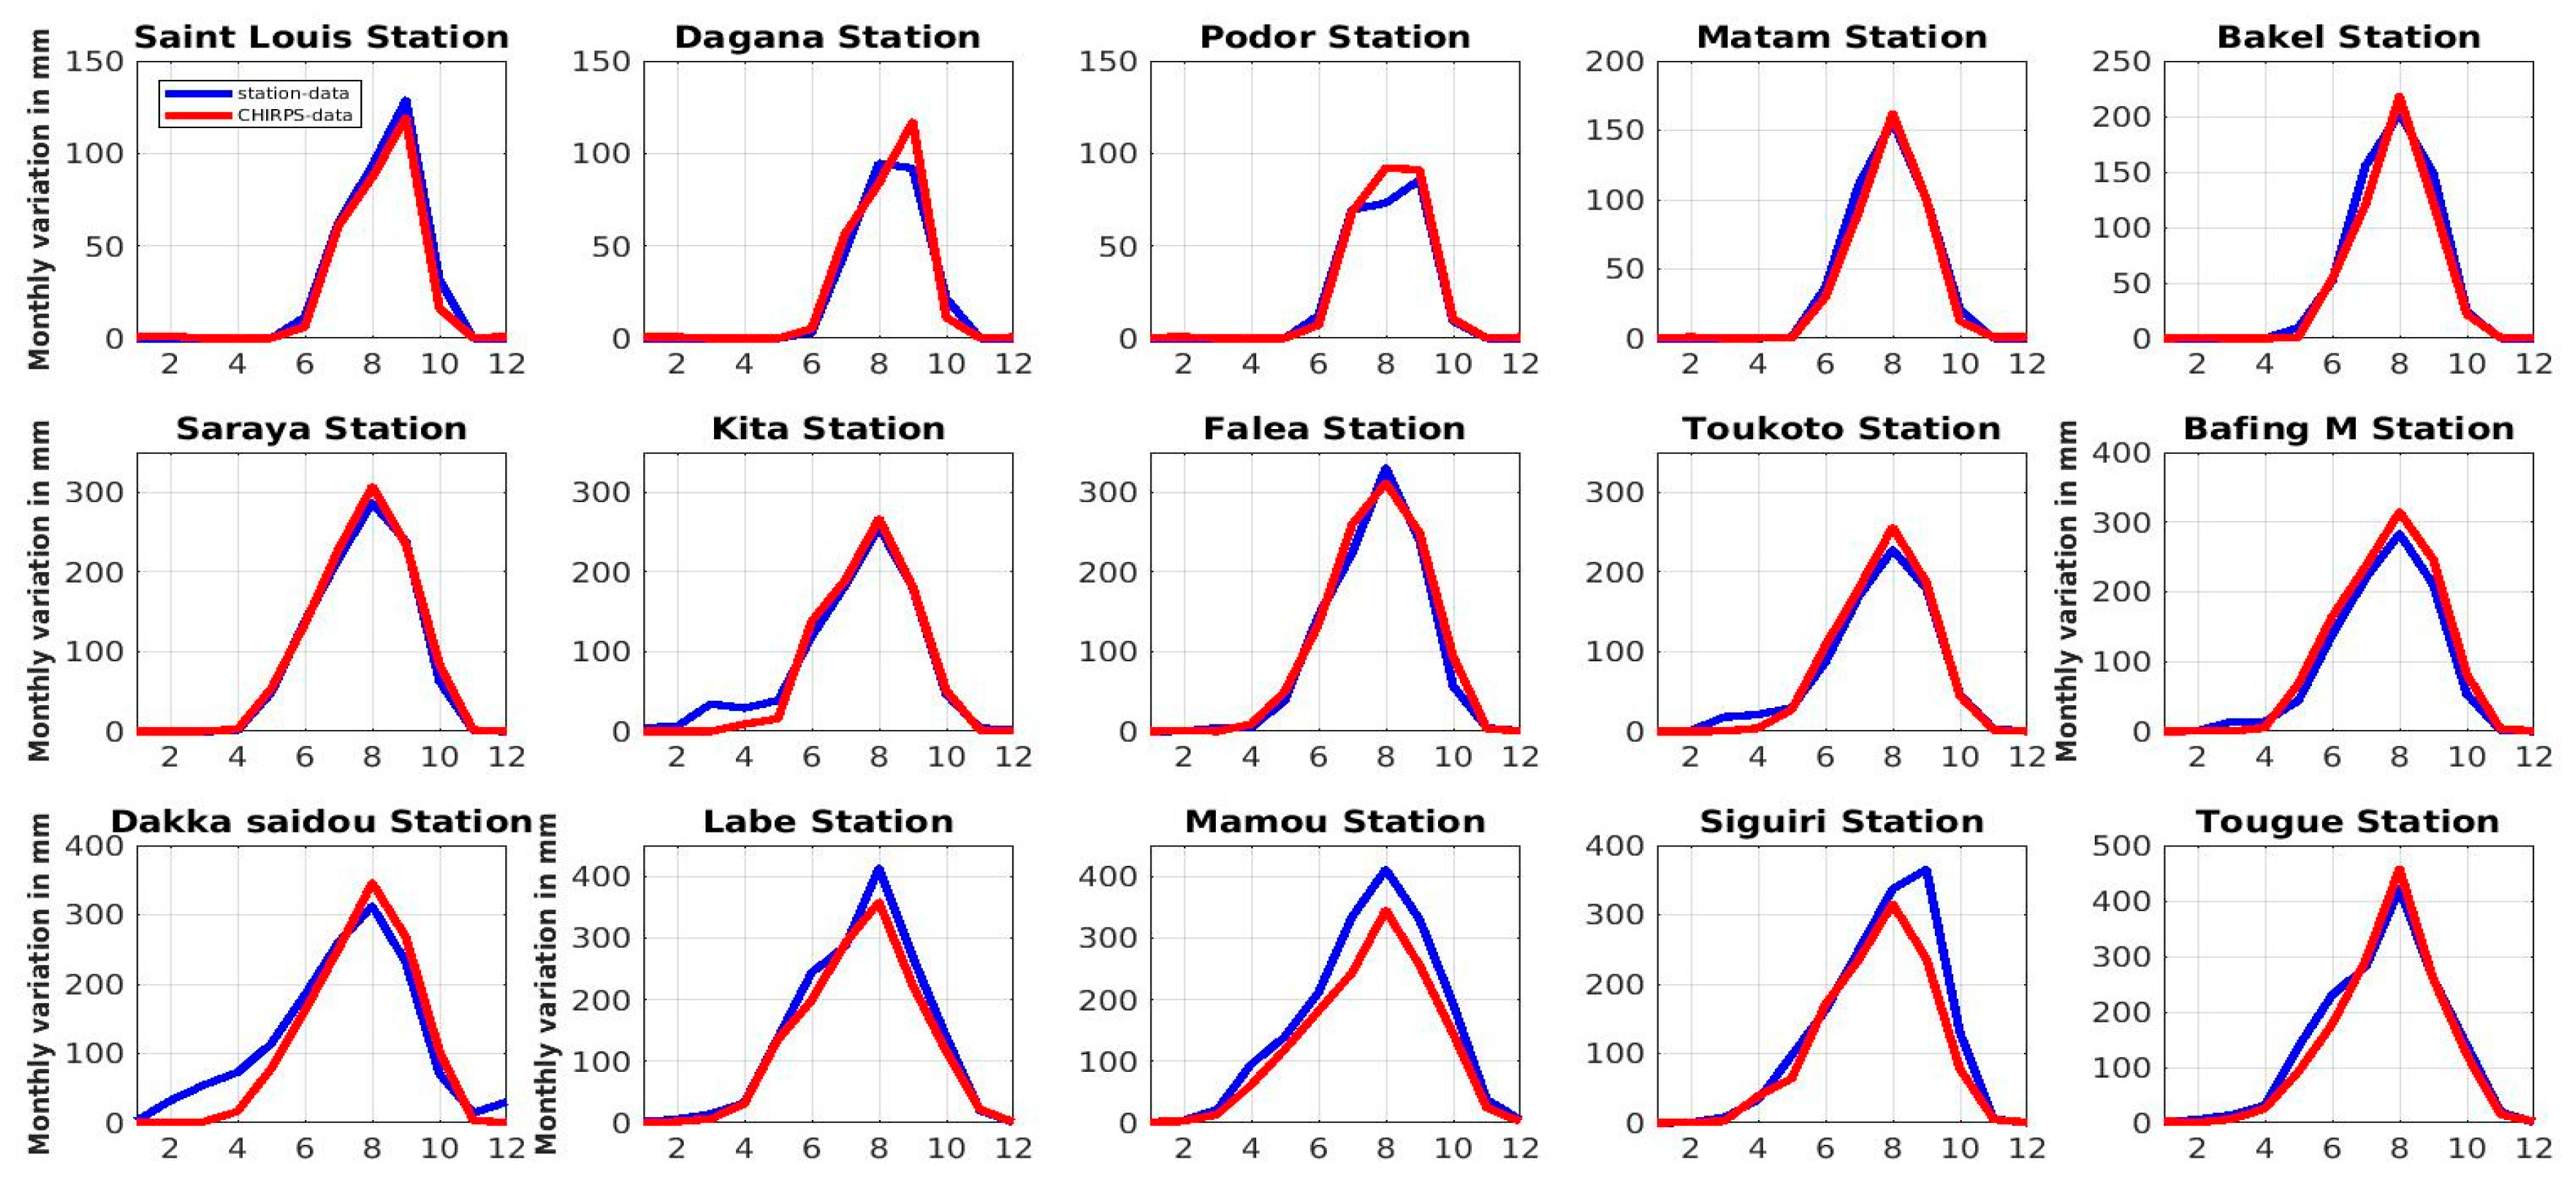
Figure 3.
spatial variation of rainy events over the Senegal River basin in. .
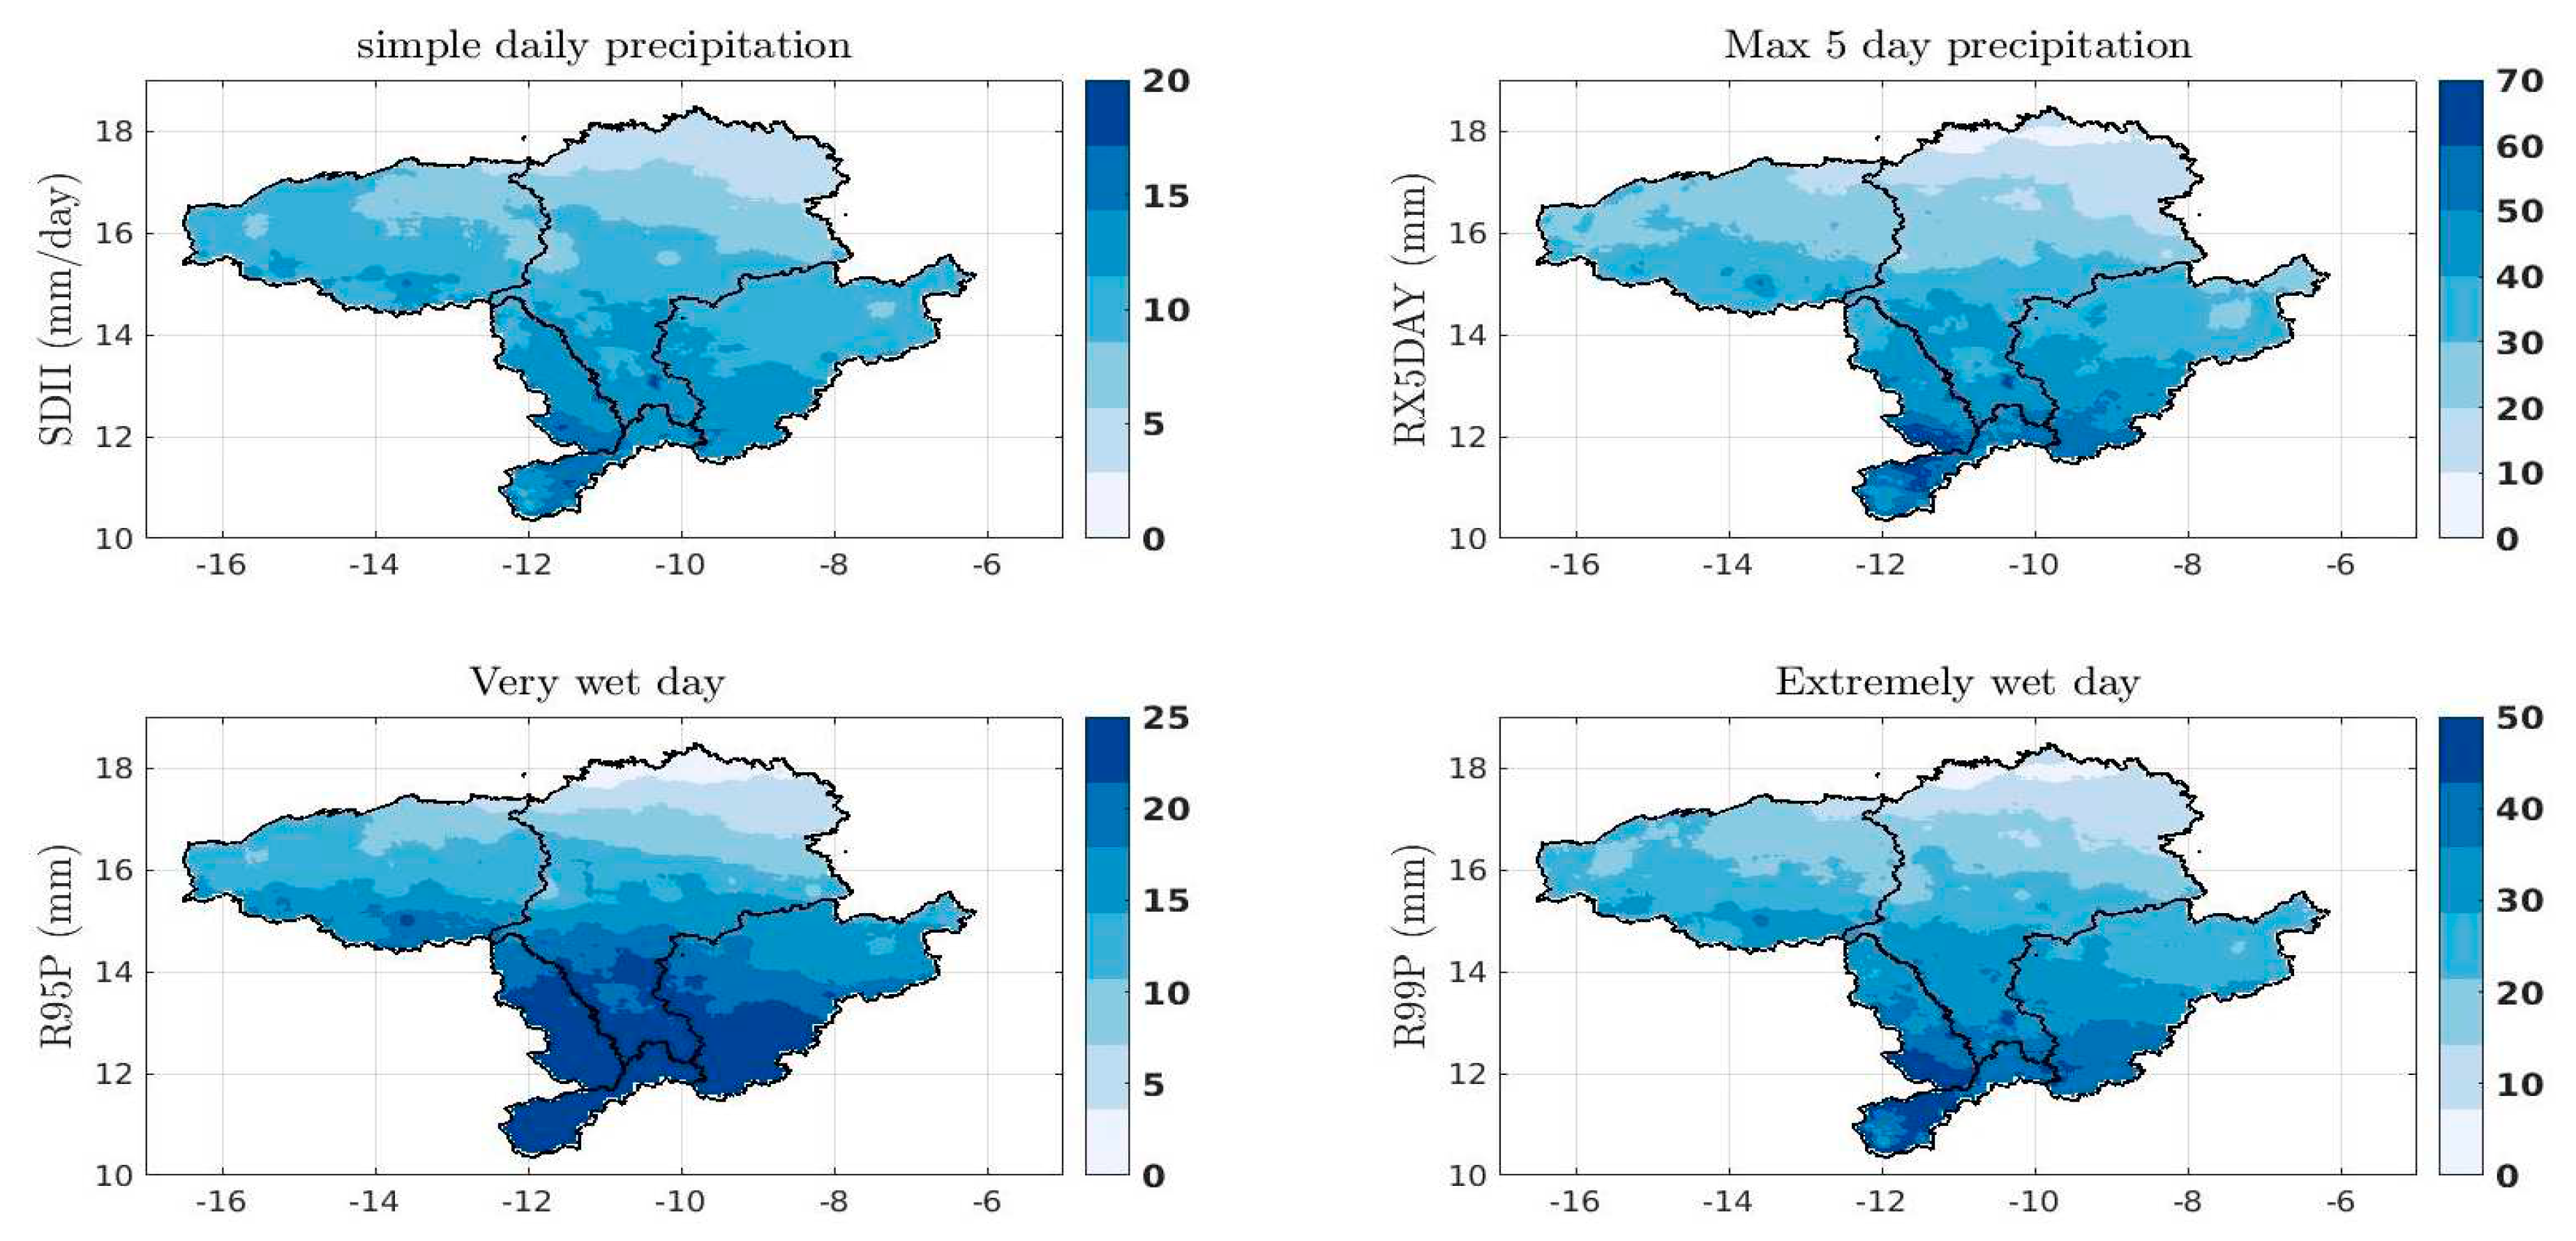
Figure 4.
Sen’s slope and trends for SRB from 1982 to 2021 (black point were statistically had a significant trend at P <0.05).
Figure 4.
Sen’s slope and trends for SRB from 1982 to 2021 (black point were statistically had a significant trend at P <0.05).
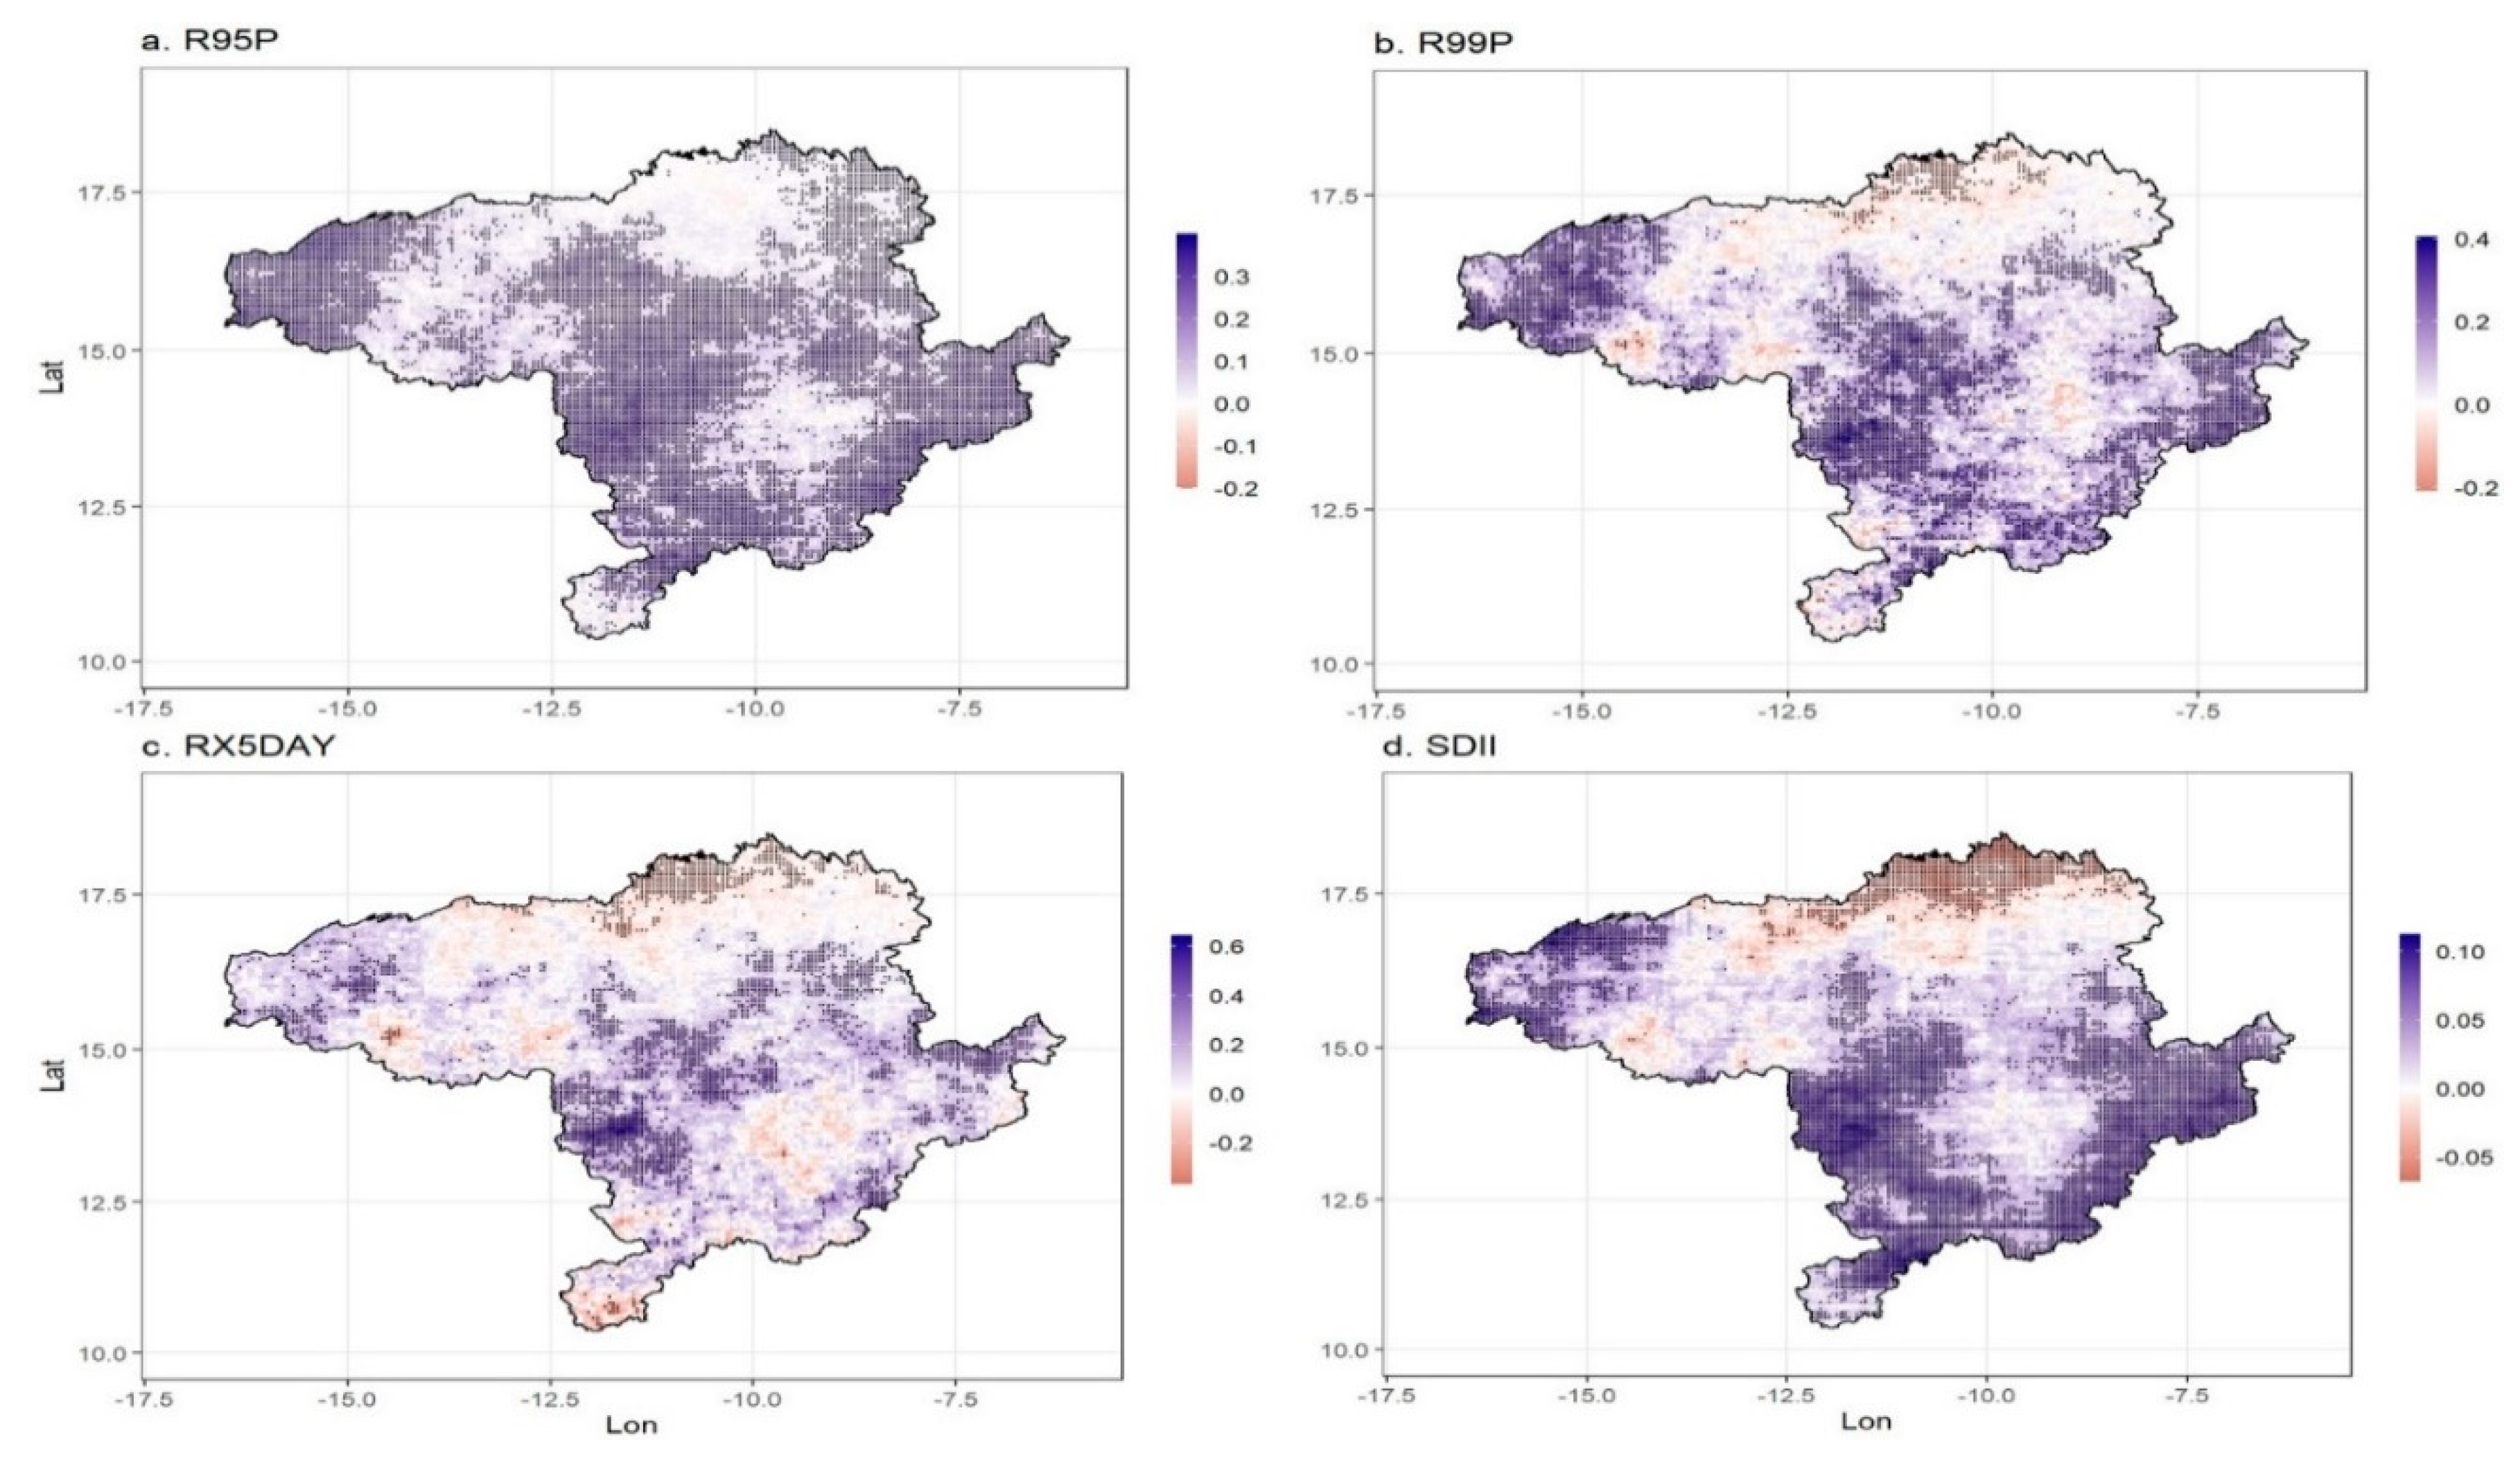
Figure 5.
break result for the extremes precipitation over the Senegal River basin (SRB).
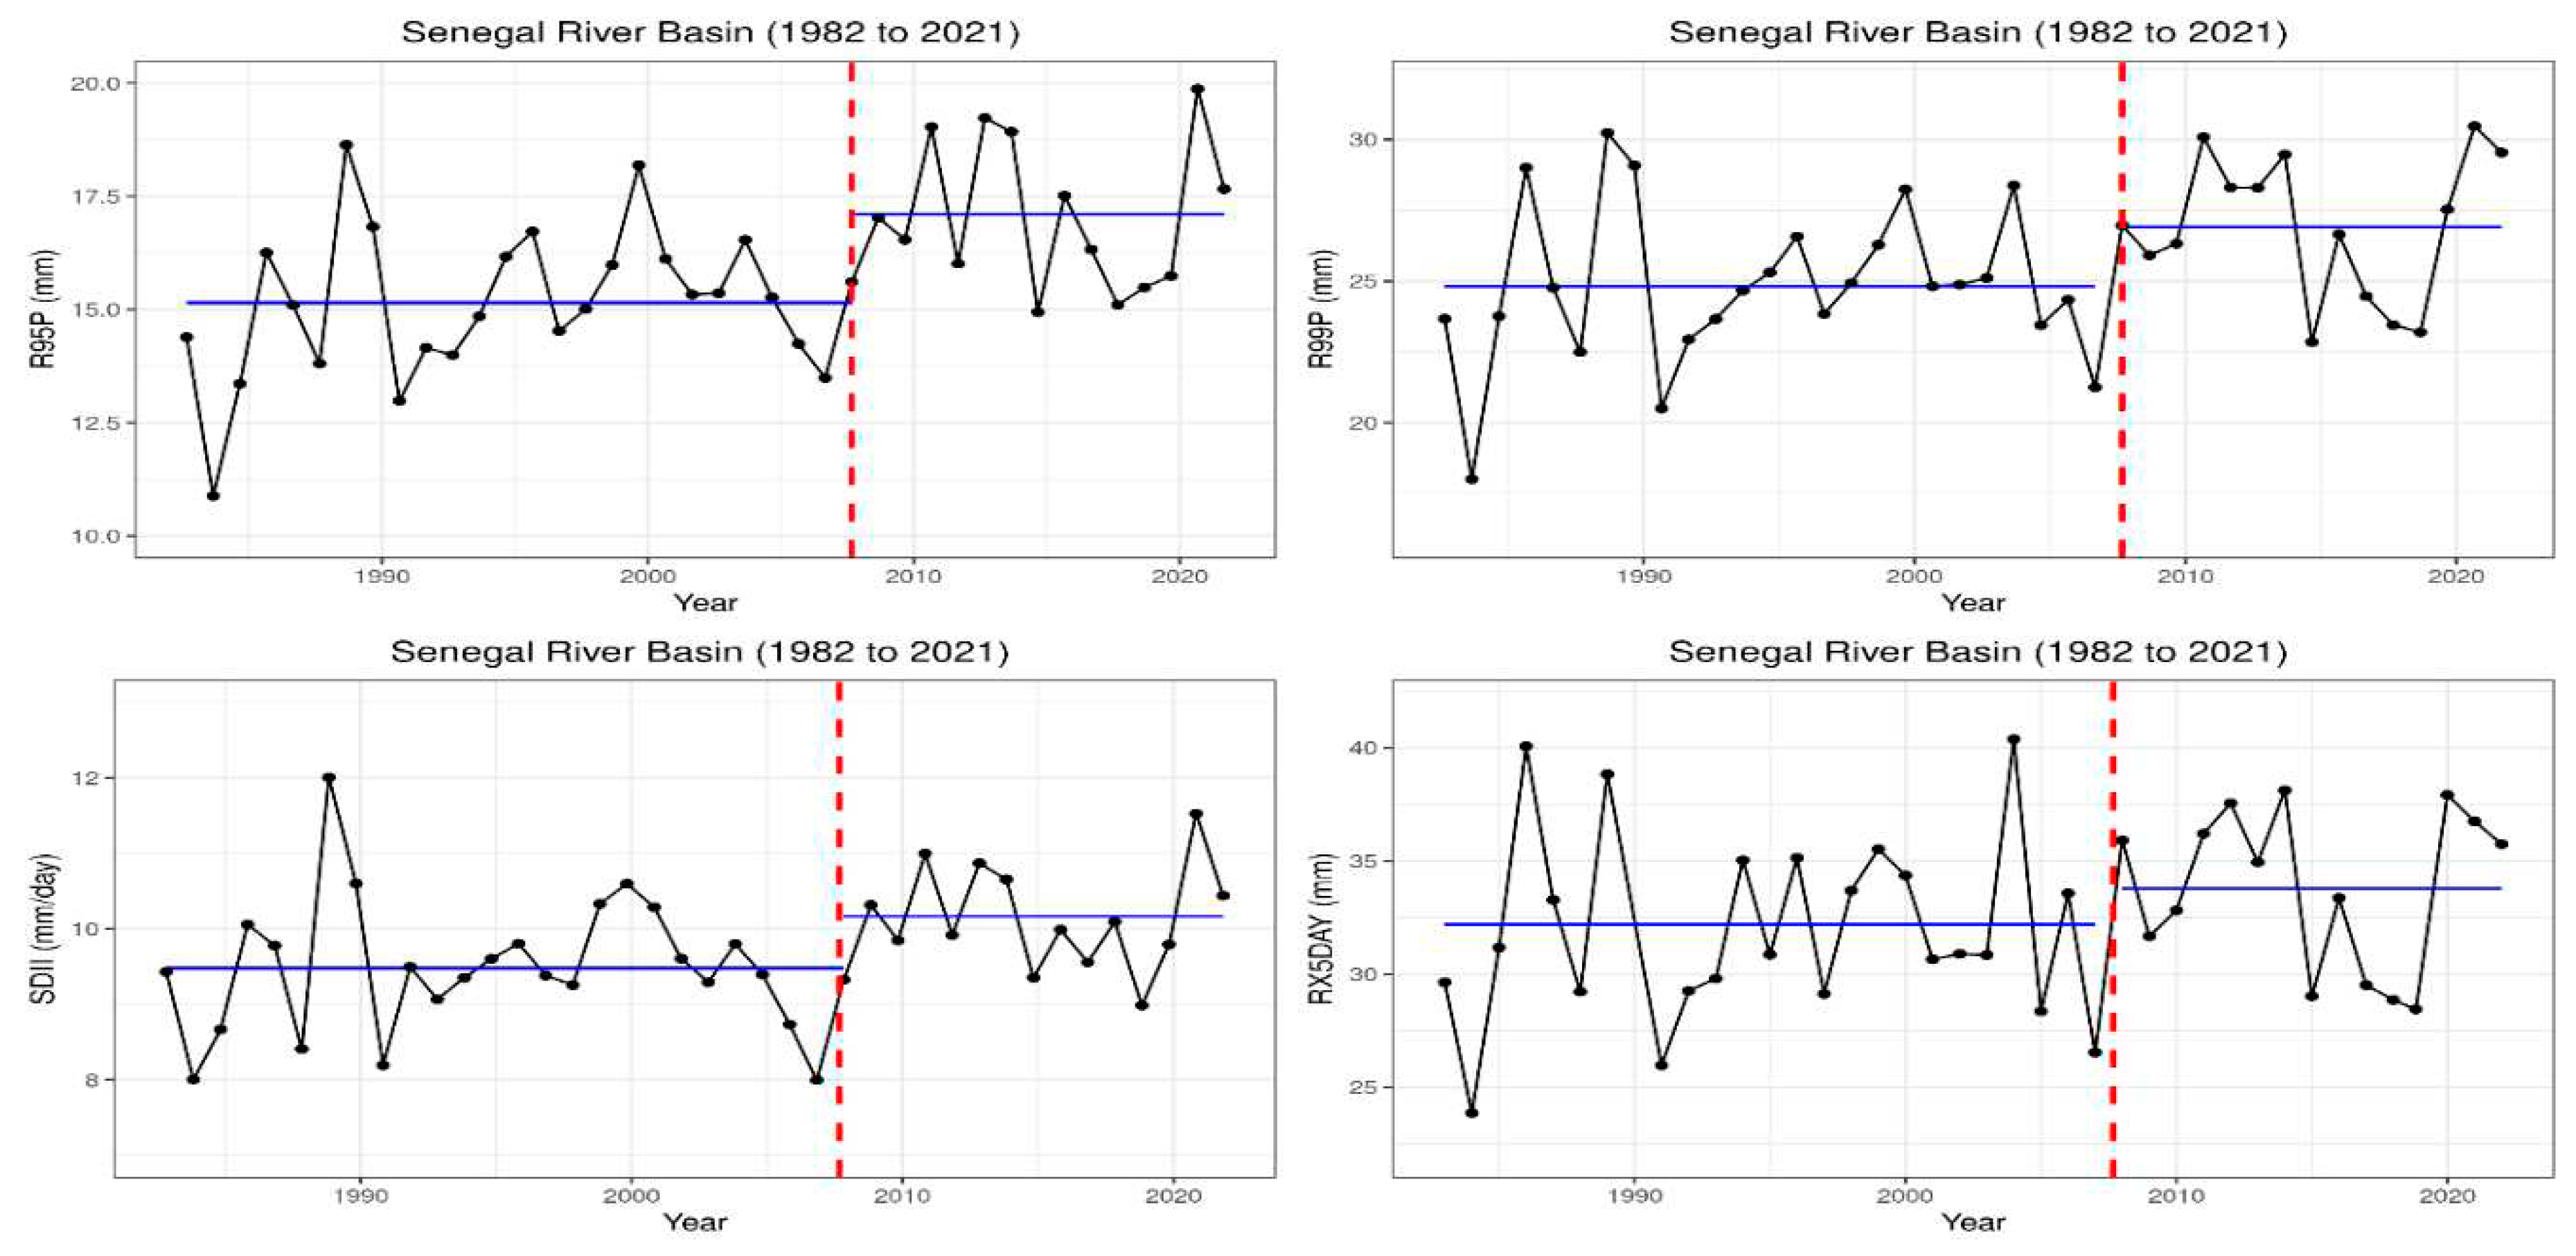
Figure 6.
standardized flow index over the upper basin (1980 to 2021).
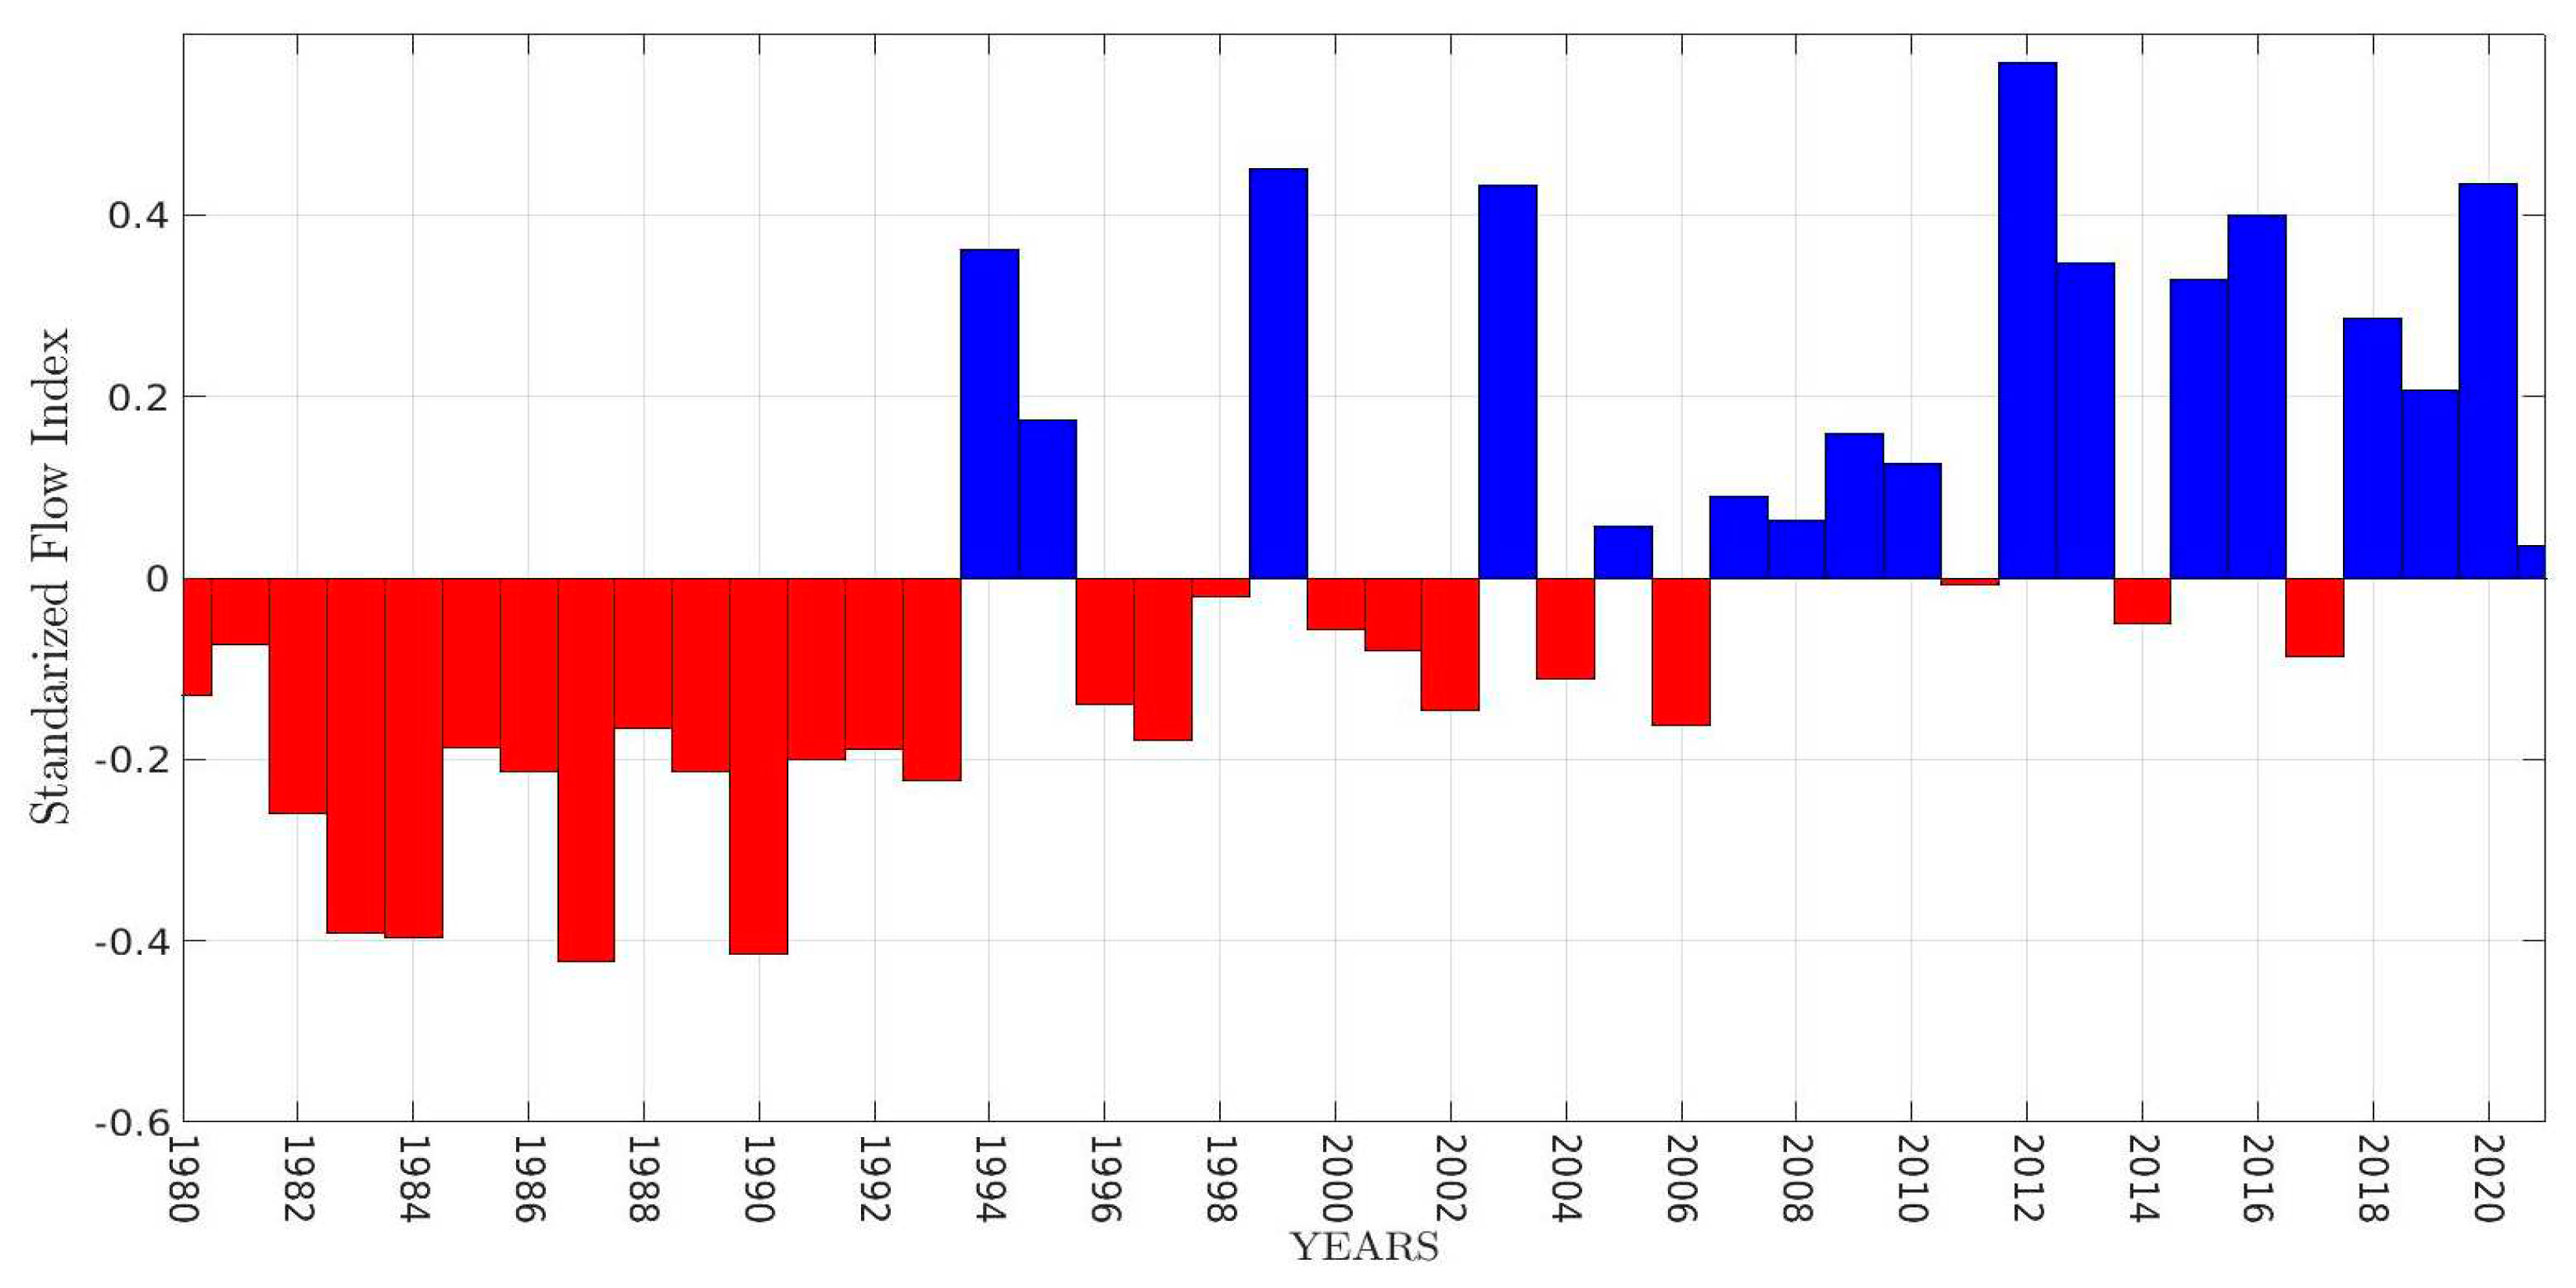
Figure 7.
break result for the extremes flow over the upper basin.
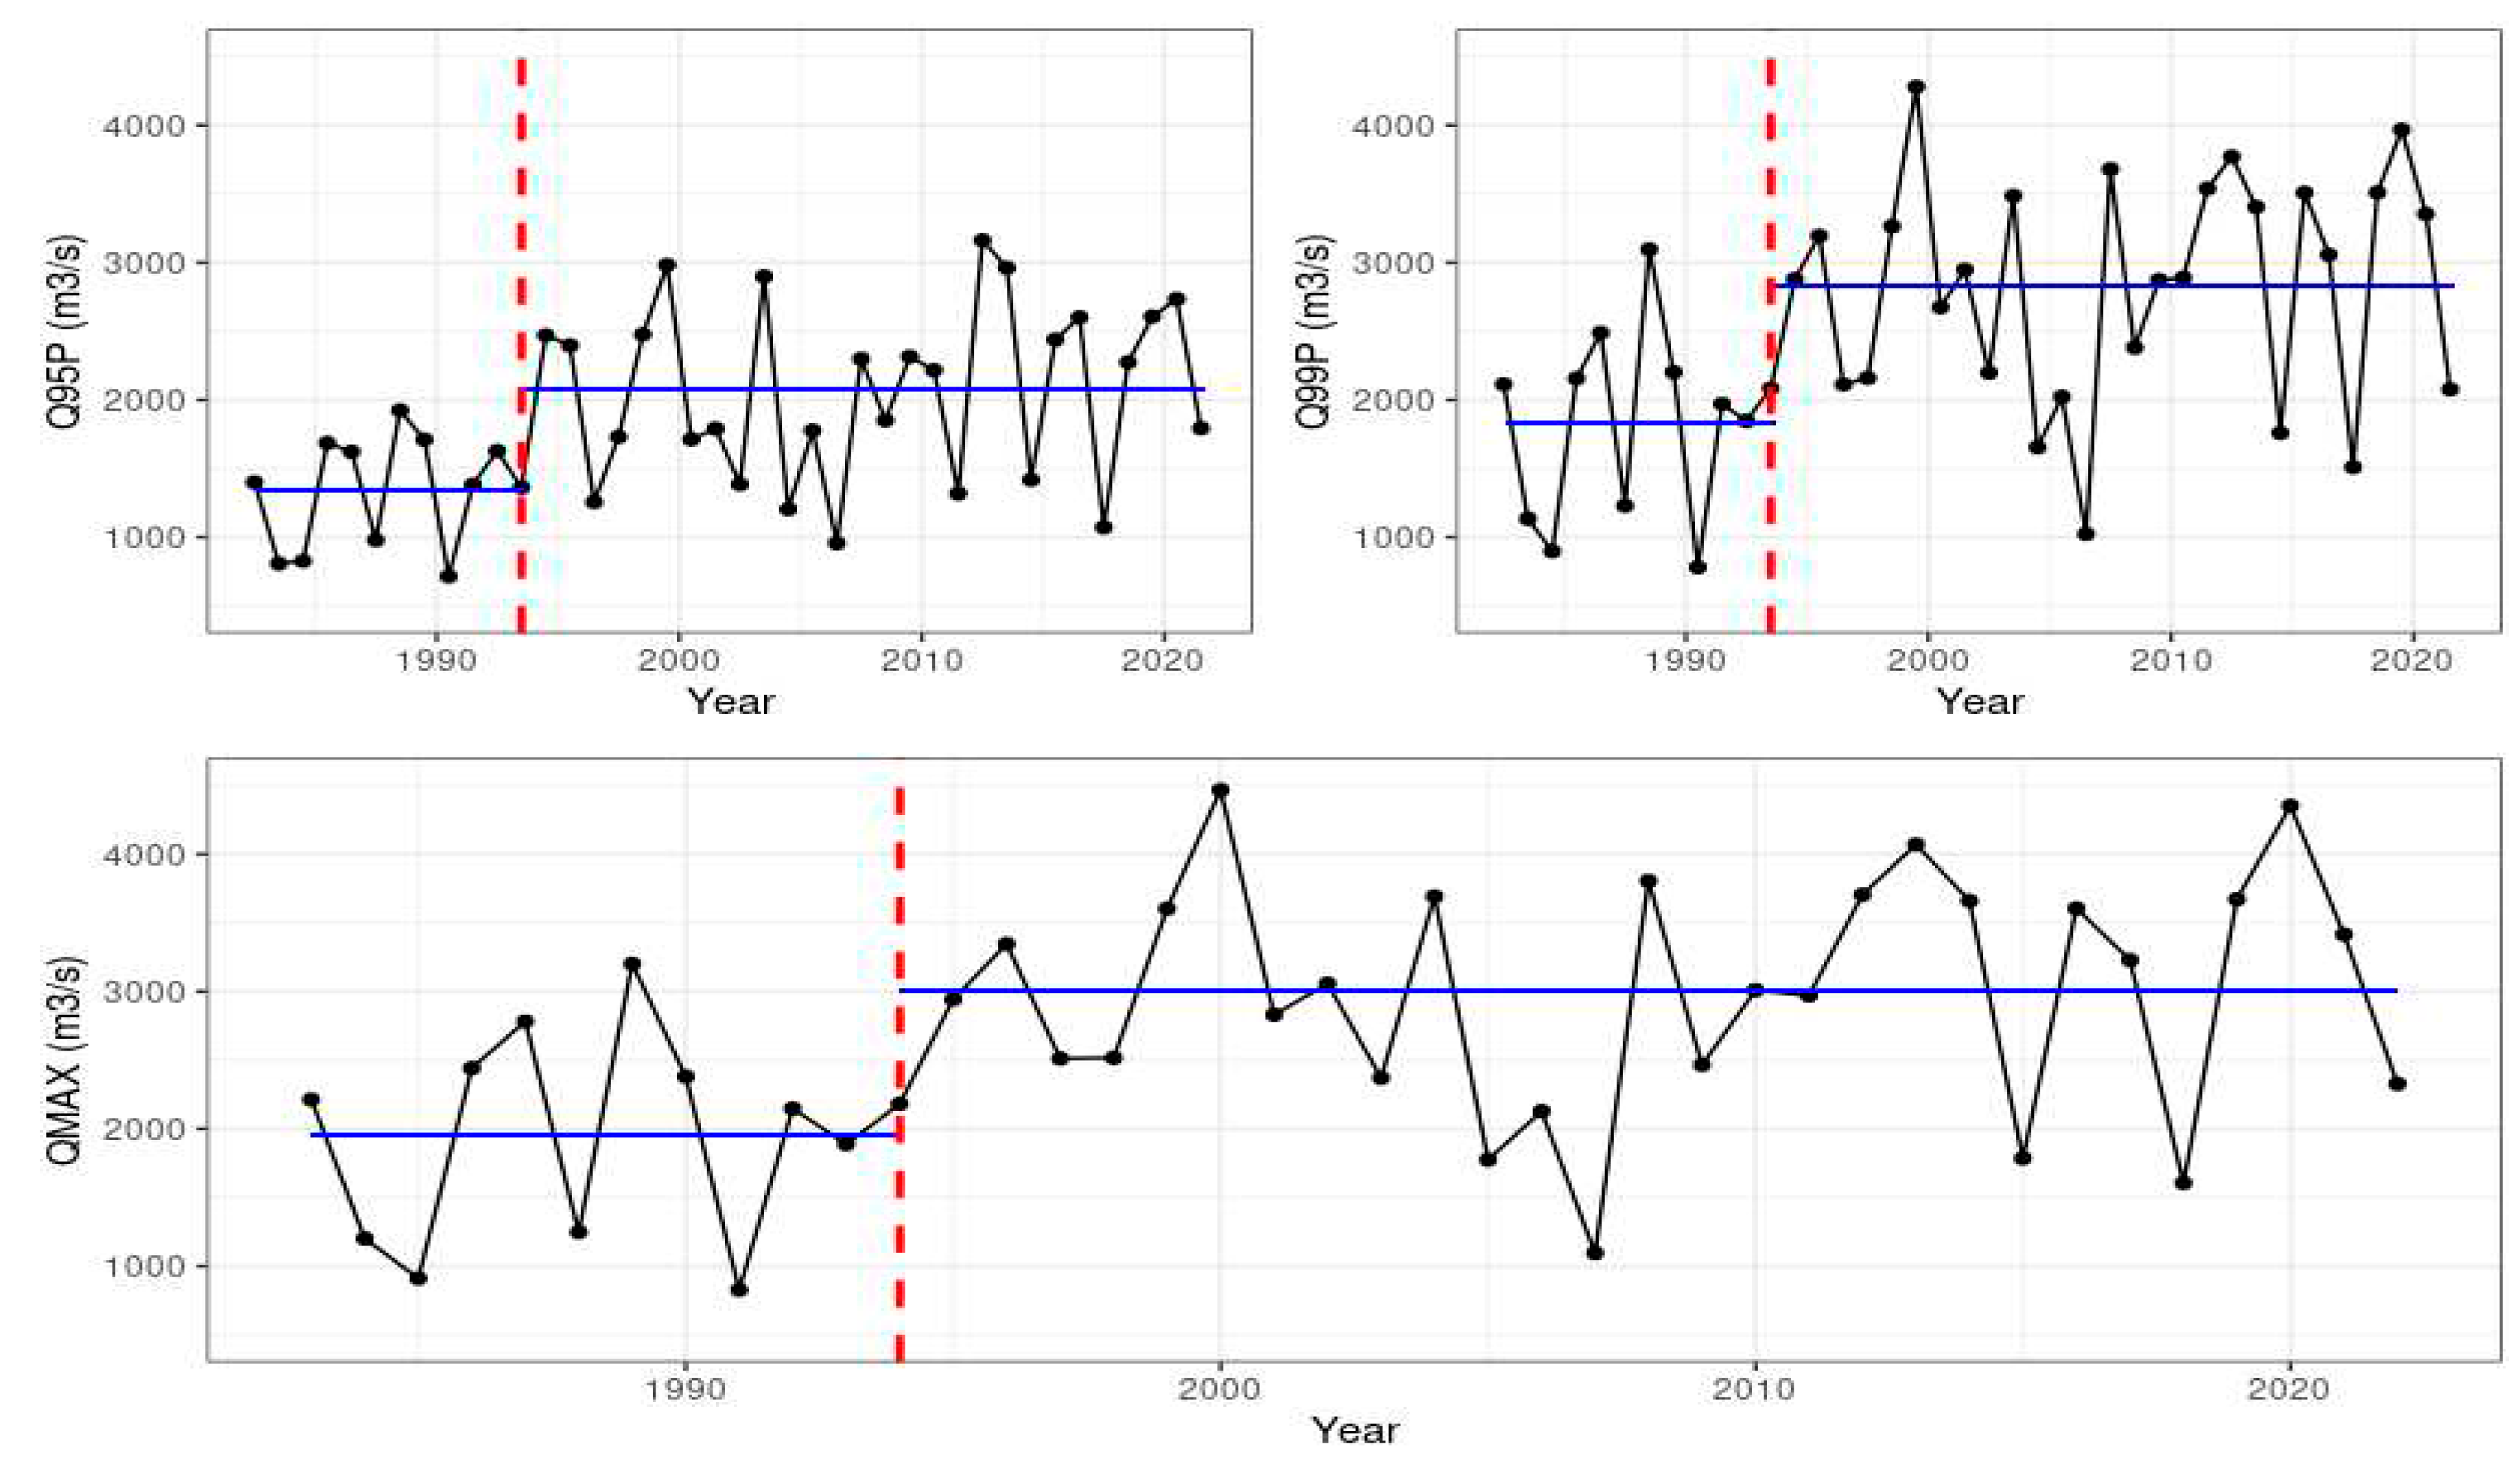

Table 1.
Rainfall stations data.
| Rainfall Station Name | Longitude | Latitude | Country located |
|---|---|---|---|
| Saint Louis | -16.45 | 16.05 | Senegal |
| Dagana | -15.5 | 16.52 | Senegal |
| Podor | -14.97 | 16.65 | Senegal |
| Matam | -13.25 | 15.65 | Senegal |
| Bakel | -12.47 | 14.90 | Senegal |
| Saraya | -11.78 | 12.78 | Senegal |
| Siguiri | -9.17 | 11.43 | Guinea |
| Labe | -12.30 | 11.32 | Guinea |
| Tougue | -11.66 | 11.43 | Guinea |
| Mamou | -12.08 | 10.37 | Guinea |
| Toukoto | -9.90 | 13.45 | Mali |
| Bafing-makana | -10.25 | 12.55 | Mali |
| Daka saidiou | -10.61 | 11.95 | Mali |
| Kita | -9.47 | 13.07 | Mali |
| Falea | -11.82 | 12.26 | Mali |
Table 2.
River discharge station used.
| Discharge station Name | Longitude | Latitude |
|---|---|---|
| Bakel | -12.45 | 14.9 |
| Kidira | -12.21 | 14.45 |
| Oualia | -10.38 | 13.6 |
| Bafing-makana | -10.28 | 12.55 |
Table 3.
Comparative statistical analysis between CHRIPS and station-based rainfall data.
| Statistical Indicators | ||
|---|---|---|
| Stations | NSE | Correlation Coefficient |
| Saint-Louis | 0.98 | 0.99 |
| Dagana | 0.93 | 0.97 |
| Podor | 0.96 | 0.99 |
| Matam | 0.98 | 0.99 |
| Bakel | 0.96 | 0.98 |
| Saraya | 0.99 | 0.99 |
| Kita | 0.96 | 0.99 |
| Falea | 0.97 | 0.98 |
| Tokoto | 0.97 | 0.95 |
| Daka saidou | 0.89 | 0.97 |
| Bafing-Makana | 0.95 | 0.99 |
| Mamou | 0.90 | 0.99 |
| Tougue | 0.85 | 0.96 |
| Labe | 0.96 | 0.99 |
| Siguiri | 0.89 | 0.96 |
Table 4.
Extreme precipitation and flow indices applied in this study.
| Index | Index Name | Index Definitions | Units |
|---|---|---|---|
| SDII | Simple daily rainfall index | The ratio of annual total rainfall to the number of wet days | mm/day |
| RX5day | Max 5-day rainfall | Annual maximum consecutive 5- day rainfall | mm |
| R95p | Very wet days | Total annual rainfall accumulated above the 95th percentile of 1982–2021 |
mm |
| R99p | extremely wet day | Total annual rainfall accumulated above the 95th percentile of 1982–2021 |
mm |
| Qmax | Peak discharge | Annual maximum discharge in 1982 - 2021 | m3/s |
| Q95p | High flow days | Annual total stream flow from days > 95th percentile of 1982-2021 | m3/s |
| Q99p | Very high flow days | Annual total stream flow from days > 99th percentile of 1982-2021 | m3/s |
Table 5.
Modifier Mann-Kendall test and Sen's slope estimation.
| Indices | P-value | Zc | Sen’s slope | Tau | Var |
|---|---|---|---|---|---|
| R95P | 47E-25 | 10.33 | 0.079 | 0.34 | 667.00 |
| R99P | 99E-9 | 5.73 | 0.098 | 0.23 | 997.35 |
| SDII | 11E-9 | 6.08 | 0.024 | 0.22 | 826.80 |
| RX5DAY | 22E-3 | 3.05 | 0.067 | 0.096 | 587.97 |
Table 6.
Break point related to extremes precipitation indices in the SRB for the period 1982 to 2021.
Table 6.
Break point related to extremes precipitation indices in the SRB for the period 1982 to 2021.
| Index | P-value | Break point |
|---|---|---|
| R95p | 0.020 | 2007 |
| R99p | 0.2625 | 2006 |
| SDII | 0.078 | 2007 |
| RX5DAY | 1 | 2006 |
Table 7.
Sen’s slope and modifier Mann Kendall test on extreme flow.
| Indices | P-Value | Zc | Sen’s slope | Tau | Var(s) |
|---|---|---|---|---|---|
| Q95P | 22 E-17 | 8.48 | 29.23 | 0.33 | 946.912 |
| Q99P | 33 E-14 | 7.58 | 37.49 | 0.31 | 1060 |
| Qmax | 13E-12 | 7.08 | 38.35 | 0.30 | 1137.5 |
Table 8.
Breakpoints related to extreme flow indices for the period 1982-2021.
| Indices | Pettit’s test | SNHT | ||
|---|---|---|---|---|
| P-value | Break point | P-value | Break point | |
| Q95p | 0.0239 | 1993 | 0.0153 | 1993 |
| Q99p | 0.04125 | 1993 | 0.01795 | 1993 |
| QMAX | 0.02804 | 1993 | 0.01735 | 1993 |
Disclaimer/Publisher’s Note: The statements, opinions and data contained in all publications are solely those of the individual author(s) and contributor(s) and not of MDPI and/or the editor(s). MDPI and/or the editor(s) disclaim responsibility for any injury to people or property resulting from any ideas, methods, instructions or products referred to in the content. |
© 2023 by the authors. Licensee MDPI, Basel, Switzerland. This article is an open access article distributed under the terms and conditions of the Creative Commons Attribution (CC BY) license (http://creativecommons.org/licenses/by/4.0/).
Copyright: This open access article is published under a Creative Commons CC BY 4.0 license, which permit the free download, distribution, and reuse, provided that the author and preprint are cited in any reuse.


