Submitted:
08 August 2023
Posted:
09 August 2023
You are already at the latest version
Abstract
Water scarcity is a worldwide concern, considering that water is a limited resource and essential for life. In Brazil, approximately 30% of its population lives in one of the areas that most suffer from lack of water, the semi-arid region covering about 20% of the country's territorial extension. The lack of water, mainly in the northeast of the country, has been a problem for years, where people who live in this territory have been suffering for months from the lack of water and the poor distribution of the resource, which increases the degree of inequality between the regions of the country. The research aims to show the effect of the hydrological cycle on the quality of vegetation and how such processing can end up affecting people's lives and the environment. The municipality of Floresta is within the scope of sub-basin 73, the territory is part of the municipalities benefited from the PISF- São Francisco River integration project works, and the study has raised discussion on the part of the scientific community regarding the effectiveness of the population project and the possible risks caused to the environment. This study carried out a temporal analysis, 1961-2021, to investigate water availability and how the hydrological system can affect society, raising the degree of its importance for a better quality of life and consequently reducing hydric inequalities. It was also evaluated how climate changes can interfere with these environmental changes and the quality of life at the local scale. The hydrological model system used to assess water availability was the Pernambuco Hydrological Response Units SUPer-System. In addition, this system helped to understand the changes that occurred in the studied sub-basin. Yet was used UAV-Unmanned Aerial Vehicles to view relationship between lives in house and environment conditions. The study can obtain accurate and necessary information to understand the dynamics of the hydrological system and the possible changes of social hydric inequalities. Thus, it is concluded that climate change will have different impacts on small scales and lives conditions due to different characteristic's environment. It is very important to carry out studies on a detailed scale to provide better public policies for mitigating the effects of climate change on people's lives.
Keywords:
social inequalities
; water dynamics
; São Francisco River
; Climate change.
1. Introduction
Water scarcity is a worldwide concern, given that water is a limited resource and essential for life. In Brazil, approximately 30% of its population lives in one of the areas that most suffer from lack of water semi-arid region covers about 20% of the country's territorial extension. The lack of water, mainly in the northeast of the country, has been a problem for years, were people who live in this territory suffer for months from the lack of water and the poor distribution of the resource, which increases the degree of inequality between the regions of the country. Bringing water security to the hinterland has always been one of the guidelines raised by the management bodies, the São Francisco River Integration Project with the Hydrographic Basins - PISF, has become the investment to ensure the mitigation of the effect of drought on the life of the northeastern population.
The hydrological model Soil Water Assessment Tools- SWAT is very widespread in Brazil and due to the need for adjustments in the results obtained through modeling and observed data, it is necessary to carry out a calibration. Different studies have been developed to calibrate the swat model to Brazil, Tretin, Laurent and Robaina, 2023, Rodrigues et al., (2021), Martins et al., (2020), Castro e Machado (2019), northeast of Brazil, Nascimento e Silva (2018), and for the Pernambuco basins. Paz et al., (2018), Viana et al., (2018), Viana et al., (2019), Brito et al., (2021), Lins et al., (2021), Paz et al., (2022), Paz, Holanda e Galvincio (2022), Souza et al., (2022), Farias et al., (2023). The intention was and is being to provide a system that can facilitate the monitoring and planning of watersheds. This system is called SUPer- System of Hydrological Response Units for Pernambuco, Galvincio (2021), Galvincio and Luz (2021), Galvincio and Luz (2022), Torres et al., (2022), Tiburcio et al., (2023).
Watersheds can be qualified as natural systems that play a crucial role in the hydrological cycle. It is important to emphasize that water flow may be the most important component of the hydrological cycle and that it may be influenced by climate change and human activities (Mikaeilli &Shourian, 2022). Climate change and human activities are determining factors in the quantity and quality of water, analyzing these two factors is extremely important in the formulation of public policies, (Cão et. al, 2022). In Brazil, to implement what is foreseen in the Water Law, the River Basin Committees (CBHs) were created (Majeski, Trindade, 2023). The committees are made up of individuals with different interests, such committees defend, analyze and discuss the deliberation of the programs that are included in the Basin Plans, an important initiative for the entire civil community. A hydrographic basin is responsible for receiving rainwater that falls on the surface, which can be captured and stored in reservoirs, lakes, soil and underground aquifers, as shown by Luz & Galvincio, 2022.
Studies that analyze the behavior of precipitation and flow in a watershed have drawn the attention of researchers around the world (Rosin, Amorim, Morais, 2015). The amount and distribution of precipitation over time is extremely important to determine the flow regime of rivers, which directly interferes with water availability. Studies such as Ferreira and Valverde 2022, explain the importance of precipitation coupled with extreme events that directly affect the life of the population of a given watershed. Another very relevant process within the hydrological cycle is evapotranspiration. Becoming the second most important variable within the hydrological cycle (Rocha et., al 2021). When the atmospheric demand for evapotranspiration (ET) is greater than the supply of precipitation, there will be an indicator of water deficit which can help to generate problems of social vulnerability through the reduction of water and the limitation of its access (Eakin, Lemos, Nelson 2014). Understanding the quantification of ET is necessary to understand the process of interactions between energy from the atmosphere and the Earth's surface and regional water balances in watersheds (Andrade et., al 2020). The São Francisco River Integration Project (PISF) was carried out by the Ministry of National Integration (Santos, Pedrozo, Ioris. 2022). One of the most important works in the semi-arid region to generate water security, with all part of the scientific community raising discussions about the effectiveness of the project. Regarding the physical aspect of the PISF, it consists of the construction of the two axes that integrate the São Francisco River with the intermittent hydrographic basins, the NORTH and EAST axis (Costa, Ojima 2022). The arrival of water from the Velho Chico, via the east axis, led to an expectation of a possible abundance of water access for the municipalities that are part of the channel (Silva, Almeida, 2021).
The research aims to show the effect of the hydrological cycle on the quality of vegetation and how such processing can end up affecting people's lives and the environment. In this study, 61 years of data were used on the daily scale, period 2016-2021. To warm up the SWAT-Soil Water Assessment Tools model, five years were used. The SWAT model used for water balance modeling was the 2012 version.
2. Materials and Methods
Area study
The hydrographic basin under study has an area of 236.02 km 2. It is a sub-basin of the Pajeu hydrographic basin. This area is in the hinterland of Pernambuco with semi-arid weather conditions, Figure 1. It is located next to the São Francisco River and is under the impact of the transposition of the São Francisco River. Part of its basin covers indigenous areas, Figure 1B.
Neste estudo foram utilizados 61 anos de dados na escala diária, período de 2016-2021. Para aquecimento do modelo SWAT-Soil Water Assessment Tools foram utilizados cinco anos. O modelo SWAT usado para modelagem do balanço hídrico foi a versão 2012.
In this study, the SUPer system (System of Hydrological Response Units for Pernambuco) was used, https://super.hawqs.tamu.edu/. SUPer is a simulation model for the quantification and quality of water in the basin. More detail for SUPER can see in Galvincio and Luz (2022), Tiburcio et al., (2023), Farias et al., (2023).
The methodological basis of SUPer is the SWAT. SUPer has been used to simulate numerous basins in the state of Pernambuco for soil and water resource assessments. SUPer is an efficient model that continuously simulates a wide variety of watershed processes for a defined recording period. SUPer allows you to estimate soil moisture in spatial and temporal detail. Thus, it is believed that the SUPer is very useful in indicating disasters that have a good relationship with the water balance and soil moisture.
In the SUPer there are several variables of the hydrological and environmental cycle. Before uploading to the SUPer system, the Pajeu river basin was calibrated using the SWAT model. This result is not yet published. Because of this, here, we validated the SUPer data with observed data. To evaluate the calibration of the model, the determination coefficient was used. We used average monthly values simulated and observed in Floresta long -38.64 and lat -8.61. The station code is 48860000. Observed data period 01/01/1968 to 31/12/1991 was used to evaluate SWAT model calibrated. Floresta municipality was chosen because it was the closest station to subbasin 73 under study and so the model would be better calibrated and adjusted for this area.
In the SUPer the model was run in daily scale, the set-up/warm-up was two years and SWAT model version was SWAT2012. The project in SUPer to subbasin 73 has HRU-Hydrology Response Unit has seven.
The data used in this study are SW- Soil Water, PRECIP-Precipitation of the period 1961-2021.
Scenery
- Actual
- Semiárid decrease 15% rainfall and increase 2celius in temperature (climate change)
The hydrological model system used to assess water availability was the SUPer-System of Hydrological Response Units for Pernambuco. In addition, this system helped to understand the changes that occurred in the sub-basin studied. The study can obtain accurate and necessary information to understand the dynamics of the hydrological.
For a better analysis of the impacts of climate change on the environmental conditions of the vegetation, the analysis of biomass by land use was used, where SPAS-summer pasture and CRWO-cropland/woodland mosaic, soil types is RQ- Risk Quotient (represents relative activities of aerobic and anaerobic microbial metabolism) and TC - eutrophic soil and slope 0-3, 3-8, 8-20, 20-45.
In this study, aerial photography images obtained with a UAV- Unmanned Aerial Vehicles, in 2023/09/28, were used to visualize changes in vegetation and surface temperature in areas with changing conditions in the São Francisco River water diversion project. That is, an area with water entering the hydrological system.
3. Results
Calibration of the Pajeú Basin
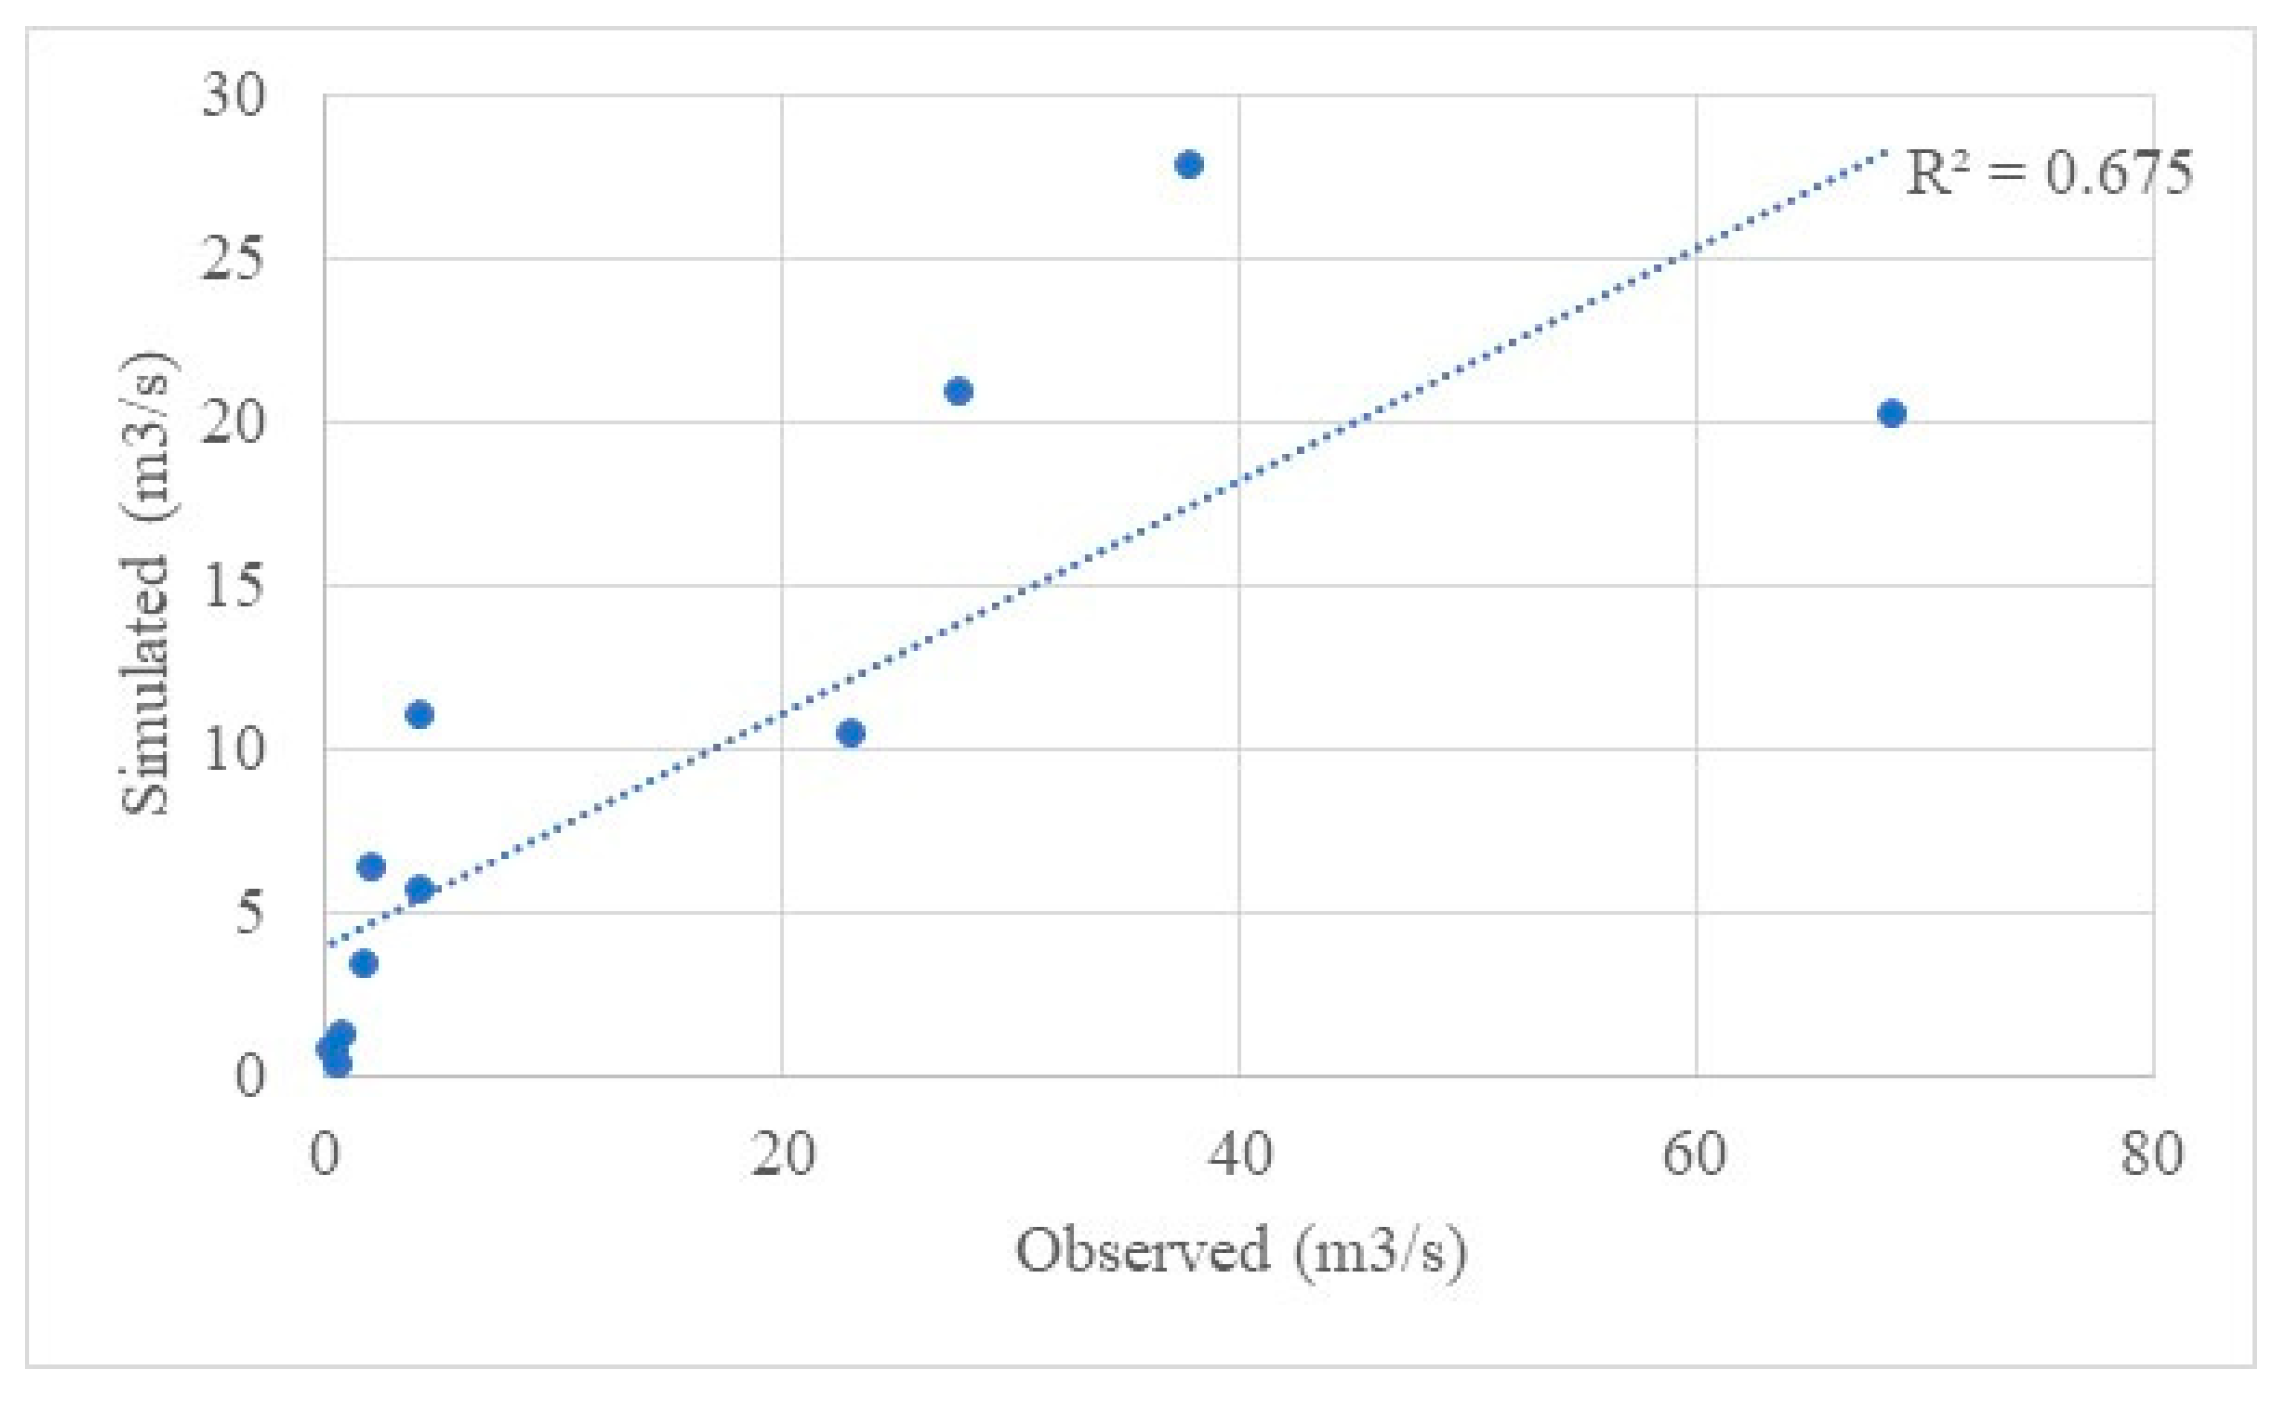
Before uploading to the SUPer system, the Pajeu river basin was calibrated using the SWAT model. It is noted that the calibration control points the model presented r2 above 0.67. Different studies have already been developed for the Pajeu basin with the aim of contributing to better management of water resources in these basins, Porto et al., (2022).
Figure 2.
Relationship between runoff observed and simulated for the Pajeu basin.
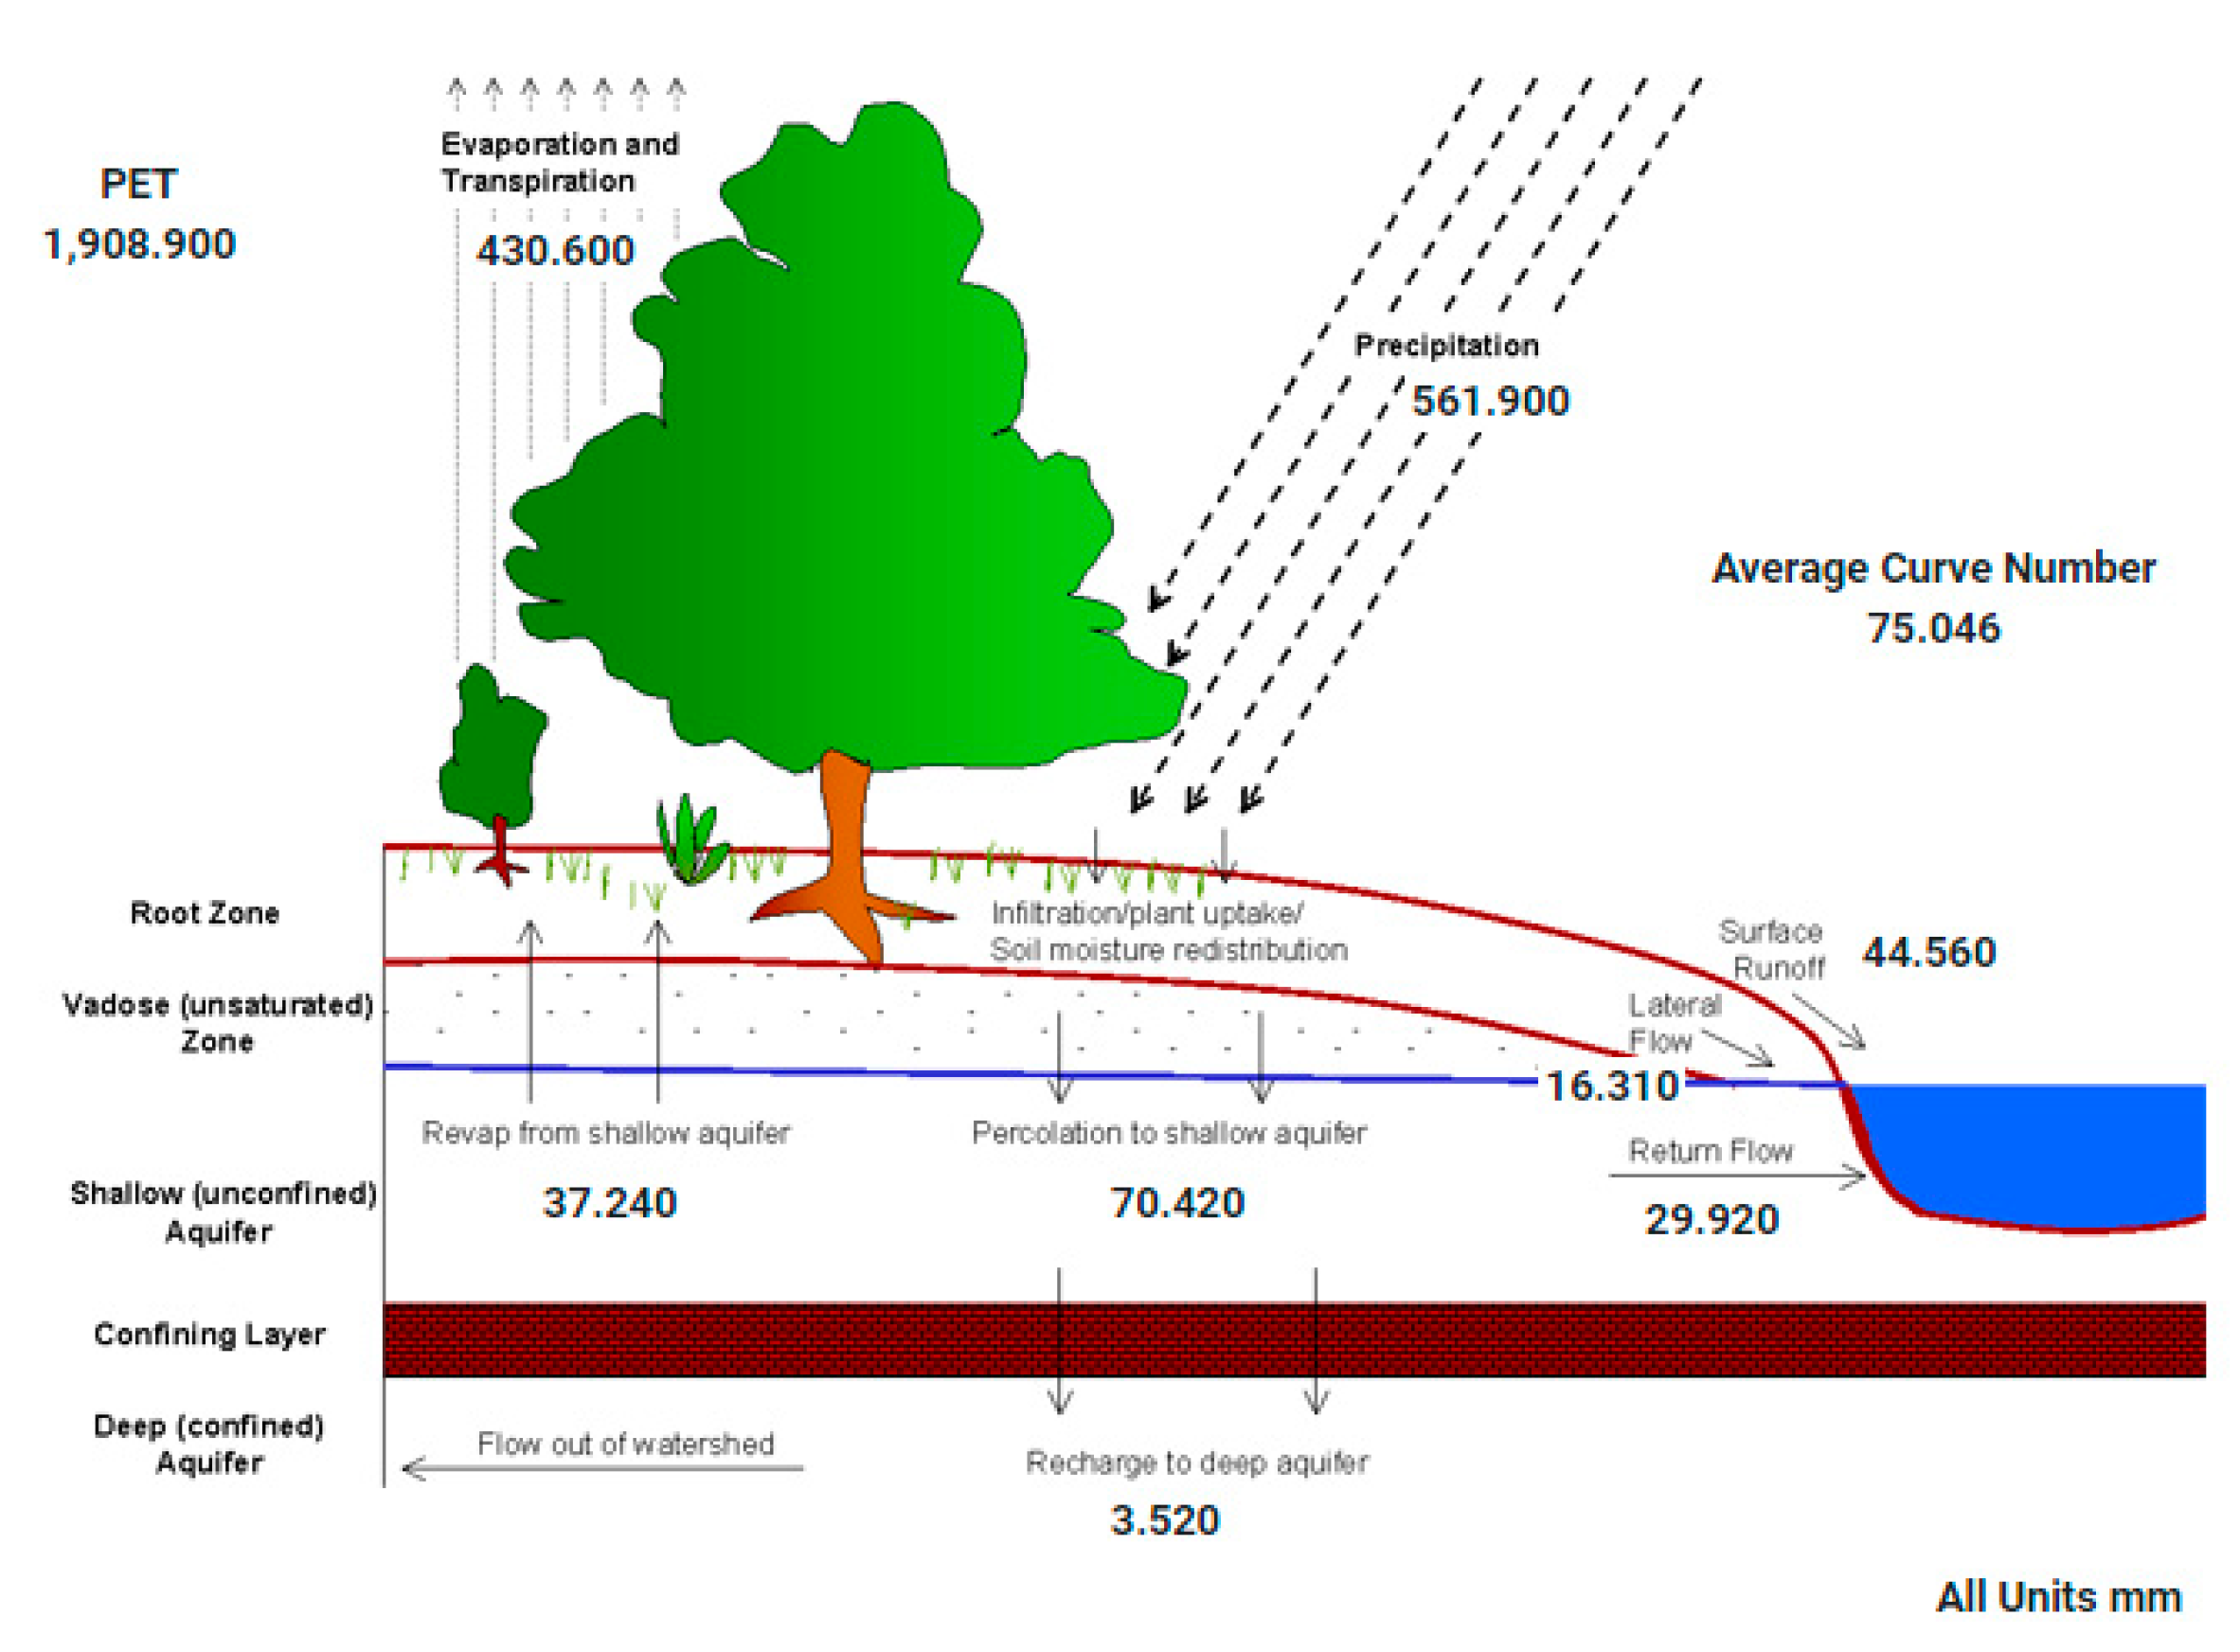
The average annual water balance of basin 73 presents an average annual precipitation of 661mm, surface runoff of 73mm, lateral flow of 20mm, return flow of 67mm, evaporation and transpiration of 459mm and potential evapotranspiration of 1788mm, Figure 3. The statistics of the average annual water balance showed in Table 1. Note that 69% of precipitation is to actual evapotranspiration. The baseflow is 55% of total flow. The baseflow is lateral flow and return flow. Total flow is 161.34 mm. In the first layers of the soil occurs infiltration/plantuptake/soil moisture redistribuition that transform in lateral flow. Streamflow is total flow. The streamflow was 24% of the precipitation. That is, 24% of precipitation is transformed into runoff. The percolation to shallow aquifer is 16% of precipitation. The baseflow is 13% of the precipitation. The surface runoff is 11% of precipitation. When we simulate climate change, the water balance is greatly altered. There is a significant decrease in baseflow, Figure 4. I draw attention to baseflow because it is very important in semi-arid areas.
Climate change
Figure 4.
Average annual water balance, climate change situation.
Actual
The 25% of the year with flow above 1m3/s, Figure 5. PISF increase in Pernambuco state 6m3/s to water security all year. But climate change decrease to 15% of year, 36 days a year, the PISF project will only serve to mitigate climate change?
Under current average annual conditions, the vegetation of subbasin 73 under study undergoes seven days of average temperature stress, 70 days of water stress, 30 days of nitrogen stress, and 43 days of phosphorus stress, Figure 6. With climate change, days with temperature stress decrease to 2, days with water stress increase to 83, days with nitrogen stress drops to 18 and days with phosphorus stress drops to 29, Figure 7. That is, it is possible to perceive a high impact on conditions of vegetation with climate change in the area. The decrease in the range of days with temperature stress can be fatal for different plant species in the area. The decrease in phosphorus and nitrogen can also impact the death of plant species. As well as the water requirement for family farming belonging to the area. These conditions, too, can impair the quality of life for people living in the area. It is important to highlight that climate changes cause different impacts according to land use, soil type and slope. For SPAS use, TC soil and slope 3-8 in this study climate change can impact increasing biomass, Figure 8. This is more evident in areas with lower slopes, Figure 9. This may be due to these areas having greater water availability. The conditions the soil, for example, soil RQ that is represents relative activities of aerobic and anaerobic microbial metabolism and with high slope showed importance increase in biomass, Figure 10 and Figure 11. The cropland/woodland mosaic, soil types is TC - eutrophic soil and slope 0-3, in this land use, in the future decrease biomass, Figure 12; Figure 13 (3-8 slope).
The biomass in subbasin 73 with conditions of CRWO- cropland/woodland mosaic, soil types is RQ- Risk Quotient and slope 3-8, Figure 14, its possible see increase to future.
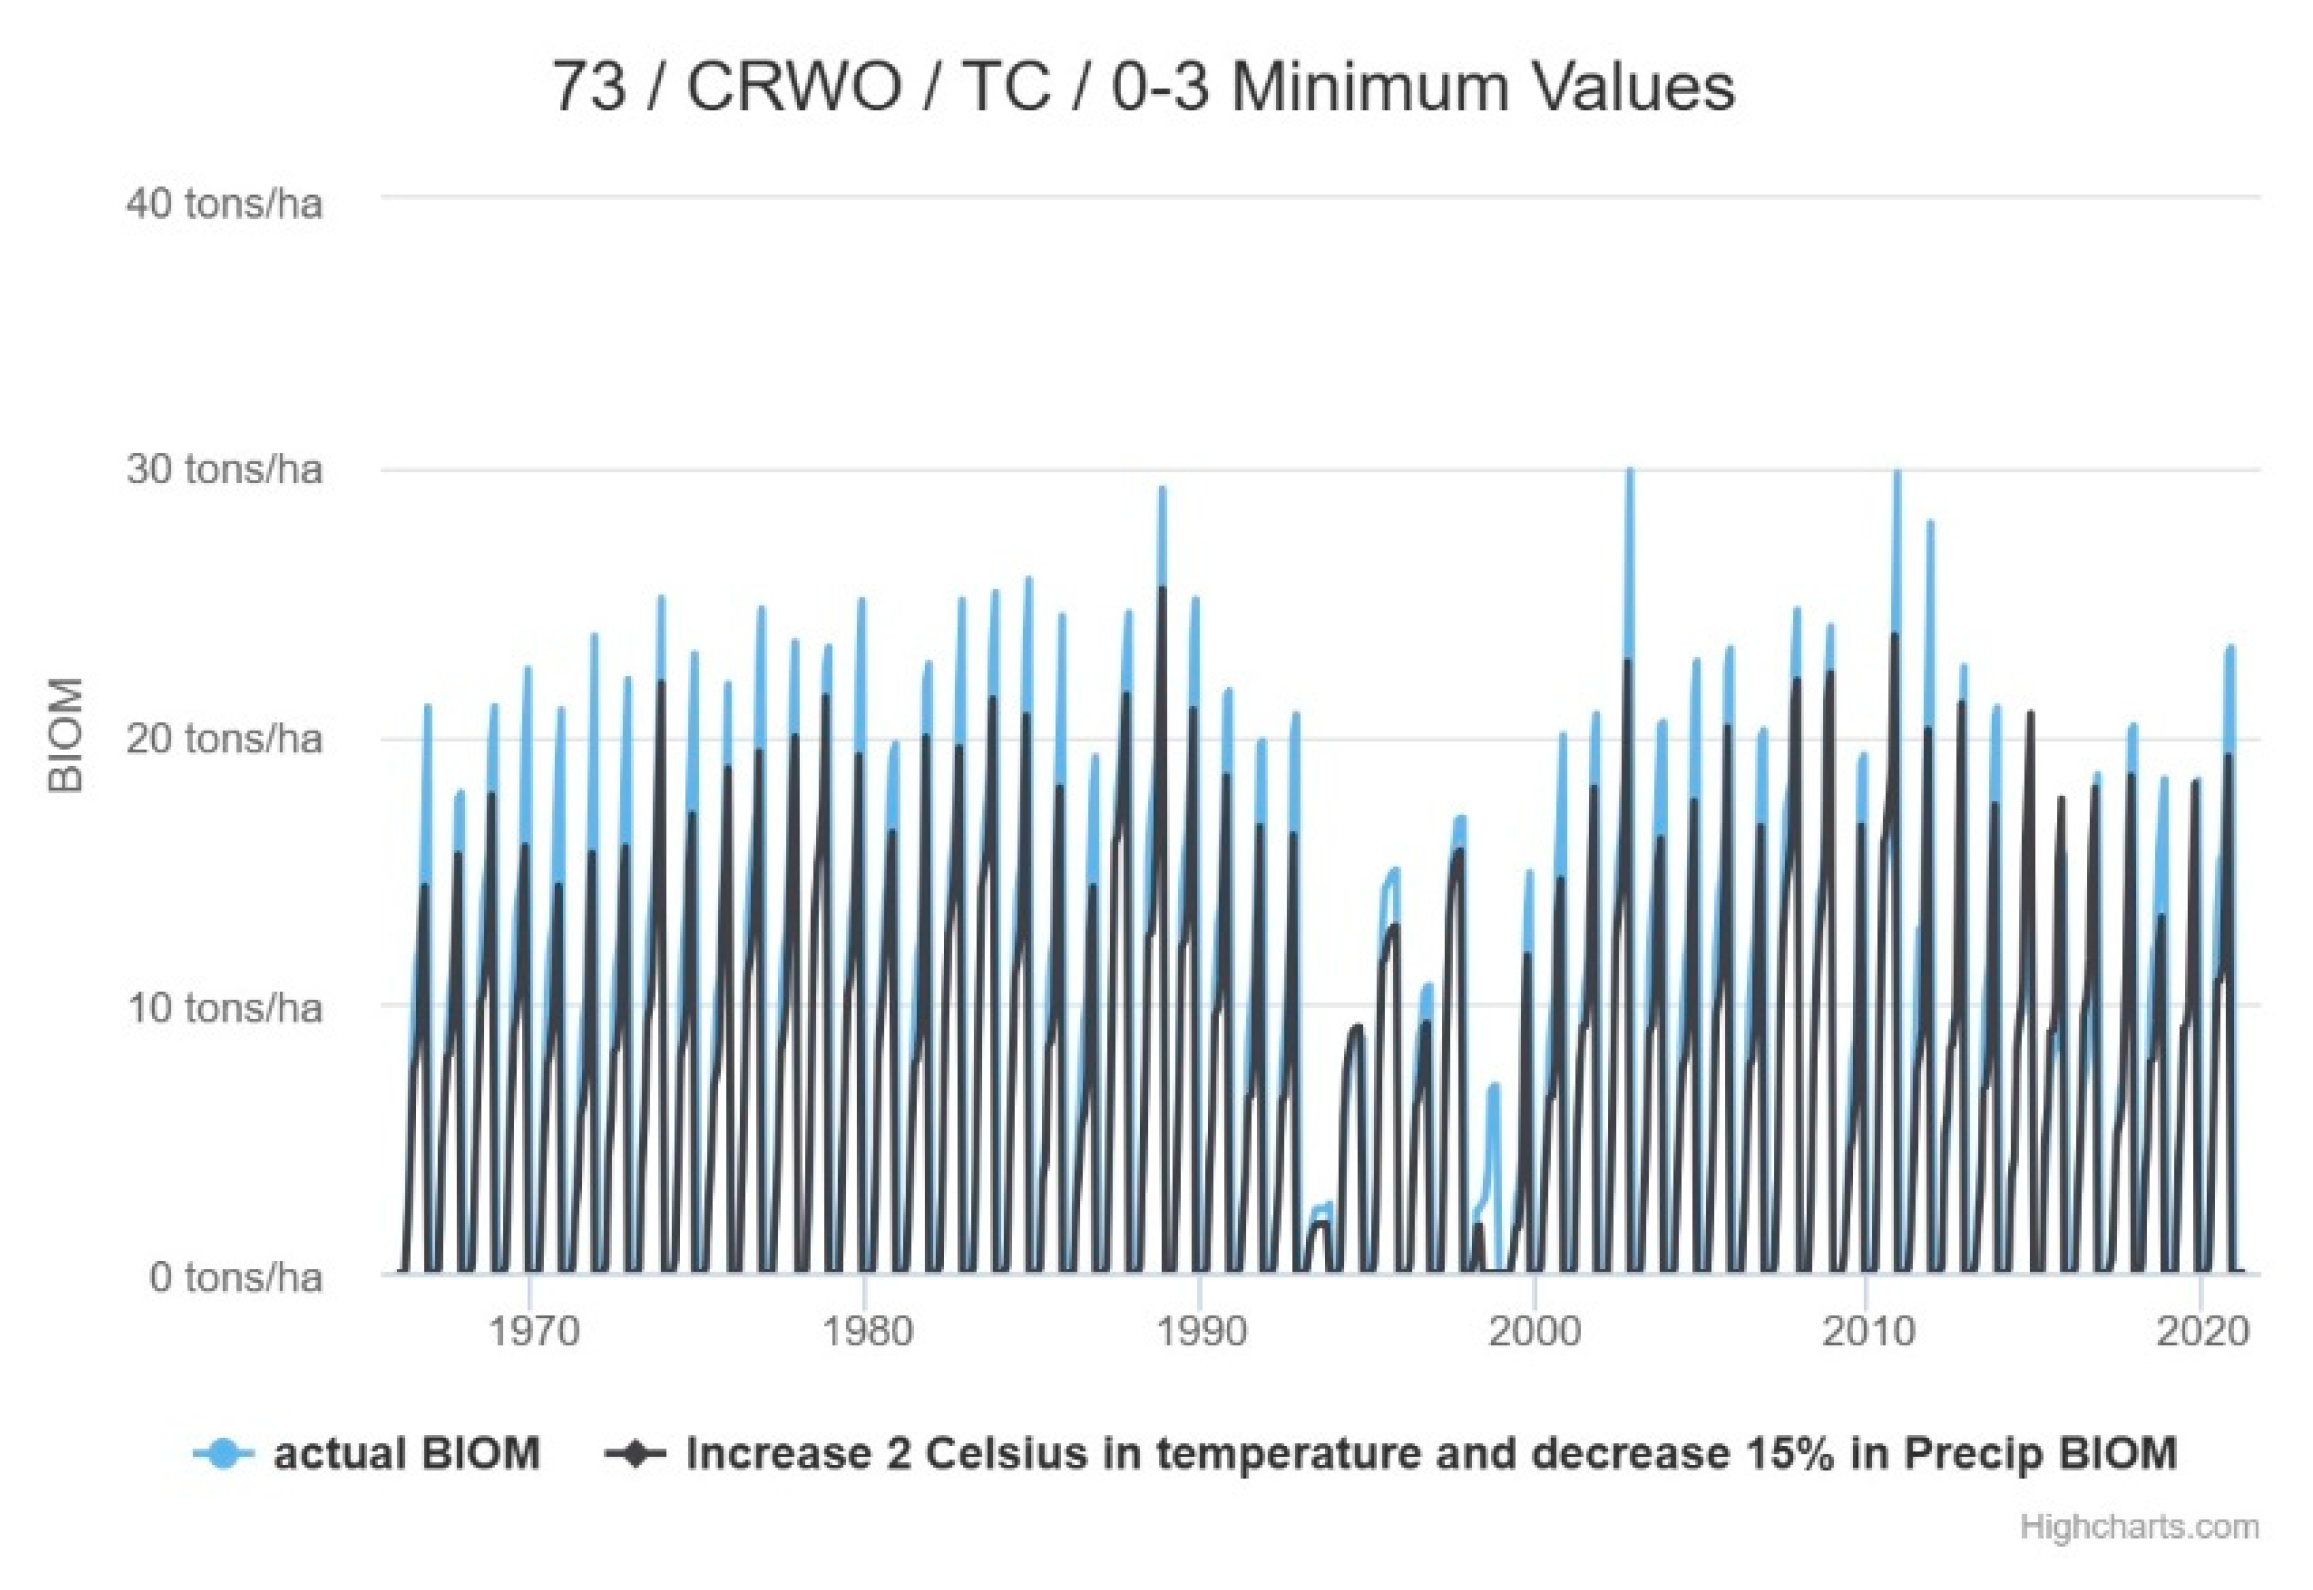
When analysis averages, minimum, and maximum, Figure 15, Figure 16 and Figure 17 for CROW has important increase biomass.
Figure 8.
Temporal variation of biomass in subbasin 73. SPAS- SPAS-summer pasture, soil types are TC - eutrophic soil and slope 3-8.
Figure 8.
Temporal variation of biomass in subbasin 73. SPAS- SPAS-summer pasture, soil types are TC - eutrophic soil and slope 3-8.

Figure 9.
Temporal variation of biomass in subbasin 73. SPAS- SPAS-summer pasture, soil types are TC - eutrophic soil and slope 0-3.
Figure 9.
Temporal variation of biomass in subbasin 73. SPAS- SPAS-summer pasture, soil types are TC - eutrophic soil and slope 0-3.
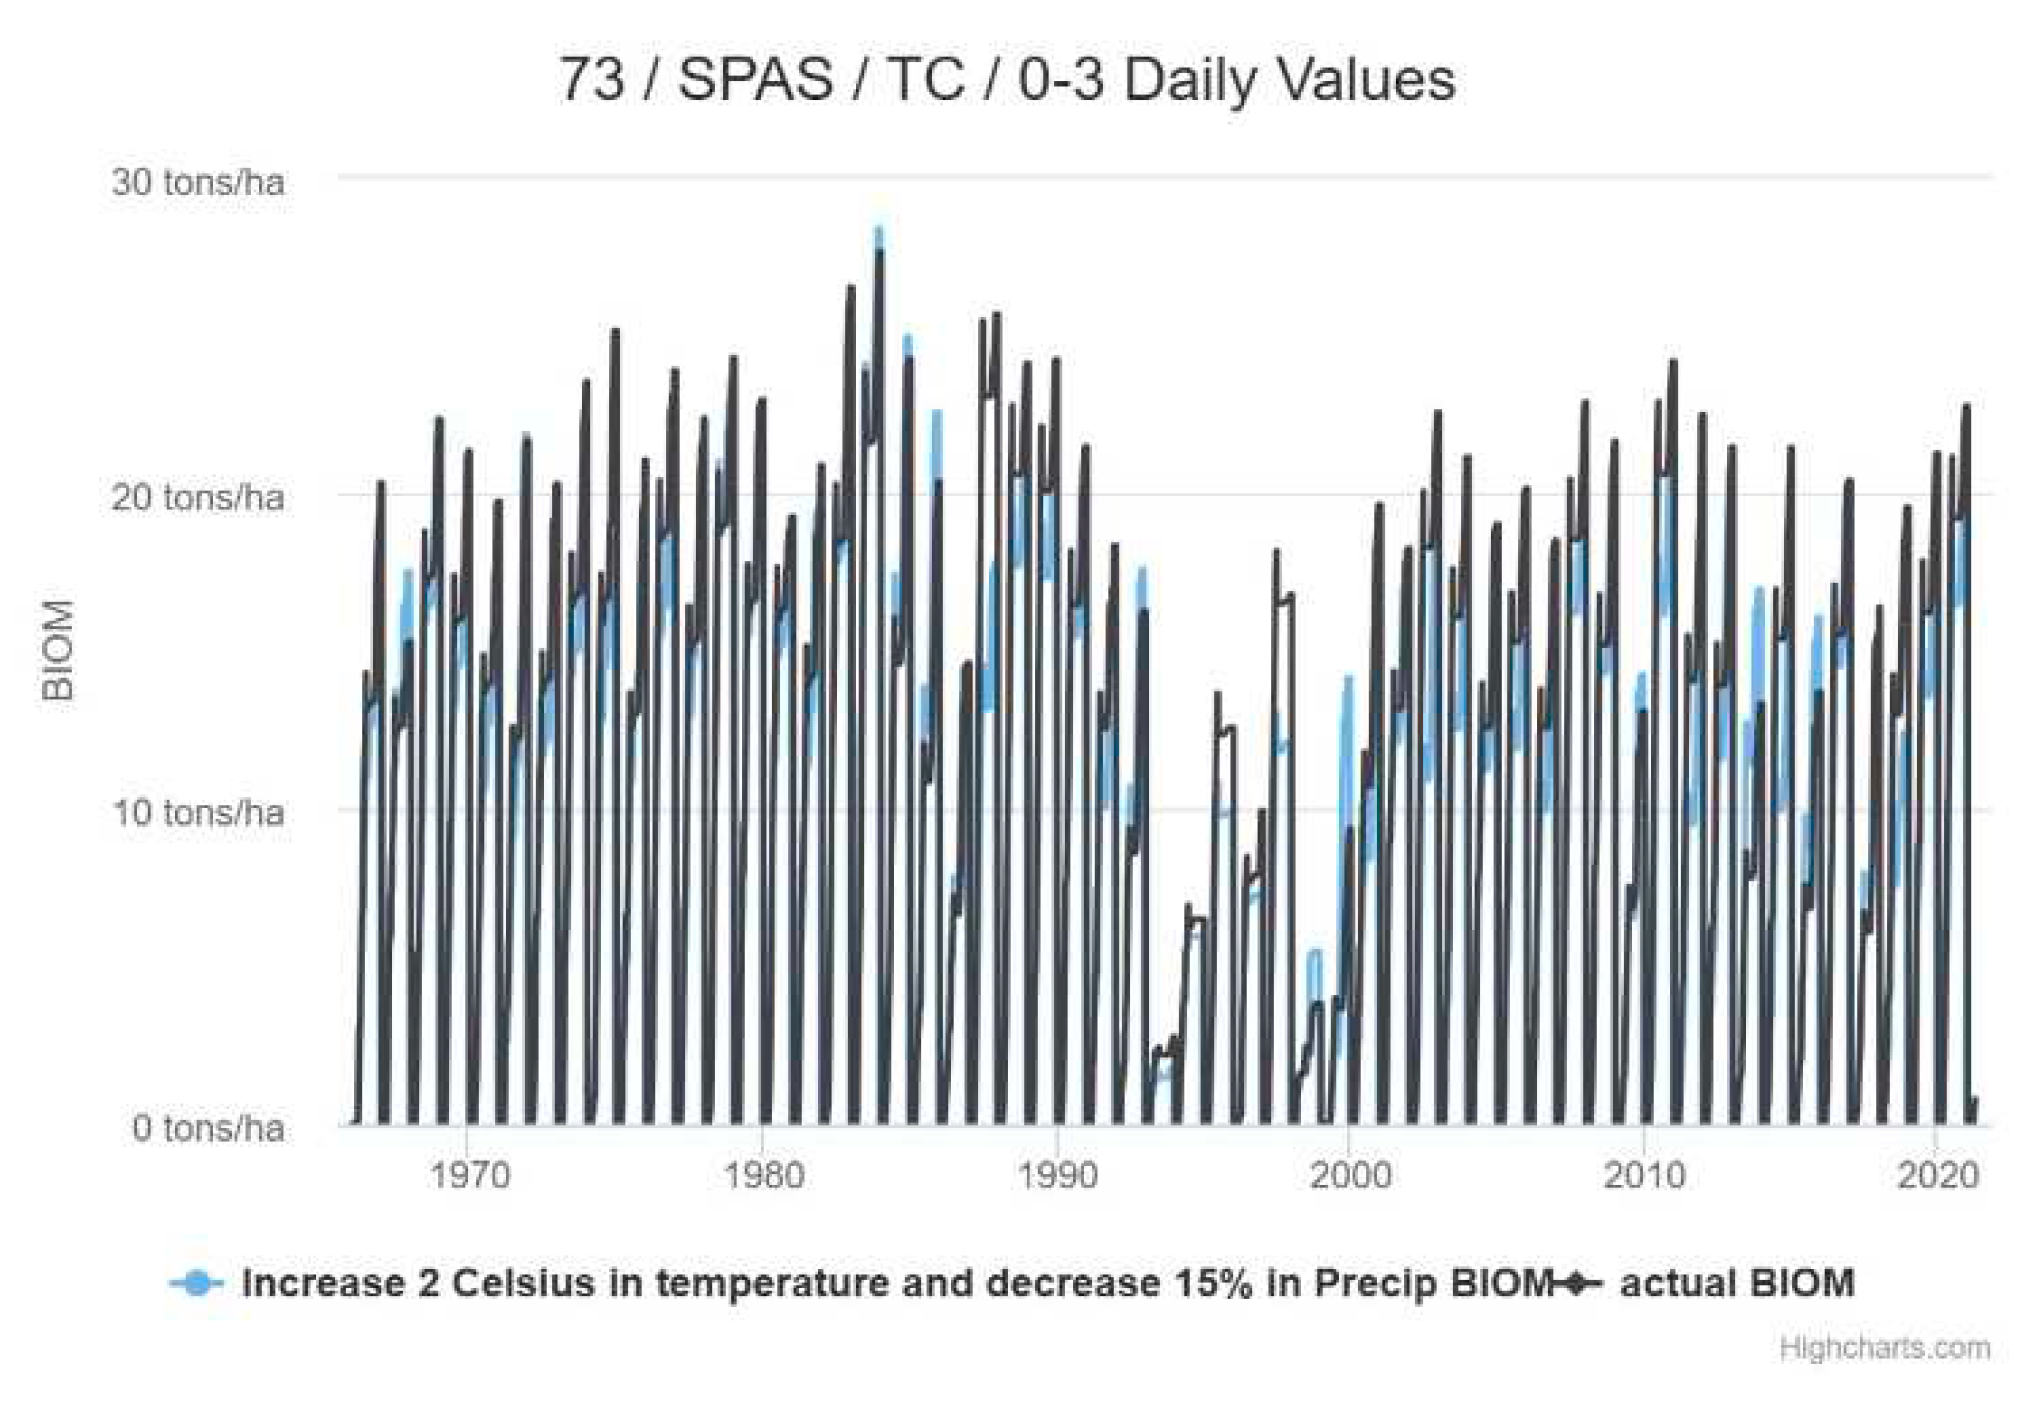
Figure 10.
Temporal variation of biomass in subbasin 73. SPAS- SPAS-summer pasture, soil types are RQ- Risk Quotient (represents relative activities of aerobic and anaerobic microbial metabolism) and slope 8-20.
Figure 10.
Temporal variation of biomass in subbasin 73. SPAS- SPAS-summer pasture, soil types are RQ- Risk Quotient (represents relative activities of aerobic and anaerobic microbial metabolism) and slope 8-20.
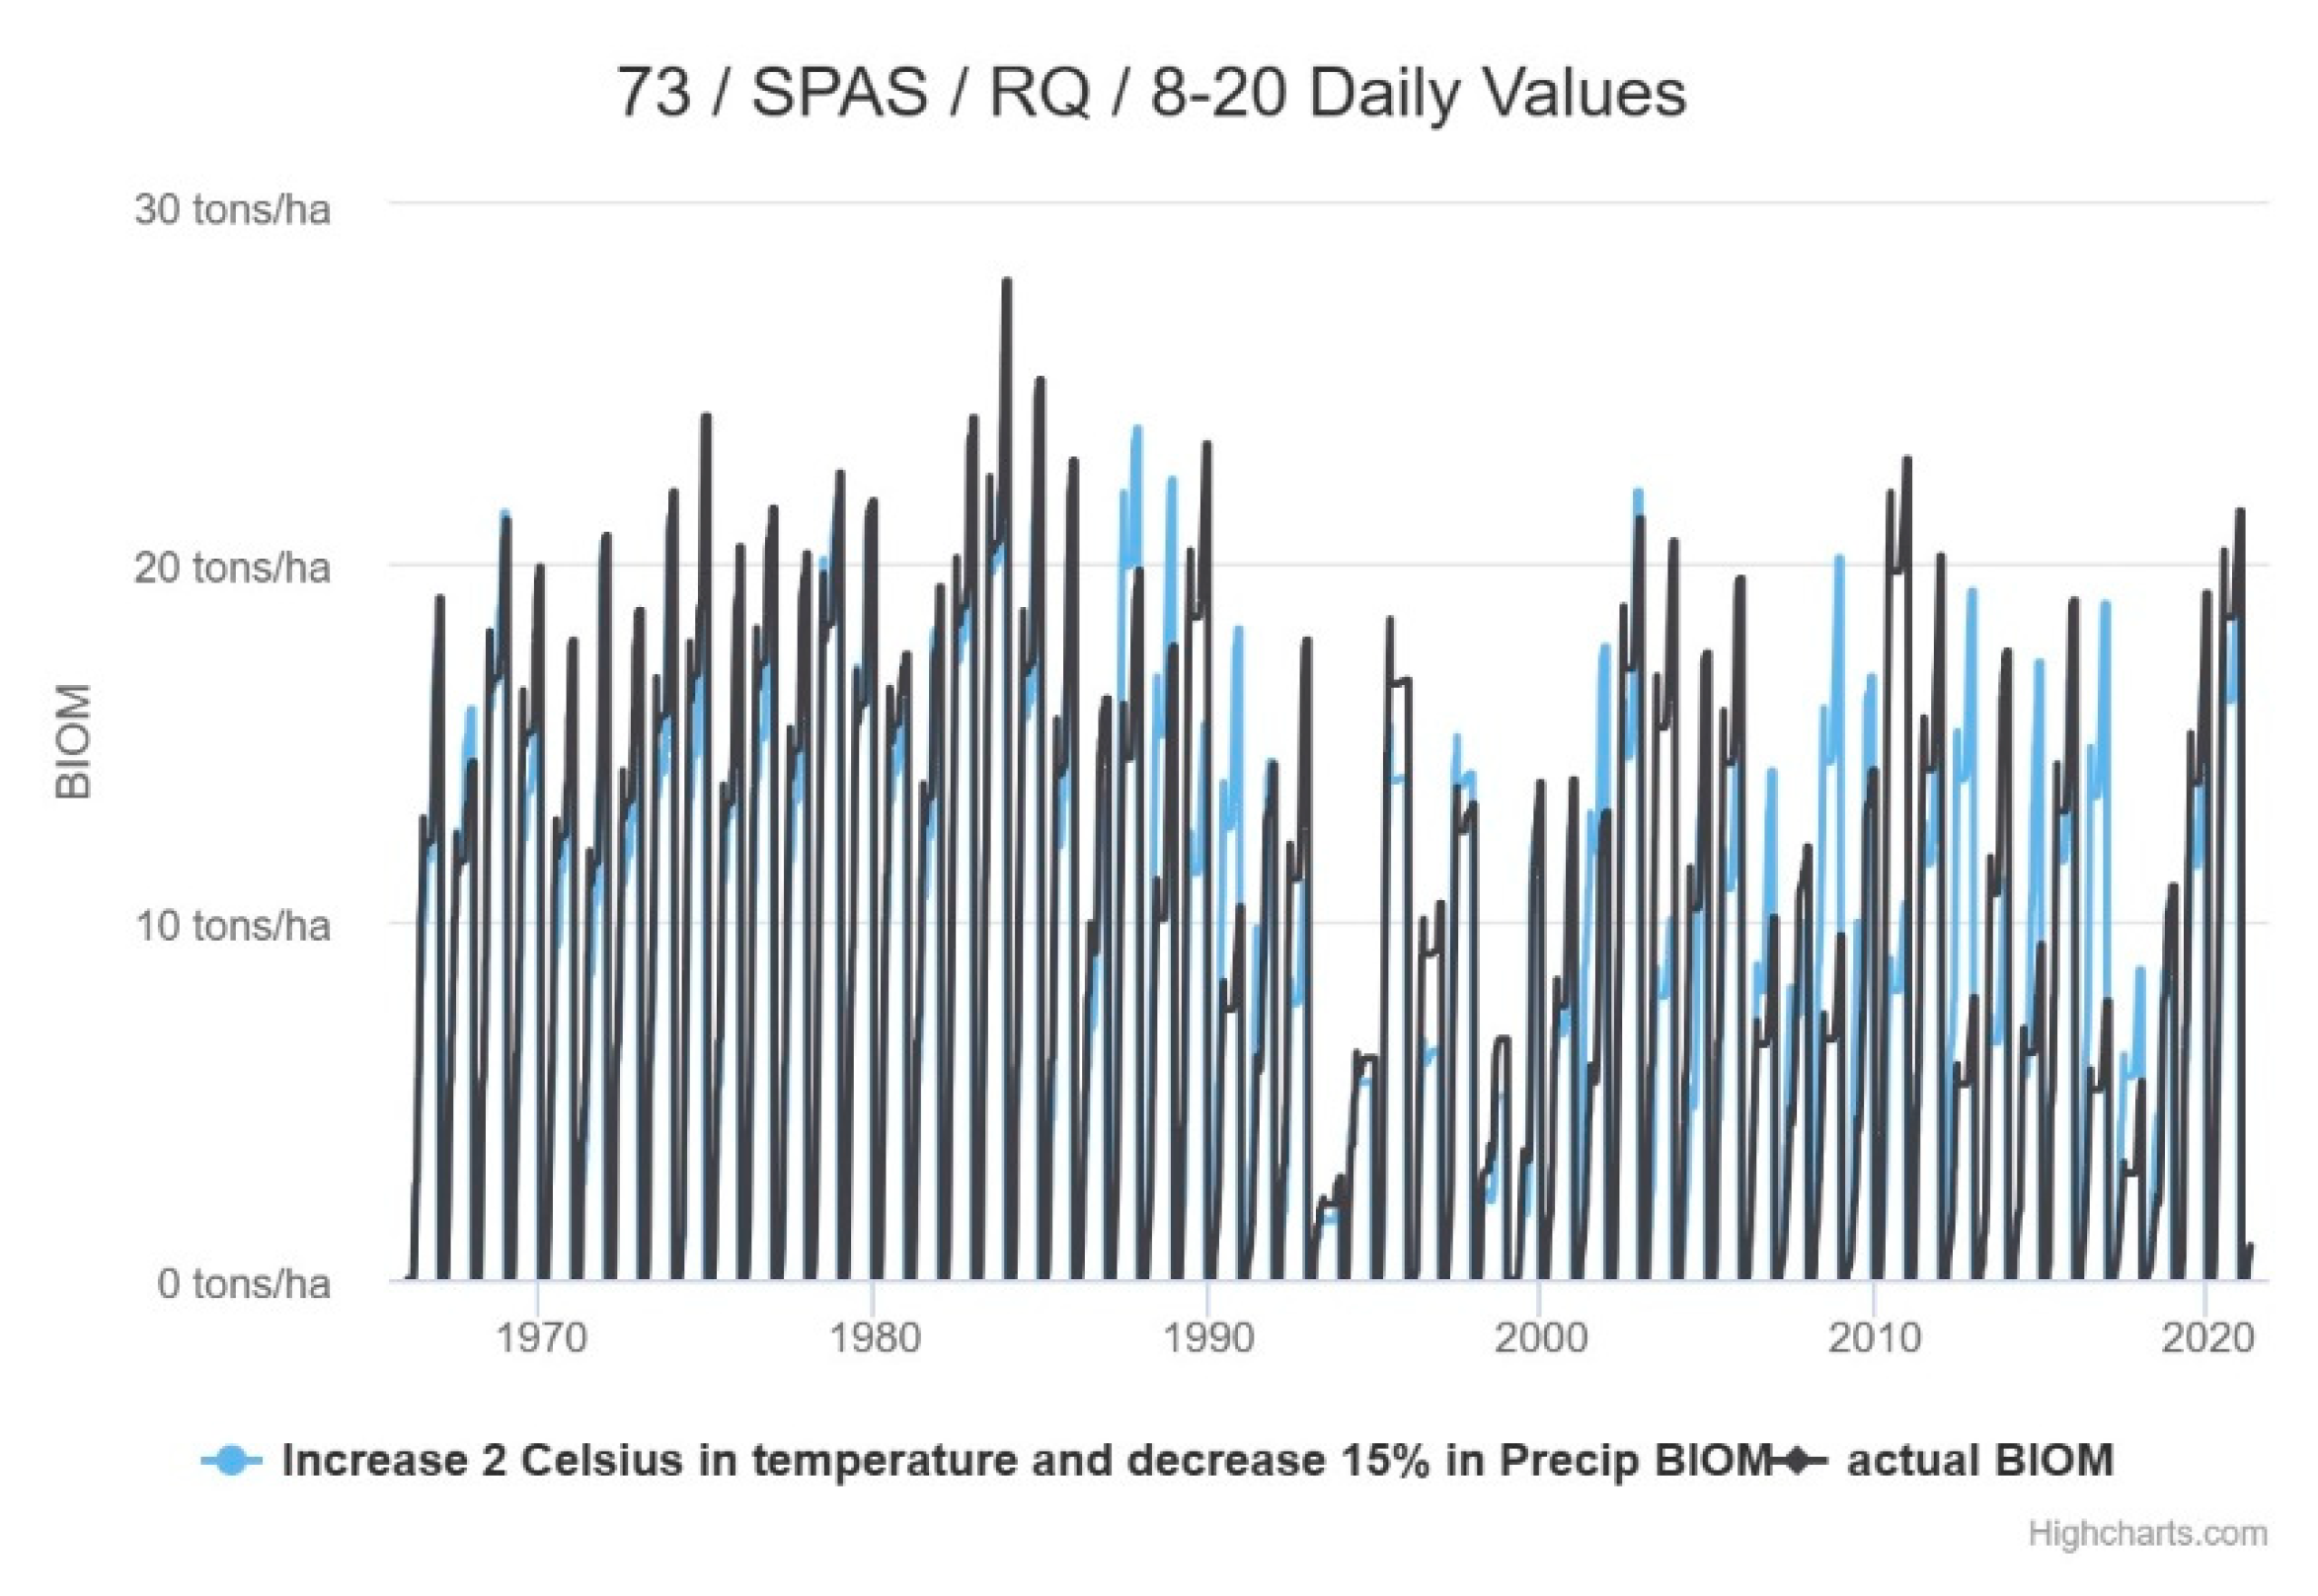
Figure 11.
Temporal variation of biomass in subbasin 73. SPAS- SPAS-summer pasture, soil types are RQ- Risk Quotient (represents relative activities of aerobic and anaerobic microbial metabolism) and slope 2-450.
Figure 11.
Temporal variation of biomass in subbasin 73. SPAS- SPAS-summer pasture, soil types are RQ- Risk Quotient (represents relative activities of aerobic and anaerobic microbial metabolism) and slope 2-450.
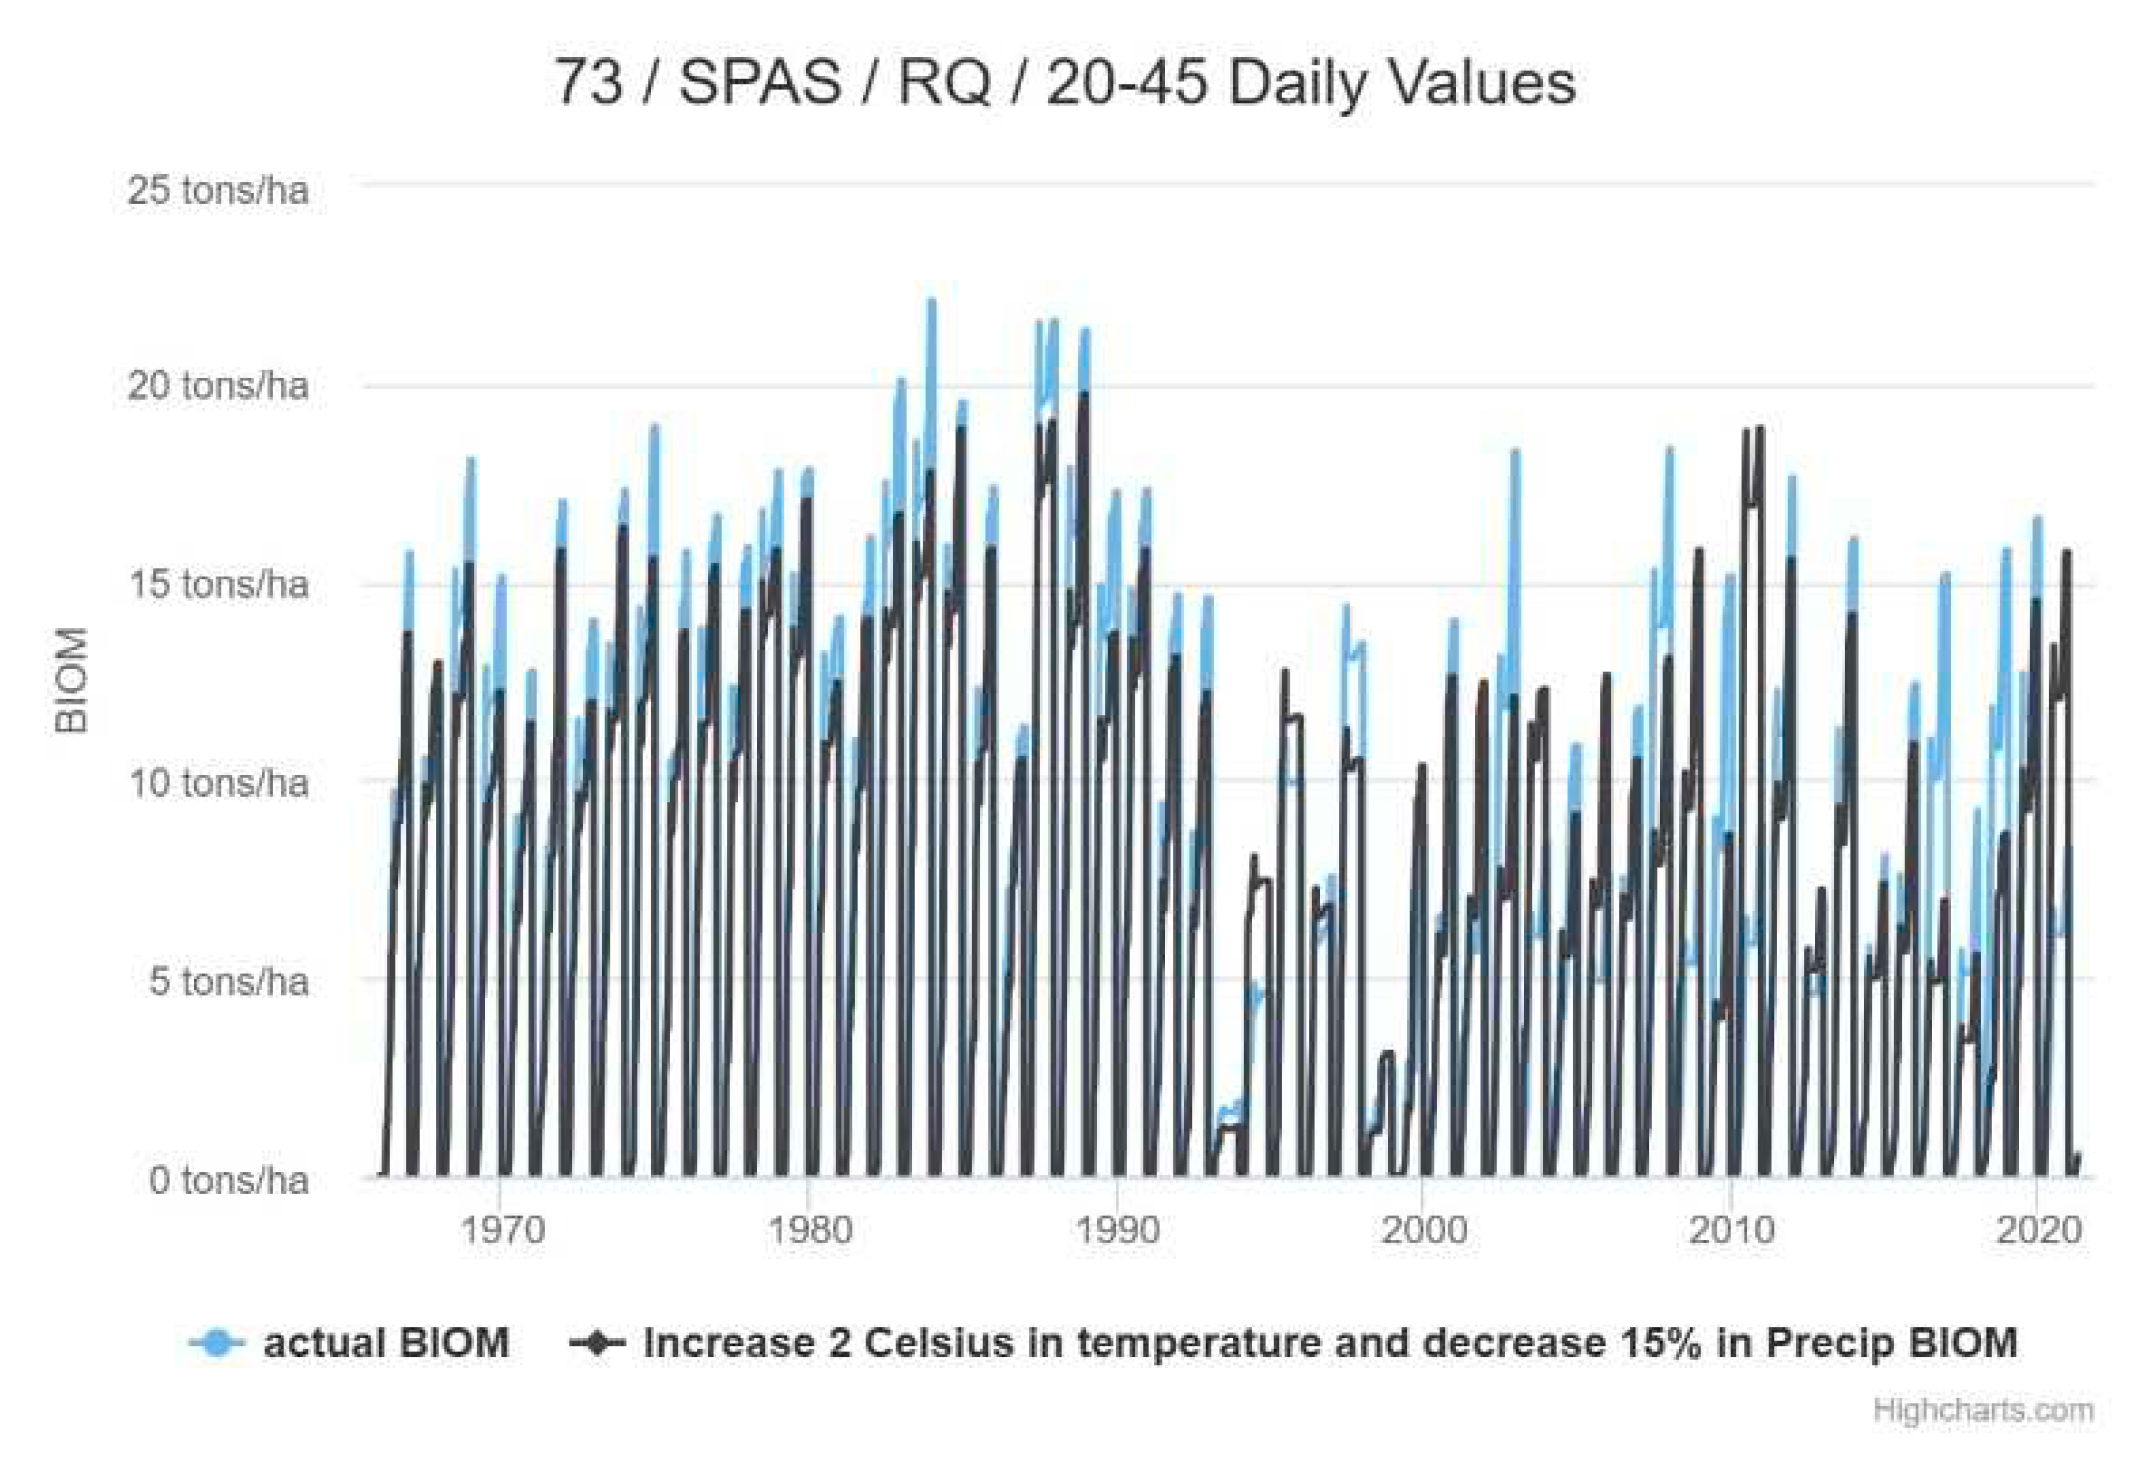
Figure 12.
Temporal variation of biomass in subbasin 73. CRWO- cropland/woodland mosaic, soil types are TC - eutrophic soil and slope 0-3.
Figure 12.
Temporal variation of biomass in subbasin 73. CRWO- cropland/woodland mosaic, soil types are TC - eutrophic soil and slope 0-3.
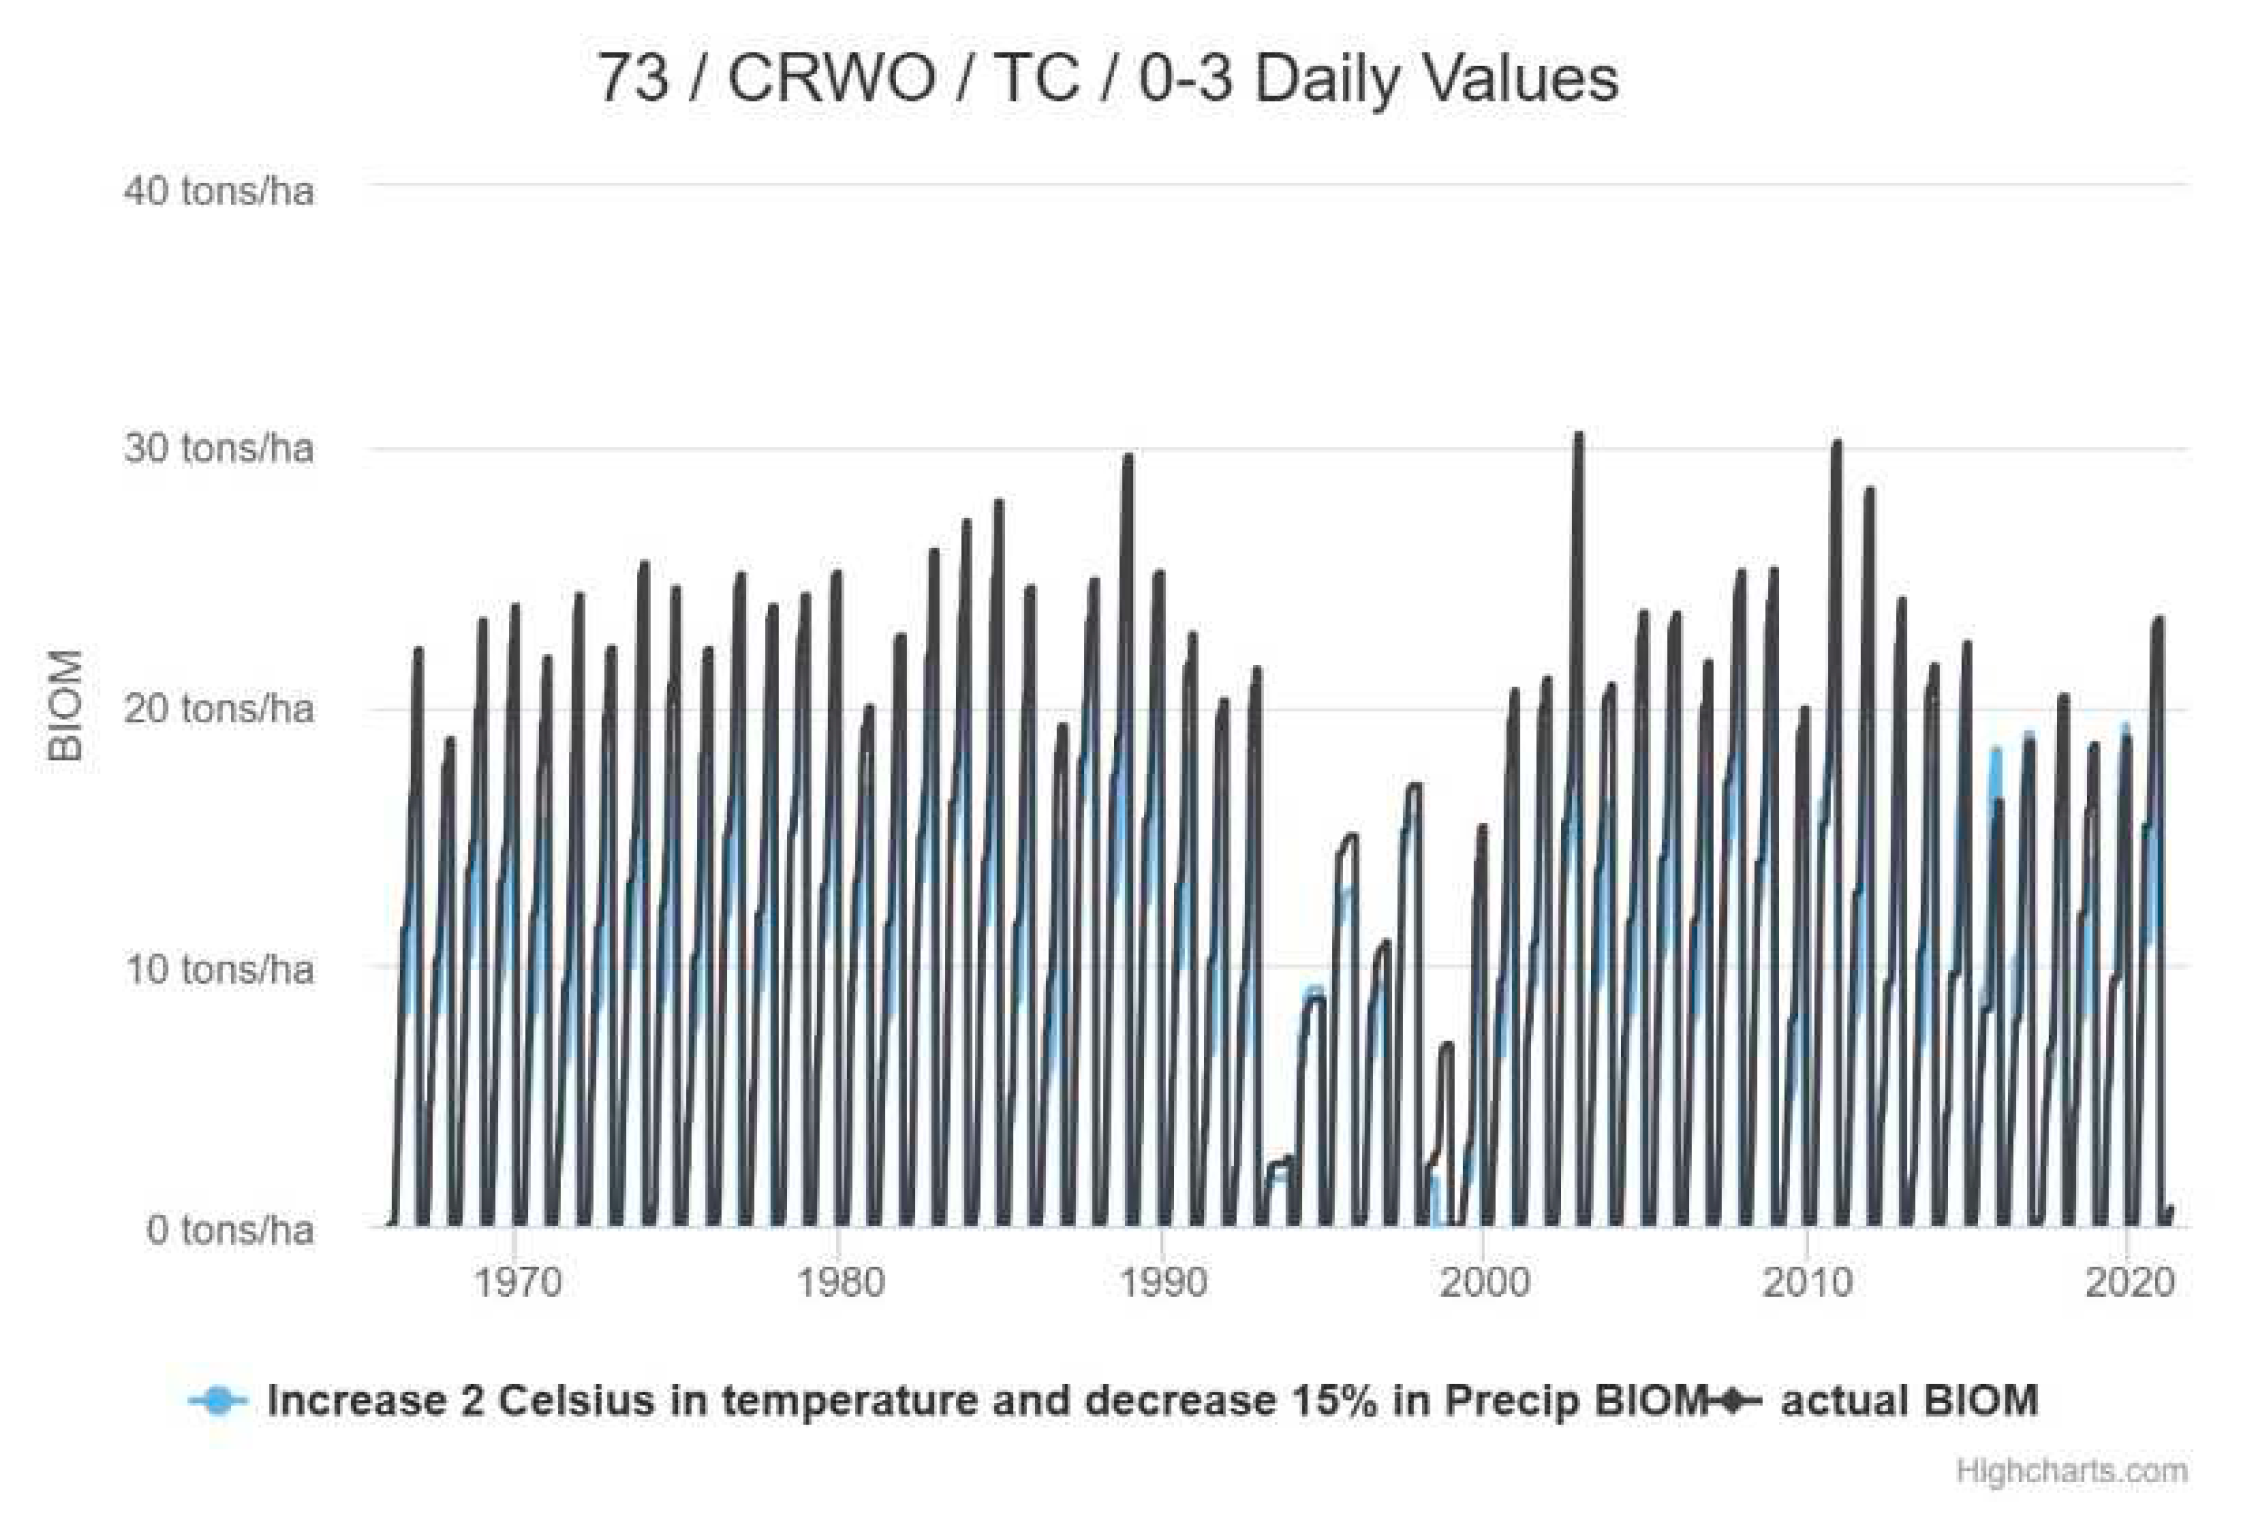
Figure 13.
Temporal variation of biomass in subbasin 73. CRWO- cropland/woodland mosaic, soil types are TC - eutrophic soil and slope 3-8.
Figure 13.
Temporal variation of biomass in subbasin 73. CRWO- cropland/woodland mosaic, soil types are TC - eutrophic soil and slope 3-8.
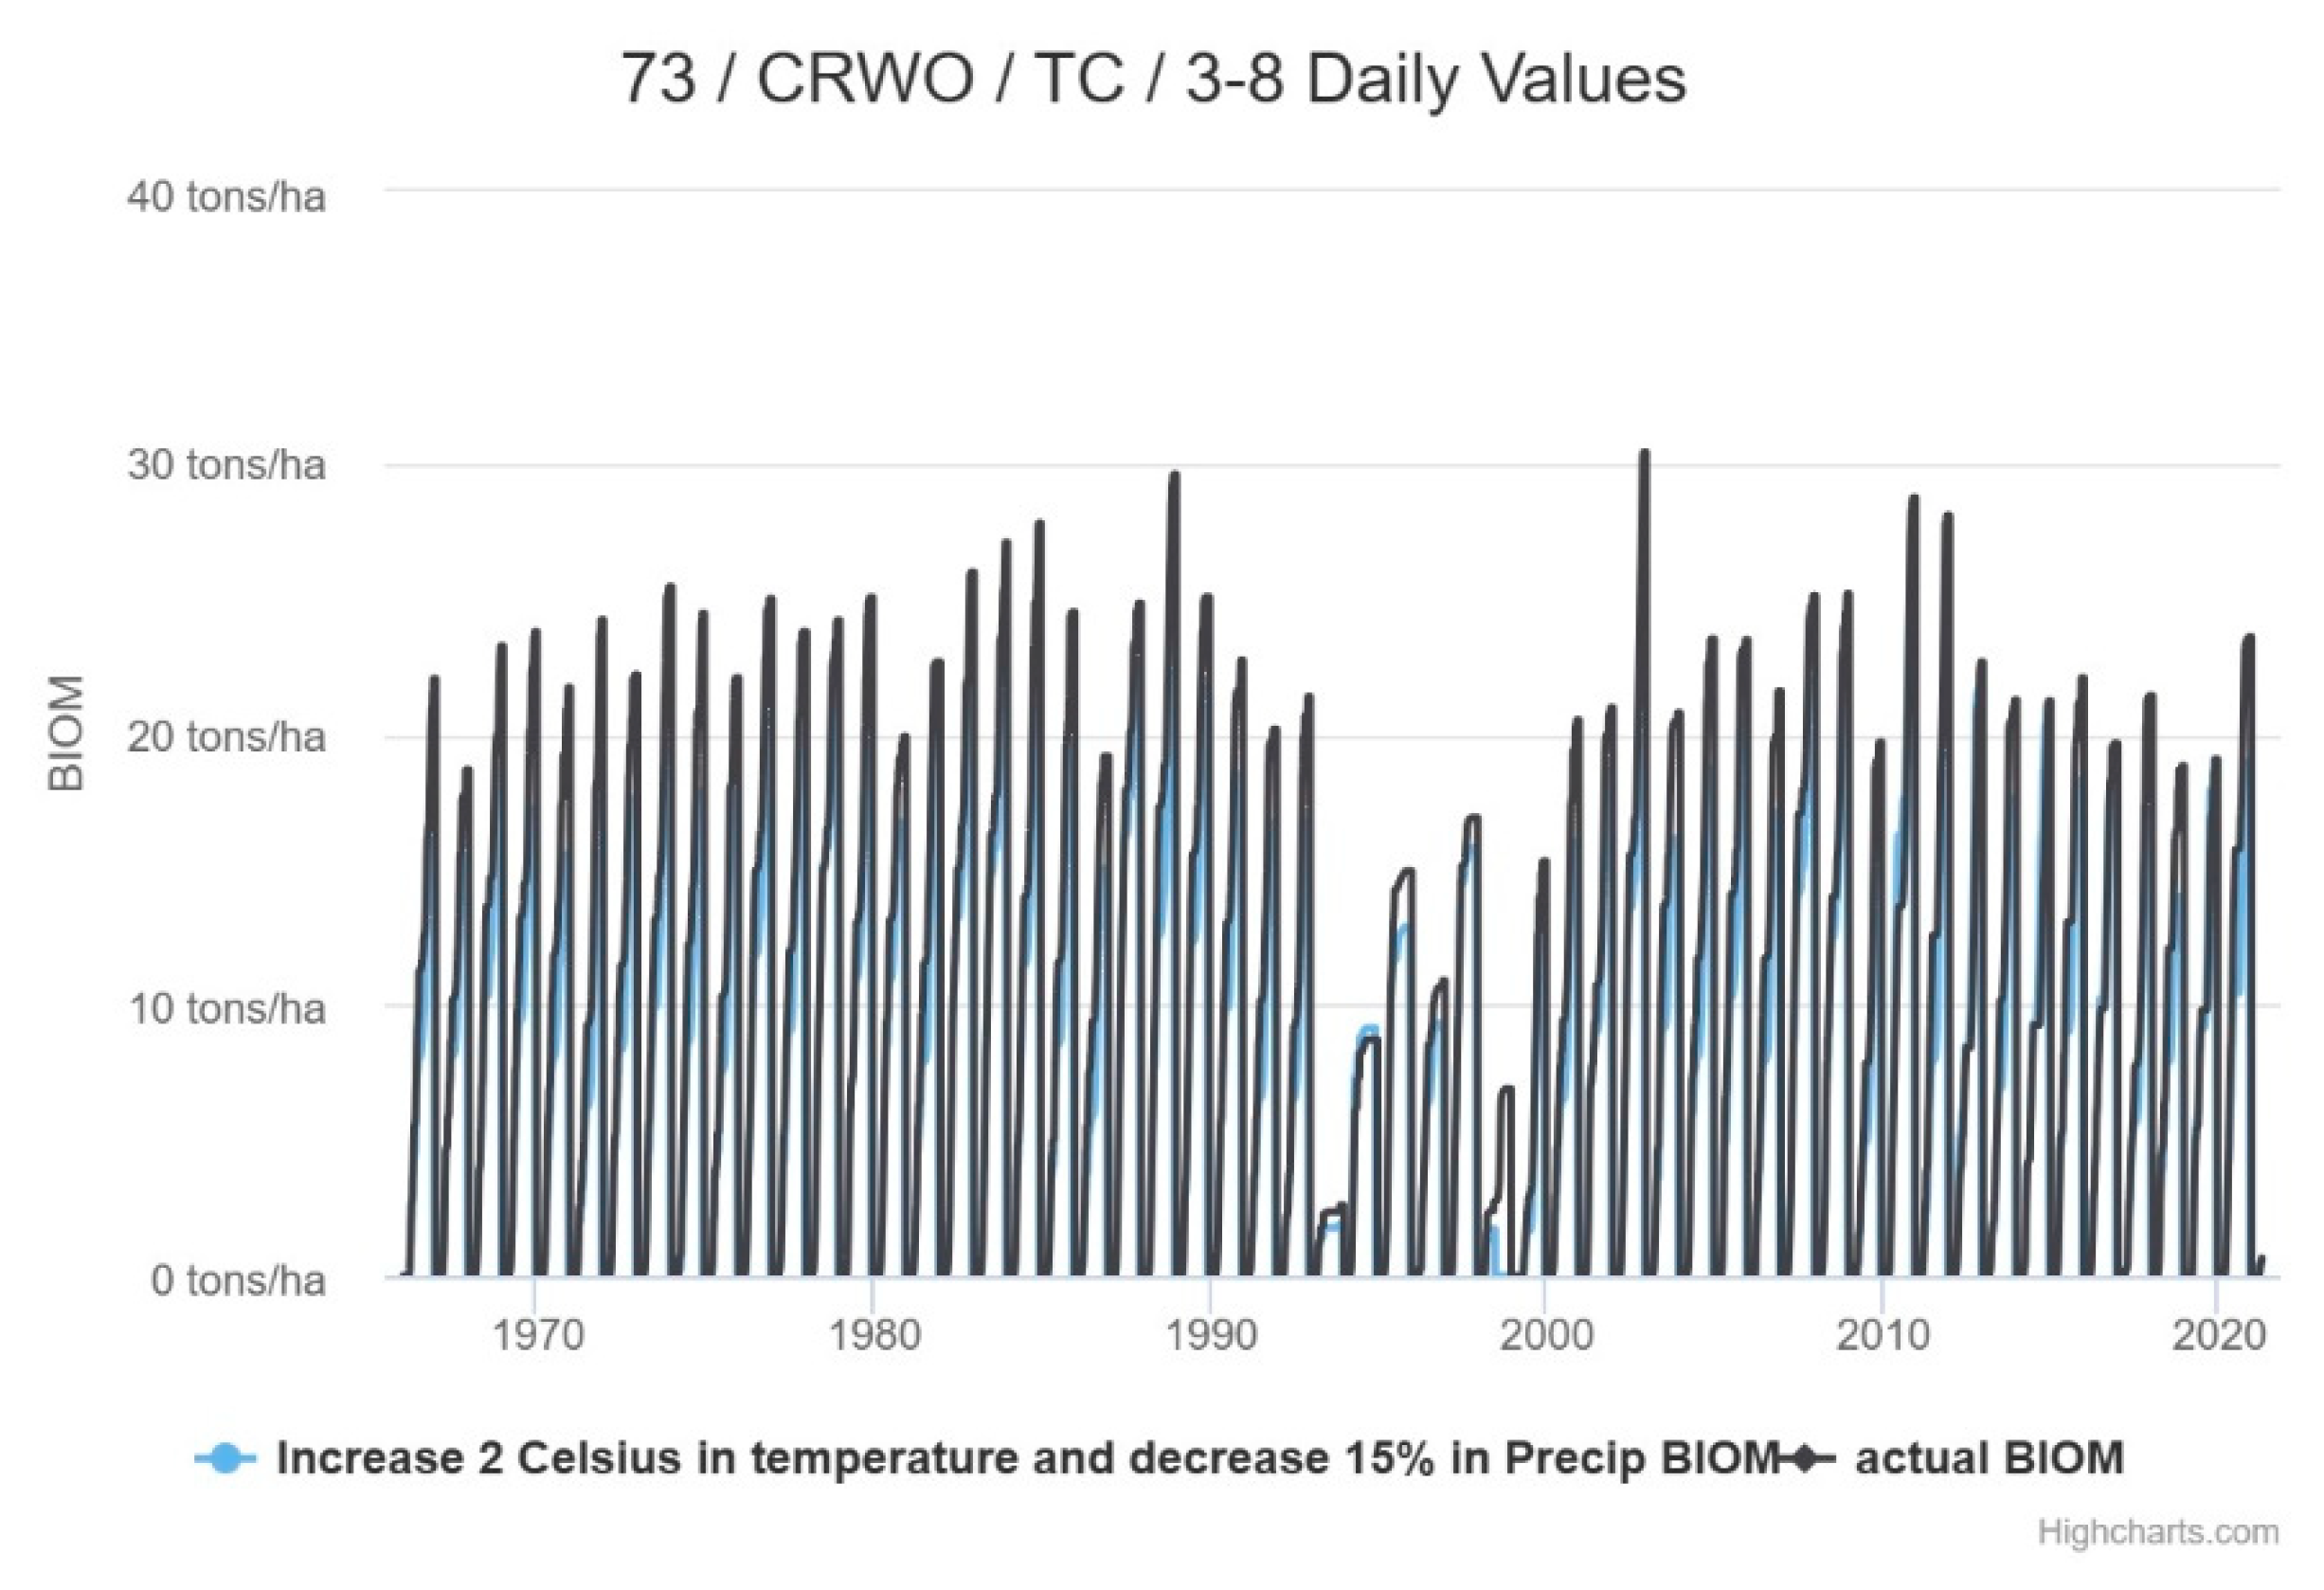
Figure 14.
Temporal variation of biomass in subbasin 73. CRWO- cropland/woodland mosaic, soil types are RQ- Risk Quotient (represents relative activities of aerobic and anaerobic microbial metabolism) and slope 3-8.
Figure 14.
Temporal variation of biomass in subbasin 73. CRWO- cropland/woodland mosaic, soil types are RQ- Risk Quotient (represents relative activities of aerobic and anaerobic microbial metabolism) and slope 3-8.
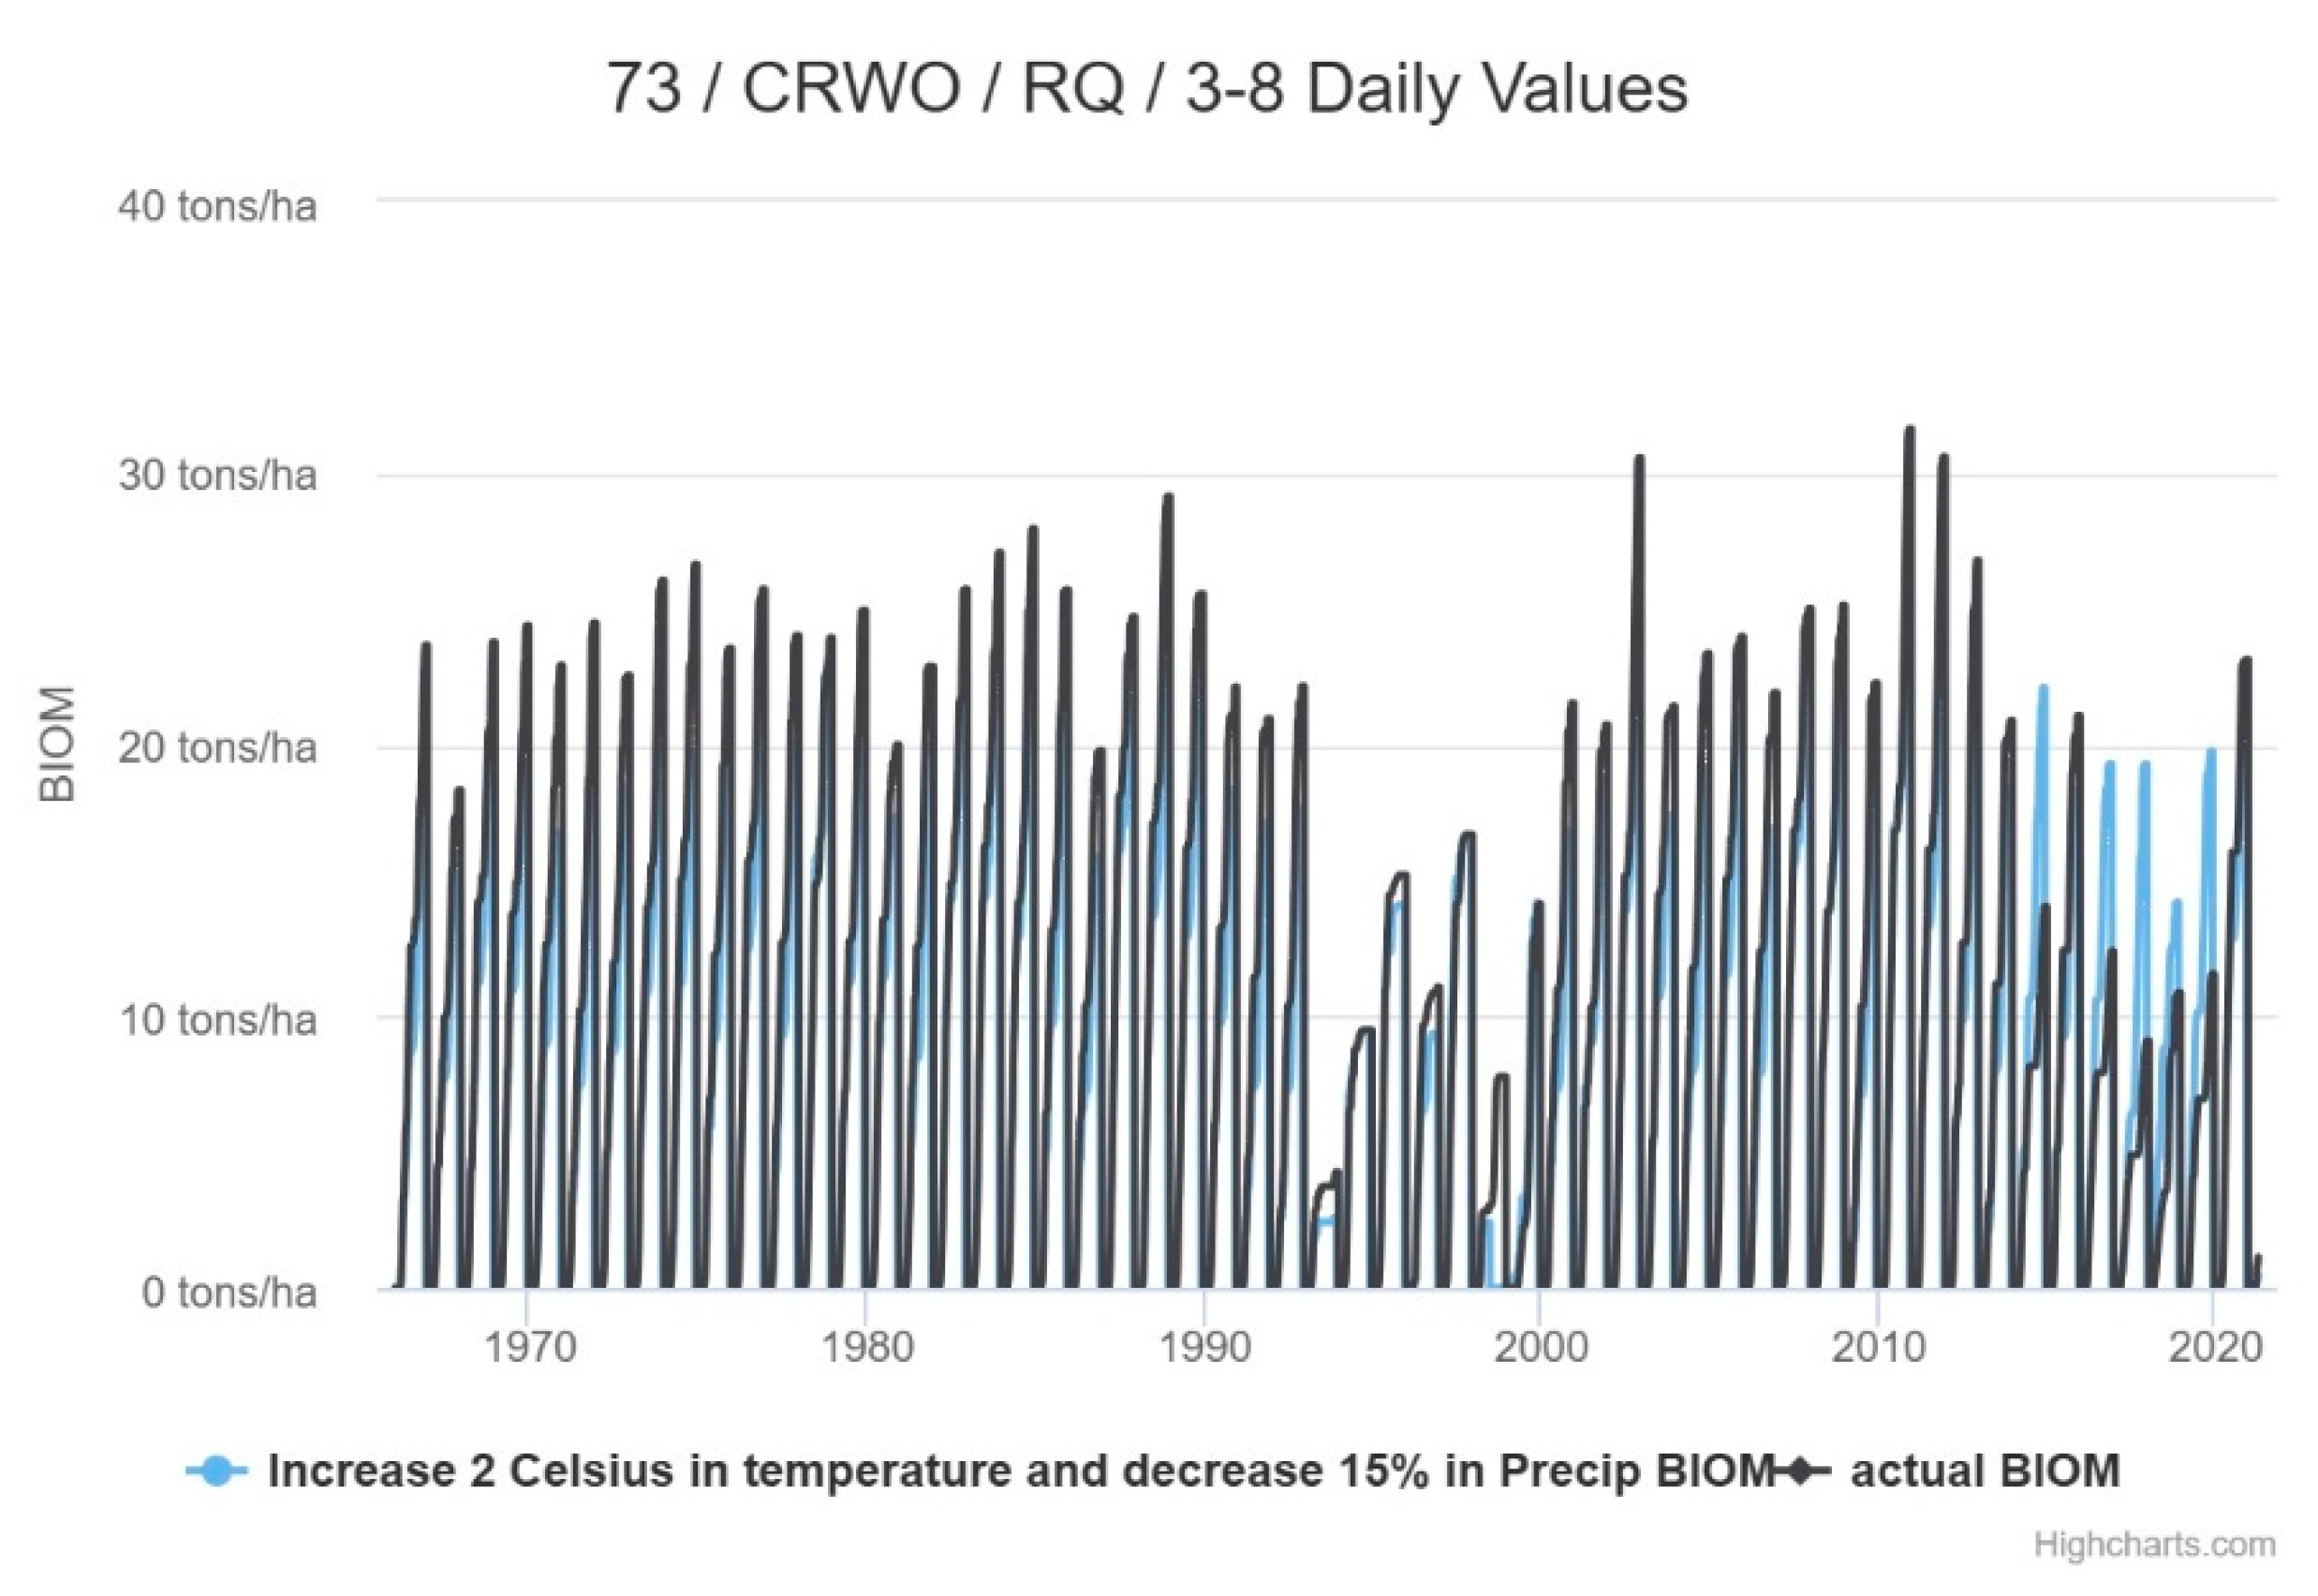
Figure 15.
Daily averages biomass.
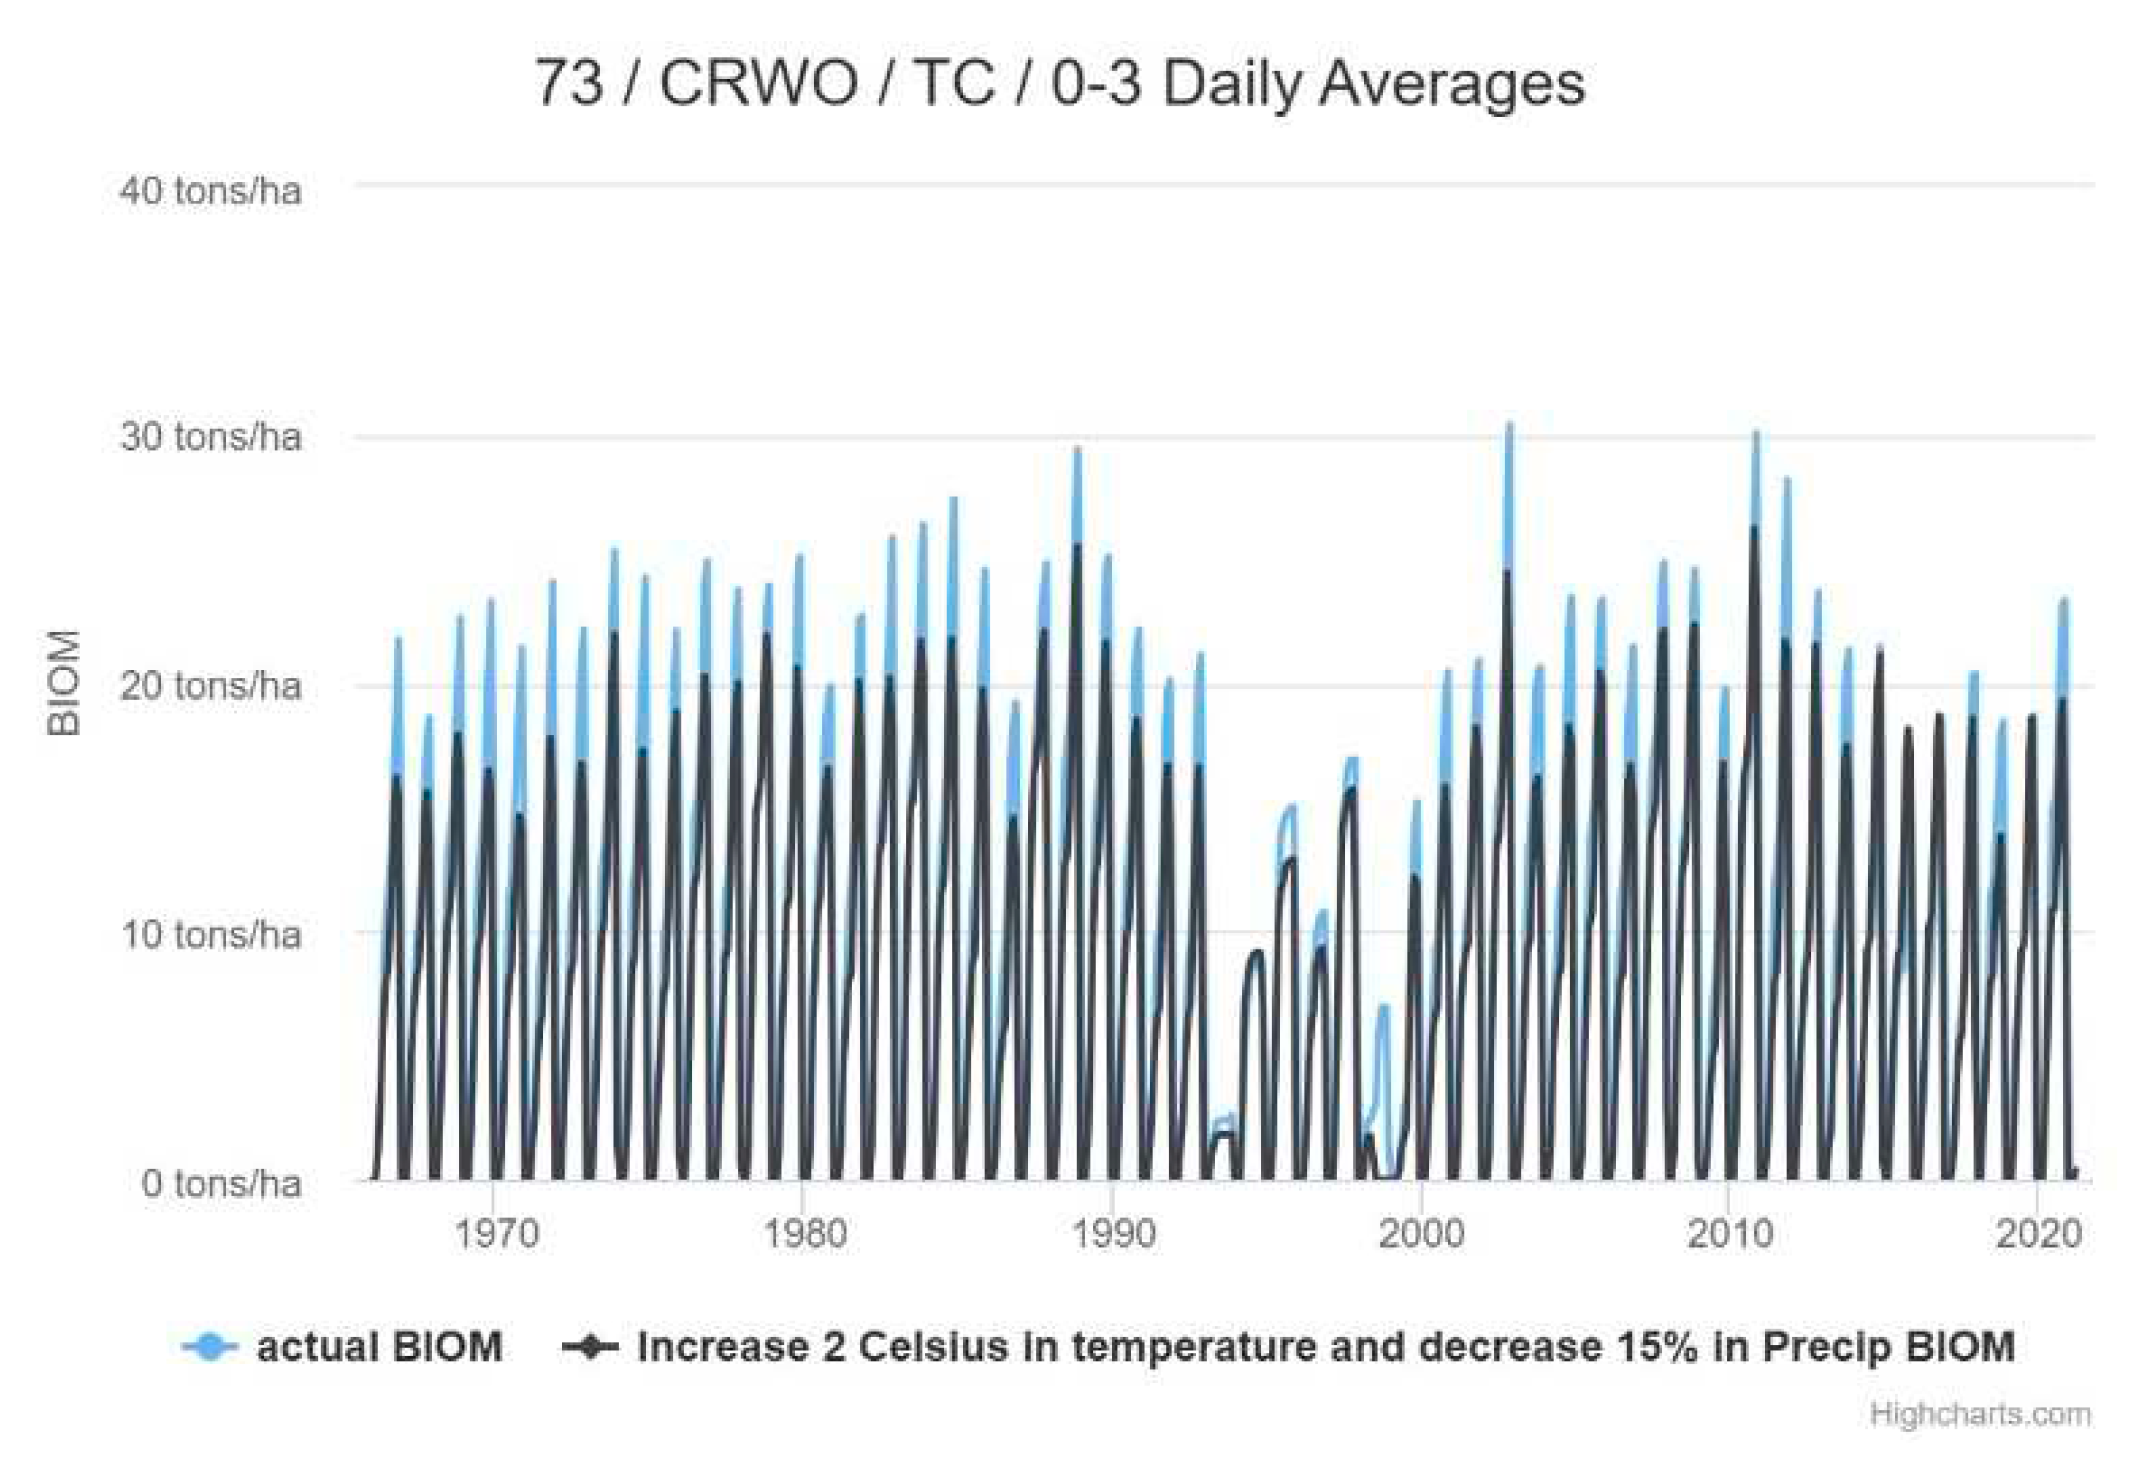
Figure 16.
Daily maximum values biomass.
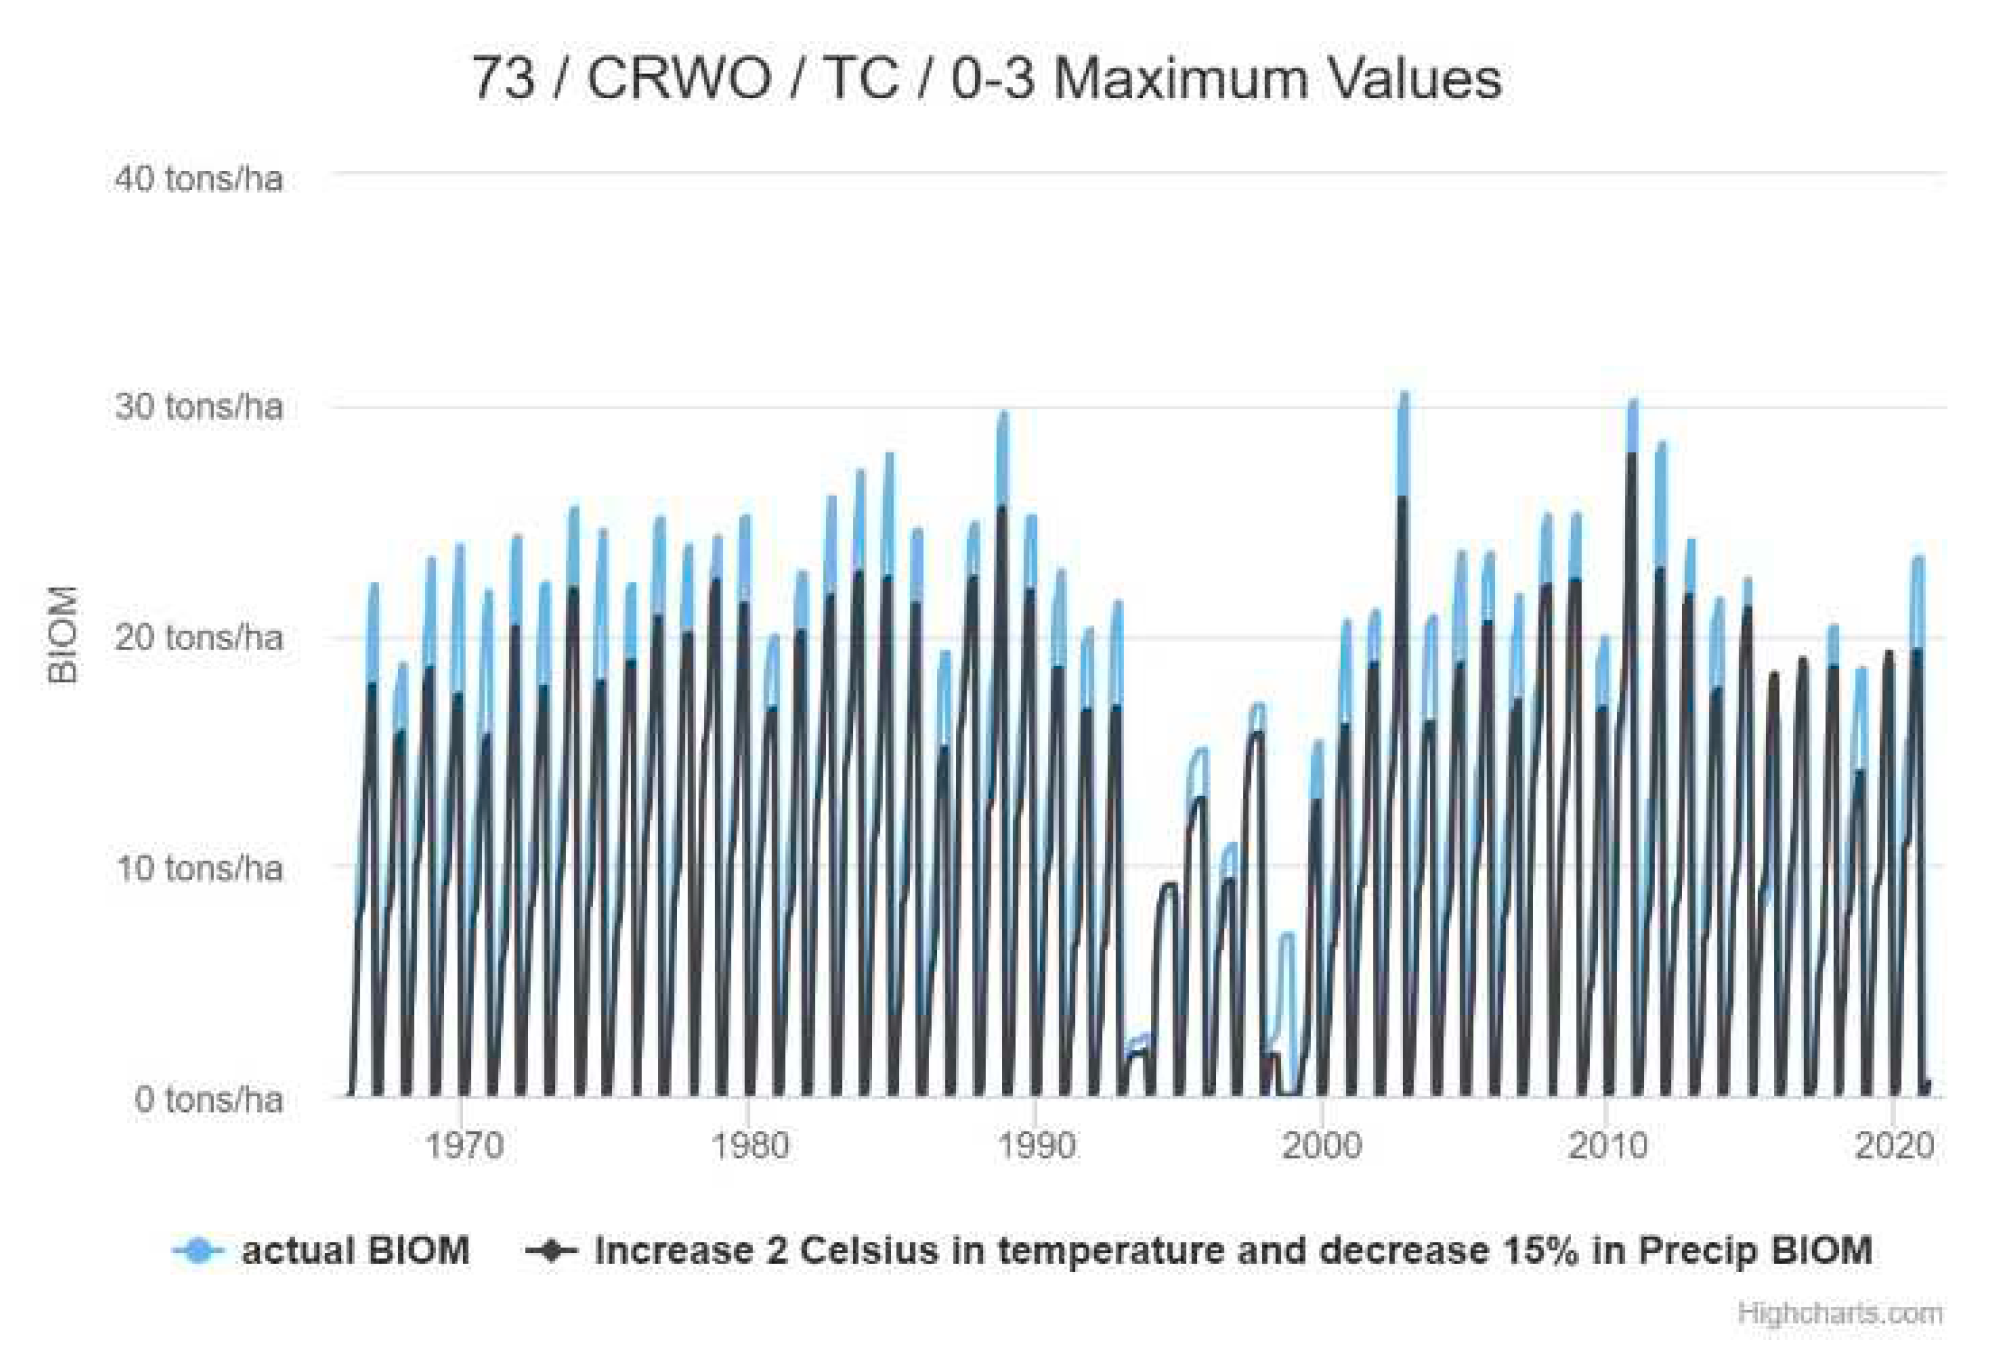
Figure 17.
Daily minimum values biomass.
It is possible to observe the influence of the channel on the surface temperature. It is also possible to see the influence of green vegetation near the residences, Figure 18 (A to F). This green vegetation influences the surface temperature and consequently the temperatures of the residences, giving a better quality of life when related to temperature conditions. In view of what was presented in this study that the areas of CROW with climate change will increase the biomass, it is believed that the surface temperature in these areas where there is an increase in biomass will be softened. The increase in water supply through the channel of the PISF-Integration Project of the São Francisco River will have an influence on the vegetation cover, an increase in biomass, especially in the CROW areas. Thus, it is concluded that climate change will have different impacts on small scales.
4. Discussion
The results of this study showed that water conditions in the region are so worrying that the SUPer system issues an alert (messages and warning: more than 100 days of water stress). An interesting result is that the average annual biomass will increase. But the efficiency in carbon sequestration will not be the same. Similar results have been shown in publications for forest ecosystems in the United States, Zhu et al., (2018). The trajectory of forest recovery is governed by two critical parameters: the asymptotic saturated aerial biomass and the age of the stand to reach half saturation, both assumed to be climate dependent. In all forest types, higher temperature generally increases aboveground saturated biomass but decreases the half-saturation stand age; more abundant rainfall increases both saturated biomass and half-saturation age. The estimated parameters of the model quantify the saturated biomass and the middle age, Zhu et al., (2018).
5. Conclusions
The study can obtain accurate and necessary information to understand the dynamics of the hydrological system and the possible changes of social hydric inequalities.
The climate change will have different impacts on small scales and lives conditions due to different characteristic's environment.
Assessment of water availability and environmental influence on people's lives in a small basin can be one important information to better mitigating the effects of climate change on people's lives
It is very important to carry out studies on a detailed scale to provide better public policies for mitigating the effects of climate change on people's lives.
Acknowledgments
The authors are grateful to Coordenação de Aperfeiçoamento de Pessoal de Nível Superior (CAPES), for the scholarship offered to the first author, ao CNPq for the research grant the second author. The Universidade Federal de Pernambuco for the space given to carry out the research during the master's degree of the first author. To the CNPq for granting financial resources to research project number 405853/2022-0. A FACEPE for granting research project number APQ-0392-3.07/22.
References
- Andrade, R.G.; Hott, M.C.; de Magalhães Junior WC, P.; de Melo Ribeiro, C.B. Análise espaço-temporal da evapotranspiração na bacia do rio Paraibuna usando o produto MOD16. Brazilian Journal of Animal and Environmental Research 2020, 3, 3406–3416. [Google Scholar] [CrossRef]
- Brito, P., Miranda, R., Morais, Y., Moura, M., Silva, A., Galvíncio, J., Costa, V. Avaliação da evapotranspiração estimada pelo MODIS e do balanço hídrico para bacia do Pontal- Pernambuco. Revista Brasileira de Geografia Física. 2021, 14, 2866-2877. [CrossRef]
- Castro, R., Machado, E. Análise de sensibilidade de parâmetros hidrológicos na bacia do rio das pedras Guarapuava-PR. Revista Brasileira de geografia Física, 2019, 12, 1746–1756. [CrossRef]
- da Costa, P. V. M.; Ojima, R. Transposição do rio São Francisco: migração e vulnerabilidade no Semiárido Nordestino. Anais 2022, 1–13. [Google Scholar]
- Eakin, H. C., Lemos, M. C., & Nelson, D. R. Differentiating capacities as a means to sustainable climate change adaptation. Global environmental change 2014, 27, 1–8. [CrossRef]
- Farias, C., Viana, J., Miranda, R., Silva, S., Vasco, G., Montegro, S., Galvíncio J, D. Técnica de calibração para modelagem da bacia hidrográfica do Rio São Francisco, Brasil, utilizando o SWAT. Revista Brasileira de Geografia Física 2023, 16, 1621–1628. [CrossRef]
- Ferreira, B.C.C.; Valverde, M.C. Análise dos índices de extremos de precipitação em cenários futuros na bacia do rio Ribeira de Iguape-São Paulo. Revista Brasileira de Meteorologia 2022, 37, 41–55. [Google Scholar] [CrossRef]
- Galvincio, J. D. Impacto do aumento de CO2 nas precipitações do estado de Pernambuco. Revista Brasileira de Geografia Física 2021, 14, 1828–1839. [Google Scholar] [CrossRef]
- Galvincio, J. D.; Luz, G. G. Desenvolvimento de modelo que estima o impacto do CO2 Atmosférico nas precipitações do estado de Pernambuco, utilizando ARIMA. Revista Brasileira de Geografia Física 2021, 14, 1840–1851. [Google Scholar] [CrossRef]
- Gouveia, J. Nascimento, C. Identificação operacional de áreas com potencial de regeneração e/ou recuperação vegetal nas mesorregiões do sertão e são Francisco pernambucano. Revista Brasileira de Geografia Física. 2023, 16, 1231-1246. [CrossRef]
- Guenni, L.B.; Cardoso, M.; Goldammer, J.; Hurtt, G.; Mata, L.J.; Ebi, K.; House, J.; Valdes, J. Regulation of natural hazards: floods and fires. Ecosystems and human well-being: current state and trends 2005, 55, 441–454. [Google Scholar]
- Lins, F.A.C.; Montenegro, A.A.S.; Farias, C.W.L.A.; Chagas, A.M.S.; Miranda, R.Q.; Galvíncio, J.D. Análise da dinâmica temporal da evapotranspiração real em uma bacia hidrográfica do semiárido através de modelagem hidrológica e sensoriamento remoto. IRRIGA 2021, 543–564. [Google Scholar] [CrossRef]
- Luz, G. G, Galvíncio, J. D. Balanço hídrico superficial da bacia hidrográfica do riacho milagres-PE, utilizando o SUPer. Revista Brasileira de Geografia Física. 2022, 15, 1094–1107. [CrossRef]
- Luz, G. G.; Galvíncio, J. D. Balanço hídrico superficial da bacia hidrográfica do riacho Milagres-PE, utilizando o SUPer. Revista Brasileira de Geografia Física 2022, 15, 1094–1107. [Google Scholar] [CrossRef]
- Majeski, J. C. L., & Trindade, L. de L. Lacunas de governança da água nas bacias hidrográficas da vertente Atlântica do Estado de Santa Catarina. Engenharia Sanitaria E Ambiental. 2023, 28, e20220231. [CrossRef]
- Martins, L, Martin, W, de Moraes, J, Júnior, M, Maria, I. Calibração hidrológica do modelo SWAT em bacia hidrográfica carcaterizada pela expansão do cultivo da cana-de-açúcar revista Brasileira de Geografia Física. 2020, 13, 576–594. [CrossRef]
- Mc Phillips, L.E., et. al,. Defining extreme events: a cross disciplinary. Review. Earth’s Future. 2018, 6, 441–455. [CrossRef]
- Metych, Michele. "natural disaster". Encyclopedia Britannica, 27 Mar. 2023. Available online: https://www.britannica.com/science/natural-disaster (accessed on 31 July 2023).
- Mikaeili, O.; Shourian, M. Assessment of the analytic and hydrologic methods in separation of watershed response to climate and land use changes. Water Resources Management 2023, 37, 2575–2591. [Google Scholar] [CrossRef]
- Miranda, R. D. Q, Galvíncio, J. D, Morais, Y. C. B, Moura, M. S. B, Jones, C. A, Srinivas, R. And Dry forest deforestation dynamics in Brazil’s Pontal basin, Revista Caatinga. 2018, 31, 385–395. [CrossRef]
- Miranda, R.Q.; Nóbrega, R.L.B.; Moura, M.S.B.; Raghavan, S.; Galvíncio, J.D. Realistic and simplified molds of plant and leaf area indices for a seasonally dry tropical forest. International Journal Of Aplied Earth Observation and Geoinformation 2020, 85, 101992. [Google Scholar] [CrossRef]
- Munang, R.; Thiaw, I.; Alverson, K.; Liu, J.; Han, Z. The role of ecosystem services in climate change adaptation and disaster risk reduction. Curr. Opin. Eviron Sustation. 2013, 5, 47–52. [Google Scholar] [CrossRef]
- Nacismento, J., Frade, T., Silva, R. Modelagem da resposta do escoamento emu ma bacia do semiárido da Paraíba utilizando o modelo SWAT, Revista Brasileira de Geografia Física. 2018, 11, 1137–1150. [CrossRef]
- Paz, Y.M.; Silva, J.F.; Holanda, R.M.; Galvíncio, J.D. Planejamento e gestão ambiental de bacias hidrográficas a partir da modelagem hidrossedimentológica e estudo de cenários alternativos de uso e cobertura do solo. Geociências 2022, 41, 675–687. [Google Scholar] [CrossRef]
- Paz, Y.M.; Silva, J.F.; Holanda, R.M.; Galvíncio, J.D. Avaliação espacial da produção de sedimentos e estratégias para redução dos processos erosivos em bacia hidrográfica no Nordeste do Brasil. Derbyana 2022, 1–30. [Google Scholar] [CrossRef]
- Paz, Y., Galvincio J. D., Holanda R, Srinasan, R., Jones, C. Análise de sensibilidade e calibração espacial do modelo SWAT aplicado em uma bacia do litoral pernambucano através de dados climáticos observados e de reanálise, Revista Brasileira de Geografia Física. 2018, 11, 371–388. [CrossRef]
- Portela, B., Alves, G., Silva, S., Lafayatte, K. Análise da vulnerabilidade a inudações ma bacia hidrográfica do Rio Sirinhaém, utilizando o modelo de análise hierárquia. Revista Brasileira de Geografia Física. 2023, 16, 1247–1262. [CrossRef]
- Porto, A. V., Viana, J. F. D. S., Miranda, R. Q., & Montenegro, S. M. Analysis of future climate projections for the Pajeú River basin simulated by the regional model Eta-Hadgem2-ES. Journal of Hyperspectral Remote Sensing. 2022, 12, 1–9. [CrossRef]
- Porto, A., Viana, J., Miranda, R., Montenegro, S., Sousa, W., Araújo, D., Gusmão, A., da Silva, S. Análise das projeções climáticas futuras para a bacia do Rio Pajeú simuladas pelo modelo regional Eta-Hadgem2-ES. Journal of Hyperspectral Remote Sensing. 2022, 12, 1–9. [CrossRef]
- Rocha, R. L. da., Silva, F.D. dos S., Costa, R. L., Gomes, H. B, Gomes, H. B,, Silva, M. C. da., Pinto, D. D.C., Herdies, D. L. Cabral, J. B., & Pita-Díaz, Mudança de longo prazo e regionalização da evapotranspiração de referência no Nordeste brasileiro. Revista Brasileira de Meteorologia. 2021, 35, 891–902. [CrossRef]
- Rodrigues, J., Junqueira, R., Amorim, J., Alves, B., Viola, M. Hydrological modeling in the Sono river basin, environmental protection region of the Jalapão, Brazian savana, Revista Brasileira de Geografia Física. 2021, 14, 1131–1142. [CrossRef]
- Rosin, C.; Amorim, R.S.S.; Morais, T.S.T. Análise de tendências hidrológicas na bacia do rio das Mortes. Revista Brasileira de Recursos Hídricos. 2015, 20, 991–998. [Google Scholar] [CrossRef]
- Saco, P. M, McDonough, K. R., Rodriguez J. F., Rivera-Zayas J., Sandi S. G. The role of soils in the regulation of hazardsand extreme events.Phil. Trans. R. Soc. 2021, B376, 20200178. [CrossRef]
- Santos, J.G.; Pedrozo, E.A.; Ioris, A. A reterritorialização e a luta pela água dos atingidos pela transposição do rio São Francisco no Nordeste brasileiro. Sociedade & Natureza 2022, 34. [Google Scholar]
- Silva, J.I.A.O.; de Almeida, P.L.R. Gestão, Governança e Compliance: O caso da transposição do São Francisco. Revista Direito em Debate 2022, 31, e12015. [Google Scholar] [CrossRef]
- Sousa, W. dos S., Viana, J. F. de S., Silva, R. R., Irmão, R. A. Estimativa do balanço hídrico de uma sub-bacia da Bacia Hidrográfica do Rio Ipanema com o Modelo SWAT. Journal of Environmental Analysis and Progress. 2018, 3, 146–154. [CrossRef]
- Tiburcio, I., Silveira, N., Santos, T., Miranda, R., Galvíncio, J. D, Balanço hídrico e mudanças climáticas no semiárido pernambucano: aplicabilidadedo Sistema de unidades de respostas hidrologicas para Pernambuco (SUPer). Revista Brasileira de Geografia Física. 2023, 16, 1657–1670. [CrossRef]
- Torres, S.N.; Silveira, H.T.; Tiburcio, I.M.; Galvíncio, J.D. Qualidade da água e modelagem hidrológica: aplicabilidade do sistema de Unidades de respostas hidrológicas para Pernambuco (SUPer). Revista Brasileira de Sensoriamento Remoto. 2022, 30–40. [Google Scholar]
- Trentin, R., Laurent, F., Robaiana, L. Vazão e balanço hídrico relacionado a mudanças no uso da terra emu ma bacia hidrográfica de médio porte no bioma Pampa do Brasil, Revista Brasileira de Geografia Física. 2023, 16, 873–893. [CrossRef]
- Valentini M. H. K, Beskow S, Silva M. E. S, Sell M. B, Mello, R. G. C, Beskow C. L. T, Silveira M. P. J. Overview on the historical series of annual maximum streamflows in Brazil: analysis based on temporal and statistical criteria. Revista Brasileira de Geografia Física 2023, 16, 837–846. [CrossRef]
- Viana, J. F. de S., Montenegro, S. M. G. L., Silva, B. B. da, Silva, R. M. da, & Sousa, W. dos S. Modelagem hidrológica da Bacia Hidrográfica do Rio Pirapama-PE utilizando o modelo SWAT. Journal of Environmental Analysis and Progress. 2018, 3, 155–172. [CrossRef]
- Wang, Y.; Xie, X.; Shi, J.; Zhu, B.; Jiang, F.; Chen, Y.; Liu, Y. Accelerated hydrological cycle on the Tibetan Plateau evidenced by ensemble modeling of Long-term water budgets. Journal of Hydrology 2022, 128710. [Google Scholar] [CrossRef]
- Zhu, K., Zhang, J., Niu, S. et al. (Limites ao crescimento do sumidouro de carbono da biomassa florestal sob as mudanças climáticas. Nat Commu. 2018, 9, 2709. [CrossRef]
Figure 1.
Location of the hydrographic basin 73, in Pajeu.
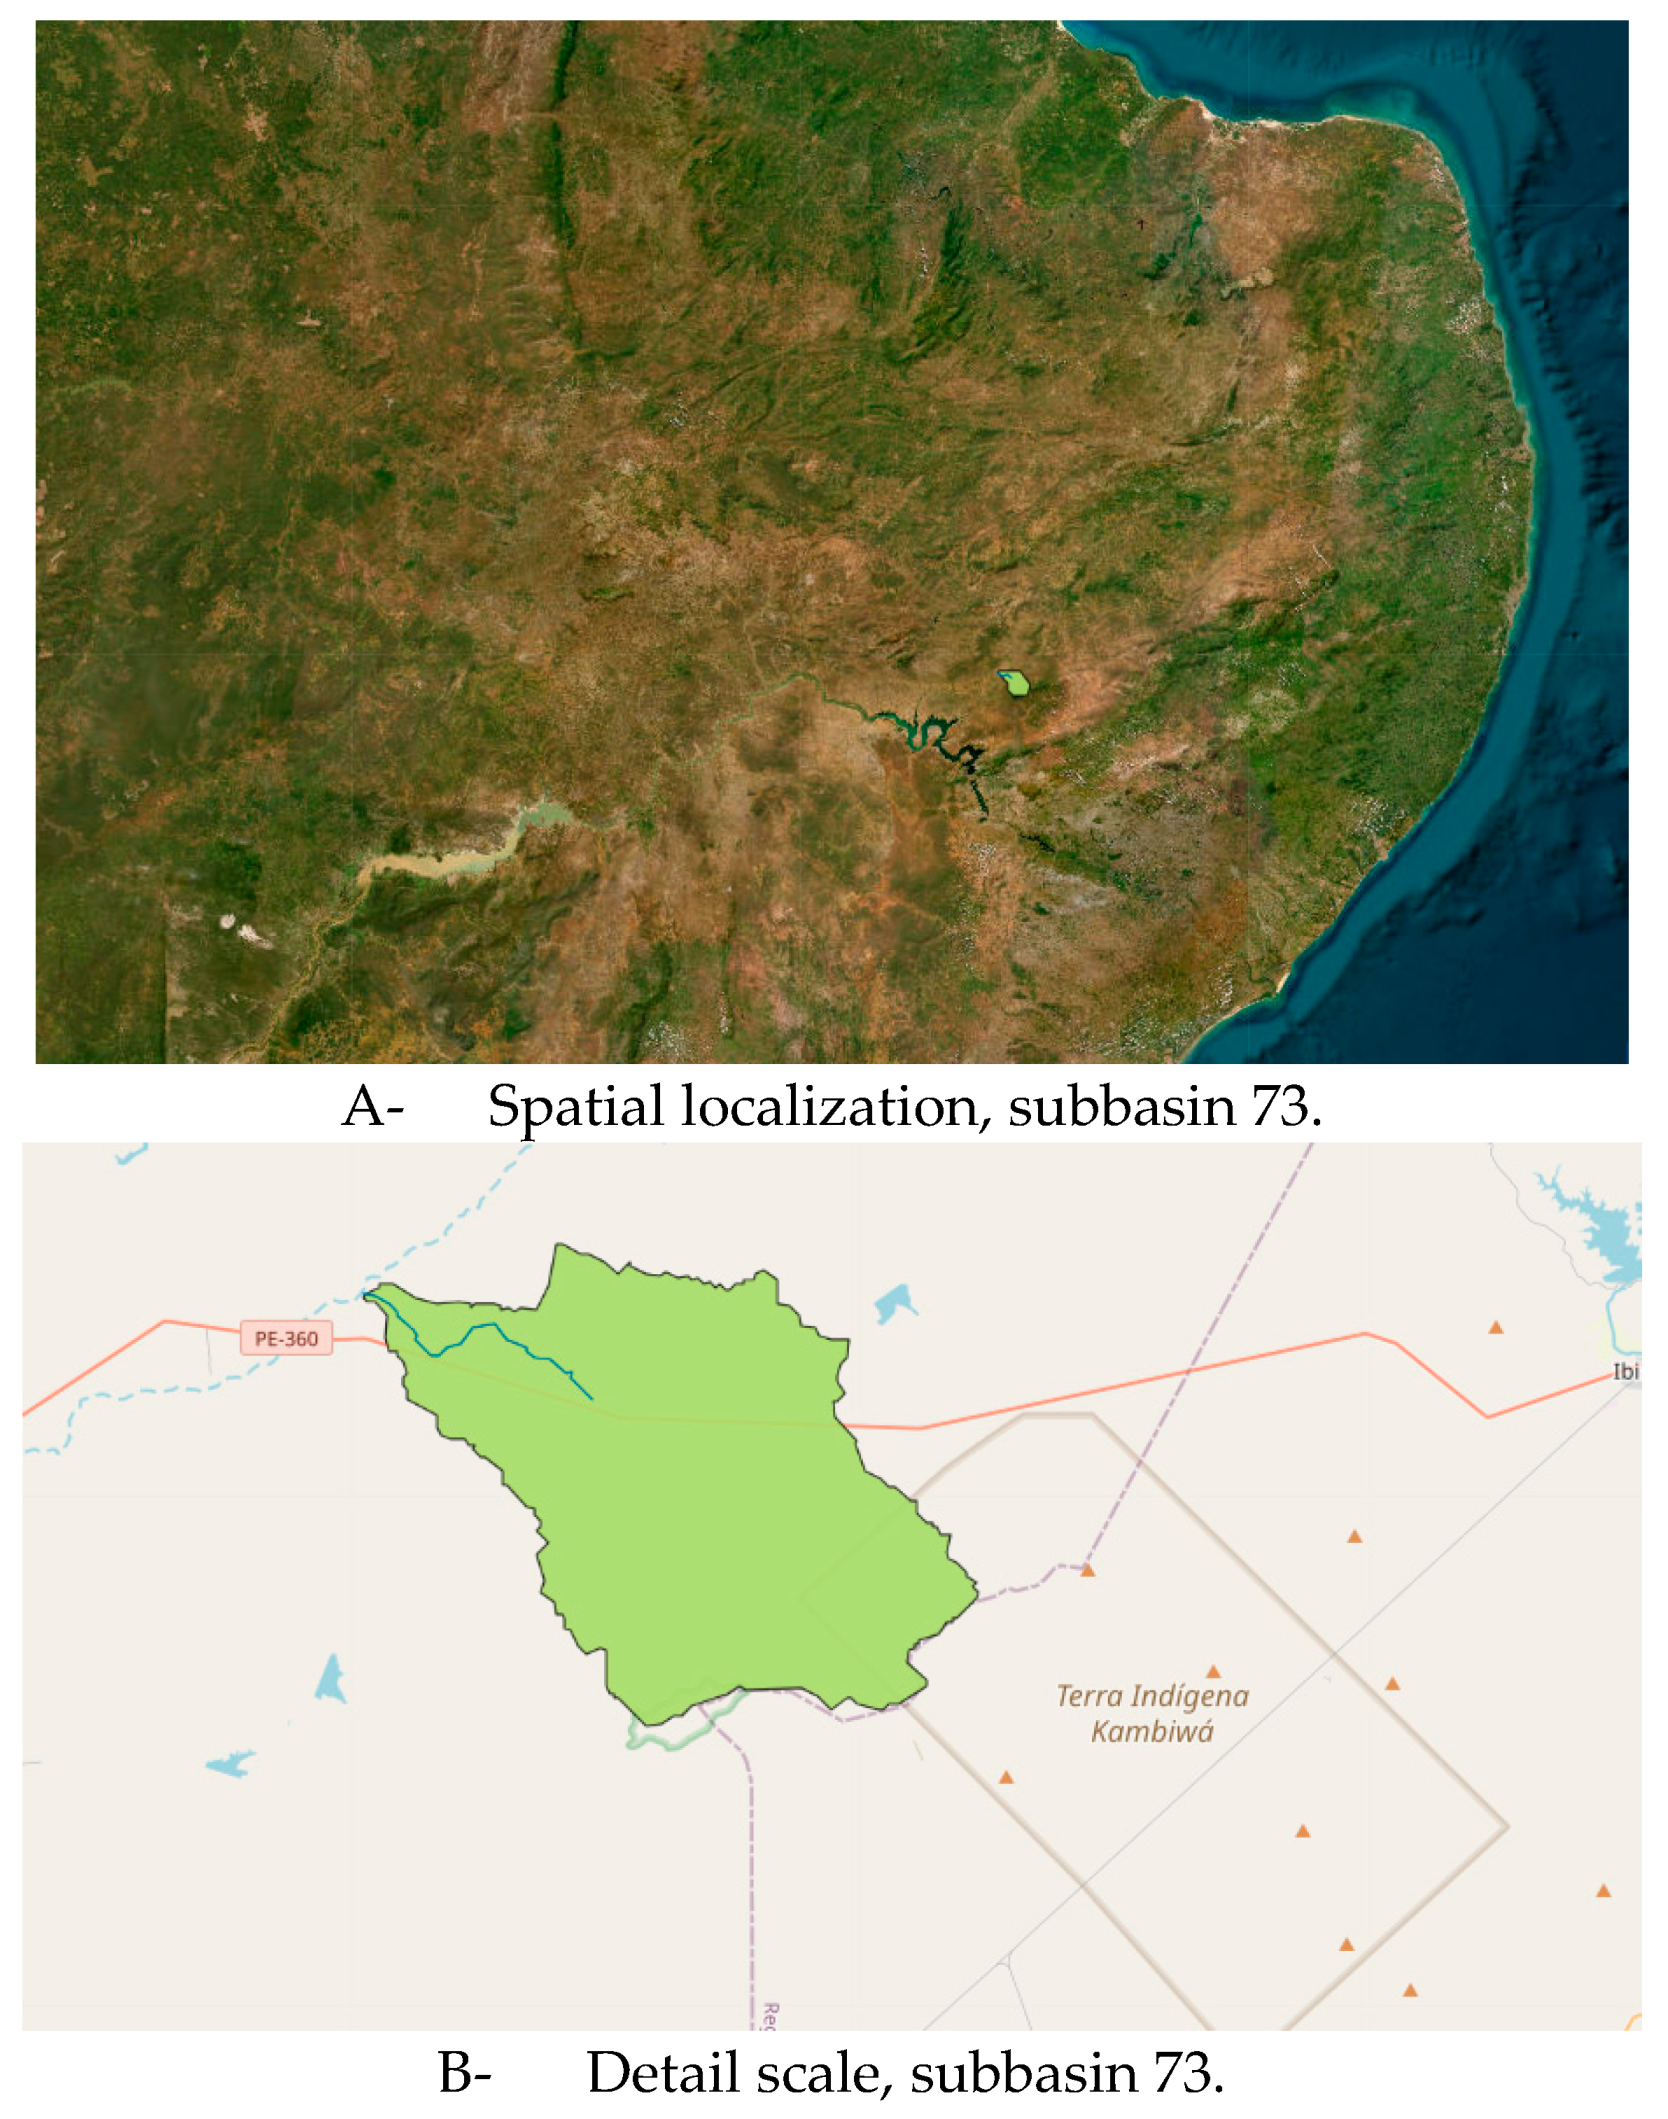
Figure 3.
Average annual water balance of subbasin 73 of the Pajeú-PE basin.
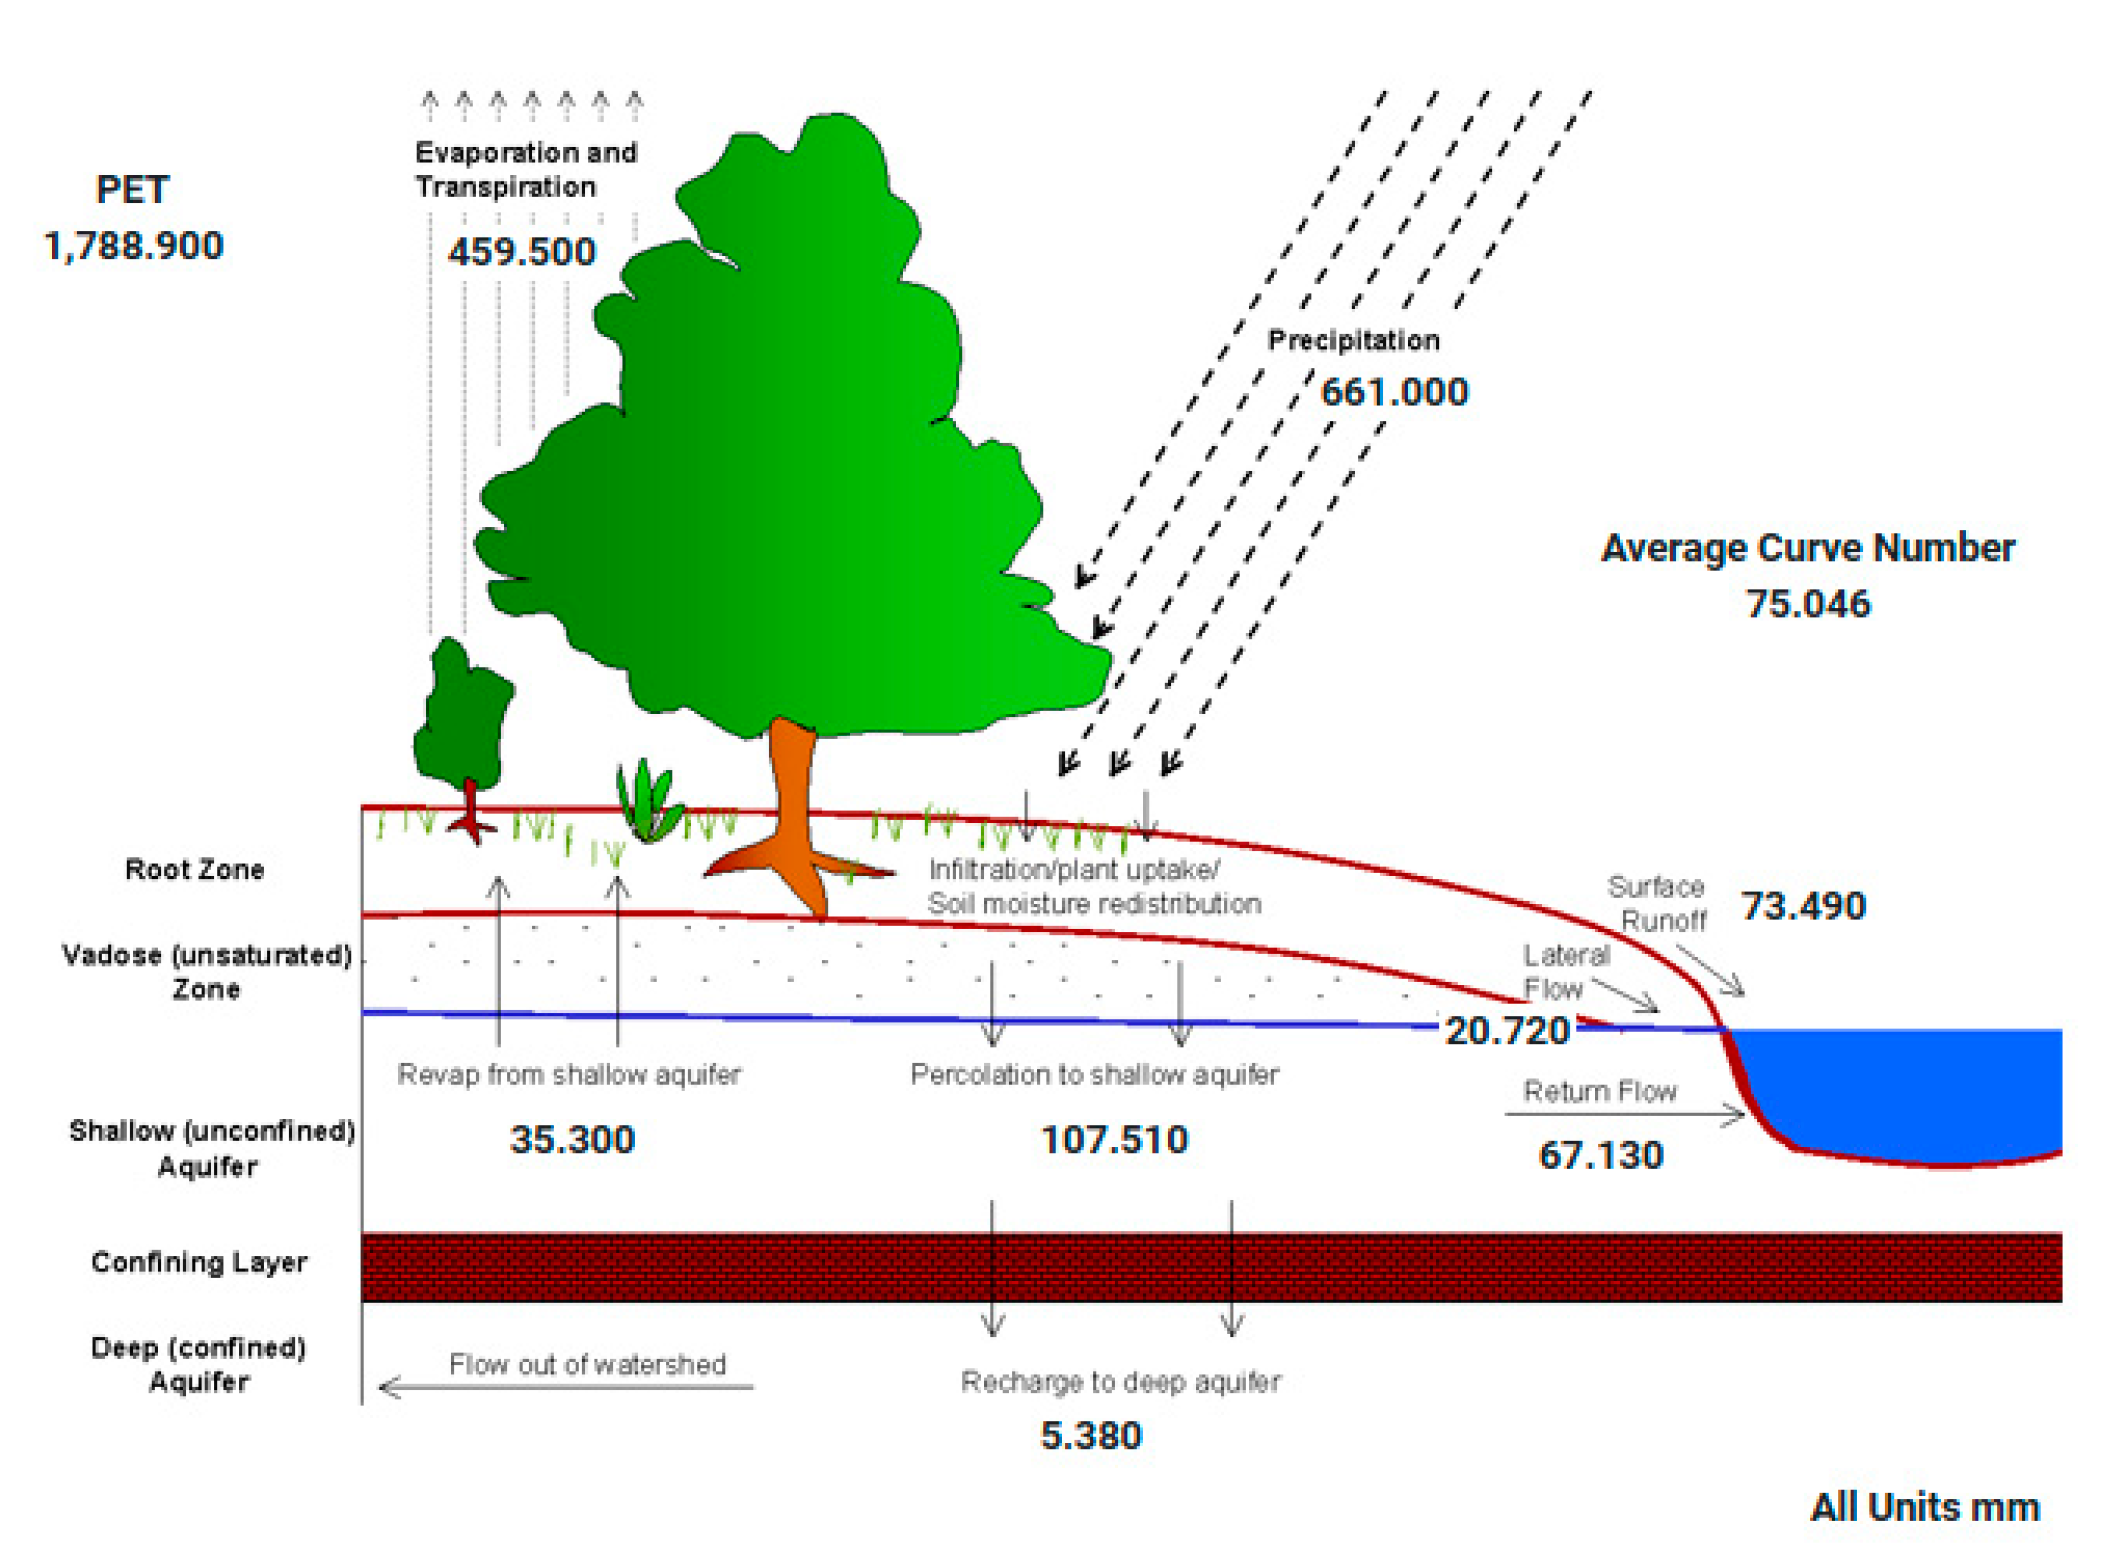
Figure 5.
Flow duration curve in subbasin 73, Pajeu basin.
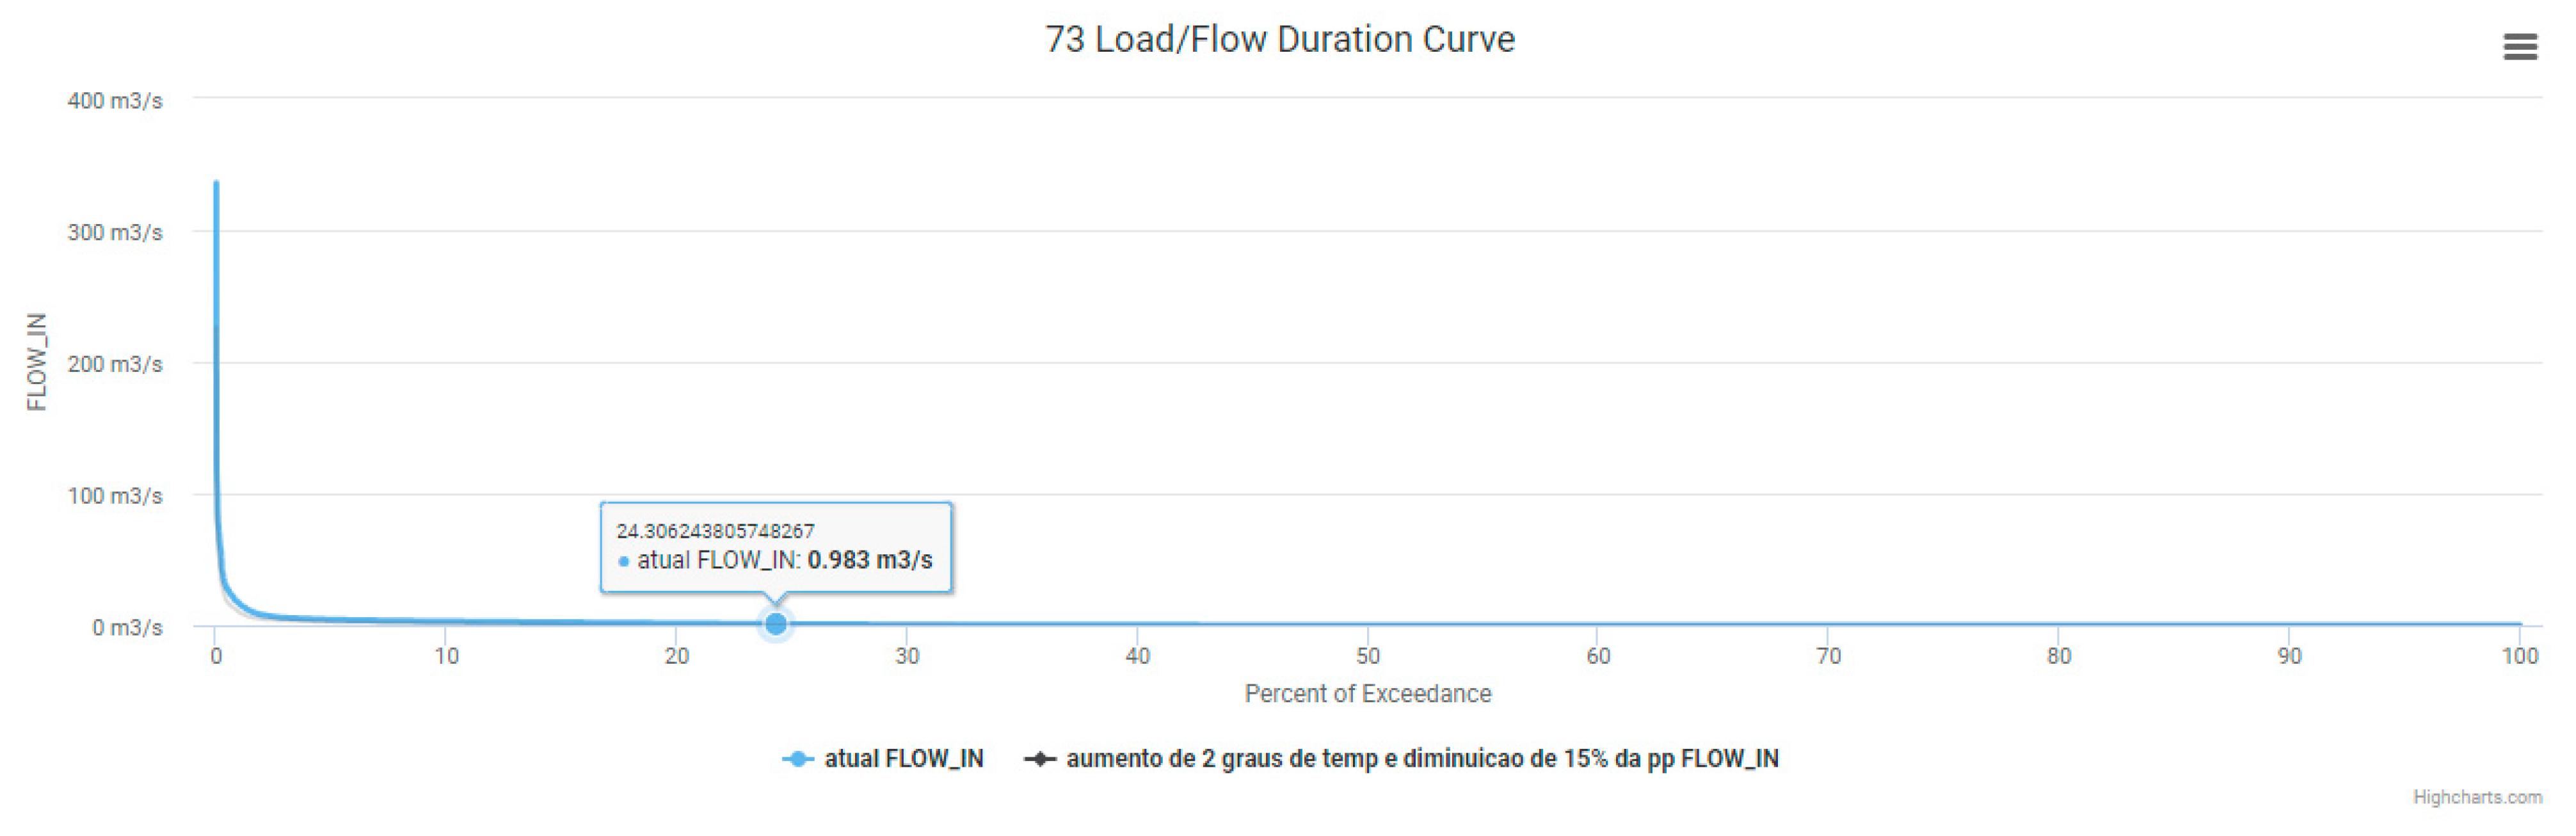
Figure 6.
Annual environmental conditions of the vegetation, actual situation.
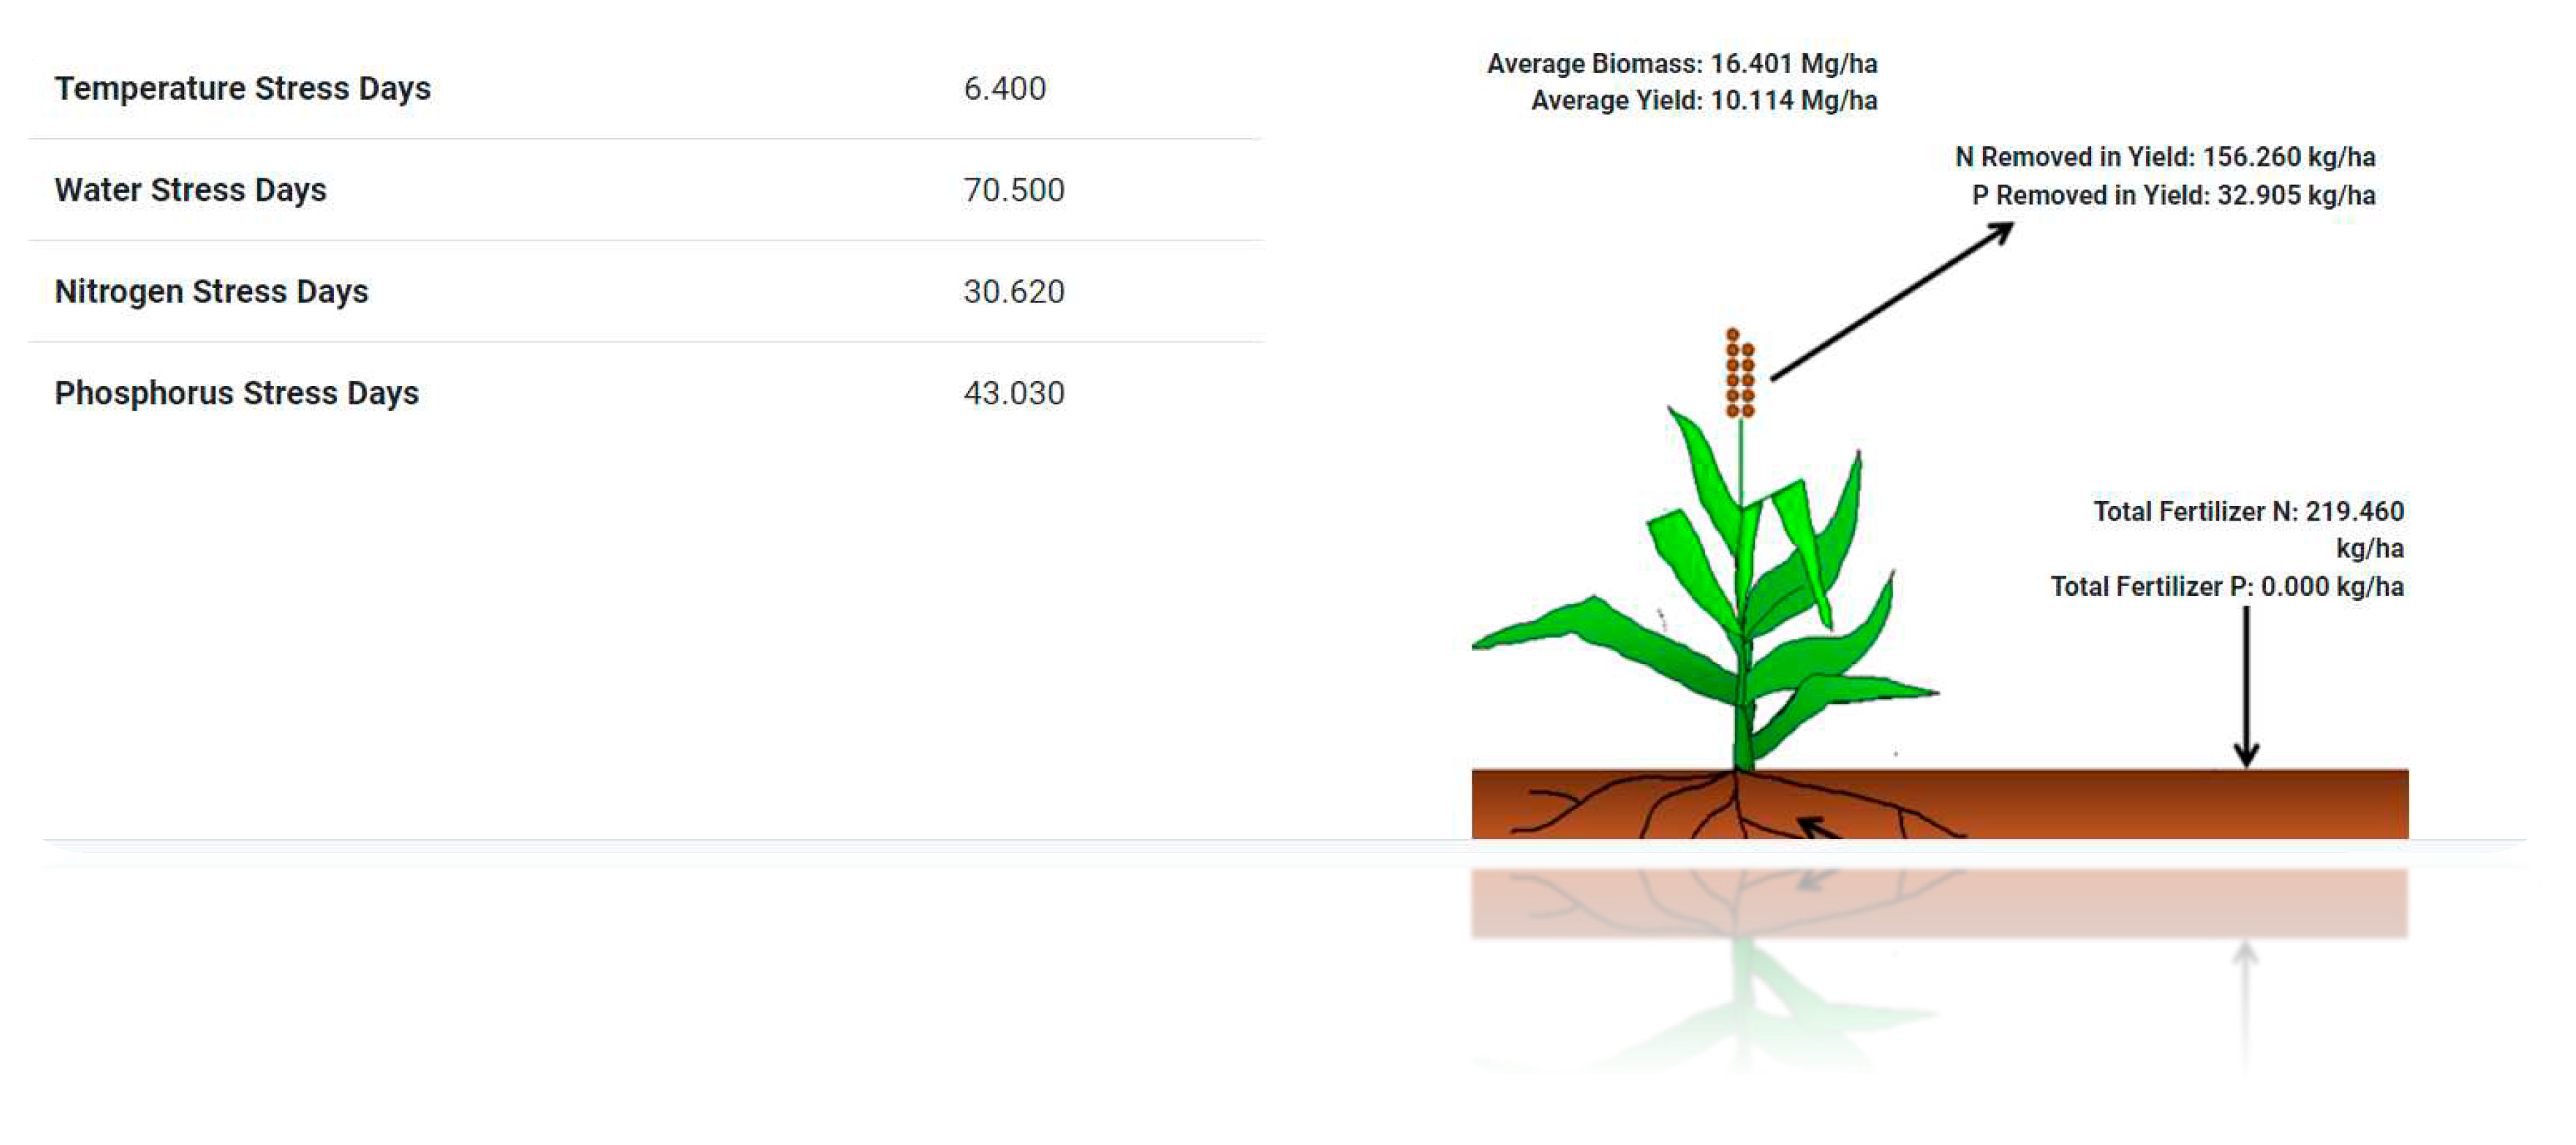
Figure 7.
Annual environmental conditions of the vegetation, climate change situation.
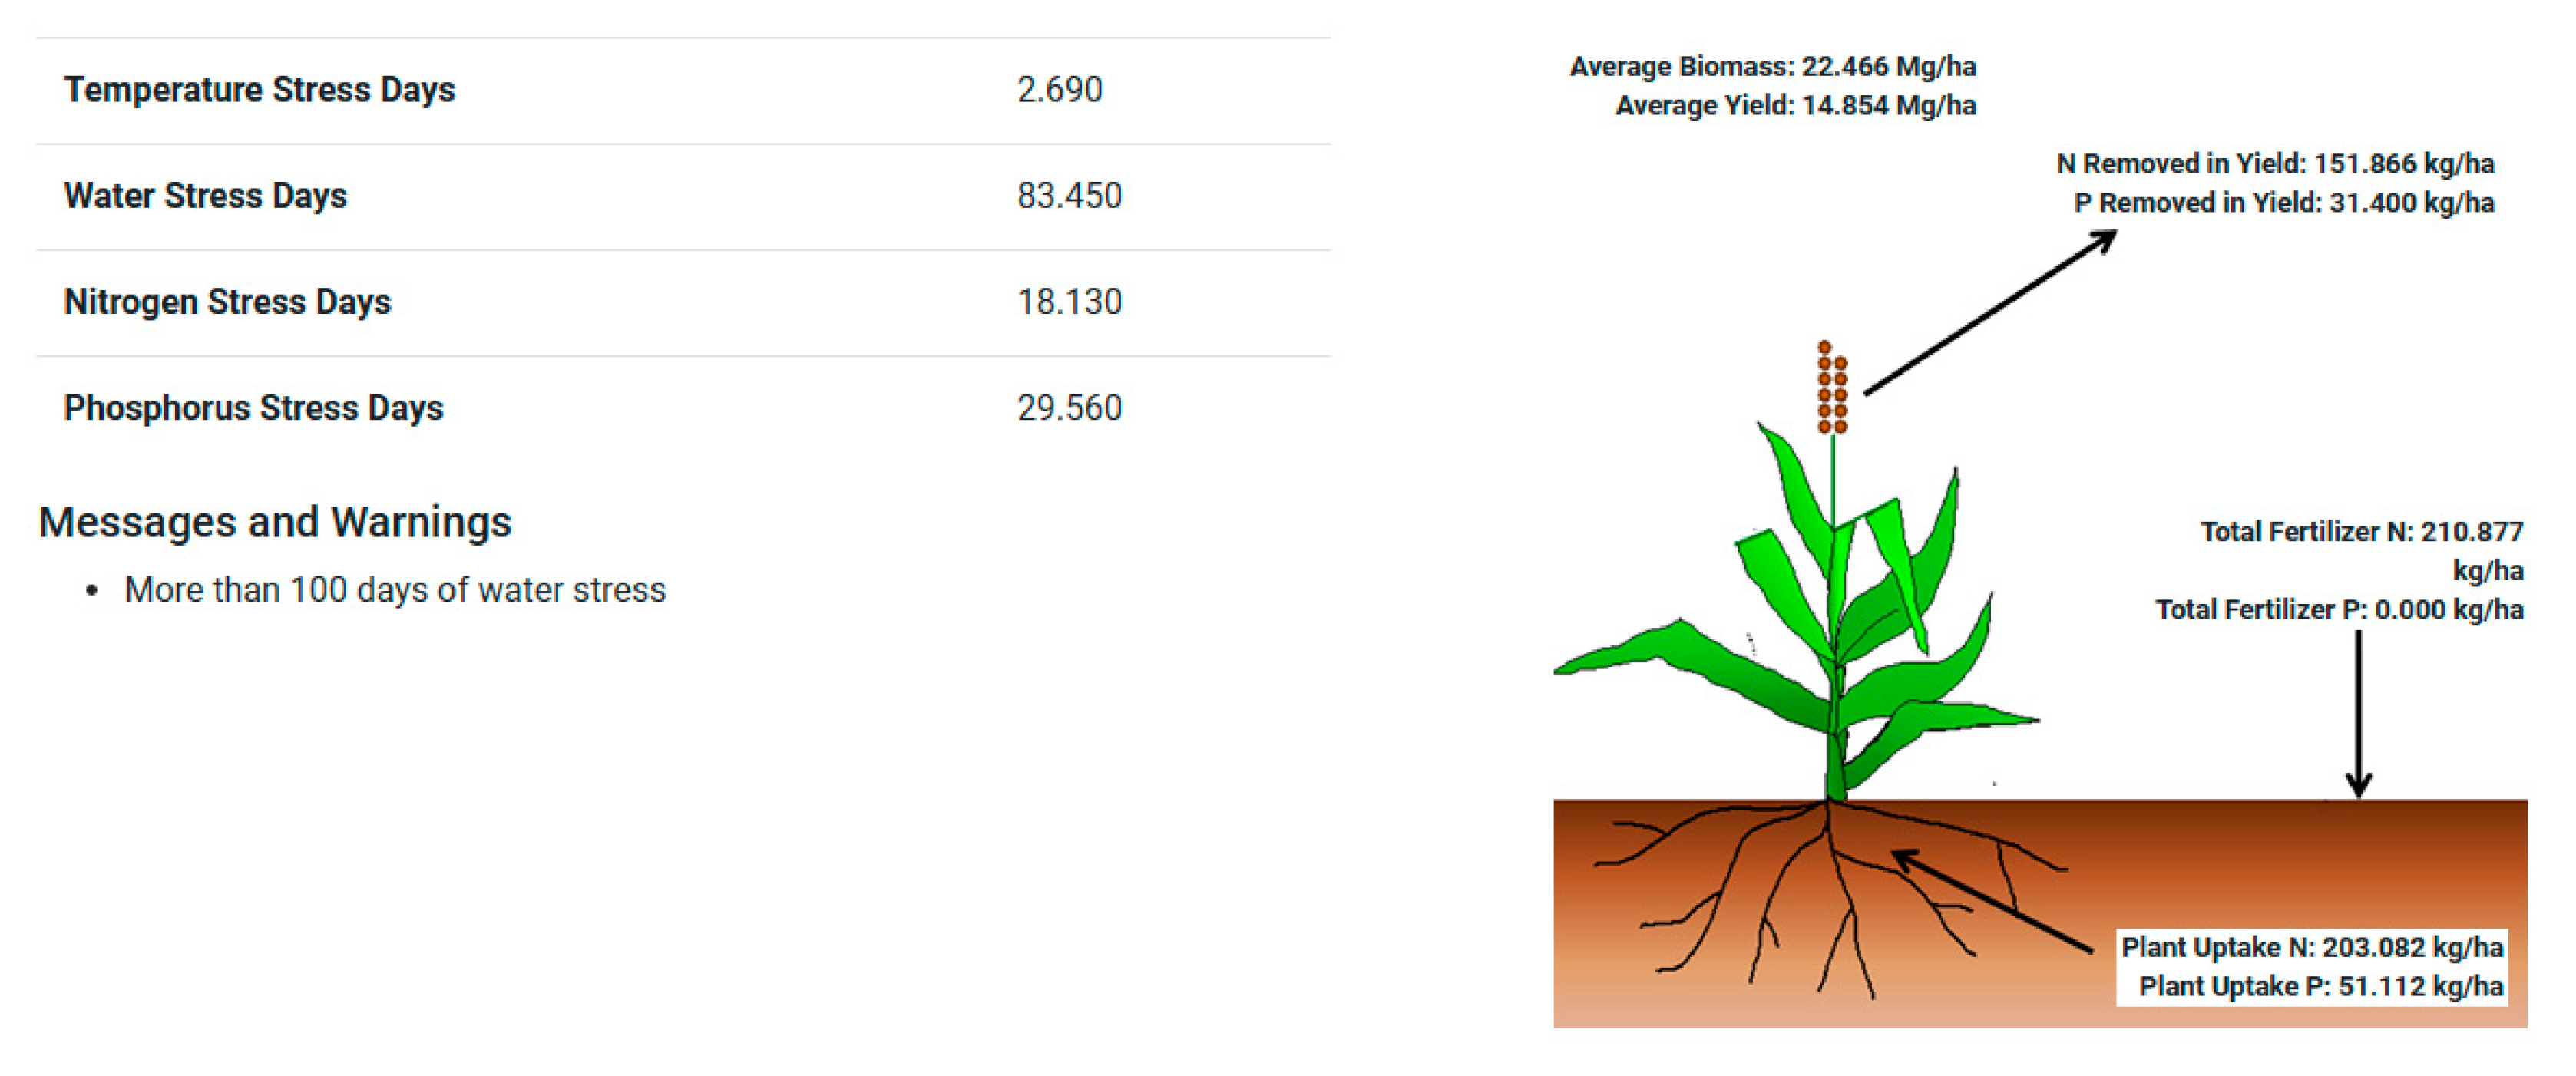
Figure 18.
RGB and surface temperature imagens in small area of the subbasin 73.
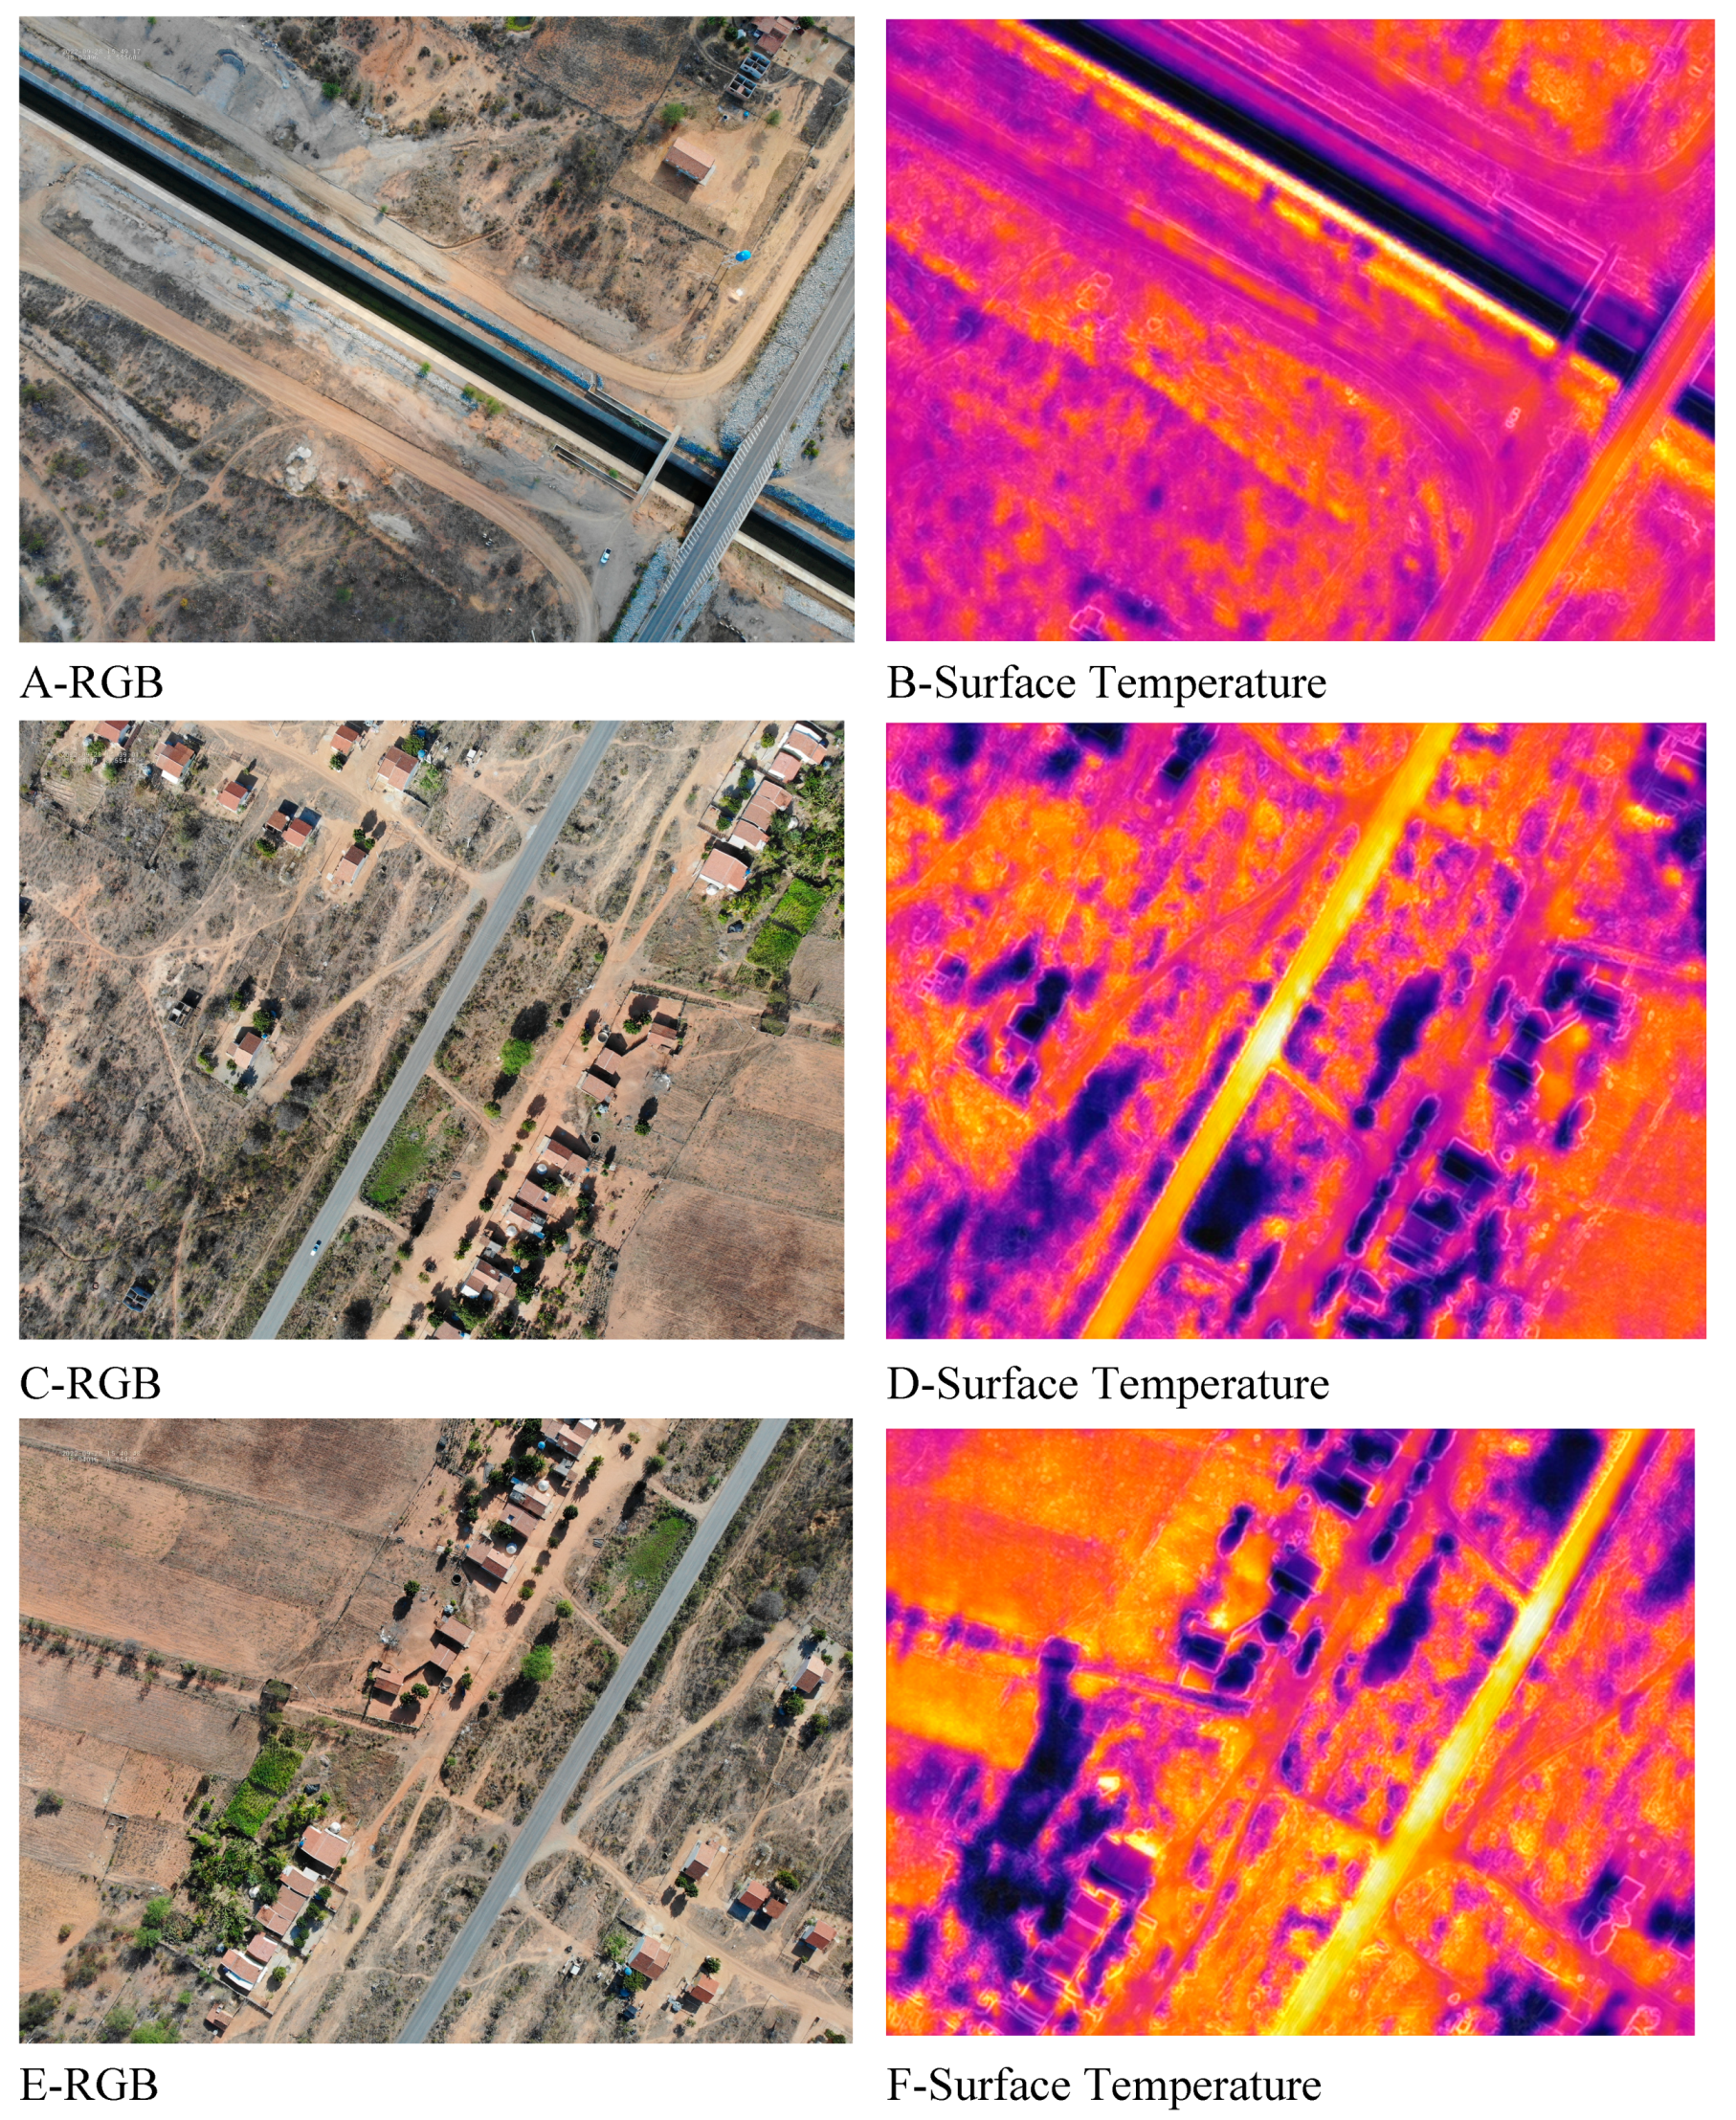

Table 1.
Water Balance Ratios.
| Streamflow/Precip | 0.244 |
|---|---|
| Baseflow/Total Flow | 0.545 |
| Surface Runoff/Total Flow | 0.455 |
| Perc/Precip | 0.163 |
| Deep Recharge/Precip | 0.008 |
| ET/Precipitation | 0.695 |
Disclaimer/Publisher’s Note: The statements, opinions and data contained in all publications are solely those of the individual author(s) and contributor(s) and not of MDPI and/or the editor(s). MDPI and/or the editor(s) disclaim responsibility for any injury to people or property resulting from any ideas, methods, instructions or products referred to in the content. |
© 2023 by the authors. Licensee MDPI, Basel, Switzerland. This article is an open access article distributed under the terms and conditions of the Creative Commons Attribution (CC BY) license (http://creativecommons.org/licenses/by/4.0/).
Copyright: This open access article is published under a Creative Commons CC BY 4.0 license, which permit the free download, distribution, and reuse, provided that the author and preprint are cited in any reuse.


