Submitted:
04 August 2023
Posted:
07 August 2023
You are already at the latest version
Abstract
Tuna species are an important resource to the people of the Pacific, particularly small island countries like Tonga, that have few alternative natural resources. These countries are dependent on this fishery for their nutrition, recreation, government revenue, employment, welfare and culture. Threatening these benefits, however, are global warming and climate uncertainties that affect the presence and distribution of tuna in the Pacific islands countries and territories. There-fore, one of the most important development goals for Tonga involves managing its tuna fish-eries in order to optimize these benefits within the context of climatic impacts. This paper has two main goals. Firstly, we discuss Tonga’s commitment to implement the existing tuna man-agement policies. This commitment permeates through a range of activities to monitoring catch regulations and regulate locally based foreign vessels to fish in the Economic Exclusive Zone of Tonga. This reflects the implementation of an information-based management framework namely, the Tonga National Tuna Fishery Management and Development Plan that is revised every five years. Secondly, the paper identifies key scientific research programs, which form the basis to design more informed future policies towards tuna management. These researches include : i) examining of the bathymetric features of the island nation’s fishing ground, ii) model-ling the spatio-temporal distribution of tuna and, iii) characterizing tuna habitats within an oceanic environment using biophysical oceanographic data within Geographic Information Sys-tem, and iv) impacts of climate change on tuna
Keywords:
economically important species
; exclusive economic zones
; fisheries research
; national obligations
; tuna fisheries management
1. Introduction
Tonga and many other Pacific Island Countries (PICs) in the Western and Central Pacific Ocean (WCPO) depend on tuna fisheries for food security, revenue, and social livelihoods [1,2,3]. Tongan fisheries largely targeted reef and lagoon species up to the early 1960s but due to a local population rise this resulted in overfishing of many inshore marine species. As a result, open water fishes such as tuna became the targeted species and soon attracted international fleets to Tongan waters [4]. International longline fleets from countries like Taiwan, Korea and the US mainly dominated the fishing of tuna until the early 1980s. By 2001, the number of registered, locally based foreign vessels increased to 25, and to 33 by 2003 [5]. However, a moratorium upon foreign fishing fleets (2004–2011) caused the decline of tuna longline vessels to 3 by 2011 [5]. The moratorium was lifted in 2011 as part of the Tonga’s long-term plan to expand its tuna fishery, which resulted in the licensing of 19 foreign longline vessels to fish in Tongan waters in 2012 and 2013 (Table 1) [5]. This expansion was based on the economically important tuna species: albacore Thunnus alalunga, bigeye Thunnus obesus, yellowfin Thunnus albacares, and skipjack Katsuwonus pelamis [5].
Regionally, management of tuna fisheries in the PICs is at a critical stage [3]. Countries in the WCPO continue to struggle with conflicting interests and issues pertaining to tuna management [6]. These issues include difference in access fees by distant water fishing nations (DWFNs) [7] and transshipment measures and harvest control rules for catch limits [8,9]. These complicate attempts to regulate management efforts within PIC’s exclusive economic zones (EEZs) [10,11]. Additionally, the Regional Fisheries Management Organizations (RFMOs) such as the Forum Fisheries Agencies (FFA) [12] and the Western and Central Pacific Fisheries Commission (WCPFC) [13] have established comprehensive management regimes for high seas stocks. However, these management actions have met very little success due to failures of PICs to adequately implement management measures and sustainability improvement processes [14]. In addition, the rise in population growth poses a threat in further overfishing of tuna [15].
The most pressing management question is, therefore, whether each nation should individually manage the fish within its EEZ, or whether a regional agency should manage the species at a broader scale. Either way, Tonga is committed to support the growing of this important resource at both national and regional levels. Figure 1 describes the framework by which Tonga monitors and reinforces its commitment towards its tuna fisheries. This commitment is evident through governance of relevant policies and laws. Effective governance is demonstrated through Tonga’s commitment to: i) implementing and monitoring catch regulations and ii) limiting the number of locally-based foreign and foreign licensed longlining vessels allowed to fish in the EEZ of Tonga. These commitments are executed through the implementation of an information-based management plan namely, the Tonga National Tuna Fishery Management and Development Plan that is revised every five years. The plan structure (Figure 1) also envisaged and factored in future climate uncertainties so that the fisheries are well-prepared to meet their future negative impacts. This paper highlights Tonga’s support capacity towards tuna management both at national and regional levels which provides a strong basis for sustainability of tuna species and ensuring optimal benefits are obtained. We have also identified key research priorities that could be basis for national planning and policy development for conservation and sustainable management of tuna.
2. National obligations: An information-based management
Tonga like many other countries is experiencing anthropogenic threats such as overfishing and climate variability and potentially these challenges will affect tuna stock [11,14,16]. Tuna stock assessments presented at the WCPFC 2017 meetings showed that tuna were being overfished [17] in the region, primarily due to the increasing number of international purse seine fleets allowed to fish in Pacific waters [18,19].
Although marine resources are freely accessible in Tonga, the Ministry of Fisheries stipulates the operational conditions for tuna fishing within its EEZ [5]. These conditions are outlined in two key information-based features; Tonga National Tuna Fishery Management and Development Plan 2018–2022 (TMDP) and the Implementation Schedule [5]. The TMDP and the Implementation Schedule are in line with Tonga’s Fisheries Management Act 2002 and Tonga Strategic Development Framework II [5]. Extensive consultation and stakeholder participation and dialogue were key in the production of these information-based resources. These are high-level policy documents that provide guidance to the management and development of tuna fishery and for that reason essentially require full support and cooperation of the tuna fishing industry in Tonga. The TMDP provides the government with goals and aspirations for the fisheries, strategies to enforce vessels licensing and compliance, a summary of the current state of tuna and guidelines for catch limit measures. The Implementation Schedule provides strategic directions upon which management actions are implemented. The Implementation Schedule addresses information management, administration and legal standards of the fishery. Moreover, the TMDP and Implementation Schedule provide clear directions for ‘vehicles’ that are accessing the tuna resources, and to ensure that the allocations for food security, livelihoods and economic growth are operating in the most sustainable and effective ways as shown in the theoretical framework flow diagram (Figure 1).
These national planners draw from a number of necessary reports and policy documents developed by the Tonga Ministry of Fisheries and regional fishing agencies such as the FFA and WCPFC [5]. Incorporated documents include regional and international arrangements and treaties designed to sustain catches and share benefits within the context of an ecosystem approach to fisheries management [20,21,22].
3. Improving profitability and sustainability through governance
3.1. Governance in implementing and monitoring catch regulations
One of the ways Tonga cooperates with other PICs in managing tuna resources is its comprehensive sampling of catch landings at designated authorized ports. Pursuant to the TMDP 2018–2022: “All licensed longline fishing vessels shall offload all catches (100%) in the authorized ports of Tonga”. The policy ensures that Tonga supports the International Commission for the Conservation of Atlantic Tunas (ICCAT) [5] management and conservation measures for tuna in the PICs. Upon this, Tonga particularly implements two management measures i) it closely monitors catches of ICCAT-specified endangered species and ii) compares cumulative catch volumes against annual quotas for each species. At the port, the state inspector verifies that all vessels’ relevant identification documentation is true and correct; cross-references authorization for fishing and related fishing activities and confirms that all fishing gear and devices on-board conform with catch regulations for the species being harvested [5]. In addition, through this comprehensive sampling, Tonga cooperates with the Secretariat of the Pacific Community (SPC) and WCPFC’s Offshore Fisheries Program to facilitate sustainable harvesting of tuna. For example, these regional organizations provide species stock status that recommend allowing no catch of Pacific bluefin based on its fully exploited status in the WCPO [14] and encourage more catch of skipjack based on low current catch rates and abundant stock status. Regardless, Tonga’s highest catches in 2013 of 2463 mt, and in 2016 of 2350 mt, were insignificant [5] compared to other Pacific nations as can be seen in the catch records of recent years (Table 1).
A major challenge facing tuna fisheries amongst PICTs is the declining fish stocks due to juvenile bycatch by the purse seine fishery using floating objects and fish aggregating devices [3]. Tonga is committed to comply with bycatch and non-target species catch regulations hence 100% check of catch landing at authorized ports [5]. Currently, Tonga has no access agreements with DWFN with the exception of the Multilateral Treaty of Fisheries with the United States, which allows US purse seiners to fish within Tongan waters. However, there have been very little US purse seine fishing operations in Tongan waters, due to the low productivity of the EEZ zone as compared to the equatorial belt [17]. Total Allowable Catch (TAC) for the main commercial tuna species in Tonga waters are 2500 mt for albacore, 2000 mt bigeye and yellowfin, and no limit for skipjack (Table 1) due to its sustained high recruitment rate and abundance in the WCPO [17]. These management limits are set based on and proportionally consistent with TAC recommendations by FFA and WCPFC [5].
3.2. Contribution to economy and livelihood
Tuna fisheries have been identified as one of Tonga’s most important natural resources [5,14]. The tuna industry in the WCPO is the largest in the world with annual catches exceed 2 million metric tons (mt), approximately 50 % of the global tuna catch [17]. The largest portion of the catch is taken within the EEZ of the PICs [19,23]. In 2014, PICs generated approximately US$820 million from total fishery exports and US$349 million from total foreign fishing access [24]. Similarly, tuna production is the largest commercial fishery in Tonga, which is estimated at 2000 mt per year (approximately 17% of 30% of Tonga marine resources related benefits). Most catches are given by locally based foreign vessels (mainly from Taiwan, Korea and China) that fish in Tonga under a framework of national and regional agreements. These benefits come mainly from foreign fishing vessels’ access fees (and related charges) and revenues from domestic and international marketing. The tuna industry also brings other benefits such as sport fishing, good nutrition through fish protein, subsistence and artisanal fisheries [2,5]. These benefits also culturally shape exhibit socially positive effects on livelihood [25]. However, in recent years the tuna fisheries in Tonga have been challenged with rising fuel prices, decline of tuna prices at both local and international markets, low catch rates, and general economic pressures [5]. Consequently, domestic operators struggle to remain viable despite the technical and policy support provided by the government and international donor agencies [5]. Documentations of national aspirations and strategies exist that attempt to redress and maximize social and economic benefits of tuna resources, and will be examined later in this review. In addition, this work reflects how Tonga wishes to develop its tuna resources for the benefits of its people. This highlights the fact that the government realizes that management of tuna resources is a national responsibility [26] and aspires to cooperate undauntedly with other Pacific island states to overcome economic, social and climatic challenges.
3.3. Governance of fleet size control
Longline is the main commercial fishing method used in Tonga. Current mandates limit the number of domestic, locally based foreign, and foreign licensed longlining vessels to 50, with no more than ten foreign vessels allowed to fish in the EEZ of Tonga at any given time [5]. Domestic and locally based foreign vessels have license preferences over foreign vessels. The extent of priority is so great that foreign vessels shall be phased out (fishing vessels > 50) when new local vessels apply for licenses. The 2004–2011 moratorium resulted in the decline of longlining vessels from 20 in 2004 to only 3 in 2011. The lifting of the moratorium in 2011 saw the increase of both the number of longline vessels and tuna catch in the subsequent years (Table 1). The number of licensed vessels increased from 3 in 2011 to 23 in 2012 and catch estimates of primary species in 2013 totaled to 2463 mt (Table 1) which is over a 40 % increase that of the previous year [5]. The purse seine fishery is limited to 150 – 250 fishing days per fishing vessel per year, which is in line with the WCPFC Vessel Day Scheme (VDS) regulation for purse seiners [3].
3.4. Fishing within EEZ
Global recognition of a 200-nautical mile EEZ around coastal nations allows PICs to claim vast amounts of maritime resources. On that, it is possible for a domestic fishery to grow if it sustainably utilizes the portion of a regional population that persists within its EEZ [26]. Moreover, on global scale, the PICs’ EEZs hold the largest tuna resources and provide some 65–75% of the WCPO’s tuna catch [27]. On another note, to date Pacific island states have been unable to effectively patrol their EEZs against distant water illegal fishers due to the vast area that requires ongoing observation coupled with a lack of financial, technical and scientific expertise. Furthermore, regional and national fishing management organizations have barely slowed the decline of key tuna species due to exploitation, unreported fishing, and product distribution [28]. Even so, Tonga is committed to protecting its EEZ (Figure 2) by improving its own patrol capabilities, practicing international tuna resource management regimes [5]. Likewise, Tonga is one of the few countries in the FFA and WCPFC that did not take quick steps to exploit its tuna resources, instead controlling foreign fishers access to its zone. In fact, Tonga is seemingly the only FFA member that had not entered into agreements with any distant water fishing nations by the end of 1989 [17].
Geographically, the EEZ of Tonga (Figure 2) spreads across – and –, which covers an area of about [29]. This EEZ envelops the northern end of the Tonga trench, Tonga Ridge, Tofua Arc Volcanic Front, northern end of the Tonga Kermadec Arc and the westward region of the Lau Basin [30]. Two geologically parallel chains of volcanic seamounts along the Tonga Ridge and the famous seamount of Capricorn 193 km east of Vava’u island. These geologically bathypelagic features are part of the island nation’s fishing ground (Figure 2). Albacore and yellowfin dominate Tonga’s annual catch from 2002 to 2018 over bigeye and skipjack (Table 1). In addition, bigeye (Figure 4), skipjack (Figure 5) and yellowfin (Figure 6) catches were primarily higher in the central and southern quadrants of the EEZ, while albacore (Figure 3) catches were relatively higher in the northern portion of Tonga’s EEZ (Figure 4). Overall, catch value (as indicated by number of metric tons) is higher in the area bounded by – and –, ie., central to the northern part of the EEZ.
4. Research opportunities in relation to an ecosystem-based approach to tuna management
Given how valuable tuna is and how committed this small island nation is to managing its tuna resource, it is crucial to design an ecosystem-based approach to management. Figure 1 shows the inclusion of science in its tuna management framework. Here we propose the understanding the variation of spatio-temporal distribution, the habitat of tuna in relation to their oceanic environment and the potential impacts of climate change, are essential in developing this ecosystem-based approach.
4.1. Spatio-temporal distribution of four main tuna species 2002–2018
The fishery deploys longline which mainly uses ultrasound radar to detect seamounts, depth of seafloor around the vessel and fish schools between the vessel and the seafloor. The traditional method of using seabirds as visual cues of fish aggregations is still being used [5]. The fishing vessels provide data that contains records of the temporal and spatial distribution of fish catch (latitude, longitude and time) and effort data (number of hooks and volume) of each tuna species. These records are kept by the Tonga Ministry of Fishery and the South Pacific Community (SPC) Office in New Caledonia. Scientists use this kind of information and data from catch to estimate and model the size and distribution of population being fished [31]. Studies have also used these kind of data to estimate rates of fishing [32] as well as the rate of recruitment of juveniles into adults [33].
An overview of the spatial-temporal distribution of the CPUE of albacore (Figure ), bigeye (Figure ), skipjack (Figure ) and yellowfin (Figure ) across the EEZ of Tonga over time period 2002–2018 are shown.. The figures show the catch in CPUE (1˚ spatial grid) plotted against latitudes and longitudes. Generally, highest CPUE are in latitude range – and longitude range – of the EEZ for all species. The distribution of CPUE shown, suggests that most of the fishing effort of the tuna longliners was concentrated in these geographical ranges. This is evident of areas most occupied by fishing fleets. Figure 7 shows the annual (Figure 7A), monthly (Figure 7B) and daily (Figure 7C) trends of catch (in CPUE) for the four main tuna species from 2002 to 2018. Annual trend shows the highest catch was in 2016 followed by 2015 and lowest in 2003 followed by 2004. Monthly trend shows the highest catch was in the months of June and July. Daily catches show constant catch values throughout the month. Figure 7D shows the median (indicated by the mark within the quartiles) and relative density (indicated by the width and height of the plot) of data points of each species. Also, data such as the catch and catch per unit effort provides estimates of important information such as the size of the stock population and rates of recruitment of juveniles to the adult population [34].
4.2. Tuna habitats in relation to biological and physical oceanic conditions
Understanding the variability of the distribution of tuna as influenced by oceanic conditions both spatially and temporally [35] is vague to tuna fisheries in Tonga [5]. Furthermore, there have been no scientific studies done on tuna fishing based on their oceanic habitats such as sea surface temperature and bathymetry in Tonga EEZ as reported by their Ministry of Fisheries [5]. The understanding and skills of species distribution are gained through the application of satellite remote sensing within Geographic Information System (GIS). These are tools to improve the work of tuna management processes and outcomes [36]. Tonga needs this knowledge and understanding to support its goal for improving sustainability and productivity of tuna. We will use this as basis to design similar studies that have been conducted in other places [37,38] using the application stated above. Our goal is to improve stock assessment by integrating classical fishery data with environmental information from satellite remote sensing data.
It is important to note that studies based on fishery data and statistical methods alone have inherent deficiencies that have occasionally caused management failures and closures of fishing industries [39]. This assessment method is based largely upon data collected by fishing vessels and research cruises. As a result, national and international agencies are seeking for a more ecological approach to managing marine species such as tuna. Therefore, it is crucial to establish proper management of the stocks so that harvesting is at sustainable scale. Thus, an ecological approach that seeks to understand why these species occupy these areas within greater physical, chemical and biological processes will provide a more informed management laws and plans. This is one of the key research priorities for the tuna fisheries in Tonga.
Studies have shown environmental variables and oceanic conditions also have been proven to influence the presence and spatio-temporal distribution of tuna [40,41] therefore, characterizing their habitats is essential to understanding more their physiological and biological needs and processes. Fish biology and behavior are simulated based on relationships with environmental variables [42]. Potential fishing zones have been identified in countries’ EEZs as a results of using the information extracted from satellite data [43,44]. Generally, tuna have no geographical boundaries, swimming constantly in search for food and favorable places for their survival. It is therefore hard to monitor their habitat because their global distribution covers vast ocean area. Satellite data such as sea surface temperature, sea surface chlorophyll concentration, sea surface height, salinity, wind velocity, and surface current have been used to study tuna habitat variability in other places [31,45,46,47].
Food supply (abundance) and sea surface temperature are cited as the main environmental factors influencing tuna habitat [41,48]. Sea surface temperature directly affects physiological functions of tuna. Sea surface chlorophyll concentration is linked to primary production and thus the upper trophic level production as well as the subsurface light field in eutrophic zone [49,50]. Bathymetry has been identified to affect catch rate of yellow and bigeye tuna in the Indian Ocean with their CPUE generally becomes higher as steep bathymetry zones become larger [51,52]. Sea surface height is linked to ocean near surface advection, convergent and divergent flows [45]. Wind and current velocities are included because they influence the transport of phytoplankton and small pelagic fishes hence affects the distribution of higher trophic marine animals [53].
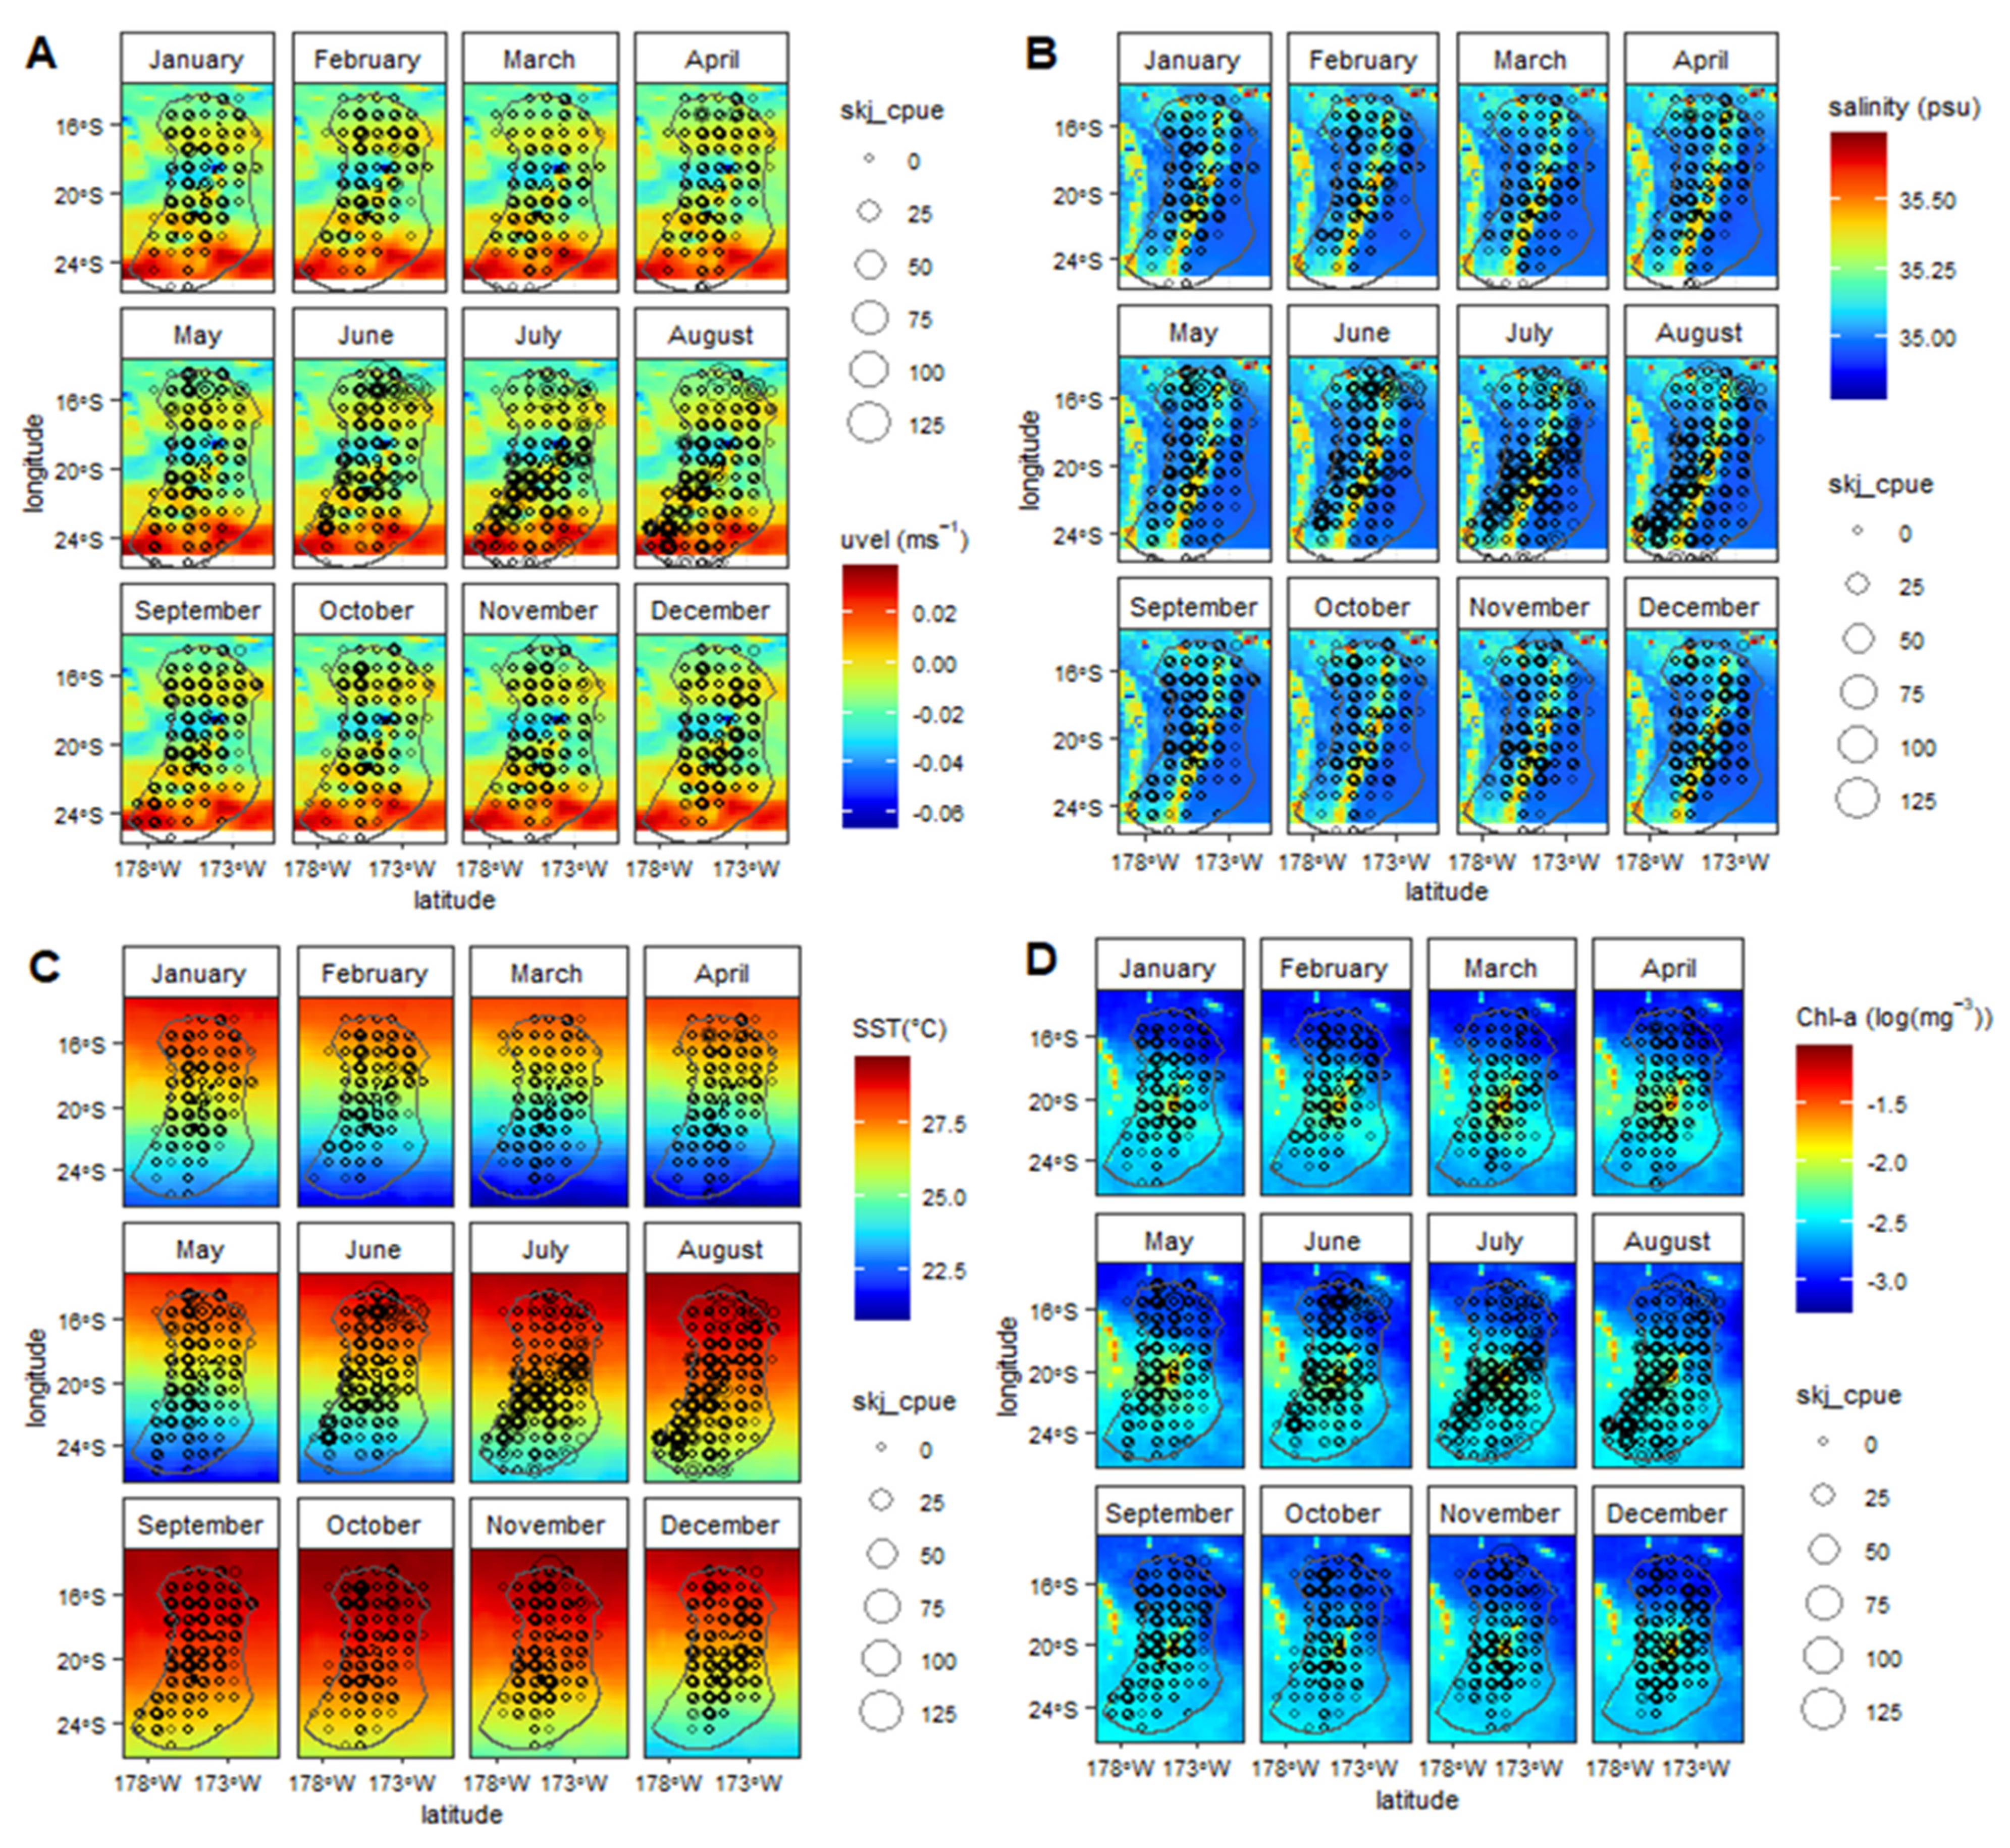
The work of habitat suitability and species distribution modelling have been proven to improve tuna fishery production and management [36,50,54,55]. Our initial work, shown (figure 5), in the R-software [56] we used the ggplot2 package [57] to generate our visualization and the dplyr and tidyverse packages [58] for data manipulation and analysis. The catch and effort data were aggregated into monthly resolved datasets to match the temporal scales of the environmental data. The utilities, geom_raster and geom_point of ggplot2 were used for the overlaying of the environmental and the fishery data monthly composites.
An overview (Figure 8) of the spatio-temporal monthly distribution of sea surface current (zonal current, uvel in ms-1, Figure 8A), sea surface salinity (in psu, Figure 8B), sea surface temperature (in °C, Figure 8C) and sea surface chlorophyll (Chl-a in mg m-3, Figure 8D) are from 2002 to 2018. The sea surface current and sea surface salinity are the monthly/0.25 degree2 of the NASA ECCO-2 Global Circulation Model (ecco2.jpl.nasa.gov) and sea surface temperature and Chl-a are the daily/0.25 degree2 are the Advanced Very High Resolution Radiometer (AVHRR) sensor on board the National Oceanic and Atmospheric Administration (NOAA) satellites [59]. Here for demonstration purposes, we overlayed the monthly distributions of the CPUE of skipjack by the longline fishery from January to December within the same time series. The distribution of CPUE shown (Figure 5) suggests that the occurrence of skipjack was mostly found in the central part of the EEZ and towards the northern area. In addition, the high tuna CPUE were observed during winter (April-October) and relatively low encounters were observed during summer (November-March).
Comprehending the spatial and spatio-temporal distribution of tuna in relation to their environmental conditions is particularly crucial for Tonga’s tuna fisheries given the small size of its EEZ. As a small island nation heavily dependent on tuna resources [5,17] sustainable management of its fisheries is paramount for economic growth, food security, and conservation of marine ecosystems. By identifying high-density areas, tuna fisheries can concentrate their operations, leading to more efficient and sustainable practices. Conversely, avoiding areas with low CPUE can minimize incidental catch of non-target species, contributing to ecosystem preservation. Knowing the spatial distribution of tuna CPUE allows Tonga’s fisheries to focus their efforts on areas with higher fish abundance, optimizing catch rates while minimizing operational costs and environmental harm associated with extensive searching. Furthermore, understanding the temporal distribution of tuna CPUE is vital in Tonga’s case to ensure proper timing of fishing activities. By identifying seasonal patterns in tuna movements and aggregations, fisheries can align their operations with peak abundance periods, thus maximizing catches without overexploiting the resource. Considering the potential impacts of climate change on tuna distribution [60,61], knowledge of how environmental conditions influence CPUE becomes even more critical for Tonga. As changing ocean temperatures and currents can shift tuna habitats [44,48,54], understanding these relationships helps Tonga anticipate and adapt to fluctuations in tuna availability, reducing economic and food security risks.
Figure 8.
The monthly CPUE and monthly environmental conditions distribution for A) sea surface current, B) sea surface salinity, C) SST and D) Chl-a within the EEZ, , longitude of Tonga.
Figure 8.
The monthly CPUE and monthly environmental conditions distribution for A) sea surface current, B) sea surface salinity, C) SST and D) Chl-a within the EEZ, , longitude of Tonga.
4.3. Tuna and climate variability
Climate variability such as the El Nino Southern Oscillation (ENSO) and global warming have negative impacts on global fisheries [62]. Global warming is a direct result of anthropogenic activities [63] with predicted negative impacts including increasing global temperature, changing weather patterns, rising sea levels, acidifying oceans, changing nutrient loads in ocean circulations, increasing stratification of the water column, and changing precipitation patterns affect marine habitats [60,64,65]. Under those circumstances, these negative impacts exert environmental stress on primary producers, which then are transferred through the trophic webs. Furthermore, impacts arise throughout marine communities including changes in tuna distribution and abundance [60,61,66]. These environmental threats translate as socio-economic vulnerability in Pacific island states through their dependency on tuna fisheries [11]. As stated above, if PIC governments act cooperatively they can have extremely vital roles in ensuring tuna species in their waters are managed sustainably. Tonga, is committed to work collaboratively with other PICs to manage the tuna stocks within its waters through the implementation of management structure and measures in placed at both national and regional levels [5].
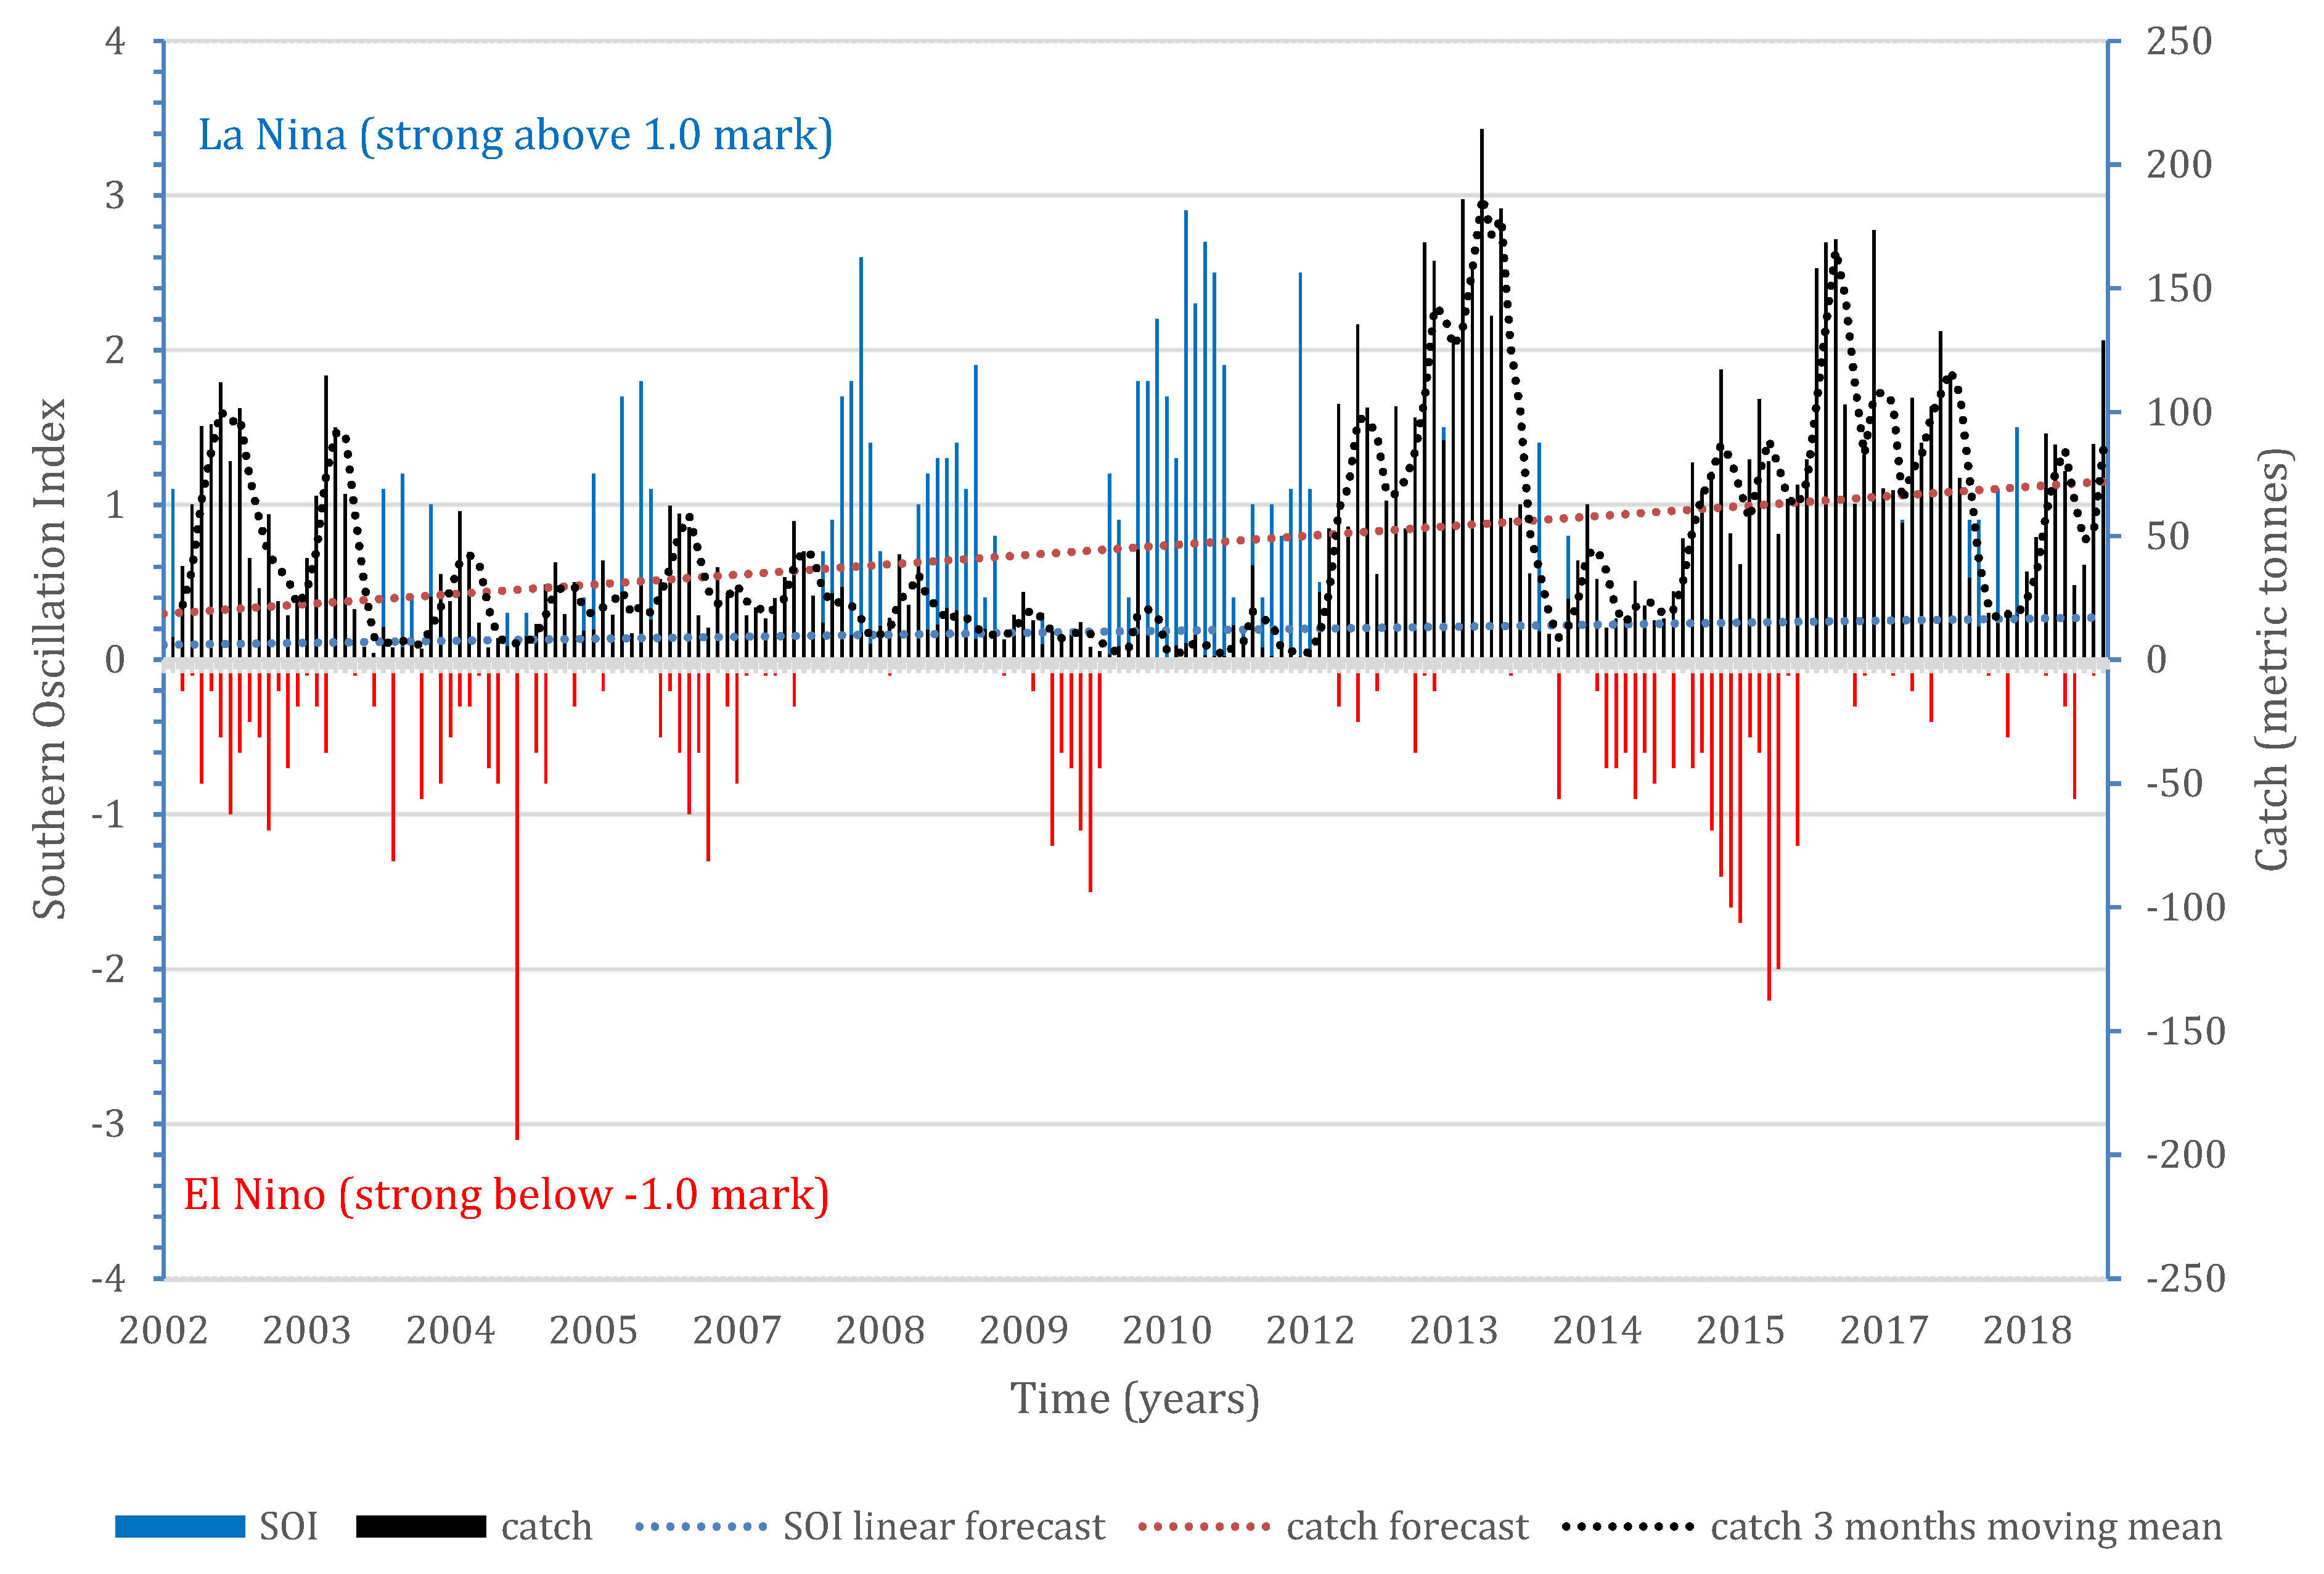
ENSO events have had clear historical impacts on tuna catches in Tonga (figure 3) and studies have shown changes to tuna’s spatio-temporal distribution is strongly linked to these events [67]. Figure 8 shows 2004/2005, 2009-2011 and 2014 as periods with low catches. The shift is precipitated by positive anomalies of sea surface temperature show moderate to strong El Nino events in time period of 1997/98 (strong), 2003/04 (moderate) [60], 2009/10 (moderate to strong) [68], and 2014 – 2016 (moderate to strong) [69]. These correspond to periods of low catches in Tonga. Our goal is to use this corresponding pattern in catch and El Nino events (indicated by SOI Index) as basis of further researches. Studies have shown that, ENSO events are known to cause climate variability and are the major phenomena driving seasonal and inter-annual ocean processes in the Western Pacific [70]. ENSO events affect tuna catchability through the spatial shift of tuna’s preferred habitat away from normal fishing grounds [67,71,72]. Other studies [60,73,74] have used species distribution modelling to predict the current and future distribution of tuna in relation to climate change. These studies have shown spatial and temporal shifts in their tuna abundance due to biophysical changes of their habitats. For example, Senina et al. (2018) [46] showed an eastern shift in the biomass of skipjack and yellowfin tuna over time at the Pacific basin scale and within the EEZs of PICTs using the application of the model SEAPODYM applied each tuna species.
Figure 8.
SOI and tuna catch patterns of 2002 to 2018 with linear forecasts of catch and SOI and 3 months moving mean of catch.
Figure 8.
SOI and tuna catch patterns of 2002 to 2018 with linear forecasts of catch and SOI and 3 months moving mean of catch.
With the environmental conditions, it can be seen that the distribution of zonal current and sea surface salinity are homogeneous throughout the year (Figures 5A and B). Sea surface current is distributed in a range of -0.06 to 0.02 ms-1 and sea surface salinity is distributed in a range of 35 to 35.50 psu respectively. However, relatively high sea surface current is shown at high latitudes between 22°S – 25°S. For sea surface temperature and Chl-a, their distribution is not homogeneous in the EEZ of Tonga. SST has pronounced seasonal variability with the value ranges from to (Figure 5C). From December to August, the temperature is relatively cooler between and . From September to November the temperature increases to a range between and . The distribution of Chl-a concentration also suggests seasonal variations (Figure 5D). The value of Chl-a concentration is at a range of 0.03 to 0.1 mg m-3. Generally, higher Chl-a concentration occurred in the central-southern part of the EEZ during winter from June to September and lower in the central-northern part of the EEZ during summer from October to May.
5. Conclusion
Tonga like many other PICs in the WCPO depends on tuna fisheries for food security, revenue, and social livelihoods. Despite facing challenges (eg. low catch values over the years and impacts and threats of climate variability), it is committed to developing and growing its tuna fisheries. This is evident through the strong management measures set up to promote governance and improve profitability and sustainability of the fishery. Controlling fleet size, monitoring catch regulations, protecting its EEZ are major key management issues being discussed. This national effort confirms Tonga’s commitment to support regional and international regulations as a means to sustainably harvest their tuna resources. Tonga’s commitment also is to ensure that economic benefits, employment opportunities and food security from tuna are sustainable. Furthermore, this aspires to enhance the regional and international relationships by meeting tuna related international laws and regulations. Two of these regulations are ensuring tuna catch does not exceed sustainable levels (i.e., not more than its annual quotas) and obtaining all foreign vessels access and license fees.
The paper also links the fishery policy framework and science upon which it identifies key research areas that could be conducted to support the fishery. The work of habitat suitability and species distribution modelling has been proven to improve tuna fishery production and management. This type of study has been successfully conducted in other regions and proven to improve accessibility of fleets to high density fishing zones. The utilization of satellite remotely sensed oceanographic and fishery data integrated within GIS environment is key feature in this research method. Importantly, climate change, such as ENSO and global warming have negative impacts on global fisheries. ENSO events have had clear historical impacts on tuna catches in Tonga as shown by time series trends of catch landing and SOI. The information and outcomes of these studies can be utilized as a decision support tool for ecosystem-based management and aid future scientific researches on tuna in Tonga.
Supplementary Materials
PDF file of the Tonga National Tuna Fishery Management and Development Plan 2018–2022 [5]. The following supporting information can be downloaded at: DOI https://doi.org/10.5061/dryad.nk98sf7xs.
Author Contributions
S.V. wrote the draft manuscript with input from S.K. All authors contributed to designing the study, the analysis, the interpretation of the results, the critical revision, and approval of the final manuscript. S.K. supervised the project. All authors have read and agreed to the published version of the manuscript.
Funding
Pacific European Marine Program (PEUMP) grant number F3288 funded this research, and the APC was also funded by PEUMP.
Data Availability Statement
All species data and extracted predictor variables are available in: DOI https://doi.org/10.5061/dryad.nk98sf7xs.
Acknowledgments
The authors would like to thank the Pacific European Marine Program for financially supporting this study and the Tonga Ministry of Agriculture, Forestry and Fisheries and the SPC for providing the fishery datasets from the Tonga longline fishery industry. Also, the authors acknowledge NOAA of the USA for the environmental and bathymetry remotely sensed datasets and the R community.
Conflicts of Interest
All authors declare they have no conflicts of interest.
References
- Barclay, K.,; Cartwright, I. Governance of tuna industries: The key to economic viability and sustainability in the western and central pacific ocean. Marine Policy, 2007, 31, 348–358. [CrossRef]
- Bell, J. D.,; Kronen, M.,; Vunisea, A.,; Nash, W. J.,; Keeble, G.,; Demmke, A.,; Pontifex, S. Planning the use of fish for food security in the pacific. Marine Policy, 2009, 33, 64–76. [CrossRef]
- Havice, E. Rights-based management in the western and central pacific ocean tuna fishery: Economic and environmental change under the vessel day scheme. Marine Policy, 2013, 42, 259–267. [CrossRef]
- Bayliff, W. H. The fisheries for tunas in the eastern pacific ocean. In Advances in tuna aquaculture, 2016, 21–41. [CrossRef]
- MAFF, and FFA. 2018. Tonga tuna fishery framework 2018 - 2022. Ministry of Agriculture, Forestry; Fisheries, Fishery Forum Agency, Nuku’alofa, Tonga.
- Ram-Bidesi, V.,; Tsamenyi, M. Implications of the tuna management regime for domestic industry development in the pacific island states. Marine Policy, 2004, 28, 383–392. [CrossRef]
- Havice, E. The structure of tuna access agreements in the western and central pacific ocean: Lessons for vessel day scheme planning. Marine Policy, 2010, 34, 979–987. [CrossRef]
- Dalzell, P.,; Kingma, E.,; Bailey, A. S.,; Ha, P.,; McGregor, M.,; Tosatto, M. D. Amendment 7 fishery ecosystem plan for pelagic fisheries of the western pacific region regarding the use and assignment of catch and effort limits of pelagic management unit species by the US pacific island territories and specification of annual bigeye tuna catch limits for the US pacific island territories: Including an environmental assessment and regulatory impact review, 2014, RIN 0648-BD46.
- McCoy, M. A. Regulation of transshipment by the western and central pacific fisheries commission: Issues and considerations for FFA member countries. Gillett, Preston; Associates. 2007.
- Langley, A.,; Hampton, J.,; Ogura, M. Stock assessment of skipjack tuna in the western and central pacific ocean. WCPFC SC1 SA WP-4. Bigeye tuna Yellowfin tuna. 2005.
- McIlgorm, A. Economic impacts of climate change on sustainable tuna and billfish management: Insights from the western pacific. Progress in Oceanography, 2010, 86, 187–191. [CrossRef]
- Van Dyke, J.,; Haftel, S. Tuna management in the pacific: An analysis of the south pacific forum fisheries agency. U. Haw. L. Rev., 1981, 3: 1.
- Gillett, R.,; Lightfoot, C. The contribution of fisheries to the economies of pacific island countries. Asian Development Bank. 2001.
- Williams, P.,; Terawasi, P. Overview of tuna fisheries in the western and central pacific ocean, including economic conditions–2010. WCPFC-SC7-2011/GN WP-1. 2011.
- Bell, J. D.,; Allain, V., Allison, E. H.,; Andréfouët, S.,; Andrew, N. L.,; Batty, M. J.,; Blanc, M. Diversifying the use of tuna to improve food security and public health in pacific island countries and territories. Marine Policy, 2015, 51, 584–591. [CrossRef]
- Cochrane, K.,; De Young, C., Soto, D.,; Bahri, T. Climate change implications for fisheries and aquaculture. FAO Fisheries and aquaculture technical paper, 2009, 530, 212.
- WCPFC. Overview of tuna fisheries in the western and central pacific ocean, including economic conditions. WCPFC-TCC13-2017-IP0, Rarotonga, Cook Is. 2017.
- Dagorn, L.,; Holland, K. N.,; Restrepo, V.,; Moreno, G. Is it good or bad to fish with FAD s? What are the real impacts of the use of drifting FAD s on pelagic marine ecosystems? Fish and fisheries, 2013, 14, 391–415. [CrossRef]
- Evans, K.,; Young, J.,; Nicol, S.,; Kolody, D.,; Allain, V.,; Bell, J.,; Brown, J. N. Optimising fisheries management in relation to tuna catches in the western central pacific ocean: A review of research priorities and opportunities. Marine Policy, 2015, 59, 94–104. [CrossRef]
- Link, J.S.,; Huse, G.,; Gaichas, S.,; Marshak, A.R. Changing how we approach fisheries: a first attempt at an operational framework for ecosystem approaches to fisheries management. Fish and Fisheries, 2020, 21, 393-434. [CrossRef]
- Morishita, J. What is the ecosystem approach for fisheries management?. Marine policy, 2008, 32, 19-26. [CrossRef]
- Heenan, A.,; Pomeroy, R.,; Bell, J.,; Munday, P.L.,; Cheung, W.,; Logan, C.,; Brainard, R.,; Amri, A.Y.,; Aliño, P.,; Armada, N.,; David, L. A climate-informed, ecosystem approach to fisheries management. Marine Policy, 2015, 57, 182-192. [CrossRef]
- Yeeting, A. D.,; Bush, S. R.,; Ram-Bidesi, V.,; Bailey, M. Implications of new economic policy instruments for tuna management in the western and central pacific. Marine Policy, 2016, 63: 45–52. [CrossRef]
- Gillett, R.,; Tauati, M. I. Fisheries of the pacific islands: Regional and national information. FAO Fisheries and Aquaculture Technical Paper: Food; Agriculture Organization of the United Nations. 2018. 1–400.
- Kronen, M.,; Vunisea, A.,; Magron, F.,; McArdle, B. Socio-economic drivers and indicators for artisanal coastal fisheries in pacific island countries and territories and their use for fisheries management strategies. Marine Policy, 2010, 34, 1135–1143. [CrossRef]
- Sibert, J.,; Hampton, J. Mobility of tropical tunas and the implications for fisheries management. Marine Policy, 2003, 27: 87–95. [CrossRef]
- Gillett, R.,; McCoy, M.,; Rodwell, L.,; Tamate, J. Tuna: A key economic resource in the pacific islands. A report prepared for the asian development bank and the forum fisheries agency. In Tuna: A key economic resource in the pacific islands. A report prepared for the asian development bank and the forum fisheries agency. 2001.
- Miller, K. A. Climate variability and tropical tuna: Management challenges for highly migratory fish stocks. Marine Policy, 2007, 31, 56–70. [CrossRef]
- Kawaley, I. Implications of exclusive economic zone management and regional cooperation between south pacific small midocean island commonwealth territories. Ocean Development & International Law, 1999, 30, 333–377. [CrossRef]
- Stone, K.,; Fenner, D.,; LeBlanc, D.,; Vaisey, B.,; Purcell, I.,; Eliason, B. Tonga. In World seas: An environmental evaluation. 2019, 661-678.
- Arrizabalaga, H.,; Dufour, F.,; Kell, L.,; Merino, G.,; Ibaibarriaga, L.,; Chust, G.,; Irigoien, X.,; Santiago, J.,; Murua, H., Fraile, I.,; Chifflet, M. Global habitat preferences of commercially valuable tuna. Deep Sea Research Part II: Topical Studies in Oceanography, 2015, 113, 102-112. [CrossRef]
- Polacheck, T. Tuna longline catch rates in the Indian Ocean: Did industrial fishing result in a 90% rapid decline in the abundance of large predatory species?. Marine Policy, 2006, 30, 470-482. [CrossRef]
- Methot Jr, R.D.,; Wetzel, C.R. Stock synthesis: a biological and statistical framework for fish stock assessment and fishery management. Fisheries Research, 2013, 142, 86-99. [CrossRef]
- Glaser, S. M.,; Ye, H., Maunder, M.,; MacCall, A.,; Fogarty, M.,; Sugihara, G. Detecting and forecasting complex nonlinear dynamics in spatially structured catch-per-unit-effort time series for north pacific albacore (thunnus alalunga). Canadian Journal of Fisheries and Aquatic Sciences, 2011, 68, 400–412. [CrossRef]
- Cornic, M.,; Rooker, J. R. Influence of oceanographic conditions on the distribution and abundance of blackfin tuna (thunnus atlanticus) larvae in the gulf of mexico. Fisheries Research, 2018, 201, 1–10. [CrossRef]
- Lan, K.-W.,; Shimada, T.,; Lee, M.-A.,; Su, N.-J.,; Chang, Y. Using remote-sensing environmental and fishery data to map potential yellowfin tuna habitats in the tropical pacific ocean. Remote Sensing, 2017, 9, 444. [CrossRef]
- Nurdin, S.,; Lihan, T.,; Mustapha, A. Mapping of potential fishing grounds of rastrelliger kanagurta (cuvier, 1816) in the archipelagic waters of spermonde indonesia using satellite images. In Malaysia geospatial forum. 2012.
- Rajapaksha, J.,; Samarakoon, L.,; Gunathilaka, A. Environmental preferences of yellowfin tuna in the northeast indian ocean: An application of satellite data to longline catches. International Journal of Fisheries and Aquatic Sciences, 2013, 2, 72–80.
- Walters, C., and Maguire, J.-J. 1996. Lessons for stock assessment from the northern cod collapse. Reviews in fish biology and fisheries, 1996, 6, 125–137. [CrossRef]
- Harrison, D. P.,; Hinton, M. G.,; Kohin, S.,; Armstrong, E. M.,; Snyder, S.,; O’Brien, F.,; Kiefer, D. K. The pelagic habitat analysis module for ecosystem-based fisheries science and management. Fisheries Oceanography, 2017, 26, 316–335. [CrossRef]
- Setiawati, M. D.,; Sambah, A. B.,; Miura, F.,; Tanaka, T.,; As-syakur, A. R. Characterization of bigeye tuna habitat in the southern waters off java–bali using remote sensing data. Advances in Space Research, 2015, 55: 732–746. [CrossRef]
- Keyl, F.,; Wolff, M. Environmental variability and fisheries: what can models do?. Reviews in Fish Biology and Fisheries, 2008, 18, 273-299. [CrossRef]
- Mainuddin, M.,; Saiton, K.,; Saiton, S. Albacore fishing ground in relation to oceanographic conditions in the western north pacific ocean using remotely sensed satellite data. Fish Oceanogr, 2008,17, 61–73.
- Roandrianasolo Tsihoboto, M.,; John, B.,; Rijasoa, F. Analysis of environmental parameters effects on the spatial and temporal dynamics of tropical tuna in the EEZ of madagascar: Coupling remote sensing and catch data. Universidad de Alicante. Instituto Interdisciplinar para el Estudio del, 2015. [CrossRef]
- Lumban-Gaol, J.,; Leben, R. R.,; Vignudelli, S.,; Mahapatra, K.,; Okada, Y.,; Nababan, B.,; Mei-Ling, M. Variability of satellite-derived sea surface height anomaly, and its relationship with bigeye tuna (thunnus obesus) catch in the eastern indian ocean. European Journal of Remote Sensing, 2015, 48, 465–477. [CrossRef]
- Polovina, J.J.,; Howell, E.A. Ecosystem indicators derived from satellite remotely sensed oceanographic data for the North Pacific. ICES Journal of Marine Science, 2005, 62,, 319-327. [CrossRef]
- Novianto, D.,; Susilo, E. Role of sub surface temperature, salinity and chlorophyll to albacore tuna abundance in Indian Ocean. Indonesian Fisheries Research Journal, 2016, 22, 17-26. [CrossRef]
- Wiryawan, B.,; Loneragan, N.,; Mardhiah, U.,; Kleinertz, S.,; Wahyuningrum, P.I.,; Pingkan, J.,; Timur, P.S.,; Duggan, D.,; Yulianto, I. Catch per unit effort dynamic of yellowfin tuna related to sea surface temperature and chlorophyll in Southern Indonesia. Fishes, 2020, 5, 28. [CrossRef]
- Hidayat, R.,; Zainuddin, M.,; Putri, A. R. S. Skipjack tuna (katsuwonus pelamis) catches in relation to chlorophyll-a front in bone gulf during the southeast monsoon. Aquaculture, Aquarium, Conservation & Legislation, 2009, 12, 209–218.
- Yen, K.W.,; Lu, H.J.,; Chang, Y.,; Lee, M.A. Using remote-sensing data to detect habitat suitability for yellowfin tuna in the western and central pacific ocean. International Journal of Remote Sensing, 2012, 33, 7507–7522. [CrossRef]
- Maravelias, C. D. Habitat selection and clustering of a pelagic fish: Effects of topography and bathymetry on species dynamics. Canadian Journal of Fisheries and Aquatic Sciences, 1999, 56, 437–450. [CrossRef]
- Nishida, T.,; Mohri, M.,; Itoh, K.,; Nakagome, J. Study of bathymetry effects on the nominal hooking rates of yellowfin tuna (thunnus albacares) and bigeye tuna (thunnus obesus) exploited by the japanese tuna longline fisheries in the indian ocean. In IOTC proceedings, 2001, 191–206.
- Teo, S. L.,; Block, B. A. Comparative influence of ocean conditions on yellowfin and atlantic bluefin tuna catch from longlines in the gulf of mexico. PLoS One, 2010, 5, e10756. [CrossRef]
- Lan, K.W.,; Shimada, T.,; Lee, M.A.,; Su, N.J.,; Chang, Y. Using remote-sensing environmental and fishery data to map potential yellowfin tuna habitats in the tropical pacific ocean. Remote Sensing, 2017, 9, 444. [CrossRef]
- Solanki, H.,; Prakash, P.,; Dwivedi, R.,; Nayak, S.,; Kulkarni, A.,; Somvamshi, V. Synergistic application of oceanographic variables from multi-satellite sensors for forecasting potential fishing zones: Methodology and validation results. International Journal of Remote Sensing, 2010, 31, 775–789. [CrossRef]
- R Core Team. 2021. R: A language and environment for statistical computing. R Foundation for Statistical Computing, 2021, https://www.R-project.org/. (Accessded March 24, 2019).
- Wickham, H. ggplot2: Elegant Graphics for Data Analysis. 2016, Springer-Verlag New York.
- Wickham, H.,; François, R.,; Henry, L.,; Müller, K. dplyr: A Grammar of Data Manipulation. 2022, https://dplyr.tidyverse.org, https://github.com/tidyverse/dplyr. (Accessed June 12, 2019).
- National Oceanic and Atmospheric Administration, Sea surface temperature & Sea surface Chlorophyll, 2021,.
- Robinson, J.,; Guillotreau, P.,; Jiménez-Toribio, R.,; Lantz, F.,; Nadzon, L.,; Dorizo, J.,; Gerry, C. Impacts of climate variability on the tuna economy of seychelles. Climate Research, 2010, 43, 149–162. [CrossRef]
- Berry, P.,; Dawson, T; Harrison, P.,; Pearson, R. Modelling potential impacts of climate change on the bioclimatic envelope of species in britain and ireland. Global ecology and biogeography, 2002, 11, 453–462.
- Bertrand, A.,; Lengaigne, M.,; Takahashi, K.,; Avadi, A.,; Poulain, F.,; Harrod, C. El niño southern oscillation (ENSO) effects on fisheries and aquaculture. Food & Agriculture Org. 2020.
- Beuttler, C.,; Charles, L.,; Wurzbacher, J. The role of direct air capture in mitigation of anthropogenic greenhouse gas emissions. Frontiers in Climate, 2019, 1, 10. [CrossRef]
- Albouy, C.,; Delattre, V.,; Donati, G.,; Frölicher, T. L.,; Albouy-Boyer, S.,; Rufino, M.,; Pellissier, L. Global vulnerability of marine mammals to global warming. Scientific reports, 2020, 10: 1–12. [CrossRef]
- Brierley, A.S.,; Kingsford, M.J. Impacts of climate change on marine organisms and ecosystems. Current biology, 2009, 19, R602-R614. [CrossRef]
- Hartoko, A.,; Suradi, W.,; Ghofar, A. Impact of climate variability on skipjack tuna (katsuwonus pelamis) catches in the indonesian fisheries management area (FMA) 715. In IOP conference series: Earth and environmental science, 2021, 012003. [CrossRef]
- Zhou, C.,; Wan, R., Cao, J.,; Xu, L.,; Wang, X.,; Zhu, J. Spatial variability of bigeye tuna habitat in the pacific ocean: Hindcast from a refined ecological niche model. Fisheries Oceanography, 2021, 30, 23–37. [CrossRef]
- Kim, W.,; Yeh, S.-W.,; Kim, J.-H.,; Kug, J.-S.,; Kwon, M. The unique 2009–2010 el niño event: A fast phase transition of warm pool el niño to la niña. Geophysical Research Letters, 2011, 38. [CrossRef]
- Hu, S.,; Fedorov, A. V. The extreme el niño of 2015–2016 and the end of global warming hiatus. Geophysical Research Letters, 2017, 44, 3816–3824. [CrossRef]
- Redondo-Rodriguez, A.,; Weeks, S. J.,; Berkelmans, R.,; Hoegh-Guldberg, O.,; Lough, J. M. Climate variability of the great barrier reef in relation to the tropical pacific and el nino-southern oscillation. Marine and Freshwater Research, 2012, 63, 34–47. [CrossRef]
- Syamsuddin, M. L.,; Saitoh, S.-I.,; Hirawake, T.,; Bachri, S.,; Harto, A. B. Effects of el niño–southern oscillation events on catches of bigeye tuna (thunnus obesus) in the eastern indian ocean off java. Fishery Bulletin, 2013, 111, 175–188. [CrossRef]
- Vaihola, S., Kininmonth, S. Climate Change Potential Impacts on the Tuna Fisheries in the Exclusive Economic Zones of Tonga. Diversity, 2023, 15, 844. [CrossRef]
- Lan, K.W.,; Evans, K.,; Lee, M.A. Effects of climate variability on the distribution and fishing conditions of yellowfin tuna (Thunnus albacares) in the western Indian Ocean. Climatic Change, 2013, 119, 63-77. [CrossRef]
- Lehodey, P.,; Senina, I.,; Calmettes, B.,; Hampton, J.,; Nicol, S. Modelling the impact of climate change on Pacific skipjack tuna population and fisheries. Climatic change, 2013, 119, 95-109. [CrossRef]
- Senina, I.,; Lehodey, P.,; Calmettes, B.,; Dessert, M.,; Hampton, J.,; Smith, N.,; Gorgues, T.,; Aumont, O.,; Lengaigne, M.,; Menkes, C.,; Nicol, S. Impact of climate change on tropical Pacific tuna and their fisheries in Pacific Islands waters and high seas areas. 14th Regular Session of the Scientific Committee of the Western and Central Pacific Fisheries Commission, WCPFC-SC14. 2018.
Figure 1.
Theoretical framework of social and economic interactions between national and fisheries planners for optimal management of tuna resources and benefits in Tonga. Source: Summarized and modified from Bell et al., (2009) [2] and Tonga’s TMDP and Implementation Schedule [5].
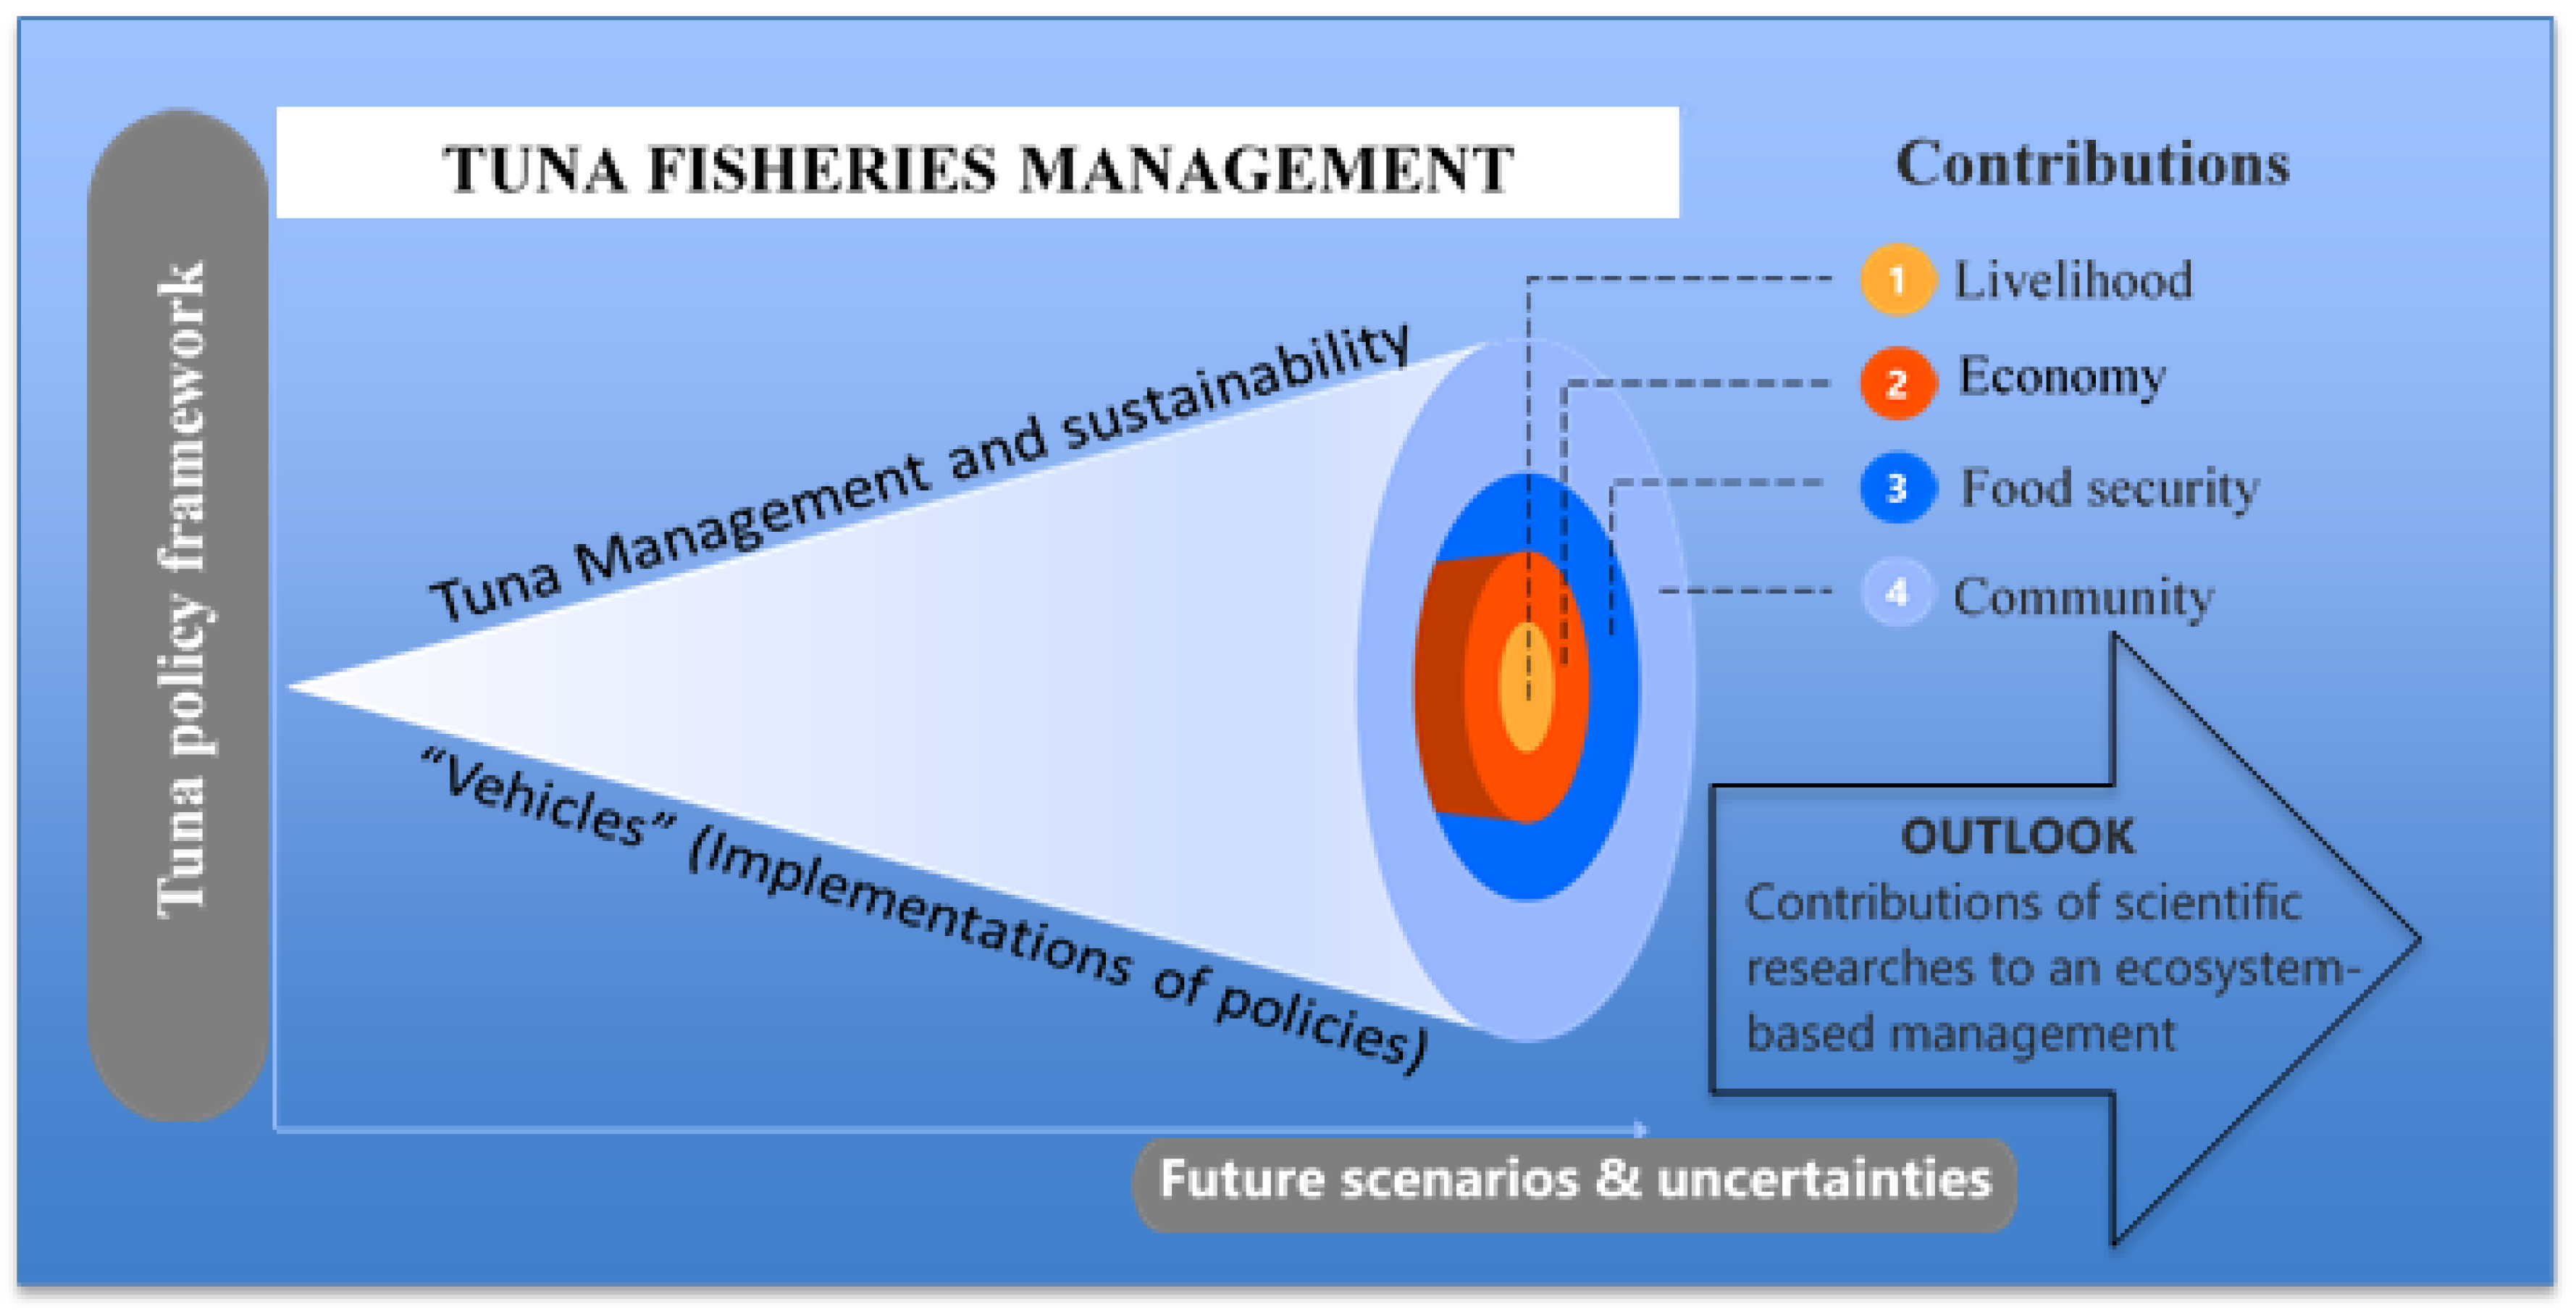
Figure 2.
The fishing ground (EEZ) of Tonga which envelops areas with troughs, trench, terraces, slope, shelf, seamounts, ridges, escarpments, basins and abyssal.
Figure 2.
The fishing ground (EEZ) of Tonga which envelops areas with troughs, trench, terraces, slope, shelf, seamounts, ridges, escarpments, basins and abyssal.
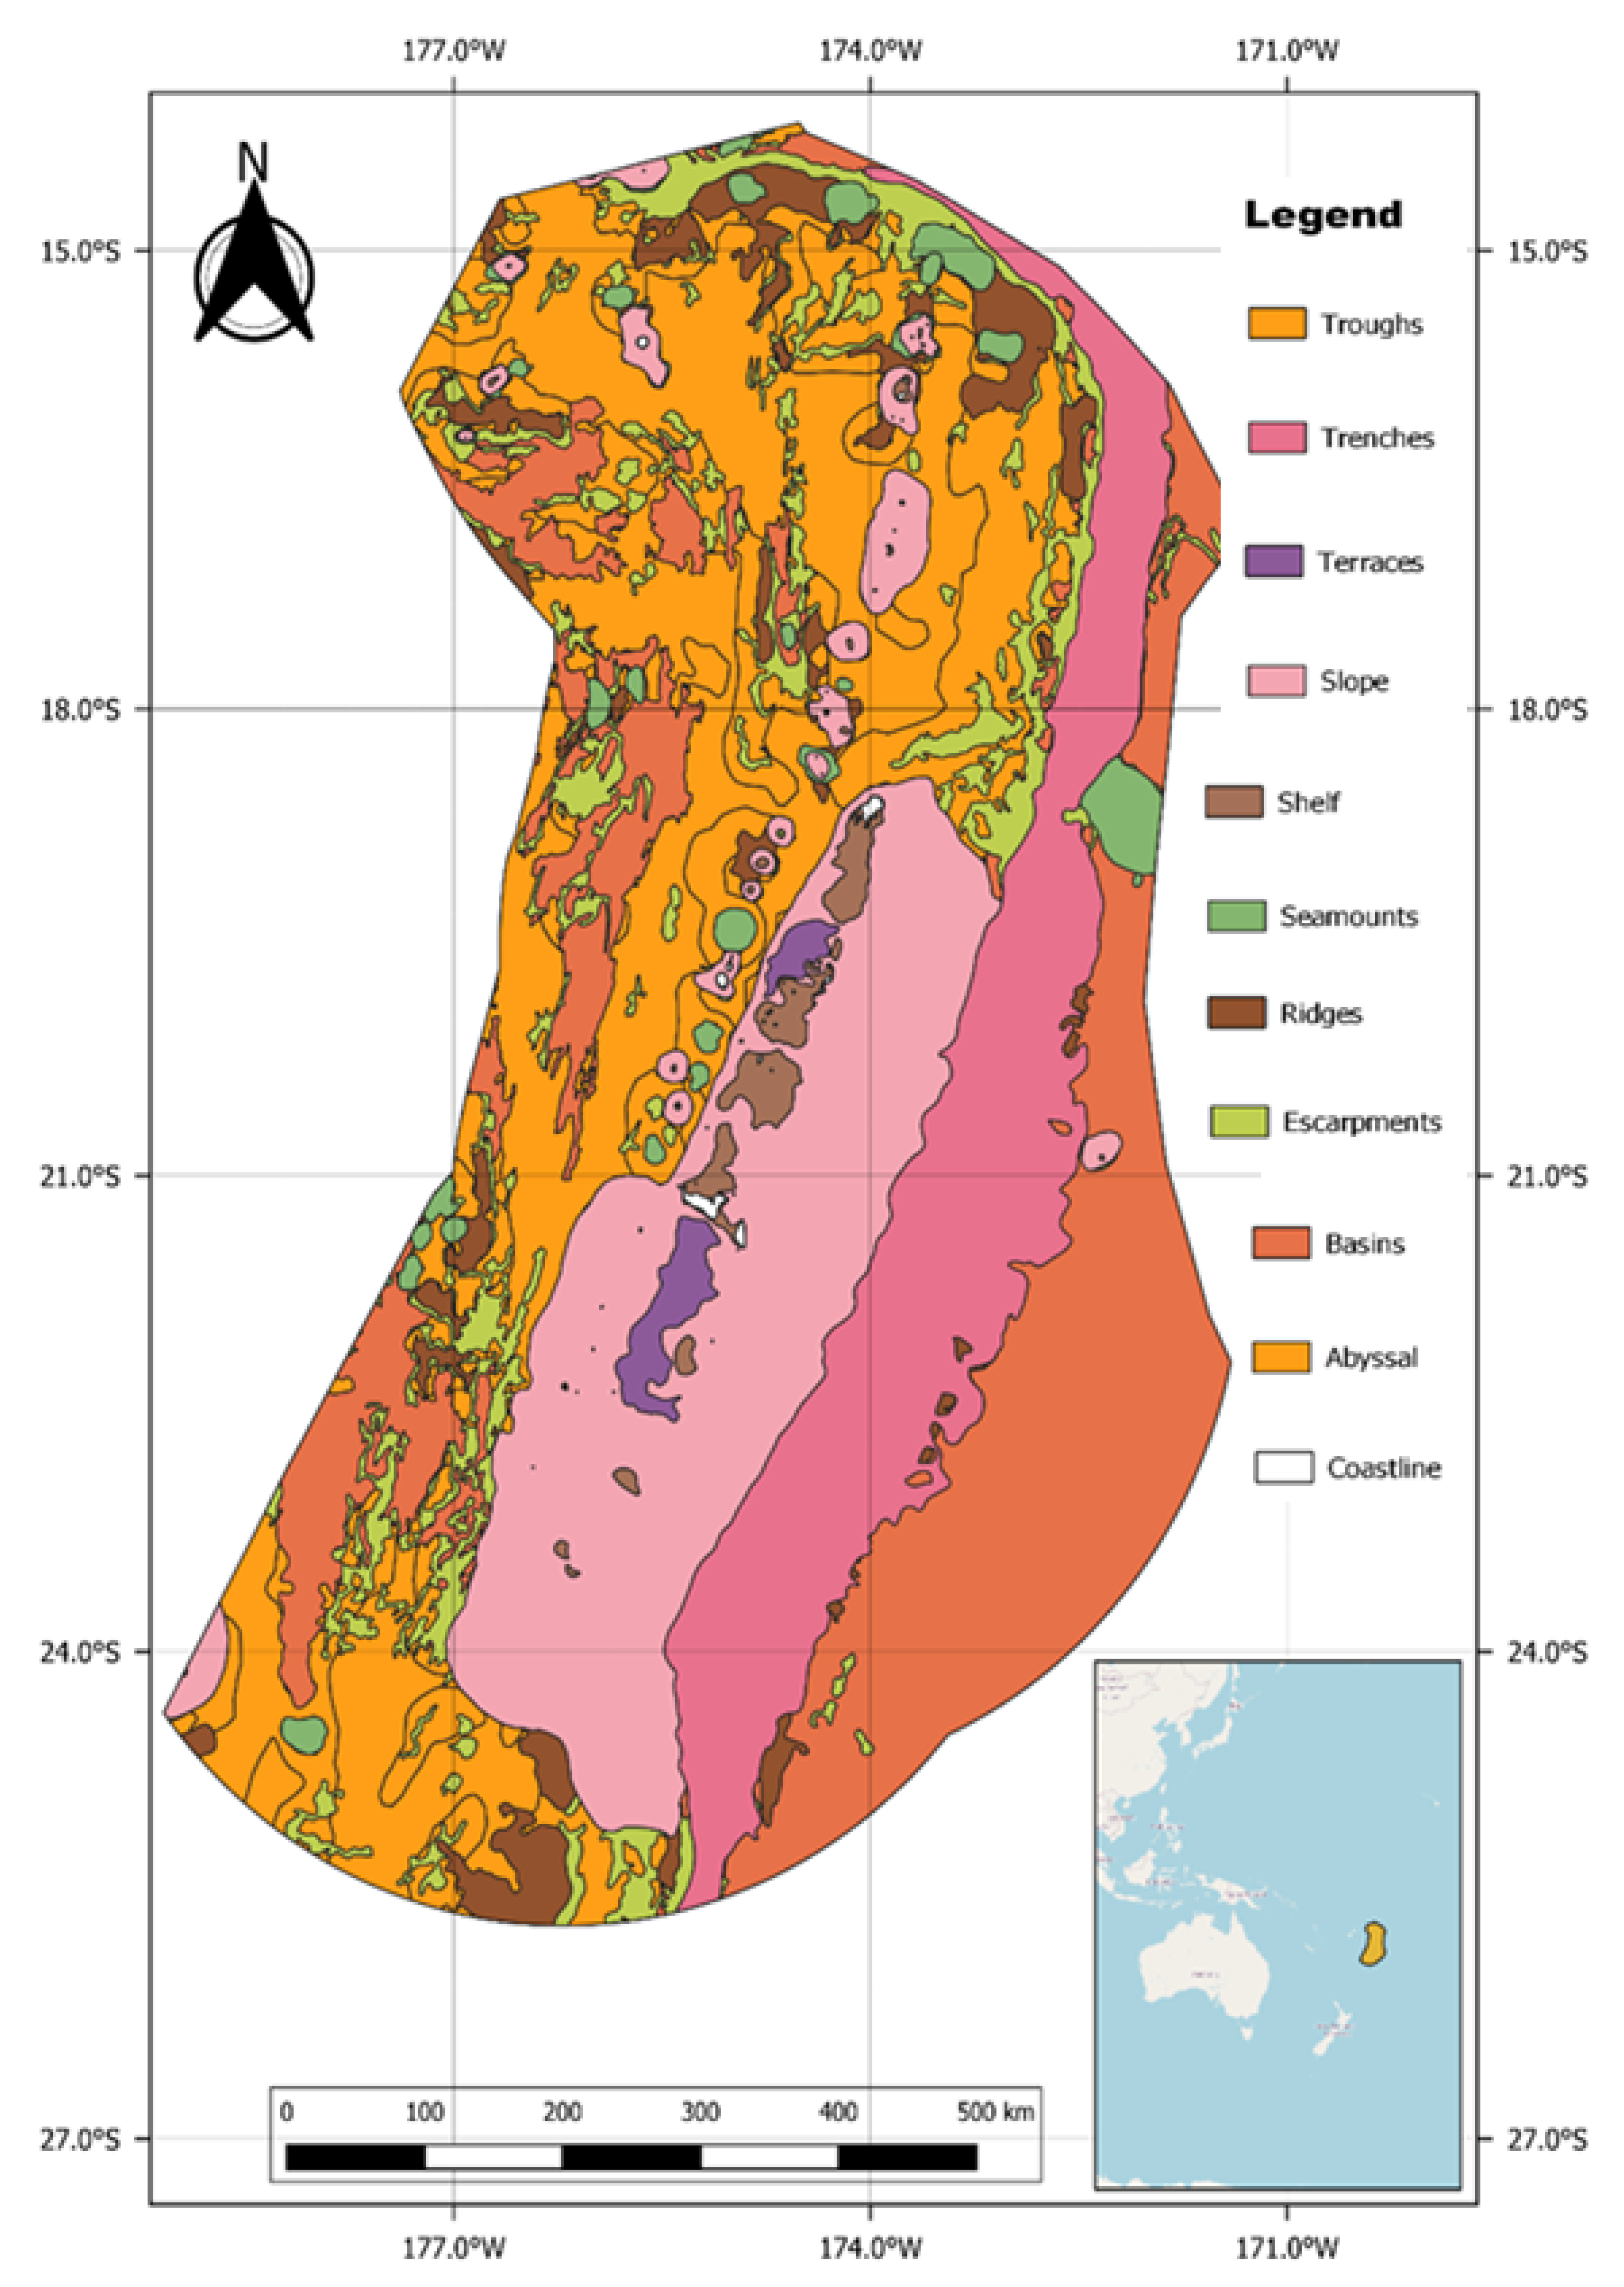
Figure 3.
Spatio-temporal pattern in the distribution of albacore tuna within the EEZ, , longitude of Tonga over time period 2002–2018.
Figure 3.
Spatio-temporal pattern in the distribution of albacore tuna within the EEZ, , longitude of Tonga over time period 2002–2018.
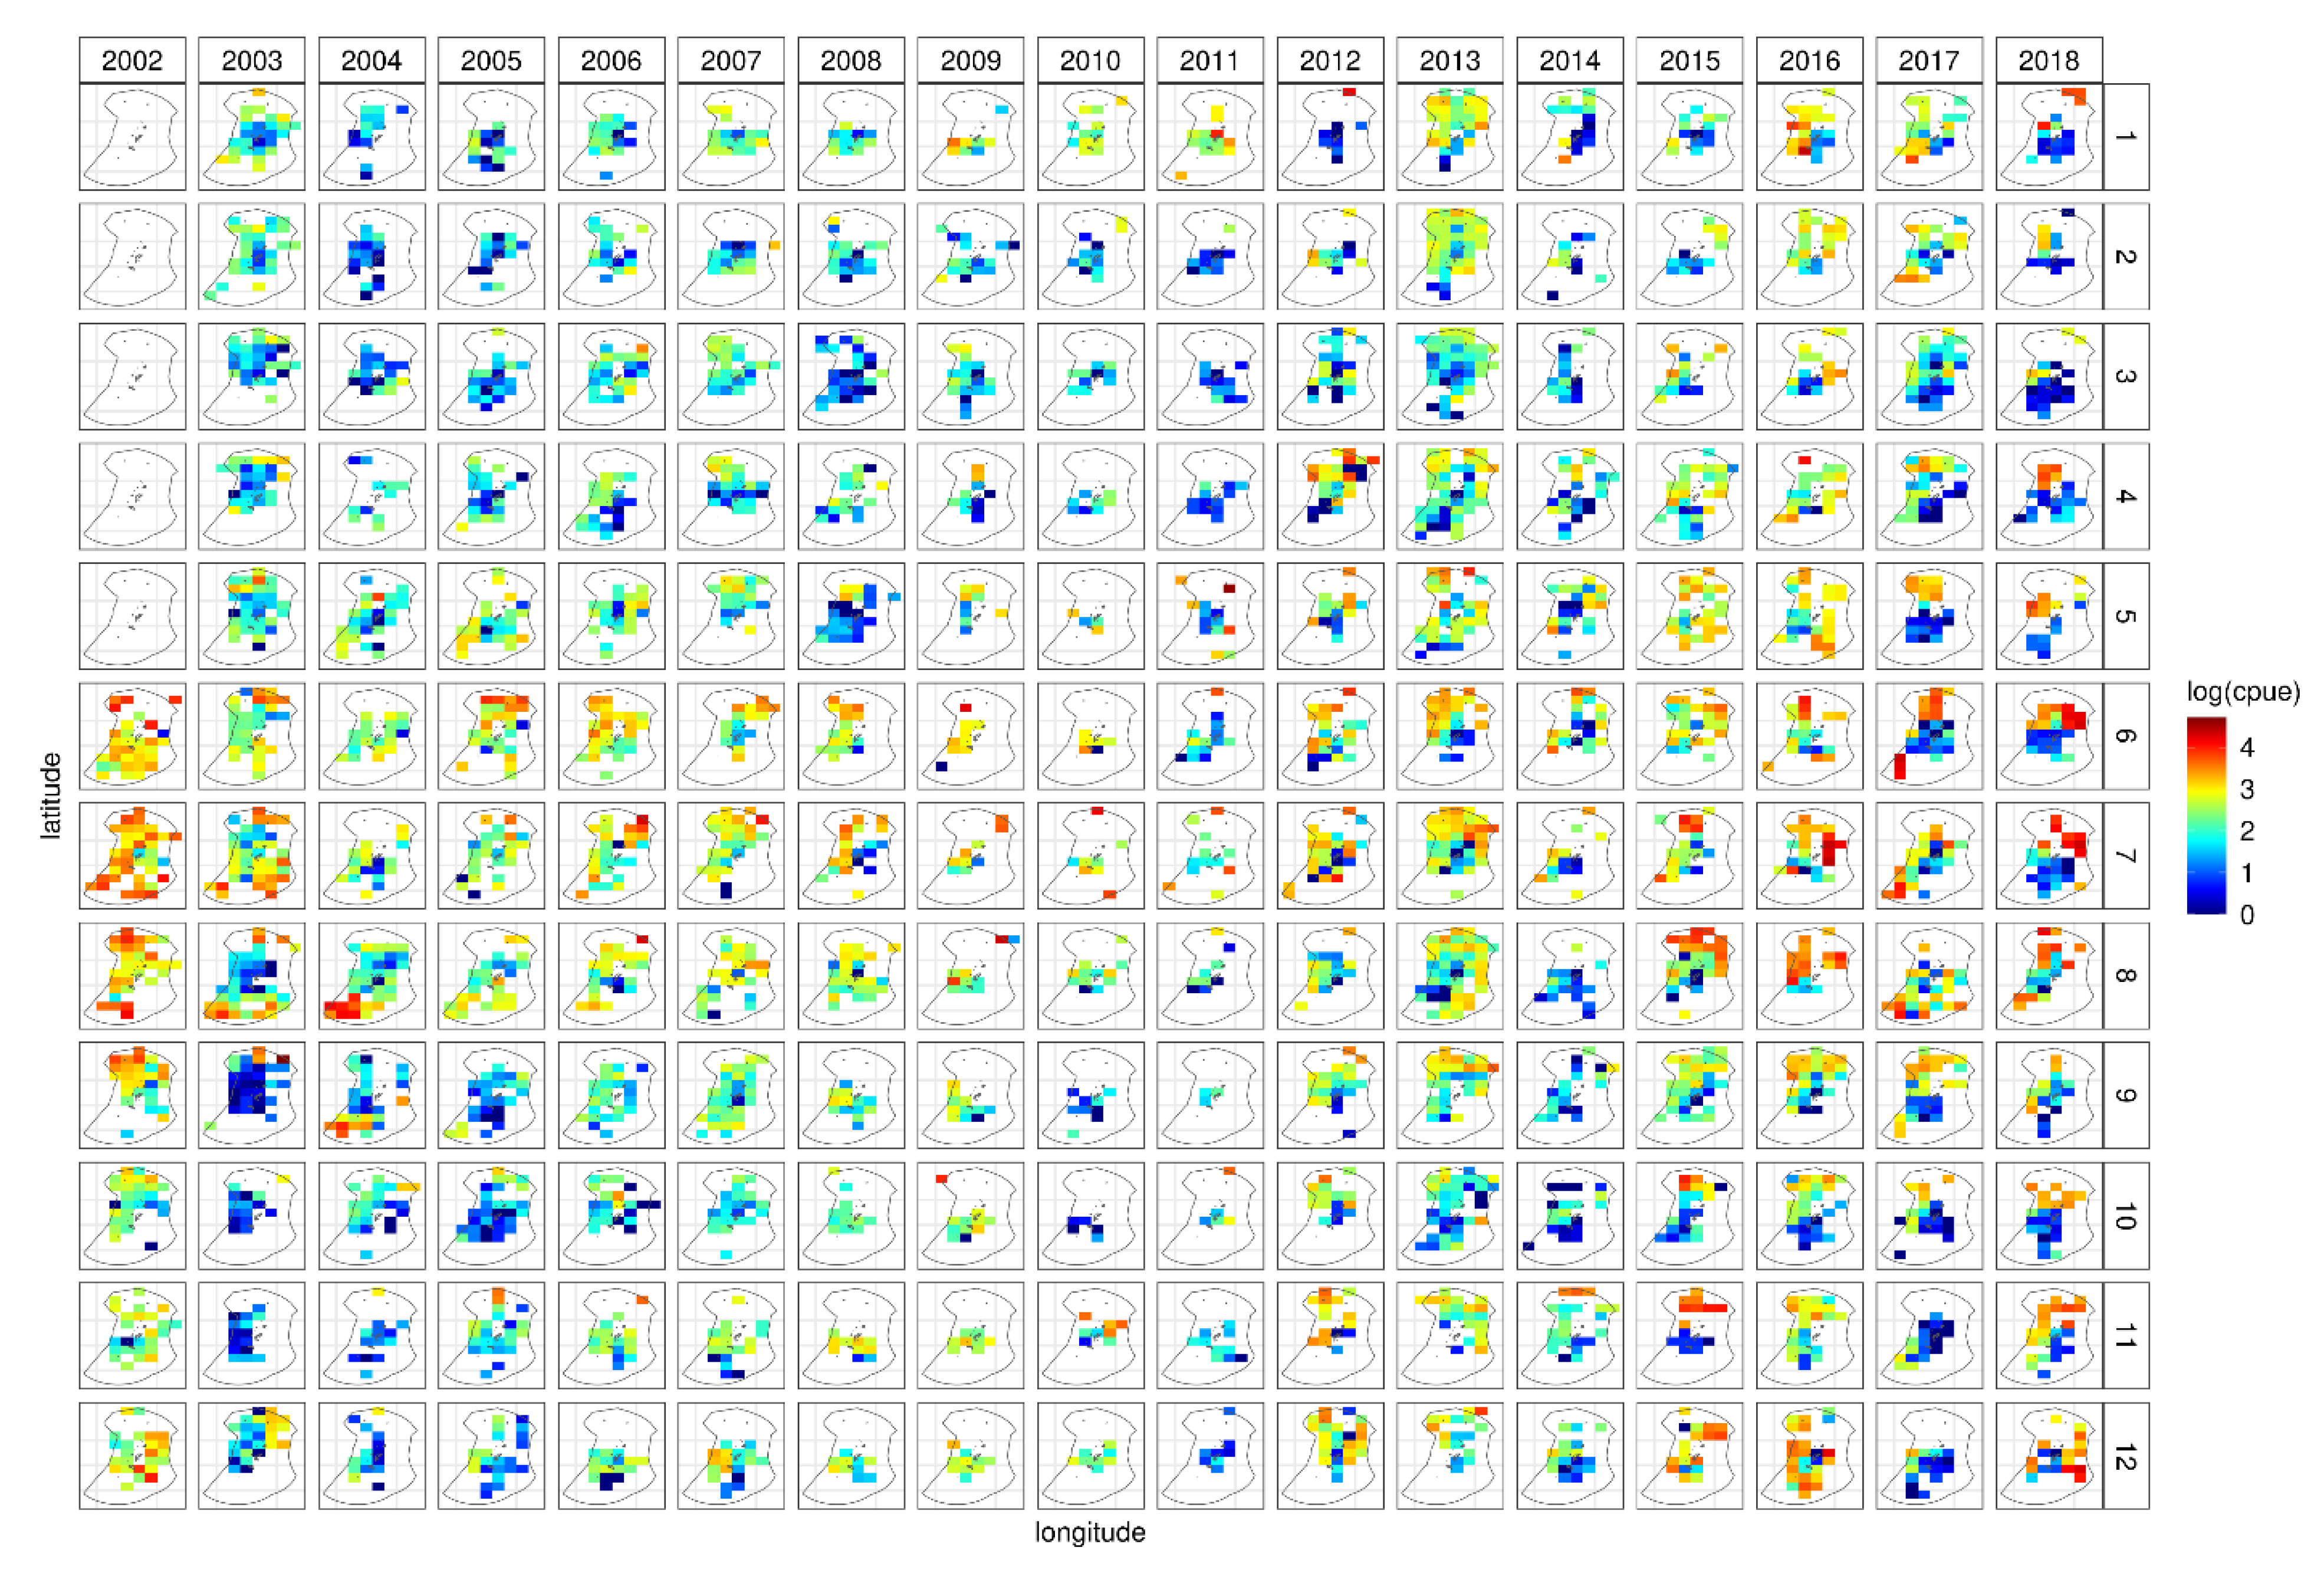
Figure 4.
Spatio-temporal pattern in the distribution of bigeye tuna in the EEZ, , longitude of Tonga over time period 2002–2018.
Figure 4.
Spatio-temporal pattern in the distribution of bigeye tuna in the EEZ, , longitude of Tonga over time period 2002–2018.
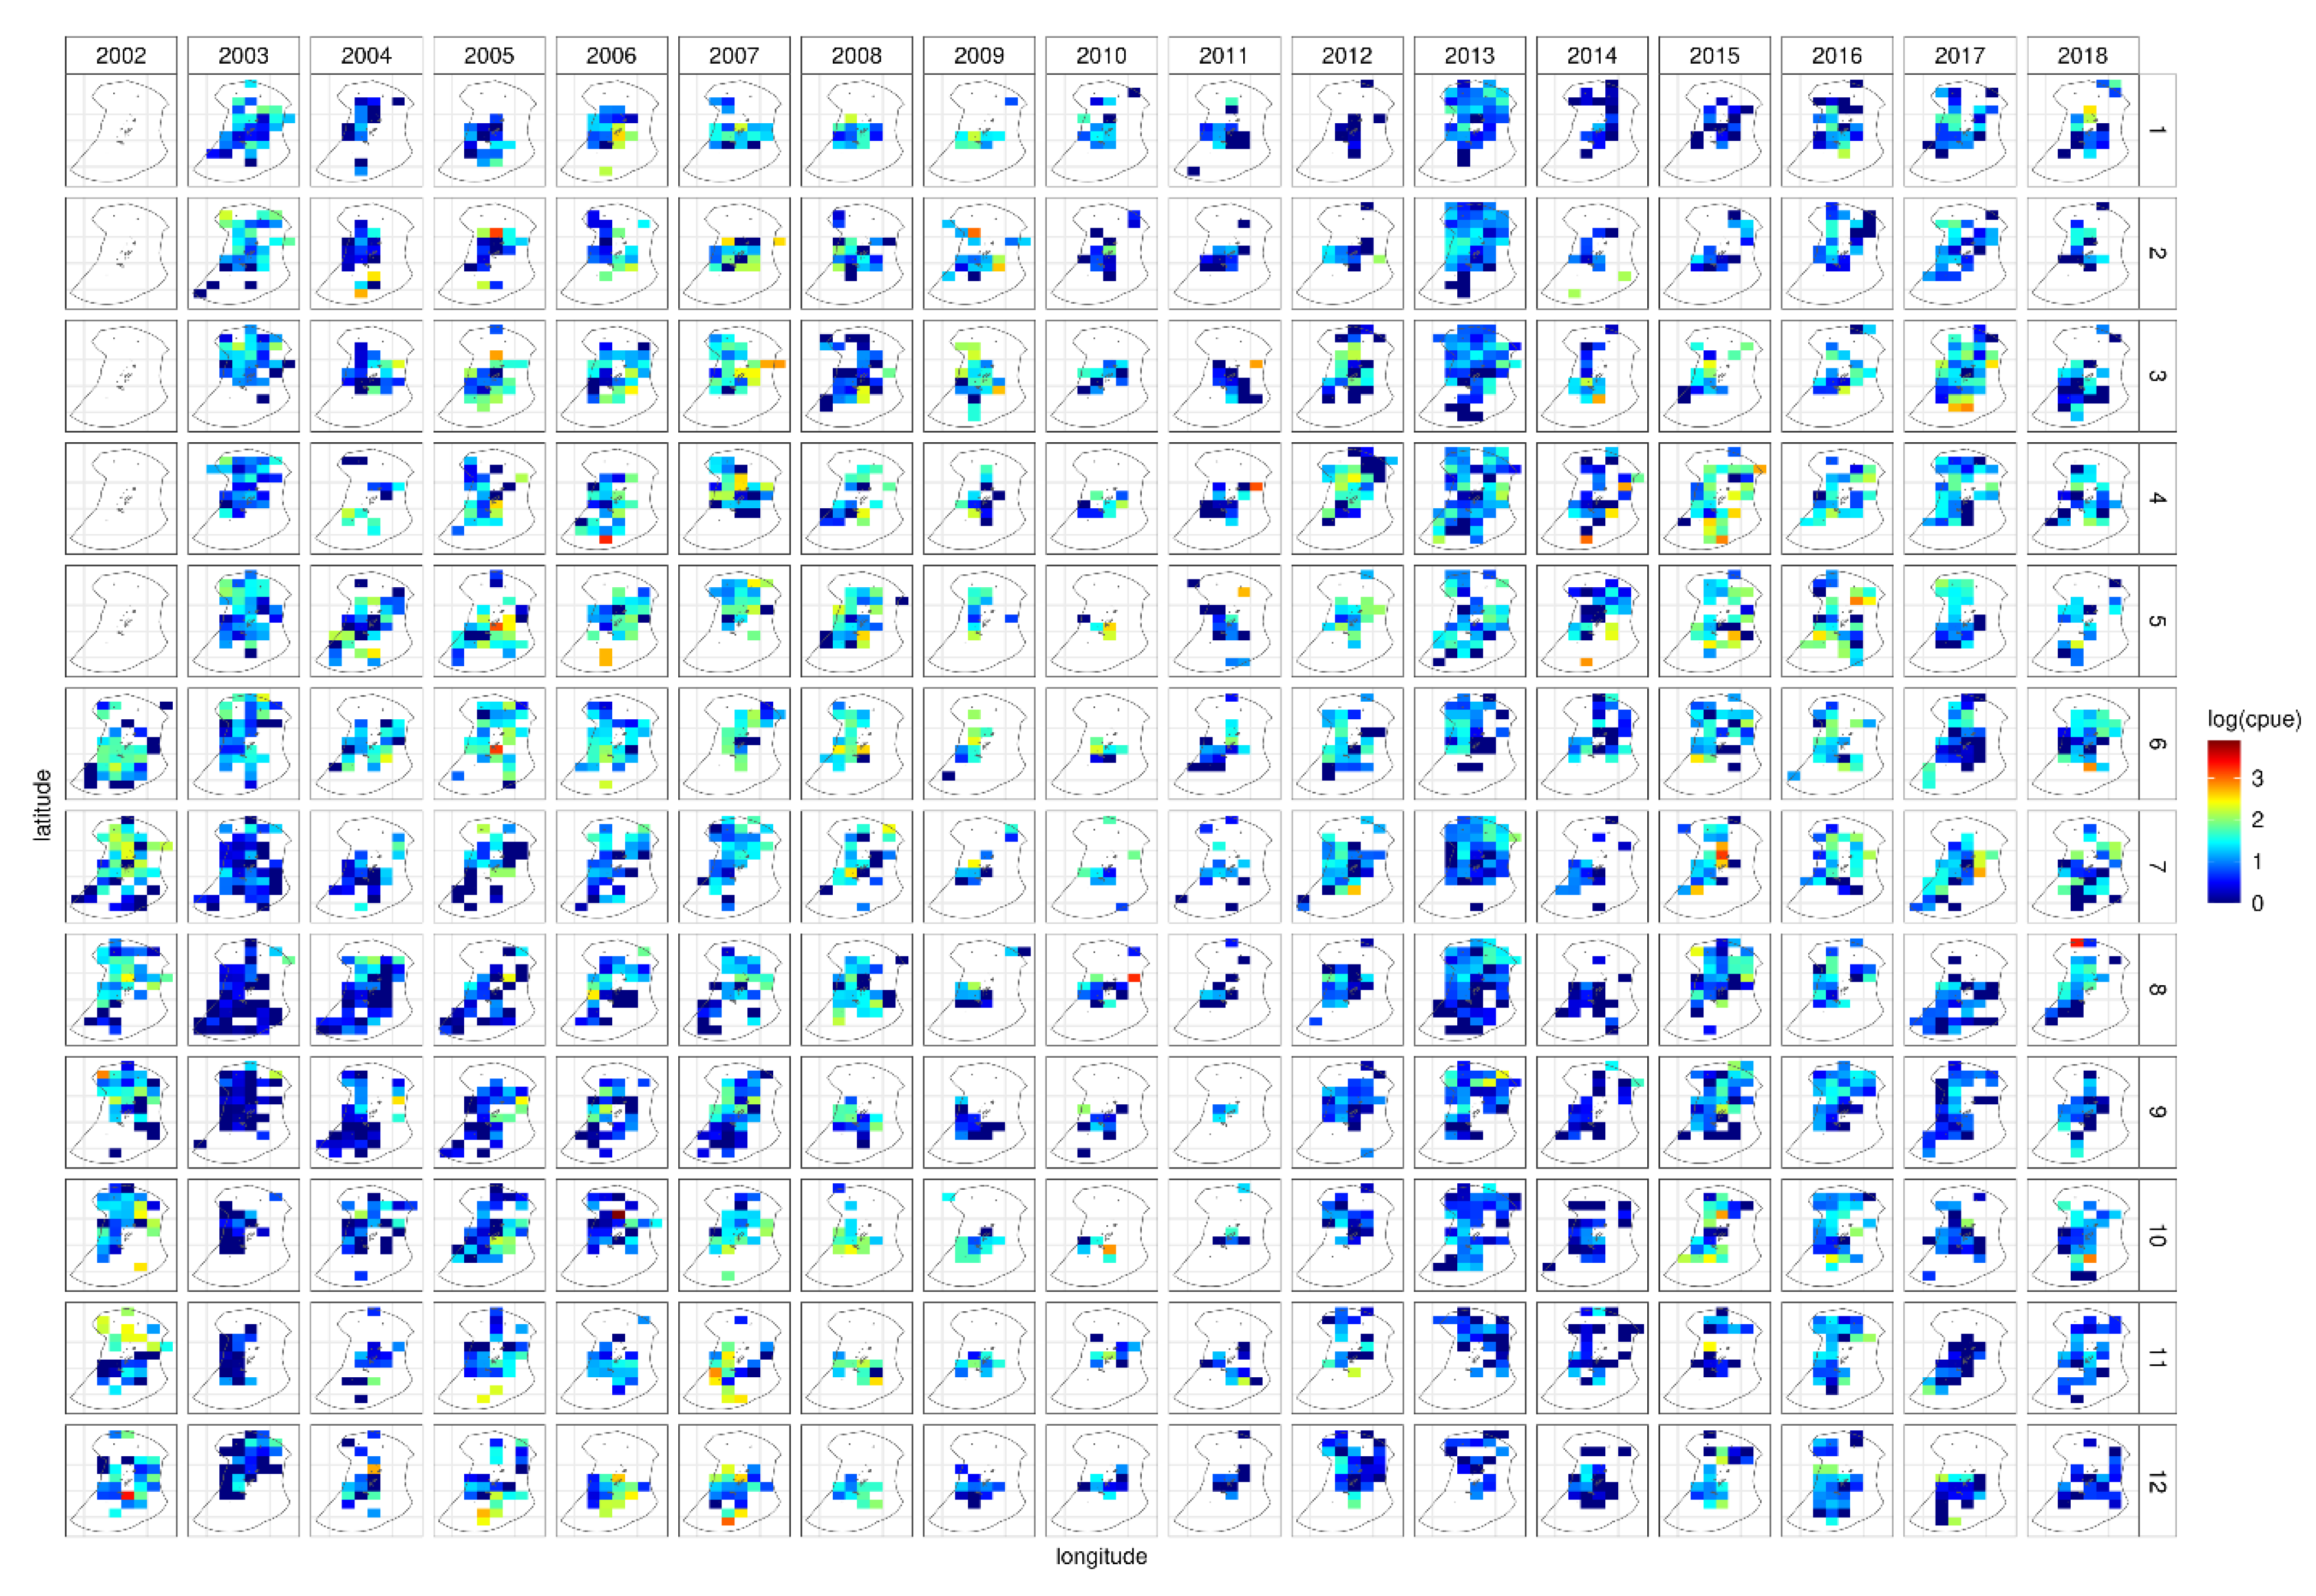
Figure 5.
Spatio-temporal pattern in the distribution of skipjack tuna in the EEZ, , longitude of Tonga over time period 2002–2018.
Figure 5.
Spatio-temporal pattern in the distribution of skipjack tuna in the EEZ, , longitude of Tonga over time period 2002–2018.
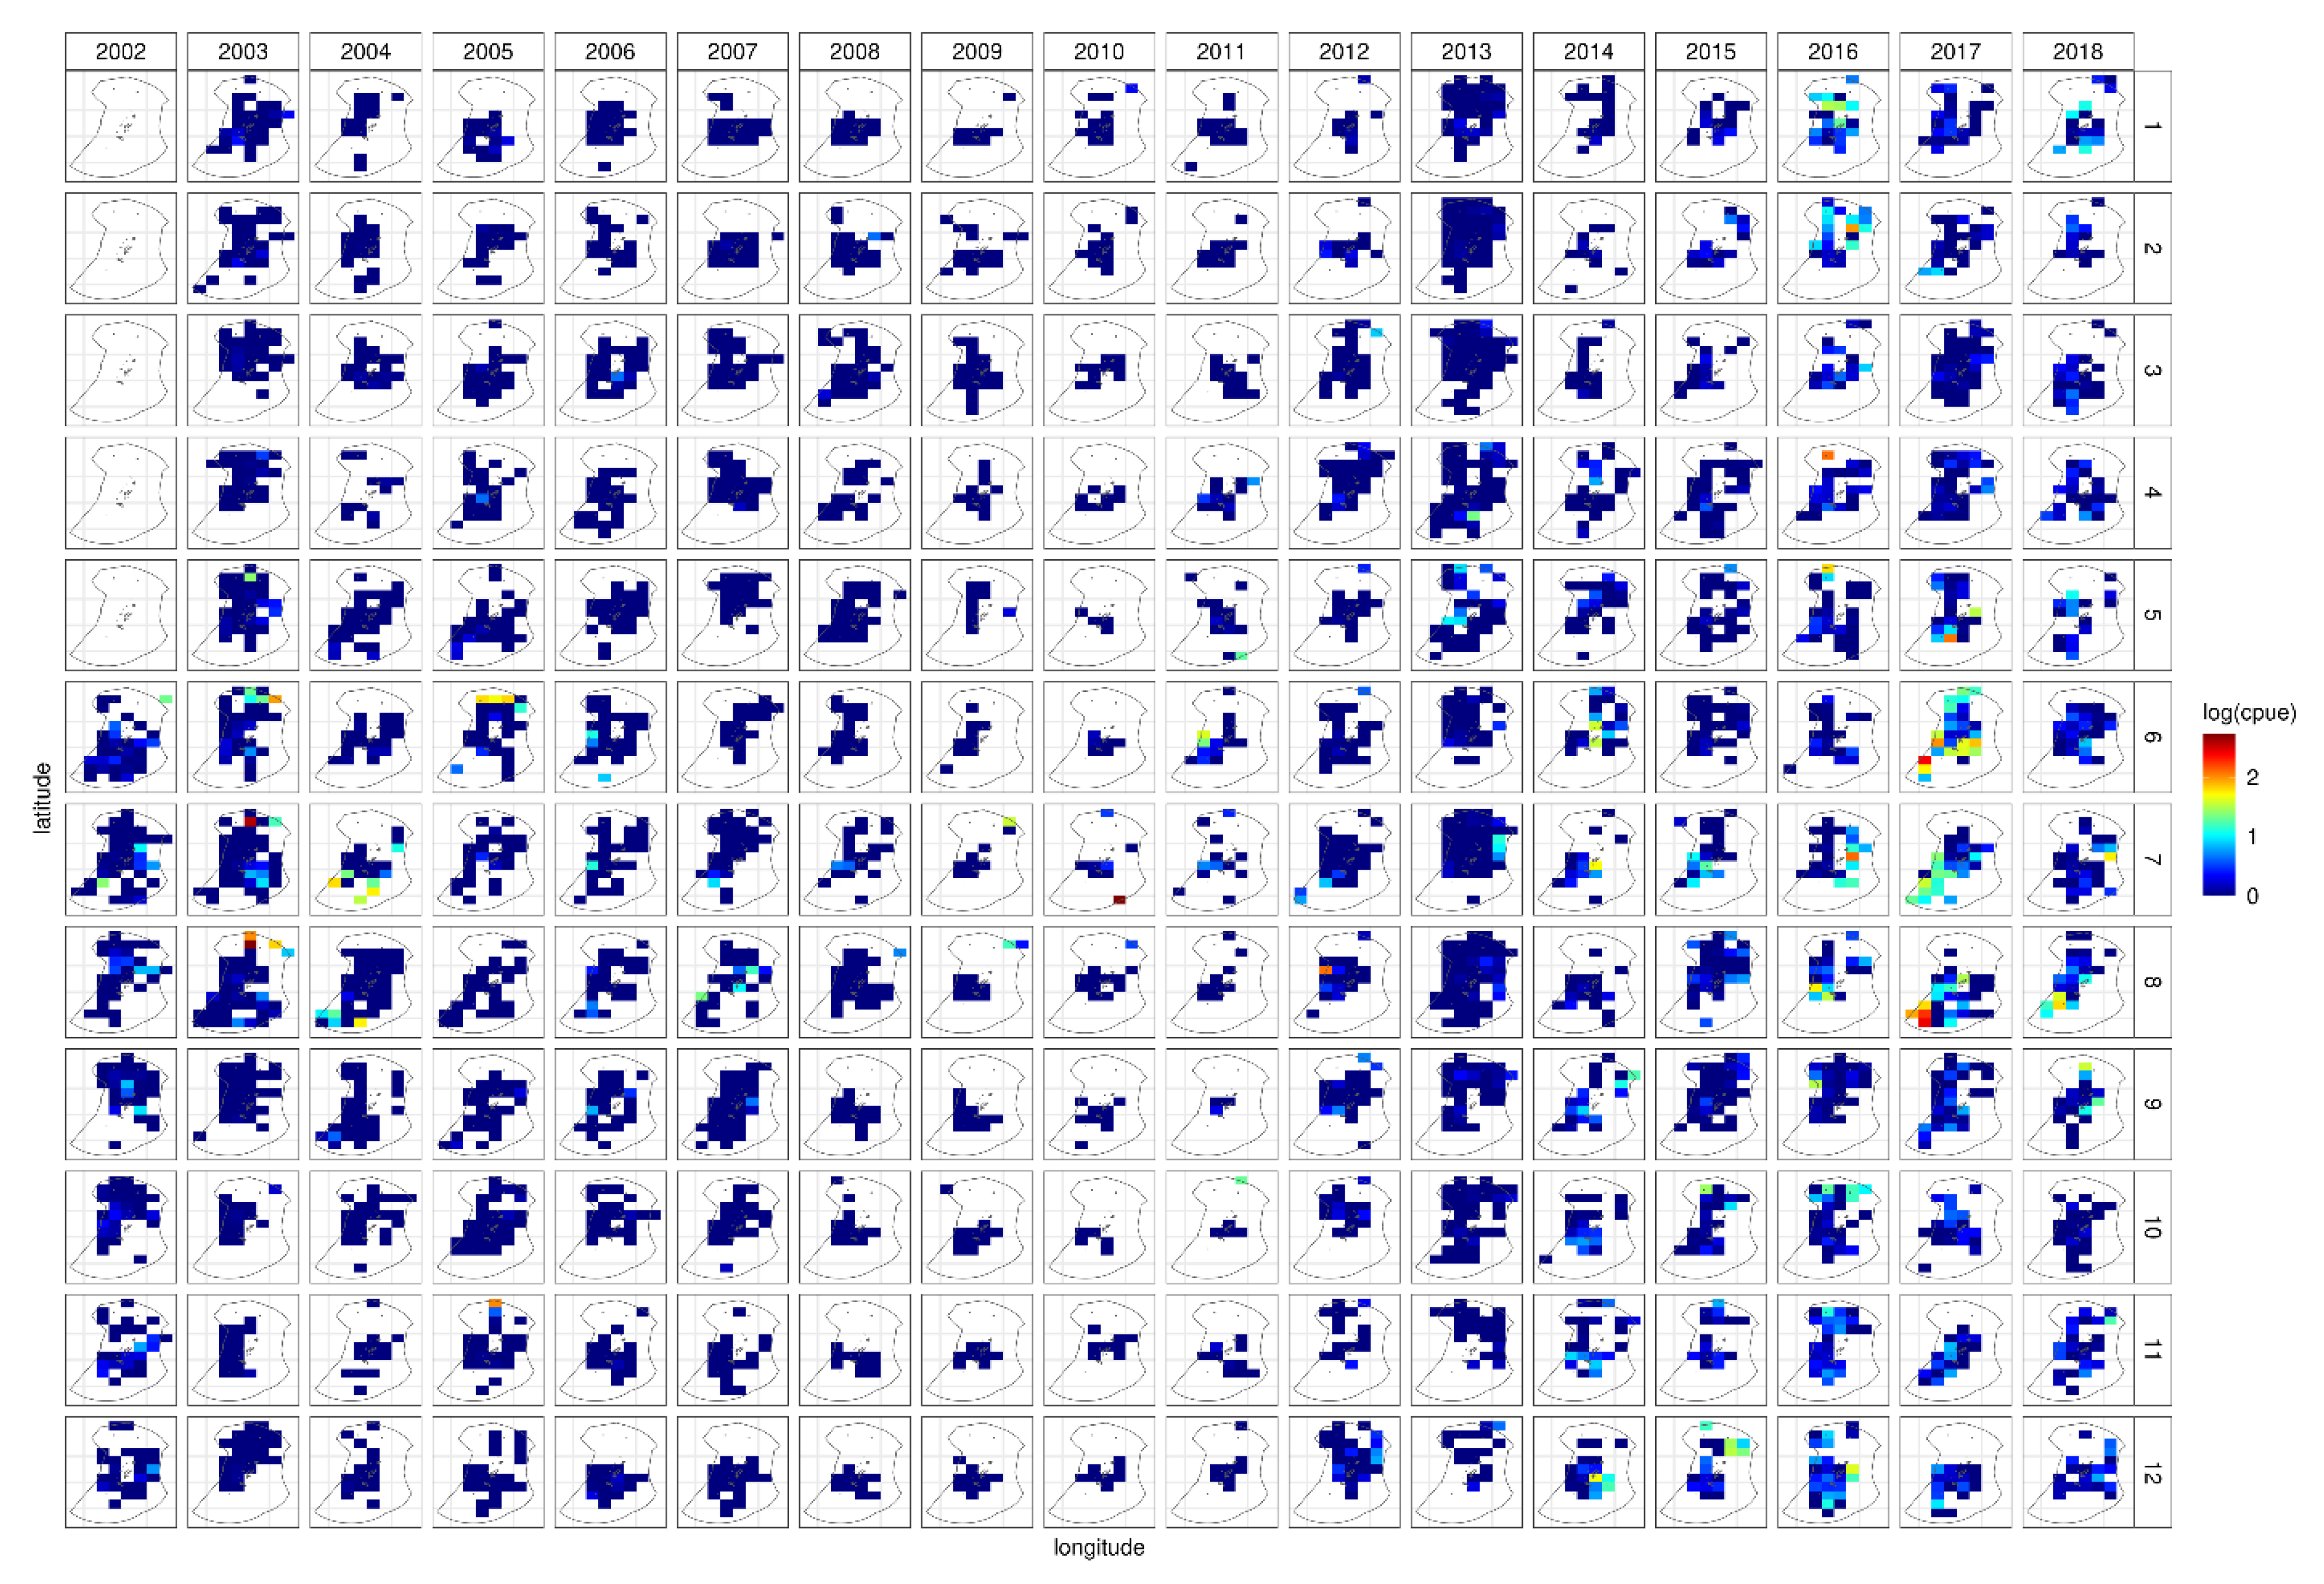
Figure 6.
Spatio-temporal pattern in the distribution of yellowfin tuna in the EEZ, , longitude of Tonga over time period 2002–2018.
Figure 6.
Spatio-temporal pattern in the distribution of yellowfin tuna in the EEZ, , longitude of Tonga over time period 2002–2018.
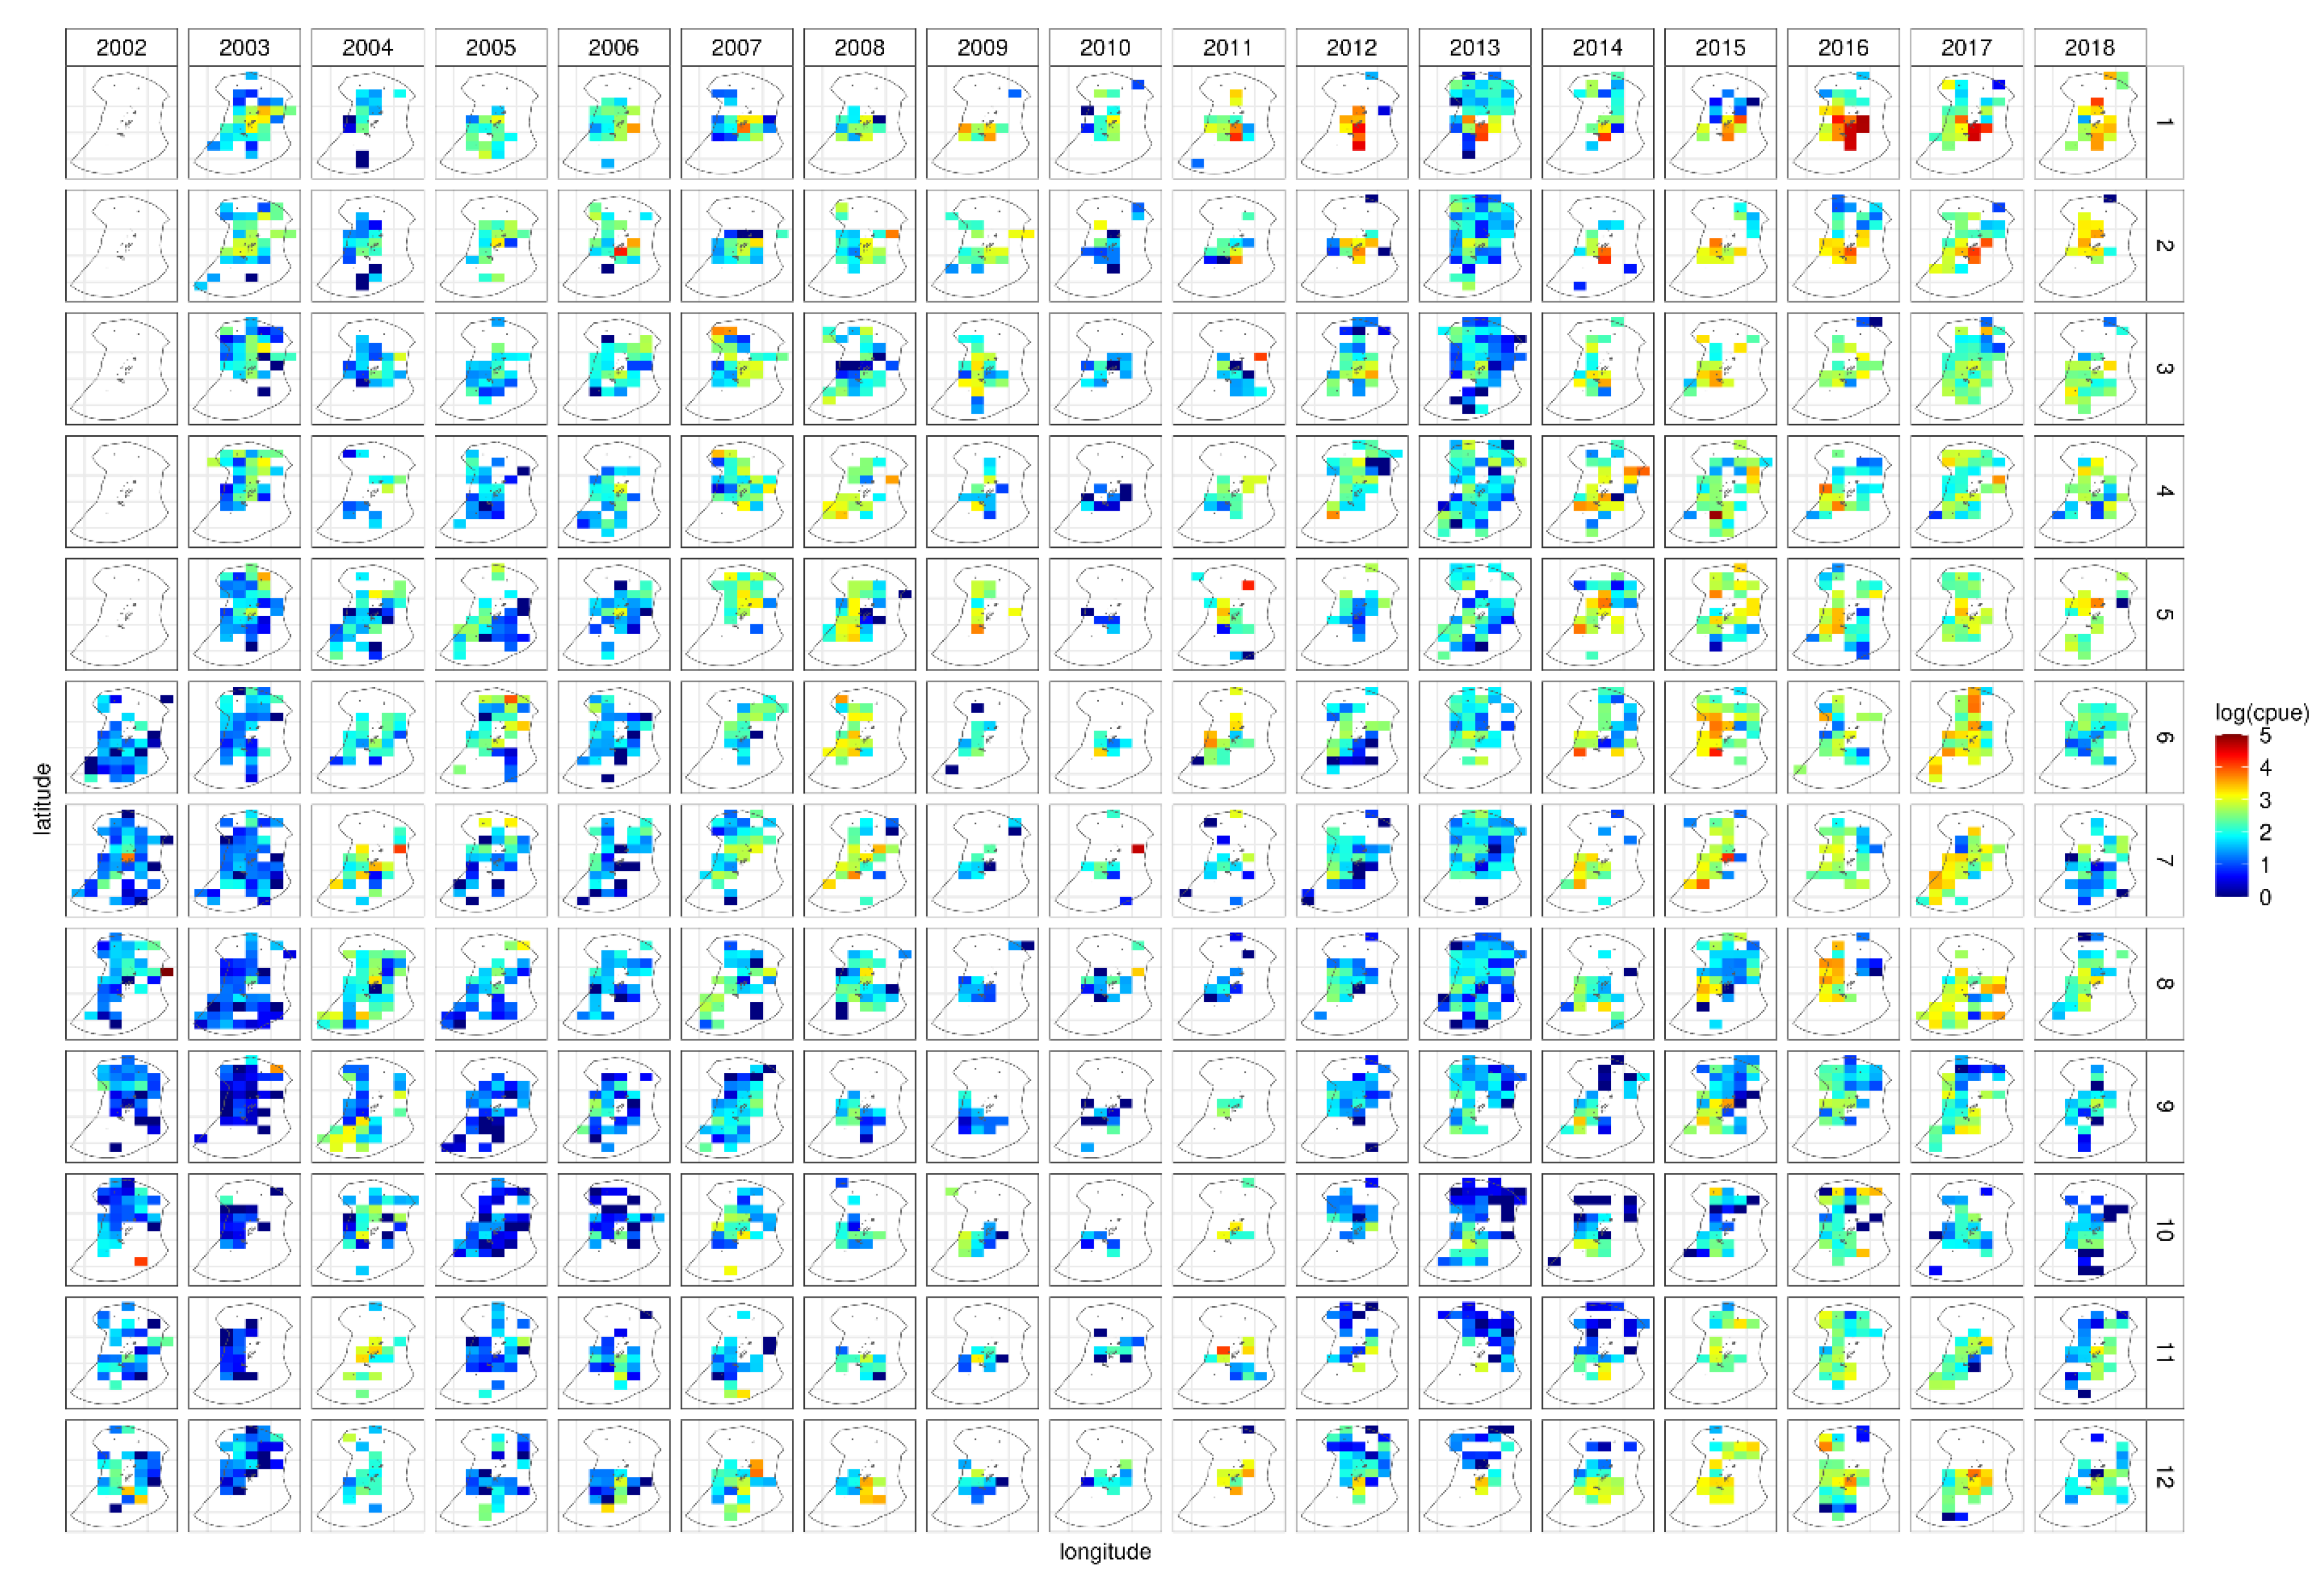
Figure 7.
Historical catch trends (CPUE) of the four main tuna species in year (A), month (B) and day (D). (C) shows the median and range CPUE distribution of the four species during 2002 to 2018.
Figure 7.
Historical catch trends (CPUE) of the four main tuna species in year (A), month (B) and day (D). (C) shows the median and range CPUE distribution of the four species during 2002 to 2018.
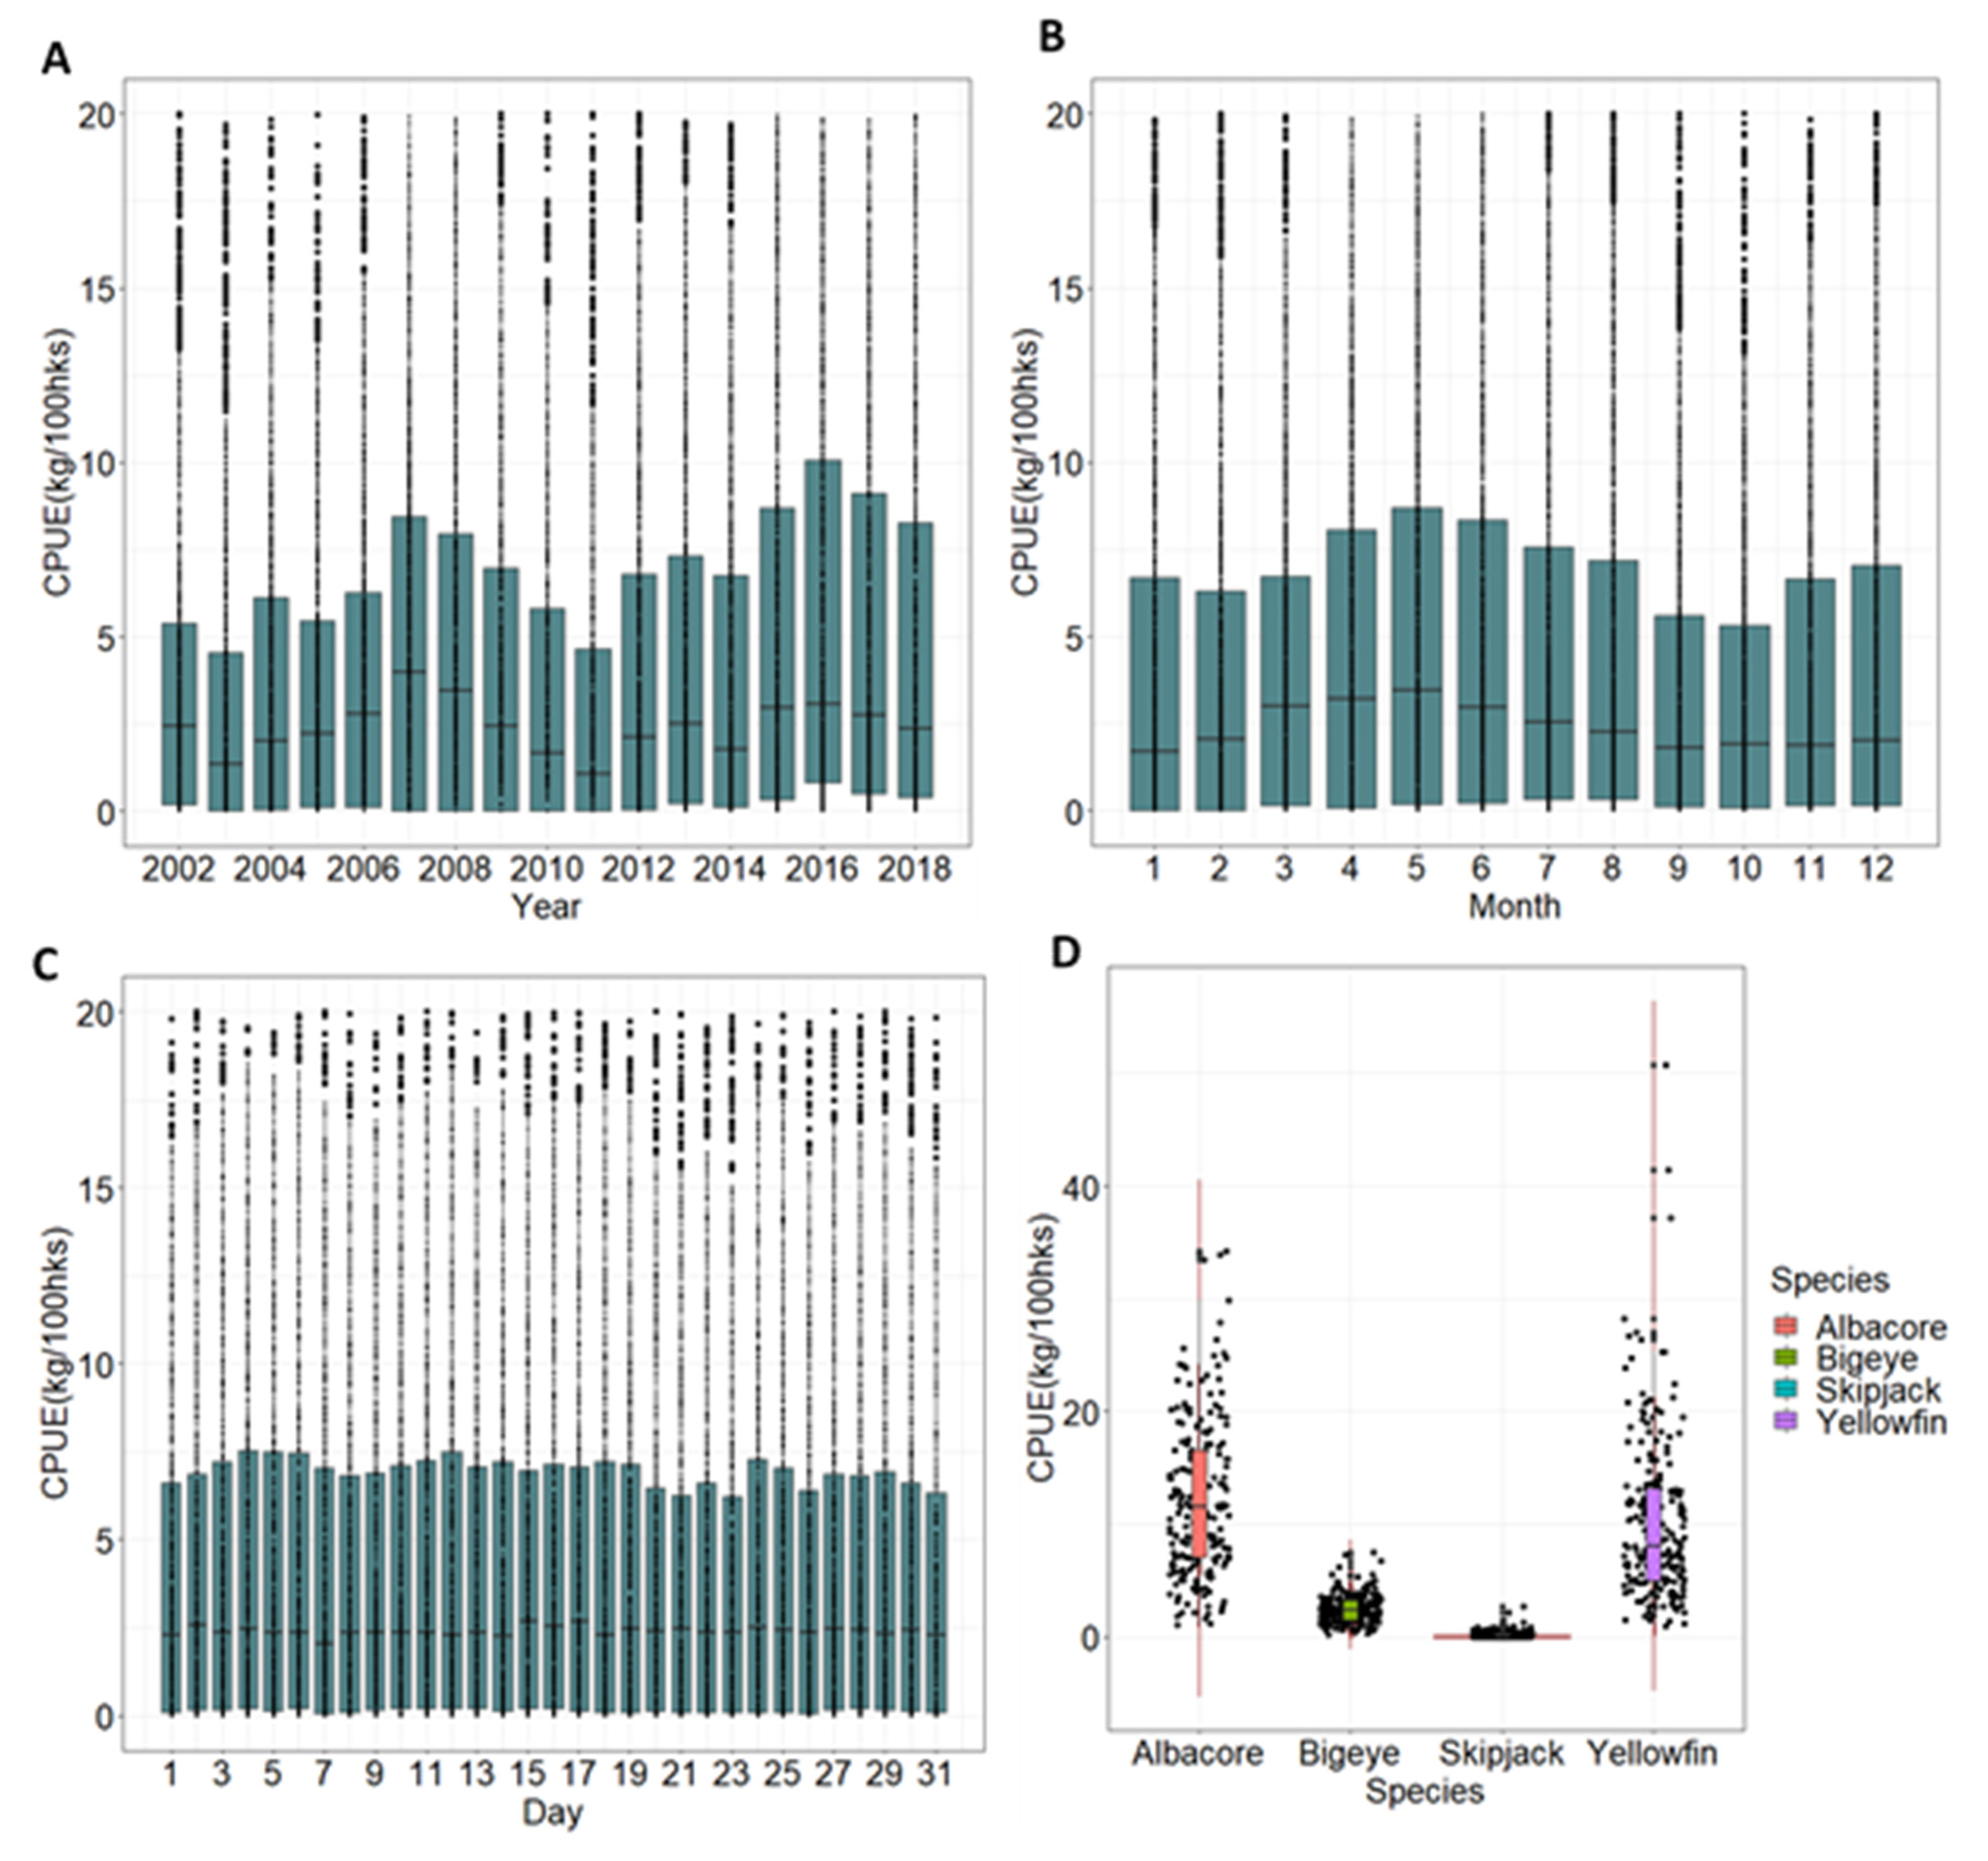

Table 1.
Historical landings of catch, CPUE, total number of hooks used, number of longline vessels operated and total allowable catch for the main tuna species from 2002 to 2018 within the EEZ, longitude of Tonga.
Table 1.
Historical landings of catch, CPUE, total number of hooks used, number of longline vessels operated and total allowable catch for the main tuna species from 2002 to 2018 within the EEZ, longitude of Tonga.
| No. of longline vessels | Catch size (metric tons) | CPUE (no. of fish/100 hooks/year) | |||||||||||
|---|---|---|---|---|---|---|---|---|---|---|---|---|---|
| Year | Total no. of hooks | Domestic | Foreign | Albacore | Bigeye | Skipjack | Yellowfin | Albacore | Bigeye | Skipjack | Yellowfin | ||
| 2002 | 38526 | 17 | - | 740 | 124 | 4 | 170 | 30890 | 5097 | 209 | 6918 | ||
| 2003 | 46622 | 23 | - | 489 | 76 | 15 | 240 | 19164 | 2702 | 754 | 8686 | ||
| 2004 | 26348 | 20 | - | 237 | 47 | 3 | 208 | 10607 | 2120 | 166 | 9215 | ||
| 2005 | 28521 | 13 | - | 235 | 78 | 3 | 123 | 10290 | 3609 | 163 | 5653 | ||
| 2006 | 33818 | 11 | - | 383 | 83 | 2 | 176 | 15835 | 3859 | 101 | 7439 | ||
| 2007 | 31347 | 12 | - | 336 | 109 | 1 | 278 | 14518 | 4967 | 43 | 12314 | ||
| 2008 | 22432 | 9 | - | 227 | 72 | 0 | 248 | 10355 | 3441 | 19 | 11118 | ||
| 2009 | 11112 | 6 | - | 146 | 33 | 1 | 97 | 7444 | 1776 | 49 | 5308 | ||
| 2010 | 6927 | 6 | - | 105 | 19 | 1 | 40 | 4348 | 1064 | 35 | 2513 | ||
| 2011 | 8703 | 3 | - | 88 | 14 | 2 | 142 | 3170 | 824 | 72 | 6960 | ||
| 2012 | 48766 | 4 | - | 829 | 126 | 4 | 379 | 19846 | 2976 | 121 | 11488 | ||
| 2013 | 109494 | 3 | 19 | 1583 | 230 | 9 | 640 | 36947 | 5477 | 210 | 17078 | ||
| 2014 | 31357 | 4 | 19 | 284 | 40 | 8 | 378 | 8742 | 1484 | 305 | 14785 | ||
| 2015 | 45302 | 4 | 14 | 724 | 129 | 13 | 755 | 19822 | 4104 | 364 | 23191 | ||
| 2016 | 58498 | 4 | 4 | 1265 | 159 | 31 | 895 | 32618 | 4457 | 943 | 28260 | ||
| 2017 | 55438 | 6 | 8 | 874 | 129 | 41 | 871 | 23328 | 3740 | 1290 | 29104 | ||
| 2018 | 30186 | 6 | 4 | 677 | 63 | 12 | 336 | 21489 | 2486 | 485 | 13895 | ||
| Total allowable catches for each species (metric tons) | 2500 | 2000 | Unlimited* | 2000 | Manage through WCPFC harvest strategic plan and TMDP | ||||||||
Note. No domestic and foreign vessels were licensed to fish in the Tonga EEZ in 2002-2003 and 2002-2012 respectively, indicated with dash marks.
Disclaimer/Publisher’s Note: The statements, opinions and data contained in all publications are solely those of the individual author(s) and contributor(s) and not of MDPI and/or the editor(s). MDPI and/or the editor(s) disclaim responsibility for any injury to people or property resulting from any ideas, methods, instructions or products referred to in the content. |
© 2023 by the authors. Licensee MDPI, Basel, Switzerland. This article is an open access article distributed under the terms and conditions of the Creative Commons Attribution (CC BY) license (http://creativecommons.org/licenses/by/4.0/).
Copyright: This open access article is published under a Creative Commons CC BY 4.0 license, which permit the free download, distribution, and reuse, provided that the author and preprint are cited in any reuse.


