
Submitted:
29 July 2023
Posted:
31 July 2023
You are already at the latest version
Abstract
African swine fever has damaged the foundation of China’s hog industry, caused a serious decline in hog production, highlighted the contradiction between supply and demand in the pork market, and led to major economic and social impacts. This study measured the industrial resilience of 31 Chinese provinces which faced the African swine fever shock and its spatial and temporal differentiation characteristics from 2018-2021 in terms of the two dimensions of resistance and recoverability. Using Geodetector, the study explored the key factors influencing the resilience of China’s hog industry. The results showed that 2018-2019 and 2020-2021 were the resistance and recovery periods of the hog industry under the African swine fever shock, respectively, with poor resilience characterizing the resistance period and improved resilience exemplifying the recovery period. At the early stage of the African swine fever outbreak, Tianjin, Shanxi, Guangxi and Yunnan had robust resistance in the hog industry, and the slaughter rate, economic level, mortality rate, carcass weight and culling rate showed the highest explanation for the resistance. At the most severe stage of the outbreak, the resistance of the hog industry in all provinces was generally poor, and the slaughter rate, per capita consumption and scale level showed the highest explanation for the resistance. In the period of rapid recovery of hog production, the recoverability of each province was very strong, and the industrial structure, culling rate, economic level and resource carrying capacity showed the highest explanation for the recoverability. In the reasonable adjustment period of hog production capacity, the recoverability based on the breeding sow inventory in 13 provinces, including Henan, Shandong and other large hog breeding provinces, was negative, and the scale level, slaughter rate, per capita consumption and resource carrying showed the highest explanation for the recoverability. It is recommended to take measures to enhance the resilience of the hog industry, strengthen the prevention and control of hog epidemics, improve the monitoring and early warning mechanism, and strive to enhance the ability of the hog industry to cope with major animal epidemics.
Keywords:
African swine fever
; hog industry
; industry resilience
; resistance
; recoverability
; influencing factors
1. Introduction
A traditional Chinese saying states that “Hogs and grain can stabilize the nation”. The hog industry occupies a key strategic position in China’s national economic and social development. Since the reform and opening up, the development of China’s hog industry has achieved remarkable results, but it still faces many outstanding problems and practical challenges. In particular, the outbreak of African swine fever in 2018 had a significant negative impact on the hog industry and the pork market, severely challenging the foundation of the industry, leading to a severe decline in hog production, exacerbating the contradiction between supply and demand in the pork market, and pushing up the prices of livestock products across the board. In 2019, the number of hogs slaughtered started falling by 21.6% year on year, and pork production fell by 21.3%. In addition to the impact of cyclical factors, the African swine fever shock effect on hog price fluctuations beginning in the second half of 2019 was exceptionally obvious, with prices surging and becoming an important factor driving up China’s CPI. At the same time, African swine fever caused outstanding problems, such as a shortage of breeding sows, retention of ternary sows and low productivity of sows, severely impairing the sustainable development of the hog industry. Unlike the hog epidemic and the avian influenza in previous years, the impact of African swine fever was much greater and deeper, had more obvious and negative effects on China’s national economic development and the production and lives of its people.
To cope with the negative impact of African swine fever and accelerate the recovery of hog production, the Chinese government has intensively launched a series of policy initiatives, including infrastructure, agricultural machinery purchase, manure resource utilization, standardization demonstration, resumption of production support, epidemic prevention and control, finance and insurance, etc., entailing breakthroughs in terms of the policy of land use, prohibition and restriction of breeding. In 2022, China’s hog inventory reached 452.56 million heads, up 0.7% from the previous year, of which breeding sow inventory reached 43.90 million heads, an equivalent increase of 1.4%; hog slaughter reached 699.95 million heads, up by 4.3%; pork production reached 55.41 million tons, up by 4.6%; and hog production capacity was set in a reasonable range. A traditional Chinese saying states that “Family money with animal does not count”, referring to the major risk of animal disease for livestock breeding. At present, China still faces challenges, including a wide range of diseases, considerable capacity issues with respect to total hog breeding and weak epidemic prevention and control, and a large risk of introducing foreign animal epidemics. The future prevention and control of major animal epidemics cannot be ignored. In this context, to speed up the improvement of hog industry resilience, building a safe and effective supply of pork market “defense system” is of great practical significance.
There are currently no domestic or foreign studies on the resilience of China’s hog industry and its influencing factors, and the related literature has focused more on exploring the impact mechanisms of epidemic shocks such as African swine fever on the hog industry and pork market. Studies have concluded that epidemics have a high negative impact, can cause severe economic losses and pose a major threat to the livelihoods of farming households in developing countries [1,2,3]. Epidemics can affect market movements through both supply and demand levels, including constraining production, reducing consumption, and regulating trade [4,5,6,7,8]. African swine fever has reduced hog production capacity, tightened supply and initiated a new cycle of price increases, which in turn has contributed to the rise in the CPI [9,10]. The impact of epidemics such as African swine fever is also manifested in micro aspects; the willingness of farmers to expand the scale of farming under the epidemic shock is low, with less than a quarter of such farmers having the desire to expand the scale of farming [11]. The degree of epidemic loss has a significant negative impact on the decision-making behavior of farmers, but the difference in the factors affecting the decision-making behavior of different sizes of farms is obvious [12]. It will also affect the farm’s disease prevention and control behavior, efficiency and effectiveness [13,14].
Epidemics have a major impact on price fluctuations in the hog market, and “behind every round of large swings in hog prices, there is a lingering shadow of epidemic disease” [15,16,17]. Uncertain events, such as epidemics, are an important cause of large fluctuations in hog prices and their cyclical, time-varying, and state transition characteristics [18,19,20,21]. This type of unexpected event information has a leverage effect on hog price fluctuations, and this is why hog price fluctuations exhibit the characteristics of clustering, asymmetry, memory, and persistence [22]. The impact of this type of shock extends to the entire industrial chain and related markets, with significant regional differences [23,24]. Epidemic shocks not only affect supply, demand and price changes in the hog market but can also lead to a lack of confidence in the administration by market participants [25].
Thus far, the literature on resilience has focused on agricultural and macroeconomic fields, and its research paradigm and research methods have important reference value for this study. From the perspective of agricultural resilience, the current literature uses factor analysis, coupling coordination degree and other methods to study the characteristics, laws and synergistic strength of agricultural economic resilience and high-quality agricultural development [26]; it adopts the entropy value-topsis model and the superefficient SBM model to measure the resilience and efficiency of China’s marine fishery economy [27]; and constructs an evaluation based on the three dimensions of resistance, adaptability and change ability index system and thus explores the effect and mechanism of the digital economy on the robustness of the agricultural economy [28]. In terms of nonagricultural resilience, studies have been conducted to measure the resilience of Beijing’s tourism industry and China’s foreign trade from the perspectives of resistance, recoverability and resilience enhancement capacity by using the core variable method under the background of the impact of COVID-19 [29,30]; to measure the resilience of China’s provincial economy and the key factors affecting it from the perspective of resistance [31]; and to explore the spatial and temporal heterogeneity of logistics timeliness from a resilience perspective [32].
Considering that current studies have not yet systematically measured the resilience of China’s hog industry or explored the relevant influencing factors, exploring resilience is of great practical significance for promoting the stable and orderly development of the hog industry and ensuring the safe and effective supply of the pork market. Therefore, this study selects two core variables, namely, the inventory of hogs and breeding sows, and systematically measures the industrial resilience and its spatial and temporal characteristics of 31 provinces which are facing the impact of the African swine fever in 2018-2021; the study uses the two dimensions of resistance and recoverability, then investigates the influencing mechanism of the resilience of China’s hog industry utilizing Geodetector, and finally proposes relevant countermeasures and recommendations for policy and production decisions.
2. Methods and Materials
2.1. Methods
2.1.1. Hog Industry Resilience Measurement Method
Based on the theory of regional economic resilience, this study selects two indicators, namely, the inventory of hogs and breeding sows, as the core variables to measure the resilience of the hog industry towards the impact of African swine fever by measuring its resistance and recoverability. Resistance focuses on the ability of the hog industry to avoid the decline caused by the impact of African swine fever, while recoverability focuses on the ability of the hog industry to adapt and recover through its own vitality, external thrust and other factors. This study focuses on the resistance of the hog industry to fall from its normal level to a trough and the recoverability of the hog industry from such a trough back to its normal level under the impact of African swine fever.
The formula for calculating resistance is as follows:
where Resistancer denotes the resistance of the hog industry, Vires denotes the inventory of hogs or breeding sows in province r in year i during the resistance period, and Vi-1res denotes the inventory of hogs or breeding sows in province r in year i-1 during the resistance period.
The formula for calculating recoverability is as follows:
where Recoverabilityr denotes the recoverability of the hog industry, Virec denotes the inventory of hogs or breeding sows in province r in year i during the recovery period, and Vi-1rec denotes the inventory of hogs or breeding sows in province r in year i-1 during the recovery period.
2.1.2. Geodetector
In this study, a Geodetector was used to detect the relationship between various factors and the resilience of the hog industry in each province of China and to search for the factors with the most explanatory power. Geodetector is a statistical method used to detect spatial heterogeneity and reveal the driving force behind it, including factor detection, interaction detection, risk area detection, and ecological detection [33]. The specific model of Geodetector is as follows:
where q denotes the driving force explanatory factor, with a value range of 0-1. A larger value indicates that the influence factor has a higher degree of explanation for the resilience of the regional hog industry; h=1,2...; L is the number of classifications; Nh and N denote the number of sample units in stratum h and the whole region, respectively; and σh2 and σ2 denote the variance in stratum h and the whole region, respectively.
To explore the key factors affecting the resilience of the hog industry, this study combines regional economic theory, the actual development of the hog industry and the existing research foundation and systematically analyzes the four dimensions of the development foundation, scientific and technological support, basic security, and epidemic shock. Regarding the development foundation, four indicators are mainly considered: economic level, industrial structure, market share and per capita pork consumption; regarding scientific and technological support, four indicators are mainly considered: hog slaughter rate, carcass weight, scale breeding degree and labor productivity; regarding basic security, three indicators are mainly considered: comparative efficiency of hog breeding, resource carrying capacity and technical service level; regarding epidemic shock, three indicators are mainly considered: the number of cases, mortality and culling rate of African swine fever. In general, the better the development foundation of the hog industry, the higher the level of scientific and technological support and basic security, and the more robust the resilience of the hog industry; the more intense the impact of African swine fever, the weaker the resilience of the hog industry. The relevant influencing factors and the methods for calculating the resilience of China’s hog industry are shown in Table 1.
2.2. Materials
The period considered in this study is 2018-2021, because African swine fever started in 2018, and by 2021, the epidemic was better controlled and hog production had recovered to its normal previous levels. The study unit consists of 31 provinces in China, excluding Hong Kong, Macau and Taiwan. The basic data for this study were obtained from the China Statistical Yearbook, the China Animal Husbandry and Veterinary Yearbook, the National Compilation of Cost and Benefit Information of Agricultural Products, and the Official Veterinary Bulletin of the Ministry of Agriculture and Rural Affairs of the People’s Republic of China. Some of the data were specifically treated in the following ways: (1) Tibet lacks market prices for hogs and corn, and this study replaces them with the corresponding average prices across the country; (2) labor productivity in hog breeding is measured by the ratio of total output value per head to the number of laborers used on average for large, medium, and small farms; however, there is a lack of data for small farms in Beijing, Shanghai, and Tibet; for medium farms, there is a lack of data for Shanghai and Tibet; and for large farms, there are data gaps for Tibet and Ningxia, hence national averages data are added to fill such gaps.
3. Results and Discussion
3.1. Spatial and Temporal Characteristics of Hog Industry Resilience
Before examining the resilience of the hog industry and its influencing factors, it is necessary to identify the resistance and recovery periods of the hog industry. After the African swine fever outbreak was first diagnosed in China’s Liaoning province in August 2018, it spread rapidly across the country in just eight months. In terms of the changing dynamics of the inventory of hogs and breeding sows, both decreased by 3.04% and 4.71% in 2018 compared to the previous year, respectively, and by 27.50% and 27.70% in 2019 compared to the previous year, respectively. At the end of 2019, the Chinese government formulated and implemented the Three-Year Action Program for Accelerating the Resumption of the Development of Hog Production to promote the accelerated recovery of hog production to its normal levels of previous years. In 2020, the inventory of hogs and breeding sows increased by 30.96% and 35.09%, respectively, compared to the previous year, and the production capacity of hogs basically recovered to the level of a normal year in 2021, increasing by 10.51% and 4.02%, respectively, compared to the previous year (Figure 1). Therefore, 2018-2019 can be defined as the resistance period of the hog industry under the impact of African swine fever, and the resilience of the hog industry in the resistance period was obviously poor; 2020-2021 was the recovery period of the hog industry under the impact of African swine fever, and the resilience of the hog industry in the recovery period had become more robust.
Based on this, and considering the hog industry resilience measurement method and basic data, the resilience of the hog industry and its spatial and temporal characteristics were calculated. Table 2 shows the spatiotemporal characteristics of the resistance and recoverability of the hog industry, and Figure 2 and Figure 3 show the spatiotemporal characteristics of the industry resilience based on the inventory of hogs and breeding sows, respectively.
In terms of resistance, at the early stage of the African swine fever outbreak, that is, in 2018, Tianjin, Shanxi, Guangxi and Yunnan had positive resistance, and Shanxi and Xinjiang had positive resistance based on the inventory of breeding sows, indicating that the hog industry in these provinces was not negatively affected by African swine fever and maintained a relatively normal development trend. The five provinces with the worst resistance were Beijing, Shanghai, Fujian, Ningxia and Tibet, which are areas with a relatively weak hog breeding base; Liaoning Province, where African swine fever was first diagnosed, was also relatively hard hit. The main reason for this is the outbreak of African swine fever in the second half of 2018, which spread quickly and widely in a relatively short period, but during that period, the epidemic has not yet spread to all parts of the country, and there are still some areas that have not been affected or are less affected by the epidemic.
In 2019, when African swine fever was at its most severe state, except for the positive resistance level of the hog industry in Ningxia based on the inventory of breeding sows, the resistance of other provinces based on the inventory of hogs or breeding sows was negative, indicating that the resistance of the hog industry was generally poor during the most severe period of the epidemic. The main reason for this is that African swine fever appeared in China for the first time, and neither the government departments nor hog farmers had mature knowledge or experience in epidemic prevention and control, coupled with irrational epidemic prevention and control policies and epidemic awareness, causing more serious market panic and artificially deepening the impact of African swine fever. The five provinces with the worst resistance based on the hog inventory were Beijing, Jiangsu, Hainan, Qinghai and Shanghai, and the five provinces with the worst resistance based on the breeding sow inventory were Beijing, Hainan, Qinghai, Jiangsu and Guangdong. From the point of view of large hog farming provinces, Hunan, Sichuan and Yunnan provinces were affected by the impact of African swine fever at varying degrees, but the resistance was robust, and the impact was at a relatively moderate level.
In terms of recoverability, in 2020, when the recovery of hog production accelerated, the recoverability of the hog industry in 31 provinces was positive, based on the inventory of hogs or breeding sows, indicating that the hog industry nationwide had been showing continuous accelerated recovery and strong recoverability. The top five provinces in terms of recoverability based on hog inventory were Beijing, Jiangsu, Qinghai, Shanghai and Tibet, and the provinces at the bottom of the ranking were Shaanxi, Jilin, Guangxi, Guizhou and Heilongjiang; the top five provinces in terms of recoverability based on breeding sow inventory were Qinghai, Jiangsu, Beijing, Shanghai and Hainan, and the provinces at the bottom of the ranking were Tibet, Shaanxi, Guangxi, Jilin and Yunnan. The reason for the generally strong resilience of the hog industry in 2020 is mainly because the government has implemented a series of policies to prevent and control African swine fever and has vigorously promoted and supported hog farming, including the issuance and implementation of policy documents such as the Three-Year Action Program for Accelerating the Resumption of the Development of Hog Production, which has resulted in a very high level of activism among local governments and large-scale farms to resume and expand hog farming. During the period of piglet shortage, many farm households for rearing and expansion of the purchase of hogs, ternary sows or backcross sows as binary sows, crossbred sows as purebred hogs and other phenomena became frequent; moreover, the birth of foreign piglets was ordered by domestic hog farms.
In 2021, the recoverability based on the inventory of hogs has two provinces, Ningxia and Shanghai, as negative values, and the recoverability based on the inventory of breeding sows is relatively more negative, with 13 provinces, including Henan, Shandong and other large hog breeding provinces. The main reason for this is that in 2020, the year of accelerated recovery of hog production, many farm households blindly and disorderly expanded the healthy development of the hog industry, causing great potential problems. Facts have also proven that due to the unregulated expansion of hog farming, the price at the hog market in 2021 appeared to fall off a cliff and experienced the strongest “hard landing”, resulting in many farms experiencing the “epidemic impact loss - high price profits - price plunge loss” “roller coaster” of the “second blow”. To ensure the orderly development of the hog industry, the Ministry of Agriculture and Rural Affairs of the People’s Republic of China issued and implemented the Hog Production Capacity Control Implementation Plan (Provisional) in 2021, which clearly proposed stabilizing the hog production capacity within a reasonable range. The requirements of the 14th Five-Year Plan period were able to stabilize the normal retention of breeding sows at approximately 41 million, with a minimum retention of not less than 37 million, causing many provinces to reduce the size of breeding sows.
3.2. Influencing Factors of Hog Industry Resilience
The resistance and recoverability of the hog industry in each province was taken as the dependent variable, and 14 indicators in four dimensions, such as development foundation, scientific and technological support, basic security, and epidemic shock, were taken as independent variables. After the data of the independent variables were discretized by using the natural breakpoint method of Arc-GIS, we applied the factor detection and interaction detection of Geodetector to analyze the resistance and recoverability of the hog industry in China. The spatial differentiation of the factors affecting the resistance and recoverability of China’s hog industry was analyzed. Table 3 shows the results of the factor detection of resistance and recoverability of the hog industry, and Table 4, Table 5, Table 6, Table 7, Table 8, Table 9, Table 10 and Table 11 show the results of the interaction detection of resistance and recoverability of the hog industry.
Regarding the factors influencing resistance in the hog industry, in 2018, at the early stage of the African swine fever outbreak, the five indicators with the highest explanation for the resistance based on the inventory of hogs were the slaughter rate, economic level, mortality rate, carcass weight, and culling rate, and the five indicators with the highest explanation for the resistance based on the inventory of breeding sows were the slaughter rate, economic level, carcass weight, mortality rate, and culling rate. Contrasting the two sets of factors, they appear to be the same indicators, indicating that the scientific and technological support capacity, the economic development level and the epidemic shock have had a large impact on the resistance of the hog industry in the early stage of the African swine fever outbreak. The higher the level of economic development, the more fundamental advantages the development of the hog industry has and the stronger its resistance; the more severe the African swine fever shock, the greater the impact on the hog industry and the weaker its resistance. In general, the slaughter rate and carcass weight reflect the level of scientific and technological development, and these factors show a positive relationship with the resilience of the hog industry, i.e., the higher the slaughter rate and the higher the carcass weight, the stronger the resilience of the hog industry. However, in the early stage of the African swine fever outbreak, the extent of the impacts cannot be based on the general situation, as affected by information asymmetry and many other factors. Many farmers experiencing market panic and other influences accelerated slaughter activities, resulting in a substantial increase in the hog slaughter rate, and carcass weight decreased sharply. At that time, the slaughter rate and carcass weight proved that more industry resilience is not enough.
In 2019, when the African swine fever outbreak was at its worst, the five indicators with the highest explanation for the resistance based on hog inventory were slaughter rate, per capita consumption, scale level, economic level, and the number of cases, while the five indicators with the highest explanation for the resistance based on breeding sow inventory were per capita consumption, slaughter rate, technical service, labor productivity, and scale level. Contrasting the two sets of indicators, the same indicators were slaughter rate, per capita consumption and scale level. As mentioned above, when there is an outbreak of African swine fever, many hog farmers would accelerate slaughter efforts, resulting in a slaughter rate different from the level of normal years, and the abnormal slaughter level of hog farming is directly related to the lack of resilience. During the period of serious impact of African swine fever, large-scale farms have had a better foundation and stronger advantages than small-scale farms and free-range farmers, and their resistance to the impact of African swine fever was greater. That is, the higher the scale level is, the greater the resistance and resilience of the hog industry. The epidemic impact also caused a decline in hog production capacity and pork supply shortages, and residents’ consumption and other demand-side factors became important factors affecting the resistance of the hog industry.
Regarding the factors influencing the recoverability of the hog industry, in 2020, the year of rapid recovery of hog production, the five indicators with the highest explanation for the recoverability based on the inventory of hogs were industrial structure, slaughter rate, culling rate, economic level, and resource carrying, and the five indicators with the highest explanation for the recoverability based on the inventory of breeding sows were resource carrying, labor productivity, culling rate, economic level, and industrial structure. The same indicators are industrial structure, culling rate, economic level and resource carrying capacity. The industrial structure reflects the advantages of the hog industry. The higher the industrial structure, i.e., the higher the proportion of the output value of the hog industry in the total agricultural output value, the greater the hog industry in terms of being the dominant industry in the region, the better the foundation of its development, and the more robust the recovery and resilience. The culling rate reflects the severity of the impact of African swine fever, hence the higher the culling rate is, the more severe the epidemic and the greater the threat to the resilience of the hog industry. In addition, hogs are grain-feeding livestock; the better the resource base, the stronger the carrying capacity, the more secure the feed grain for the development of the hog industry, and the stronger its recoverability and resilience. The mechanism of the influence of the economic level on the resilience of the hog industry is the same as above.
In 2021, when hog production capacity was reasonably adjusted, the five indicators with the highest explanation for recoverability based on hog inventory were the scale level, slaughter rate, resource carrying, per capita consumption and economic level, and the five indicators with the highest explanation for recoverability based on breeding sow inventory were the scale level, slaughter rate, per capita consumption, labor productivity and resource carrying. Contrasting the two sets of indicators, the same indicators are scale level, slaughter rate, per capita consumption and resource carrying capacity. The degree of scale and the slaughter rate show the level of scientific and technological support during the reasonable adjustment period of hog production capacity. Scale is the inevitable requirement for the high-quality development of the hog industry, and the slaughter rate reflects the scientific and technological level under normal circumstances. Both have a positive impact on the recoverability and resilience of the hog industry in the adjustment period of hog production capacity. The influence mechanism of per capita consumption and resource carrying is consistent with the above.
Regarding the results of the interaction detection of resistance and recoverability in the hog industry, the effect of any two factors interacting on the resistance and recoverability divergence pattern of the hog industry is greater than the effect of any one variable alone on the spatial divergence pattern of resistance and recoverability, indicating that the relevant effects of the resilience of the hog industry are all integrated effects. In addition, resistance based on the inventory of hogs was a two-factor enhancement of 27 in 2018, and the corresponding number of the two-factor enhancements for resistance and recoverability in 2019-2021 was 16-17; resistance based on the inventory of breeding sows was a two-factor enhancement of 26 in 2018 and only 3 in 2019, and the corresponding two-factor enhancements for recoverability in 2020-2021 were all 11; all remaining factor interactions were nonlinear enhancements.
4. Conclusions
In this study, we select two core variables, namely, the inventory of hogs and breeding sows; we measure the industrial resilience and its spatial and temporal characteristics of 31 provinces of China which are faced with the impact of African swine fever in terms of resistance and recoverability. We then explore the influence mechanism of the resilience of China’s hog industry using Geodetector, and we obtain the following research conclusions.
First, 2018-2019 and 2020-2021 are the resistance and recovery periods of the hog industry under the impact of African swine fever, respectively, with poor resilience of the industry in the resistance period and robust resilience in the recovery period. The increased resilience of China’s pork industry is mainly due to the adjustment of the policy for the prevention and control of African swine fever and the implementation of the policy for the recovery of hog breeding and pork production.
Second, there are differences in the resistance and recoverability of the hog industry across different provinces and periods under the impact of African swine fever. In the early stage of the African swine fever outbreak, Tianjin, Shanxi, Guangxi and Yunnan have had strong resistance of the hog industry; in the most severe stage of the African swine fever outbreak, the resistance of the hog industry in all provinces was generally poor; in the period of rapid recovery of hog production, the recoverability of all provinces was very strong; in the reasonable adjustment period of hog production capacity, the recoverability of the 13 provinces, including Henan, Shandong and other large hog breeding provinces. based on the inventory of breeding sows, was negative, and resulted from active policy regulation.
Third, there are differences in the key factors influencing the resilience of the hog industry across different provinces and different periods. In the early stage of the African swine fever outbreak, slaughter rate, economic level, mortality rate, carcass weight and culling rate had the highest explanation for the resistance of the hog industry; in the most severe period of the African swine fever outbreak, slaughter rate, per capita consumption and scale level had the highest explanation for the resistance of the hog industry; in the period of rapid recovery of hog production, industrial structure, culling rate, economic level and resource carrying had the highest explanation for the recoverability of the hog industry; and in the reasonable adjustment period of hog production capacity, scale level, culling rate, per capita consumption and resource carrying explained the highest degree of recoverability of the hog industry.
Based on the above research conclusions, the following countermeasures are suggested for reference. First, the resilience of the hog industry should be improved. It is necessary to accelerate the construction of the modern hog industry system, production system, and business system, promote the modernization of breeding, processing, circulation, sales and other high-quality development of the whole industry chain, and further enhance the resilience of the industry chain, supply chain and security level. Continuously cultivate new industries, new forms and new modes, focus on improving the level of industrial integration and development, further extend the industrial chain, improve the value chain, stabilize the supply chain, and enhance the resilience of the hog industry by internalizing risks. We should strengthen disaster prevention, mitigation and relief capacity building, support the hog breeding insurance system, especially for the prevention and control of major epidemics, and further consolidate the risk prevention foundation of the hog industry and the risk transfer capacity.
Second, the prevention and control of hog epidemics should be strengthened. The initiative, foresight and precision of epidemic prevention and control policies should be strengthened, and short-term emergency response, long-term effective response, market shock regulation and control should be improved. Promote the construction of a hog disease prevention and control system by comprehensively covering the whole industrial chain and supply chain, such as breeding, slaughtering, processing, circulation and sales. Strengthen the establishment of grassroots animal disease prevention and control teams and enhance technical training. Optimize biosecurity, culling, vaccination and other means of prevention and control and improve epidemic reporting, culling subsidies and other systems.
Third, the monitoring and early warning mechanism should be improved. Improve the mechanisms of hog epidemic risk identification, market monitoring and early warning, and regularly release information, reports and plans. Based on one national standard and one set of data, the uniformity and authority of information should be improved. Abandon the “internal reference” and other old concepts and old ways, so that the data and information are open and transparent to the whole society, thereby every producer, consumer, researcher and policy maker can access the relevant information to avoid market panic and confusion.
Author Contributions
Conceptualization, Z.S. and X.H.; methodology, Z.S. and X.H.; resources, Z.S. and X.H.; data curation, Z.S. and X.H.; writing—original draft preparation, Z.S. and X.H.; writing—review and editing, Z.S. and X.H.; visualization, Z.S. and X.H.; supervision, Z.S. and X.H.; project administration, Z.S. and X.H.; funding acquisition, Z.S. and X.H. All authors have read and agreed to the published version of the manuscript.
Funding
This research was funded by the National Social Science Fund of China (22CGL025), National Natural Science Foundation of China (72033009), Central Public-interest Scientific Institution Basal Research Funds (1610052023013, 1610052023004), and Agricultural Science and Technology Innovation Program (10-IAED-01-2023).
Institutional Review Board Statement
Not applicable.
Data Availability Statement
Data available on request from the authors.
Conflicts of Interest
The authors declare no conflict of interest.
References
- Boisvert, R.N.; Kay, D.; Turvey, C.G. Macroeconomic costs to large scale disruptions of food production: the case of foot-and-mouth disease in the United States. Econ. Model. 2012, 29, 1921–1930. [Google Scholar] [CrossRef]
- Fadiga, M.L.; Katjiuongua, H.B. Issues and strategies in ex-post evaluation of intervention against animal disease outbreaks and spread. Food policy 2014, 49, 418–424. [Google Scholar] [CrossRef]
- Mason-D’Croz, D.; Bogard, J.R.; Herrero, M.; Robinson, S.; Sulser, T.B.; Wiebe, K.; Willenbockel, D.; Godfray, H.C.J. Modelling the global economic consequences of a major African swine fever outbreak in China. Nat. Food 2020, 1, 221–228. [Google Scholar] [CrossRef]
- Rassy, D.; Smith, R.D. The economic impact of H1N1 on Mexico’s tourist and pork sectors. Health Econ. 2013, 22, 824–834. [Google Scholar] [CrossRef]
- Taha, F.A.; Hahn, W.F. The impact of BSE on U.S. exports of beef and pork. Agribusiness 2014, 30, 5–16. [Google Scholar] [CrossRef]
- Pitts, N.; Whitnall, T. Impact of African swine fever on global markets. Agric. Commod. 2019, 9, 52–54. [Google Scholar]
- Carriquiry, M.; Elobeid, A.; Hayes, D.J.; Zhang, W.D. Impact of African swine fever on US and world commodity markets. Agric. Policy Rev. 2019, 3, 1–2. [Google Scholar]
- Shi, Z.Z.; Li, J.R.; Hu, X.D. The impact of pig epidemics on China’s pork supply and demand. J. Agrotech. Econ. 2023, 3, 4–17. [Google Scholar]
- Zhu, Z.Y.; Li, M.X.; Zhang, X.B. Analysis on effects of African swine fever on China’s pig market and industry development. Trans. Chin. Soc. Agric. Eng. 2019, 35, 205–210. [Google Scholar]
- Kang, H.Q.; Xiao, H.F. The economic impacts of recent pork price increase in China caused by the African swine fever. Res. Agric. Mod. 2020, 41, 493–501. [Google Scholar]
- Nie, Y.B.; Gao, X.; Li, B.L.; Qiao, J. Farmers’ production decision under the background of African swine flu: thoughts on the recovery and development of hog production. Res. Agric. Mod. 2020, 41, 1031–1039. [Google Scholar]
- Zhou, X.Z.; Li, G.D.; Meng, X.H.; Yang, J.L.; Lu, J. Decision-making behaviors and influence factors of pig farmers at different scales against African swine fever. Trans. Chin. Soc. Agric. Eng. 2020, 36, 316–324. [Google Scholar]
- Wang, J.M.; Hu, X.D. Factors influencing disease prevention and control behaviours of hog farmers. Animals 2023, 13, 787. [Google Scholar] [CrossRef] [PubMed]
- Yan, Z.H.; Wang, M.L.; Li, X.J.; Jiang, H. Impact of African swine fever epidemic on the cost intensity of pork production in China. Agriculture 2023, 13, 497. [Google Scholar] [CrossRef]
- Li, H.S.; Hu, C.P.; Lv, Z.; Li, M.Q.; Guo, X.Z. African swine fever and meat prices fluctuation: an empirical study in China based on TVP-VAR model. J. Integr. Agric. 2021, 20, 2289–2301. [Google Scholar] [CrossRef]
- Li, J.R.; Shi, Z.Z.; Hu, X.D. Analysis of the impact of epidemic shock on China’s hog market volatility. J. Agro-Forestry Econ. Manag. 2022, 21, 453–462. [Google Scholar]
- Chen, Y.F.; Hua, J.G.; Zhang, J.H. Study on shock and spillover effect of swine epidemic change on pork price. J. Agrotech. Econ. 2022, 7, 48–63. [Google Scholar]
- Wang, M.L.; Li, W.Y. Circular decomposition of hog prices trend and measure on the effect of random shocks. J. Agrotech. Econ. 2010, 12, 68–77. [Google Scholar]
- Shi, Z.Z.; Wang, M.L.; Hu, X.D. Uncertainty of economic policy and price fluctuation of animal products in China. Chin. Rural Econ. 2016, 8, 42–55. [Google Scholar]
- Shi, Z.Z.; Zhou, H.; Hu, X.D. The impacts of disease shocks on the price volatility of China’s livestock products. Res. Agric. Mod. 2020, 41, 863–871. [Google Scholar]
- Shi, Z.Z.; Hu, X.D. Epidemic shock, policy regulation, and China’s hog market price volatility. Res. Agric. Mod. 2023, 44, 130–141. [Google Scholar]
- Miao, S.S. The impact of emergency information on pork price volatility. Manag. Rev. 2018, 30, 246–255. [Google Scholar]
- Zhang, X.C.; Zhang, L.X.; Bian, Q.S. External shocks’ impact on the price fluctuations in the pig industry chain and the regulatory mechanism. J. Agrotech. Econ. 2012, 7, 22–31. [Google Scholar]
- Duan, C.C.; Liu, L.Z. The dynamic relationship of price fluctuation of livestock and poultry products with the influence of African swine fever in China: from the perspective of public opinion management. Res. Agric. Mod. 2020, 41, 678–686. [Google Scholar]
- Scott, A.; Christie, M.; Midmore, P. Impact of the 2001 foot-and-mouth disease outbreak in Britain: implications for rural studies. J. Rural Stud. 2004, 20, 1–14. [Google Scholar] [CrossRef]
- Jiang, H.; Zhang, C.; Jiang, H.P. Study on effect and mechanism of China’s agricultural economic resilience on agricultural high-quality development. Agric. Econ. Manag. 2022, 1, 20–32. [Google Scholar]
- Han, Z.L.; Zhu, W.C.; Li, B. Synergistic analysis of economic resilience and efficiency of marine fishery in China. Geogr. Res. 2022, 41, 406–419. [Google Scholar]
- Zhao, W.; Xu, X.W. Effect and mechanism of digital economy on the resilience of agricultural economy. J. South China Agric. Univ. (Soc. Sci. Ed.) 2023, 22, 87–96. [Google Scholar]
- Di, Q.B.; Chen, K.Q.; Chen, X.L. The economic resilience measurement of Beijing’s tourism industry and its influencing factors under the impact of the COVID-19 pandemic. Econ. Geogr. 2023, 43, 133–140. [Google Scholar]
- Zong, H.M.; Zhang, J.M.; Liu, H.M. Spatial pattern and influencing factors of China’s foreign trade resilience under the COVID-19 pandemic. Geogr. Res. 2021, 40, 3349–3363. [Google Scholar]
- Li, L.G.; Hu, X.H. Analysis on the spatial-temporal pattern and influencing factors of regional economic resilience in China under the COVID-19 pandemic. World Reg. Stud. 2023, 32, 64–75. [Google Scholar]
- Yu, J.Y.; Zhang, Y.N.; Liu, W.D.; Xiao, Z.P. Research on spatio-temporal heterogeneity of global cross-border e-commerce logistics resilience under the impact of the COVID-19 epidemic. Geogr. Res. 2021, 40, 3333–3348. [Google Scholar]
- Wang, J.F.; Xu, C.D. Geodetector: principle and prospective. Acta Geogr. Sin. 2017, 72, 116–134. [Google Scholar]
Figure 1.
Trends in hog inventory and epidemics. Data source: National Bureau of Statistics and the Official Veterinary Bulletin of the Ministry of Agriculture and Rural Affairs of the People’s Republic of China.
Figure 1.
Trends in hog inventory and epidemics. Data source: National Bureau of Statistics and the Official Veterinary Bulletin of the Ministry of Agriculture and Rural Affairs of the People’s Republic of China.
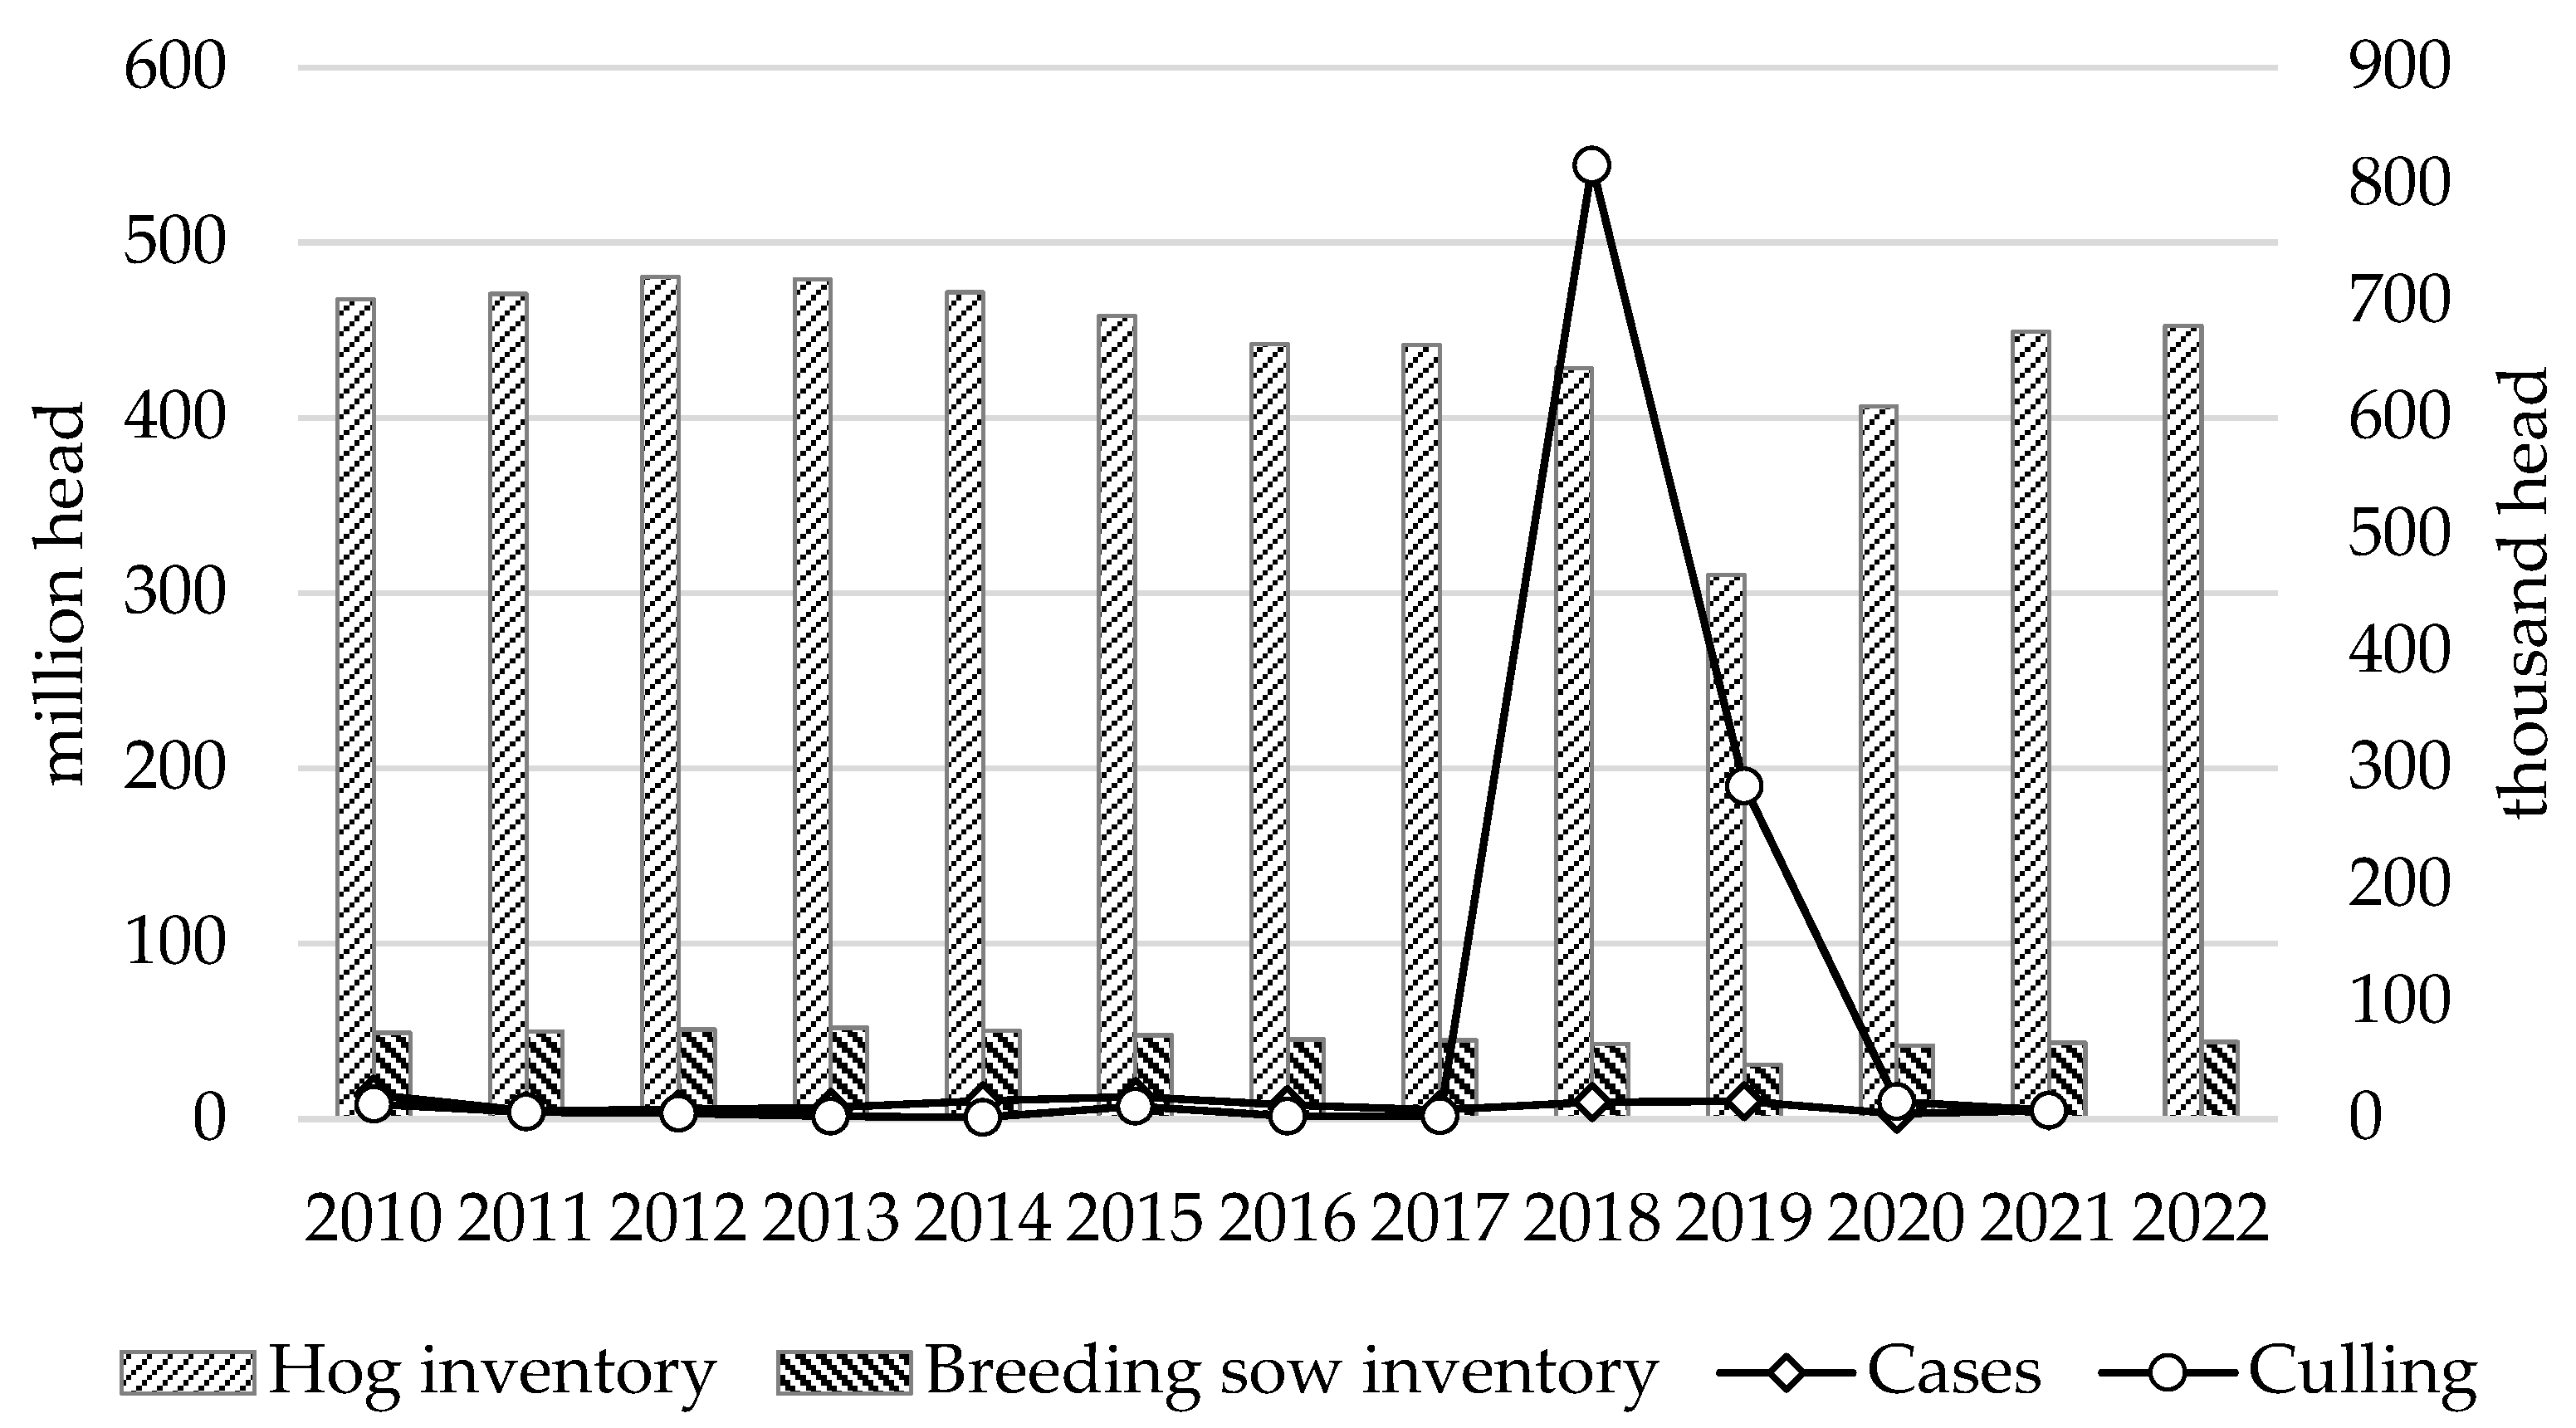
Figure 2.
Spatiotemporal characteristics of industry resilience based on hog inventory.
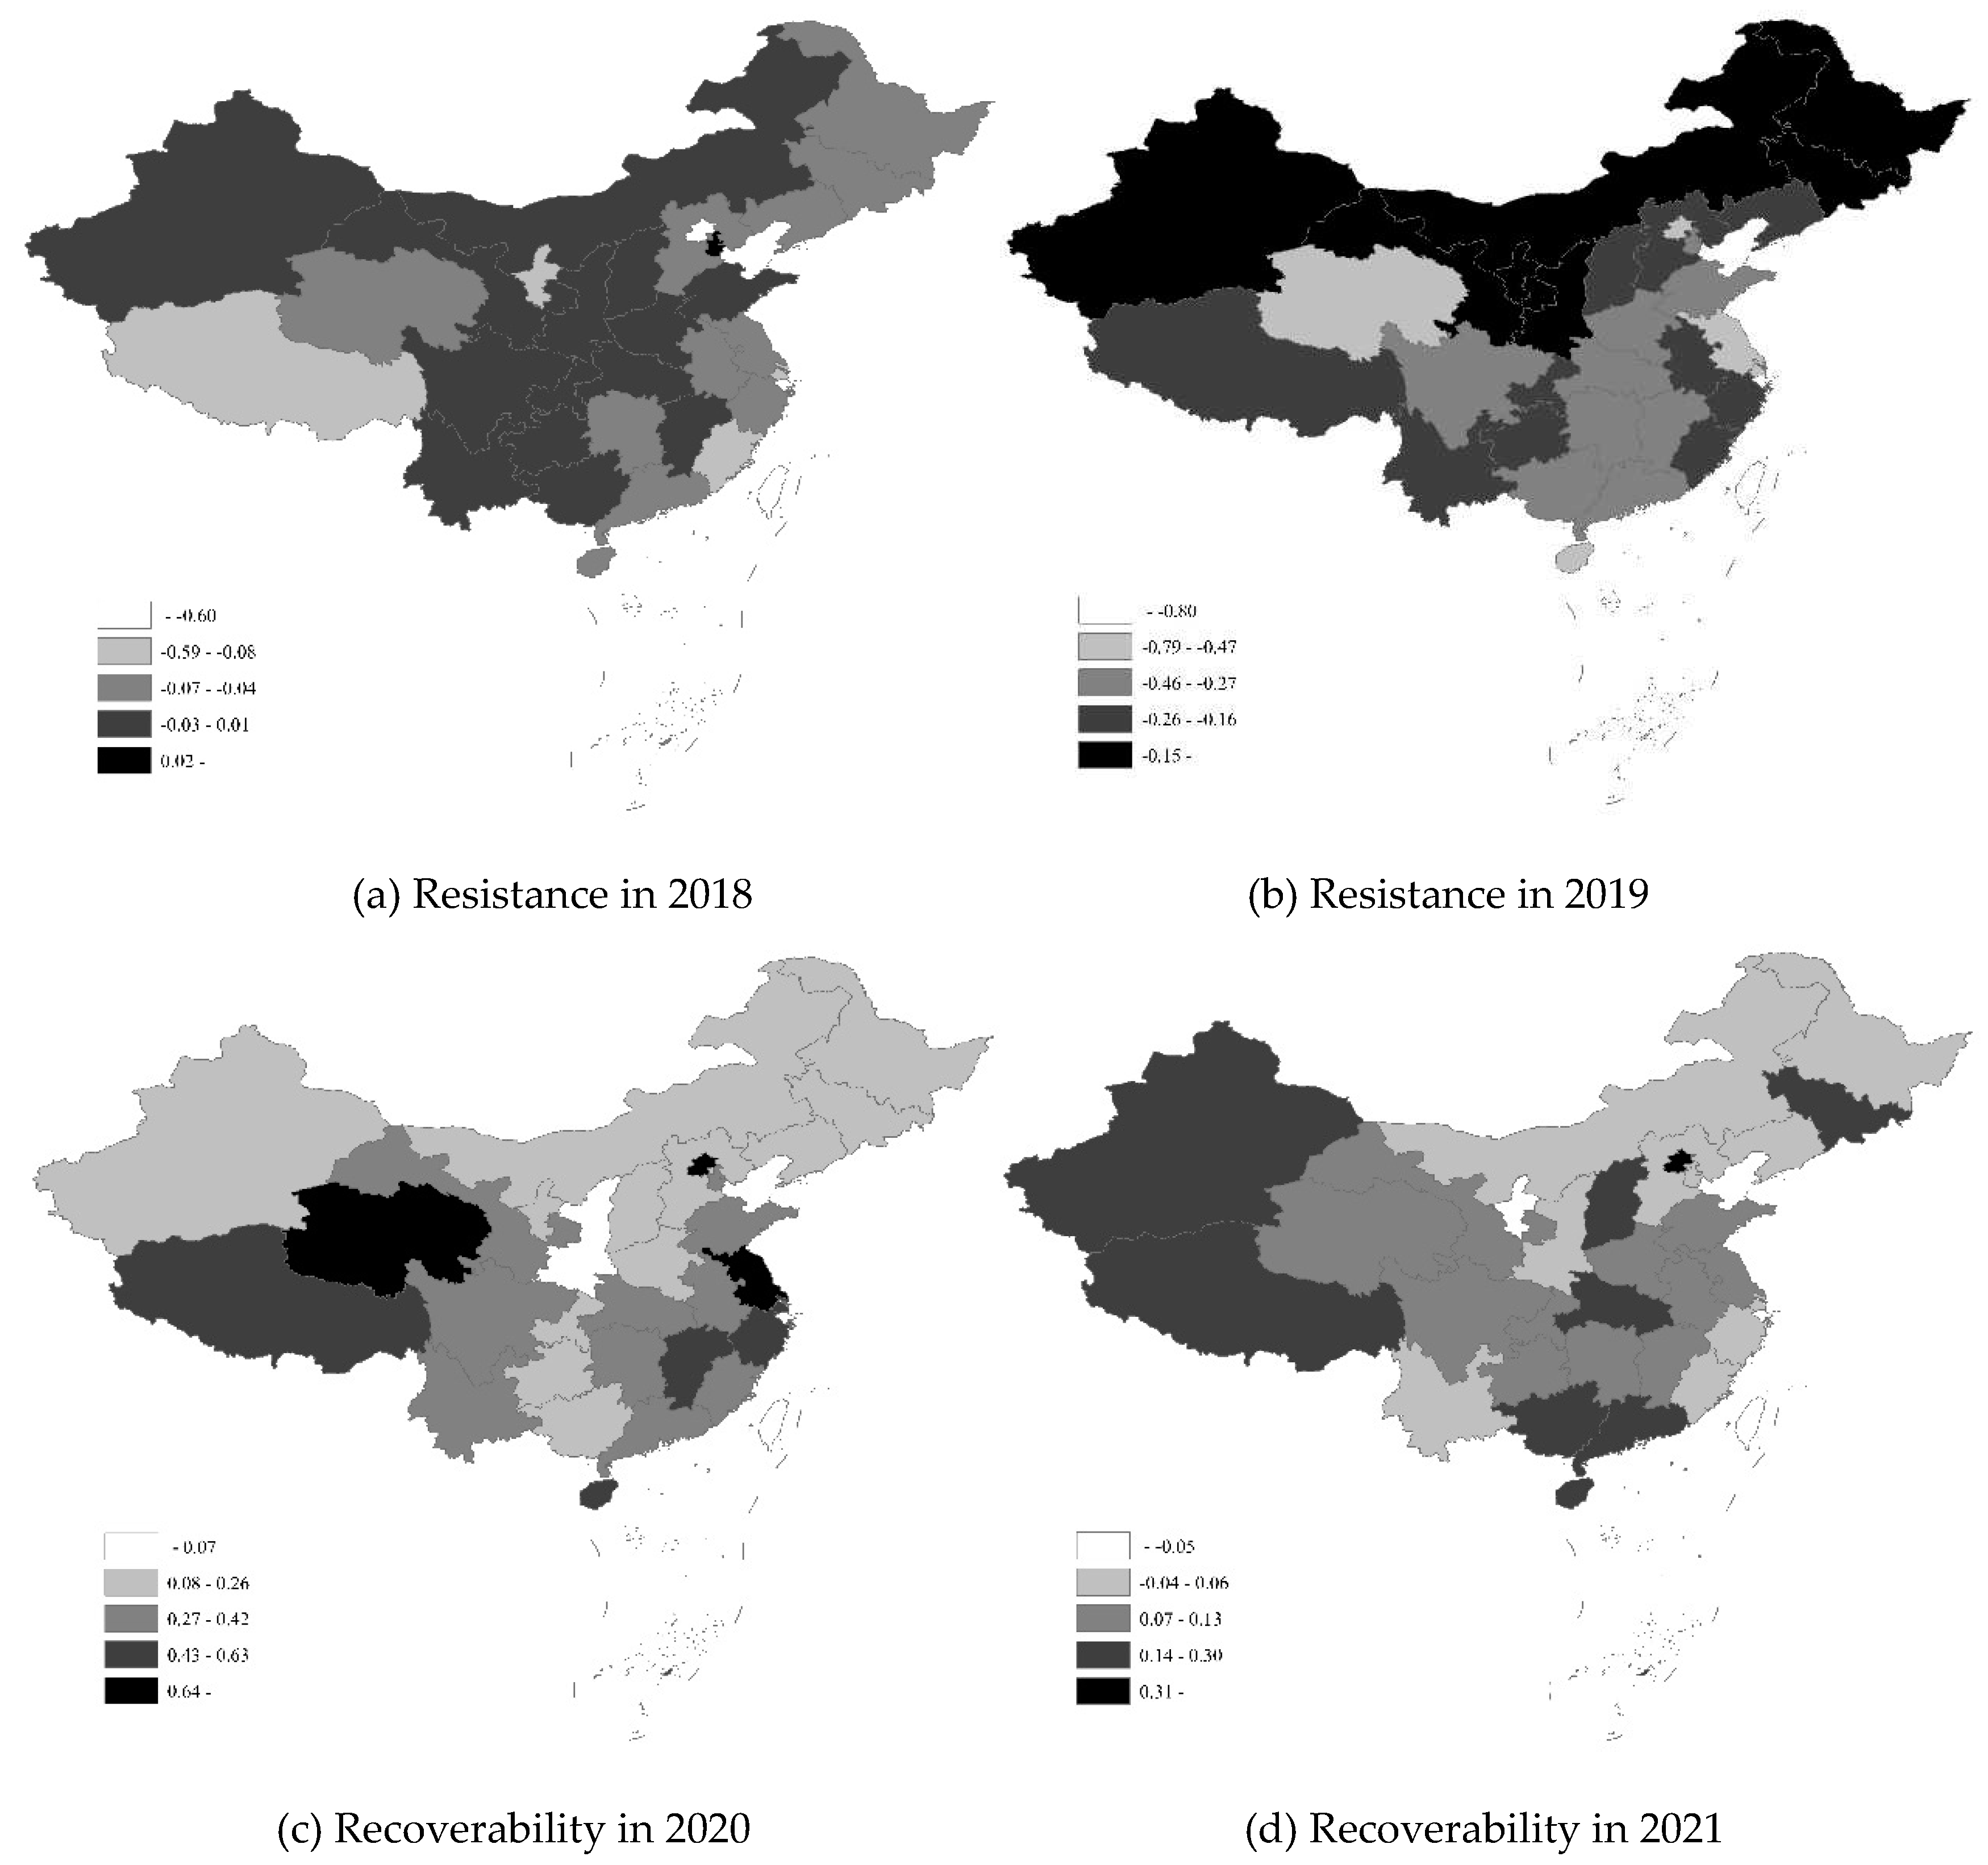
Figure 3.
Spatiotemporal characteristics of industry resilience based on breeding sow inventory.
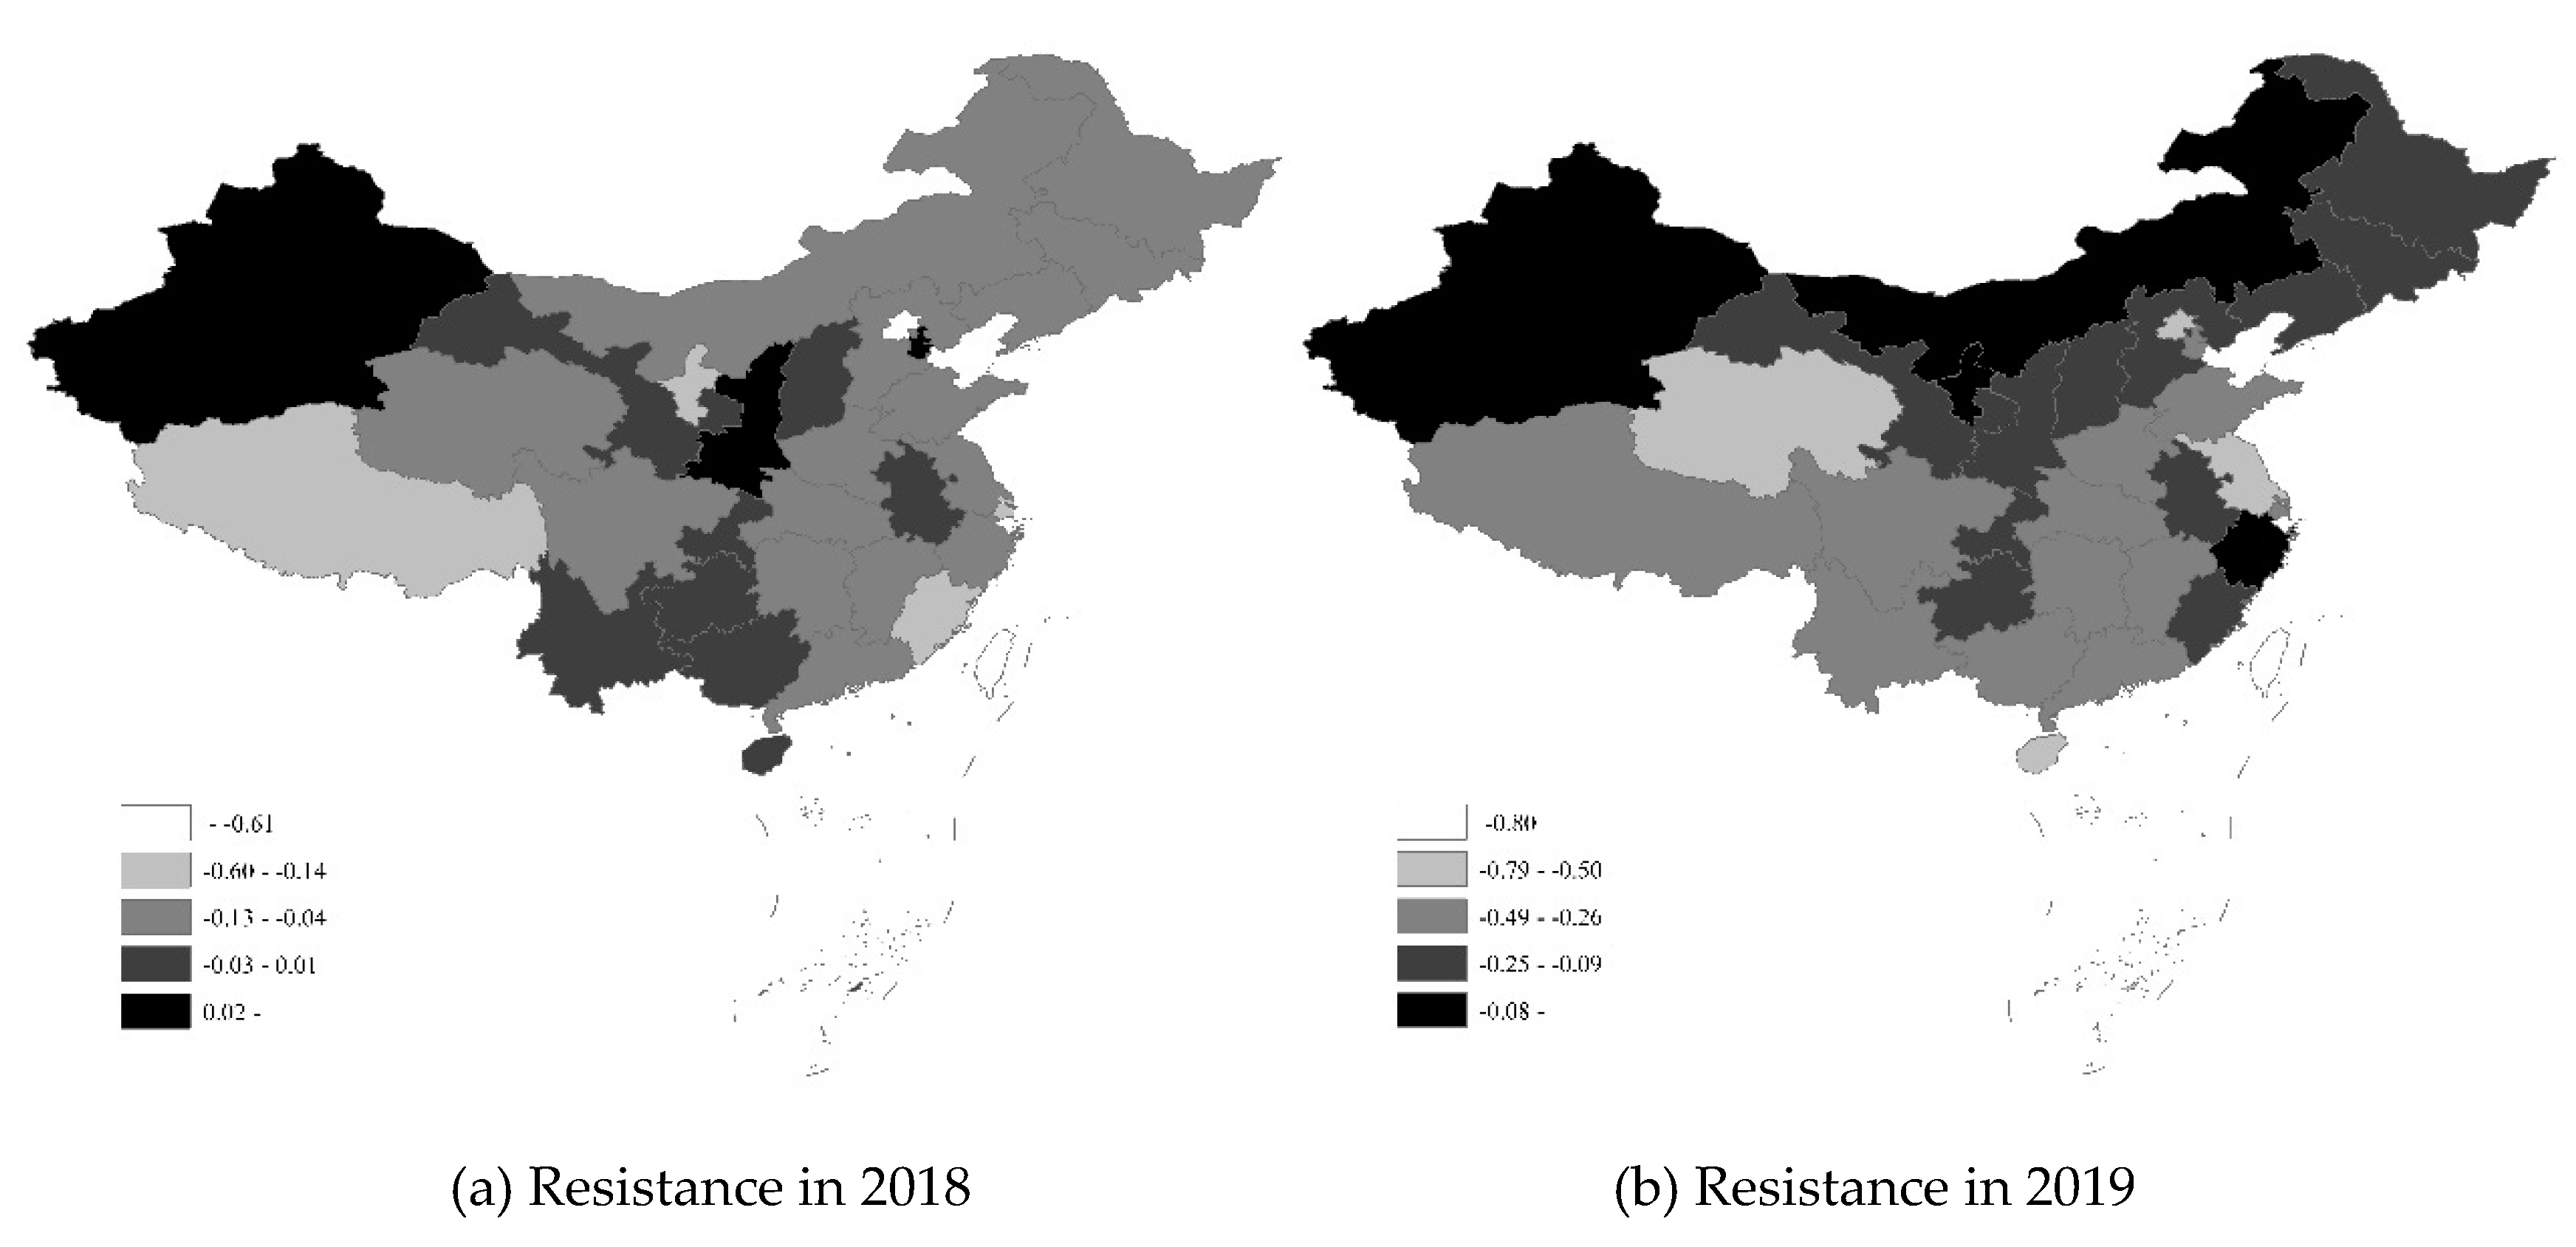
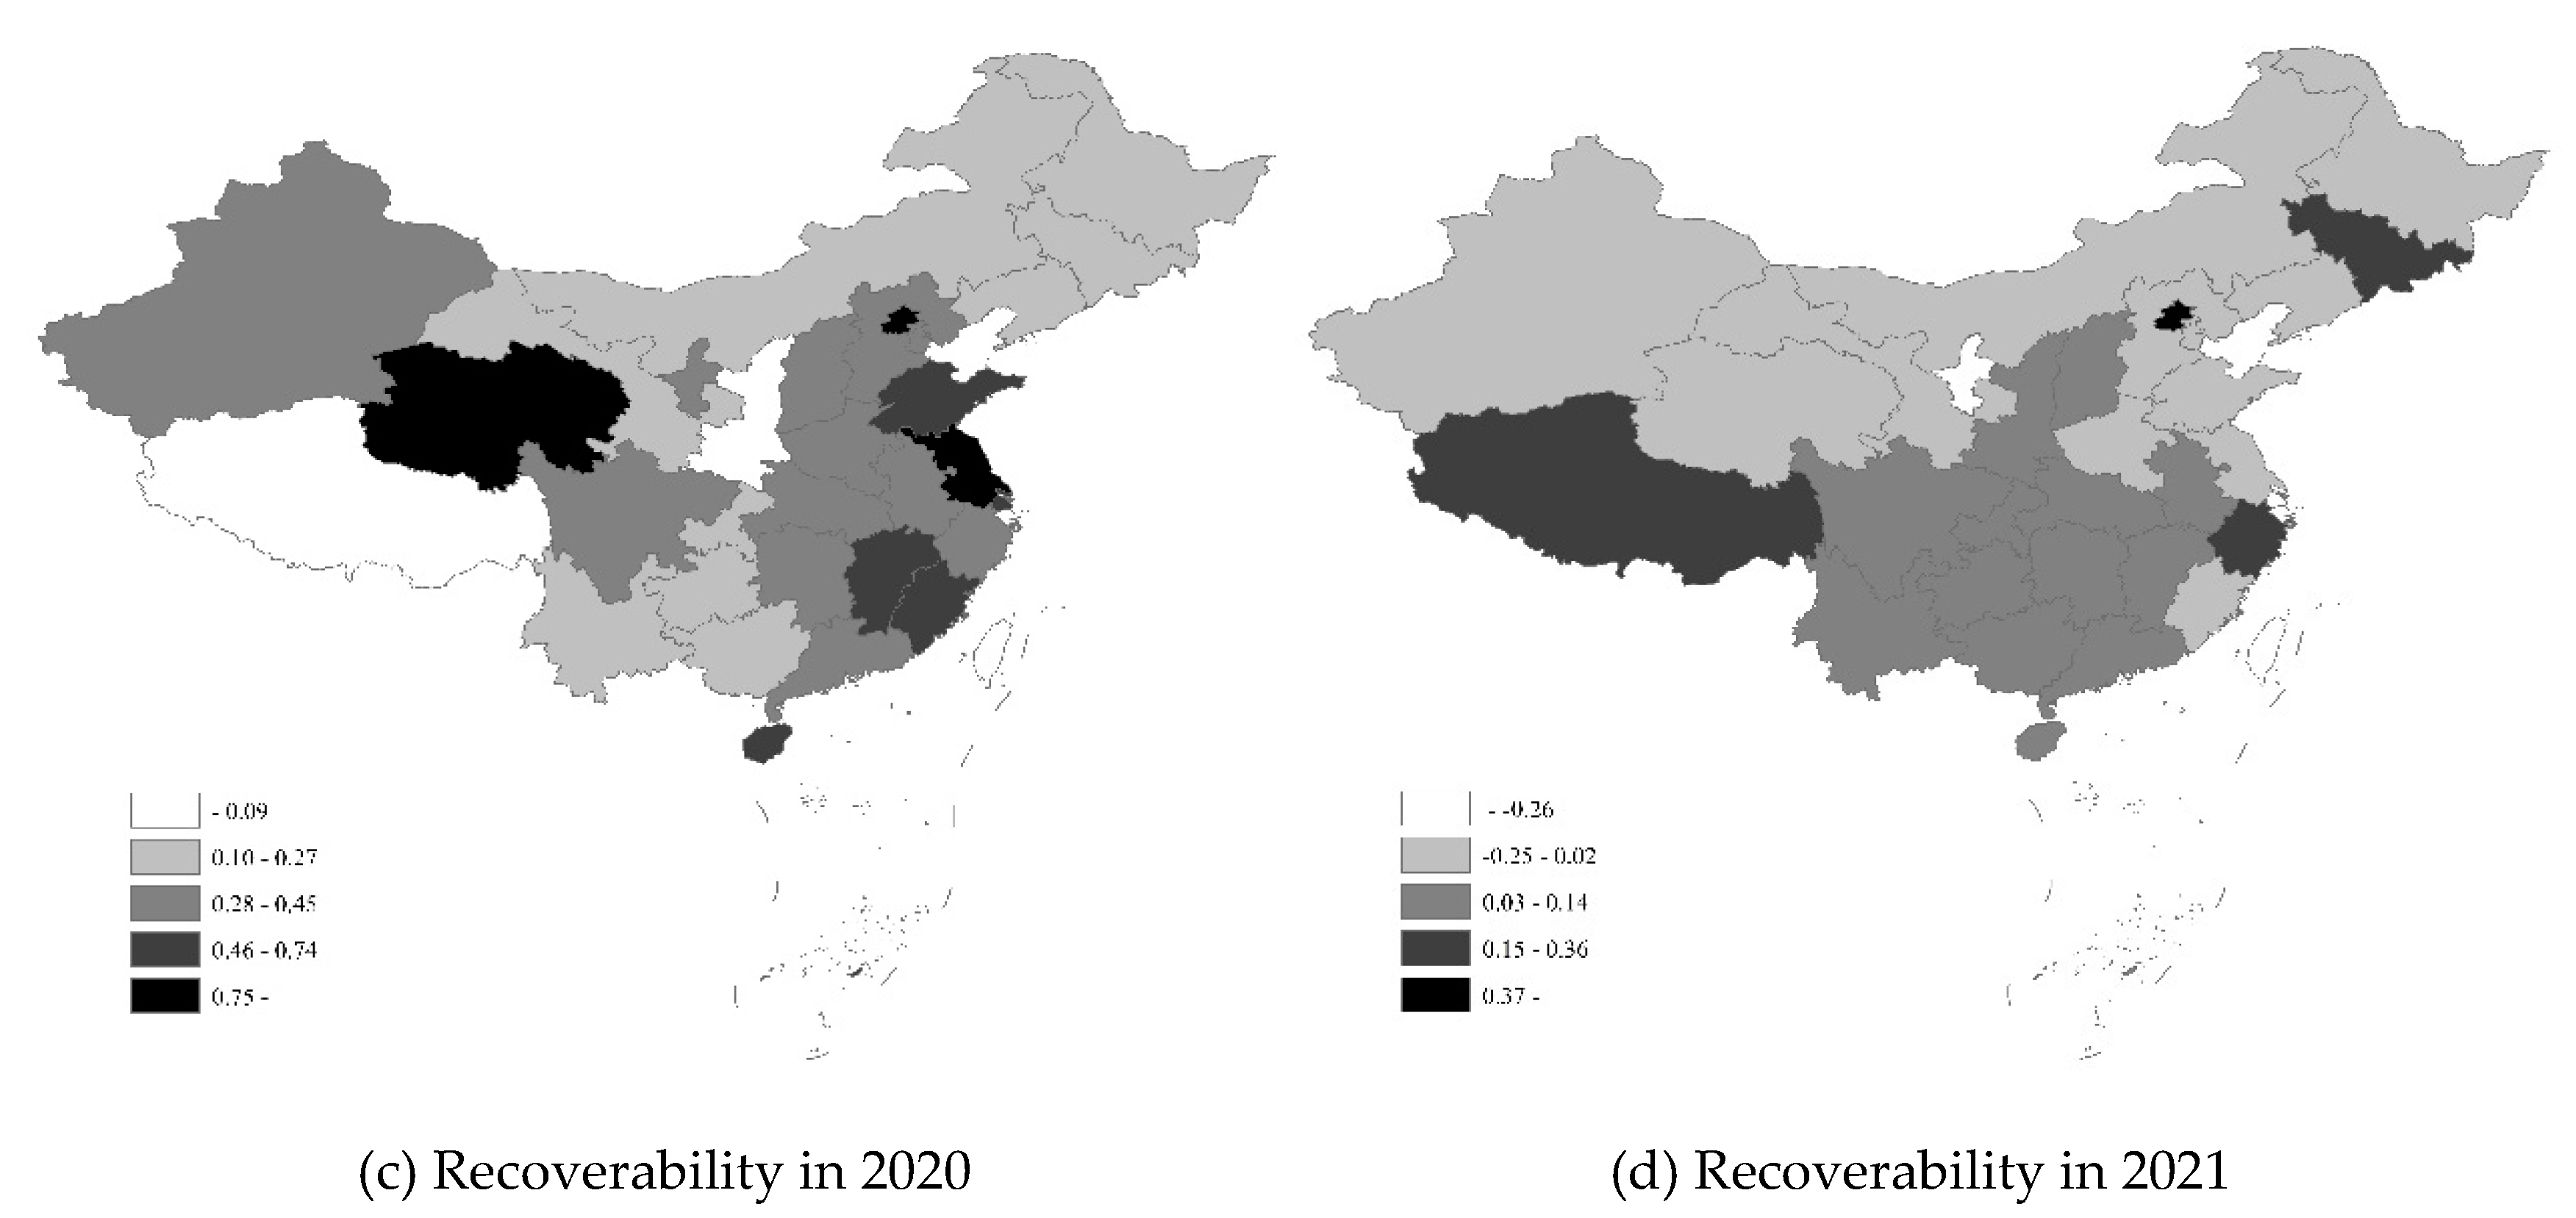

Table 1.
Geographic detection factors.
| Type | Indicator | Unit | Interpretation of indicators |
|---|---|---|---|
| Development foundation | Economic level | CNY | GDP per capita |
| Industrial structure | % | Share of hog industry output value in total agricultural output value | |
| Market share | % | Share of the region’s hog inventory in the national inventory | |
| Per capita consumption | kg | Per capita household consumption of pork | |
| Scientific and technological support | Slaughter rate | % | Ratio of number of hogs slaughtered to number of hog inventory |
| Carcass weight | kg/head | Ratio of pork production to the number of hogs slaughtered | |
| Scale level | % | Share of farms with more than 500 head in total farms | |
| Labor productivity | CNY | Ratio of average gross value added per hog to number of workers | |
| Basic security | Comparative benefit | — | Ratio of hog prices to corn prices |
| Resource carrying | head/ha | Ratio of hog inventory to grain acreage | |
| Technical service | head | Ratio of hog inventory to the number of employees in the township animal husbandry and veterinary stations | |
| Epidemic shock | Cases | head | Number of cases due to African swine fever outbreaks |
| Mortality rate | % | Ratio of deaths to cases due to African swine fever outbreaks | |
| Culling rate | % | Ratio of culls to hog inventory due to African swine fever outbreaks |
Table 2.
Spatiotemporal characteristics of resistance and recoverability of hog industry.
| Province | Hog | Breeding sow | ||||||
|---|---|---|---|---|---|---|---|---|
| Resistance (2018) |
Resistance (2019) |
Recoverability (2020) |
Recoverability (2021) |
Resistance (2018) |
Resistance (2019) |
Recoverability (2020) |
Recoverability (2021) |
|
| Beijing | -0.5950 | -0.7097 | 1.4397 | 0.8350 | -0.6136 | -0.7255 | 1.1429 | 0.8333 |
| Tianjin | 0.0942 | -0.3690 | 0.3064 | 0.0545 | 0.0698 | -0.3696 | 0.3241 | -0.0260 |
| Hebei | -0.0700 | -0.2210 | 0.2330 | 0.0350 | -0.0701 | -0.1869 | 0.3225 | -0.0160 |
| Shanxi | 0.0099 | -0.1785 | 0.2614 | 0.3000 | 0.0126 | -0.1365 | 0.3162 | 0.1139 |
| Inner Mongolia | -0.0164 | -0.1362 | 0.2433 | 0.0582 | -0.0853 | -0.0329 | 0.2571 | -0.0226 |
| Liaoning | -0.0350 | -0.1640 | 0.2170 | 0.0190 | -0.0781 | -0.1552 | 0.2562 | -0.0152 |
| Jilin | -0.0447 | -0.0891 | 0.1340 | 0.2653 | -0.0855 | -0.0946 | 0.1714 | 0.2024 |
| Heilongjiang | -0.0563 | -0.1330 | 0.1687 | 0.0329 | -0.0457 | -0.1603 | 0.2203 | -0.0270 |
| Shanghai | -0.1327 | -0.4741 | 0.6342 | -0.0123 | -0.1667 | -0.2933 | 0.7358 | -0.3587 |
| Jiangsu | -0.0538 | -0.6279 | 1.3810 | 0.0784 | -0.0578 | -0.4996 | 1.1990 | -0.0471 |
| Zhejiang | -0.0475 | -0.1732 | 0.4687 | 0.0202 | -0.0903 | -0.0716 | 0.4453 | 0.1928 |
| Anhui | -0.0430 | -0.1950 | 0.3000 | 0.1150 | -0.0357 | -0.1695 | 0.4000 | 0.1088 |
| Fujian | -0.1322 | -0.1980 | 0.4199 | 0.0293 | -0.1667 | -0.1906 | 0.5390 | 0.0237 |
| Jiangxi | -0.0210 | -0.3660 | 0.5600 | 0.0722 | -0.0525 | -0.3210 | 0.5105 | 0.1198 |
| Shandong | -0.0180 | -0.2710 | 0.3480 | 0.0740 | -0.0568 | -0.3500 | 0.5499 | -0.0701 |
| Henan | -0.0120 | -0.2690 | 0.2260 | 0.1300 | -0.0529 | -0.2780 | 0.3367 | -0.0050 |
| Hubei | -0.0220 | -0.3585 | 0.3360 | 0.1706 | -0.0620 | -0.3201 | 0.3582 | 0.1246 |
| Hunan | -0.0368 | -0.2940 | 0.3840 | 0.1252 | -0.0437 | -0.3451 | 0.4177 | 0.0469 |
| Guangdong | -0.0509 | -0.3411 | 0.3250 | 0.1744 | -0.0497 | -0.3991 | 0.4099 | 0.0352 |
| Guangxi | 0.0020 | -0.3040 | 0.1430 | 0.1640 | 0.0031 | -0.3098 | 0.1679 | 0.0449 |
| Hainan | -0.0430 | -0.5741 | 0.5262 | 0.2494 | -0.0169 | -0.5973 | 0.6635 | 0.1425 |
| Chongqing | -0.0205 | -0.2104 | 0.1750 | 0.0895 | -0.0274 | -0.2250 | 0.2392 | 0.0622 |
| Sichuan | -0.0270 | -0.3259 | 0.3500 | 0.0980 | -0.0630 | -0.3199 | 0.3580 | 0.0890 |
| Guizhou | -0.0298 | -0.2440 | 0.1646 | 0.1220 | -0.0113 | -0.2317 | 0.2614 | 0.0377 |
| Yunnan | 0.0087 | -0.2334 | 0.3321 | 0.0639 | 0.0057 | -0.2611 | 0.2157 | 0.1103 |
| Tibet | -0.0828 | -0.1970 | 0.6100 | 0.2373 | -0.1519 | -0.2687 | 0.0306 | 0.3564 |
| Shaanxi | -0.0180 | -0.0517 | 0.0680 | 0.0418 | 0.0304 | -0.1157 | 0.0935 | 0.0391 |
| Gansu | -0.0111 | -0.1190 | 0.2950 | 0.1014 | -0.0112 | -0.1570 | 0.2668 | -0.0409 |
| Qinghai | -0.0544 | -0.5568 | 1.0799 | 0.0712 | -0.0889 | -0.5244 | 1.4103 | -0.0319 |
| Ningxia | -0.0900 | -0.0052 | 0.2269 | -0.0502 | -0.1383 | 0.0864 | 0.3182 | -0.2586 |
| Xinjiang | -0.0201 | -0.0862 | 0.2245 | 0.1607 | 0.0633 | -0.0174 | 0.3182 | -0.0785 |
Table 3.
Factor detection results of resistance and recoverability of hog industry.
| Indicator | Hog | Breeding sow | ||||||
|---|---|---|---|---|---|---|---|---|
| Resistance (2018) |
Resistance (2019) |
Recoverability (2020) |
Recoverability (2021) |
Resistance (2018) |
Resistance (2019) |
Recoverability (2020) |
Recoverability (2021) |
|
| Economic level | 0.5852 | 0.3471 | 0.4294 | 0.2781 | 0.5573 | 0.2012 | 0.3097 | 0.1031 |
| Industrial structure | 0.0782 | 0.1208 | 0.5410 | 0.1327 | 0.0943 | 0.2493 | 0.2992 | 0.1079 |
| Market share | 0.1868 | 0.2456 | 0.3615 | 0.0926 | 0.2631 | 0.2992 | 0.2543 | 0.0368 |
| Per capita consumption | 0.1035 | 0.6027 | 0.3218 | 0.3112 | 0.1236 | 0.5388 | 0.2130 | 0.3815 |
| Slaughter rate | 0.9143 | 0.6145 | 0.4723 | 0.5590 | 0.8773 | 0.4428 | 0.2553 | 0.5927 |
| Carcass weight | 0.3682 | 0.1022 | 0.1749 | 0.0736 | 0.4597 | 0.0478 | 0.1861 | 0.1916 |
| Scale level | 0.2903 | 0.3694 | 0.2574 | 0.8110 | 0.3269 | 0.3312 | 0.1879 | 0.7669 |
| Labor productivity | 0.0779 | 0.3073 | 0.2860 | 0.2265 | 0.1430 | 0.3596 | 0.3829 | 0.3338 |
| Comparative benefit | 0.0846 | 0.2528 | 0.2501 | 0.2672 | 0.0875 | 0.3108 | 0.1600 | 0.1848 |
| Resource carrying | 0.2238 | 0.2758 | 0.4051 | 0.3662 | 0.2078 | 0.3069 | 0.4692 | 0.2624 |
| Technical service | 0.2637 | 0.3083 | 0.3524 | 0.1621 | 0.2372 | 0.3832 | 0.2419 | 0.1375 |
| Cases | 0.2127 | 0.3360 | 0.2037 | 0.1052 | 0.2026 | 0.2583 | 0.1249 | 0.0577 |
| Mortality rate | 0.3820 | 0.2555 | 0.1931 | 0.1204 | 0.3770 | 0.2042 | 0.1102 | 0.0205 |
| Culling rate | 0.2919 | 0.2570 | 0.4323 | 0.0847 | 0.3442 | 0.2326 | 0.3120 | 0.0363 |
Table 4.
Interaction detection results of resistance based on hog inventory, 2018.
| Indicator | Economic level |
Industrial structure |
Market share |
Per capita consumption |
Slaughter rate |
Carcass weight |
Scale level |
Labor productivity |
Comparative benefit |
Resource carrying |
Technical service |
Cases | Mortality rate |
Culling rate |
|---|---|---|---|---|---|---|---|---|---|---|---|---|---|---|
| Economic level |
0.5852 | |||||||||||||
| Industrial structure |
0.9802 | 0.0782 | ||||||||||||
| Market share |
0.7055 | 0.3442 | 0.1868 | |||||||||||
| Per capita consumption |
0.9991 | 0.3501 | 0.2824 | 0.1035 | ||||||||||
| Slaughter rate |
0.9802 | 0.9832 | 0.9924 | 0.9755 | 0.9143 | |||||||||
| Carcass weight |
0.9800 | 0.9801 | 0.9271 | 0.9466 | 0.9736 | 0.3682 | ||||||||
| Scale level | 0.9816 | 0.3462 | 0.3475 | 0.3444 | 0.9824 | 0.9899 | 0.2903 | |||||||
| Labor productivity |
0.9858 | 0.2378 | 0.2996 | 0.3474 | 0.9926 | 0.5296 | 0.3377 | 0.0779 | ||||||
| Comparative benefit |
0.9852 | 0.3486 | 0.2950 | 0.3497 | 0.9684 | 0.9907 | 0.3430 | 0.2181 | 0.0846 | |||||
| Resourcecarrying | 0.9681 | 0.4041 | 0.9960 | 0.9459 | 0.9746 | 0.6889 | 0.9840 | 0.9918 | 0.5643 | 0.2238 | ||||
| Technical service |
0.9948 | 0.9871 | 0.4900 | 0.5432 | 0.9709 | 0.9659 | 0.9898 | 0.6305 | 0.6205 | 0.9616 | 0.2637 | |||
| Cases | 0.9289 | 0.9800 | 0.9964 | 0.9992 | 0.9929 | 0.5427 | 0.9980 | 0.5284 | 0.9803 | 0.9971 | 0.5424 | 0.2127 | ||
| Mortality rate | 0.9993 | 0.9742 | 0.6186 | 0.5666 | 0.9760 | 0.9809 | 0.9920 | 0.9821 | 0.9836 | 0.9806 | 0.9720 | 0.9781 | 0.3820 | |
| Culling rate | 0.9968 | 0.9957 | 0.9987 | 0.5722 | 0.9819 | 0.7074 | 0.9983 | 0.9998 | 0.4731 | 0.7071 | 0.9682 | 0.9700 | 0.9979 | 0.2919 |
Note: Underlined is the two-factor enhancement, the rest is the nonlinear enhancement.
Table 5.
Interaction detection results of resistance based on hog inventory, 2019.
| Indicator | Economic level |
Industrial structure |
Market share |
Per capita consumption |
Slaughter rate |
Carcass weight |
Scale level |
Labor productivity |
Comparative benefit |
Resource carrying |
Technical service |
Cases | Mortality rate |
Culling rate |
|---|---|---|---|---|---|---|---|---|---|---|---|---|---|---|
| Economic level |
0.3471 | |||||||||||||
| Industrial structure |
0.8503 | 0.1208 | ||||||||||||
| Market share |
0.8542 | 0.6745 | 0.2456 | |||||||||||
| Per capita consumption |
0.9610 | 0.9765 | 0.9552 | 0.6027 | ||||||||||
| Slaughter rate |
0.9366 | 0.9687 | 0.9612 | 0.8183 | 0.6145 | |||||||||
| Carcass weight |
0.8073 | 0.8968 | 0.9917 | 0.9019 | 0.9482 | 0.1022 | ||||||||
| Scale level | 0.7635 | 0.8041 | 0.9995 | 0.9535 | 0.9922 | 0.8350 | 0.3694 | |||||||
| Labor productivity |
0.8163 | 0.7001 | 0.8338 | 0.9724 | 0.9487 | 0.9512 | 0.7941 | 0.3073 | ||||||
| Comparative benefit |
0.9491 | 0.9017 | 0.9009 | 0.9465 | 0.9846 | 0.8537 | 0.7758 | 0.8685 | 0.2528 | |||||
| Resource carrying |
0.9804 | 0.8120 | 0.8075 | 0.7923 | 0.8318 | 0.8958 | 0.9946 | 0.9205 | 0.8821 | 0.2758 | ||||
| Technical service |
0.8629 | 0.6026 | 0.8374 | 0.9613 | 0.9448 | 0.8211 | 0.7291 | 0.7987 | 0.8462 | 0.9736 | 0.3083 | |||
| Cases | 0.9198 | 0.9655 | 0.8692 | 0.9373 | 0.9236 | 0.5746 | 0.9506 | 0.8072 | 0.8640 | 0.8538 | 0.9692 | 0.3360 | ||
| Mortality rate | 0.7950 | 0.6482 | 0.9939 | 0.8608 | 0.8972 | 0.8553 | 0.8228 | 0.6949 | 0.8294 | 0.8886 | 0.9483 | 0.6319 | 0.2555 | |
| Culling rate | 0.7848 | 0.7632 | 0.9478 | 0.9355 | 0.8238 | 0.7633 | 0.8214 | 0.7298 | 0.7716 | 0.9423 | 0.9725 | 0.6897 | 0.5375 | 0.2570 |
Table 6.
Interaction detection results of recoverability based on hog inventory, 2020.
| Indicator | Economic level |
Industrial structure |
Market share |
Per capita consumption |
Slaughter rate |
Carcass weight |
Scale level |
Labor productivity |
Comparative benefit |
Resource carrying |
Technical service |
Cases | Mortality rate |
Culling rate |
|---|---|---|---|---|---|---|---|---|---|---|---|---|---|---|
| Economic level |
0.4294 | |||||||||||||
| Industrial structure |
0.8442 | 0.5410 | ||||||||||||
| Market share |
0.8553 | 0.8768 | 0.3615 | |||||||||||
| Per capita consumption |
0.9839 | 0.9871 | 0.9924 | 0.3218 | ||||||||||
| Slaughter rate |
0.9601 | 0.8817 | 0.6651 | 0.9981 | 0.4723 | |||||||||
| Carcass weight |
0.9132 | 0.9824 | 0.7597 | 0.5763 | 0.9690 | 0.1749 | ||||||||
| Scale level | 0.9151 | 0.9465 | 0.9484 | 0.9598 | 0.9540 | 0.8814 | 0.2574 | |||||||
| Labor productivity |
0.8982 | 0.9994 | 0.9998 | 0.8329 | 0.9955 | 0.6587 | 0.8083 | 0.2860 | ||||||
| Comparative benefit |
0.9755 | 0.8917 | 0.8983 | 0.6917 | 0.8345 | 0.8664 | 0.6607 | 0.9762 | 0.2501 | |||||
| Resource carrying |
0.9558 | 0.8272 | 0.9828 | 0.8476 | 0.9895 | 0.8444 | 0.9738 | 0.7536 | 0.9092 | 0.4051 | ||||
| Technical service |
0.9464 | 0.8713 | 0.6552 | 0.8677 | 0.6803 | 0.6976 | 0.7886 | 0.9946 | 0.7875 | 0.9670 | 0.3524 | |||
| Cases | 0.7452 | 0.7725 | 0.7384 | 0.6957 | 0.8885 | 0.5009 | 0.9262 | 0.8400 | 0.7873 | 0.9833 | 0.5157 | 0.2037 | ||
| Mortality rate | 0.9999 | 0.8796 | 0.7669 | 0.9824 | 0.8413 | 0.8160 | 0.5150 | 0.7551 | 0.8474 | 0.9993 | 0.7286 | 0.7830 | 0.1931 | |
| Culling rate | 0.8504 | 0.8823 | 0.8504 | 0.6835 | 0.8911 | 0.6396 | 0.6592 | 0.6717 | 0.8272 | 0.9773 | 0.8905 | 0.6857 | 0.6993 | 0.4323 |
Table 7.
Interaction detection results of recoverability based on hog inventory, 2021.
| Indicator | Economic level |
Industrial structure |
Market share |
Per capita consumption |
Slaughter rate |
Carcass weight |
Scale level |
Labor productivity |
Comparative benefit |
Resource carrying |
Technical service |
Cases | Mortality rate |
Culling rate |
|---|---|---|---|---|---|---|---|---|---|---|---|---|---|---|
| Economic level |
0.2781 | |||||||||||||
| Industrial structure |
0.9189 | 0.1327 | ||||||||||||
| Market share |
0.4921 | 0.3213 | 0.0926 | |||||||||||
| Per capita consumption |
0.8924 | 0.9019 | 0.9285 | 0.3112 | ||||||||||
| Slaughter rate |
0.9764 | 0.9345 | 0.6849 | 0.9480 | 0.5590 | |||||||||
| Carcass weight |
0.9938 | 0.9085 | 0.9351 | 0.5960 | 0.9777 | 0.0736 | ||||||||
| Scale level | 0.8972 | 0.9245 | 0.9647 | 0.9477 | 0.9033 | 0.9919 | 0.8110 | |||||||
| Labor productivity |
0.9624 | 0.9949 | 0.7545 | 0.9849 | 0.7154 | 0.5853 | 0.9265 | 0.2265 | ||||||
| Comparative benefit |
0.9302 | 0.9443 | 0.8962 | 0.9772 | 0.9440 | 0.8873 | 0.9795 | 0.9924 | 0.2672 | |||||
| Resource carrying |
0.9947 | 0.8981 | 0.9552 | 0.8841 | 0.9846 | 0.8789 | 0.9588 | 0.9680 | 0.6356 | 0.3662 | ||||
| Technical service |
0.9680 | 0.3570 | 0.3945 | 0.9555 | 0.9560 | 0.9893 | 0.9440 | 0.9930 | 1.0000 | 0.9865 | 0.1621 | |||
| Cases | 0.4991 | 0.4157 | 0.3126 | 0.9599 | 0.6538 | 0.4626 | 0.9427 | 0.4628 | 0.9207 | 0.9340 | 0.4452 | 0.1052 | ||
| Mortality rate | 0.4724 | 0.4545 | 0.3005 | 0.9671 | 0.9673 | 0.5552 | 0.9280 | 0.5847 | 0.9946 | 0.9946 | 0.4696 | 0.2372 | 0.1204 | |
| Culling rate | 0.4874 | 0.4133 | 0.3180 | 0.5978 | 0.7545 | 0.3046 | 0.9793 | 0.5333 | 0.9097 | 0.9325 | 0.4360 | 0.2323 | 0.2814 | 0.0847 |
Table 8.
Interaction detection results of resistance based on breeding sow inventory, 2018.
| Indicator | Economic level |
Industrial structure |
Market share |
Per capita consumption |
Slaughter rate |
Carcass weight |
Scale level |
Labor productivity |
Comparative benefit |
Resource carrying |
Technical service |
Cases | Mortality rate |
Culling rate |
|---|---|---|---|---|---|---|---|---|---|---|---|---|---|---|
| Economic level |
0.5573 | |||||||||||||
| Industrial structure |
0.9366 | 0.0943 | ||||||||||||
| Market share |
0.7490 | 0.4376 | 0.2631 | |||||||||||
| Per capita consumption |
0.9997 | 0.4432 | 0.3925 | 0.1236 | ||||||||||
| Slaughter rate |
0.9307 | 0.9453 | 0.9968 | 0.9891 | 0.8773 | |||||||||
| Carcass weight |
0.9553 | 0.9759 | 0.9240 | 0.9744 | 0.9658 | 0.4597 | ||||||||
| Scale level | 0.9369 | 0.4421 | 0.4383 | 0.4235 | 0.9819 | 0.9872 | 0.3269 | |||||||
| Labor productivity |
0.9682 | 0.3445 | 0.4154 | 0.4235 | 0.9882 | 0.6452 | 0.3965 | 0.1430 | ||||||
| Comparative benefit |
0.9665 | 0.4445 | 0.4095 | 0.4452 | 0.9886 | 0.9846 | 0.4136 | 0.3192 | 0.0875 | |||||
| Resource carrying |
0.9563 | 0.4421 | 0.9964 | 0.9019 | 0.9693 | 0.7420 | 0.9690 | 0.9734 | 0.5789 | 0.2078 | ||||
| Technical service |
0.9825 | 0.9300 | 0.6013 | 0.6207 | 0.9792 | 0.9756 | 0.9911 | 0.7334 | 0.7175 | 0.9440 | 0.2372 | |||
| Cases | 0.9234 | 0.9713 | 0.9943 | 0.9737 | 0.9917 | 0.6553 | 0.9900 | 0.6608 | 0.9566 | 0.9663 | 0.4300 | 0.2026 | ||
| Mortality rate | 0.9945 | 0.9667 | 0.7011 | 0.5603 | 0.9783 | 0.9825 | 0.9763 | 0.9684 | 0.9694 | 0.9691 | 0.9568 | 0.9628 | 0.3770 | |
| Culling rate | 0.9576 | 0.9888 | 0.9828 | 0.6567 | 0.9950 | 0.7497 | 0.9921 | 0.9994 | 0.5040 | 0.7607 | 0.9805 | 0.9397 | 0.9903 | 0.3442 |
Table 9.
Interaction detection results of resistance based on breeding sow inventory, 2019.
| Indicator | Economic level |
Industrial structure |
Market share |
Per capita consumption |
Slaughter rate |
Carcass weight |
Scale level |
Labor productivity |
Comparative benefit |
Resource carrying |
Technical service |
Cases | Mortality rate |
Culling rate |
|---|---|---|---|---|---|---|---|---|---|---|---|---|---|---|
| Economic level |
0.2012 | |||||||||||||
| Industrial structure |
0.8782 | 0.2493 | ||||||||||||
| Market share |
0.8121 | 0.6779 | 0.2992 | |||||||||||
| Per capita consumption |
0.9210 | 0.9950 | 0.9746 | 0.5388 | ||||||||||
| Slaughter rate |
0.9070 | 0.9606 | 0.9424 | 0.7702 | 0.4428 | |||||||||
| Carcass weight |
0.7520 | 0.8966 | 0.9841 | 0.8824 | 0.9152 | 0.0478 | ||||||||
| Scale level | 0.6932 | 0.8015 | 0.9999 | 0.8927 | 0.9648 | 0.9014 | 0.3312 | |||||||
| Labor productivity |
0.7937 | 0.7634 | 0.8419 | 0.9784 | 0.9196 | 0.9417 | 0.8351 | 0.3596 | ||||||
| Comparative benefit |
0.9307 | 0.8702 | 0.8794 | 0.9329 | 0.9604 | 0.8848 | 0.7667 | 0.8814 | 0.3108 | |||||
| Resource carrying |
0.9804 | 0.7734 | 0.7805 | 0.7829 | 0.8190 | 0.9096 | 0.9889 | 0.9488 | 0.8894 | 0.3069 | ||||
| Technical service |
0.8852 | 0.6883 | 0.8675 | 0.9842 | 0.9049 | 0.8445 | 0.8155 | 0.8403 | 0.8884 | 0.9356 | 0.3832 | |||
| Cases | 0.8610 | 0.9450 | 0.9207 | 0.9205 | 0.9409 | 0.4364 | 0.8560 | 0.7935 | 0.8351 | 0.8929 | 0.9897 | 0.2583 | ||
| Mortality rate | 0.7492 | 0.6003 | 0.9969 | 0.8896 | 0.8818 | 0.7904 | 0.7033 | 0.6977 | 0.7521 | 0.9226 | 0.9467 | 0.5767 | 0.2042 | |
| Culling rate | 0.7258 | 0.7061 | 0.9453 | 0.8718 | 0.7927 | 0.6944 | 0.6648 | 0.7283 | 0.8326 | 0.9471 | 0.9662 | 0.6909 | 0.4879 | 0.2326 |
Table 10.
Interaction detection results of recoverability based on breeding sow inventory, 2020.
| Indicator | Economic level |
Industrial structure |
Market share |
Per capita consumption |
Slaughter rate |
Carcass weight |
Scale level |
Labor productivity |
Comparative benefit |
Resource carrying |
Technical service |
Cases | Mortality rate |
Culling rate |
|---|---|---|---|---|---|---|---|---|---|---|---|---|---|---|
| Economic level |
0.3097 | |||||||||||||
| Industrial structure |
0.5905 | 0.2992 | ||||||||||||
| Market share |
0.6519 | 0.6376 | 0.2543 | |||||||||||
| Per capita consumption |
0.9835 | 0.9738 | 0.9093 | 0.2130 | ||||||||||
| Slaughter rate |
0.6811 | 0.6170 | 0.4633 | 0.9946 | 0.2553 | |||||||||
| Carcass weight |
0.7490 | 0.9793 | 0.8482 | 0.5788 | 0.9652 | 0.1861 | ||||||||
| Scale level | 0.6343 | 0.6752 | 0.6755 | 0.9464 | 0.6623 | 0.7147 | 0.1879 | |||||||
| Labor productivity |
0.7989 | 0.9917 | 0.9997 | 0.8701 | 0.9975 | 0.8215 | 0.8806 | 0.3829 | ||||||
| Comparative benefit |
0.9657 | 0.7928 | 0.7982 | 0.6193 | 0.7123 | 0.9051 | 0.6397 | 0.9543 | 0.1600 | |||||
| Resource carrying |
0.9699 | 0.8585 | 0.9895 | 0.8756 | 0.9826 | 0.9009 | 0.9780 | 0.8442 | 0.7861 | 0.4692 | ||||
| Technical service |
0.6768 | 0.6131 | 0.4479 | 0.7485 | 0.4772 | 0.7729 | 0.5828 | 0.9993 | 0.6017 | 0.9379 | 0.2419 | |||
| Cases | 0.5183 | 0.5550 | 0.5508 | 0.6273 | 0.6326 | 0.6432 | 0.6379 | 0.8849 | 0.5915 | 0.9840 | 0.3900 | 0.1249 | ||
| Mortality rate | 0.9986 | 0.7365 | 0.5808 | 0.9675 | 0.7035 | 0.9207 | 0.5556 | 0.8834 | 0.7311 | 1.0000 | 0.6963 | 0.5919 | 0.1102 | |
| Culling rate | 0.5978 | 0.6318 | 0.5764 | 0.6267 | 0.6216 | 0.5496 | 0.4501 | 0.7089 | 0.7626 | 0.9583 | 0.6255 | 0.4915 | 0.7165 | 0.3120 |
Table 11.
Interaction detection results of recoverability based on breeding sow inventory, 2021.
| Indicator | Economic level |
Industrial structure |
Market share |
Per capita consumption |
Slaughter rate |
Carcass weight |
Scale level |
Labor productivity |
Comparative benefit |
Resource carrying |
Technical service |
Cases | Mortality rate |
Culling rate |
|---|---|---|---|---|---|---|---|---|---|---|---|---|---|---|
| Economic level |
0.1031 | |||||||||||||
| Industrial structure |
0.9572 | 0.1079 | ||||||||||||
| Market share |
0.3173 | 0.4077 | 0.0368 | |||||||||||
| Per capita consumption |
0.9015 | 0.8801 | 0.9889 | 0.3815 | ||||||||||
| Slaughter rate |
0.9492 | 0.8861 | 0.8414 | 0.8835 | 0.5927 | |||||||||
| Carcass weight |
0.9690 | 0.9867 | 0.8270 | 0.6734 | 0.9748 | 0.1916 | ||||||||
| Scale level | 0.8572 | 0.9575 | 0.9208 | 0.9401 | 0.9560 | 0.9813 | 0.7669 | |||||||
| Labor productivity |
0.9699 | 0.9988 | 0.8819 | 0.9508 | 0.8705 | 0.6763 | 0.9299 | 0.3338 | ||||||
| Comparative benefit |
0.9052 | 0.9664 | 0.7257 | 0.9515 | 0.8528 | 0.7852 | 0.9708 | 0.9900 | 0.1848 | |||||
| Resource carrying |
0.9982 | 0.9781 | 0.9976 | 0.9179 | 0.8335 | 0.8329 | 0.9557 | 0.8954 | 0.5841 | 0.2624 | ||||
| Technical service |
0.9220 | 0.3384 | 0.3863 | 0.9764 | 0.9827 | 0.9141 | 0.8859 | 0.9813 | 1.0000 | 0.9741 | 0.1375 | |||
| Cases | 0.3648 | 0.4755 | 0.1946 | 0.9900 | 0.7962 | 0.4750 | 0.9667 | 0.6419 | 0.7386 | 0.9817 | 0.4786 | 0.0577 | ||
| Mortality rate | 0.3659 | 0.3978 | 0.2452 | 0.9829 | 0.9339 | 0.6415 | 0.9901 | 0.6783 | 0.9940 | 0.9962 | 0.4073 | 0.1913 | 0.0205 | |
| Culling rate | 0.3624 | 0.4291 | 0.1918 | 0.7476 | 0.8490 | 0.3919 | 0.9542 | 0.6034 | 0.7175 | 0.9017 | 0.4626 | 0.1602 | 0.2400 | 0.0363 |
Disclaimer/Publisher’s Note: The statements, opinions and data contained in all publications are solely those of the individual author(s) and contributor(s) and not of MDPI and/or the editor(s). MDPI and/or the editor(s) disclaim responsibility for any injury to people or property resulting from any ideas, methods, instructions or products referred to in the content. |
© 2023 by the authors. Licensee MDPI, Basel, Switzerland. This article is an open access article distributed under the terms and conditions of the Creative Commons Attribution (CC BY) license (http://creativecommons.org/licenses/by/4.0/).
Copyright: This open access article is published under a Creative Commons CC BY 4.0 license, which permit the free download, distribution, and reuse, provided that the author and preprint are cited in any reuse.


