
Submitted:
09 May 2023
Posted:
10 May 2023
You are already at the latest version
Abstract
Accelerating the construction of livestock powerhouses is of great significance to better enhance the ability to guarantee the supply of livestock products and improve the quality, efficiency and competitiveness of the livestock industry. This study constructed an evaluation index system to assess the level of China’s livestock powerhouse and then performed an in-depth analysis of the issues and challenges facing the construction of livestock powerhouses. The research results showed that the level of China’s livestock powerhouse ranked 5th in the world, and the livestock industry was transitioning from being a large livestock country to a powerhouse, while there was still a large gap in terms of reaching the goal of constructing livestock powerhouses. There were significant differences in the level of livestock powerhouses across different livestock industries; the layer industry was the world leader in China, whereas the pig, sheep and goat, and broiler industries were stronger, while the beef cattle and dairy industries were weaker. There are still many challenges to accelerating the construction of livestock powerhouses in terms of supply security, scientific and technological support, operation systems, industry and supply chain resilience, international trade, policy support, etc. It is recommended to improve the institutional mechanism for the construction of livestock powerhouses, promote a high level of self-reliance and self-improvement in livestock science and technology, build a modern livestock operation system, enhance the resilience and security level of the industrial and supply chain, and consolidate and expand international trade and cooperation.
Keywords:
livestock industry
; livestock products
; livestock powerhouse
; issues and challenges
; policy recommendations
1. Introduction
The livestock industry is the pillar industry of China’s agricultural and rural economy, and livestock products are an important and indispensable foodstuff for the population. Since the reform and opening up, China’s livestock industry has achieved remarkable results in the development of livestock products and the effective supply of such products to meet the population needs of meat, eggs and milk and other livestock products. However, the reality of the livestock industry as the main short board of agricultural and rural development has remained fundamentally unchanged for a long time. There are still, particularly in recent years, tight resource constraints, increased pressure on environmental protection, high external dependence on key factors, international market that is somewhat weak in competition in addition to other outstanding issues; moreover, in the international livestock industry and livestock products market, there is the game of large countries, trade friction, geopolitical risks, major natural disasters, animal and plant epidemics, public health emergencies and other instability and uncertainty factors. Smooth and orderly development brings serious challenges, and the resilience and security level of the livestock industry chain and supply chain need to be quickly improved. Based on the current development stage in the context of an agricultural powerhouse construction, it is necessary to coordinate and grasp the shortcomings and milestones of the livestock industry high-quality development, to accelerate the construction of a livestock powerhouse as the main objective, to achieve an all-round consolidation of the livestock industry chain and supply chain in terms of resilience and security, to provide a firm material basis for Chinese-style modernization and to build a strong socialist modern state. Therefore, it is of great practical significance to systematically grasp the level of the construction of China’s livestock powerhouse, determine the issues and challenges faced by the construction such powerhouse, and study and propose policy recommendations to accelerate the construction this powerhouse.
At present, domestic and foreign studies on the construction of a livestock powerhouse do not exist in the current literature, and the established studies were more focused on exploring the competitiveness of China’s livestock industry and the high-quality development of this industry, partially reflecting the realistic basis and strategic path for the construction of a livestock powerhouse in China. In terms of livestock industry competitiveness, research methods have mainly analyzed the international competitive situation from the perspectives of cost‒benefit, import and export trade, and production efficiency [1,2,3]; moreover, such studies measured international competitiveness using indicators such as international market share, trade competitiveness index, and revealed a comparative advantage index [4,5,6,7,8,9]; they also assessed international competitiveness by constructing an evaluation index system including multiple factors such as resource endowment, production, consumption, quality, trade, and the environment [10,11,12,13,14], and explored the competitiveness of the industry and its influencing factors with the help of a diamond model and a deviation-share analysis spatial model [15,16,17]. In terms of research findings, the literature generally concluded that China’s livestock industry was generally not competitive. In terms of the influencing factors, studies concluded that the main factors affecting the improvement of China’s livestock industry competitiveness include market price, production cost, technology level, resource conditions, processing capacity, quality and safety, trade barriers, and policy support and suggested that multiple measures should be taken to sustain efforts to fast-track the improvement of the international competitiveness of the livestock industry [18,19,20]. In terms of the high-quality development of the livestock industry, the literature has generally focused on the connotation characteristics of the high-quality development of the industry [21,22,23] and systematically explored the problematic challenges and practical paths for accelerating the high-quality development of this industry [24,25,26].
Overall, current studies have formed many insightful and important reference value results in terms of the competitiveness and the high-quality development of China’s livestock industry, playing an active role in directly or indirectly supporting the research or decision making of the construction of a powerhouse industry, but there is still room for further exploration, development and breakthroughs. On the one hand, current studies are generally based on traditional indicators such as international market share, trade competitiveness index and revealed comparative advantage index, exploring the competitiveness of China’s livestock industry from the trade perspective and further reflecting the construction of a powerhouse industry from a trade competitiveness perspective. On the other hand, when constructing the evaluation index system to explore the competitiveness of the livestock industry, more consideration was given to indicators such as cost and benefit, production efficiency and international trade, neglecting the comprehensive consideration of supply security ability, resulting in the assessment results not reflecting the reality of China’s livestock industry competitiveness and the construction status of a powerhouse industry.
Considering that the current studies focused more on the competitiveness and high-quality development of China’s livestock industry, this study systematically discussed the level of livestock powerhouse, international comparison, issues, challenges and strategic choices based on the perspective of the construction of agricultural powerhouses. The 2023 Central Government No. 1 document clearly put forward that agricultural powerhouses should include “five strong” elements, such as supply security, scientific and technological equipment, operation systems, industrial resilience and competitive ability. In constructing the index system to evaluate the level of a livestock powerhouse, it is necessary to base it on China’s agricultural state, reflect Chinese characteristics, and highlight important aspects such as supply security, scientific and technological equipment, etc. Therefore, this study established an evaluation index system based on the construction of agricultural powerhouses, evaluated the level of China’s livestock powerhouse, compared it with major countries in the world, deeply explored the challenges and shortcomings faced by the construction of livestock powerhouses, and finally put forward strategic paths and policy recommendations to be referenced in production and policy decisions.
2. Methods and Materials
2.1. Methods
The 20th report of the Communist Party of China proposed accelerating the construction of an agricultural powerhouse; the 2023 Central Government No. 1 document further made the following clarification: “to build an agricultural powerhouse with strong supply security, strong scientific and technological equipment, strong operation system, strong industrial resilience and strong competitiveness, based on the national agricultural conditions and reflecting Chinese characteristics”. The construction of a livestock powerhouse is needed to achieve strong supply security, strong scientific and technological equipment, a strong operation system, strong industrial resilience and strong competitiveness and should be combined with the development efforts of China’s livestock industry to accelerate the promotion of a strong feed and forage supply, strong green cycle development and strong animal disease prevention and control. In constructing the evaluation index system to explore the level of the construction of a livestock powerhouse, this study considered the spirit of the 20th report of the Communist Party of China and the 2023 Central Government No. 1 document and made comprehensive considerations in terms of supply security, scientific and technological equipment, operation system, industrial resilience, and competitiveness in the context of the construction of an agricultural powerhouse based on the national agricultural conditions and reflecting Chinese characteristics.
2.1.1. Supply security
Ensuring a stable and safe supply of grains and other important agricultural products is always the top priority in terms of accelerating the construction of an agricultural powerhouses in China. Resilient supply security is the fundamental symbol of the construction of a livestock powerhouse. To enhance the supply of livestock products and ensure the supply capabilities, the most critical and most basic factor is reflected in the total amount supplied, and this directly reflects the “strategic depth” of livestock powerhouse construction and its international competitiveness. At the same time, we must fully consider the per capita occupancy and self-sufficiency, especially in terms of the basic national conditions of a large population, the per capita consumption demand fulfillment or challenges of autonomy, and the ability to provide nationally secure supplies. Ultimately, the provision of strong security is manifested in resolving the issue of access of 1.4 billion people to “meat, eggs, milk” which is a fundamental objective. Therefore, in the assessment of the construction level of a livestock powerhouse in terms of supply security, the three indicators of global share, per capita possession and self-sufficiency rate of livestock products were mainly considered, corresponding to the “strong supply security” in the construction of an agricultural powerhouse.
2.1.2. Science and technology equipment
It is important to rely on the twin wheels of science, technology and reform to accelerate the construction of agricultural powerhouses. Strong science and technology equipment is the core driving force for the construction of a livestock powerhouse. Science and technology are the first productive forces; by continuously conquering the seed industry, machinery and other key areas of the core technology and accelerating the transformation and application of scientific and technological achievements we can promote the realization of quality change, efficiency change and power change in the livestock industry, improve the industry’s total factor productivity and quality, efficiency and competitiveness, and solidify the foundation of scientific and technological support for the construction an industry powerhouse. Based on this, in the assessment of the livestock powerhouse construction level of scientific and technological equipment, the main considerations of livestock slaughter rate, slaughter carcass weight (yield) and agricultural labor productivity reflect “strong scientific and technological equipment” in terms of the construction of an agricultural powerhouse. The main reason is that the number of patents, seed and machinery, and the contribution rate of scientific and technological progress, total factor productivity and other direct indicators, in addition to meat-feed ratio and other indirect indicators that reflect the level of scientific and technological development in the field of livestock husbandry were difficult to obtain, so only the above three indirect indicators were considered. It should be noted that since the layer and dairy industries usually do not involve slaughter, only the two indicators of yield and agricultural labor productivity were considered in the evaluation.
2.1.3. Operation system
To accelerate the modernization of agriculture, it is necessary to build a modern agricultural industry system, production system and operation system. A strong operating system is the key support for the construction of a livestock powerhouse. To accelerate the construction of a livestock powerhouse, we must strengthen the cultivation of business subjects and coordinate the leading enterprises, professional cooperatives, family farms, traditional farm households and social service organizations to achieve high-quality development and better solidify the organizational foundation for building a strong economy. In light of assessing the construction of an agricultural powerhouse, it should be noted that the development situation of enterprises, cooperatives, family farms, socialized service organizations and other business subjects and their indicators such as the scale and intensification should be considered, but it was impossible to obtain large-scale data of various countries to support a comparative analysis. Therefore, this study did not consider the indicators related to the operation system when assessing the construction of a livestock powerhouse real level but discussed them systematically in part 4 of this article.
2.1.4. Industrial resilience
It is important to enhance the resilience and security level of the industry chain and supply chain. Strong industrial resilience is the basic guarantee for the construction of a livestock powerhouse. For accelerating the construction of a livestock powerhouse, we must continue to extend the industrial chain, enhance the value chain, stabilize the supply chain, strengthen the risk identification, control and transfer capabilities, and achieve an all-round solid livestock industry and supply chain resilience and security. In the industrial resilience assessment of the construction level of a livestock powerhouse, this study mainly considered three indicators, the comparative benefits, resource carrying capacity and feed grain self-sufficiency rate, reflecting the “strong industrial resilience” required in such construction. The key to the strength or weakness of an industry’s resilience is its high or low comparative benefits. We must rely on the market, policy and other multicchannels to enhance the efficiency of livestock production and better consolidate the local government, farm households in terms of focusing on agriculture, and grasping the enthusiasm of breeding. At the same time, in the context of the continued tightening of resource and environmental constraints, the resource carrying and feed grain supply should also be taken into account.
2.1.5. Competitiveness
In China, the government attaches great importance to improving agricultural quality, efficiency and competitiveness. Competitiveness is an inevitable requirement for the construction of a livestock powerhouse. To speed up the construction of a livestock powerhouse, we must consider the two markets and two resources, not only to “import” but also to “export”. Relying on the international market and resources to support the foundation of domestic livestock product supply guarantees, through multiple ways and channels such as international production capacity cooperation and global food and agriculture governance, enhances the livestock industry’s rule-making power, product pricing power and resource control power in the global arena and continues to strengthen the industry’s international competitiveness. Regarding the assessment of the level of the construction of a livestock powerhouse, considering that the competitive ability is more in the field of international trade, this study considered the international market share, the trade competitiveness index, and the revealed comparative advantage index, as these were commonly used in the literature. In other words, this study mainly reflected on the issue of “strong competitiveness” mentioned in the construction of an agricultural powerhouse through the indicators used in the field of international trade.
According to the abovementioned five aspects in terms of the construction of a livestock powerhouse, namely, security, scientific and technological equipment, operation system, industrial resilience and competitiveness, combined with the effort of developing China’s livestock industry, and based on the principle of availability of relevant data and indictors for the livestock industry in various countries, this study relied on current research theories and methods, and constructed four aspects, namely supply security, scientific and technological support, industrial resilience and international trade. The specific indicators and calculation methods are shown in Table 1.
In constructing the index system to comparatively assess the level of livestock powerhouse, considering the differences of various indexes in terms of their measurement levels, this study first standardized the indicators, then calculated the weights of the indicators at all levels through the entropy method, and finally combined the standardized index values and weights to calculate the index of livestock powerhouse. Because the indicators selected in this study are all positive indicators, their standardization formulas are as follows:
where xij is the standardized index value, aij is the original value of the index, and max{aij} and min{aij} are the maximum and minimum values of the index, respectively.
Before calculating the weights of each indicator through the entropy method, the weight of the corresponding indicator for the ith country under the jth indicator needs to be calculated as follows:
where pij is the corresponding indicator weight. Then, the entropy value of the jth indicator is calculated:
where ej is the entropy value of the corresponding indicator and it satisfies ej≥ 0; k=1/lnn. On this basis, the weights of each indicator are calculated as follows:
where wj is the corresponding indicator weight; dj is the information entropy redundancy of the jth indicator, and dj =1-ej.
2.2. Materials
The livestock species considered in this study were mainly six categories, including pig, beef cattle, sheep and goat, broiler, layer and dairy, and the basic data were all from the FAO database. Except for the two indicators of agricultural value added and agricultural land area, which adopt 2020 data, the output of livestock products, import and export volume, import and export value and other indicators were all available in the 2021 data. Subsequent to data processing, the number of countries evaluated for the livestock powerhouse level of the pig industry was 112, those evaluated for beef cattle, sheep and goats were 124 and 108, respectively, countries evaluated for broilers and layers were 109 and 108, respectively, and 132 countries were evaluated for the dairy industry, and the whole livestock industry involved 135 countries in total. The samples selected in this study cover major countries such as China, the United States, Germany, France, New Zealand, Australia, Japan, Korea, Brazil, Russia and India, and the results of the evaluation were informative.
Naturally, due to the lack of other key indicators in some of the larger countries with large production and export volumes of livestock products, such as Denmark, which lacked price data, they were not considered in this study. In addition, due to the lack of more detailed basic data on the output value of each livestock species and the output value of livestock, most countries lacked indicators on agriculture employment, so the ratio of agricultural value added to the total population was used to measure agricultural labor productivity. Considering that feed grains were mainly corn and soybeans, and corn accounted for a higher proportion in the feed structure of livestock breeding, this study used corn as a representative to calculate comparative benefits and feed grain self-sufficiency rate, i.e., comparative benefits were measured by producer price of livestock products and producer price of corn, and feed grain self-sufficiency rate mainly was corn self-sufficiency rate.
3. Results and Discussion
3.1. Results
Based on the livestock industry and its related basic data of the countries considered for evaluation, the relevant indicators of supply security, scientific and technological support, industrial resilience and international trade were calculated after standardized processing, and using the entropy value method to obtain the livestock powerhouse index of the relevant countries by species. According to the standards of 15.1 g, 20.0 g, 18.5 g, 20.3 g, 13.1 g and 3.3 g protein content per 100 g of pork, beef, mutton, poultry, egg and milk, respectively, the world subspecies livestock powerhouse index weights were calculated according to the protein equivalent of livestock products, and the overall livestock powerhouse index was obtained by considering the livestock powerhouse index of different livestock species. Figure 1 shows the index and ranking of China’s livestock powerhouse and its subspecies powerhouse, Table 2 provides the evaluation results of livestock powerhouse and its subspecies powerhouse index of the top 20 countries, and Table 3 provides the state of livestock powerhouse and its subspecies powerhouse index of major countries.
In a comprehensive view, China’s livestock powerhouse index was 0.2462, ranking 5th among the 135 countries considered, indicating that the level of China’s livestock powerhouse construction was in a relatively high position and had high relative strength and that China was moving from a large livestock country to a livestock powerhouse. Specifically, there were more obvious differences in the level of different livestock powerhouses in China, with a strong layer industry, stronger hog, sheep and goat, and broiler industries, and a weaker beef cattle industry and dairy industry. China’s powerhouse indexes for pig, sheep and goat, and broiler industries were 0.3396, 0.2002 and 0.2730, respectively, ranking 6th, 5th and 7th among 112, 108 and 109 countries, indicating that China’s pig, sheep and goat, and broiler industries had relatively high strength in the world. The powerhouse index of the beef cattle industry is 0.1174, and the powerhouse index of the dairy industry is 0.1011, ranking 34th and 42nd among 124 and 132 countries, respectively, indicating that China’s beef cattle industry and dairy industry were relatively weak. The powerhouse index of the layer industry was 0.5045, ranking 1st among 108 countries, indicating that China’s layer industry was strong and in the leading position in the world.
In terms of different countries’ livestock powerhouse levels, the top 5 countries are the United States, Brazil, New Zealand, the Netherlands and China, with livestock powerhouse indexes of 0.4521, 0.3556, 0.3439, 0.2635 and 0.2462, respectively. Although China ranks high, there was still a very large gap compared with the United States, whose livestock powerhouse level was nearly two times that of China’s corresponding level. At the same time, there was a large gap between China and Brazil and New Zealand. Of the other major countries, Australia and India ranked 9th and 10th, with livestock powerhouse indexes of 0.2075 and 0.1969, respectively. The top 20 countries included Germany, Canada and France, ranking 11th, 12th and 17th, respectively, with livestock powerhouse indexes of 0.1863, 0.1855 and 0.1608. Russia, Japan and Korea ranked relatively low, ranking 21st, 33rd and 37th, respectively, with livestock powerhouse indexes of 0.1443, 0.1022 and 0.0957.
The top 5 countries in the powerhouse level of the pig industry were Spain, the United States, the Netherlands, Germany and Canada. Spain’s pig industry was obviously stronger than that of other countries. China ranks 6th after Canada, but there was still a gap compared to Spain, the United States, the Netherlands and other countries and small gap compared to Canada and Germany. Of the other major countries, Brazil ranked 8th in the pig industry, France, Russia and South Korea ranked 14th, 15th and 18th, respectively, and India, Australia, Japan, New Zealand and other countries ranked in relatively lower positions. The top 5 countries in the powerhouse level of the beef cattle industry were the United States, Brazil, Uruguay, Australia and New Zealand, and there was still a very large gap between China’s beef cattle industry and the United States, Brazil and Australia. From other major countries, Canada, India, France, Germany, Japan, Russia and South Korea ranked relatively at low levels. The top 5 countries in the powerhouse level of the sheep and goat industry were New Zealand, Australia, Ethiopia, Uruguay and China. Although China’s sheep and goat industry ranked 5th in the world, there was a large gap compared to New Zealand and Australia. Of the other major countries, India ranked 9th in the world; France, Russia, Germany, Canada, the United States and Brazil ranked 29th, 40th, 46th, 55th, 63rd and 67th, respectively; and Japan and South Korea ranked relatively at low positions.
The top 5 countries at the powerhouse level of the broiler industry were Brazil, the United States, Poland, Hungary and Belarus. Although China ranked 7th in the world, there was still a large gap compared with Brazil and the United States. From other major countries, Australia, New Zealand, Russia, France and India were ranked in the world’s top 20, and Canada, South Korea, Japan and other countries ranked relatively at low positions. The top 5 countries in the powerhouse level of the layer industry were China, the United States, Turkey, Panama and Malaysia, with China having the strongest layer industry, followed by the United States and Turkey. Of the other major countries, Germany, Japan, and India ranked 7th, 8th and 9th in the world, respectively, and Brazil, Canada, New Zealand, Russia, South Korea, Australia and other countries ranked relatively at low positions. The top 5 countries in the powerhouse level of the dairy industry were New Zealand, the United States, India, the Netherlands and Ireland. China ranked 42nd in the world, and there was a very large gap compared with New Zealand and the United States. Of the other major countries, Germany and France ranked 7th and 9th in the world, and Australia, Canada, Russia, Brazil, Japan and South Korea ranked relatively at low positions.
3.2. Discussion
This study constructed an evaluation index system based on supply security, scientific and technological support, industrial resilience, and international trade to explore the overall situation of the livestock powerhouse in the world, and the specific ranking was the result of comprehensive consideration of four aspects. Given the state of China’s livestock powerhouse, the top ranking was mainly due to the volume of the livestock industry, with pork, beef, mutton and poultry production accounting for 44.00%, 9.63%, 31.43% and 17.25% of the world’s total production, respectively, egg production accounting for 36.83%, dairy production accounting for 4.94%, and the global share of livestock products being generally high. Naturally, different livestock species had different degrees of advantages in terms of supply security, scientific and technological support, industrial resilience, and international trade. From the layer industry, the indicators including scientific and technological support and industrial resilience did not have advantages, while the indicators including supply security and international trade had advantages. The global share and per capita possession of the layer industry ranked first and third in the world, respectively; the self-sufficiency rate of eggs to maintain more than 100% level; and the international market share and trade competitiveness index were fourth and first in the world, respectively. Taking the beef cattle industry and dairy industry, although the volume was large, the per capita possession and self-sufficiency rate were at a relatively low level, with the beef industry ranking 65th and 91st in the world and the dairy industry ranking 87th and 85th, respectively. The indicators reflecting the level of scientific and technological development, such as carcass weight and yield, were relatively weak. Due to the large net import volume, the international market share, the trade competitiveness index and the revealed comparative advantage index were relatively low.
4. Issues and challenges of China’s livestock powerhouse construction
4.1. Supply security capacity needs to be strengthened
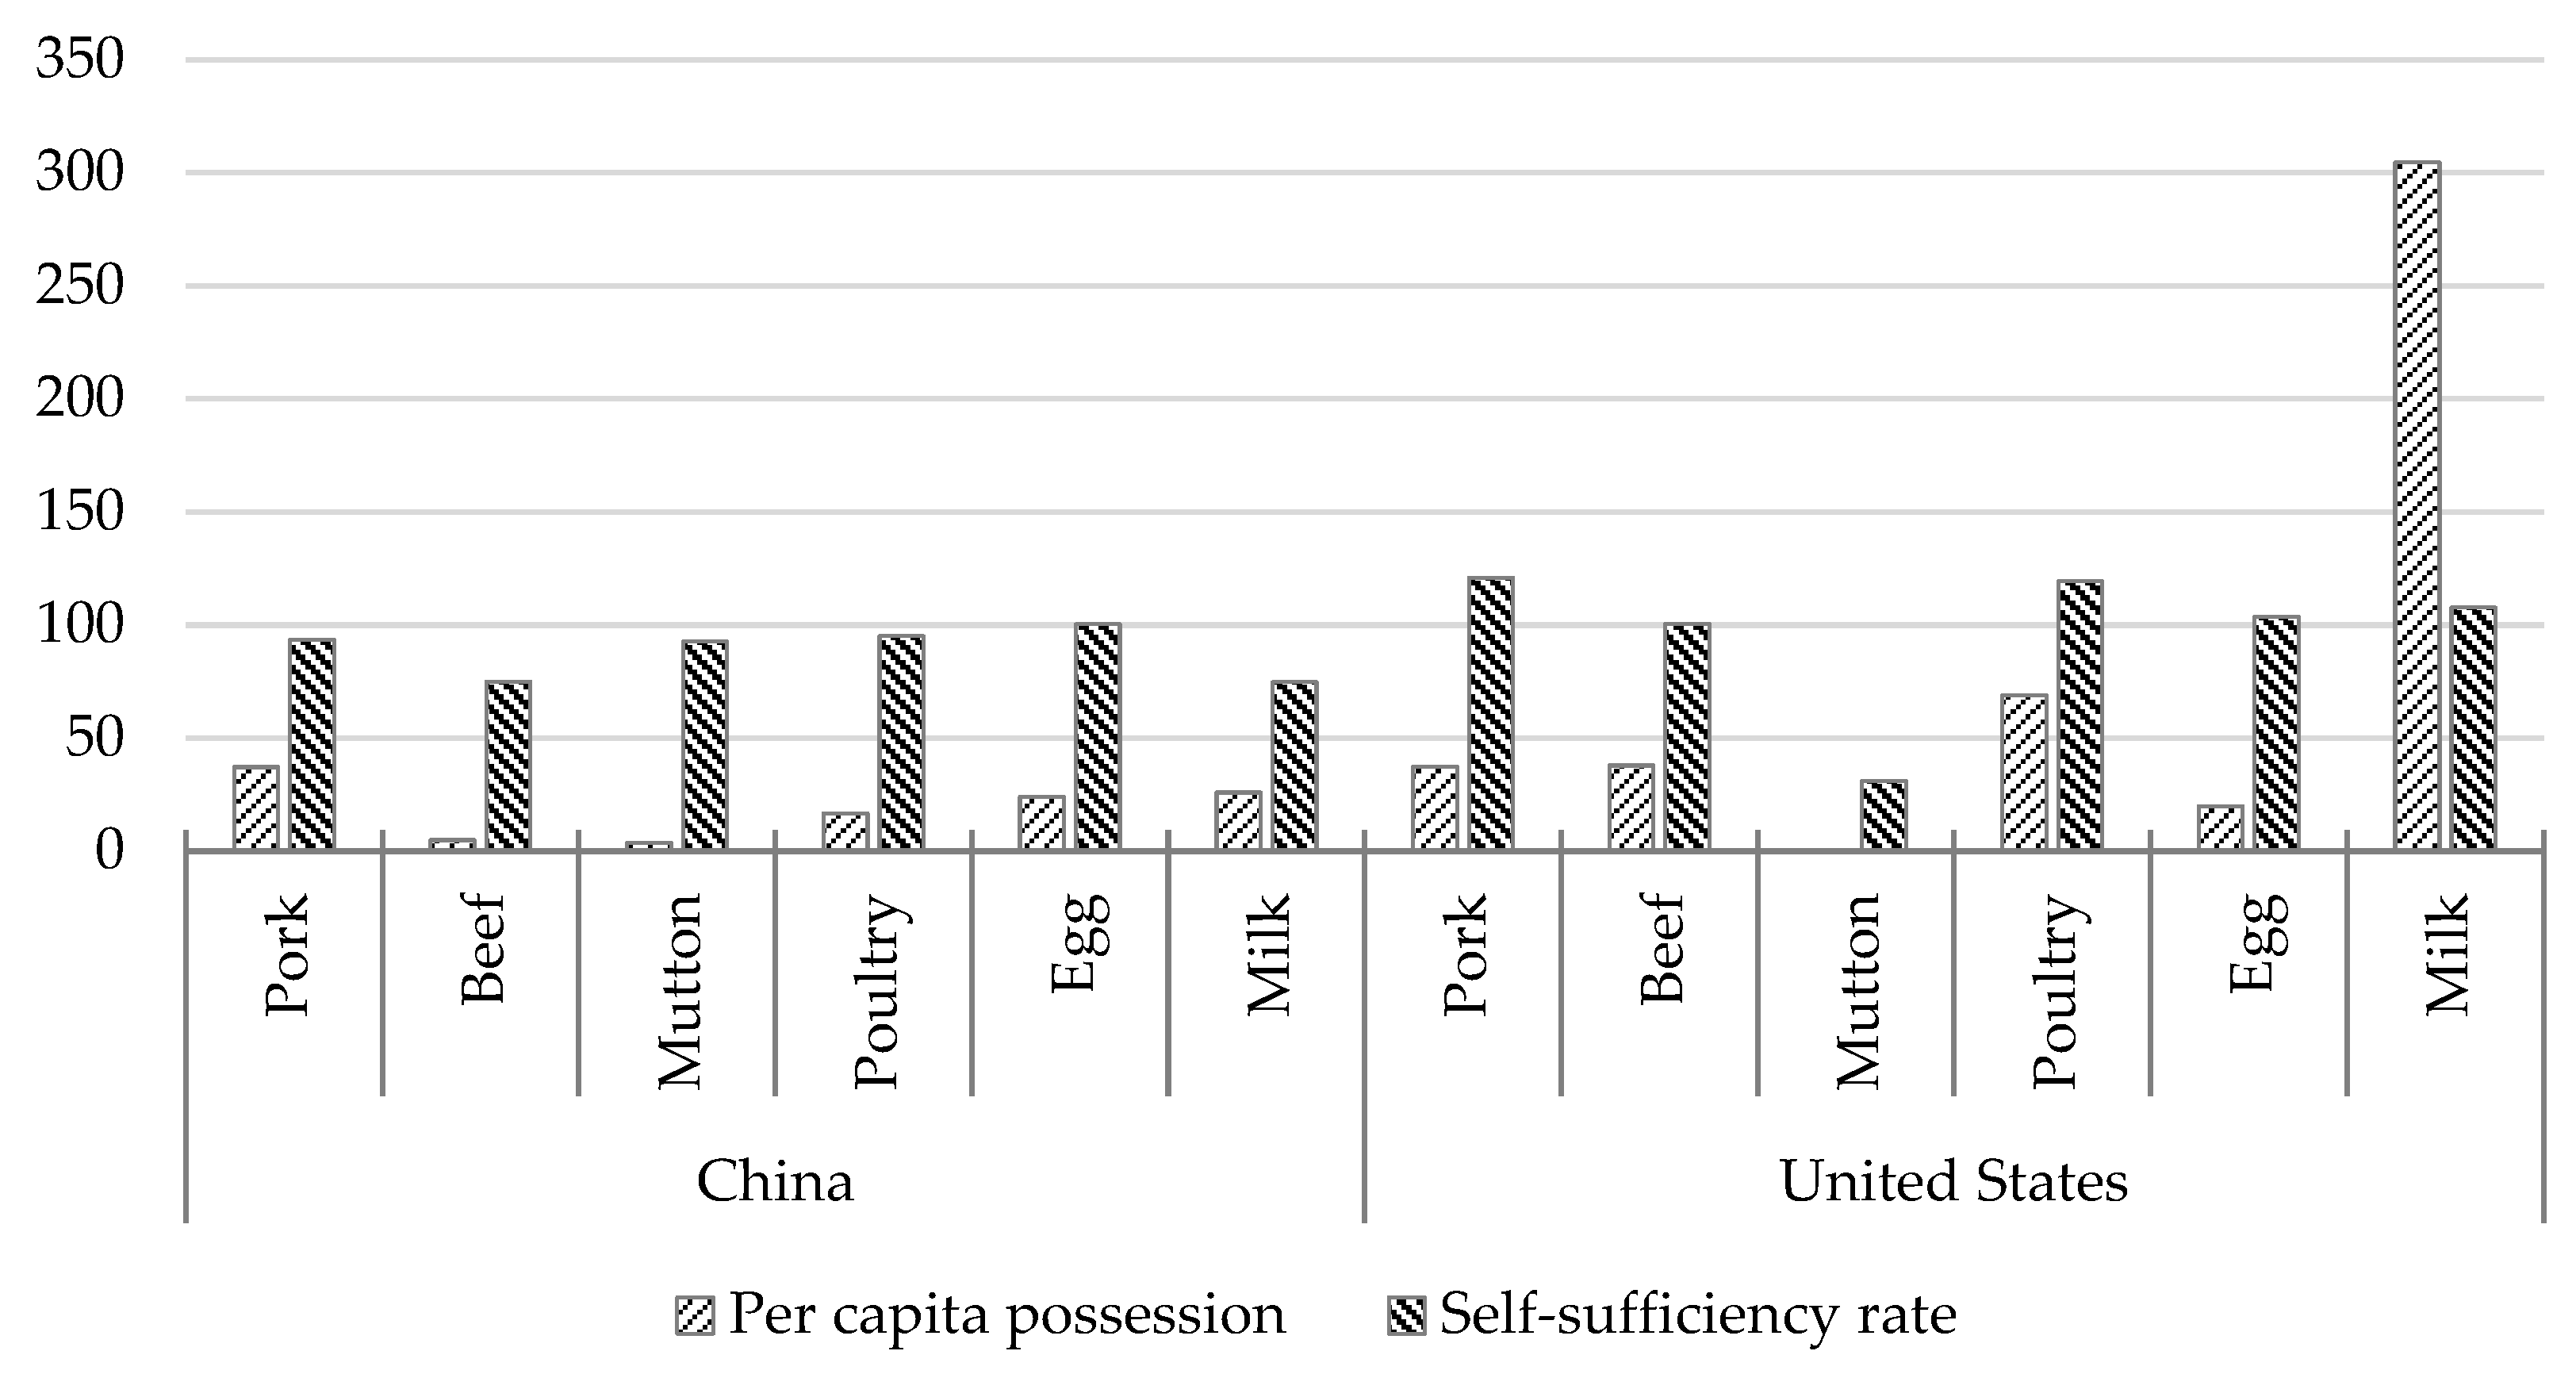
With policy support and market-driven efforts, China’s livestock industry has taken a new step in development, and the supply security capacity of livestock products has significantly improved, but there are still many shortcomings and weaknesses that need to be resolved. Although China’s total livestock products maintain a high level, most of the livestock production steadily ranked first in the world, but due to the large population, consumer demand and other factors, the per capita possession of livestock products and self-sufficiency rate were relatively low. From the viewpoint of per capita possession, the per capita possession of pork, beef and poultry in 2021 were 37.14 kg, 4.89 kg and 16.69 kg, respectively, and these were less than 37.27 kg, 37.79 kg and 68.91 kg in the United States. The per capita possession of dairy products in China was 25.83 kg, and this was much lower than the value of 304.54 kg in the United States. In terms of self-sufficiency, China’s self-sufficiency rates for pork, beef and poultry in 2021 were 93.39%, 74.94% and 95.02%, respectively, which were not as high as those of the U.S. levels of 120.75%, 100.38% and 119.28%. China’s layer industry was highly competitive, but the self-sufficiency rate of 100.30% was slightly lower than that of the U.S. level of 103.63%. China’s dairy self-sufficiency rate was only 74.59%, far lower than the U.S. level of 107.63%.
Figure 2.
Comparison of the per capita possession and self-sufficiency rate of livestock products between China and the United States in 2021 (kg, %). Data source: FAO database (https://www.fao.org/faostat/en/#home).
Figure 2.
Comparison of the per capita possession and self-sufficiency rate of livestock products between China and the United States in 2021 (kg, %). Data source: FAO database (https://www.fao.org/faostat/en/#home).
The issues and challenges faced by livestock product supply security capacity enhancement were the result of the combined effect of the tightening resource and environmental constraints, insufficient scientific and technological support, weak operation systems, insufficient industry chain and supply chain resilience, increasing uncertainty and instability factors, and unsound policy support systems. Considering the systematic analysis of science and technology support, operation systems, industry chain and supply chain resilience, policy support systems, etc., only the resource and environmental constraints will be discussed here. From the perspective of resource constraints, affected by the unequal exchange of factors between industry, agriculture and urban and rural areas and the poor free flow of such factors, land, labor and other resources were more willing to enter the industry and cities, and agriculture and rural areas were obviously less attractive to the advantageous factors, and this was especially true for the development of the livestock industry. In terms of land, the main manifestation was the difficulty in acquiring land for livestock breeding and the competition for land between rations and feed grain and forage. In terms of labor, the contradictions of poor quality and high cost were prominent, and the average annual growth of labor costs for free-range breeding of pigs, beef cattle, sheep and goats in China from 2010 to 2021 were 7.19%, 9.33% and 9.46%, respectively. For the small-scale breeding of broilers and layers, the corresponding indicators were 7.76% and 8.54%, respectively, and the average annual growth rate of free-range dairy cattle labor costs reached 8.82%. From the perspective of environmental protection, since 2015, the state has attached great importance to steadily promoting the green development of agriculture, with the successive introduction of “water 10” “soil 10” and other policy initiatives, and the green cycle of livestock industry development taking new steps, but the environmental protection posed the most “headache” for livestock farming and it persisted. In particular, regarding the implementation of environmental protection policies, some areas took unscientific and unreasonable “one-size-fits-all” measures to limit the development of the livestock industry, and thus far farmers were still “talking about tiger”. Obviously, environmental protection facilities and equipment investment directly increased the cost of livestock breeding and industry entry barriers.
4.2. Scientific and technological support needs to be improved
Science and technology are the first productive forces, innovation is the first driving force to lead development, and thus accelerating the construction of a livestock powerhouse must rely on strong support from science and technology. Although China’s scientific and technological innovation and applications in the livestock industry have achieved significant results, there are still many shortcomings and weaknesses, that are mainly reflected in the low production efficiency and high production costs. In terms of the development state of science and technology in the field of breeding industry and machinery, including the domestic breeding market “foreign ternary” becoming mainstream, and the quality of beef cattle breeds such as Simmental and Angus, the major high-yielding dairy breeds such as Holstein, and the quality of sheep and goat breeds such as Suffolk, Boer and Dupo coming from abroad [27]. TMR mixer, automatic feeding carts, conveyor feeding systems, calf feeding carts, and other feeding machinery relied on imports at 25%, robotic milking equipment at 100%, other milking equipment relied on imports at 90%, environmental control machinery relied on imports at 70%, and manure treatment machinery relied on imports at 80% [28,29].

Table 4.
Comparison of livestock production efficiency in major countries in 2021 (%, kg/head).
| Country | Pig | Beef cattle | Sheep and goat | Broiler | Layeryield | Milk yield | ||||
|---|---|---|---|---|---|---|---|---|---|---|
| Slaughterrate | Carcassweight | Slaughterrate | Carcassweight | Slaughterrate | Carcassweight | Slaughterrate | Carcassweight | |||
| Australia | 212.97 | 78.74 | 27.10 | 291.88 | 37.87 | 24.69 | 608.94 | 1.92 | 16.01 | 6400.40 |
| Brazil | 124.70 | 82.29 | 12.34 | 351.92 | 30.09 | 14.46 | 400.96 | 2.43 | 12.30 | 2280.70 |
| Canada | 166.99 | 102.63 | 30.01 | 417.46 | 94.06 | 22.99 | 439.12 | 1.89 | 17.72 | 9646.70 |
| China | 133.56 | 88.27 | 77.98 | 148.19 | 110.99 | 14.49 | 252.04 | 1.55 | 10.69 | 3026.90 |
| France | 180.15 | 94.53 | 25.73 | 319.48 | 57.87 | 18.14 | 305.50 | 1.89 | - | 7458.90 |
| Germany | 218.31 | 95.83 | 29.60 | 330.61 | 99.05 | 20.41 | - | - | 19.70 | 8481.40 |
| India | 103.64 | 35.00 | 21.08 | 103.00 | 34.88 | 10.59 | 328.87 | 1.34 | 11.98 | 1880.20 |
| Japan | 181.24 | 78.29 | 26.82 | 450.00 | 30.31 | 26.20 | 261.72 | 2.88 | 18.30 | 8939.20 |
| New Zealand | 254.74 | 70.89 | 46.27 | 159.81 | 87.20 | 20.24 | 458.88 | 1.91 | 15.96 | 4555.30 |
| Korea | 163.89 | 76.54 | 24.18 | 321.24 | 39.24 | 15.45 | 583.80 | 0.94 | 10.09 | 10374.30 |
| Russia | 179.23 | 92.90 | 43.43 | 213.75 | 55.13 | 18.04 | 484.88 | 1.89 | 16.70 | 5016.70 |
| United States | 174.06 | 97.32 | 36.64 | 370.59 | 38.08 | 24.92 | 597.13 | 2.43 | 17.08 | 10869.00 |
Data source: FAO database (https://www.fao.org/faostat/en/#home).
In terms of production efficiency in 2021, China’s slaughter rate and carcass weight of pigs, beef cattle, sheep and goats, and broilers were 133.56%, 77.98%, 110.99%, 252.04% and 88.27 kg/head, 148.19 kg/head, 14.49 kg/head and 1.55 kg/head, respectively, while layer and dairy cattle yields were 10.69 kg/head and 3026.90 kg/head, and these were generally lower than those of the United States and other developed countries and lower than the world average. From the point of view of production efficiency, domestic livestock production costs continued to rise and were generally higher than the world average, resulting in an uncompetitive price advantage of domestic livestock products in the international market. At present, most of the livestock production cost growth rates beats the output value growth rate, and the total costs of production of pigs, sheep and goats, broilers and layers from 2010 to 2021 increased by 7.28%, 7.51%, 3.28% and 2.91%, respectively, and these rates were higher than the corresponding 6.15%, 6.90%, 1.90% and 2.44% of the total output value. Although the total cost of production of beef cattle and dairy cattle grew at a slightly lower rate than the total output value, it was still at a relatively high level, with an average annual growth rate of 9.70% and 3.85%, respectively. Comparing the production cost of pigs in China and the United States, the production cost of pig in the United States in 2021 was only 51.96%, 57.46%, 59.05% and 60.25% of the corresponding levels of free-range, small-scale, medium-scale and large-scale in China, respectively. Of course, such conclusions could be drawn from the import prices of livestock products and domestic market prices. In 2021, the average import prices of pork, beef and mutton were 16.91 CNY/kg, 34.54 CNY/kg and 37.35 CNY/kg, respectively, and the domestic market prices in that year were 32.45 CNY/kg, 85.14 CNY/kg and 84.11 CNY/kg, respectively. The average import price of poultry was 15.31 CNY/kg, and the average import price of dairy was 3.66 CNY/kg, both were lower than the domestic level of 22 CNY/kg and 4 CNY/kg above. In general, China’s scientific and technological innovation in the livestock industry still needs to be strengthened, and there is still much room for improvement in the construction of a livestock powerhouse empowered by science and technology.
Table 5.
Trends in the cost‒benefit of China’s livestock industry.
| Type | 2010 | 2015 | 2020 | 2021 | Average annual growth rate (%) | |
|---|---|---|---|---|---|---|
| Pig (CNY/head) |
Total output | 1341.01 | 1827.19 | 4146.29 | 2586.49 | 6.15 |
| Total Cost | 1250.20 | 1835.35 | 2913.65 | 2709.18 | 7.28 | |
| Feed cost | 696.90 | 870.08 | 960.55 | 1112.67 | 4.35 | |
| Labor Cost | 238.98 | 510.82 | 537.99 | 512.82 | 7.19 | |
| Beef cattle (CNY/head) |
Total output | 6014.92 | 10663.30 | 16713.20 | 17498.70 | 10.19 |
| Total Cost | 4983.38 | 8550.67 | 12641.30 | 13799.30 | 9.70 | |
| Feed cost | 1291.16 | 1709.56 | 2526.98 | 2965.52 | 7.85 | |
| Labor cost | 440.66 | 1010.52 | 1147.56 | 1175.52 | 9.33 | |
| Sheep and goat (CNY/head) |
Total output | 775.41 | 936.08 | 1573.63 | 1614.86 | 6.90 |
| Total Cost | 639.67 | 1002.11 | 1367.84 | 1418.25 | 7.51 | |
| Feed cost | 164.02 | 201.87 | 241.94 | 270.24 | 4.64 | |
| Labor cost | 196.27 | 422.32 | 495.04 | 530.60 | 9.46 | |
| Broiler (CNY/hundred) |
Total output | 2489.48 | 2627.07 | 2753.70 | 3061.84 | 1.90 |
| Total Cost | 2219.53 | 2700.31 | 2902.79 | 3164.02 | 3.28 | |
| Feed cost | 1615.85 | 1911.85 | 1916.43 | 2194.70 | 2.82 | |
| Labor cost | 179.80 | 354.20 | 414.16 | 409.20 | 7.76 | |
| Layer (CNY/hundred) |
Total output | 13772.50 | 15617.00 | 13980.70 | 17955.40 | 2.44 |
| Total Cost | 12871.90 | 14643.80 | 15865.10 | 17655.80 | 2.91 | |
| Feed cost | 9558.24 | 10082.83 | 10732.30 | 12412.90 | 2.40 | |
| Labor cost | 731.92 | 1599.62 | 1855.82 | 1802.76 | 8.54 | |
| Dairy cattle (CNY/head) |
Total output | 16361.70 | 21337.70 | 24609.60 | 26217.30 | 4.38 |
| Total Cost | 12190.90 | 16331.20 | 17300.20 | 18462.00 | 3.85 | |
| Feed cost | 8516.76 | 10165.34 | 10258.62 | 11327.12 | 2.63 | |
| Labor Cost | 1651.84 | 3695.35 | 4200.20 | 4186.45 | 8.82 | |
Note: Data from the National Compilation of Cost and Benefit Information of Agricultural Products. The costs and benefits of pigs, beef cattle, sheep and goats, and dairy cattle are for free-range farming, and the costs and benefits of broilers and layers are for small-scale farming.
4.3. Modern operation system needed to be sound
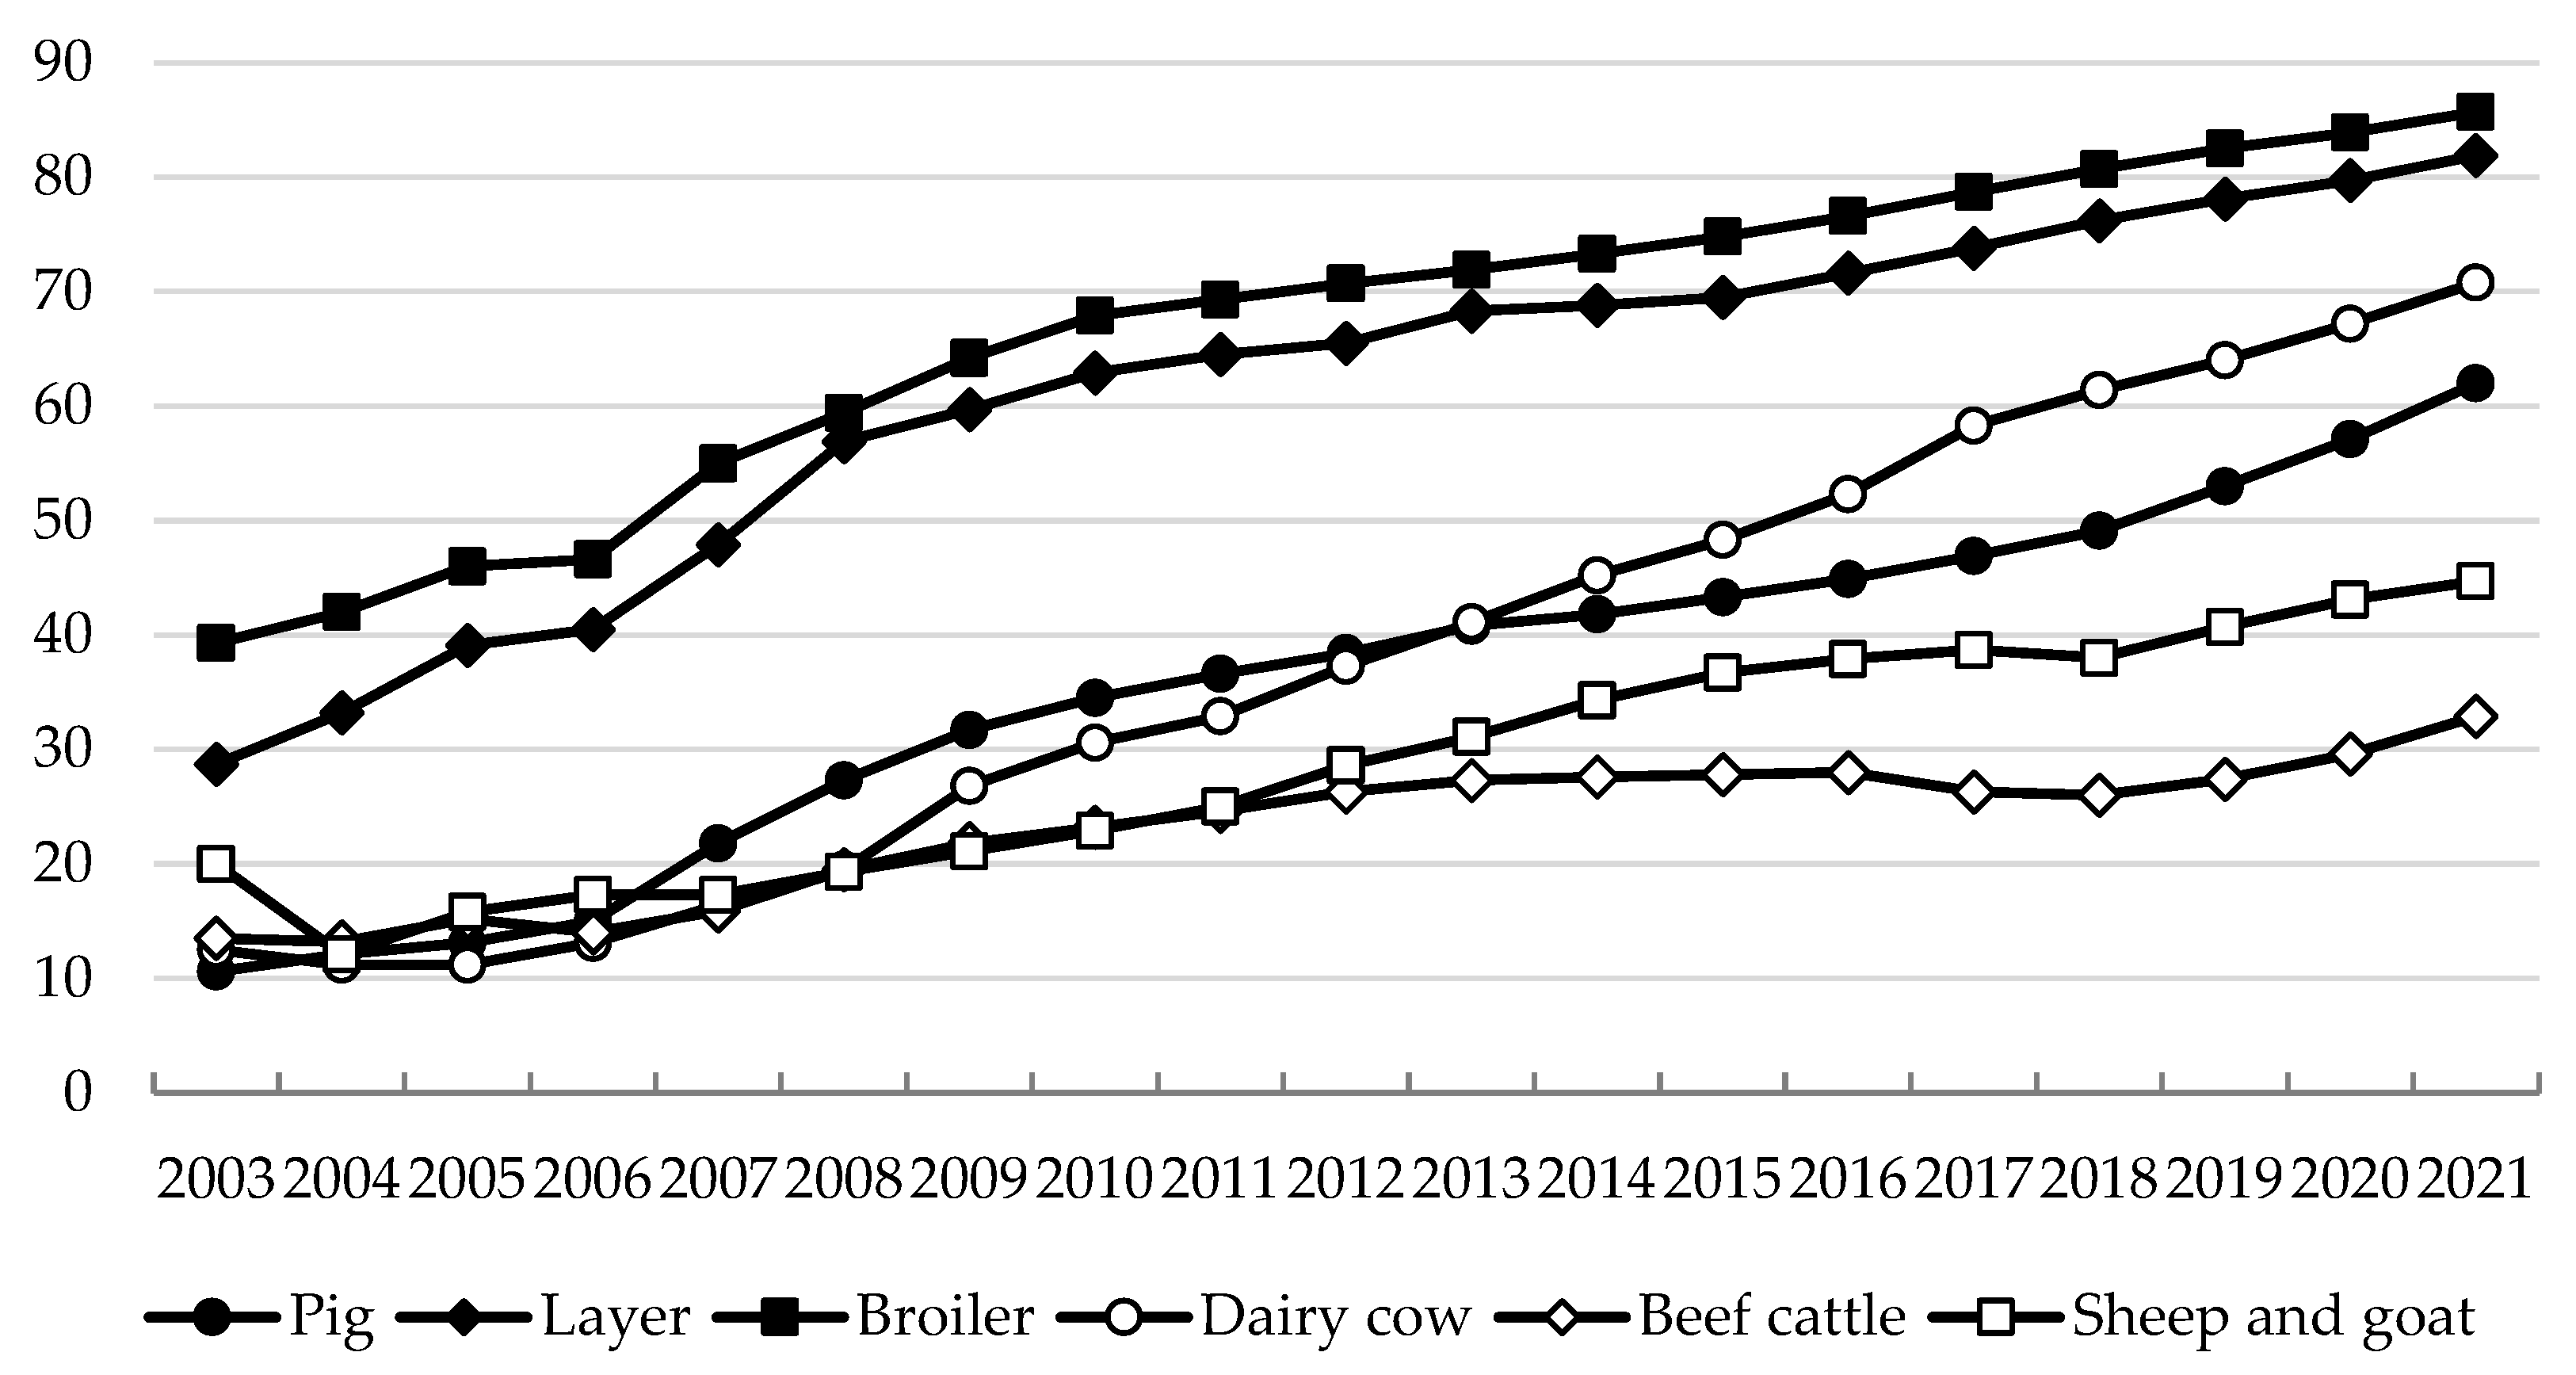
China’s government attached great importance to the construction of the agricultural industry system, as well as it production system and operation system and formulated a series of policies and measures to accelerate the construction of a new operation system, promoting the continuous growth of new business entities in the livestock industry in China, promoting the continuous increase of industrialized leading enterprises, enhancing the professional cooperatives and family farms, and the rapid development of socialized service organizations. However, compared with developed countries, China’s livestock operation system still needs further transformation and upgrading. In terms of scale, in 2021, China’s livestock breeding scale rate reached 69.0%, an increase of 48.4 percentage points compared with 2003. Among these rates, the scale rates of pig, beef cattle, sheep and goat, broiler, layer and dairy breeding reached 62.0%, 32.9%, 44.7%, 85.7%, 81.9% and 70.8%, respectively, and the scale of major livestock breeding has been greatly improved. Except for beef cattle, sheep and goats, the scale of other major livestock breeding was at a high level.
Figure 3.
China’s livestock breeding scale rate trend (%). Note: Data from China Animal Husbandry and Veterinary Statistics. The different livestock breeding scale standards are as follows: more than 500 pigs slaughtered per year, more than 2,000 layers inventory per year, more than 10,000 broilers slaughtered per year, more than 100 dairy cows inventory per year, more than 50 beef cattle slaughtered per year, and more than 100 sheep and goats slaughtered per year.
In terms of industry concentration, although the concentration of China’s livestock industry has increased significantly, it was still at a relatively low level. Taking pig breeding as an example, after the African swine fever outbreak in 2018, there was a new round of “reshuffling” in the pig industry, with the total number of pigs slaughtered by the top 10 listed pig enterprises in China increasing from 49.55 million to 124.5 million from 2018 to 2022 (subject to the ranking in 2022), with an increase of 151.26%, and the share of national slaughter increasing from 7.14% to 17.79%, with an increase of 10.65 percentage points. The industry concentration of pig breeding has rapidly improved. The concentration of the pig slaughtering industry has gradually increased, and the slaughtering volume of the above-scale pig slaughtering enterprises nationwide increased significantly in 2022, with a slaughtering volume of 285.37 million head, an increase of 17.67% compared with 2018. The slaughtering rate of fixed location slaughtering grew steadily, from 34.95% in 2018 to 40.77% in 2022, an increase of nearly 6 percentage points. China Business Intelligence research data showed that the CR5 share of China’s slaughter industry was approximately 5%, of which the slaughter leader’s share was only 2.35%. Compared to the United States and other developed countries, China’s livestock industry was still at a relatively low scale level and industry concentration, and there was more room for future improvement. According to USDA data, in 2012, the proportion of pig inventory above 500 head in the total inventory in the United States reached 97.3%, and the scale level was much higher than the corresponding level in China [30]. The concentration of pork processing was also at a high level, with the market share of the top 4 slaughter and processing enterprises reaching approximately 70%.
Table 6.
Trend of pig slaughter of listed pig enterprises, 2018-2022 (million head, %).
| Enterprise | 2018 | 2019 | 2020 | 2021 | 2022 |
|---|---|---|---|---|---|
| Muyuan Foods Co., Ltd. | 1101 | 1025 | 1812 | 4026 | 6120 |
| Wens Foodstuff Group Co., Ltd. | 2230 | 1852 | 955 | 1322 | 1791 |
| New Hope Group | 255 | 355 | 829 | 998 | 1461 |
| Zhengbang Group | 554 | 578 | 955 | 1493 | 845 |
| Aonong Group | 42 | 66 | 135 | 325 | 519 |
| Da Bei Nong Group | 168 | 164 | 185 | 431 | 443 |
| Tech-bank Food Co., Ltd. | 217 | 244 | 308 | 428 | 442 |
| COFCO Joycome Foods Limited | 255 | 199 | 205 | 343 | 410 |
| Tangrenshen Group Co., Ltd. | 68 | 84 | 102 | 154 | 216 |
| Tecon Biology Co., Ltd. | 65 | 84 | 135 | 160 | 203 |
| Total | 4955 | 4651 | 5621 | 9680 | 12450 |
| National | 69382 | 54419 | 52704 | 67128 | 69995 |
| Percentage of | 7.14 | 8.55 | 10.67 | 14.42 | 17.79 |
Note: Data from the National Bureau of Statistics and related enterprises. This table was sorted according to the top 10 listed pig enterprises in terms of slaughter volume in 2022.
4.4. The industry chain and supply chain were not highly resilient
Since the reform and opening up, China’s livestock industry policy system has been improved to promote the resilience and security level of the livestock industry chain and supply chain, gradually improving the effective response to a series of “black swan” “gray rhinoceros” event impacts. However, the current livestock industry to extend the chain, complement the chain, and strengthen the chain task was still heavy, the industry business model innovation still needed to be accelerated, the level of industrial integration development still needed to be enhanced, risk control and transfer capacity needed to be strengthened, and the livestock industry chain and supply chain resilience and security foundation needed to be firmly established. There was an old Chinese saying “Family money, with animal does not count”, relating to animal disease being a major risk facing livestock breeding. For major animal diseases, for example, comparing the situation of major animal diseases in China and the United States since 2010, it was not difficult to observe that the epidemic situation in China was more severe but to a certain extent the situation reflects the weak level of domestic animal disease prevention and control adopting efficient prevention and control of epidemics to help build a livestock powerhouse space. In 2010-2016, there were more than 20,000 new outbreaks of animal diseases in China. In 2017-2019, there were more than 20,000. In 2017-2019, the new outbreaks of animal diseases were more than 1,000. But since 2020, with the improvement of animal disease prevention and control systems and the strengthening of prevention and control capacity, new outbreaks have been significantly reduced. In contrast, in the United States, the new outbreaks of animal diseases have never exceeded 1,000 since 2010, showing the advantages of animal disease prevention and control in the United States.
Table 7.
Comparison of the state of major animal diseases in China and the United States (104 head).
Table 7.
Comparison of the state of major animal diseases in China and the United States (104 head).
| Year | China | United States | ||||||
|---|---|---|---|---|---|---|---|---|
| New outbreaks | Cases | Killed and disposed | Deaths | New outbreaks | Cases | Killed and disposed | Deaths | |
| 2010 | 20434 | 496.56 | 18.36 | 70.08 | 53 | 0.07 | 0.13 | 0.00 |
| 2011 | 30466 | 417.93 | 31.35 | 43.56 | 40 | 0.03 | 1.55 | 0.00 |
| 2012 | 24107 | 269.08 | 184.50 | 32.05 | 50 | 0.09 | 0.02 | 0.00 |
| 2013 | 24884 | 267.04 | 61.17 | 33.27 | 55 | 0.68 | 1.06 | 0.00 |
| 2014 | 22640 | 265.21 | 217.17 | 22.54 | 454 | 0.07 | 11.65 | 0.01 |
| 2015 | 27142 | 293.35 | 62.34 | 34.97 | 253 | 2.53 | 1607.14 | 5.92 |
| 2016 | 23266 | 281.64 | 100.21 | 48.78 | 25 | 0.07 | 23.67 | 0.10 |
| 2017 | 8381 | 100.82 | 77.23 | 28.96 | 25 | 0.06 | 19.59 | 0.07 |
| 2018 | 8560 | 85.91 | 63.65 | 20.52 | 35 | 0.06 | 22.19 | 0.02 |
| 2019 | 3946 | 31.84 | 20.27 | 5.30 | 52 | 0.09 | 171.46 | 0.02 |
| 2020 | 124 | 0.90 | 1.76 | 0.87 | 245 | 0.09 | 33.95 | 2.22 |
| 2021 | 120 | 0.59 | 0.43 | 0.58 | 82 | 0.04 | 0.04 | 0.03 |
| 2022 | 18 | 0.03 | 0.06 | 0.03 | 994 | 0.02 | 5691.43 | 144.44 |
Data source: World Organization for Animal Health (https://wahis.woah.org/).
From the feed grain and forage supply security capacity, the current corn, soybeans and other feed materials were highly dependent on imports, although the advantage of grain-based livestock including layer, pig, broiler industry was more than the dairy and beef cattle industry, but the “broken chain” risk was faced, once the extreme emergencies caused by feed grain could not be imported, a situation in which China’s livestock development would not induce a talk about a powerhouse. In addition, after the “melamine” incident in 2008, farmers paid more attention to the role of high-quality forage in the diet of grass-fed livestock, and the ratio of green and roughage feed to concentrate feed for grass-fed livestock showed an overall increase. However, the domestic forage industry started late and lagged in development. In 2020, nearly 80 million mu of high-quality forage was planted on arable land, and the forage output reached 71.6 million tons, of which 6.5 million mu was planted with high-quality and high-yield alfalfa, and the output was 3.4 million tons. In contrast, in the United States, alfalfa has become the fourth largest crop after corn, wheat, and soybeans, and its production in recent years has maintained more than 11 million tons, becoming an important driver of dairy production efficiency and competitiveness in the United States. Currently, China’s dairy cattle inventory is 11 million head, and its milk production is 39.3 million tons. By vigorously developing a high-quality forage industry, it is important to improve the quality and efficiency of milk production, enhance supply chain resilience and strengthen the competitiveness of China’s dairy industry.
4.5. International trade risks were increasing
In recent years, affected by the tightening of domestic resources and environmental constraints, the expansion of urban and rural residents’ consumption needs and other factors, China’s livestock industry has continued to increase the depth and breadth of its opening to the world, in addition to China’s increased use of international markets and resources to enhance the ability to play an important role in compensating for the lack of domestic resource endowment, and the gap between the supply and demand of livestock products. In particular, in the context of China’s grain security problem manifested mainly in the safety of feed grain, livestock products and feed grain imports for the domestic savings of a large number of resources, only corn, soybeans and other feed grain imports were equivalent to the use of nearly 800 million acres of foreign arable land. However, the current use of international markets and resources to support the high-quality development of the domestic livestock industry and the construction of livestock powerhouses are facing increasing risk factors.
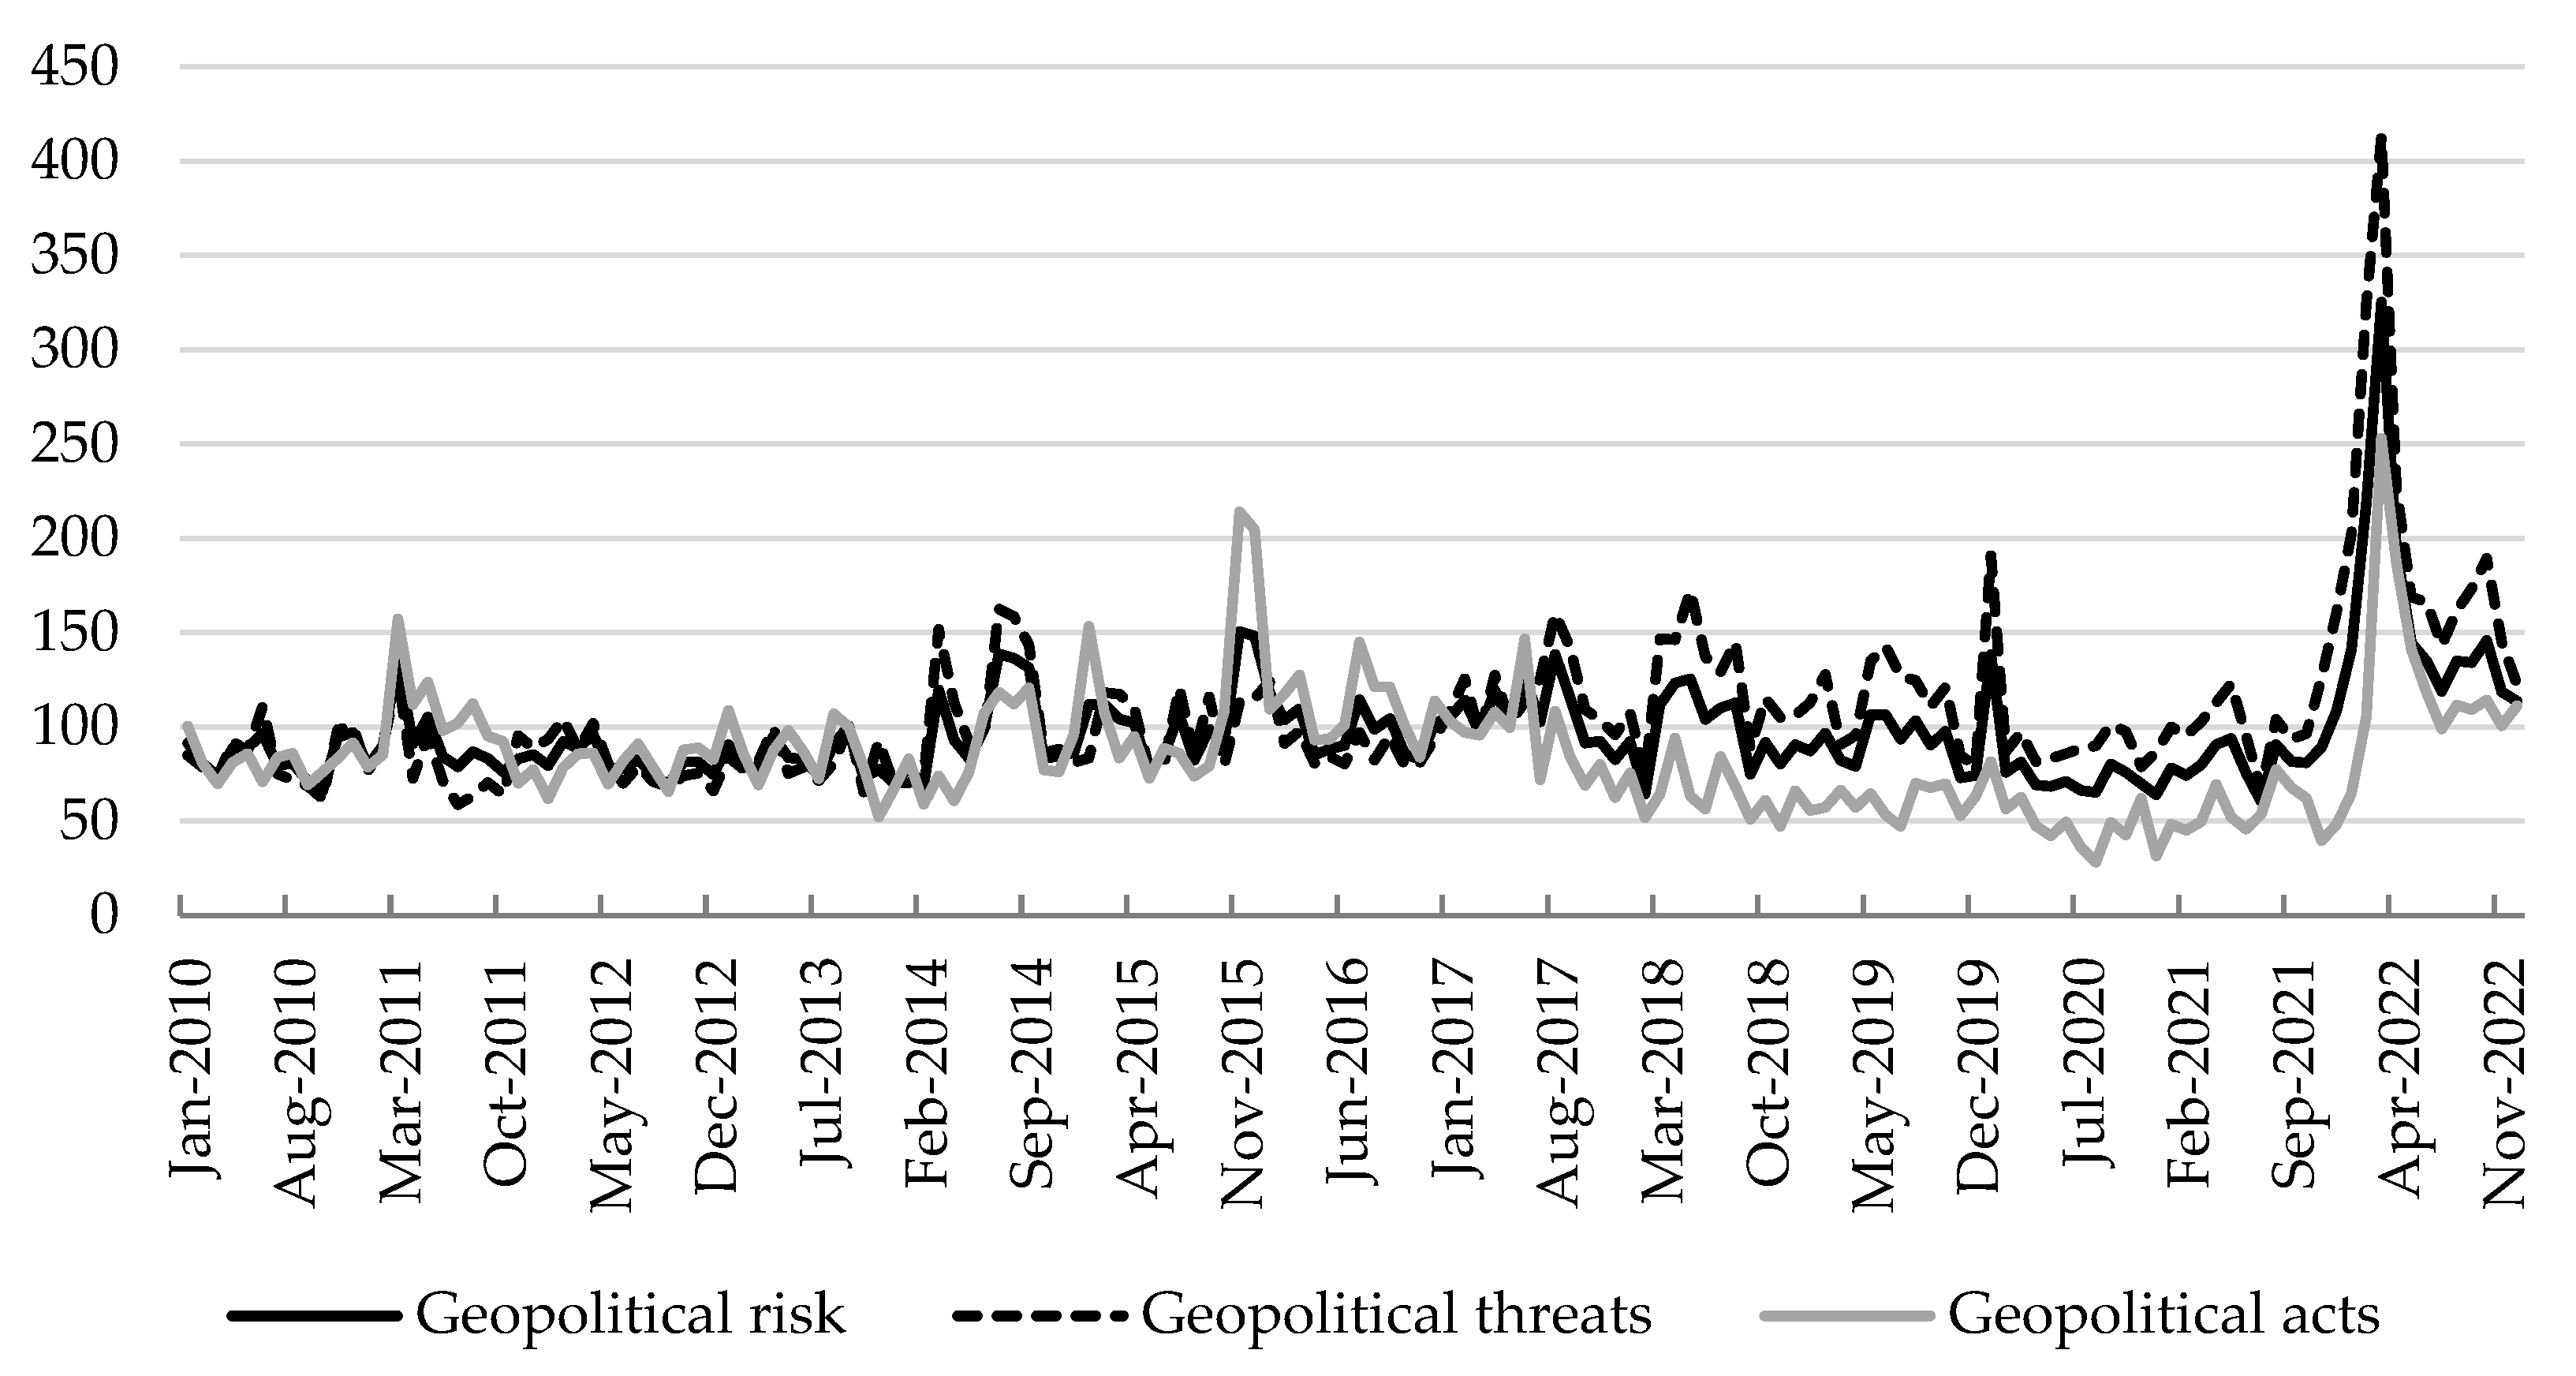
On the one hand, the risk of a high concentration of imports of livestock products and feed grains should pose a high alert. From the perspective of imports source countries, in recent years, pork imports were mainly from Spain, Brazil and Denmark, beef imports were mainly from Brazil, Argentina and Uruguay, mutton imports were from New Zealand and Australia, poultry imports were from Brazil and the United States, and dairy imports were mainly from New Zealand and the European Union. In 2022, 92% of soybean imports were from the United States and Brazil, of which Brazil accounted for nearly 60% and 98% of corn imports were from the United States and Ukraine, with the United States accounting for 72%, and over 60% of sorghum imports were from the United States. On the other hand, livestock products and feed grain imports face the risk of uncertainty that continues to grow. In a century of unprecedented changes, the game, unilateralism, protectionism, hegemony, etc., continue to intensify, led by the United States and other developed countries to contain China and these changes are still unabated. Trade disputes and scientific and technological suppression continue to exist; in extreme cases that do not exclude feed grain, livestock products face the same pressure as the “chip” market. The conflict between Russia and Ukraine is still continuing, and the international security supply of livestock products and feed grain facing geopolitical risks cannot be ignored. In the international competition between China and the United States livestock and related industries, the United States initiative was stronger, and the advantage was more obvious. In addition, the frequency of extreme weather disasters around the world, the frequent occurrence of heavy, animal and plant epidemics, public health emergencies and other disasters, it was difficult to provide a stable environment for the safe import of livestock products, feed grains, etc.
Figure 4.
Global geopolitical risk trends, 2010-2022. Data source: Economic Policy Uncertainty Database (http://www.policyuncertainty.com/index.html).
Figure 4.
Global geopolitical risk trends, 2010-2022. Data source: Economic Policy Uncertainty Database (http://www.policyuncertainty.com/index.html).
4.6. Policy support system needed to be improved
The policy support system of China’s livestock industry has gradually evolved and improved, driven by many factors, such as changes in consumer demand, tightening resource and environmental constraints, and increasing external uncertainties, and has now formed a policy support system covering all aspects of the whole industry chain, such as breeding, slaughtering and processing, circulation, storage, disease prevention and control, green development and two resources in both domestic and international markets. This played an important role in strengthening the supply security capacity of livestock products, improving the quality, efficiency and competitiveness of the livestock industry and accelerating the construction of livestock powerhouses. However, compared with countries and regions such as the United States and the European Union, China’s livestock policy support system can still be further improved and optimized, especially in terms of policy foresight, precision and sustainability.
Taking African swine fever as an example, after it was first diagnosed in Liaoning Province in August 2018, the epidemic spread rapidly across the country within a short period, bringing a large negative impact on the pig industry and market, seriously damaging the pig production base, highlighting the contradiction between supply and demand in the pork market, and highlighting the problem of “expensive and difficult meat eating” forthe population. Reflecting on the current round of epidemic prevention and control measures and pig market regulation policies, it was easy to observe that although the government has intensively introduced a series of policy initiatives in the short term, including the release of important policy documents such as “Opinions of the General Office of the State Council on Strengthening Prevention and Control of African Swine Fever”, “Three-Year Action Plan for Accelerating the Recovery and Development of Pig Production” and “Opinions of the General Office of the State Council on Promoting the High-Quality Development of the Livestock Industry”, the series of control policies implemented in response to African swine fever had obvious problems of mismatch and overreaction, deepening market fluctuations and compressing the original “pig cycle” [31,32]. On the one hand, even though major animal epidemics such as porcine reproductive and respiratory syndrome and highly pathogenic avian influenza were experienced in the early stage, the relevant lessons were not well absorbed to effectively address African swine fever, resulting in the widespread spread of the epidemic and large-scale losses in pig breeding. On the other hand, pig market control policies followed the epidemic, showing a certain degree of passivity and lagging, with policy initiative and foresight still to be strengthened. Of course, the policy initiatives related to the current round of the epidemic did not achieve better results in suppressing the sharp rise and fall of pig market prices, resulting in a rapid fall in prices after a sharp rise, and a large number of farmers suffered a “second blow” due to the drastic market shock. Overall, China’s livestock industry policy support system still needs to be enhanced and improved to help strengthen the policy assurance and institutional governance for the construction of a livestock powerhouse.
5. Conclusions
Based on the construction of the evaluation index system, this study, using the livestock industry and its related basic data of major countries in the world, combined the entropy method to comparatively assess the level of China’s livestock powerhouse and discussed the challenges and shortcomings faced by accelerating the construction of a livestock powerhouse. Specifically, the following research conclusions can be obtained.
First, the level of China’s livestock powerhouse was ranked high and was moving from being large to a powerhouse status. The level of China’s livestock powerhouse ranked 5th among 135 countries. Although the ranking was relatively high and the strength was relatively robust, there was still a large gap compared to the United States, and compared with the domestic livestock powerhouse target and requirements, and thus further efforts are needed. China’s livestock powerhouse level was higher than that of Australia, Germany, Canada, France, Japan, South Korea and other countries. There were obvious differences in the corresponding powerhouse level of different livestock species, and the layer industry was the world’s leading industry, ranking 1st in 108 countries. The pig, sheep and goat, and broiler industries were relatively strong, ranking 6th, 5th and 7th in 112, 108 and 109 countries, respectively. The beef cattle and dairy industry were weak, ranking 34th and 42nd in 124 and 132 countries, respectively.
Second, accelerating the construction of livestock powerhouses still faces many issues and challenges to be resolved. Domestic supply security capacity needed to be strengthened, and international trade risks were increasing. The high cost and low efficiency of livestock production problems were highlighted, and the level of scientific and technological support needed to be improved. The livestock production scale of intensification needs to be improved, and the modern operation system needs to be sound. The animal disease prevention and control capacity was weak, instability and uncertainty factors increased, and the industry chain and supply chain resilience was not strong. The policy accuracy and effectiveness were not sufficient, and the policy support system needed to be improved.
Based on the above findings, the following strategic path and policy recommendations are proposed for reference. First, improve the institutional mechanism for the construction of a livestock powerhouse. Develop a strong livestock construction program and implement strong livestock construction action; adhere to the national “chess”, unified leadership, unified planning layout, clear levels of various departments and different production and business entities responsibilities and obligations. Focus on supply security, science and technology equipment, business system, industrial resilience, competitiveness and other key tasks, further improve the policy support system, increase the financial and financial insurance support breadth and depth, leveraging social forces to actively invest in the construction of a strong livestock industry.
Second, promote a high level of self-reliance and self-improvement in animal husbandry science and technology. Seed industry, machinery and other key areas of core technology as the main direction, increase the investment in animal husbandry science and technology, strengthen the strategic layout of animal husbandry science and technology, deepen the basic, frontier, public welfare, strategic research, innovative transformation of scientific and technological achievements and technology promotion model. The soybean oil production capacity improvement project should be deepened, and the corn yield improvement project should be implemented to promote high-quality feed grain high-quality development and strengthen the feed forage domestic supply security capacity.
Third, the construction of modern animal husbandry business system. Strengthen the cultivation of new business entities, further support leading enterprises, professional cooperatives, family farms and other development of animal husbandry, taking into account the development of traditional small farmers and retail livestock and poultry breeding, innovative “enterprise + family farm” “enterprise + cooperative” “enterprise + farmers” and other business models, improve the close interest linkage mechanism, give full play to the leading role of leading enterprises, and promote the realization of small farmers and the development of modern animal husbandry organic linkage.
Fourth, enhance the industry chain supply chain resilience and security level. Market monitoring and early warning should be strengthened, a monitoring and early warning system with global influence should be built, short-term and medium- and long-term reports should be regularly released, market assessments should be made, and contingency plans should be clarified. Promote the open socialization of market information data so that policy makers, producers, consumers, researchers and others can access effective information. Accelerate the cultivation of new industries and new models in the livestock industry to further extend the industrial chain, enhance the value chain and stabilize the supply chain. Innovate livestock insurance systems, strengthen the construction of animal disease prevention and control systems, and improve the policy toolbox for responding to unexpected and uncertain events.
Fifth, international trade and cooperation should be consolidated and expanded. According to the strength of the competitive ability, the development of “import” and “export” priority strategies by species. Continue to strengthen the existing international cooperation base and actively expand new trade channels. Cultivate livestock enterprises with global influence, support the advantageous livestock and poultry industries to “export” in a gradual manner, and enhance the ability to control the supply chain of the global livestock industry chain.
Author Contributions
Conceptualization, S.Z., L.J. and H.X.; methodology, S.Z., L.J. and H.X.; resources, S.Z., L.J. and H.X.; data curation, S.Z. and L.J.; writing—original draft preparation, S.Z., L.J. and H.X.; writing—review and editing, S.Z., L.J. and H.X.; visualization, S.Z., L.J. and H.X.; supervision, S.Z. and H.X.; project administration, S.Z. and H.X.; funding acquisition, S.Z. and H.X. All authors have read and agreed to the published version of the manuscript.
Funding
This research was funded by the National Social Science Fund of China (22CGL025), National Natural Science Foundation of China (72033009), Central Public-interest Scientific Institution Basal Research Funds (1610052023013), and the Agricultural Science and Technology Innovation Program (10-IAED-01-2023).
Institutional Review Board Statement
Not applicable.
Data Availability Statement
Data available on request from the authors.
Conflicts of Interest
The authors declare no conflict of interest.
References
- Wang, X. Q.; Li, D. F. . Study on the international environment and competitiveness of pig production. Chinese Rural Econ. 1998, 8, 48–55. [Google Scholar]
- Tang, L.; Wang, M. L.; Shi, Z. Z. International comparison of total factor productivity of Chinese meat sheep from the perspective of competitive advantage. Issu. Agric. Econ. 2019, 10, 74–88. [Google Scholar]
- Chinese Academy of Agricultural Sciences. China agricultural sector development report 2020. Beijing: China Agricultural Science and Technology Press 2020.
- Yu, M. Comparative advantages and international competitiveness of China’s livestock industry under the WTO framework. Econ. Rev. J. 2002, 3, 31–32. [Google Scholar]
- Xia, X. P.; Li, B. L. Analysis on the international competitiveness of China sheep and goat meat products. J. Int. Trade 2009, 8, 38–44. [Google Scholar]
- Cui, Y.; Mu, Y. Y.; Li, B. L. China’s mutton trade and factors analysis on its international competition power. Issu. Agric. Econ. 2009, 30, 94–99. [Google Scholar]
- Zhang, R. R.; Shen, X. M.; Wang, J. M. Analysis of the international competitiveness of China’s Chicken industry. Chinese Rural Econ. 2010, 7, 28–38+46. [Google Scholar]
- Liao, Y.; Zhou, F. M. An empirical study on the international competitiveness of pork products in China. Int. Econ. Trade Res. 2011, 27, 25–33. [Google Scholar]
- Gao, H. X.; Wang, M. L.; Shi, Z. Z. International competitiveness of China’s pig industry. J. Northwest A&F Univ. (Soc. Sci. Ed.) 2020, 20, 145–152. [Google Scholar]
- Cui, X.; Guo, L. J.; Li, F. Z. Grey correlation analysis of factors influencing for animal husbandry competitiveness in China. Guizhou Agric. Sci. 2015, 43, 124–128. [Google Scholar]
- Chen, H. P.; Zhang, Y. R.; Huang, B. K. An empirical study on factors affecting herbivorous animal husbandry competitiveness based on co-integration analysis: taking Gansu province as a case. J. Agric. Sci. Technol. 2016, 18, 192–199. [Google Scholar]
- Ma, X. P.; Wang, M. L. Competitiveness of China’s layer industry and its international comparison: based on perspective of industrial development. Agric. Econ. Manag. 2021, 6, 94–106. [Google Scholar]
- Liu, C. Y.; Wang, J. M.; Wang, Z. L.; Pei, L.; Xin, X. F. Research on the evaluation of international competitiveness of china’s hog industrycomparative analysis based on the perspective of trade and industrial development. Chinese J. Agric. Resour. Reg. Plan. 2022, 43, 29–39. [Google Scholar]
- Zhang, Z. H.; Ji, Y. F.; He, Z. J. Evolution in the spatio-temporal pattern on animal husbandry green development competitiveness in China. J. Agric. Sci. Technol. 2022, 24, 12–23. [Google Scholar]
- Zhang, W. B. International competitiveness of China’s dairy industry: an analysis based on RCA and diamond model. Issu. Agric. Econ. 2005, 11, 38–42. [Google Scholar]
- Yin, Z. Y.; Wang, K.; Felipe, I. de. International competitiveness and influencing factors analysis of Chinese pig breeding industry: based on the industrial chain perspective and the diamond model. J. Hunan Agric. Univ. (Soc. Sci. Ed.) 2016, 17, 26–33. [Google Scholar]
- Wang, B. B.; Xiao, H. F. Regional analysis on structure and competitiveness of China’s animal husbandry: based on shift-share analysis space model. Chinese J. Agric. Resour. Reg. Plan., 2021, 42, 142–148. [Google Scholar]
- Xu, S.; Yan, F. Z. A comparative analysis of pork’s international competitiveness in China. Res. Agric. Mod. 2011, 32, 518–522. [Google Scholar]
- Zhang, Z.; Qiao, J. An empirical analysis on international competitiveness of China’s pork products. J. Int. Trade 2011, 7, 39–48. [Google Scholar]
- Xie, J. W.; Du, H. M. Empirical analysis on the lnfluencing factors for the international competitiveness of live pias in Hunan. Econ. Geogr. 2012, 32, 140–144. [Google Scholar]
- Yu, F. W.; Huang, X.; Wang, G. L. High-quality development of animal husbandry: theoretical lnterpretation and realization path. China Rural Econ. 2021, 4, 85–99. [Google Scholar]
- Wang, M. L.; Li, P. C.; Ma, X. P. The influence of scale structure adiustment on the hich-guality development of animal husbandry and its path optimization: an analysis from the perspective of pig breeding scale. China Rural Econ. 2022, 3, 12–35. [Google Scholar]
- Hu, H.; Jiang, G. H.; Ge, Y. High-auality development of chinese pig breeding industry: realistic needs connotation features and path selection. Issu. Agric. Econ. 2022, 12, 32–44. [Google Scholar]
- Wang, J. N.; Xu, Z. C.; Yang, J. Scale development model of animal husbandry in China: from an environmental preservation point of view. Issu. Agric. Econ. 2012, 8, 13–18. [Google Scholar]
- Chen, W. S.; Guan, L.; Huang, R. L.; Zhang, M. J.; Liu, H. N.; Hu, Y. L.; Yin, Y. L. Sustainable development of animal husbandry in China. Bull. Chinese Acad. Sci. 2019, 34, 135–144. [Google Scholar]
- Xiong, X. Z.; Yang, C.; Ma, X. P. Situation of China’s animal husbandry development and high-quality development strategy selection. J. Agric. Sci. Technol. 2022, 24, 1–10. [Google Scholar]
- Wang, M. L. China’s livestock industry development:achievements, experiences and future trends. Issu. Agric. Econ. 2018, 8, 60–70. [Google Scholar]
- Li, Y. The wind is strong broad prospects: review and prospect of animal husbandry machinery market. Contemp. Agric. Mach. 2022, 2, 30–31. [Google Scholar]
- Zhang, H. G. Animal husbandry machinery: will it rebound after the big fall. Agric. Mach. Mark. 2022, 6, 18–21. [Google Scholar]
- Hu, X. D.; Wang, M. L. The causes and enlightenments of U.S. hog production and price fluctuation. Issu. Agric. Econ. 2013, 9, 98–109+112. [Google Scholar]
- Hu, X. D.; Shi, Z. Z.; Zhang, H. C. China’s hog market regulation and control policy: historical evolution and future choices. Issu. Agric. Econ. 2022, 4, 4–14. [Google Scholar]
- Shi, Z. Z.; Hu, X. D. Epidemic shock, policy regulation, and China’s hog market price volatility. Res. Agric. Mod. 2023, 44, 130–141. [Google Scholar]
- Shi, Z. Z.; Hu, X. D. Analysis of supply and demand and its policy effects in China’s hog market. J. Huazhong Agric. Univ. (Soc. Sci. Ed.) 2022, 4, 104–115. [Google Scholar]
Figure 1.
China’s livestock powerhouse index and its ranking.
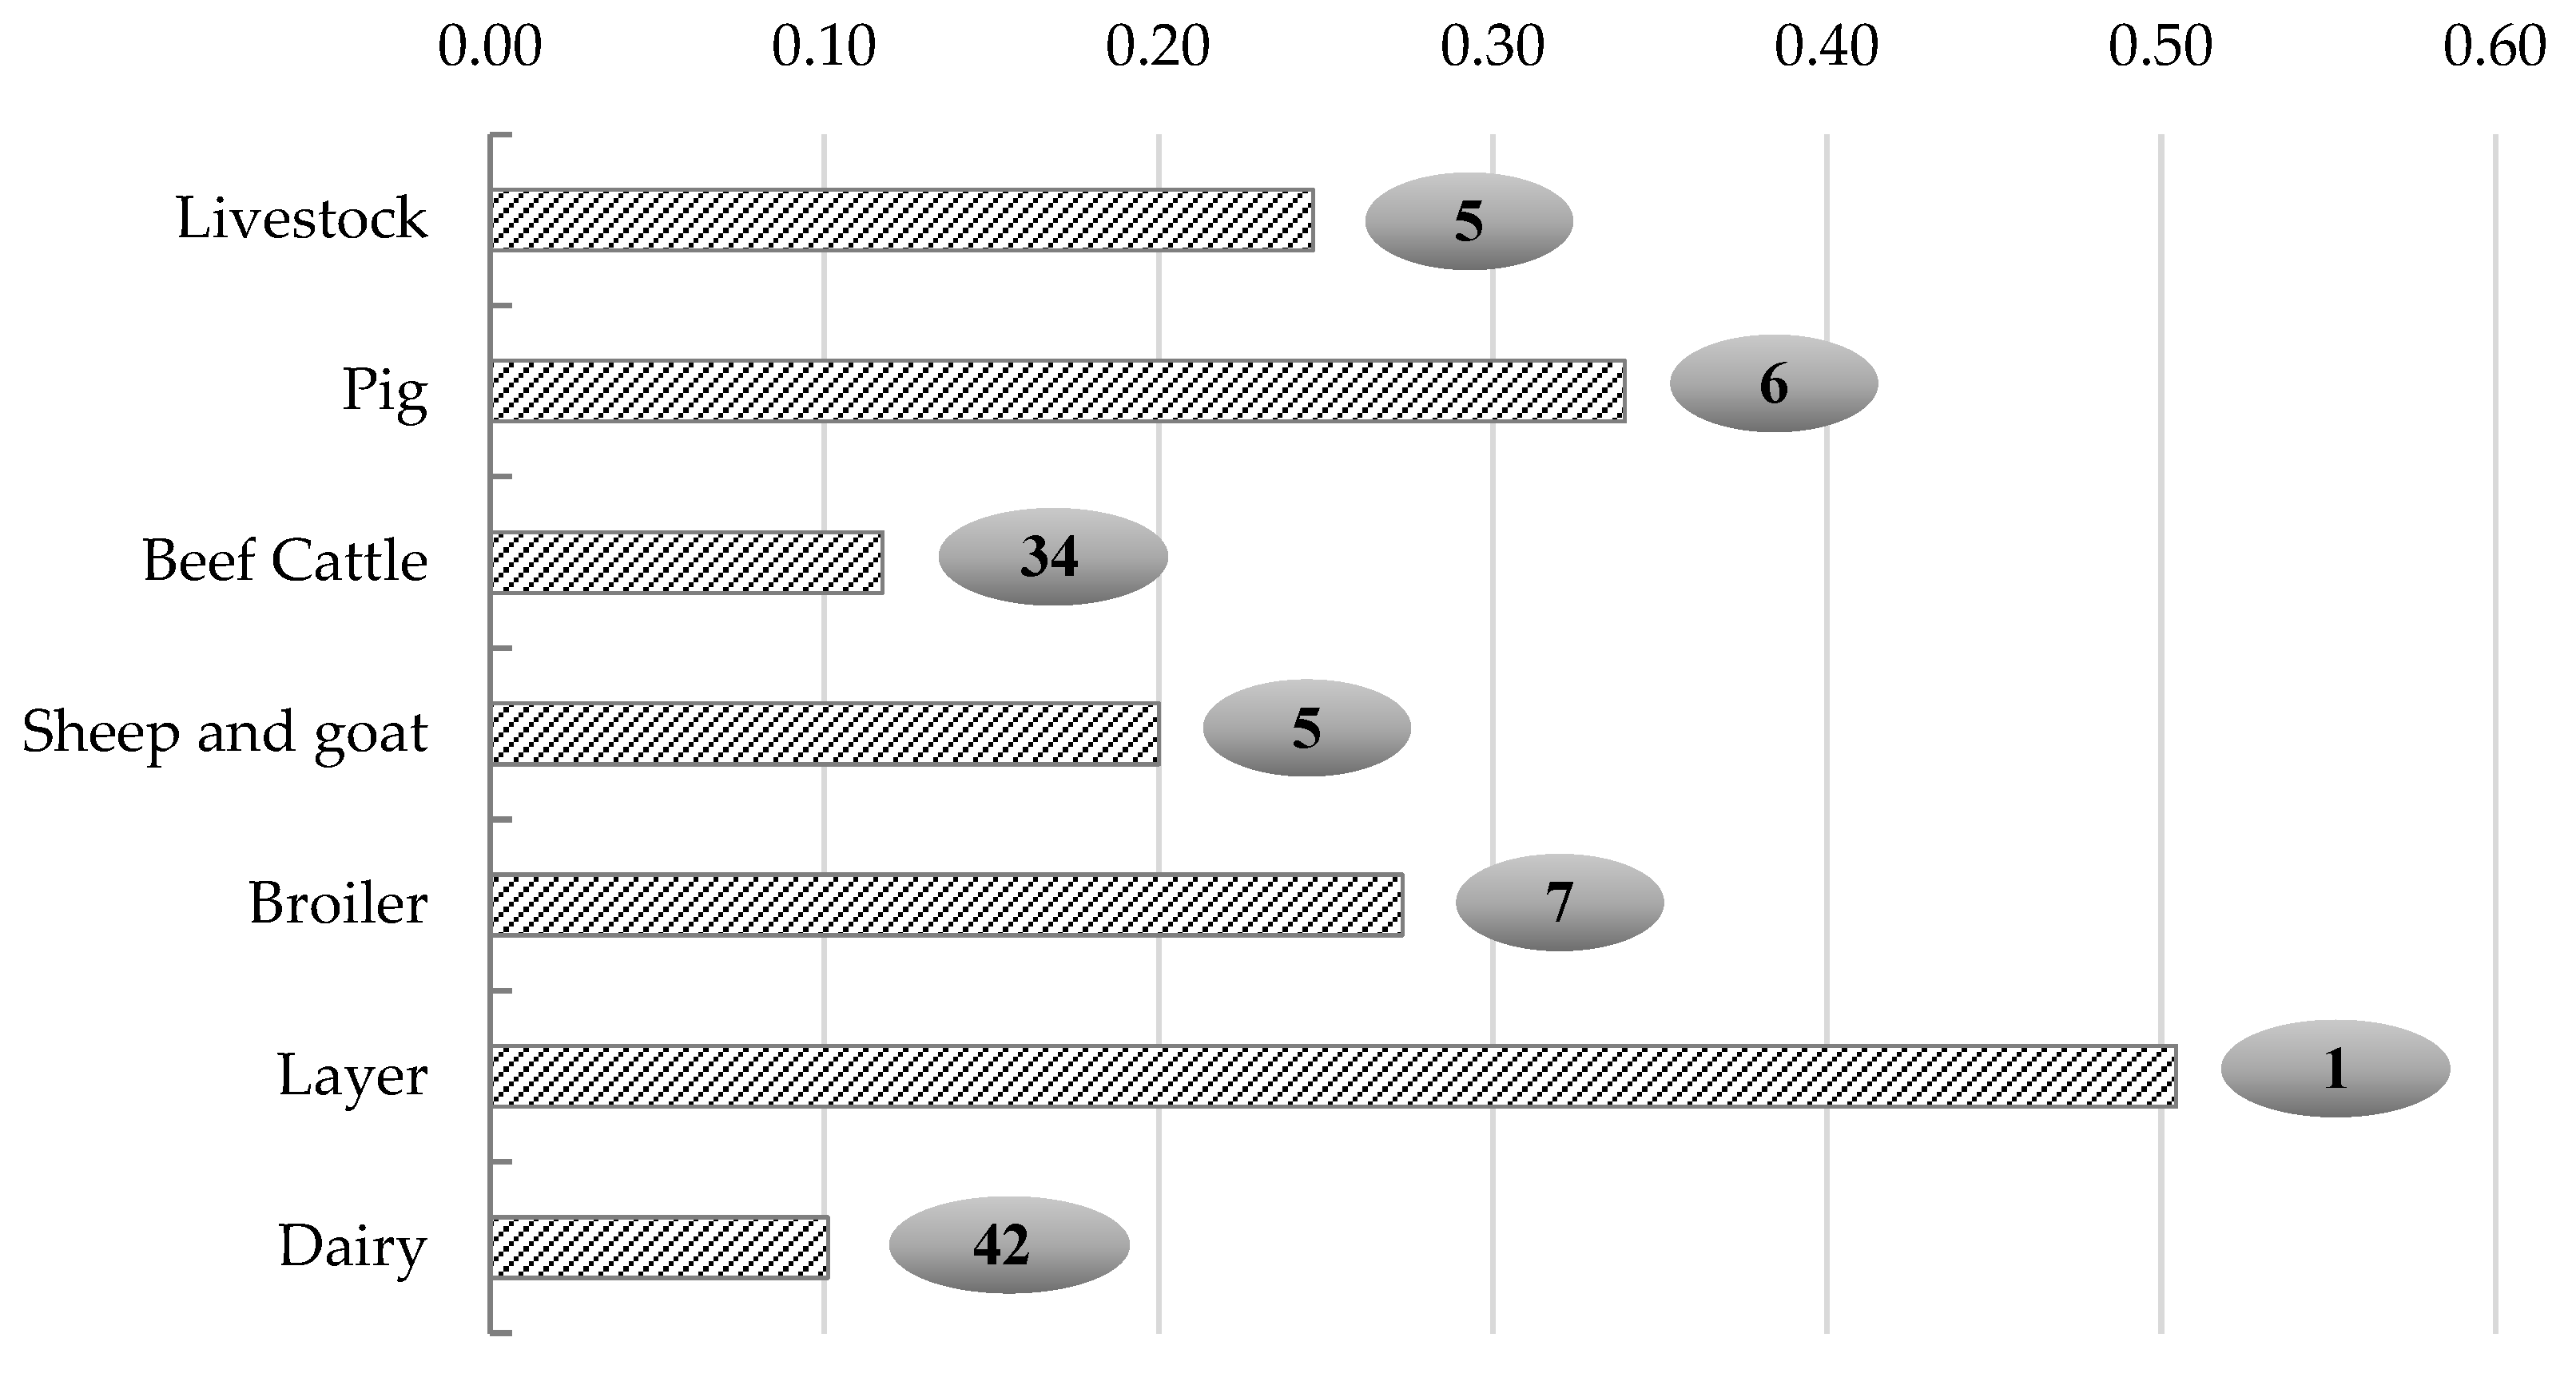
Table 1.
Evaluation index system of livestock powerhouse.
| Indicators | Unit | Calculation method | |
|---|---|---|---|
| Supply security | Global share | % | Domestic livestock production/Global livestock production |
| Per capita possession | kg | Livestock production/Total population | |
| Self-sufficiency rate | % | Livestock domestic production/(Domestic production + Net imports) | |
| Scientific and technological support | Slaughter rate | % | Slaughter/Inventory |
| Carcass weight (yield) | kg/head | Livestock production/Slaughter (livestock production/Inventory) | |
| Agricultural labor productivity | USD/person | Value added in agriculture/Employment in agriculture | |
| Industrial resilience | Comparative benefits | - | Producer price of livestock products/Producer price of feed grain |
| Resource carrying capacity | Head/ha | Livestock inventory/Agricultural land | |
| Feed grain self-sufficiency rate | % | Domestic production of feed grain/(Domestic production + Net imports) | |
| International trade | International market share | % | Domestic exports of livestock products/World exports of livestock products |
| Trade competitiveness index | - | (Exports of livestock products - Imports of livestock products)/(Exports of livestock products + Imports of livestock products) | |
| Revealed comparative advantage index | - | (Domestic exports of livestock products/World exports of livestock products)/(Domestic exports of agricultural products/World exports of agricultural products) | |
Table 2.
Evaluation results of livestock powerhouse.
| Livestock | Pig | Beef cattle | Sheep and goat | Broiler | Layer | Dairy | |||||||
|---|---|---|---|---|---|---|---|---|---|---|---|---|---|
| Country | Index | Country | Index | Country | Index | Country | Index | Country | Index | Country | Index | Country | Index |
| United States | 0.4521 | Spain | 0.6049 | United States | 0.4727 | New Zealand | 0.7489 | Brazil | 0.6646 | China | 0.5045 | New Zealand | 0.7619 |
| Brazil | 0.3556 | United States | 0.4431 | Brazil | 0.4703 | Australia | 0.5163 | United States | 0.5592 | United States | 0.4680 | United States | 0.3678 |
| New Zealand | 0.3439 | Netherlands | 0.4175 | Uruguay | 0.4320 | Ethiopia | 0.2048 | Poland | 0.4271 | Turkey | 0.4088 | India | 0.3210 |
| Netherlands | 0.2635 | Germany | 0.3964 | Australia | 0.4031 | Uruguay | 0.2002 | Hungary | 0.3137 | Panama | 0.2841 | Netherlands | 0.2938 |
| China | 0.2462 | Canada | 0.3430 | New Zealand | 0.3694 | China | 0.2002 | Belarus | 0.2998 | Malaysia | 0.2720 | Ireland | 0.2926 |
| Belarus | 0.2438 | China | 0.3396 | Paraguay | 0.3136 | Kenya | 0.1689 | Netherlands | 0.2983 | Belarus | 0.2479 | Belarus | 0.2901 |
| Poland | 0.2338 | Belgium | 0.3331 | Ireland | 0.3096 | North Macedonia | 0.1686 | China | 0.2730 | Germany | 0.2475 | Germany | 0.2653 |
| Argentina | 0.2138 | Brazil | 0.2758 | Argentina | 0.3011 | Pakistan | 0.1633 | Brunei | 0.2678 | Japan | 0.2412 | Luxembourg | 0.2356 |
| Australia | 0.2075 | Austria | 0.2463 | Nicaragua | 0.2764 | India | 0.1495 | Turkey | 0.2647 | India | 0.2239 | France | 0.2342 |
| India | 0.1969 | Ireland | 0.2202 | Canada | 0.2341 | Moldova | 0.1429 | Ukraine | 0.2575 | Portugal | 0.2164 | Argentina | 0.2223 |
| Germany | 0.1863 | Hungary | 0.2143 | Brunei | 0.2139 | Spain | 0.1398 | Argentina | 0.2551 | Ukraine | 0.1929 | Uruguay | 0.2119 |
| Canada | 0.1855 | Italy | 0.2087 | Netherlands | 0.2057 | Kazakhstan | 0.1377 | Thailand | 0.2439 | Brazil | 0.1833 | Belgium | 0.2102 |
| Turkey | 0.1855 | Chile | 0.1921 | Poland | 0.2047 | Greece | 0.1373 | Chile | 0.2236 | Brunei | 0.1832 | Poland | 0.2008 |
| Hungary | 0.1769 | France | 0.1913 | Belarus | 0.2028 | Kyrgyzstan | 0.1361 | Australia | 0.2057 | Argentina | 0.1829 | Australia | 0.1931 |
| Ukraine | 0.1690 | Russia | 0.1866 | Mexico | 0.1890 | Serbia | 0.1344 | New Zealand | 0.1901 | Morocco | 0.1825 | Czech Republic | 0.1855 |
| Spain | 0.1667 | Poland | 0.1851 | India | 0.1798 | Myanmar | 0.1290 | Russia | 0.1857 | Fiji | 0.1774 | Turkey | 0.1805 |
| France | 0.1608 | Belarus | 0.1591 | Pakistan | 0.1769 | Armenia | 0.1290 | Slovenia | 0.1852 | Thailand | 0.1744 | Kyrgyzstan | 0.1699 |
| Uruguay | 0.1602 | Korea | 0.1562 | Namibia | 0.1660 | Georgia | 0.1278 | France | 0.1612 | Pakistan | 0.1627 | Saudi Arabia | 0.1659 |
| Ireland | 0.1562 | Thailand | 0.1465 | Bolivia | 0.1535 | Argentina | 0.1182 | India | 0.1554 | Barbados | 0.1616 | Austria | 0.1649 |
| Paraguay | 0.1521 | Fiji | 0.1389 | South Africa | 0.1530 | South Africa | 0.1181 | Israel | 0.1516 | Bosnia and Herzegovina | 0.1512 | Slovenia | 0.1633 |
Table 3.
Comparison of major countries’ livestock powerhouse indexes.
| Country | Livestock | Pig | Beef cattle | Sheep and goat | Broiler | Layer | Dairy |
|---|---|---|---|---|---|---|---|
| Australia | 0.2075 | 0.0863 | 0.4031 | 0.5163 | 0.2057 | 0.1118 | 0.1931 |
| Brazil | 0.3556 | 0.2758 | 0.4703 | 0.0339 | 0.6646 | 0.1833 | 0.1199 |
| Germany | 0.1863 | 0.3964 | 0.1264 | 0.0480 | - | 0.2475 | 0.2653 |
| Russia | 0.1443 | 0.1866 | 0.0837 | 0.0575 | 0.1857 | 0.1271 | 0.1206 |
| France | 0.1608 | 0.1913 | 0.1455 | 0.0926 | 0.1612 | - | 0.2342 |
| Korea | 0.0957 | 0.1562 | 0.0651 | 0.0198 | 0.0870 | 0.1152 | 0.0786 |
| Canada | 0.1855 | 0.3430 | 0.2341 | 0.0402 | 0.1387 | 0.1484 | 0.1302 |
| United States | 0.4521 | 0.4431 | 0.4727 | 0.0368 | 0.5592 | 0.4680 | 0.3678 |
| Japan | 0.1022 | 0.0714 | 0.0974 | 0.0210 | 0.0834 | 0.2412 | 0.0906 |
| New Zealand | 0.3439 | 0.0589 | 0.3694 | 0.7489 | 0.1901 | 0.1461 | 0.7619 |
| India | 0.1969 | 0.0964 | 0.1798 | 0.1495 | 0.1554 | 0.2239 | 0.3210 |
| China | 0.2462 | 0.3396 | 0.1174 | 0.2002 | 0.2730 | 0.5045 | 0.1011 |
Disclaimer/Publisher’s Note: The statements, opinions and data contained in all publications are solely those of the individual author(s) and contributor(s) and not of MDPI and/or the editor(s). MDPI and/or the editor(s) disclaim responsibility for any injury to people or property resulting from any ideas, methods, instructions or products referred to in the content. |
© 2023 by the authors. Licensee MDPI, Basel, Switzerland. This article is an open access article distributed under the terms and conditions of the Creative Commons Attribution (CC BY) license (http://creativecommons.org/licenses/by/4.0/).
Copyright: This open access article is published under a Creative Commons CC BY 4.0 license, which permit the free download, distribution, and reuse, provided that the author and preprint are cited in any reuse.


