
Submitted:
25 July 2023
Posted:
27 July 2023
You are already at the latest version
Abstract
Polymeric microparticles of polyethyleneglycol-polylactic acid-co-glycolic acid (PEG-PLGA) are widely used as drug carriers for a variety of applications due to their unique characteristics. Herein, we developed a novel method for the synthesis of uniformly sized microparticles via coaxial flow-phase separation. The study evaluated the effect of various process parameters on microparticle size and polydispersity including polymer concentration, stirring rate, surfactant concentration, and the organic/aqueous phase flow rate and volume ratio. The results demonstrated that stirring rate and polymer concentration had the most significant impact on the mean particle size and distribution whereas surfactant concentration had the most substantial impact on the morphology of particles. Several microparticle formulations yielding particle sizes in the range of (5-50 µm), morphology, and concentration were synthesized as a demonstration of the tunability and scalability of this method. Notably, by controlling the process parameters microparticles of less than ~ 7 μm could be made using polymer concentrations varying by an order of magnitude. Finally, we demonstrated the tunability and scalability of this method by showing a 10-fold increase in encapsulation efficiency, a 3-fold increase in drug loading of a model hydrophilic drug, and modified release kinetics in microparticle formulations of comparable sizes but different polymer concentrations.
Keywords:
Microparticles
; PEG
; PLGA
; coaxial flow
; phase separation
; drug delivery
1. Introduction
Polymeric microparticles (MPs) are highly regarded as suitable carriers for a wide range of drug delivery applications due to their unique characteristics. Among the different polymeric materials available, polylactide-co-glycolide (PLGA) and poly(ethylene glycol)-poly(lactide-co-glycolide) (PEG-PLGA) copolymers have been widely recognized as ideal options for producing microparticles, owing to their biocompatibility and FDA approval [1,2,3]. While PLGA offers the advantage of controllable drug release due to its favorable degradation properties [3], PEG due to its hydrophilicity and inert surface charge can reduce particle aggregation, prolong circulation time, improve cellular uptake, and serve as an anchor for ligand attachment [4]. As a result of these additional benefits, PEG-PLGA is highly desirable for the synthesis of particulate systems for drug delivery applications [5,6].
To date, several methods exist to fabricate PEG-PLGA polymeric microparticles, the most common being emulsion solvent evaporation, spray drying, electrospray, phase separation, and microfluidics method [7,8]. Depending on the fabrication technique, MPs exhibit distinct size, polydispersity, and morphological characteristics which are crucial to ensuring the stability, encapsulation efficiency, loading capacity, and release of drugs from microparticles [9]. As a result, the biomolecule to be encapsulated and the application for which the MPs are intended remain dependent on the technique chosen for MP synthesis [10,11].
While the microfluidic technique allows the fabrication of monodispersed polymeric MPs with precisely controlled size and morphology, its reliance on expensive and complicated instruments makes it challenging for large-scale production [9,12]. On the contrary, despite being quick, easy, and highly scalable, spray drying, and solvent extraction and evaporation methods (single and double emulsion) are constrained by their inability to tune and control particle size [11]. As a result, these methods often produce polydisperse particles with irregular morphology, non-uniform size distribution, and low drug loading [5,9,12,13]. Thus, the development of a simple, quick, low-cost, and scalable technique for synthesizing polymeric microparticles with desirable characteristics holds much promise in expanding the use of particulate systems for drug delivery application.
As opposed to emulsification and solvent extraction-based techniques, phase separation demonstrates to be a simple and tunable method for the synthesis of polymeric microparticles with high encapsulation efficiency and narrow size distribution [14]; however, achieving high scale production is difficult and generating optimal uniform and monodisperse particle size remains a challenge due to the tendency of coarcevate formation caused by particle aggregation [11]. Hence this study presents a novel approach to fabricate PEG-PLGA microparticles of tunable sizes with improved monodispersity and size distribution while demonstrating scalability of particle production using a modified phase separation method based on a co-flow technique.
We show herein that by varying fabrication parameters such as polymer concentration, stirring rate, surfactant flow rate and concentration, the choice of organic solvent, and the volume ratio of the organic phase and aqueous phase, microparticles of tunable sizes between 5 µm – 50 µm as well as of different morphologies can be synthesized for specific applications. Moreover, the scalability of this method was demonstrated by producing microparticles of comparable sizes yet different concentrations through adjustments of either the polymer concentration in the organic phase or volume ratio of the organic phase to the aqueous phase; a testament to this being evident in the increase of drug loading and encapsulation efficiency of rhodamine 6G, a model hydrophilic drug. Overall, this study elucidates the influence of fabrication and process parameters on the characteristics of microparticles thereby offering a framework for expanding the applicability of the coaxial flow-phase separation method for producing polymeric microparticles with desirable characteristics for specific drug delivery applications.
2. Materials and Method
2.1. Materials
Poly (ethylene glycol)-methyl ether-block -poly (lactide-co-glycolide) (PEG-PLGA50:50, MnPEG 2000 Da and 10,000 Da MnPLGA), dimethyl sulfoxide (DMSO), and coumarin 6 dye were purchased from Sigma Aldrich (St. Louis, MO, USA). Rhodamine 6G dye, dichloromethane (DCM), polyvinyl alcohol (PVA) (87-89% hydrolyzed, high molecular weight), acetonitrile, phosphate buffer saline (PBS), polyvinyl chloride (PVC) tubing, syringes (glass and plastic), syringe needles, and polytetrafluoroethylenes (PTFE) based consumables such as syringe filters (0.45μm), evaporating dish, and magnetic stirring bars were obtained from Fisher Scientific. All other chemicals and reagents used in this study were of analytical grade.
2.2. Assembly and assessment of the coaxial needle construct
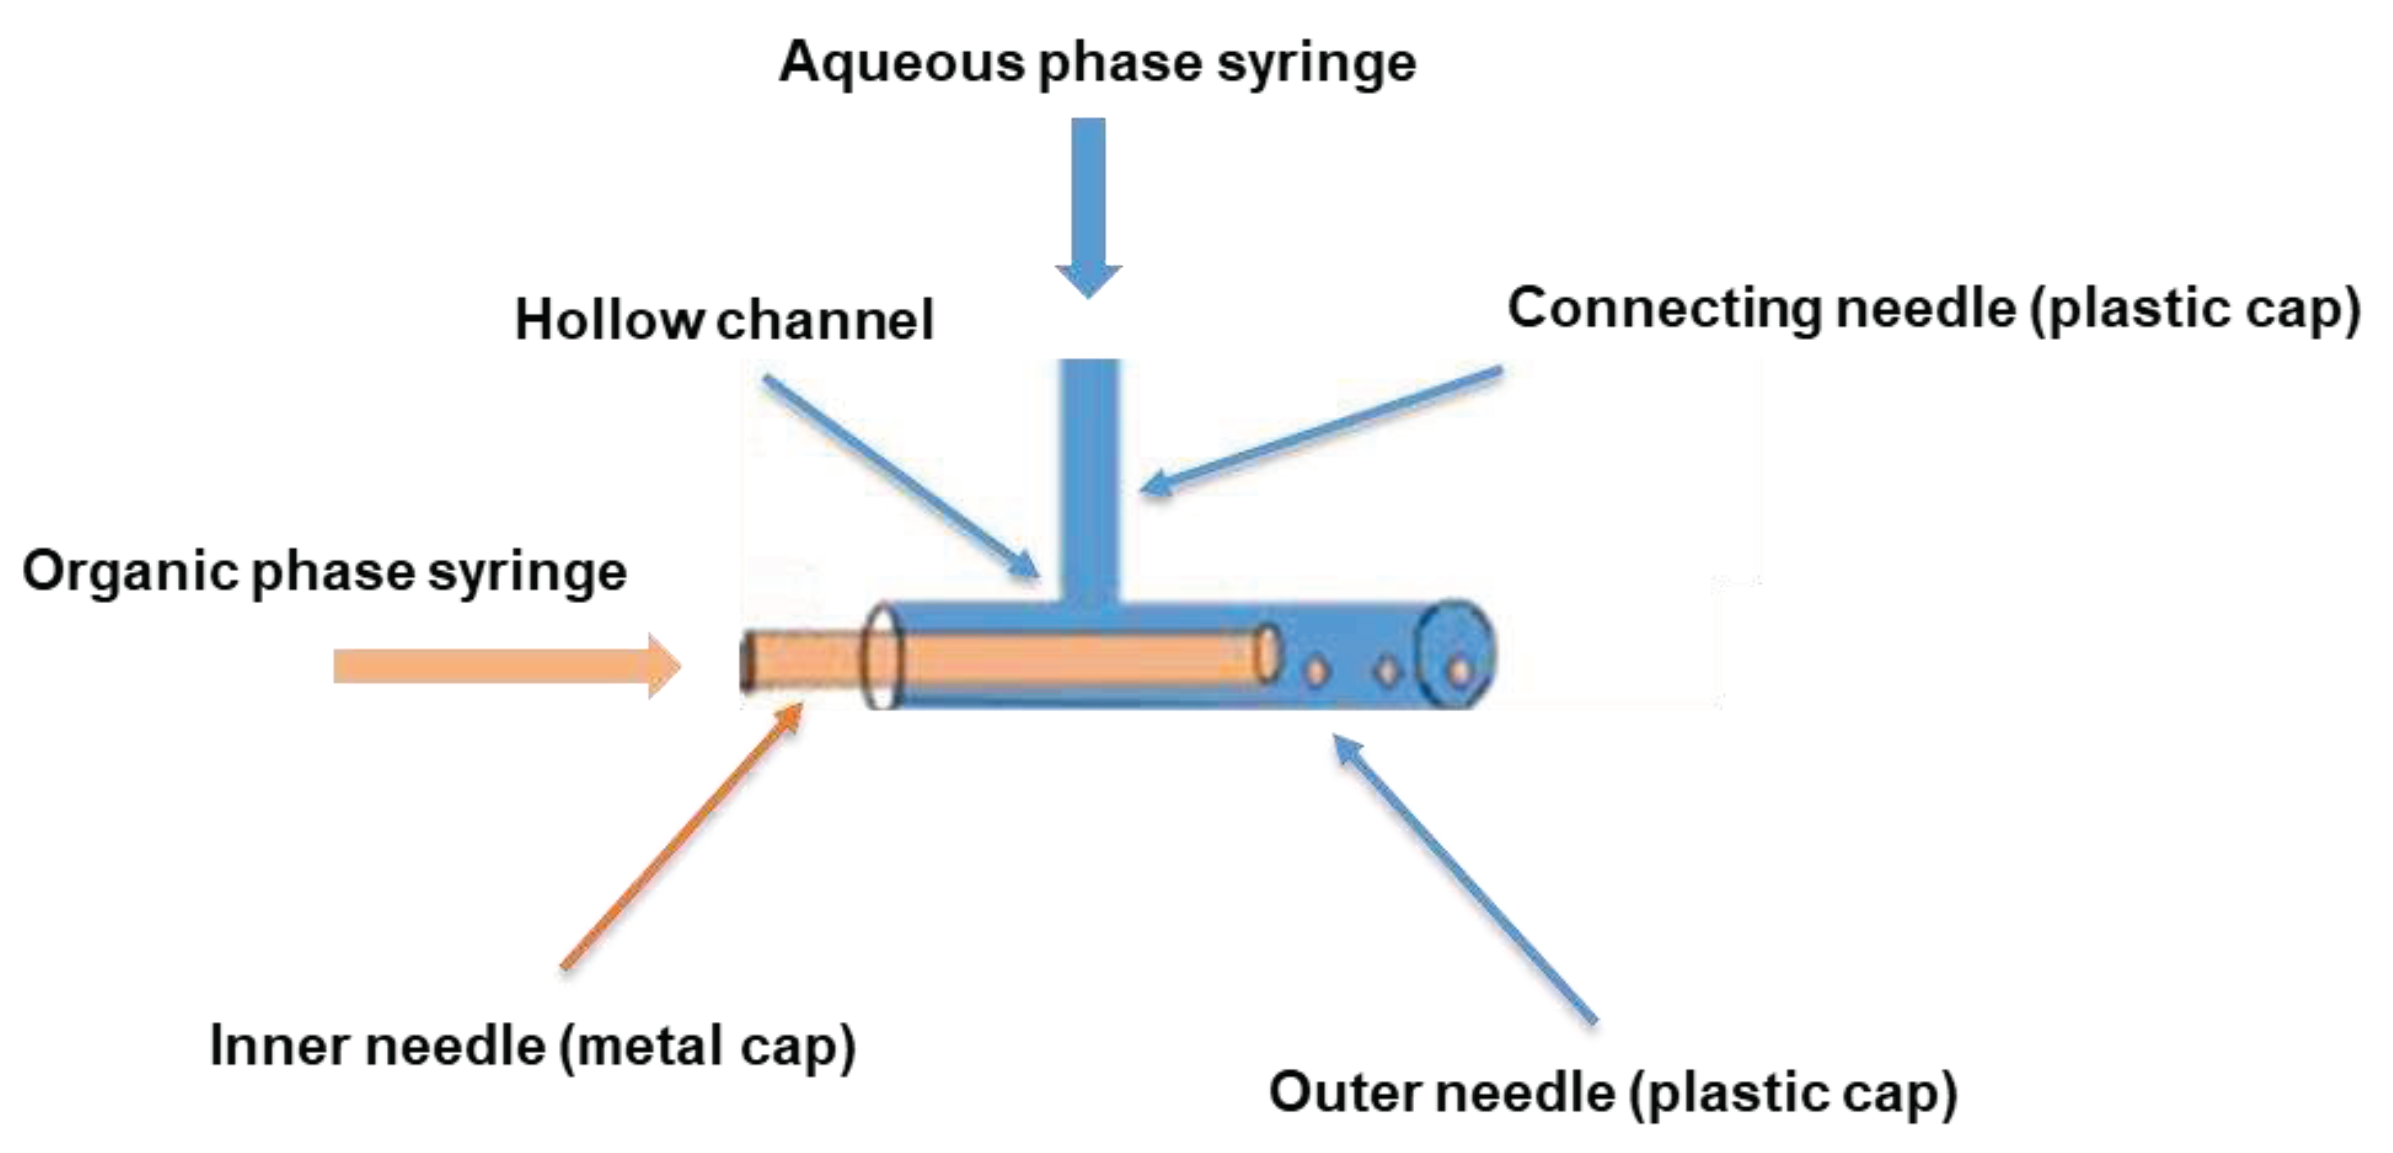
Typical of all co-flow-based droplet formation devices, the design of our coaxial needle construct was based on a co-flow geometry to ensure the parallel flow of the dispersed and continuous phases to each other [15,16]. As shown in Scheme 1, the assembly of our simple and cost-effective construct was achieved using three blunt-tip syringe needles with a length of 1.5 inches each. Two of these needles were 16G needles with plastic-based luer ends, while the third needle was a 30G Hamilton needle with a luer end made of stainless steel. The plastic base of one of the 16G needles was punctured and carefully drilled to create a uniformly sized hollow channel using a sharp-tipped 16G needle to allow the flow of the aqueous phase. Subsequently, the second blunt 16G needle was inserted gently through the generated hollow channel in the first needle to establish a connection with the first needle. The blunt 30G Hamilton needle was then inserted centrally along the main axis of the first 16G needle bearing the orifice. To ensure a secure and concentric configuration, the resulting assembly was firmly held together using either parafilm or an appropriate adhesive like super glue. In this configuration, the slender end of the stainless-steel base of the inner 30G needle rested firmly on the broader end of the plastic base of the orifice bearing outer 16G needle.
To assess the functionality and stability of the coaxial needle construct, a simultaneous flushing procedure was conducted using DI water. This involved the utilization of a 20 ml plastic syringe for the connecting needle and a 0.5 ml Hamilton glass syringe for the inner needle. The efficacy and stability of the construct were verified through the consistent unidirectional flow of deionized water via the blunt tip of the outer needle into a collecting beaker. Notably, no discernible instances of leakage or blockages impeding the flow were observed, thus affirming the construct’s effectiveness and stability.
2.3. Preparation of PEG-PLGA microparticles
All microparticles were synthesized using a phase separation method based on coaxial needle technology. In detail, the two phases organic and aqueous were prepared independently and stored in clean containers. The organic phase consisted of PEG-PLGA polymer dissolved at a desired concentration in dichloromethane (DCM). An aqueous phase consisted of polyvinyl alcohol (PVA) in deionized (DI) water. The PVA solution was made by dissolving the desired amount of PVA in boiling water to obtain a homogenous solution. Upon cooling the solution was centrifuged (100xg, 5 mins) and/or filtered through a 0.45μm syringe filter with the help of a syringe pump to remove any particulate matter. The glass syringe containing 0.1 ml of organic phase was then placed on a syringe pump (New Era Pump Systems, Inc. in Farmingdale, NY) and connected to the concentrically fixated stainless-steel end of the coaxial needle. A 20 ml plastic syringe filled with aqueous phase was connected to the female luer end of the PVC tubing and placed on a second syringe pump. A complete assembly of the setup was achieved by connecting the male luer end of the PVC tubing to the plastic end of the coaxial needle and laterally inserting the blunt tip into 16G orifice through lower end of a PTFE evaporating dish filled with 5 ml of PVA solution. Unless stated otherwise all microparticles were made by setting the flow rate at 0.1ml/hr for the organic phase and 20 ml/hr for the aqueous phase. The microparticles generated were collected in a PVA bath in a PTFE evaporating dish. The emulsion was constantly stirred under a magnetic stirrer at a predefined rate until both volumes were completely injected into the evaporation dish. Following this, stirring was continued for another hour to ensure complete evaporation of the DCM and solidification of the synthesized microparticle. To remove any residual PVA, the microparticle suspension was collected in a 50 ml falcon tube and washed twice with DI water via centrifugation at (100xg, 5 mins). Afterwards, the microparticles were transferred into a 2 ml microcentrifuge tube and subjected to a final wash before resuspending the eventual microparticle pellet in 0.5 ml of DI water for further studies. For fabrication of microparticles, we conducted a preliminary analysis of the type of stirrer plate and magnetic stir bar size to be used across all runs.
Different process parameters (Table 1) were varied to assess the effect on microparticles sizes and polydispersity. A comprehensive description of the selected process parameters is shown in Table 1. Each of these runs involved selectively varying one parameter while maintaining all other fabrication parameters constant, in accordance with the reference formulation. The reference formulation was made using 0.1% w/v of organic phase, 5% w/v aqueous phase, organic-aqueous phase volume ratio (PVR) of 0.005% v/v, a flow rate 0.1 ml/hr and 20 ml/hr for the organic and aqueous phases and a constant stirring rate of 1000 RPM.
2.3. Preparation of dye loaded PEG-PLGA microparticles
Two dyes a hydrophilic rhodamine 6G and hydrophobic coumarin 6 were used as model drugs for fabrication of drug loaded microparticles. Coumarin and rhodamine microparticles, hereafter referred to as Coum6 MP and Rho6G MP, were synthesized by adding 1μl of 2 mg/ml of the respective dye solution to 100 μl of the organic phase (0.1% w/v PEG-PLGA in DCM). Following this, the resulting organic phase was placed in a glass syringe. The microparticle synthesis method here onward was similar as described above.
The drug loading and encapsulation efficiency was determined by dissolving freeze-dried and pre-weighed dye loaded microparticles in 1 ml of ethanol for coum6 MP and 1 ml of DMSO for Rho6G MP. The amount of dye release was determined spectrophotometrically at 540 nm (rhodamine 6G) and 460 nm (coumarin 6) respectively [17,18,19] against standard calibration curves of the known concentration of the dyes. Encapsulation efficiency (EE) determination was achieved by the ratio of the mass of encapsulated dye (MDenc) to the initial mass of the dye added into the organic phase during the formulation (MDinit) while drug loading (DL) was calculated as the ratio of the mass of encapsulated dye (MDenc) to the total mass of the dried microparticle (MPtot) as depicted in the two equations below.
2.4. Characterization of PEG-PLGA microparticles
The morphology and size of the microparticles were observed and determined using an inverted microscope (Leica DMI 6000). Briefly, samples were prepared for imaging by pipetting 10 μl of the microparticle suspension in DI water on a microscope glass slide and images were acquired in brightfield mode using a 20X objective. The dye loaded microparticles were imaged in both brightfield and fluorescent mode. The mean size representing the average diameter of over 200 analyzed microparticles per three independent batches of the same formulation were determined using the Image J (Fiji) open-source image-processing software. The scales of the images were standardized by measuring the distance in pixels of the scale bar provided by the Leica software, inputting the known distance and units, and adjusting the pixel aspect ratio. The ImageJ processed images were measured by zooming into the particles, drawing a diameter line across the microparticles. As an index of the broadness or dispersity of the particle size distribution, the percent coefficient of variation (CV) of all the analyzed particles was calculated as the ratio of the standard deviation (SD) of the distribution to the mean particle size (SD/mean) *100.
2.5. In vitro release of rhodamine 6G from dye loaded microparticles
Freeze dried R6G loaded microparticles were suspended in 1 ml of PBS (0.01M, pH of 7.4) in microfuge tubes. The tubes were then placed in a shaker incubator (C24-New Brunswick Scientific) at 37 °C with constant shaking at 90 rpm. Aliquots of 1 ml were collected at regular intervals by centrifuging at 8000 rpm for 5 minutes and collecting the supernatant as previously described [20]. The microparticles were resuspended in the same amount of fresh PBS. The amount of dye release at each interval in the collected supernatant was analyzed using a UV-vis spectrophotometer (Evolution 60) at 530 nm [19]. The corresponding concentration values were calculated by reference to a standard calibration curve generated in the same release medium. Prior to measurements, instrument calibration and baseline collection were performed. Each microparticle formulation was analyzed in triplicate using a black walled quartz micro cuvette (0.7 ml, 10 mm).
2.6. Statistical Analysis
The results in this study were analyzed and expressed in terms of the mean ± standard deviation of the distribution using GraphPad Prism 9.5.1 (GraphPad Software, Inc. San Diego, CA). Unless explicitly mentioned, all experiments related to microparticle size measurements were conducted using a minimum of three independent batches. To identify statistically significant differences, both batch-to-batch variations in the reference formulation and differences among various formulation conditions for the same tested process parameter were assessed using Student’s t-test and one-way ANOVA by considering a p-value less than 0.05 as indicative of significance.
3. Results and Discussion
3.1. Optimization of experimental design and mechanical parameters
Prior to the establishment of the reference formulation and synthesis of microparticles, the impact of mechanical effect as a crucial process parameter on the characteristics of microparticles was first studied. Generally, fabrication methods that rely on phase separation to generate emulsion droplets for microparticle synthesis, require mechanical agitation, such as stirring, homogenization or sonication, to create small droplets dispersed in the aqueous phase [21]. Notably, rotor type has been reported to significantly impact the size and distribution of particles as different rotors requires specific motors, subsequently influencing the input energy and performance of the stirrer [22,23]. To investigate this, two magnetic stirrers, the RT Basic Series Magnetic Stirrer, Thermo Scientific™ and the Fisherbrand™ Isotemp™ Hot Plate Stirrer, were used for the synthesis of microparticles based on the same formulation conditions. Of interest, while very little difference in morphology was seen for microparticles produced by these two magnetic stirrers, the size of the particles was observed to be impacted as shown in (Figure S1) with the RT Basic Series Magnetic Stirrer identified to produce microparticles with smaller and narrow size distribution (9.3 ± 4.0 vs 6.8 ± 3.1 μm). This difference in size despite maintaining all parameters constant, could be due to the individual difference in performance of the magnetic stirrers owing to their respective design, top plate material, wattage requirement, and type of motor. Another process parameter that was investigated was the size of the magnetic stir bar. As indicated in (Figure S1), an inverse correlation between stir bar size and particle average diameter was observed with the larger stir bar of length 25.4 mm and diameter 8 mm resulting in a smaller microparticle size and narrow distribution as compared to the smaller stir bar (length and diameter, 12.7 mm and 8mm) also tested for the same formulation. This resulting difference in size and particle distribution could be attributed to the differences in vortex flow intensity as larger magnetic stir bar ensures an appropriate ratio of stir bar length to beaker diameter. Subsequently, influencing the generation of a higher vortex flow intensity to facilitate a more vigorous agitation and stronger shear stress necessary to break down large droplets and prevent the coacervation of droplets as hypothesized in the literature [24]. Thus, the larger stir bar and the RT Basic Series Magnetic Stirrer, Thermo Scientific™ was used for the synthesis of the reference formulation and all subsequent microparticle formulations. This selection was also influenced by the wider range of RT Basic Series stirrer (150-2500 rpm) as compared to the Fisherbrand™ Isotemp™ Hot Plate Stirrer which is limited to 1500 rpm. Lastly, we also studied the impact of the diameter of the inner diameter of the co-axial needle as this will influence the size of droplet generated. As expected [25], increasing the inner needle diameter (24 G vs 30G for reference formulation) led to a small yet statistically significant increase in the microparticle size and polydispersity (Figures S1.1 and S1.2-D).
3.2. Preparation and characterization of reference formulation.
In this study, PEG-PLGA microparticles were successfully prepared by a modified phase separation method using a coaxial needle resulting in co-flow geometry. Since our main objective is to investigate the impact of the individual fabrication parameters on the characteristics of microparticles synthesized via this method, we sought to first prepare microparticles based on a reference formulation against which all other subsequent microparticles formulation were compared. Optical microscopy characterization of these particles revealed a uniform spherical morphology for all microparticles, with a normal particle distribution and an average size of 6.7 ± 3.1 μm as shown in Figure 1 and Table 2. Notably, no statistically significant difference was observed upon analyzing over 200 particles across three independent batches thus emphasizing the reproducibility and feasibility of this method.
3.3. Influence of process parameters on microparticles characteristics
3.3.1. Effect of stirring rate
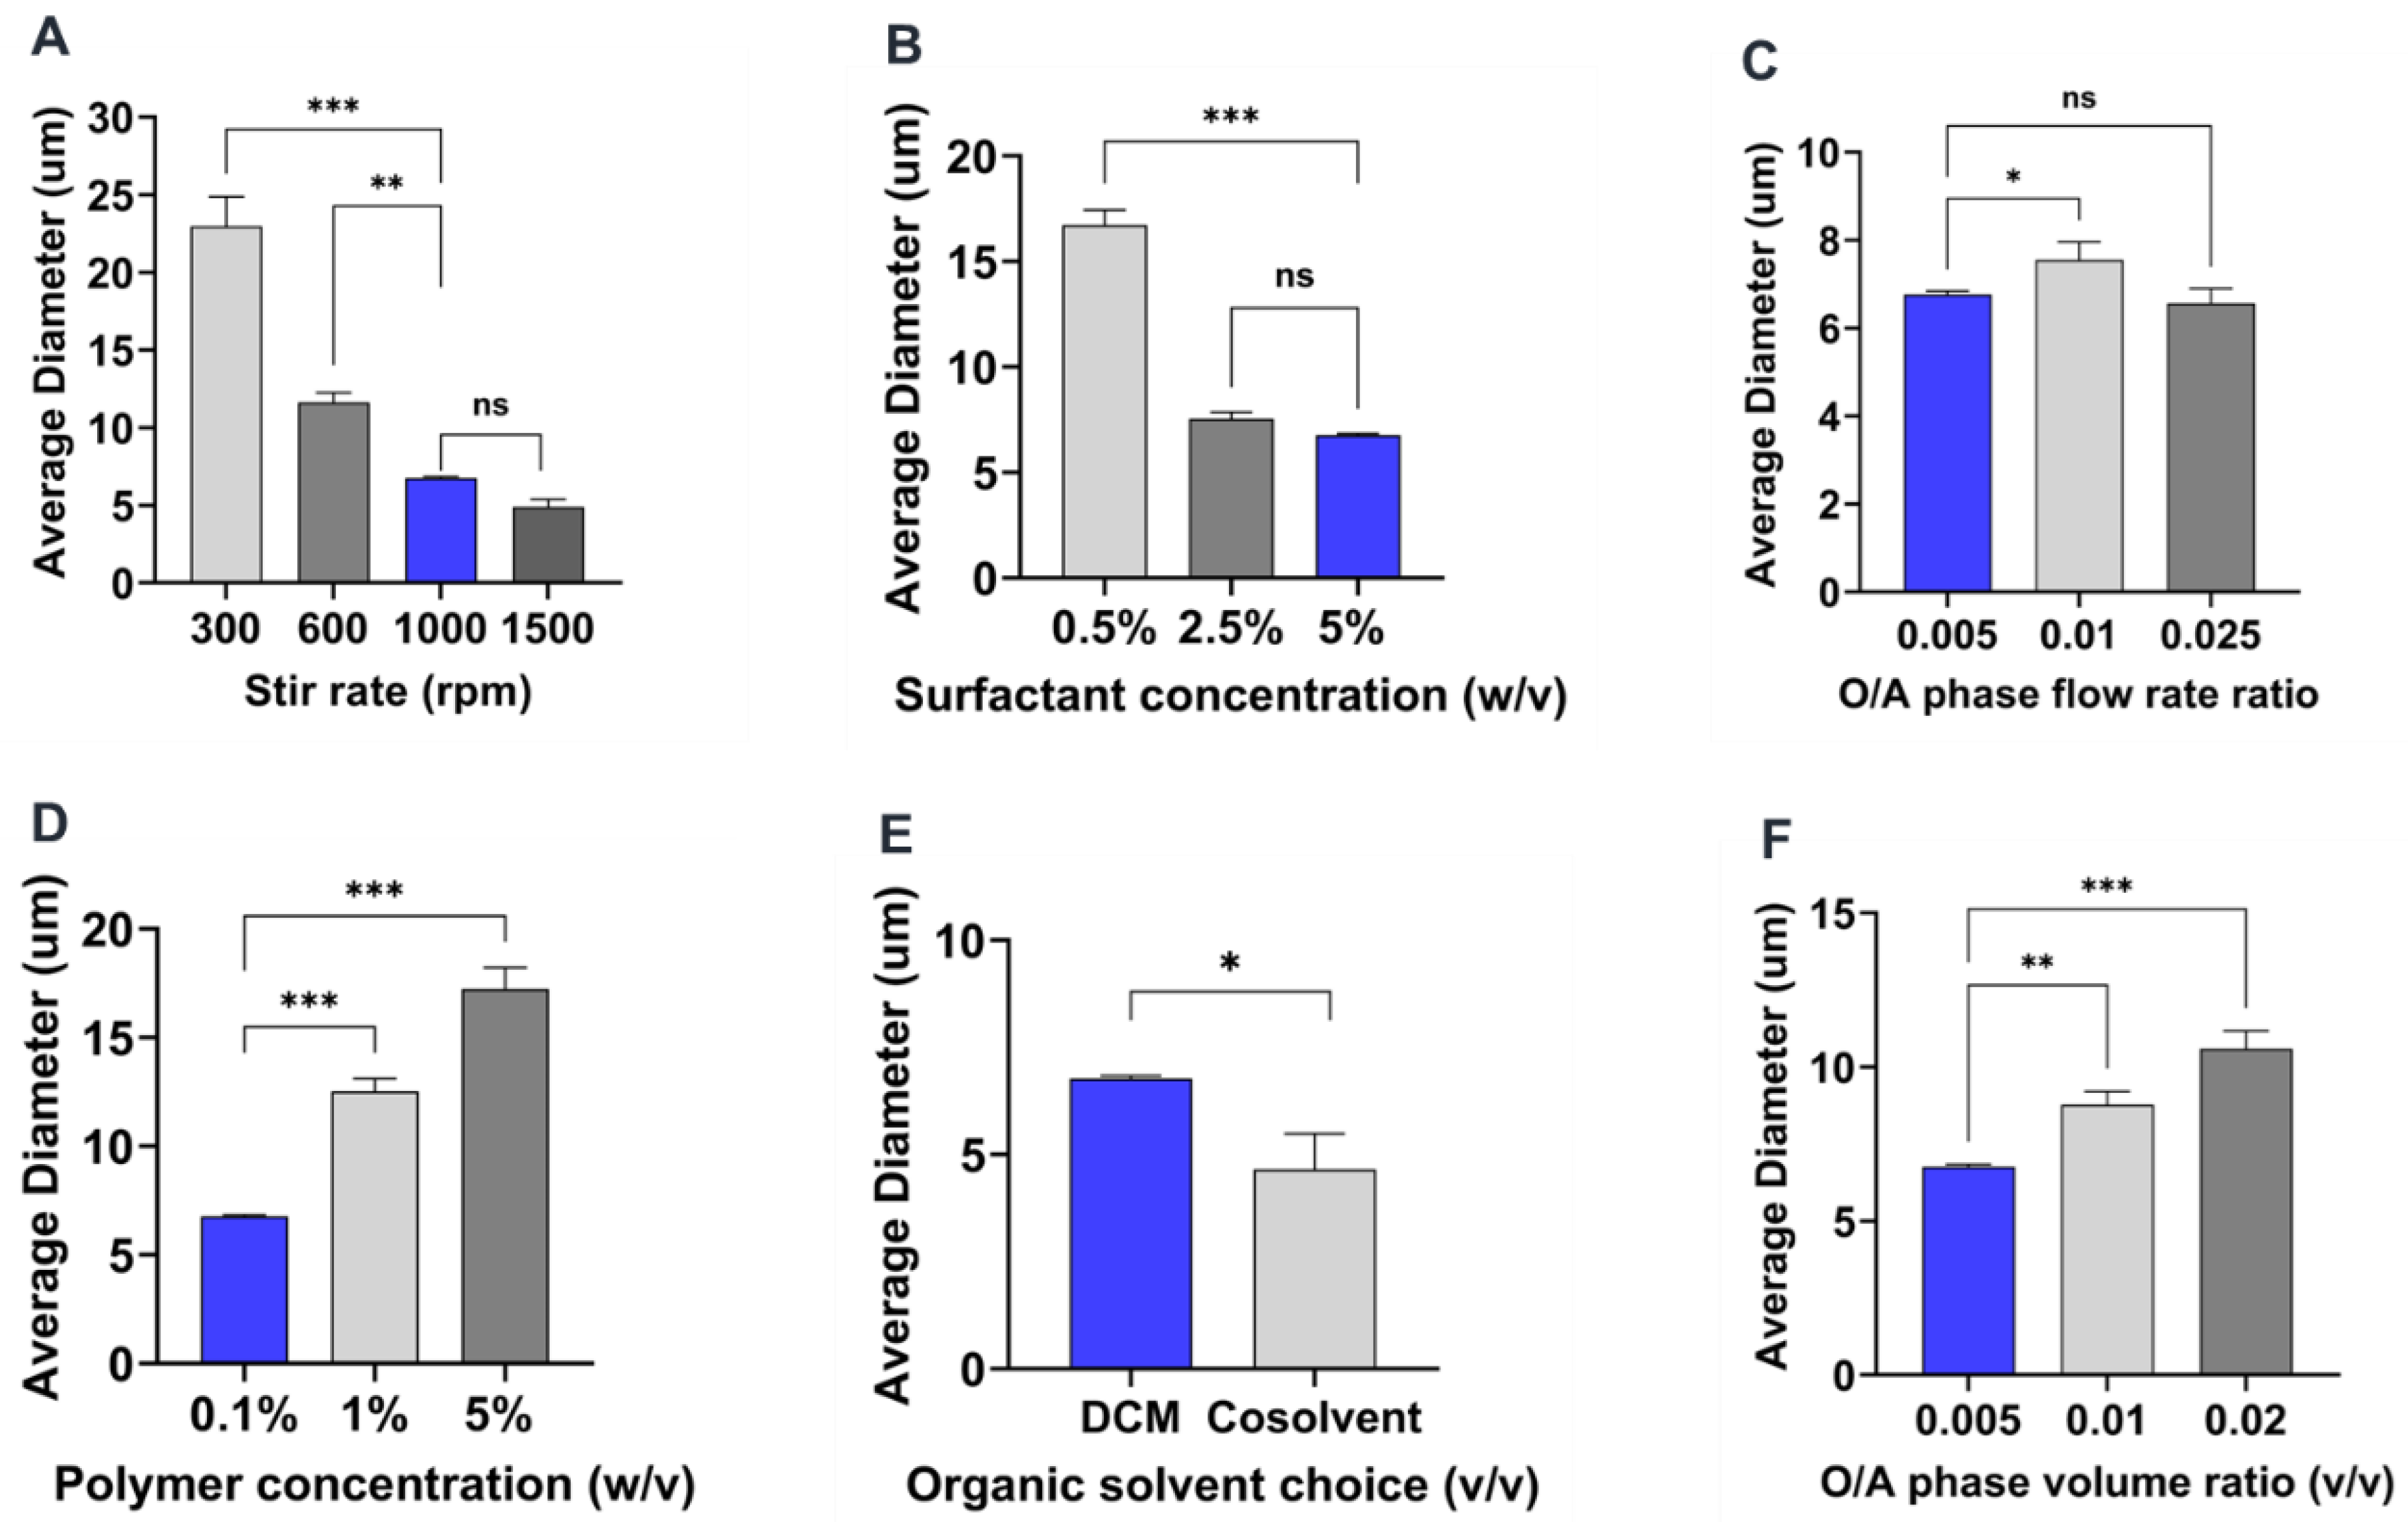
Generally, as the stirring rate increases, the shear energy generated by the magnetic stirrer also increases, thereby causing large droplets of the polymer phase to be broken into smaller droplets [26]. Consistent with previous studies [27,28,29], an inverse relationship was observed between stirring rate and mean particle size. As the stirring rate was increased from 300 rpm to 1500 rpm, the particle size of the microparticles decreased from 23.2 ± 11.7 μm to 4.7 ± 1.9 μm as shown in Table 2 and Figure 2 and Figure 8A. On comparing to the reference formulation, we did not find a statistically significant difference between microparticle mean sizes made using 1000 rpm or 1500 rpm (Figure 8A). However, there was a statistically significant difference when comparing the reference formulation to the 300 rpm (p < 0.01) or 600 rpm (p < 0.05), which had higher mean microparticle sizes (Figure 2C,D and Figure 8A and Table 2). The observation in the particle size distribution also aligns with similar reports showing that increasing the stirring rate improves the mixture and diffusion of the phases, resulting in microparticles with a relatively narrow particle size distribution [27]. For instance, while 90% of all microparticles were in size range of 2-6 μm when made at 1500 rpm, only ~30 and ~15% microparticle were in that size range when fabricated at 600 and 300 rpm respectively (Figure 2A,C,D).
3.3.2. Effect of surfactant concentration
Several previous studies have shown that surfactant concentration in the aqueous phase has a significant effect on the size and size distribution of the microparticles [6,26,29]. Generally, an increase in the concentration of surfactant has been shown to cause a decrease in microparticle size [20,30,31]. In this study, the concentration of PVA in the aqueous phase was identified to have a negative correlation on the average size of microparticles. Hence, as PVA concentration was increased from 0.5% w/v to 5% w/v, a corresponding decrease in size from 16.5 ± 5.4 μm to 6.8 ± 3.1 μm (p< 0.001) was observed as indicated in Figure 3 and Figure 8B and Table 2. Similar effects of increasing surfactant concentration were also seen when the polymer concentration was changed to 1% w/v and PVA concentration was varied from 0.5 to 10 % w/v (Supplementary information; Figure S2). At higher concentrations of PVA, the interfacial tension between the organic and aqueous phases decreases [32,33], leading to the stabilization of the emulsion against droplet coalescence hence the observed finding. Interestingly, there was no significant size difference between microparticles synthesized with 2.5% w/v and 5% w/v PVA concentrations despite the former being slightly larger (Figure 3 and Figure 8B). This could be due to the similarity in the emulsification effect induced by these two concentrations of PVA as it has been reported that the concentration of surfactants with comparable viscosity produce similar effect against particle coalescence [28,33]. Although the particle mean particle size was not significantly different between the two formulations the particle distribution showed that about ~76% and ~60% particles in size range of 2-6 μm when made using 5% or 2.5 % w/v PVA respectively (Figure 3). Another observed effect worth mentioning is the impact of the concentration of PVA on the morphology of the microparticles [34]. As shown in Figure 3 D,F, microparticles synthesized with 5% w/v PVA concentration were characterized by a high degree of smoothness and sphericity while the surface of microparticles produced by 0.5% w/v was observed to be rough and wrinkled. Other formulations with increased PVA concentration at 10% w/v and 0.5% w/v also show the emergence of oval shape (aspect ratio ~1.7) irregular morphology respectively (Figure S2).
3.3.3. Effect of organic and aqueous phase flow rate ratio
As established in literature, fabrication methods based on co-flow technology to generate droplets are influenced by the flow rates of the organic and aqueous phases [16,25,35,36,37]. In this study the influence of the flow rate ratio of organic to aqueous phase was investigated across three different ratios (0.005, 0.01, and 0.025) as presented in Figure 4 and Figure 8C and Table 2. In agreement with previous findings [12,25,37], a slight increase in microparticle size from 6.8 ± 3.1 µm to 7.5 ± 3.1 µm was observed when flow rate ratio was increased from 0.005 to 0.01 as generally higher flow rate ratio due to a less flow rate of the aqueous phase results in a faster production of polymer droplets thereby increasing the tendency of particle coalescence. On the contrary, further increase of flow rate ratio to 0.025 resulted in a slight decrease of size to 6.5 ± 2.7 µm (Figure 4 and Figure 8C). The lack of significance observed in these formulations may be attributed to the overriding influence of dominant parameters that determine particle size, such as stir rate and polymer concentration. Another possible explanation for this observation could be the stabilizing effect of the pre-existing PVA in the evaporation dish prior to initiating the co-flow. This may have minimized the impact of a higher flow rate ratio, despite the dispersed phase having higher flow rates that would typically result in faster generation of polymer droplets in the emulsion.
3.3.4. Effect of polymer concentration
Increasing in polymer concentration has been shown to result in the increase in the size of particles [26,37,38]. This observation can be explained by the heightened viscosity of the organic phase caused by the increased concentration of the polymer solution, making it challenging to generate small emulsion droplets, and ultimately leading to an increase in particle size [6,39]. Consistent with previous literature, this study’s findings demonstrate that the concentration of PEG-PLGA in the organic phase has a significant impact on microparticle size. As shown in Figure 5 and Figure 8D and Table 2, increasing the concentration of PEG-PLGA in the organic phase from 0.1% w/v (reference formulation) to 5% w/v was accompanied by a corresponding increase in the mean particle size from 6.8 ± 3.1 µm to 17.1 ± 9 µm) (p<0.001, Figure 8D). We also observed wider size distribution with increasing polymer concentration, where formulation made using 0.1% polymer concentration had ~76% particles below 6 μm while formulations of 5% polymer concentration had only ~17% particle in that size range (Figure 5A,C).
3.3.5. Effect of organic solvent choice
Generally organic solvents with increased solubility in water results in the generation of particles with smaller particle size and narrower size distribution [40]. Thus, it was anticipated that the introduction of acetonitrile (ACN), a more polar solvent in DCM will increase the solubility of the resulting organic phase in the aqueous phase thereby leading to the generation of microparticles with smaller size. As shown compared to the reference formulation (Figure 6 and Figure 8E and Table 2), the size of microparticles decreased from 6.8 ± 3.1 µm to 4.9 ± 2.2 µm (p< 0.05) upon adding 25% v/v ACN as a cosolvent to pure DCM. There is also a minor difference in particle size distributions with formulations made in ACN-DCM have about ~38% microparticles below the size of 2 μm while in DCM only ~16% of microparticles are below 2 μm. This finding aligns with previous studies that report an increase in microparticle size synthesized using DCM as the organic phase solvent as compared to ethyl acetate, a moderately polar solvent similar to CAN [30,31].
3.3.6. Effect of organic to aqueous phase volume ratio
The size of the microparticles has also been described to be influenced by the variation of the volume ratio of both the organic and aqueous phases [30,33,41]. For this investigation, the volume of the aqueous phase was maintained at a constant 20 ml and the volume of the dispersed phase was increased from 0.1 ml to 0.4 ml, constituting an organic: aqueous phase volume ratio of 0.005% v/v and 0.02% respectively. As shown in Figure 7 and Figure 8F and Table 2, the size of the microparticles increased (p < 0.01) from 6.8 ± 3.1 µm to 10 ± 3.7 µm, with a corresponding elevation in particle concentration or number of particles formed as the phase volume ratio was increased. This observation aligns with similar findings reporting the role of the viscosity of the emulsion due to an increase in the dispersed phase as a justification to the increase in particle size [23,33]. Other explanations could be the increase in the tendency of collision and coalescence among the dispersed oil droplets as a higher phase volume ratio allows for a lesser distance between the aqueous phase and the organic phase leading to poor phase separation [42,43].
3.3.7. Summary of the effect of process parameters on microparticle size and size distributions
A summary of the effect of the process parameters on PEG-PLGA microparticle formulated by co-flow phase separation method is provided in Table 2. Overall, the stirring rate had the highest impact on microparticle size followed by polymer and surfactant concentration. By varying these parameters, we were able to get microparticles ranging in size from 4.9 – 23.2 μm. The CV values indicating polydispersity of the microparticles sizes remained in the ranges of 0.33 to 0.53. The organic/aqueous phase volume ratio had the most significant impact on reducing polydispersity, but it also led to slight but significant increase in microparticle sizes under those conditions.
Figure 8.
Comparison plots of the influence of individual conditions tested for all process parameters on microparticle size. (A-F). Blue bars represent each individual reference parameter selected from the reference formulation. One-way ANOVA: *p <0.05, **p <0.01, and ***p <0.001 Student’s t test: *p < 0.05 and **p < 0.01.
3.4. Scalability and tunability of co-flow phase separation method
While phase separation has been reported as a tunable method, achieving high scale production remains challenging [11,44]. Here, by utilizing a combination of specific determining fabrication parameters that have been discussed in this study to impact microparticle size and concentration, we demonstrate that microparticles of comparable size to the reference formulation can be synthesized while achieving high scale up production without compromising particle characteristics. Here we varied the three parameters surfactant (PVA) concentration, stir rate and polymer concentration which had a significant effect on particle size simultaneously to obtain particle of similar size and narrower polydispersity. Our results demonstrate that careful combination and variation of these parameters can allow us to obtain particles with higher yields, desired particle size and narrow particle size distribution.
3.4.1. Combined effect of increasing phase volume ratio, surfactant concentration and stir rate.
While an increase in organic/aqueous phase volume ratio has been shown to increase the amount of particles generated, this effect also leads to size increase of particles as supported by our data (Figure 7 and Figure 8F) and others [23,45]. As opposed to this, the concentration of surfactant (PVA) and the stirring rate of the emulsion have both been identified to have inverse correlation to particle size. Thus, to keep microparticles size in a comparable range to the reference formulation, increasing PVA concentration and stir rate was adopted as a strategy to control the potential increase in particle size owing to the subsequent increase of the organic/aqueous phase volume ratio. As depicted in Table 3 and Figure 9, when the volume ratio of the organic to aqueous phase was increased, along with higher PVA concentration and stir rate of the emulsion, particles with similar morphology and size to the reference formulation were synthesized. Notably, these particles exhibited reduced polydispersity, narrower size distribution, and increased particle concentration (Figure 9).
Combined effect of increasing polymer concentration, surfactant concentration and stir rate. Generally, since microparticles are generated by oil droplets owing to the polymer dissolution in the organic phase, one will expect a higher polymer concentration to correspond to an increase in oil droplets, subsequently promoting the production of more microparticles. While this is true, the formation of more oil droplets, due to increased polymer concentration also increases the tendency of particle coalescence that ultimately leads to an increase in particle size as shown by our data (Figure 5 and Figure 8D) and found in literature [5,6]. To avoid this effect and foster the synthesis of microparticles with properties comparable to those of the reference formulation, an increase in PVA concentration and the emulsion stir rate speed was adopted as similarly investigated for the scalability achieved via increasing the organic/aqueous phase volume ratio. As shown in Figure 10, increasing polymer concentration with high PVA concentration and stir rate resulted in the successful tuning of the microparticles to an approximate size of ~7 μm while achieving increased microparticle concentration. As reported in literature, usually increasing polymer concentration increases microparticle size which reduces the range of applications [11,33,44]. We hereby present a method whereby controlling PVA concentration and stir rate led to formation of particles of similar size irrespective of the polymer concentration. This is critical for drug delivery applications whereby a higher drug loading can be obtained with increasing polymer concentration while keeping microparticle size a constant as needed for the application. As a testament to this, a model drug rhodamine 6G was further loaded into these microparticles and the corresponding increase in drug loading and encapsulation was observed as indicated in Table 4.
To further illustrate the tunability and the microparticle size ranges that can be obtained using this method with high polymer concentration we also tested combined effect of increasing polymer and PVA concentration with lower stir rate to examine effect of the surfactant concentration. Our result indicates that microparticle size up to ~40 μm can be obtained at lower stir rate and higher concentration of PVA also influences the microparticle (Figure S2). Lastly, to demonstrate the versatility of this method to obtain a range of microparticles we simultaneously varied several process parameters and obtained microparticles in different size range buckets including ~50, 76, 100 and 114 μm (Supplementary data Table S3 and Figure S4)
3.5. Encapsulation of model dyes in PEG-PLGA microparticles.
To showcase the potential application of microparticles generated through this method for drug delivery purposes, hydrophilic rhodamine 6G and hydrophobic coumarin 6 were incorporated as model drugs into the organic phase at a theoretical loading of 1% v/v dye concentration. Thus, by maintaining all process parameters at the levels specified by the reference formulation, Rho6G and Coum6 loaded microparticles were prepared accordingly. As expected, the encapsulation efficiency and drug loading of the coumarin 6, a hydrophobic dye, were found to be approximately four times higher than that of the hydrophilic rhodamine in the microparticles as shown in Table 5. We also observed a small but significant increase (p< 0.05) in microparticle size with encapsulation of coumarin while no such significant difference in size was found in rhodamine loaded microparticle (Figure S3).
Given that polymer concentration has been shown to have an impact on encapsulation efficiency [38],the low amount of encapsulation in both formulations may have been caused by the lower polymer concentration of 0.1 % w/v adopted for the reference formulation. Consistent with previous findings, these observed differences in drug loading and encapsulation efficiency can be attributed to the distinct physicochemical properties of the dyes [17,46]. The hydrophilicity of rhodamine necessitates enhanced diffusion of the dye out of the emulsion droplets into the external aqueous phase during microparticle production. In contrast, the hydrophobic nature of coumarin facilitates its efficient loading into the hydrophobic PLGA core of the polymer matrix. Thus, these findings underscore the significant influence of the physicochemical properties of biomolecules on their loading efficiency within polymeric carriers [33]. Further characterization of the successful incorporation of these dyes into the microparticles was visually confirmed using a fluorescent microscope (Leica DMI 6000) as shown in Figure 11.
As similarly reported in literature [6,38], while both formulations of higher polymer concentrations demonstrated an increase in encapsulation efficiency as a result of the availability of more amount of polymer to interact with the dye, the same was different for the drug loading as only 1% w/v polymer formulation yielded a significant difference in drug loading from the others. This observed difference could be attributed to the different effect as a result of higher stir rate and PVA concentration as highlighted in literature [31,33]. Particularly, an increase in the stirring speed has been reported to generates higher energy in the emulsion, leading to an intensified breakdown of the dispersed droplets forming the microparticles hence resulting into the reduction in encapsulation efficiency [47]. While higher PVA concentration has been identified with increase in encapsulation efficiency [33,48], the opposite has been reported for drug loading [32,33,49], as an increase in viscosity due to high PVA may increase the difficulty in achieving ultimate purification and washing of PVA residue subsequently contributing to the mass increase of the particles. Another potential explanation for the significantly lower drug loading observed in the 5% w/v formulation could be attributed to its inherently larger mass. This is because the loading capacity, calculated as the weight ratio of the loaded drug to the total mass of the drug encapsulated particles, is often lower for particles prepared with higher polymer concentrations, which generally have a greater mass [38].
3.6. In-vitro release studies
The reference formulation and microparticle formulation based on 1% w/v polymer concentration hereafter referred to as REF-FM and 1%PC-FM respectively were adopted to investigate the release kinetics of R6G from the loaded microparticles in PBS (0.01M, 7.4 pH). As shown in Figure 12, the release pattern of all particles exhibited an initial burst release with a continual slower linear release phase after 12 hours for 1%PC-FM, and between 12 and 24 hours for REF-FM. This observation is typical of the release from PEG-PLGA particulate systems as reported in literature [20,50,51]. Notably, REF-FM showed a faster release of R6G as compared to 1% PC-FM with a cumulative release of approximately 70% as compared to 30% at 12 hours. This finding can be explained based on the slow diffusion in the case of 1% PC-FM as the dye has to travel denser pathway from the polymer matrix to reach the dissolution medium [48]. Moreover, the slower hydrolytic degradation of the matrix may also account for the reduced cumulative quantity of drug release from the formulation based on higher polymer concentration, since slower water diffusion into the matrix may reduce the accessibility of water molecules to polymer chains. The finding of this observation also emphasizes the feasibility of achieving sustained and controlled release in microparticle formulations based on higher polymer concentration.
4. Conclusion
In this study, a reference formulation based on a combination of individual fabrication and process parameters was established for the synthesis of microparticles and the subsequent investigation of the impact of process parameters on microparticle characteristics. The findings of this investigation provide valuable insights into the tunability and scalability of phase separation co-flow method as demonstrated by our ability to optimize these parameters to attain specific characteristics, including particle size and distribution, encapsulation efficiency, drug loading, and release kinetics of encapsulated drug molecules. Among the parameters investigated in this study, stir rate and polymer concentration were identified as the most significant fabrication parameters that influence the size and distribution of microparticles while surfactant (PVA) concentration was observed as the most substantial parameter that impacts the morphology of the particles. Of interest, it was discovered that fabrication parameters had an impact on the microparticle characteristics both independently and in conjunction with other parameters thus allowing for the combination of specific fabrication parameters for optimal application. Additionally, consistency in the implementation of configurational and non-fabrication parameters such as the type of magnetic stirrer, the length, diameter and shape of the stir bar, the type and size of beaker or evaporating dish and the coaxial needle diameter and geometry, was a crucial factor that was confirmed to influence the reproducibility of this method. Overall, the presented report on our ability to tune and scale microparticles characteristics may expand the applicability of the coaxial flow phase separation method for the synthesis of polymeric microparticles for drug delivery application.
Supplementary Materials
The following supporting information can be downloaded at the website of this paper posted on Preprints.org.
Author Contributions
Conceptualization, E.J. and P.N.K.S.; Methodology, E.J., P.N.K.S and Y.M.E.; Data Analysis, E.J., P.N.K.S., Y.M.E., E.J.M., T.O., Q.W. and A.G.; Writing – Original Draft Preparation, E.J. and P.N.K.S..; Writing – Review & Editing, E.J. and P.N.K.S.; Supervision, E.J..; Project Administration, E.J.; Funding Acquisition, E.J.
Funding
The manuscript is supported by funding provided by DoD Discovery Award (W81XWH2210020) and CUSE- II-17-2020 from Syracuse University.
Conflicts of Interest
The authors declare no conflict of interest.
References
- Blasi, P. Poly(lactic acid)/poly(lactic-co-glycolic acid)-based microparticles: an overview. Journal of Pharmaceutical Investigation 2019, 49, 337–346. [Google Scholar] [CrossRef]
- Knop, K.; Hoogenboom, R.; Fischer, D.; Schubert, U.S. Poly(ethylene glycol) in drug delivery: pros and cons as well as potential alternatives. Angew Chem Int Ed Engl 2010, 49, 6288–6308. [Google Scholar] [CrossRef]
- Makadia, H.K.; Siegel, S.J. Poly Lactic-co-Glycolic Acid (PLGA) as Biodegradable Controlled Drug Delivery Carrier. Polymers (Basel) 2011, 3, 1377–1397. [Google Scholar] [CrossRef]
- Prabhuraj, R.S.; Bomb, K.; Srivastava, R.; Bandyopadhyaya, R. Selection of superior targeting ligands using PEGylated PLGA nanoparticles for delivery of curcumin in the treatment of triple-negative breast cancer cells. Journal of Drug Delivery Science and Technology 2020, 57, 101722. [Google Scholar] [CrossRef]
- Jusu, S.M.; Obayemi, J.D.; Salifu, A.A.; Nwazojie, C.C.; Uzonwanne, V.; Odusanya, O.S.; Soboyejo, W.O. Drug-encapsulated blend of PLGA-PEG microspheres: in vitro and in vivo study of the effects of localized/targeted drug delivery on the treatment of triple-negative breast cancer. Sci Rep 2020, 10, 14188. [Google Scholar] [CrossRef] [PubMed]
- Sharma, S.; Parmar, A.; Kori, S.; Sandhir, R. PLGA-based nanoparticles: A new paradigm in biomedical applications. TrAC Trends in Analytical Chemistry 2016, 80, 30–40. [Google Scholar] [CrossRef]
- Ding, D.; Zhu, Q. Recent advances of PLGA micro/nanoparticles for the delivery of biomacromolecular therapeutics. Mater Sci Eng C Mater Biol Appl 2018, 92, 1041–1060. [Google Scholar] [CrossRef]
- Lagreca, E.; Onesto, V.; Di Natale, C.; La Manna, S.; Netti, P.A.; Vecchione, R. Recent advances in the formulation of PLGA microparticles for controlled drug delivery. Prog Biomater 2020, 9, 153–174. [Google Scholar] [CrossRef]
- Busatto, C.; Pesoa, J.; Helbling, I.; Luna, J.; Estenoz, D. Effect of particle size, polydispersity and polymer degradation on progesterone release from PLGA microparticles: Experimental and mathematical modeling. International Journal of Pharmaceutics 2018, 536, 360–369. [Google Scholar] [CrossRef]
- Bao, T.-Q.; Hiep, N.-T.; Kim, Y.-H.; Yang, H.-M.; Lee, B.-T. Fabrication and characterization of porous poly(lactic-co-glycolic acid) (PLGA) microspheres for use as a drug delivery system. Journal of Materials Science 2011, 46, 2510–2517. [Google Scholar] [CrossRef]
- Wan, F.; Yang, M. Design of PLGA-based depot delivery systems for biopharmaceuticals prepared by spray drying. Int J Pharm 2016, 498, 82–95. [Google Scholar] [CrossRef]
- Yonet-Tanyeri, N.; Amer, M.; Balmert, S.C.; Korkmaz, E.; Falo, L.D., Jr.; Little, S.R. Microfluidic Systems For Manufacturing of Microparticle-Based Drug-Delivery Systems: Design, Construction, and Operation. ACS Biomaterials Science & Engineering 2022, 8, 2864–2877. [Google Scholar] [CrossRef]
- Nicolete, R.; dos Santos, D.F.; Faccioli, L.H. The uptake of PLGA micro or nanoparticles by macrophages provokes distinct in vitro inflammatory response. Int Immunopharmacol 2011, 11, 1557–1563. [Google Scholar] [CrossRef] [PubMed]
- Tran, M.K.; Swed, A.; Boury, F. Preparation of polymeric particles in CO(2) medium using non-toxic solvents: formulation and comparisons with a phase separation method. Eur J Pharm Biopharm 2012, 82, 498–507. [Google Scholar] [CrossRef]
- Jeong, W.J.; Kim, J.Y.; Choo, J.; Lee, E.K.; Han, C.S.; Beebe, D.J.; Seong, G.H.; Lee, S.H. Continuous Fabrication of Biocatalyst Immobilized Microparticles Using Photopolymerization and Immiscible Liquids in Microfluidic Systems. Langmuir 2005, 21, 3738–3741. [Google Scholar] [CrossRef] [PubMed]
- Utada, A.S.; Fernandez-Nieves, A.; Stone, H.A.; Weitz, D.A. Dripping to jetting transitions in coflowing liquid streams. Phys Rev Lett 2007, 99, 094502. [Google Scholar] [CrossRef] [PubMed]
- Abulateefeh, S.R.; Spain, S.G.; Thurecht, K.J.; Aylott, J.W.; Chan, W.C.; Garnett, M.C.; Alexander, C. Enhanced uptake of nanoparticle drug carriers via a thermoresponsive shell enhances cytotoxicity in a cancer cell line. Biomaterials Science 2013, 1, 434–442. [Google Scholar] [CrossRef]
- Lee, J.H.; Im, J.S.; Jin, X.; Kim, T.M.; Choi, J.W. In Vitro and In Vivo Evaluation of Drug-Encapsulated Lignin Nanoparticles for Release Control. ACS Sustainable Chemistry & Engineering 2022, 10, 5792–5802. [Google Scholar] [CrossRef]
- Ogunsipe, A. Solvent Effects on the Spectral Properties of Rhodamine 6G: Estimation of Ground and Excited State Dipole Moments. Journal of Solution Chemistry 2018, 47, 203–219. [Google Scholar] [CrossRef]
- Safari, H.; Adili, R.; Holinstat, M.; Eniola-Adefeso, O. Modified two-step emulsion solvent evaporation technique for fabricating biodegradable rod-shaped particles in the submicron size range. J Colloid Interface Sci 2018, 518, 174–183. [Google Scholar] [CrossRef]
- Matsumoto, A.; Kitazawa, T.; Murata, J.; Horikiri, Y.; Yamahara, H. A novel preparation method for PLGA microspheres using non-halogenated solvents. J Control Release 2008, 129, 223–227. [Google Scholar] [CrossRef] [PubMed]
- Bile, J.; Bolzinger, M.A.; Vigne, C.; Boyron, O.; Valour, J.P.; Fessi, H.; Chevalier, Y. The parameters influencing the morphology of poly(varepsilon-caprolactone) microspheres and the resulting release of encapsulated drugs. Int J Pharm 2015, 494, 152–166. [Google Scholar] [CrossRef]
- Ellis, A.; Jacquier, J.C. Manufacture of food grade κ-carrageenan microspheres. Journal of Food Engineering 2009, 94, 316–320. [Google Scholar] [CrossRef]
- Mahmoodi, N.; Ai, J.; Hassannejad, Z.; Ebrahimi-Barough, S.; Hasanzadeh, E.; Hadi, A.; Nekounam, H.; Rahimi-Movaghar, V. Are reported methods for synthesizing nanoparticles and microparticles by magnetic stirrer reproducible? Journal of Computational Applied Mechanics 2020, 51, 498–500. [Google Scholar] [CrossRef]
- Nosrati, Z.; Li, N.; Michaud, F.; Ranamukhaarachchi, S.; Karagiozov, S.; Soulez, G.; Martel, S.; Saatchi, K.; Häfeli, U.O. Development of a Coflowing Device for the Size-Controlled Preparation of Magnetic-Polymeric Microspheres as Embolization Agents in Magnetic Resonance Navigation Technology. ACS Biomaterials Science & Engineering 2018, 4, 1092–1102. [Google Scholar] [CrossRef]
- Noviendri, D.; Jaswir, I.; Taher, M.; Mohamed, F.; Salleh, H.M.; Noorbatcha, I.A.; Octavianti, F.; Lestari, W.; Hendri, R.; Ahmad, H.; et al. Fabrication of Fucoxanthin-Loaded Microsphere(F-LM) By Two Steps Double-Emulsion Solvent Evaporation Method and Characterization of Fucoxanthin before and after Microencapsulation. J Oleo Sci 2016, 65, 641–653. [Google Scholar] [CrossRef]
- Moura, M.J.; Martins, S.P.; Duarte, B.P. Production of chitosan microparticles cross-linked with genipin–Identification of factors influencing size and shape properties. Biochemical engineering journal 2015, 104, 82–90. [Google Scholar] [CrossRef]
- Valot, P.; Baba, M.; Nedelec, J.M.; Sintes-Zydowicz, N. Effects of process parameters on the properties of biocompatible ibuprofen-loaded microcapsules. Int J Pharm 2009, 369, 53–63. [Google Scholar] [CrossRef]
- Mohanty, S.; Panigrahi, A.K. Multiparticulate drug delivery system for colon targeting. Int J Pharm Pharm Sci 2015, 7, 433–436. [Google Scholar]
- Mensah, R.A.; Kirton, S.B.; Cook, M.T.; Styliari, I.D.; Hutter, V.; Chau, D.Y.S. Optimising poly(lactic-co-glycolic acid) microparticle fabrication using a Taguchi orthogonal array design-of-experiment approach. PLoS One 2019, 14, e0222858. [Google Scholar] [CrossRef]
- Vyslouzil, J.; Dolezel, P.; Kejdusova, M.; Maskova, E.; Masek, J.; Lukac, R.; Kostal, V.; Vetchy, D.; Dvorackova, K. Influence of different formulations and process parameters during the preparation of drug-loaded PLGA microspheres evaluated by multivariate data analysis. Acta Pharm 2014, 64, 403–417. [Google Scholar] [CrossRef] [PubMed]
- Su, X.; Gupta, I.; Jonnalagadda, U.S.; Kwan, J.J. Complementary Effects of Porosigen and Stabilizer on the Structure of Hollow Porous Poly(lactic-co-glycolic acid) Microparticles. ACS Applied Polymer Materials 2020, 2, 3696–3703. [Google Scholar] [CrossRef]
- Otte, A.; Sharifi, F.; Park, K. Interfacial tension effects on the properties of PLGA microparticles. Colloids Surf B Biointerfaces 2020, 196, 111300. [Google Scholar] [CrossRef] [PubMed]
- Fan, Q.; Qi, F.; Miao, C.; Yue, H.; Gong, F.; Wu, J.; Ma, G.; Su, Z. Direct and controllable preparation of uniform PLGA particles with various shapes and surface morphologies. Colloids and Surfaces A: Physicochemical and Engineering Aspects 2016, 500, 177–185. [Google Scholar] [CrossRef]
- Sheen, S.; Lee, J.; Woo, C.G. Application of coflow premixed flame for generating aggregate silica particles and its limitation. AIP Advances 2022, 12. [Google Scholar] [CrossRef]
- Operti, M.C.; Dolen, Y.; Keulen, J.; van Dinther, E.A.W.; Figdor, C.G.; Tagit, O. Microfluidics-Assisted Size Tuning and Biological Evaluation of PLGA Particles. Pharmaceutics 2019, 11. [Google Scholar] [CrossRef] [PubMed]
- Rapier, C.E.; Shea, K.J.; Lee, A.P. Investigating PLGA microparticle swelling behavior reveals an interplay of expansive intermolecular forces. Scientific Reports 2021, 11, 14512. [Google Scholar] [CrossRef] [PubMed]
- Vasiliauskas, R.; Liu, D.; Cito, S.; Zhang, H.; Shahbazi, M.A.; Sikanen, T.; Mazutis, L.; Santos, H.A. Simple Microfluidic Approach to Fabricate Monodisperse Hollow Microparticles for Multidrug Delivery. ACS Appl Mater Interfaces 2015, 7, 14822–14832. [Google Scholar] [CrossRef]
- Zhu, K.J.; Jiang, H.L.; Du, X.Y.; Wang, J.; Xu, W.X.; Liu, S.F. Preparation and characterization of hCG-loaded polylactide or poly(lactide-co-glycolide) microspheres using a modified water-in-oil-in-water (w/o/w) emulsion solvent evaporation technique. J Microencapsul 2001, 18, 247–260. [Google Scholar] [CrossRef]
- Huang, W.; Zhang, C. Tuning the Size of Poly(lactic-co-glycolic Acid) (PLGA) Nanoparticles Fabricated by Nanoprecipitation. Biotechnol J 2018, 13. [Google Scholar] [CrossRef]
- Madani, F.; Esnaashari, S.S.; Mujokoro, B.; Dorkoosh, F.; Khosravani, M.; Adabi, M. Investigation of Effective Parameters on Size of Paclitaxel Loaded PLGA Nanoparticles. Adv Pharm Bull 2018, 8, 77–84. [Google Scholar] [CrossRef] [PubMed]
- Cheng, J.; Teply, B.A.; Sherifi, I.; Sung, J.; Luther, G.; Gu, F.X.; Levy-Nissenbaum, E.; Radovic-Moreno, A.F.; Langer, R.; Farokhzad, O.C. Formulation of functionalized PLGA-PEG nanoparticles for in vivo targeted drug delivery. Biomaterials 2007, 28, 869–876. [Google Scholar] [CrossRef] [PubMed]
- Jafari, S.M.; Assadpoor, E.; He, Y.; Bhandari, B. Re-coalescence of emulsion droplets during high-energy emulsification. Food Hydrocolloids 2008, 22, 1191–1202. [Google Scholar] [CrossRef]
- Su, Y.; Zhang, B.; Sun, R.; Liu, W.; Zhu, Q.; Zhang, X.; Wang, R.; Chen, C. PLGA-based biodegradable microspheres in drug delivery: recent advances in research and application. Drug Deliv 2021, 28, 1397–1418. [Google Scholar] [CrossRef] [PubMed]
- Heiskanen, H.; Denifl, P.; Hurme, M.; Pitkänen, P.; Oksman, M. Effect of Physical Properties and Emulsification Conditions on the Microsphere Size Prepared Using a Solvent Extraction Process. Journal of Dispersion Science and Technology 2012, 33, 234–244. [Google Scholar] [CrossRef]
- Lee, S.S.; Lee, Y.B.; Oh, I.J. Cellular uptake of poly(dl-lactide-co-glycolide) nanoparticles: effects of drugs and surface characteristics of nanoparticles. Journal of Pharmaceutical Investigation 2015, 45, 659–667. [Google Scholar] [CrossRef]
- O’Donnell, P.B.; McGinity, J.W. Preparation of microspheres by the solvent evaporation technique. Advanced Drug Delivery Reviews 1997, 28, 25–42. [Google Scholar] [CrossRef] [PubMed]
- Krishnamachari, Y.; Madan, P.; Lin, S. Development of pH- and time-dependent oral microparticles to optimize budesonide delivery to ileum and colon. Int J Pharm 2007, 338, 238–247. [Google Scholar] [CrossRef] [PubMed]
- Mao, S.; Shi, Y.; Li, L.; Xu, J.; Schaper, A.; Kissel, T. Effects of process and formulation parameters on characteristics and internal morphology of poly(d,l-lactide-co-glycolide) microspheres formed by the solvent evaporation method. Eur J Pharm Biopharm 2008, 68, 214–223. [Google Scholar] [CrossRef]
- Fattahi, P.; Borhan, A.; Abidian, M.R. Microencapsulation of chemotherapeutics into monodisperse and tunable biodegradable polymers via electrified liquid jets: control of size, shape, and drug release. Adv Mater 2013, 25, 4555–4560. [Google Scholar] [CrossRef]
- Yoo, J.; Won, Y.-Y. Phenomenology of the Initial Burst Release of Drugs from PLGA Microparticles. ACS Biomaterials Science & Engineering 2020, 6, 6053–6062. [Google Scholar] [CrossRef]
Scheme 1.
Diagrammatic representation of the coaxial needle assembly.
Scheme 2.
Diagrammatic rendering of the setup used for the microparticle fabrication.
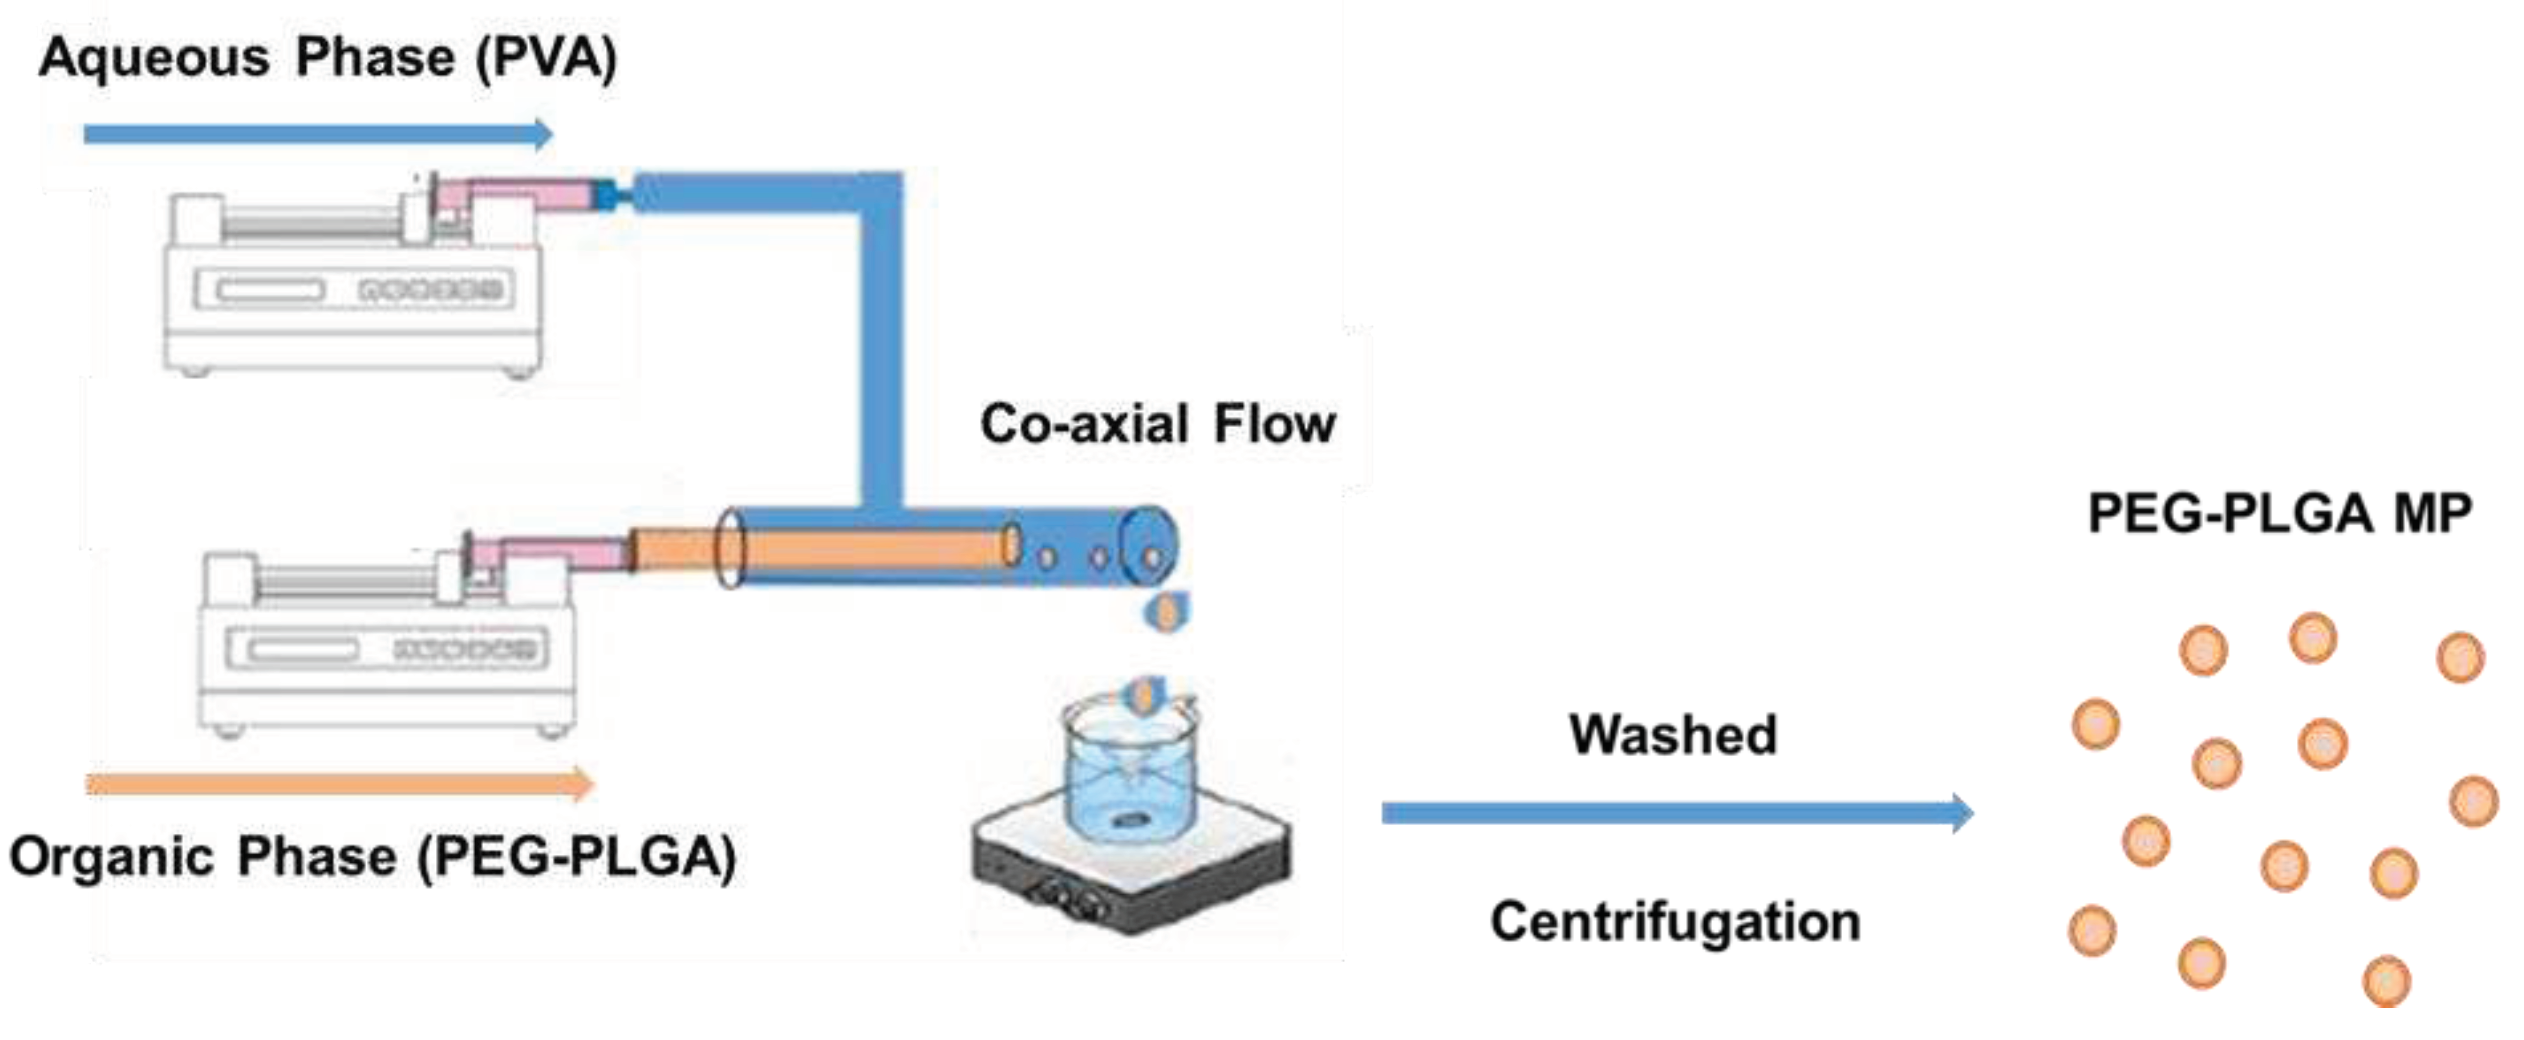
Figure 1.
Microparticle size distribution of reference formulation: A) optical micrograph of microparticle, B) histogram of the microparticle size distribution of a representative batch, C) batch-to-batch comparison of the mean values of three independent batches of the reference formulation. B1: Batch 1, B2: Batch 2, and B3: Batch 3.
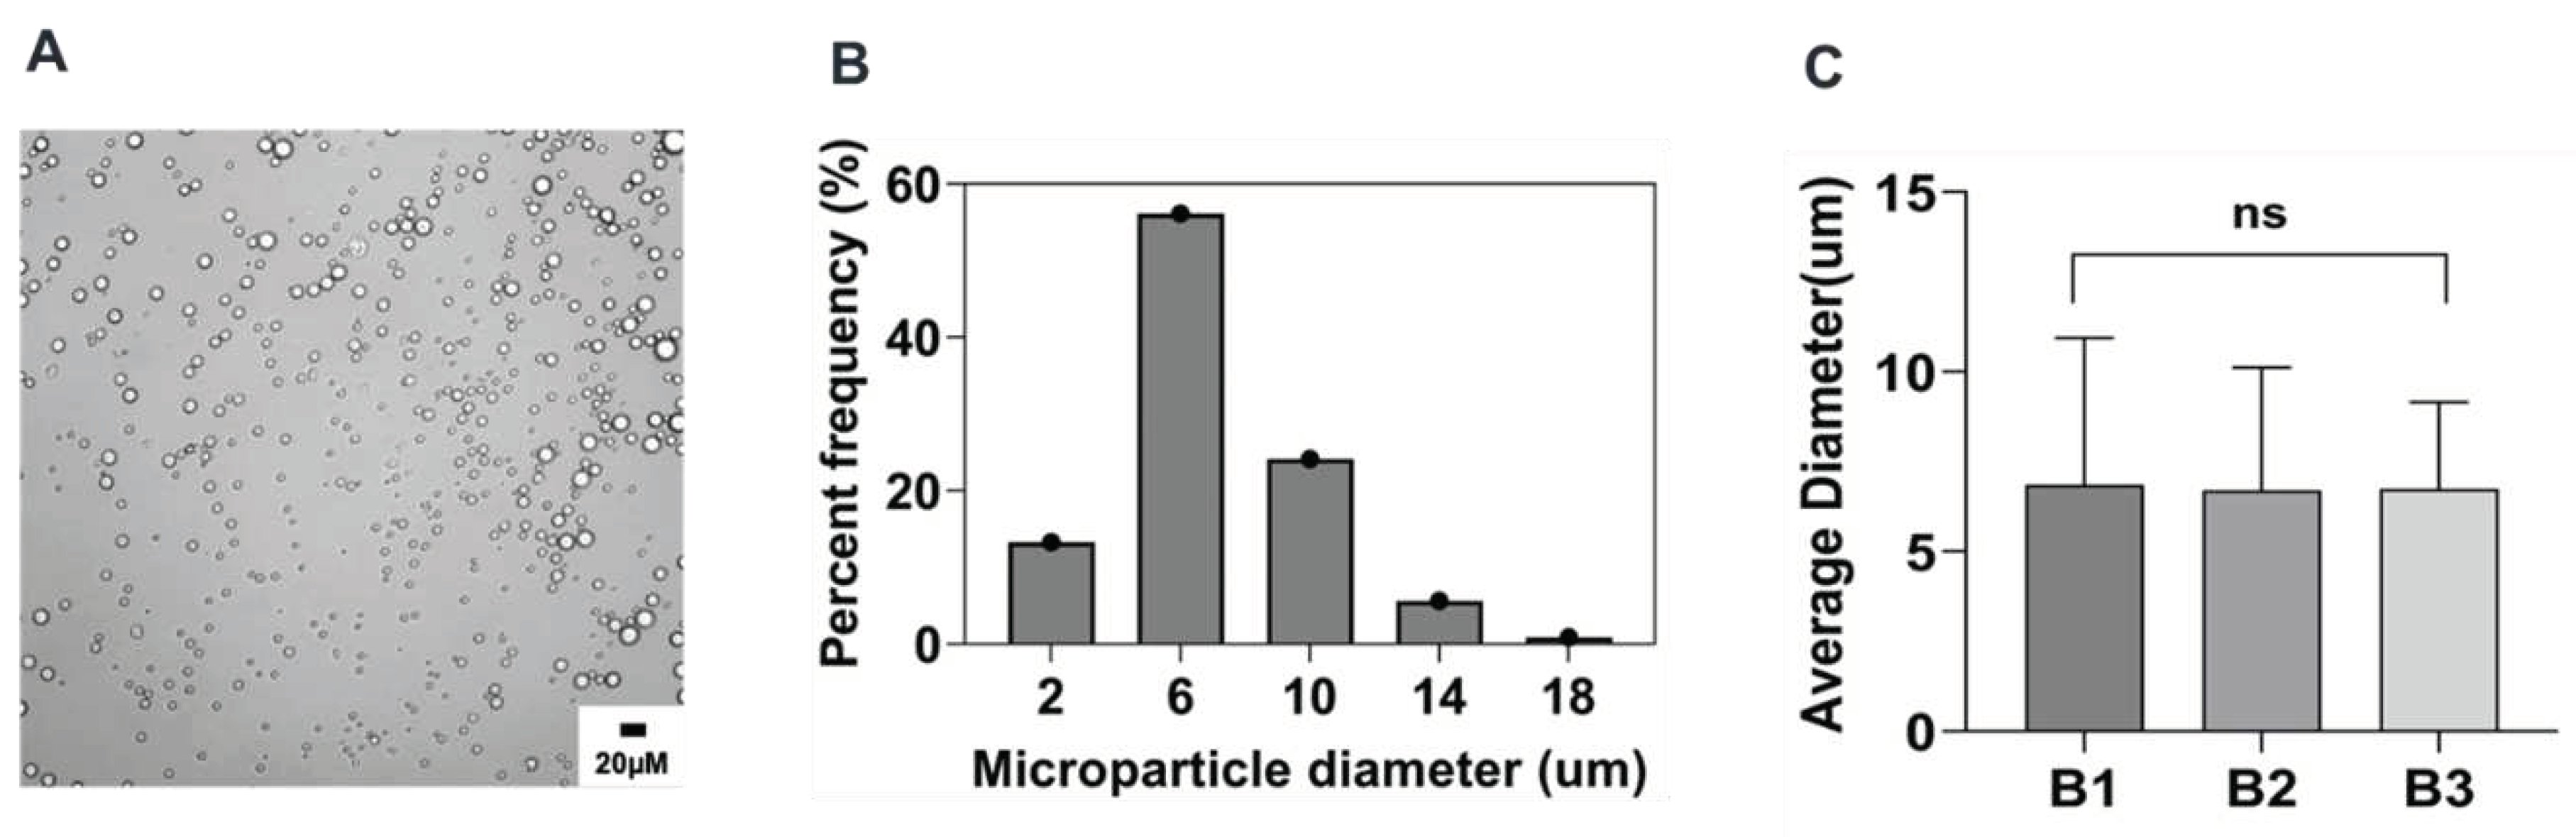
Figure 2.
Effect of stirring rate (rpm) on microparticle size and distributions. Optical micrograph and histogram of particle size distribution: A&E) 1500 RPM, B&F) 1000 RPM, C&G) 600 RPM, and D&H) 300 RPM.
Figure 2.
Effect of stirring rate (rpm) on microparticle size and distributions. Optical micrograph and histogram of particle size distribution: A&E) 1500 RPM, B&F) 1000 RPM, C&G) 600 RPM, and D&H) 300 RPM.
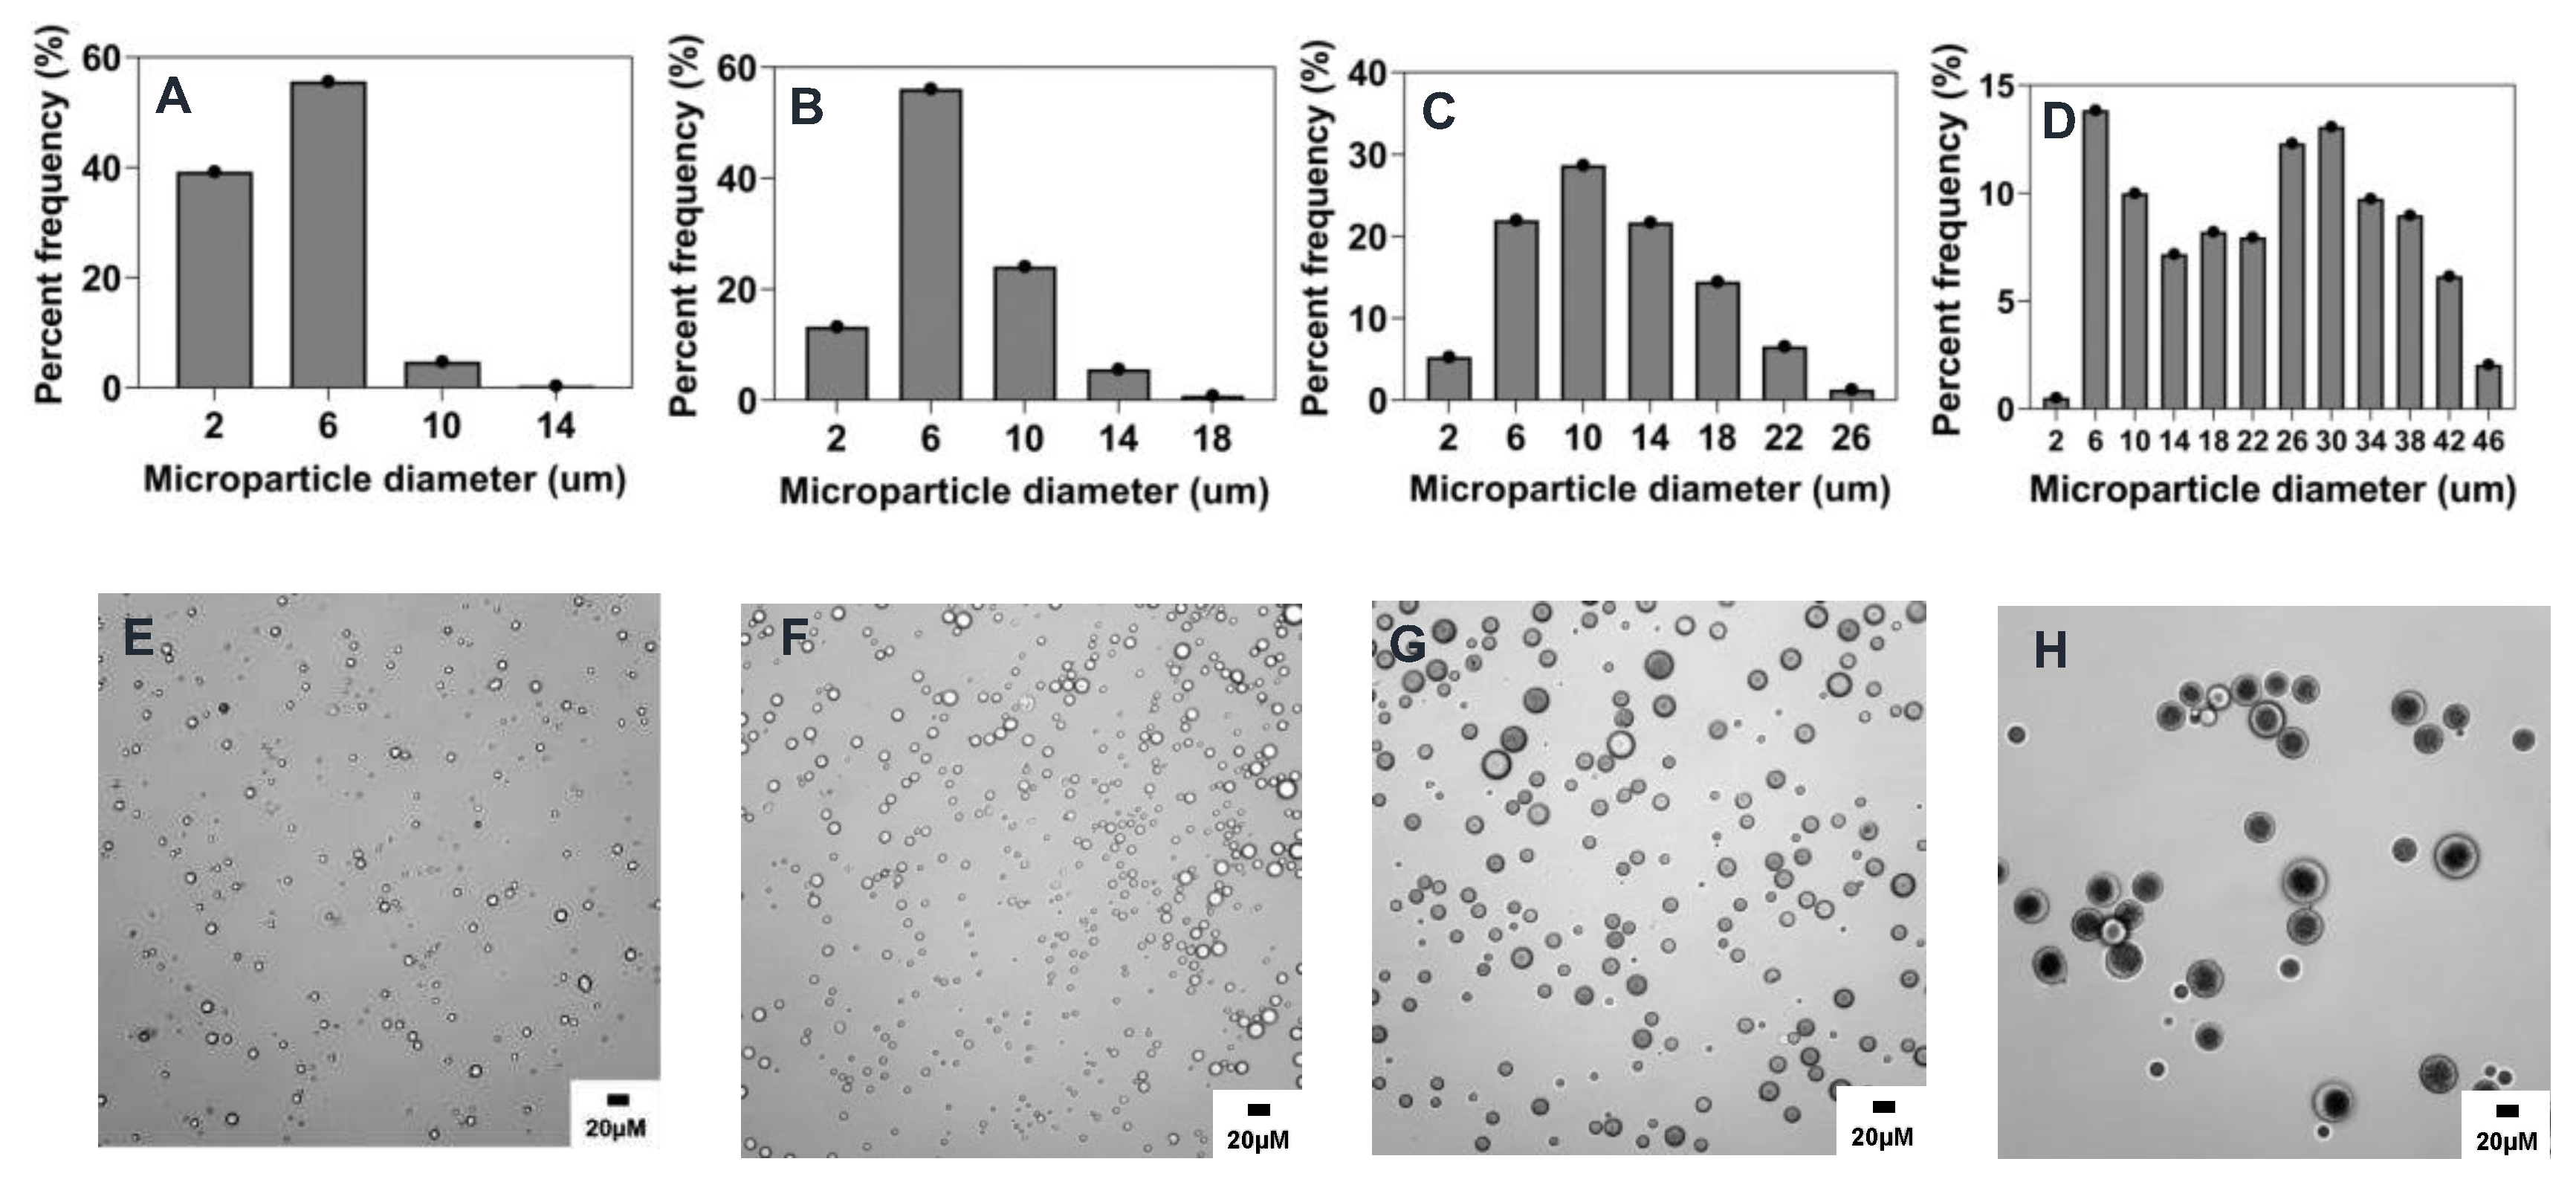
Figure 3.
Effect of surfactant (PVA) concentration (% w/v) on microparticle size and distributions. Optical micrograph and histogram of particle size distribution: A&D) 5% w/v, B&E) 2.5% w/v, C&F) 0.5% w/v.
Figure 3.
Effect of surfactant (PVA) concentration (% w/v) on microparticle size and distributions. Optical micrograph and histogram of particle size distribution: A&D) 5% w/v, B&E) 2.5% w/v, C&F) 0.5% w/v.
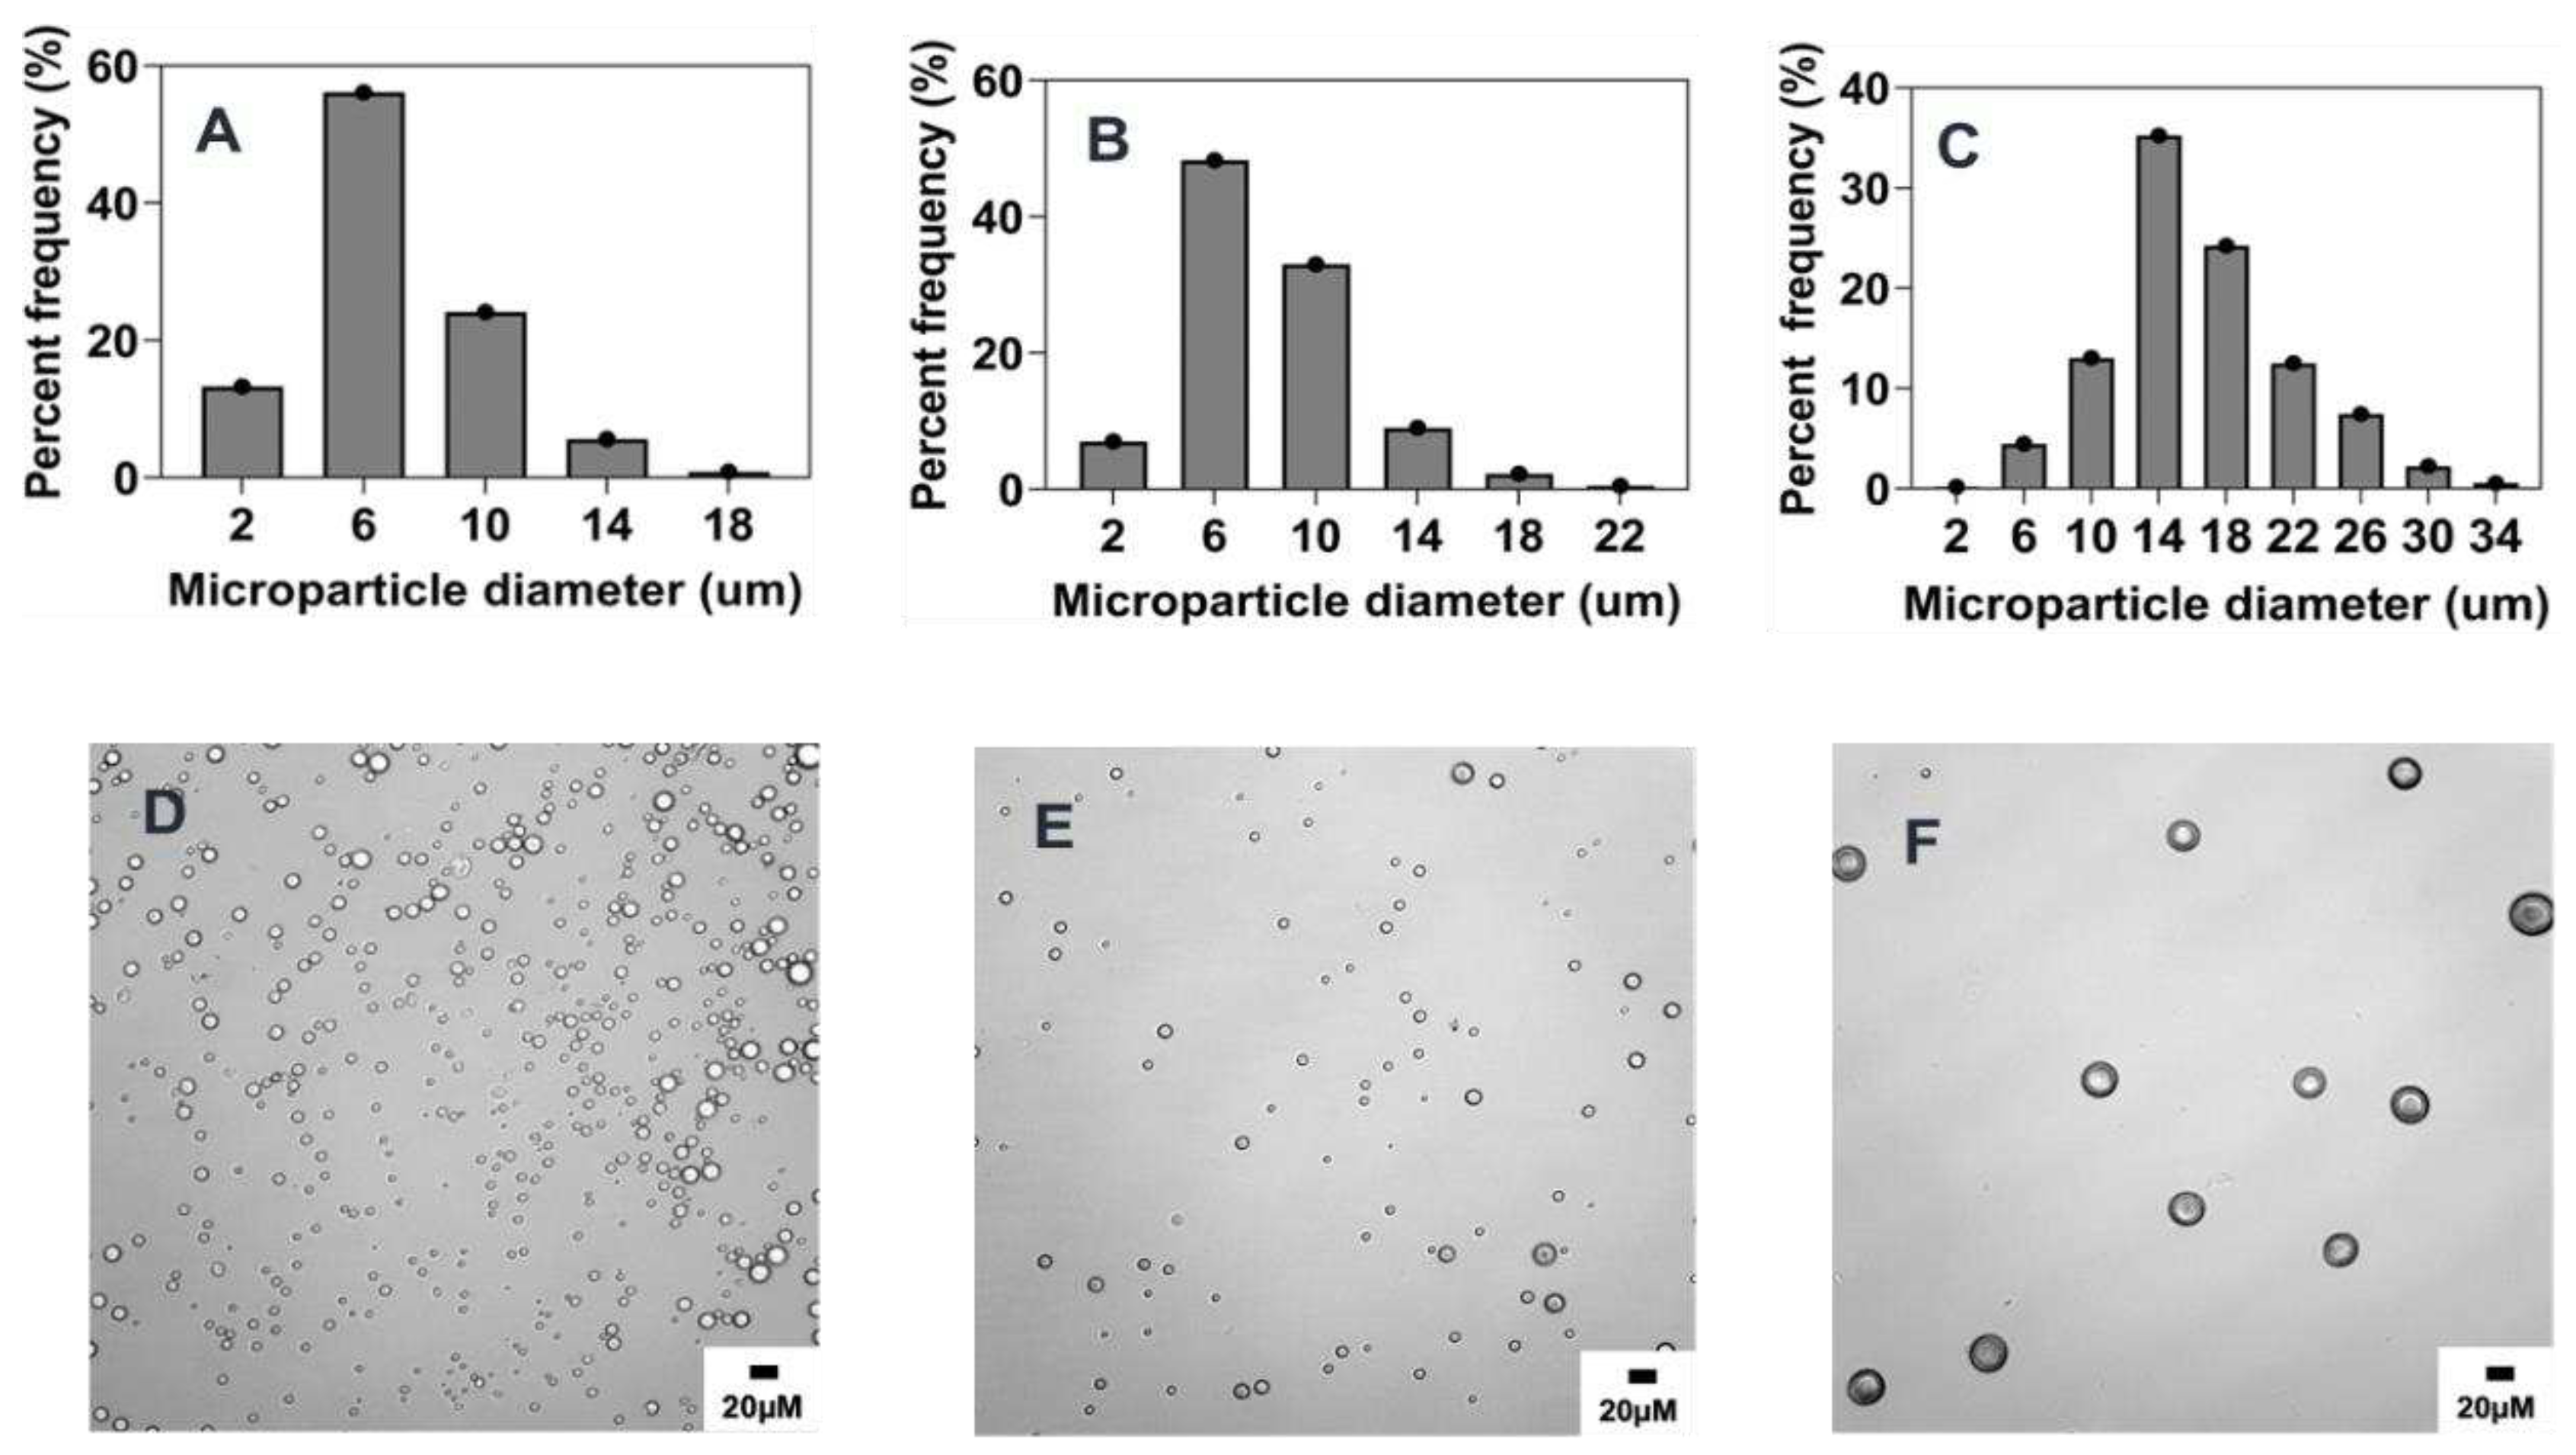
Figure 4.
Effect of organic/aqueous phase flow rate ratio on microparticle size and distributions. Optical micrograph and histogram of particle size distribution: A&D) 0.025, B&E) 0.01, C&F) 0.005.
Figure 4.
Effect of organic/aqueous phase flow rate ratio on microparticle size and distributions. Optical micrograph and histogram of particle size distribution: A&D) 0.025, B&E) 0.01, C&F) 0.005.
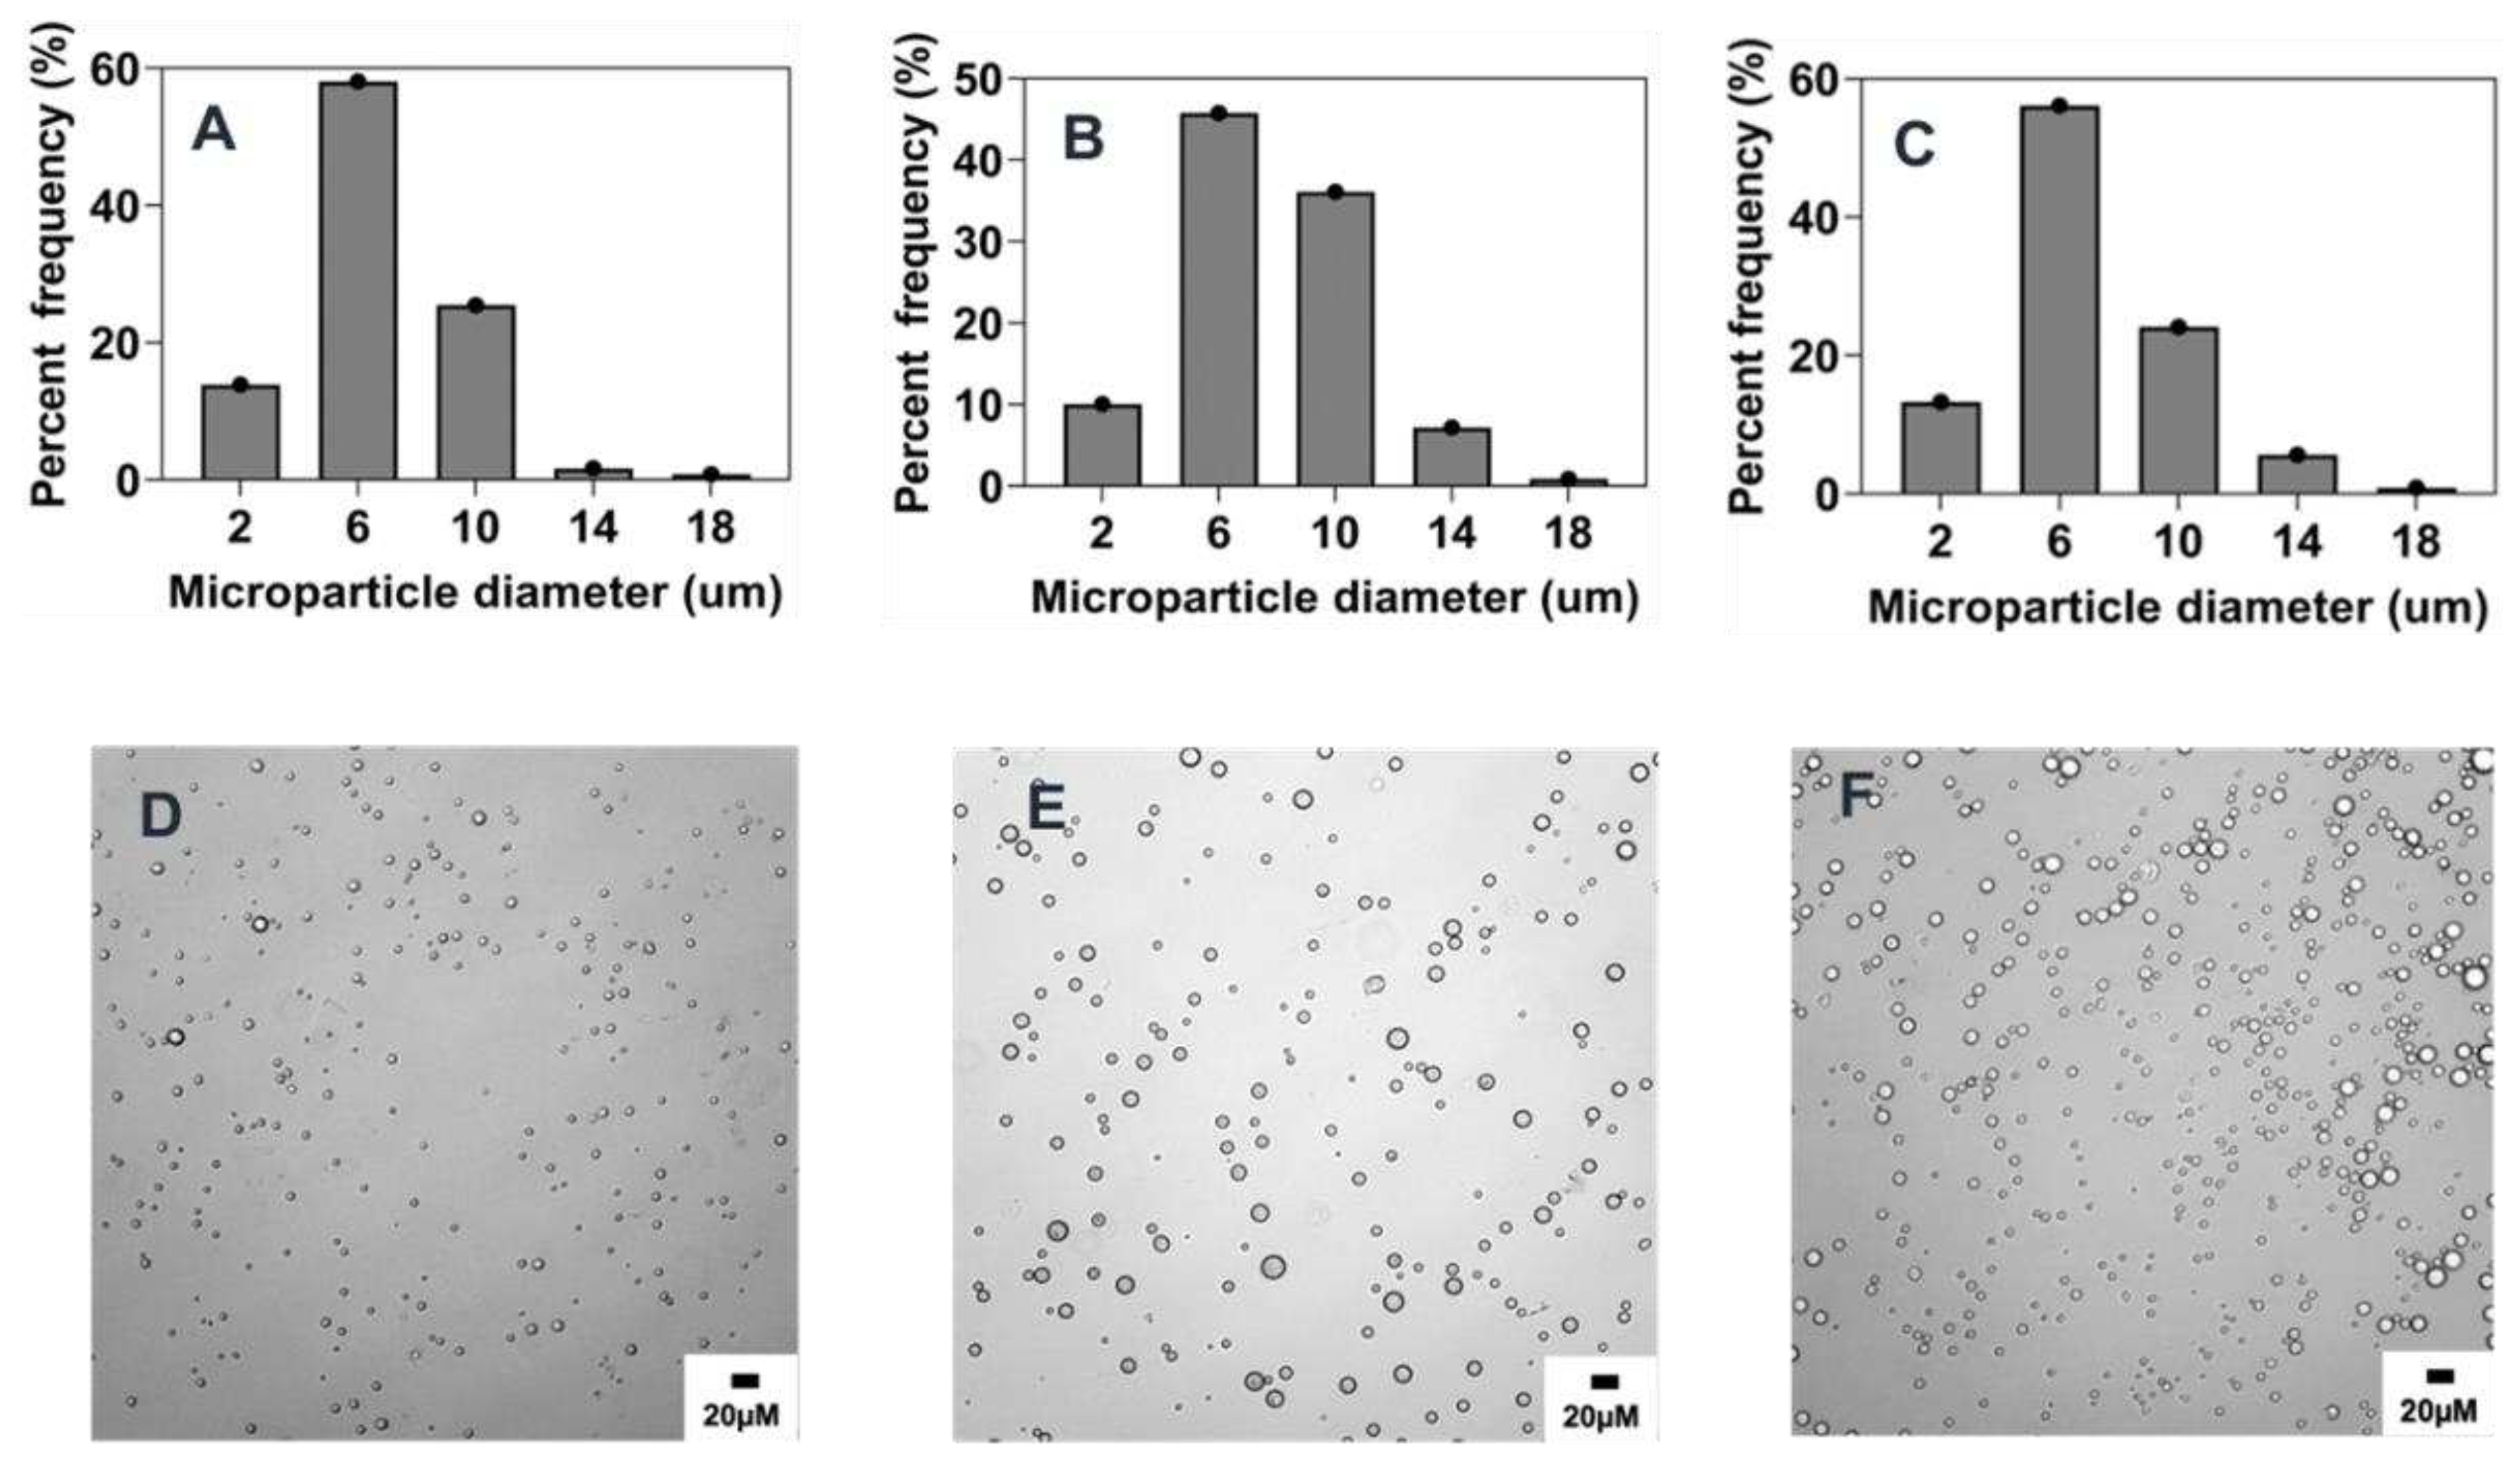
Figure 5.
Effect of polymer concentration (%w/v) on microparticle size and distributions. Optical micrograph and histogram of particle size distribution: A&D) 5% w/v, B&E) 1% w/v, C&F) 0.1% w/v.
Figure 5.
Effect of polymer concentration (%w/v) on microparticle size and distributions. Optical micrograph and histogram of particle size distribution: A&D) 5% w/v, B&E) 1% w/v, C&F) 0.1% w/v.
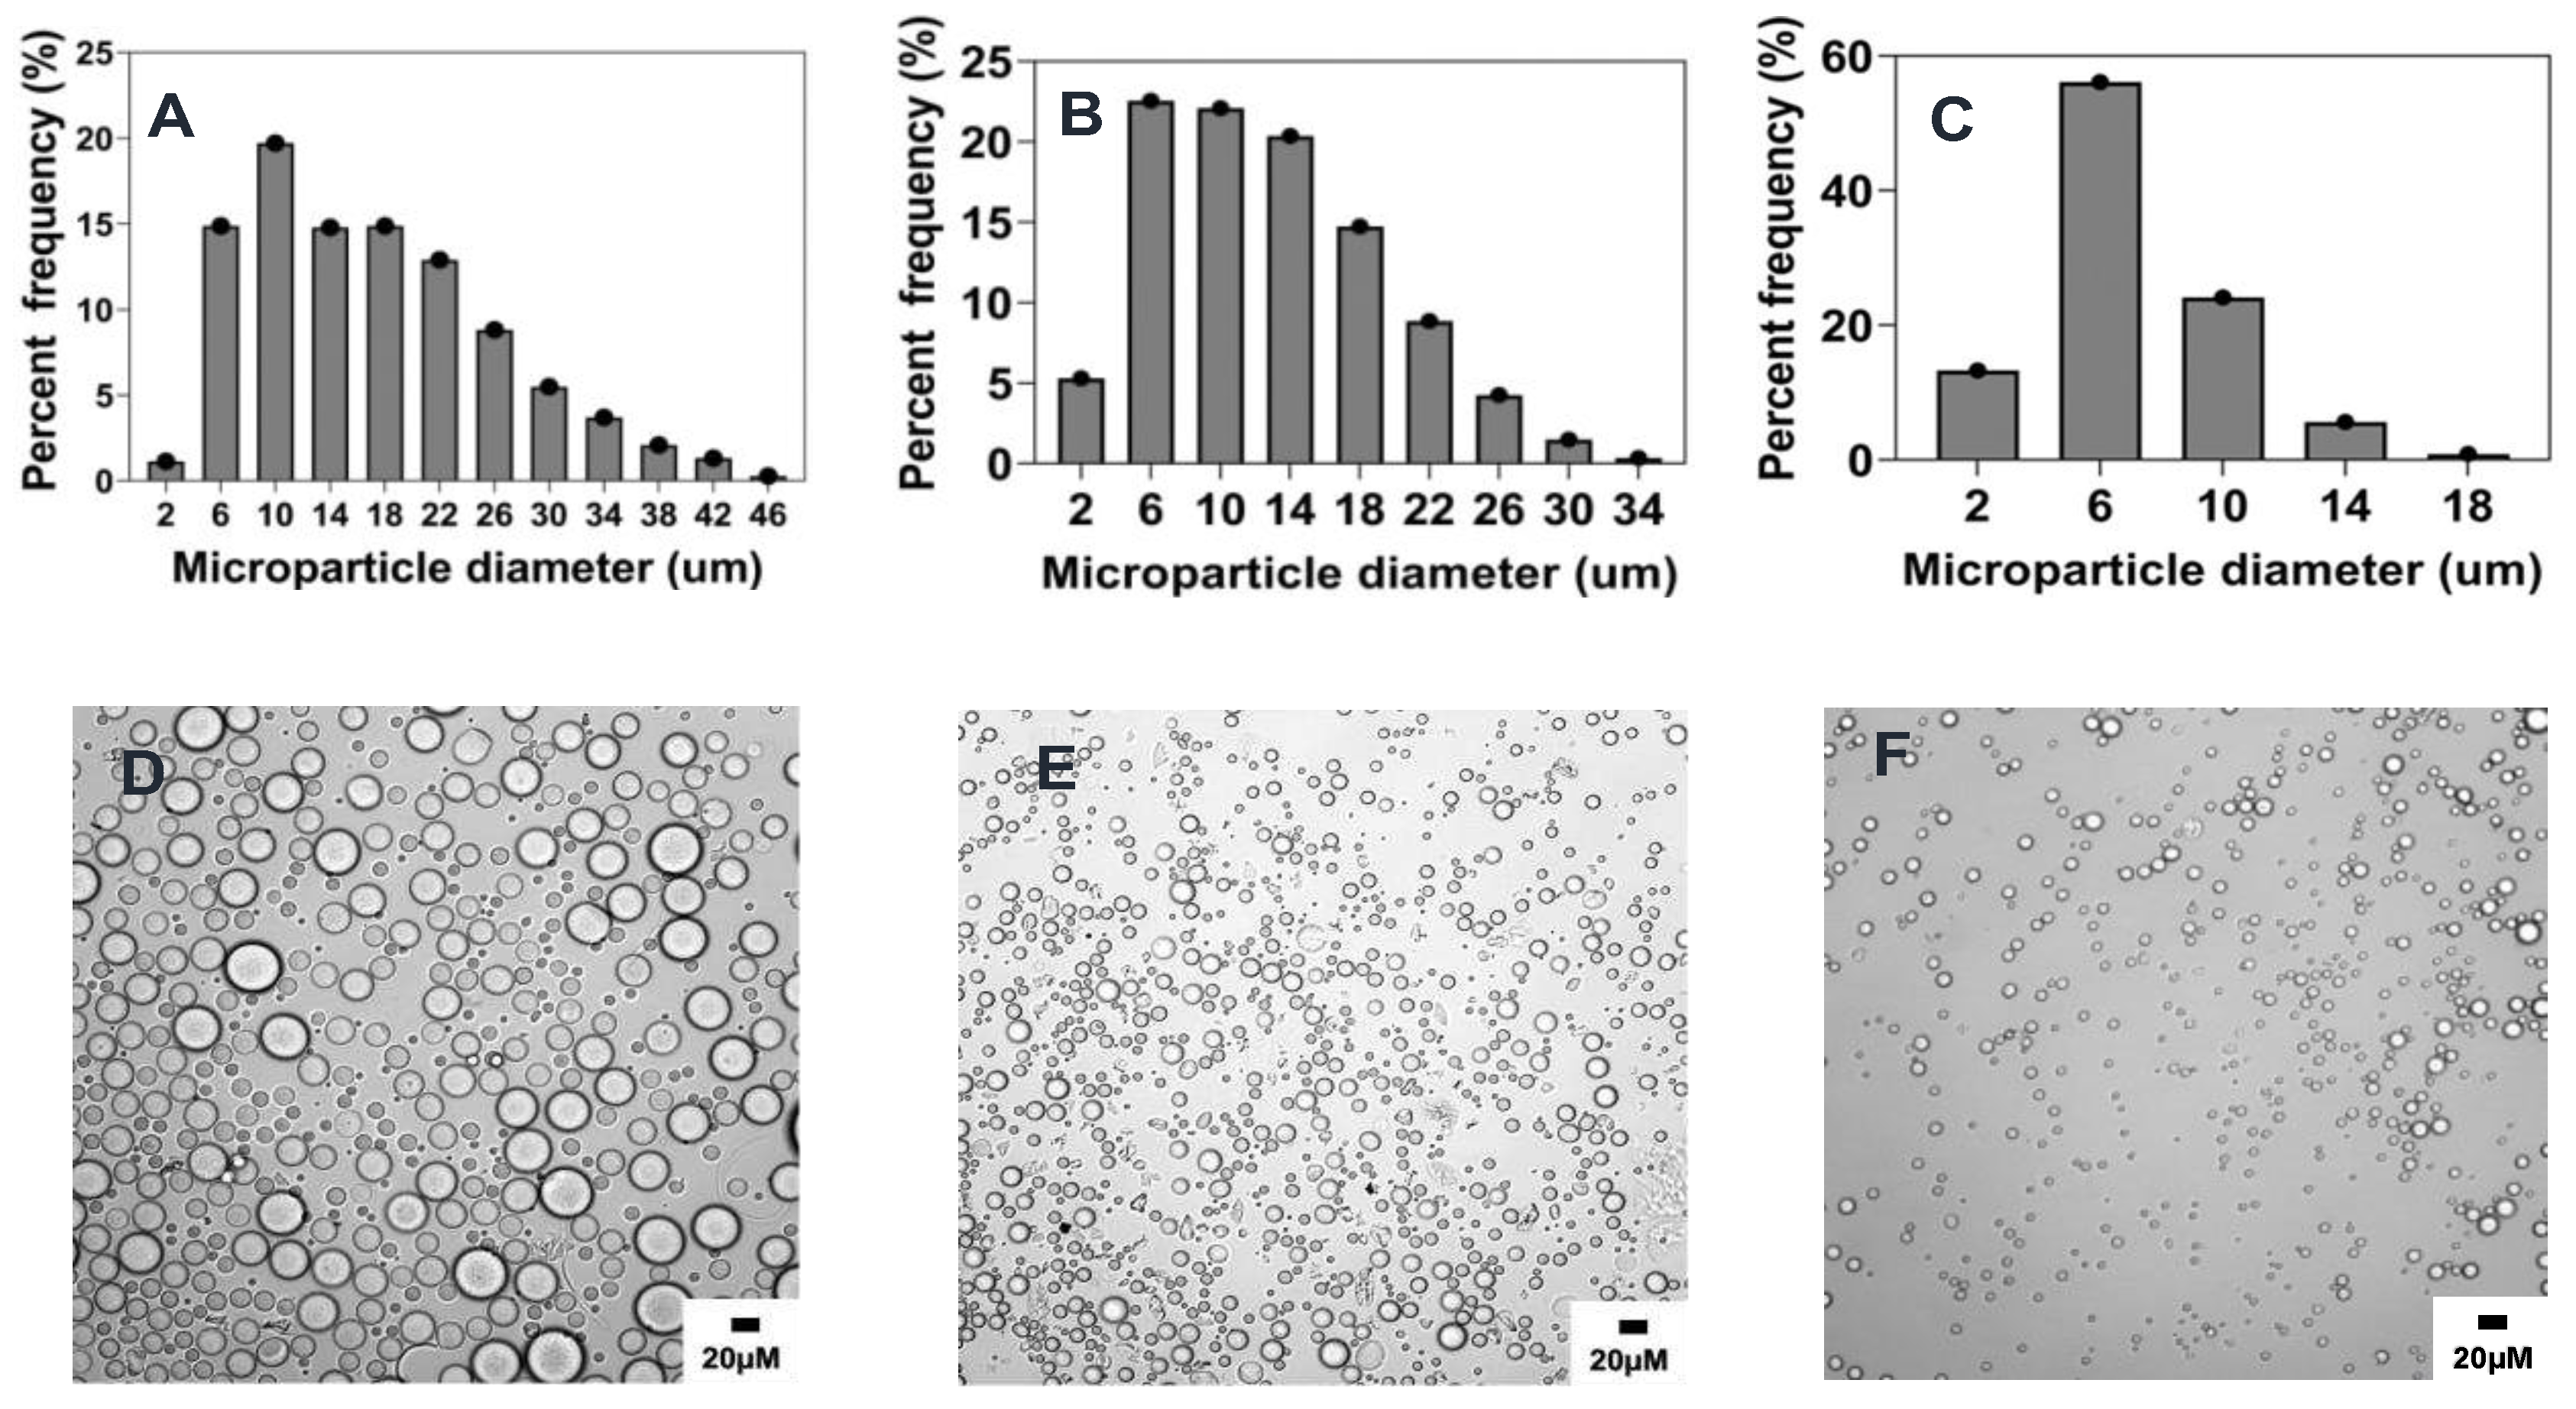
Figure 6.
Effect of organic solvent choice on microparticle size and distributions. Optical micrograph and histogram of particle size distribution: A) DCM, B) ACN: DCM (25:75 v/v).
Figure 6.
Effect of organic solvent choice on microparticle size and distributions. Optical micrograph and histogram of particle size distribution: A) DCM, B) ACN: DCM (25:75 v/v).
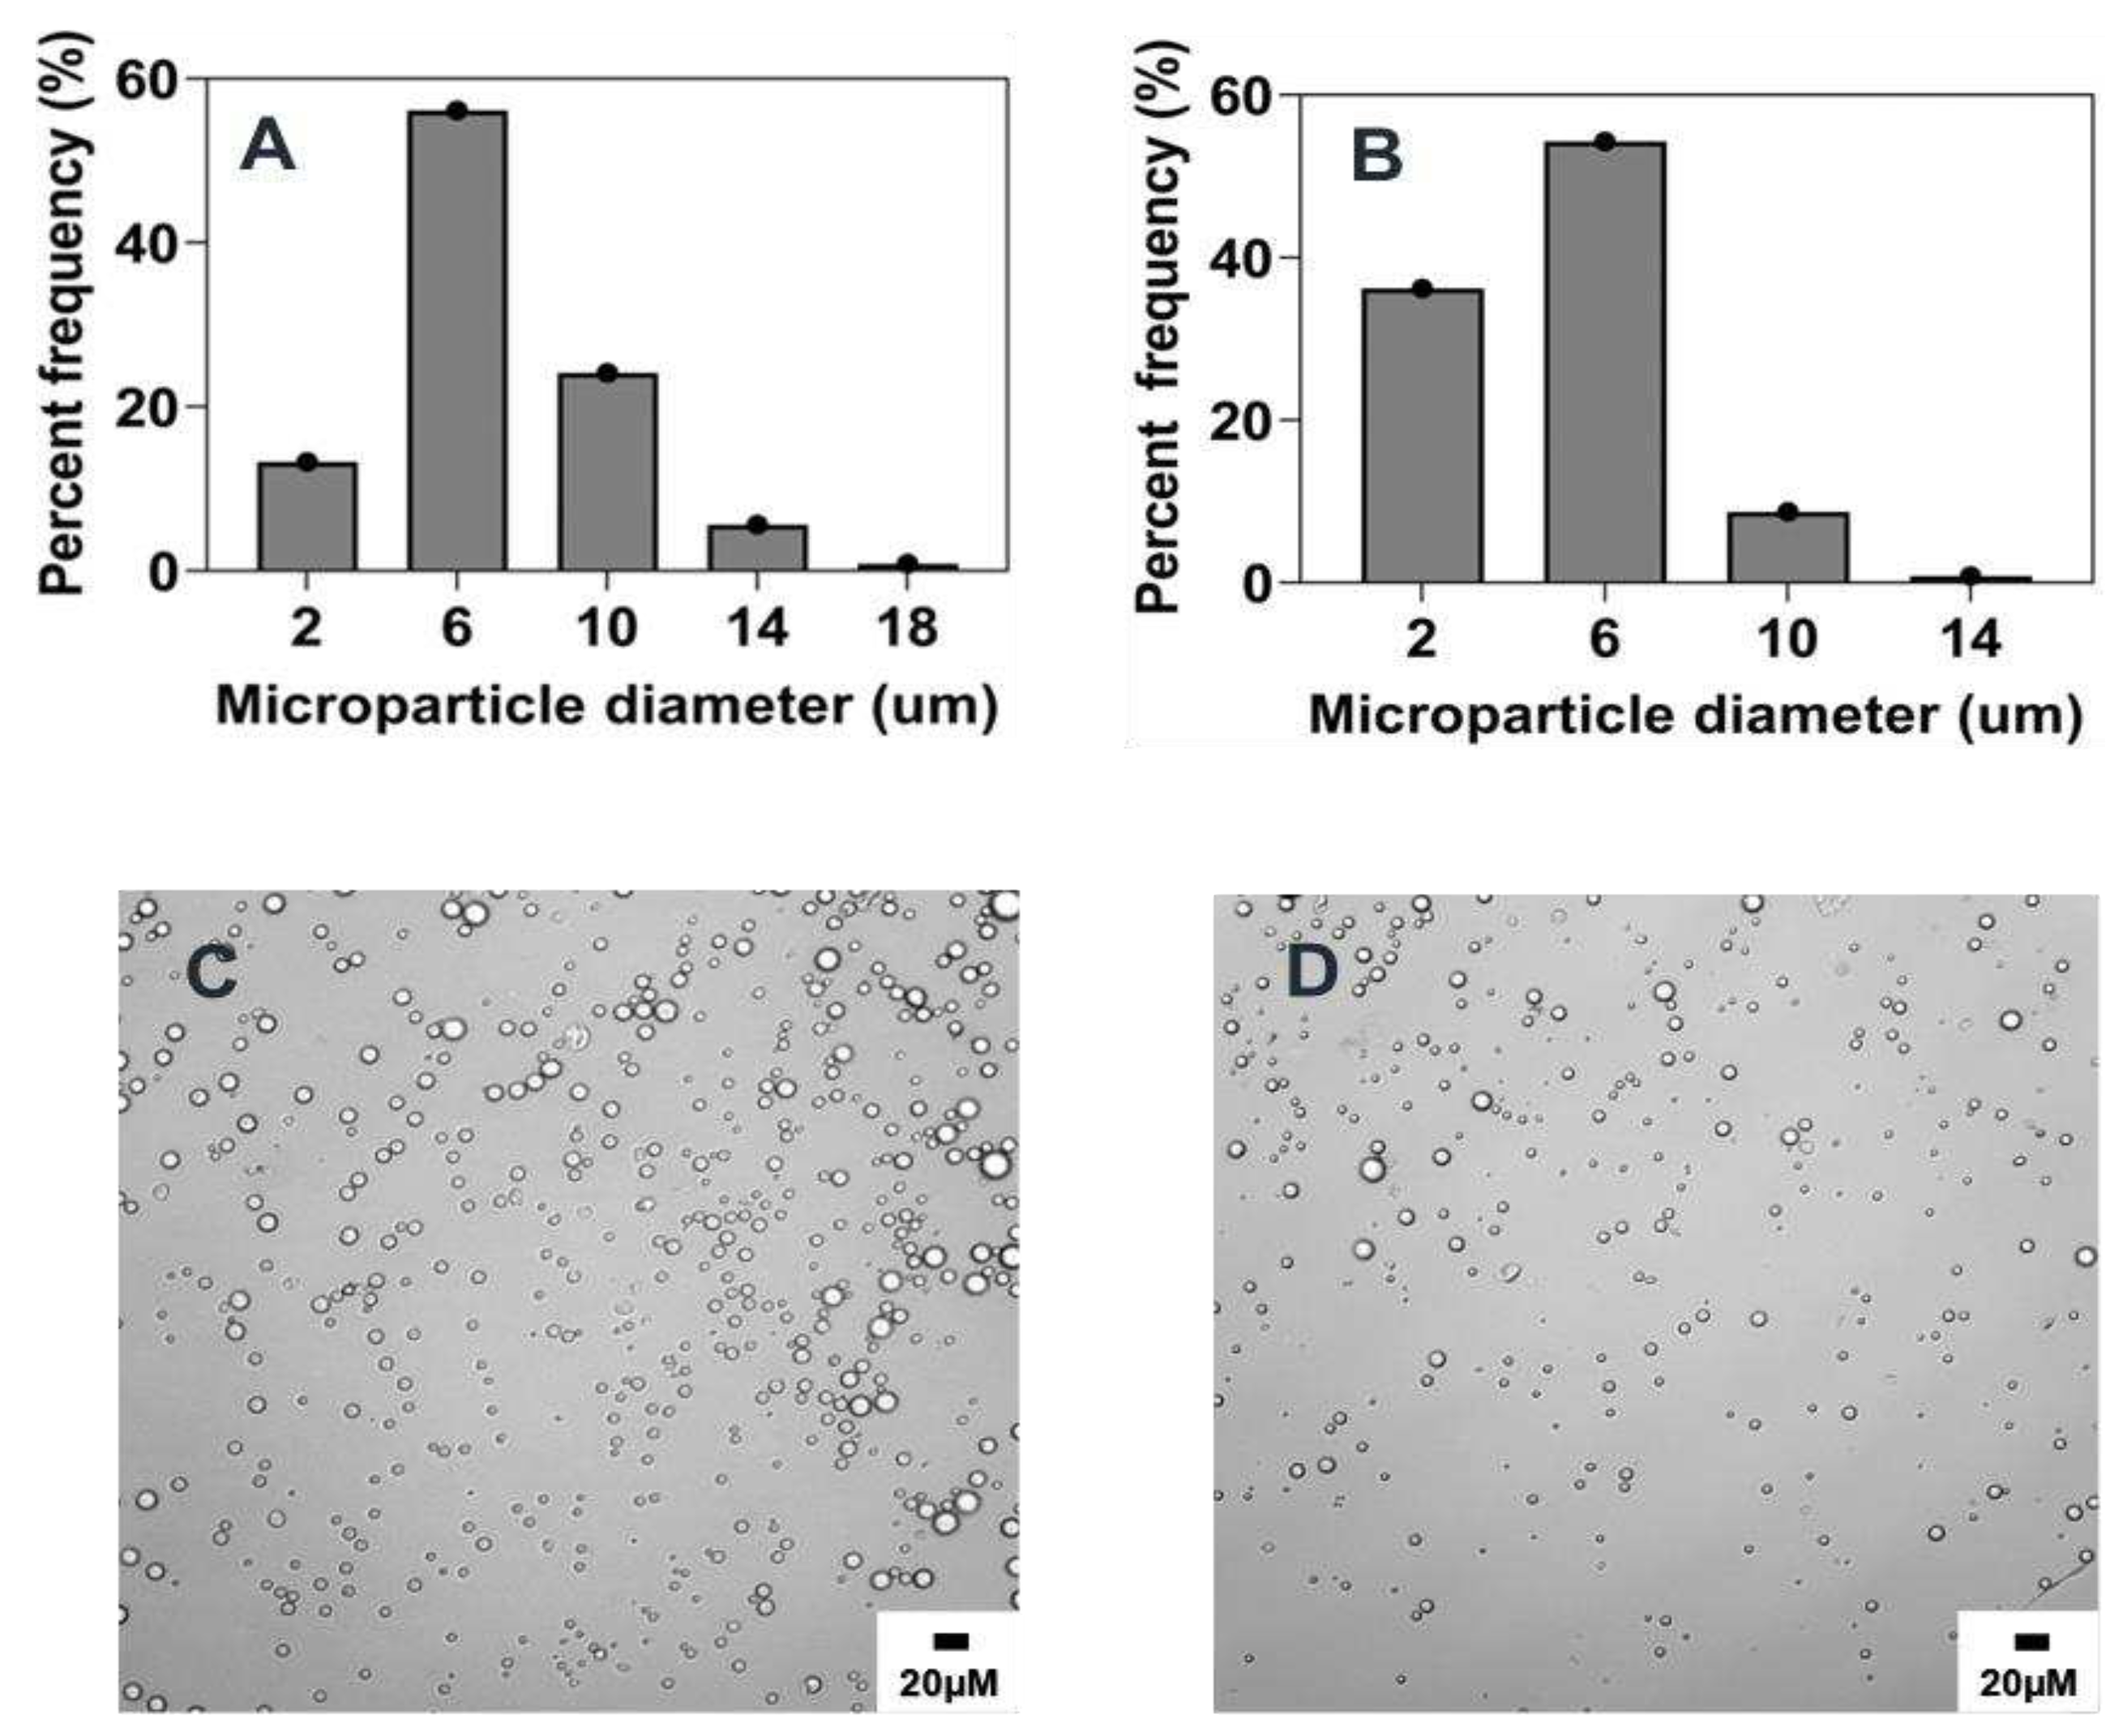
Figure 7.
Effect of organic/aqueous phase volume ratio on microparticle size and distributions. Optical micrograph and histogram of particle size distribution: A&D) 0.02% v/v, B&E) 0.01% v/v, C&F) 0.005% v/v.
Figure 7.
Effect of organic/aqueous phase volume ratio on microparticle size and distributions. Optical micrograph and histogram of particle size distribution: A&D) 0.02% v/v, B&E) 0.01% v/v, C&F) 0.005% v/v.
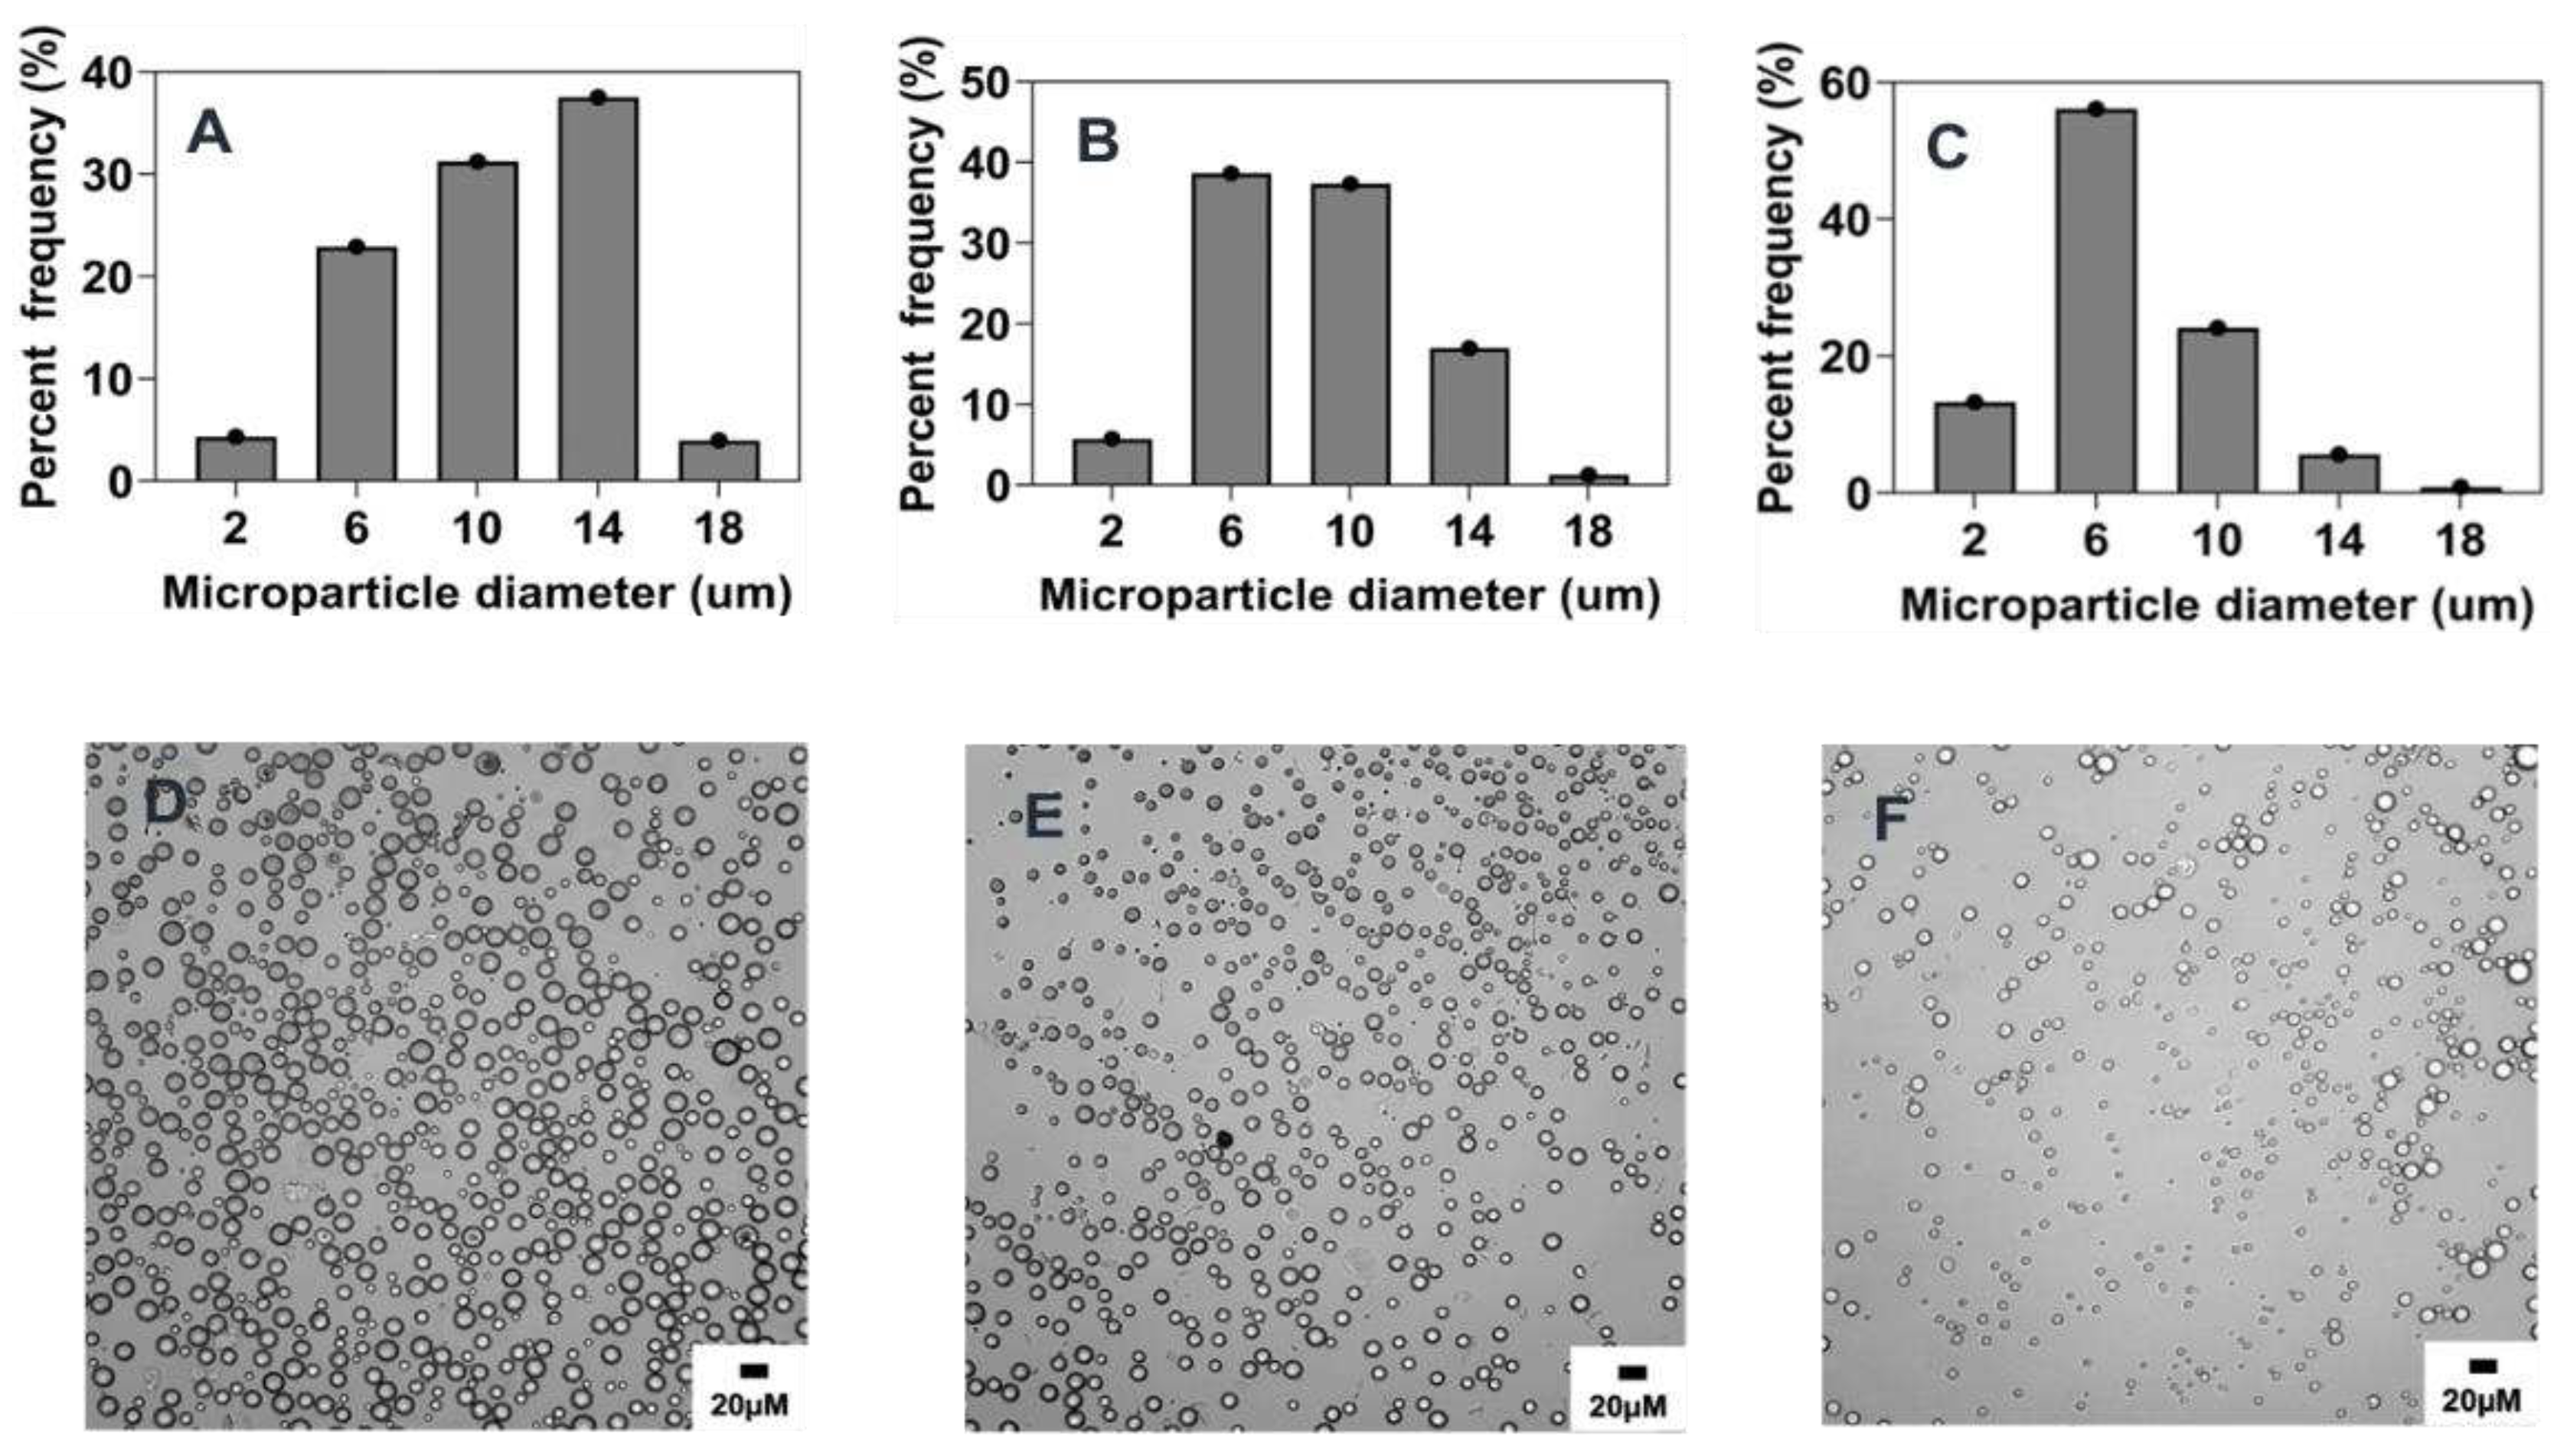
Figure 9.
Optical micrograph and histogram of the particle size distribution of scaled up microparticles produced by different PVR: A&D) 0.005% v/v, B&E) 0.01% v/v, C&F) 0.02% v/v.
Figure 9.
Optical micrograph and histogram of the particle size distribution of scaled up microparticles produced by different PVR: A&D) 0.005% v/v, B&E) 0.01% v/v, C&F) 0.02% v/v.
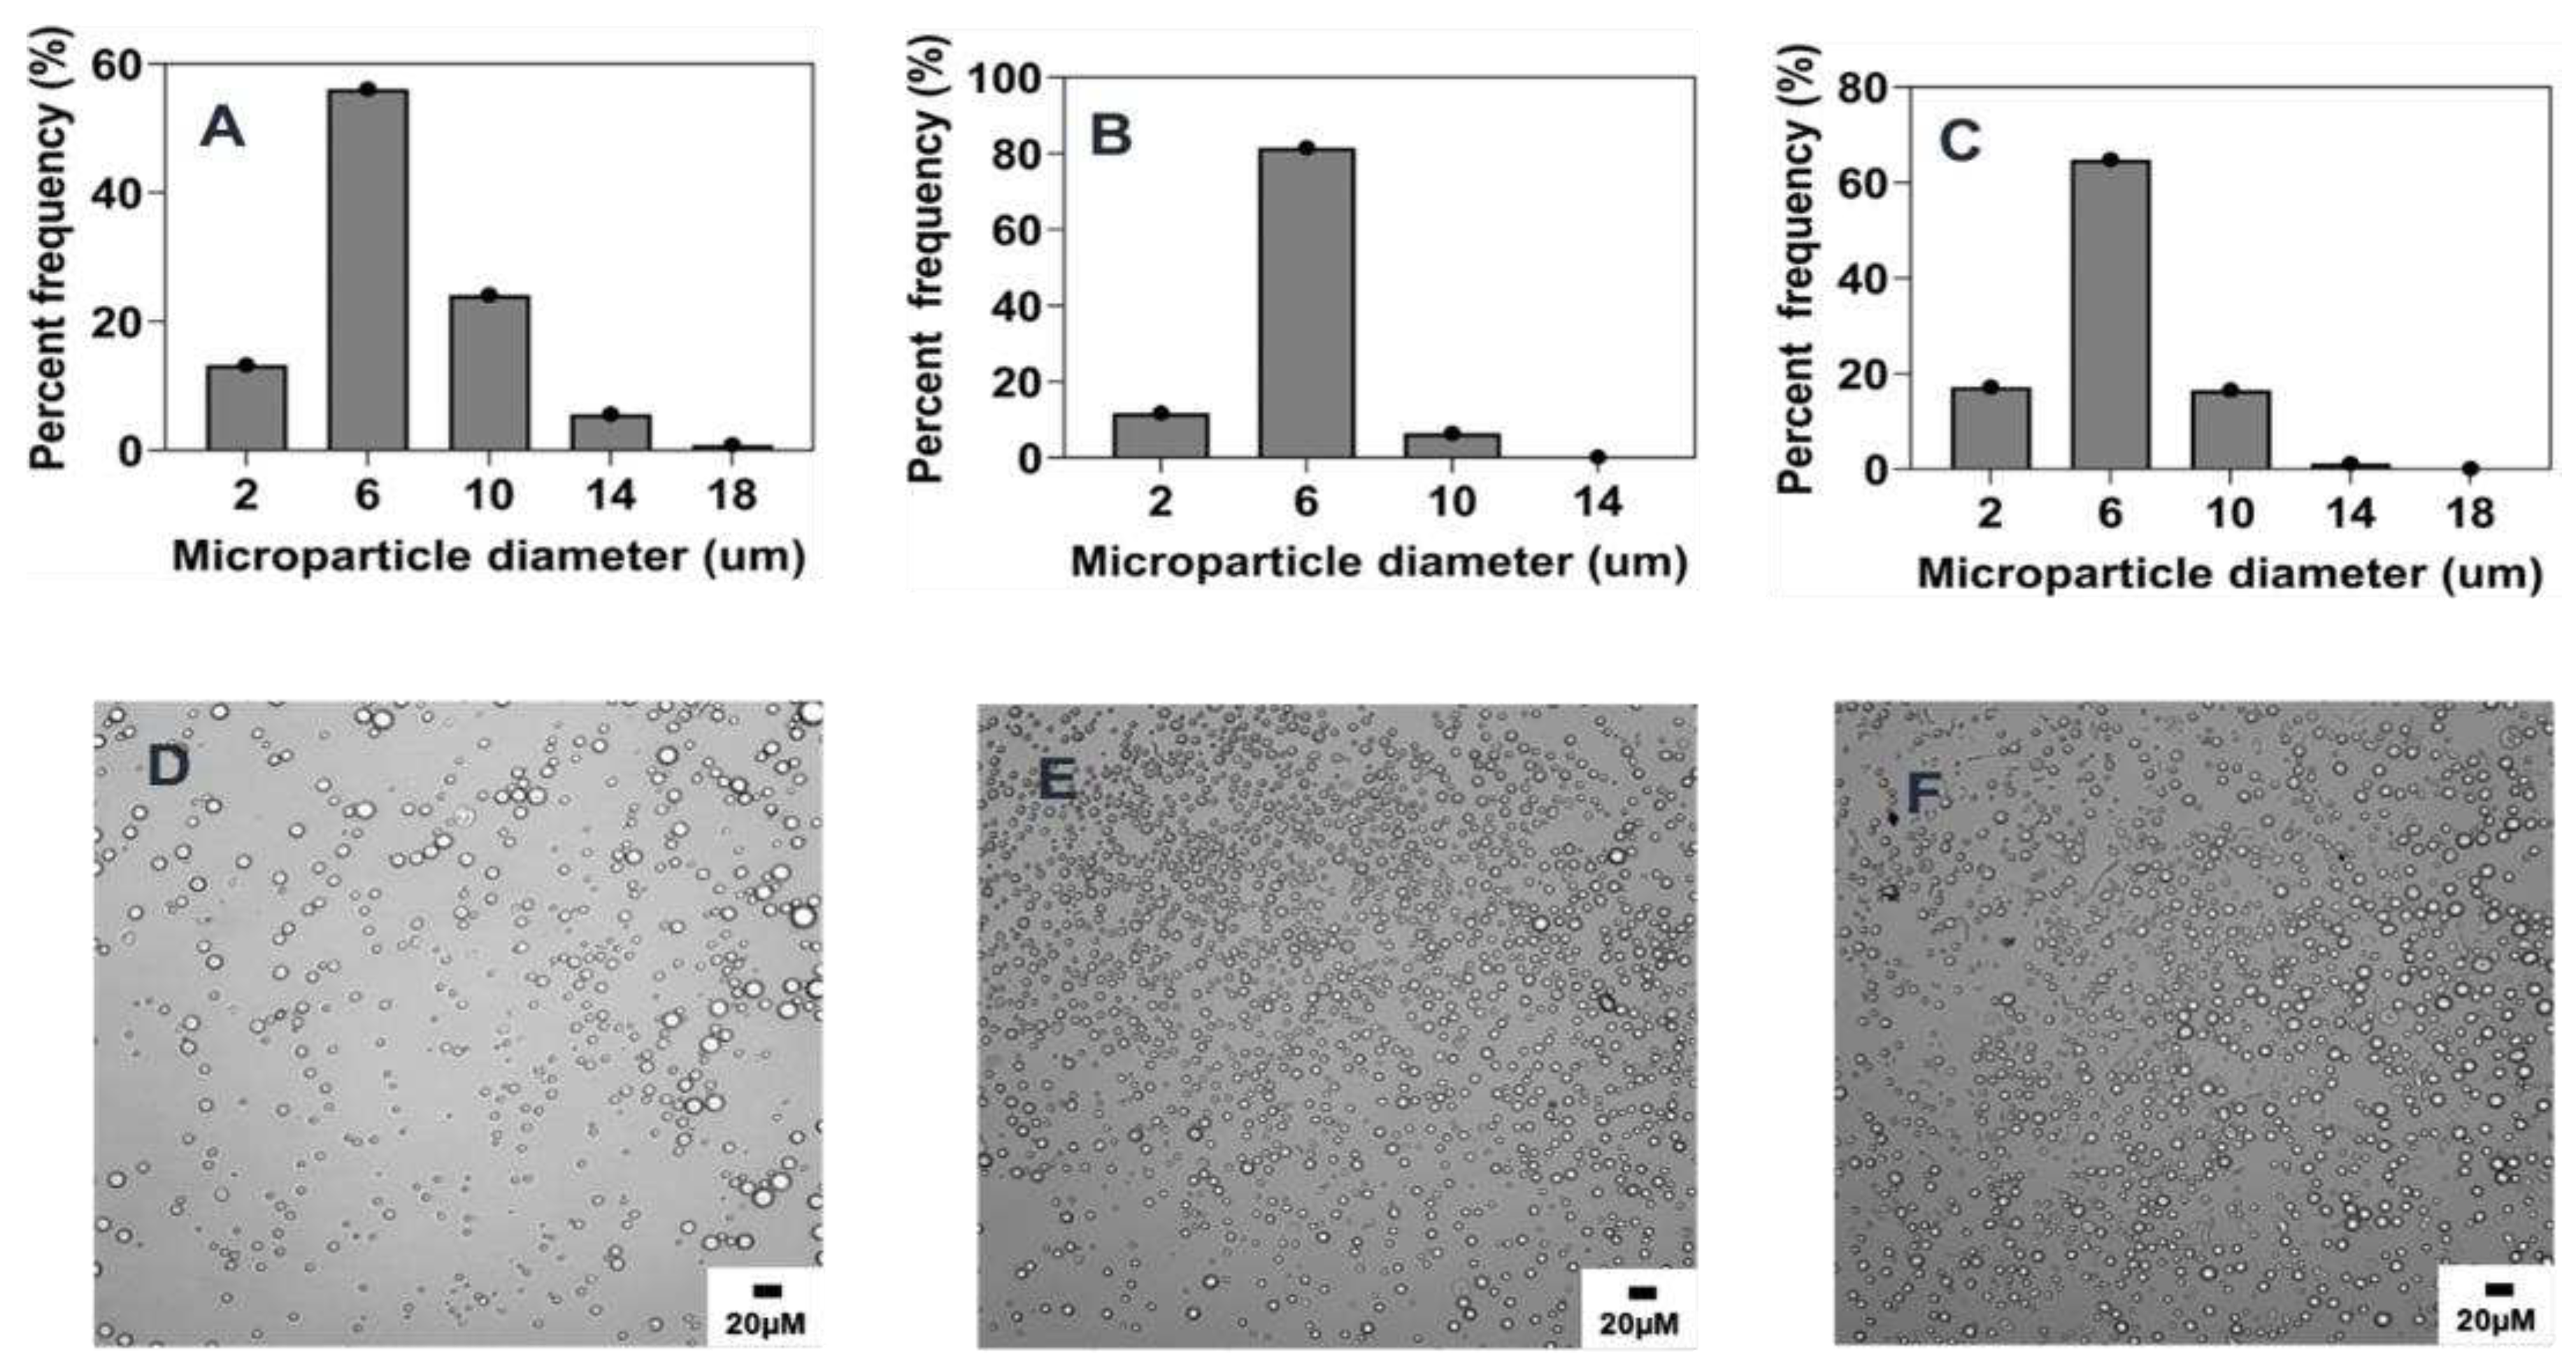
Figure 10.
Optical micrograph and histogram of the particle size distribution of scaled-up microparticles produced by increased polymer concentration: 0.1% w/v (A&D), 1% w/v (B&E), 5% w/v (C&F).
Figure 10.
Optical micrograph and histogram of the particle size distribution of scaled-up microparticles produced by increased polymer concentration: 0.1% w/v (A&D), 1% w/v (B&E), 5% w/v (C&F).
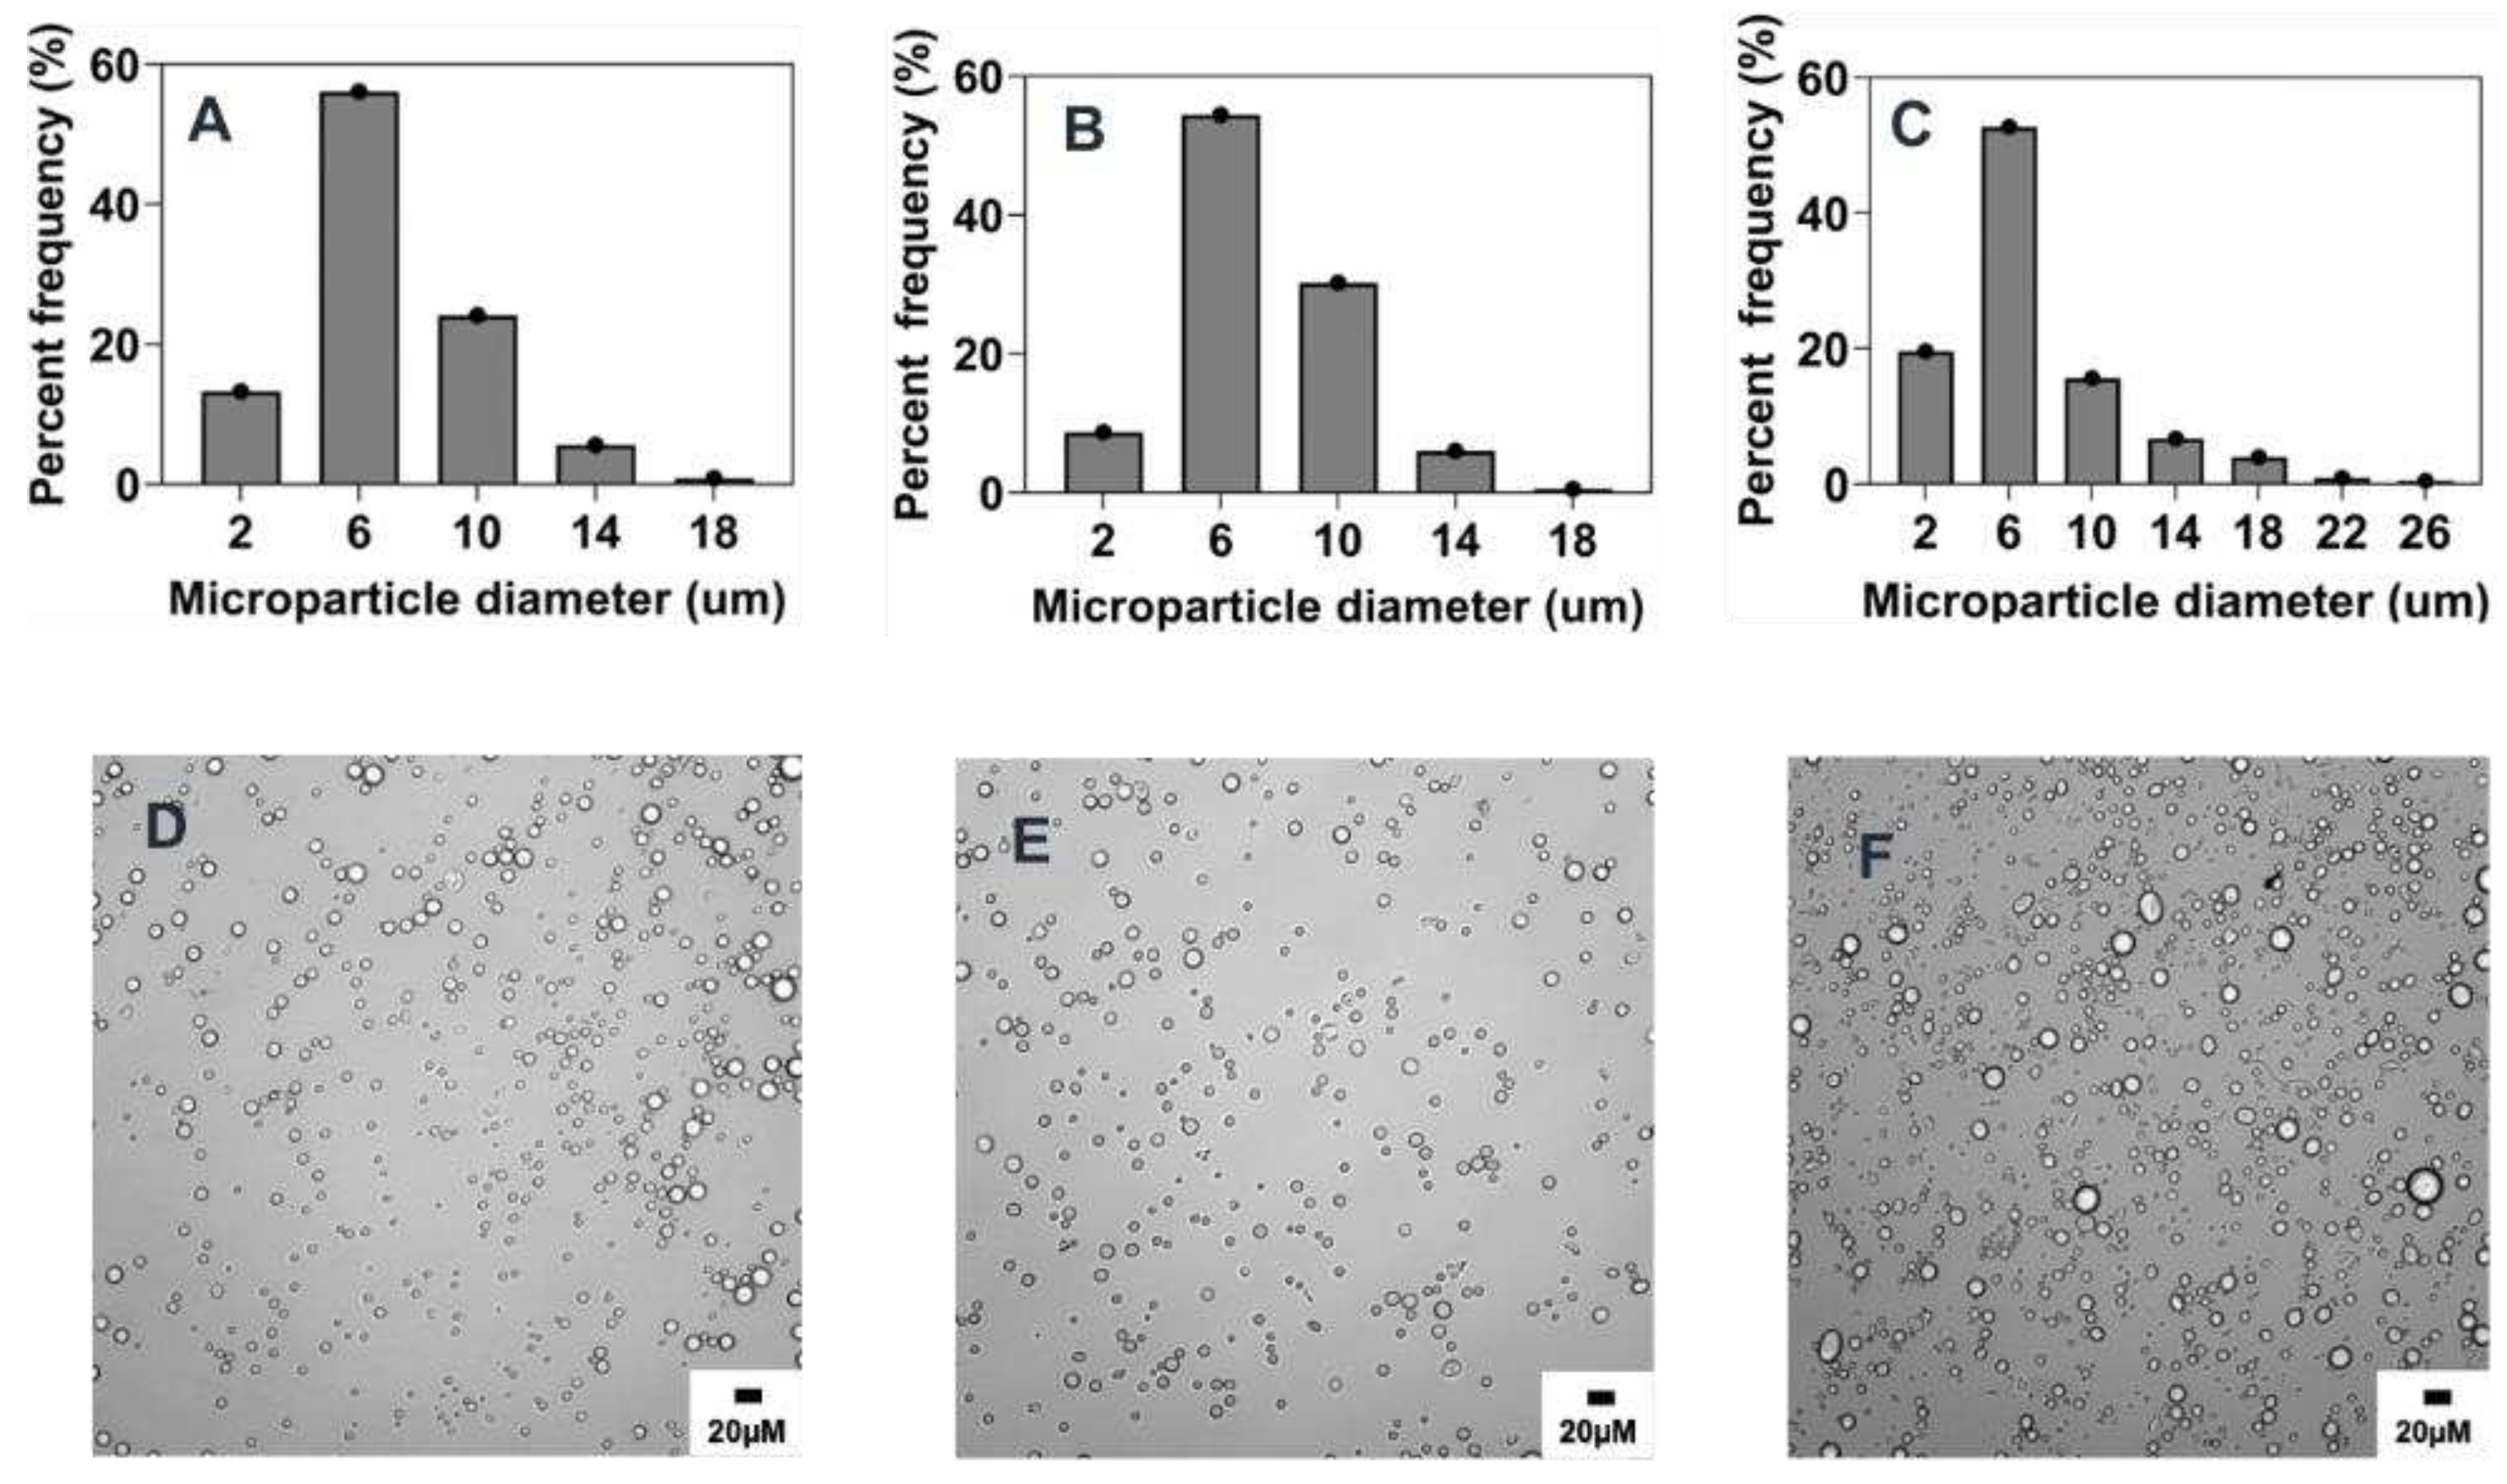
Figure 11.
Fluorescence microscopy characterization of dye-loaded PEG-PLGA microparticles.
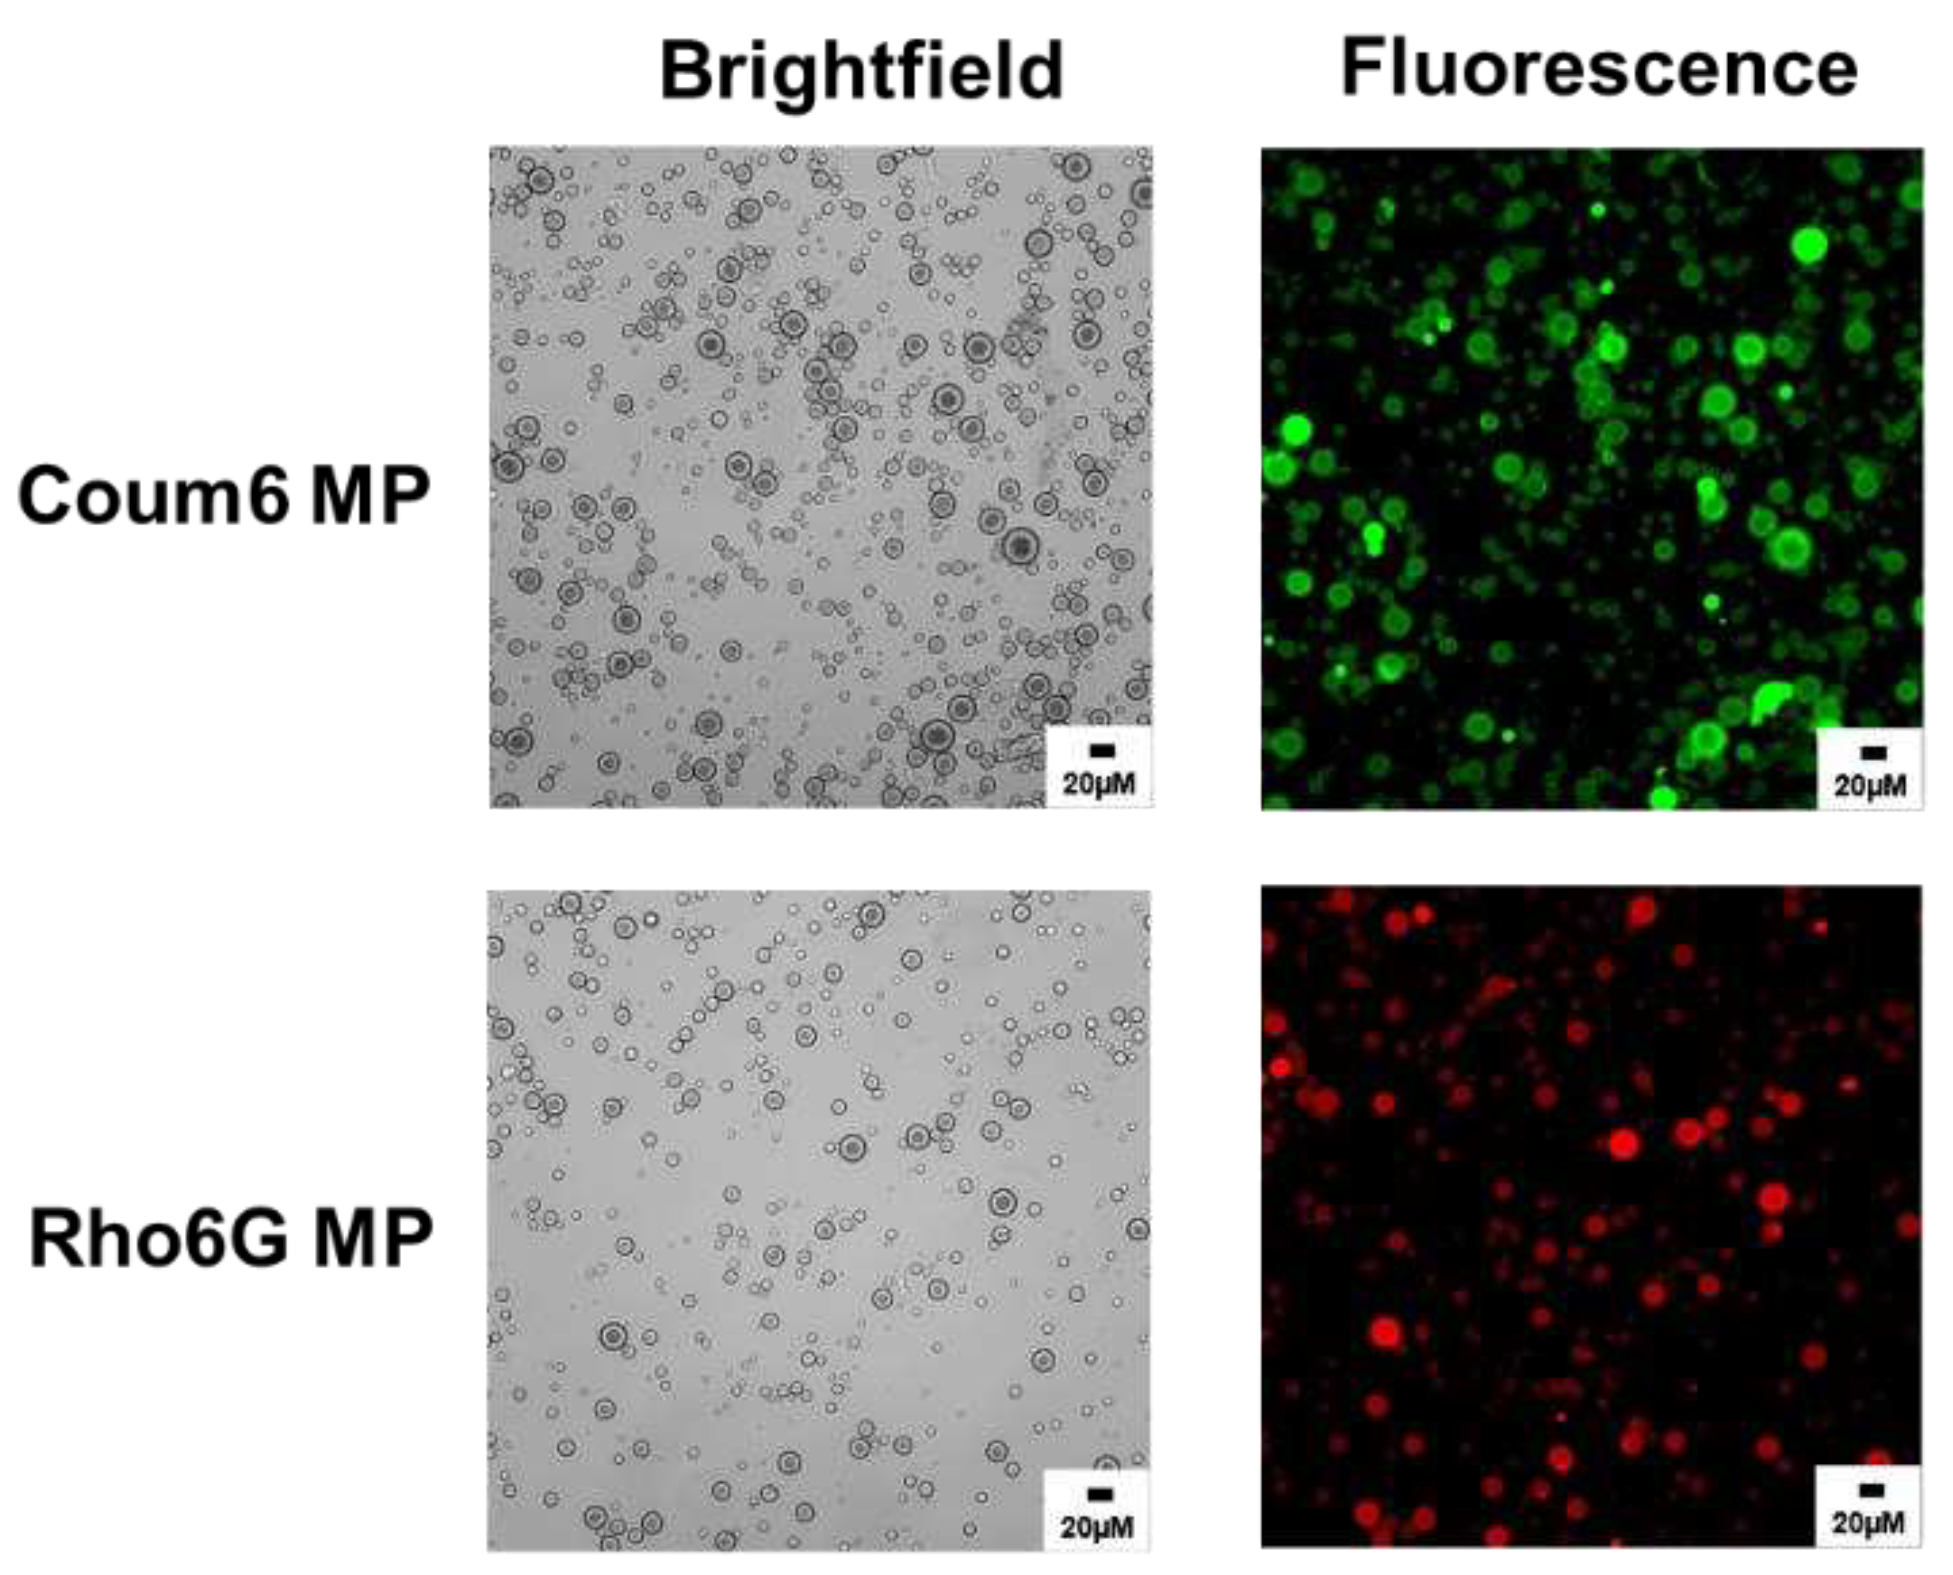
Figure 12.
Release profiles of R6G loaded particles from REF-FM and 1%PC-FM in PBS (0.01M, pH 7.4) under 37°C shaker incubator (n = 2).
Figure 12.
Release profiles of R6G loaded particles from REF-FM and 1%PC-FM in PBS (0.01M, pH 7.4) under 37°C shaker incubator (n = 2).
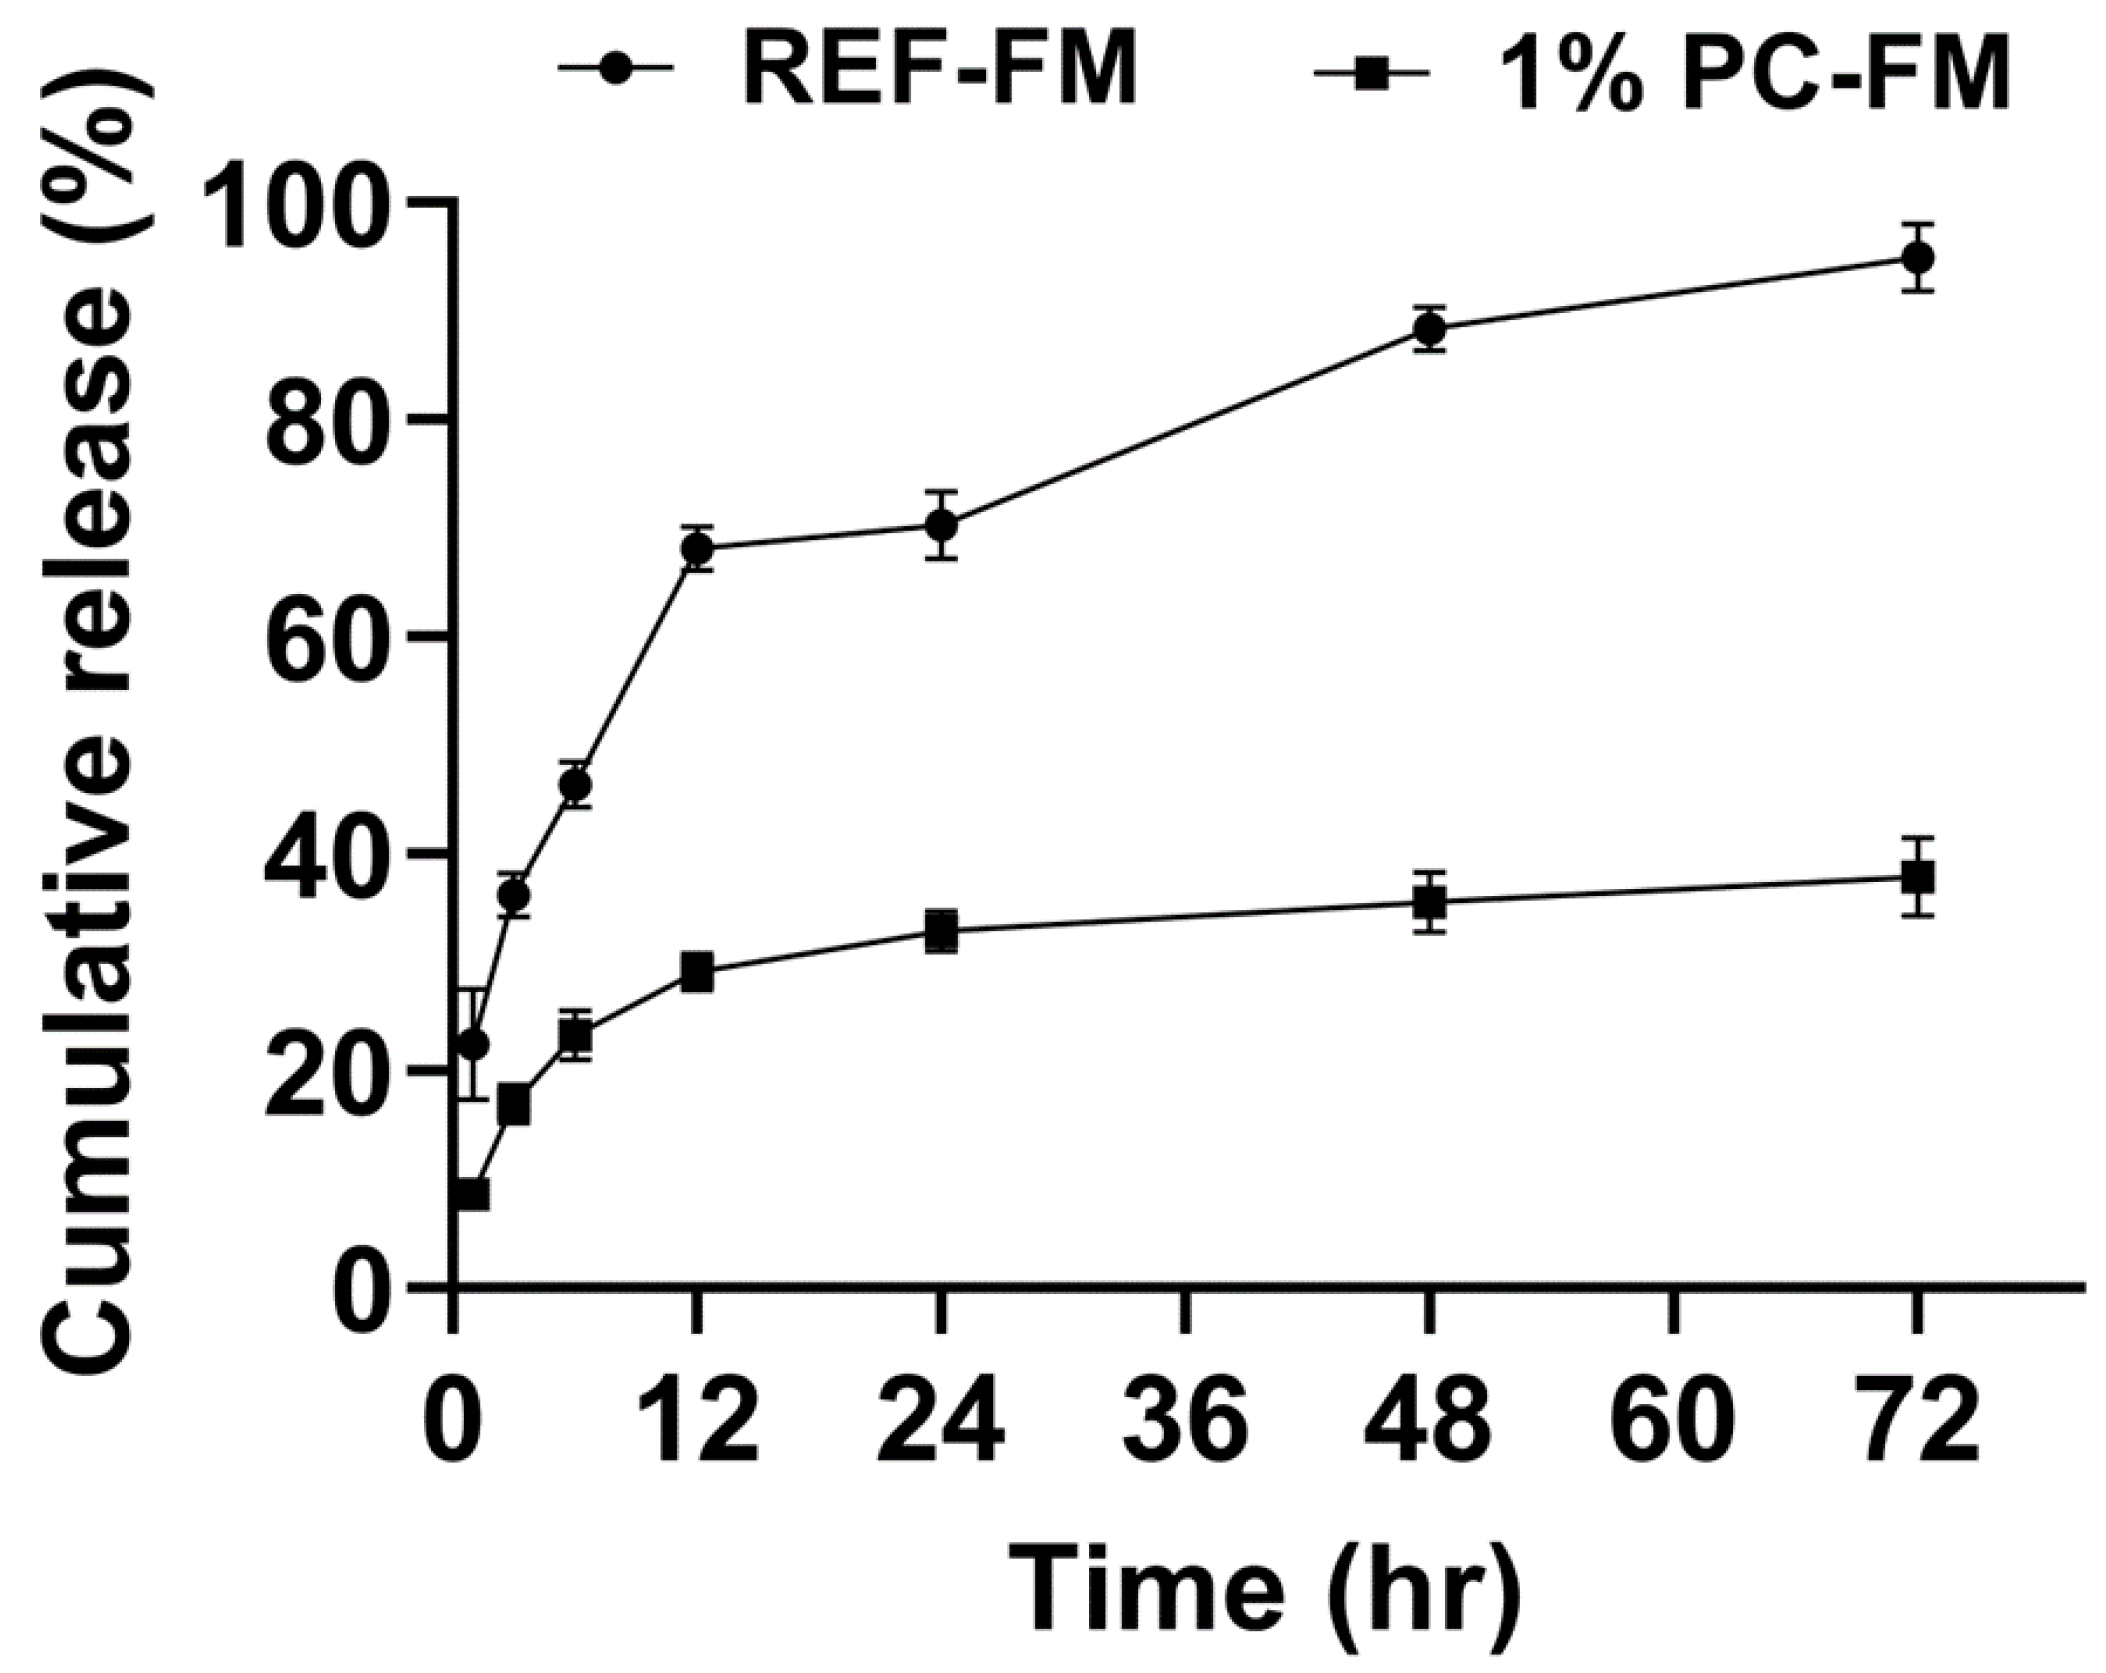

Table 1.
Process parameters varied in this study.
| Parameter. | Condition |
|---|---|
| Stir rate/speed (rpm) | 300, 600, 1000, 1500 |
| Polymer concentration (% w/v) | 0.1, 1, 0.5, 2.5, 5 |
| Surfactant concentration (%w/v) | 0.5, 2.5, 5 |
| Organic/aqueous volume ratio (% v/v) | 0.005, 0.01, 0.02 |
| Organic/aqueous flow rate ratio (ml/hr) | 0.005, 0.01, 0.025 |
| Organic solvent choice (%v/v) | 25% acetonitrile in DCM, DCM |
Note: The parameters in bold represent the ones used for fabrication of reference formulation.
Table 2.
Summary of process parameters affecting PEG-PLGA microparticle size and polydispersity.
| Parameter | Formulation | Mean Size (µm ± sd) | %CV |
|---|---|---|---|
| Reference | Reference | 6.8 ± 3.1 | 1.5 |
| Stir Rate | 300 rpm | 23.2 ± 11.7 | 8.3 |
| 600 rpm | 11.7 ± 5.3 | 5.2 | |
| 1500 rpm | 4.7 ± 1.9 | 10.2 | |
| Polymer (PEG-PLGA) concentration | 1% w/v | 12.5 ± 6.5 | 4.8 |
| 5% w/v | 17.1 ± 9 | 5.8 | |
| Surfactant (PVA) concentration | 0.5% w/v | 16.5 ± 5.4 | 4.2 |
| 2.5% w/v | 7.5 ± 3.5 | 4 | |
| Organic/aqueous phase volume Ratio | 0.01% v/v | 8.8 ± 3.3 | 4.5 |
| 0.02% v/v | 10.5 ± 3.8 | 5.7 | |
| Organic/aqueous phase flow rate Ratio | 0.01 | 7.5 ± 3.1 | 5.3 |
| 0.025 | 6.5 ± 2.7 | 4.5 | |
| Organic solvent | 25% w/v ACN/DCM | 4.9 ± 2.2 | 17 |
Note: Mean size(µm ± sd) was determined by combining all individual microparticles across 3 different runs as a single batch. %CV was determined by the ratio of the SD to the mean expressed as a percentage based on the average value of the 3 independent runs.
Table 3.
Scalability and tunability of method via phase volume ratio (PVR) modification.
| Formulation | Mean size (µm ± sd) | %CV |
|---|---|---|
| Reference 0.005 PVR, 1000 rpm | 6.8 ± 3.1 | 1.5 |
| 0.01 PVR, 5% PVA, 1500 rpm | 5.7 ± 1.5 | 0.27 |
| 0.02 PVR, 7% PVA, 1500 rpm | 6.1 ± 2.2 | 0.36 |
Table 4.
Scalability and tunability of method via increasing polymer concentration.
| Formulation | Formulation Parameters | Size (μm) | CV |
|---|---|---|---|
| REF- FM | 0.1%w/v PC, 5% PVA,1000 rpm | 6.8 ± 3.1 | 0.45 |
| 1% PC-FM | 1% w/v PC, 5% PVA, 1500 rpm | 7.1 ± 2.7 | 0.38 |
| 5% PC-FM | 5% w/v PC, 7% PVA, 1500 rpm | 7.2 ± 4.1 | 0.57 |
Note: Formulation code: REF FM: Reference formulation; 1% PC-FM: 1% w/v polymer concentration formulation; 5% PC-FM: 5% w/v polymer concentration formulation.
Table 5.
Drug loading and encapsulation efficiency of Coum MP and Rho MP.
| Formulation | Encapsulation Efficiency (%) | Drug Loading (%) |
|---|---|---|
| REF-FM with Rho | 3.43 ± 0.65 | 0.16 ± 0.04 |
| 1% PC-FM | 36 ± 5.57 | 0.50 ± 0.16 |
| 5% PC-FM | 48.12 ± 3.1 | 0.12 ± 0.02 |
| REF-FM with Coum | 12.18 ± 0.45 | 0.65 ± 0.13 |
Disclaimer/Publisher’s Note: The statements, opinions and data contained in all publications are solely those of the individual author(s) and contributor(s) and not of MDPI and/or the editor(s). MDPI and/or the editor(s) disclaim responsibility for any injury to people or property resulting from any ideas, methods, instructions or products referred to in the content. |
© 2023 by the authors. Licensee MDPI, Basel, Switzerland. This article is an open access article distributed under the terms and conditions of the Creative Commons Attribution (CC BY) license (http://creativecommons.org/licenses/by/4.0/).
Copyright: This open access article is published under a Creative Commons CC BY 4.0 license, which permit the free download, distribution, and reuse, provided that the author and preprint are cited in any reuse.


