
Submitted:
24 July 2023
Posted:
25 July 2023
You are already at the latest version
Abstract
An experiment was conducted in 2016 & 2017 for development of novel rice hybrids for aerobic ecology with lesser yield penalties in comparison to irrigated ecosystem, further with added advantage of reduced methane emissions and water budget as witnessed in irrigated system. Based on the restorer / maintainer reaction and spikelet fertility (%), 10 restorer lines were selected to cross with 3 CMS lines in the line by tester fashion in Yasangi (summer) season 2016-17. Resulting 30 experimental hybrids besides 13 parental lines (10 Restorer lines and 3 B - lines of akin CMS lines) and checks (GK 5022, CR Dhan 201) assessed during Vankalam (rainy) season 2017 at three different places/locations viz., Rajendranagar, Warangal and Kampasagar. The outcome of experiment were two experimental hybrids viz., APMS-6A × HRSV – 7 and IR-79156A × ATR – 372, were categorized as stable hybrids with desirable sca effects, heterosis (ranging from 7% to 13%) over best check GK 5022 along with an in-essence performance for yield and other yield attributing characters.
Keywords:
Aerobic rice
; hybrids
; heterosis
; stability
; water crisis
1. Introduction
For over 50 percent of the global population, rice has been a major food crop as well as a main food sources [1]. Globally, rice is grown to lowland rice at 56.9 percent, rainfed at 30.9 percent, aerobic or non-surface at 9.4 percent and deepwater at 2.8 percent [2]. India is the world's largest rice-growing nation (nearly 42.5 million ha) and 2nd largest in volume alongside China. Asia has 17 million hectares of rice irrigated areas with substantial water constraints, and 22 million hectares will encompass monetary water-shortages by 2025 [3]. Therefore it is essential for rice production to use water more efficiently. Sooner by 21st Century, it is predicted that the climate of the earth would warm on average by 2–4 °C (IPCC2007), because of human and natural sources. CO2, CH4 and N2O like GHGs emitting off the farming systems is presumed as one amongst prime cause bestowing planetary soaring heat [4].
Aerobic-rice mean planting of high-yielder varieties of rice within non-inundated, non-puddled conditions, which respond highly to supply of nutrients, can also be irrigated or rainfed and tolerate (intermittently) flooding [4]. It is the characteristic feature of the aerobic mode of development wherein, the crop will be directly seeded in free drainage; unpuddled soils are preserved without a standing water layer on the ground and roots expand in the aerobic climate [5]. It will be probable to safeguard water and to perk up water efficiency if rice is produced under aerobic conditions. However the production of suitable cultivars is a crucial element for the effectiveness of the aerobic method [6]. Water input in the aerobic rice method is projected to be very low (470-650 mm), with higher water efficiency (64-88 percent) and gross returns (28-44 percent) compared with lower labor usage (55 percent less) in comparison to lowland rice [7].
Aerobic rice, a mixture of characters, viz., drought resistance of upland rice and lowland rice yield capacity, is specifically produced rice. Therefore in terms of yield capacity, aerobic rice may be credited as 'improved upland rice' and 'improved lowland rice' in terms of drought resistance. In India, study began in 2005 to grow rice varieties appropriate for aerobic conditions and is normally restricted to the screening of existing varieties [8]. In order to recognize acceptable aerobic rice lines meant for diverse water short locations of the World, the coordinated project for rice improvement took initiative with its methodical assessment of aerobic rice genotypes across India. India has officially introduced the first variety suitable to aerobic condition, MAS 946-1 for production, during 2007 [9]. Under aerobic conditions Apo, IR55419-04, IR7437-46-1-1, Pusa RH10, Pusa 834 and ProAgro-6111 yielded morethan 4 t/ha [10]. Till date all together about 20 aerobic rice varieties/hybrids released for aerobic rice ecosystem in India.
Aerobic rice fast adoptive, that it has been reported to be grown in Latin America, Asia, and Africa. In 2006, approximately 35 million acres of aerobic rice were grown, of which 22.4 million acres were cultivated in Asia and 6.3 million acres were cultivated together in Africa and Latin America [2]. This gives a clear indication that this technology has to be given due importance to address water scarcity problems globally. The success of this production system requires development of hybrids with several specific features.
2. Material and Methods
The genotypic materials consist of 30 experimental hybrids of rice obtained by crossing 3 cytoplasmic male sterility (CMS) based lines from Wild-Abortive source with ten restorers in Line x Tester fashion at ICAR-IIRR, Hyderabad (Table 1). The multi-location evaluation of developed experimental hybrids, parental lines and check varieties was carried out under aerobic method in three locations namely E1 - ICAR-IIRR, Hyderabad (17°19′ N, 78° 29′ E and 542.7m above the MSL); E2 - Agricultural Research Station, Warangal (18.0122° N, 79.5990° E) and E3 - Agricultural Research Station, Kampasagar (17° 09' 60.00" N, 79° 29' 59.99" E). The study has been carried out replicated thrice in Completely Randomized block Design. The crop has been raised as dry direct seeded aerobic rice. Two to three dry seeds were dibbled per hill in dry soil and then irrigated. Five rows of 3meter length for each entry and spaced 20 × 15 cm apart. Thinning was done to ensure one seedling per hill after one week of sowing. The soil moisture status was maintained at below saturation level and throughout the crop period it was maintained as irrigated dry crop. The necessary cultivation practices of aerobic rice were followed so as to raise good crop. Surface irrigation can be given as soon as it has been planted in dry state in soil of fine tilth. Surface irrigation was applied at a five day cycle up to 50 days after sowing. During the critical phases such as active tillering, panicle initiation, flowering and grain filling, watering was provided one time for every three days. Water was suspended fifteen days prior to harvest of the crop to ease uniform grain ripening. Rice under aerobic cultivation, weeds is the key issue, which decreases crop yield. Weed management was also carried out with successful control using both chemical and manual means. Observations were note down for grain yield and associated traits on arbitrarily chosen 5 plants from each entry for every replicate by following Standard Evaluation System (IRRI, 2013). Bean plots are generated with the beanplot package version beanplot_1.2 [11] which is more informative than boxplot to understand the data. Further, the data (mean values) pertaining to all the traits subjugated to statistical and biometrical analysis for combining ability [12]. Data was further analyzed to determine variance, heterosis, heterobeltiosis, standard heterosis over varietal check CR Dhan 201 and hybrid check GK 5022 were determined as per standard procedure outlined [13] and expressed in percentage. Followed by that, data was subjected to stability analysis [14] where three stability parameters viz., (i) overall mean of every genotype over a spread of environments, (ii) the regression of individual genotype over the environmental index and (iii) a function of squared deviation from the regression were determined
The stability model outlined [13] as follows:
Yij = µ + bi Ij + δij
Here, (i = 1, 2, 3, 4, ….. g and j = 1, 2, 3, 4, ….., e)
Yij = Mean value of ith variety or genotype in jth location or environment or season
µ = Mean value of all the genotypes across all the locations or environments or season
bi = The coefficient of regression pertaining to ith variety or genotype on the environmental index that measures the actual response of this individual genotype to spread of environments
Ij = Environmental index which is defined as deviation of the mean of total varieties/genotypes at a given place or location from the overall mean
δij = Deviation of ith genotype at jth environment from regression
3. Results and Discussion
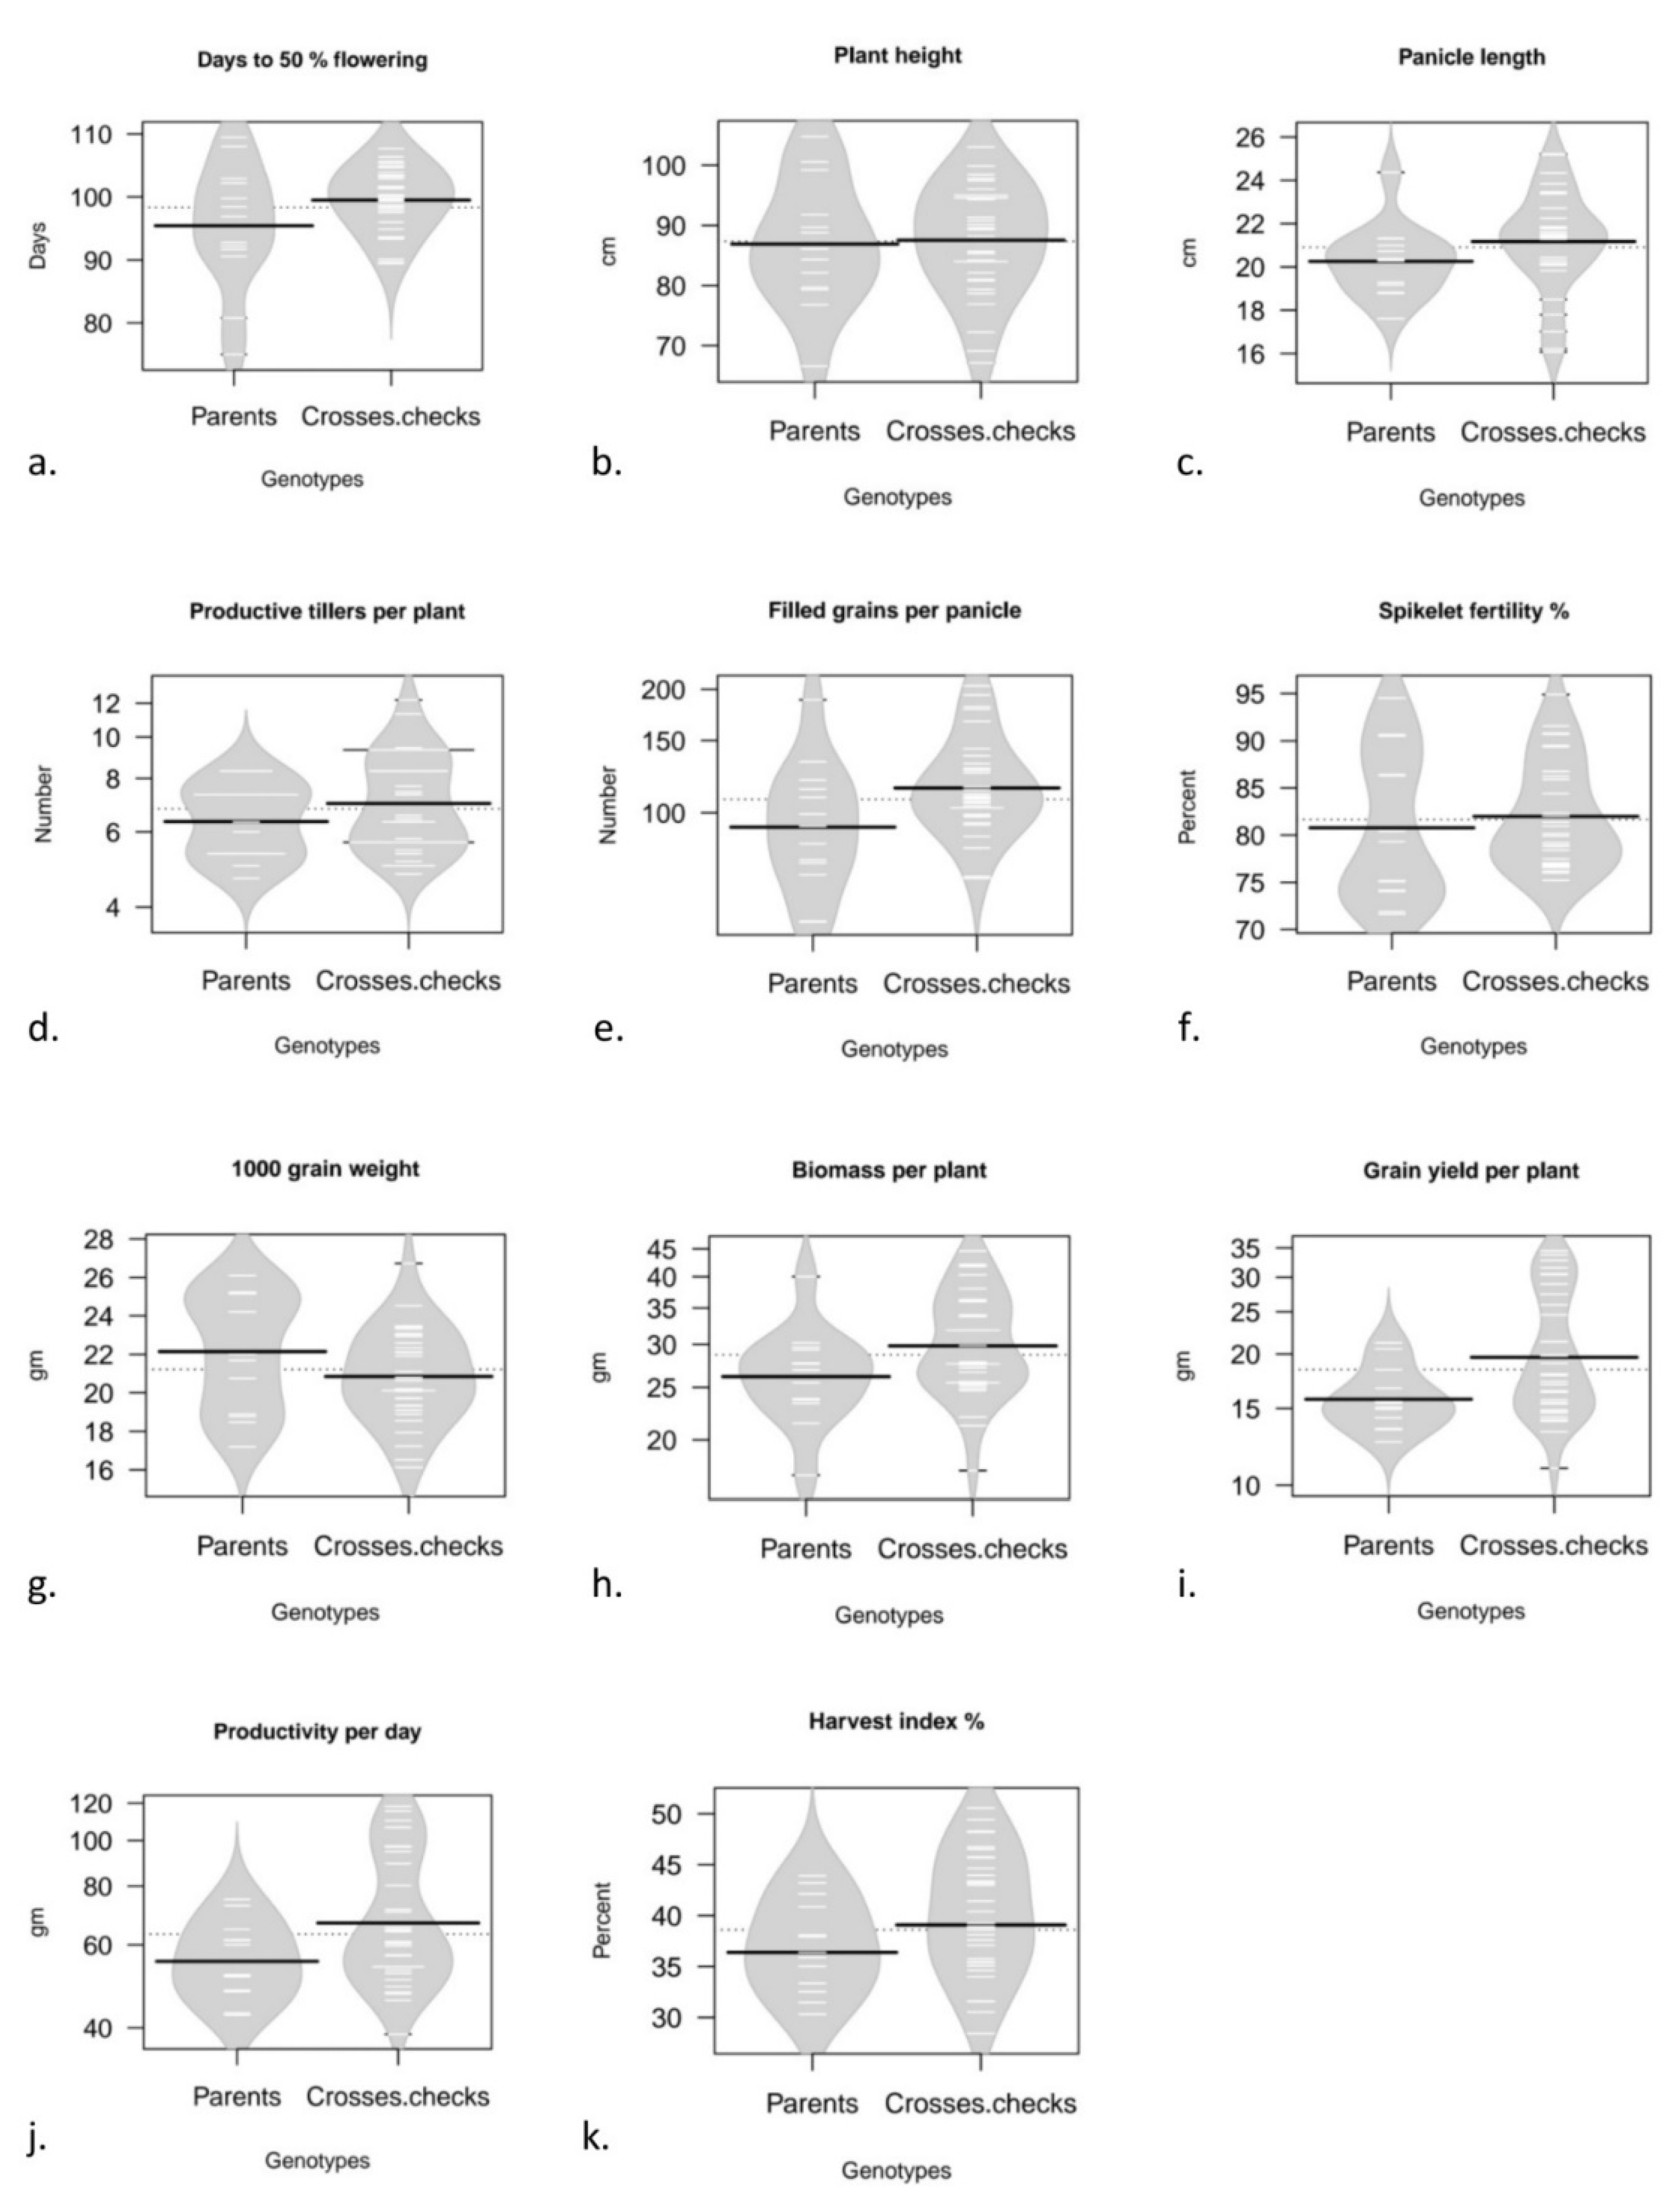
The mean values for the characters viz., days to 50 per cent flowering (DFF), plant height (PH), panicle length (PL), number of productive tillers per plant (PT), number of filled grains per panicle (FG), spikelet fertility % (SF), thousand grain weight (TGW), biomass per plant (BM), grain yield per plant (GY), productivity per day (PPD) and harvest index per cent (HI) estimated from three locations viz., Rajendranagar, Warangal and Kampasagar were subjected to statistical analysis, location wise and pooled. The mean values obtained for eleven components of parents, hybrids and standard checks for the pooled data across locations (3) are illustrated using Beanplots (Fig. 1). Visualization via Beanplots which plots graphs of univariate comparison, an alternative to existing boxplot or violin plot or stripchart. Boxplots were actually designed for normal data, or atleast unimodal data. The Beanplot instead shows the real density curve, which is more informative. The shape represents the density, short horizontal lines represents individual data point. This combines the best features of boxplot, density plot, and rug plot all into one and is very much readable. The longer thick lines represent the mean for each bean. The longer thin lines represents the data, with a sort of "stacking" where wider lines mean more duplicate values.
The results from mean performance revealed that among the lines, APMS-6B was identified as good toward PL, PT, FG, BM, PPD, GY and HI. Another line, IR-79156B was identified as good toward TGW. IR-68897B registered for early flowering and dwarf plant habit. From testers ATR- 177, ATR-186 and KS-22 recorded high GY, PT, TGW and PPD. The testers, ATR-216 exhibited earliness and HRSV-7 recorded short stature.
Substantially, depending on the inclusive performance, the following hybrids APMS-6A × HRSV - 7, APMS-6A × KS – 24 and IR-79156A × ATR – 372 performed superior to hybrid check, GK 5022 in response to GY plus additional yield ascribing traits like PL, PT, FG, SF, TGW and PPD.
Figure 1.
(a - k) Bean plots for mean data for grain yield and yield attributing traits studied, describing the data points distribution for parents and crosses separately.
Figure 1.
(a - k) Bean plots for mean data for grain yield and yield attributing traits studied, describing the data points distribution for parents and crosses separately.
The analysis of variance (ANOVA) for grain yield and yield ascribing traits unveiled significant difference amongst the treatments (Table 2) toward all the traits studied, at each and every location. Significance of genotypes indicated the existence of commensurable variability amongst the tested genotypes. Wherefore, combining ability analysis was carried out.
Pooled ANOVA toward combining ability over locations unveiled significant differences amongst locations, genotypes (treatments), parents, parents vs. crosses and crosses for all the traits studied (Table 3).
Significant of parents, crosses and parents vs. crosses for majority traits studied were earlier reported by researchers [15,16]. Splitting up of crosses into components viz., lines, testers, line × tester also showed that variances were significant for traits studied. Also, witnessed significant variances for line x tester component for all traits studied by rice workers [15,16]. Effect of interaction of lines × testers × locations recorded substantial differences for the traits, DFF, PT, FG, GY, PPD and HI. Reports in agreement with the above findings presented significant variances of lines × testers × locations for PT, PL, FG and GY [15,16].
This exposes the omnipresence of sizable variability within the plant material studied and there is a reliable prospect for identification of pragmatic hybrid combinations as well as parental lines.
The General combining ability GCA is linked with additive gene action, whereas specific combining ability is traceable to dominance along with epistasis. Pooled analysis unveiled greater SCA variances than GCA variances for all the traits implying the preponderance of non-additive gene action, which is previously envisaged to be ideal for exploitation of full potential through heterosis breeding.
A comparative study of the measure of components of variance due to GCA and SCA grounded the gene action nature in regulating the trait expression. The GCA to SCA variance ratio was found lesser than unity indicating the preponderant role of non-additive gene action for all traits studied, exhibiting a non-additive type of gene action. (Table 4). In support of present results, previously rice researchers documented findings envisaging the role of non-additive type of gene action for traits viz., DFF [17,18,19,20,21], PH [16,18,23,25,26,28], PT [18,22,24], PL [15,16,26,27,28], FG [16,18,24,25,28], SF [16,25,27,28], BM [20,29,30], HI [29,30,31], TGW [16,23,32,33,34] and GY [16,18,21,24,28,33,34,35,36] as in current experiment.
The contributory role of lines was recorded high for four traits viz., PH, FG, PPD and HI, while it came for testers, was high for characters i.e., DFF, PL, SF, TGW, BM and GY (Table 5). The line × tester interaction component contribution was higher for PT and modest for SF, the characters being significant in deciding the hybrid potency especially under aerobic conditions.
Among lines, APMS-6B was good general combiner for PL, PT, FG, BM, PPD, HI and GY. Out of ten testers five identified as excellent general combiners for GY as well as yield attributing traits includes, ATR- 186 for GY, PPD and HI; ATR-372 for GY, DFF, PL, PT, FG, SF, BM, PPD and HI; ATR-375 for GY, PH, FG and BM; KS-24 for GY, PL, PT, FG, SF, BM,
PPD and HI and HRSV-7 for GY, DFF, PH, SF, TGW, BM and PPD (Table 6).
It was noticed in few cases, that the lines as well as testers having good per se performance be not necessarily the best general combiners and contrariwise is true. Thus, the choice of parents must be predicated on both per se expression and parents gca effects. The line APMS-6B confirmed as good combiners for GY and its ascribing traits. APMS-6B was earlier also been reported as good general combiners for GY [37]. Amongst testers ATR-186, ATR-372, ATR-375, KS-24 and HRSV-7 were found to be good combiner taking consideration of high gca effects and per se for most of the yield ascribing traits. Hence, the above testers and lines perhaps well-thought-out, as potent donors for improvement of GY and linked components in upcoming rice breeding programmes.
Among the crosses studied, IR 68897A × KS - 22 (for DFF); IR-68897A × HRSV – 7, IR-68897A × ATR-177, IR-79156A × HRSV – 7 and IR-79156A × KS - 22 (for PH); IR-68897A × KS – 22, IR79156A × KS-24, IR-68897A × KS – 24, APMS 6A × ATR-374 and IR79156A × ATR-177 (for PL); APMS-6A × KS – 24, APMS- 6A × ATR-374, IR79156A × ATR-372, APMS 6A × HRSV-7 (for PT); APMS-6A × HRSV – 7 and IR-79156A × ATR – 372 (for FG); IR-79156A × ATR - 372 (for SF); APMS-6A × ATR – 177 and IR-79156A × KS – 22 (for TGW); APMS-6A × ATR – 374 and APMS-6A × ATR – 372 (for BM); APMS-6A ×
levelHRSV-7, APMS-6A × KS – 24 and IR-79156A × ATR – 372 (for GY); APMS-6A × HRSV-7, IR-79156A × ATR – 372 and APMS-6A × KS - 24 (for PPD) and APMS-6A × HRSV-7, IR-68897A × ATR – 186, IR-68897A × ATR – 372 and APMS-6A × KS – 24 (for HI) were identified as best specific combiners since their expression was exceedingly superb for grain yield and its components in terms of good sca effects of crosses and good gca of parents (Table 6).
Amongst crosses, three outstanding specific combiners were detected assumed from SCA effects and commensurable mean expression being (Table 6.) APMS-6A × HRSV – 7 for GY, PT, FG, BM, PPD and HI; APMS-6A × KS – 24 for GY, PH, PT, BM, PPD and HI and IR-79156A × ATR – 372 for GY, DFF, PL, PT, FG, BM, GY, PPD and HI.
Heterosis toward grain yield/plant is predominantly because of concurrent exemplification of heterosis for yield component character. Heterosis was expressed as per cent rise or drop noticed in the F1 over mid-parent as per the below mentioned formula.
Here,
= Mean of F1
= Mean of parents
Heterobeltiosis was expressed as per cent rise or drop noticed in F1 over the better parent as per the below mentioned formula [13].
Here,
Mean of better parent (for the traits viz., DFF, earliness is preferable so early parents considered as better parents).
Standard heterosis was expressed as per cent rise or drop noticed in F1 over standard check.
Average heterosis or Heterosis (h1), heterobeltiosis (h2) and standard heterosis (h3) is the superior expression as preferable over the mid parent, better parent and the standard checks viz., GK 5022 (commercial hybrid) and CR - Dhan 201 (variety), was projected for 30 hybrids for eleven traits (viz., DFF, PH, PL, PT, FG, SF, TGW, BM, GY, PPD and HI for 3 locations and pooled data is computed trait-wise. The negative heterosis for DFF denote earliness and the negative heterosis for PH denote short stature which are preferable, while for other traits positive heterosis values were weighed to be preferable.
The percent heterosis calculated for pooled data pertaining to top specific combiners for yield and yield ascribing traits (Table 7).
As per the pooled analysis, average heterosis and heterobeltiosis estimates ranged from -42.29 (APMS-6A × ATR – 177) to 131.13 (IR-79156A × ATR – 372) per cent and from -48.44 (APMS-6A × ATR – 177) to 119.25 (IR-79156A × ATR – 372) per cent respectively. Out of 30 hybrids studied, 18 hybrids excelled with considerable positive average heterosis and 16 hybrids exhibited considerable positive heterobeltiosis. With respect to heterosis, over best standard check GK 5022, the range was from -64.17 (APMS-6A × ATR – 177) to 12.86 per cent (APMS-6A × HRSV – 7) and positive significant standard heterosis exhibited by four hybrids that include APMS-6A × HRSV – 7 (12.86), APMS-6A × KS – 24 (10.59), IR-79156A × ATR – 372 (7.36) and APMS-6A × ATR – 372 (3.20)
Heterosis and heterobeltiosis of positive kind was documented by previous workers in rice [16,28,38,39,40,41]. While few rice workers proclaimed positive heterobeltiosis and standard heterosis values for this character [16,28,38,40,41]. However, mean performance is also important consideration coupled with gca, sca effects as well as percent heterosis [42].
Further, top ranking crosses based on high mean and their sca effects, parents gca effects, and standard heterosis for yield and its attributes were presented (Table 8). The hybrid, APMS-6A × HRSV – 7 which showcased extremely significant heterosis (positive) for grain yield in comparison with checks, also proved its performance for PL, PT, FG,
BM, PPD and HI. Similar kind of observations noticed with APMS-6A × KS – 24 and IR-79156A × ATR – 372 pertaining to GY and yield ascribing traits. It was noticed in the cross combinations which involved lines IR-68897A and APMS-6A reported their superiority for GY [37]
The stability ANOVA unveiled that genotypes as well as environments were significant for majority traits except HI, signifying diversity amongst genotypes also environments (Table 9). G × E interaction was considerable for the traits excluding PL, PT, TGW and HI, against pooled error, implying overwhelming behavioral differences of genotypes in erratic environments. G × E interaction for PL, PT, TGW and HI were detected to be insignificant. Henceforth, stability assessment was not pursued for those traits.
Dissecting sum of squares into varieties, environments + (genotypes × environment) and pooled error unveiled that mean squares owing to genotypes were highly considerable for all the traits examined, implying the manifestation of genetic variability in the studied experimental genotypic material [16,43]. Mean squares owing to environments + (genotypes × environments) were considerable entire range of traits except TGW and HI. The above findings were also in conformity with previous rice workers [16,43].
Sum of squares owing to environment + (genotype × environment) was further dissected into environment (linear), genotype × environment (linear) and pooled deviation. Considerable variation owing to environment (linear) was noticed for traits excluding HI clarifying the linear contribution of environmental effects and additive environmental variance on these traits. Results in favour of above findings were documented by earlier researchers [16,43]. The linear component of G × E was considerable for traits excluding PL, PT, TGW and HI, implying that genotypes considerably differing toward their linear response to environments. The mean sum of squares for pooled deviation was considerable for DFF, PT, TGW, GY, PPD and HI implying the non-linear response and non- predictable nature of genotypes by considerably differing toward stability. This unveils the significance of both linear and non-linear components in weighing interaction of the genotypes with environments in the current study. The above findings were in conformity with few previous rice workers [16,43,44,45].
As further stability analysis was not carried out for the following traits viz., PL, PT, TGW and HI, the adjudication of the promising experimental hybrids is made considering their pooled mean expression only.
Environmental indices of eleven characters viz., DFF, PH, PL, PT, FG, SF, TGW, BM, GY, PPD and HI are presented in the Table 10. Environmental index reveals us how favourable is one environment at a peculiar location. It was affirmed that the estimates of environmental index can bestow the rationale for identifying the favourable environments for the expression of maximum potential of the genotype [46]. Environmental indices unveiled that Kampasagar was best favourable location for FG, SF, TGW, BM, GY, PPD and HI, While Warangal was best location toward PL and PT. Rajendranagar was the best location for DFF, PH and PT.
A stable genotype as per Eberhart and Russel (1966) is one that exhibits (i) high mean yield, (ii) regression coefficient (bi=1) equal to unity (iii) mean square deviation from regression (S2di) near to zero. While comprehending results of the current study, S2di was taken into consideration toward the measure of stability as suggested [46]. Then, the kind of stability (measuring the response or sensitivity to environmental fluctuations) was determined based on regression coefficient (bi) and mean values [47]. If ‘bi’ equals to unity with high mean, the genotype is supposed to have good stability (the performance remains unchanged with vagaries in environment). If ‘bi’ is greater than unity, it is expected to possess lesser than average stability (sensitive to environmental fluctuations but adaptable to favourable environments) and if ‘bi’ is lesser than unity, it is believed to have greater than average stability (widely adaptable yet under poor environmental situations). The estimates of stability parameters i.e., mean (µ), regression coefficient (bi) and a mean square deviation from regression (S2di) were considered simultaneously while assessing the stability of genotypes.
Pooled ANOVA delineated existence of considerable G × E interaction, for GY. Linear and non-linear components pertaining to G × E interaction were considerable, which unveiled that only part of performance could be predicted. Among the genotypes, two lines, eight testers and 21 hybrids and one check showcased inconsiderable deviations from the regression (S2di) values.
Among the parents, one tester ATR-186 (20.54) exhibited average stability (mean significantly greater than varietal check, CR-Dhan 201) while another tester ATR-374 (13.49) was found adaptable to favourable environments (more than the average stability). None of the parents were found superior significantly over hybrid check GK 5022.
Two hybrids, IR-79156A × ATR – 372 (32.78 g) and APMS-6A × HRSV – 7 (34.46 g) exemplified considerably higher grain yield/plant over hybrid check GK 5022 (30.54 g) and recorded unit bi values with non-significant deviation from regression. Hence, they were identified as highly adaptable hybrids and thought to express well in all kinds of environments. Earlier rice researchers have also documented some stable high yielding hybrids for GY based on stability parameters [14,44,45,48].
Stable parents and crosses for grain yield and its component traits are listed (Table 11). Accordingly parents as well as crosses are classified as stable, suitable to favourable environment and poor environments respectively based on the prescribed three things viz., mean (µ), regression coefficient (bi) and a mean square deviation from regression (S2di).
4. Conclusions
The outcome of present experiment was to identify novel rice hybrids for aerobic ecology with lower yield penalties and added advantage of reduced water budget (almost half of irrigated rice paddies) and reduced methane emissions from irrigated paddies which are believed to contribute for global warming. APMS-6A × HRSV – 7 and IR-79156A × ATR – 372, were categorized as stable hybrids with desirable sca effects, heterosis (ranging from 7% to 13%) over best check GK 5022 and per se grain yield expression and other important characters.
Acknowledgments
Authors are grateful to DST-INSPIRE for their financial support and ICAR-IIRR, PJTSAU Hyderabad for providing facilities for research.
Declaration of Competing Interest
The authors declare no competing interest that could have appeared to impact the work reported in this paper
References
- T. Degenkolbe, P.T. Do, J. Kopka, E. Zuther, D.K. Hincha, K.I. Kohl, Identification of drought tolerance markers in a diverse population of rice cultivars by expression and metabolite profiling, PLOS One. 8 (2013): 1-14. [CrossRef]
- P. Illukpitiya, S.O.P.B Samonte, L.T. Wilson, Aerobic Rice: Production Inputs and Breeding Selection Criteria, Texas Rice. 9(2009): 1-10.
- T.P. Tuong, B.A.M. Bouman, Rice production in water-scare environments, in: J. W. Kijne, R. Barker, D. Molden (Eds.), Water productivity in agriculture: limits and opportunities for improvement, CABI Publishing, 2003, pp. 53-68.
- P. Smith, J. E. Olesen, Synergies between the mitigation of, and adaptation to, climate change in agriculture, The Journal of Agricultural Science. 148 (2010): 543-552. [CrossRef]
- G.N. Atlin, H.R. Lafitte, D.Tao, Laza, M. Amante, B. Courtois, Developing rice cultivars for high fertility upland systems in the Asian tropics, Field Crops Research. 97 (2006): 43-52. [CrossRef]
- A. Sheeba, P. Vivekanandan, V. Veerabadran, Identification of rice (Oryza sativa L.) genotypes for aerobic condition under different water regimes, Indian Journal of Genetics. 65 (2005): 287-289.
- K. Amudha, K. Thiyagarajan, N. Sakthivel, Aerobic rice: a review, J. Agric. Rev. 30 (2009): 145-149.
- R. Prasad, Aerobic rice systems, Adv. Agron. 111 (2011):207-247.
- R.V. Gandhi, N. Rudresh, S. M. Shivamurty, S. Hittalmani, Performance and adoption of new aerobic rice variety MAS 946-1 (Sharada) in southern Karnataka, Karnataka J. Agric. Sci. 25 (2012):5-8.
- A.K. Singh, V. Chinnusamy, Aerobic rice: a success story, Ind. Farm. 57(2007):7-10.
- P. Kampstra, Beanplot: A Boxplot Alternative for Visual Comparison of Distributions, Journal of Statistical Software, Code Snippets 28(2008): 1-9. URL http://www.jstatsoft.org/v28/c01/.
- O. Kempthorne, An introduction to genetic studies. John Wiley and Sons Inc., New York, 1957.
- G. H. Liang, C.R. Reddy, A.D. Dayton, Heterosis, inbreeding depression and heritability estimates in a systematic series of grain sorghum genotypes, Crop Science. 12 (1971): 400-411. [CrossRef]
- S.A. Eberhart, W.A., Russel, Stability parameters for comparing varieties. Crop Science. 6 (1966):36-40.
- P. Saidaiah, M.S. Ramesha, S. Sudheer Kumar, Line x tester analysis in rice (Oryza sativa L.), Madras Agricultural Journal. 97(2010):110-113.
- C. Parimala, Combining abiliy and heterosis in rice (Oryza sativa L.)”. Ph.D Thesis. Professor Jayashankar Telangana State Agricultural University, Hyderabad, India, 2016.
- P. Saidaiah, M.S. Ramesha, S. Sudheer Kumar, J. Suresh, Combining ability analysis for yield and yield component traits in rice (Oryza sativa L.), Journal of Research ANGRAU. 39(2011):28-33.
- Bineeta Devi, G.M. Lal, 2015. Combining ability analysis for yield and yield components in rice (Oryza sativa L.). Electronic Journal of Plant Breeding. 6(2): 360-365.
- M. J. Hasan, M. U. Kulsum, M. Emran Hossain, M. Manzur Hossain, M. Mustafizur Rahman, N.M. Farhat Rahmat, Combining ability analysis for identifying elite parents for heterotic rice hybrids, Academia Journal of Agricultural Research. 3(2015): 70-75.
- G. Priyanka, M. Sujatha, P. Senguttuvel, D. Subramanyam, Combining ability analysis for grain yield and its component traits in aerobic rice (Oryza sativa L.) cultivars, Research Journal of Agricultural Sciences. 7(2016): 237-240.
- A.M. Thakare, J.S. Mehta, Patel, S.R. Takle, Combining ability analysis for yield and grain quality traits in rice hybrids, Journal of Rice Research. 3 (2016): 5-8.
- D.K. Dwivedi, M.P. Pandey, Gene action and heterosis for yield and associated traits in indica and tropical japonica crosses of rice (Oryza sativa L.) involving wide compatibility gene(s). International Journal of Plant Breeding and Genetics. 6(2012): 140-150.
- P.V. Padmavathi, P.V. Satyanarayana, M. Lal Ahamed, Ashoka Rani, V. Srinivas Rao, Combining ability studies for yield and yield components in hybrid rice (Oryza sativa L.). Electronic Journal of Plant Breeding. 3(2012):836-842.
- G. S. Sanghera, Waseem Hussain, Gene action and combining ability studies using CMS system for developments of hybrid rice under temperate conditions, American Journal of Agricultural Science and Technology. 1(2013): 27-44.
- A.G. Ghara, G. Nematzadeh, N. B. Morteza Oladi, A. Bagheri, Heritability and heterosis of agronomic traits in rice lines, International Journal of Farming and Allied Sciences. 3 (2014): 66-70.
- M. A. Karim, Combining ability studies in rice hybrids involving new CMS lines in Bangladesh, Agricultural Science Digest. 29(2016):45-47.
- M.N. Upadhyay, H.K. Jaiswal, Combining ability analysis for yield and earliness in hybrid rice (Oryza sativa L.), Journal of Crop Science. 7(2015):81-86.
- C. Ramesh, Combining abiliy and heterosis in rice (Oryza sativa L.)”. M.Sc Thesis. Professor JayashankarTelangana State Agricultural University, Hyderabad, India, 2016.
- W. Hussain, G.S. Sanghera, Exploitation of heterosis in rice (Oryza sativa L.) using CMS system under temperate conditions, Electronic Journal of Plant Breeding. 3(2012):695-700.
- R. Suresh, R.B. Chandra, M. Gomez, P. Shanmugasundaram, Genetic analysis of yield traits in rice under irrigated and water stress environment. Indian Journal of Genetics. 73 (2013): 162-168.
- B. Savitha, D.P. Pandey, D. Singh, Gene action and combining ability studies in rice, Oryza. 51 (2015): 162-164.
- G. Kumar Babu, P.V. Satyanarayana, C. Panduranga Rao, V. Srinivasa Rao, Combining ability for yield, components and quality traits in hybrid rice (Oryza sativa L.), The Andhra Agricultural Journal. 57(2010): 143-147.
- A.D. Jarwar, Q.D.D. Cruz, G. S. Junejo, M. Jarwar, Gene action of some agronomic, yield and quality characters in aromatic rice (Oryza Sativa L.) varieties and their F1 hybrids under lowland and upland environments Pakistan Journal of Agriculture, Agricultural Engineering and Veterinary Sciences. 4(2016): 1023-1072.
- Rahaman, Study of nature and magnitude of gene action in hybrid rice (Oryza sativa L.) through experiment of line x tester mating design. International Journal of Applied Research. 2 (2016): 405-410.
- M. Sala, P. Shanthi, B. Selvi, V. Ravi, M. Raveendran, C. Vijayalakshmi, Combining ability studies for yield and yield contributing traits in rice (Oryza sativa L.), Green Farming. 7 (2016): 283-287.
- Gaurav Dharwal, O.P. Verma and G.P. Verma, Combining ability analysis for grain yield and other associated traits in rice. International Journal of Pure and Applied Biosciences. 5(2017):96-100.
- S. Shivam, K.N. Harish K, Studies on grain yield components in NPT lines of rice to develop super rice hybrid, Int. J. of Science and Research. 2(2013):589-590.
- Kumari Priyanka, H.K. Jaiswal, S.A. Waza, Combining ability and heterosis for yield, its component traits and some grain quality parameters in rice (Oryza sativa L.). Journal of Applied and Natural Science. 6 (2014): 495-506.
- P.M. Mistry, V. J. Patel, M. H. Chaudhari, N.M. Desai, Heterosis and heterobeltosis for grain yield and yield attributing traits in rice (Oryza sativa L.), Bioinfolet. 12 (2015): 212 -218.
- Srijan, Combining abiliy and heterosis in rice (Oryza sativa L.)”. M.Sc Thesis. Professor Jayashankar Telangana State Agricultural University, Hyderabad, India, 2015.
- A. Srijan, S. Sudheer Kumar, Ch. Damodar Raju, R. Jagadeeshwar, Heterosis studies in rice for the identification of better hybrids for Telangana, India, Journal of Applied and Natural Science. 8 (2016): 184 –190.
- A. Srijan, S. Sudheer Kumar, Ch. Damodar Raju, Studies on gene action and combining ability in rice (Oryza sativa L.), Environment & Ecology. 34 (2016):1749-1755.
- P. Madhukar, Stability analysis of pre-release and released rice hybrids for grain yield and quality characters. M.Sc Thesis. Professor Jayashankar Telangana State Agricultural University, Hyderabad, India, 2013.
- P. Saidaiah, S. Sudheer Kumar, M.S. Ramesha, Stability analysis of rice hybrids and parents, Indian Agriculturist. 54(2010):163-171.
- S. Sreedhar, T. Dayakar Reddy, M. S. Ramesha, Genotype x environment interaction and stability for yield and its components in hybrid rice cultivars. (Oryza sativa L.), International Journal of Plant Breeding and Genetics. 5(2011): 194-208.
- E.L. Breeze, The measurement and significance of genotype – environment interactions in grasses. Heredity. 24 (1969):181-200.
- K.W. Finlay, G.N. Wilkinson, Analysis of adaptation in a plant breeding programme, Australian Journal of Agricultural Research. 14 (1963): 742-754.
- S. Banumathy, N. Sheeba, P. Shanthi, R. Manimaran, R. Agila, Assessment of yield stability of rice genotypes through stability analysis. Journal of Rice Research. 9(2016): 17-19.
- B.D. Waghmode, H. D. Mehta, Genotype x Environment interaction and stability analysis in hybrid rice, Crop improvement. 38(2011):6-12.

Table 1.
List of male sterile lines, effective restorers used for crosses development and checks used in the study.
Table 1.
List of male sterile lines, effective restorers used for crosses development and checks used in the study.
| S. No. | Parental Lines | Source |
|---|---|---|
| CMS Lines | ||
| 1 | IR-79156B | IRRI, Philippines |
| 2 | APMS-6B | RARS, Maruteru (ANGRAU) |
| 3 | IR-68897B | IRRI, Philippines |
| Restorer lines | ||
| 1 | ATR – 177 | IIRR, Hyderabad |
| 2 | ATR – 186 | IIRR, Hyderabad |
| 3 | ATR – 216 | IIRR, Hyderabad |
| 4 | ATR – 372 | IIRR, Hyderabad |
| 5 | ATR – 374 | IIRR, Hyderabad |
| 6 | ATR – 375 | IIRR, Hyderabad |
| 7 | KS – 22 | IIRR, Hyderabad |
| 8 | KS – 24 | IIRR, Hyderabad |
| 9 | AR - 19 -18 | IIRR, Hyderabad |
| 10 | HRSV – 7 | IIRR, Hyderabad |
| Checks | ||
| 1 | CR Dhan – 201 | NRRI, Cuttak (varietal check) |
| 2 | GK 5022 | Early duration, hybrid check |
Table 2.
Analysis of variance for yield and yield components in rice at 3 locations viz., Rajendranagar (RJNR), Warangal (WGL) and Kampasagar (KSR).
Table 2.
Analysis of variance for yield and yield components in rice at 3 locations viz., Rajendranagar (RJNR), Warangal (WGL) and Kampasagar (KSR).
| Character | Source of Variation and d.f. | ||||||||
|---|---|---|---|---|---|---|---|---|---|
| Replication - 2 | Genotypes - 44 | Error - 88 | |||||||
| RJNR | WGL | KSR | RJNR | WGL | KSR | RJNR | WGL | KSR | |
| Days to 50% flowering | 0.31 | 3.02 | 0.71 | 114.33** | 132.41** | 211.84** | 3.48 | 3.00 | 3.75 |
| Plant height | 1.53 | 1.74 | 4.18 | 246.27** | 271.49** | 281.06** | 1.76 | 2.24 | 2.83 |
| Panicle length | 0.16 | 0.04 | 0.06 | 12.87** | 14.98** | 14.48** | 0.17 | 0.18 | 0.13 |
| No. of productive tillers per plant | 0.01 | 0.00 | 0.00 | 9.35** | 10.47** | 9.61** | 0.01 | 0.01 | 0.01 |
| No. of filled grains per panicle | 0.22 | 2.78 | 7.47 | 3824.77** | 3788.74** | 3702.19** | 4.11 | 3.52 | 3.85 |
| Spikelet fertility (%) | 0.68 | 1.88 | 3.82 | 148.20** | 115.15** | 108.74** | 3.13 | 3.10 | 2.80 |
| 1000 grain weight | 0.05 | 0.03 | 0.08 | 20.75** | 20.85** | 20.96** | 0.08 | 0.06 | 0.07 |
| Biomass per plant | 0.54 | 0.04 | 0.00 | 129.46** | 129.63** | 122.16** | 0.39 | 0.37 | 0.38 |
| Grain yield per plant | 0.06 | 0.01 | 0.10 | 127.90** | 131.00** | 113.38** | 0.16 | 0.17 | 0.13 |
| Productivity per day | 3.50 | 0.62 | 4.42 | 1533.70** | 1451.80** | 1168.95** | 1.39 | 1.59 | 1.92 |
| Harvest index (%) | 0.07 | 0.01 | 0.07 | 105.19** | 110.60** | 127.48** | 0.29 | 0.30 | 0.31 |
* Significant at 5 % level; ** Significant at 1 % level.
Table 3.
Pooled analysis of variance for combining ability for yield and yield components in rice.
| Source | df | Days to 50% Flowering | Plant Height | Panicle Length | No. of Productive Tillers per Plant | No. of Filled Grains per Panicle | Spikelet Fertility | |
|---|---|---|---|---|---|---|---|---|
| Replications | 2 | 3.53 | 1.23 | 0.14 | 0.00 | 4.42 | 3.35 | |
| Environments | 2 | 3973.33** | 2065.63** | 49.55** | 35.44** | 1801.67** | 168.80** | |
| Replications × Environment | 4 | 0.64 | 3.00 | 0.03 | 0.01 | 2.92 | 0.72 | |
| Treatments | 42 | 428.63** | 796.00** | 43.58** | 30.11** | 11720.97** | 328.23** | |
| Parents | 12 | 880.19** | 1011.78** | 25.02** | 14.58** | 12023.45** | 570.84** | |
| Parent vs. Crosses | 1 | 1659.39** | 18.60** | 60.65** | 57.41** | 37522.01** | 33.78** | |
| Crosses | 29 | 199.33** | 733.52** | 50.67** | 35.60** | 10706.12** | 238.00** | |
| Line effect | 2 | 64.65 | 710.40 | 31.47 | 187.75** | 8420.61 | 1296.38** | |
| Tester effect | 9 | 245.92 | 1374.09* | 46.24 | 34.50 | 21661.40** | 149.33 | |
| Line × Tester effect | 18 | 191.01** | 415.80** | 55.02** | 19.24** | 5482.42** | 164.73** | |
| Environments × Treatments | 84 | 16.72** | 5.65** | 0.12 | 0.13** | 5.07* | 8.86** | |
| Environments × Parents | 24 | 21.47** | 9.17** | 0.08 | 0.14** | 4.46 | 17.92** | |
| Environments × Parent vs. Cross | 2 | 55.90** | 29.13** | 0.30 | 0.57** | 0.29 | 78.01** | |
| Environments × Crosses | 58 | 13.40** | 3.38* | 0.13 | 0.11** | 5.48* | 2.72 | |
| Environments × Line effect | 4 | 6.67 | 4.02 | 0.20 | 0.23 | 8.63 | 6.76* | |
| Environments × Tester effect | 18 | 21.05* | 5.81** | 0.13 | 0.11 | 3.47 | 2.45 | |
| Environments × Line × Tester effect | 36 | 10.33** | 2.09 | 0.12 | 0.10** | 6.14* | 2.41 | |
| Error | 252 | 3.28 | 2.27 | 0.16 | 0.01 | 3.81 | 2.92 | |
| Source | df |
1000 Grain Weight |
Biomass per Plant |
Grain Yield per Plant |
Productivity per Day |
Harvest Index |
||
| Replications | 2 | 0.01 | 0.06 | 0.05 | 6.37* | 0.08 | ||
| Environments | 2 | 3.14** | 135.19** | 111.69** | 22.30** | 19.70** | ||
| Replications × Environment | 4 | 0.01 | 0.31 | 0.05 | 2.36 | 0.04 | ||
| Treatments | 42 | 63.66** | 383.28** | 358.97** | 3947.55** | 296.56** | ||
| Parents | 12 | 85.55** | 265.57** | 63.37** | 993.79** | 182.90** | ||
| Parent vs. Crosses | 1 | 145.18** | 1217.03** | 1705.54** | 13864.45** | 689.85** | ||
| Crosses | 29 | 51.79** | 403.24** | 434.85** | 4827.83** | 330.03** | ||
| Line effect | 2 | 22.68 | 482.26 | 817.57 | 8143.62 | 356.21 | ||
| Tester effect | 9 | 70.44 | 503.50 | 592.10 | 6913.06 | 496.13 | ||
| Line × Tester effect | 18 | 45.69** | 344.33** | 313.70** | 3416.80** | 244.07** | ||
| Environments × Treatments | 84 | 0.99** | 0.64* | 0.94** | 18.89** | 26.64** | ||
| Environments × Parents | 24 | 1.10** | 0.68* | 0.49** | 9.65** | 23.62** | ||
| Environments × Parent vs. Cross | 2 | 0.61 | 1.14 | 1.37** | 23.47** | 116.49** | ||
| Environments × Crosses | 58 | 0.95** | 0.60** | 1.12** | 22.56** | 24.79** | ||
| Environments × Line effect | 4 | 1.63 | 1.19* | 1.08 | 35.02 | 20.92 | ||
| Environments × Tester effect | 18 | 0.75 | 0.82* | 1.79* | 23.13 | 31.81 | ||
| Environments × Line × Tester effect | 36 | 0.98** | 0.43 | 0.78** | 20.89** | 21.70** | ||
| Error | 252 | 0.43 | 0.38 | 0.16 | 1.59 | 0.30 | ||
* Significant at 5 % level; ** Significant at 1 % level.
Table 4.
Estimates of general and specific combining ability variances and proportionate gene action in rice for eleven characters.
Table 4.
Estimates of general and specific combining ability variances and proportionate gene action in rice for eleven characters.
| Character | Location | σ2 gca | σ2 sca | σ2gca/ σ2 sca |
|---|---|---|---|---|
| Days to 50% flowering | Rajendranagar | 2.02 | 18.03 | 0.11 |
| Warangal | 2.33 | 18.92 | 0.12 | |
| Kampasagar | 4.52 | 30.32 | 0.15 | |
| Pooled | 2.60 | 20.86 | 0.12 | |
| Plant height | Rajendranagar | 17.69 | 43.15 | 0.41 |
| Warangal | 18.73 | 47.75 | 0.39 | |
| Kampasagar | 17.19 | 46.83 | 0.37 | |
| Pooled | 17.78 | 45.96 | 0.39 | |
| Panicle length | Rajendranagar | 0.57 | 5.47 | 0.10 |
| Warangal | 0.70 | 6.36 | 0.11 | |
| Kampasagar | 0.71 | 6.43 | 0.11 | |
| Pooled | 0.66 | 6.10 | 0.11 | |
| No. of productive tillers per plant | Rajendranagar | 1.69 | 1.89 | 0.90 |
| Warangal | 2.07 | 2.37 | 0.87 | |
| Kampasagar | 1.96 | 2.21 | 0.89 | |
| Pooled | 1.90 | 2.14 | 0.89 | |
| Contd. Table 4. | ||||
| No. of filled grains per panicle | Rajendranagar | 262.92 | 621.79 | 0.42 |
| Warangal | 262.34 | 604.36 | 0.43 | |
| Kampasagar | 246.11 | 601.61 | 0.41 | |
| Pooled | 257.04 | 608.69 | 0.42 | |
| Spikelet fertility | Rajendranagar | 9.62 | 19.14 | 0.50 |
| Warangal | 14.76 | 14.82 | 0.99 | |
| Kampasagar | 12.71 | 19.63 | 0.65 | |
| Pooled | 12.30 | 17.93 | 0.69 | |
| 1000 grain weight | Rajendranagar | 0.77 | 4.55 | 0.17 |
| Warangal | 0.96 | 5.44 | 0.18 | |
| Kampasagar | 0.71 | 5.47 | 0.13 | |
| Pooled | 0.79 | 5.01 | 0.16 | |
| Biomass per plant | Rajendranagar | 8.85 | 39.04 | 0.23 |
| Warangal | 8.50 | 39.06 | 0.22 | |
| Kampasagar | 7.98 | 36.59 | 0.22 | |
| Pooled | 8.42 | 38.22 | 0.22 | |
| Grain yield per plant | Rajendranagar | 12.25 | 36.44 | 0.34 |
| Warangal | 13.26 | 37.13 | 0.36 | |
| Kampasagar | 10.76 | 31.37 | 0.34 | |
| Pooled | 12.05 | 34.84 | 0.35 | |
| Productivity per day | Rajendranagar | 144.64 | 437.87 | 0.33 |
| Warangal | 139.36 | 405.95 | 0.34 | |
| Kampasagar | 104.81 | 307.45 | 0.34 | |
| Pooled | 128.66 | 379.45 | 0.34 | |
| Harvest index | Rajendranagar | 6.01 | 30.00 | 0.20 |
| Warangal | 6.85 | 29.63 | 0.23 | |
| Kampasagar | 11.65 | 35.89 | 0.32 | |
| Pooled | 7.28 | 27.08 | 0.27 | |
Table 5.
Proportional contribution of lines, testers and their interactions to total variance.
| S.No. | Character | Contribution | ||
|---|---|---|---|---|
| Line (%) | Tester (%) | Lines × Tester (%) | ||
| 1 | Days to 50% flowering | 38.29% | 59.48% | 2.24% |
| 2 | Plant height | 58.14% | 35.18% | 6.68% |
| 3 | Panicle length | 28.32% | 67.40% | 4.28% |
| 4 | No. of productive tillers per plant | 30.07% | 33.55% | 36.37% |
| 5 | No. of filled grains per panicle | 62.79% | 31.78% | 5.42% |
| 6 | Spikelet fertility (%) | 19.47% | 42.96% | 37.57% |
| 7 | 1000 grain weight | 42.21% | 54.77% | 3.02% |
| 8 | Biomass per plant | 38.75% | 53.00% | 8.25% |
| 9 | Grain yield per plant | 42.26% | 44.78% | 12.97% |
| 10 | Productivity per day | 44.44% | 43.93% | 11.63% |
| 11 | Harvest index (%) | 46.65% | 45.90% | 7.44% |
Table 6.
Estimates of general and specific combining ability effects pooled over three locations for grain yield and yield attributing traits against mean grain yield of good general and specific combiners.
Table 6.
Estimates of general and specific combining ability effects pooled over three locations for grain yield and yield attributing traits against mean grain yield of good general and specific combiners.
| Parent/Cross | GCA/SCA effects | MGY (g) | ||||||||||
|---|---|---|---|---|---|---|---|---|---|---|---|---|
| DFF | PH | PL | PT | FG | SF | TGW | BM | GY | PPD | HI | ||
| APMS-6B | 0.98** | 1.88** | 0.37** | 1.30** | 18.44** | -4.36** | -0.06 | 2.44** | 3.39** | 10.63** | 2.27** | 21.22 |
| ATR – 186 | 0.24 | 1.81** | -0.06 | -0.49** | -11.89** | -0.15 | -0.56** | -3.64** | 1.43** | 5.09** | 4.04** | 20.54 |
| ATR – 372 | -1.06** | 8.33** | 0.01 | 0.63** | 73.51** | 0.90* | -1.74** | 8.08** | 10.57** | 36.99** | 6.99** | 14.95 |
| ATR – 375 | 4.83** | -1.97** | -1.92** | 0.81** | 6.00** | -0.33 | 0.13 | 3.31** | 0.84** | 0.14 | -0.71** | 15.12 |
| KS – 24 | 3.98** | 0.37 | 2.19** | 2.33** | 7.81** | 1.76** | -0.76** | 0.45** | 2.61** | 6.48** | 2.53** | 12.57 |
| HRSV – 7 | -4.87** | -13.93** | 0.30** | 0.03 | 7.40** | 2.63** | 1.19** | 2.06** | 0.30** | 3.20** | -1.79** | 14.28 |
| IR-79156A × ATR – 177 | 0.44 | 6.43** | 2.48** | -0.22** | 13.06** | 4.13** | -1.28** | -1.37** | 2.00** | 6.51** | 3.18** | 14.03 |
| IR-79156A × ATR – 216 | -2.27** | 0.47 | 1.32** | 0.15** | 52.32** | 4.38** | 1.14** | 8.62** | 7.16** | 25.30** | 2.76** | 25.92 |
| IR-79156A × ATR – 372 | -3.49** | 1.39** | -0.29* | 1.26** | 31.25** | 6.69** | -0.70** | 3.47** | 2.71** | 12.13** | 0.64** | 32.78 |
| IR-79156A × KS – 22 | 6.59** | -8.38** | -2.80** | 0.30** | -30.35** | -5.50** | 1.69** | -1.78** | 3.70** | 9.19** | 5.59** | 21.31 |
| IR-79156A × AR - 19 -18 | 3.36** | -0.57 | -2.16** | 1.82** | 6.25** | -0.97 | 0.14 | 1.58** | 3.28** | 9.24** | 3.03** | 19.79 |
| APMS-6A × ATR – 374 | 6.02** | 1.19* | 2.59** | 2.66** | -26.44** | 2.83** | -0.21 | 7.55** | 3.31** | 8.57** | 1.44** | 24.58 |
| APMS-6A × ATR – 375 | 1.91** | 2.82** | 0.60** | -0.08* | 23.23** | 2.19** | 2.05** | 1.77** | 5.66** | 17.17** | 5.05** | 30.4 |
| APMS-6A × KS – 24 | 0.43 | -5.40** | -3.25** | 1.29** | -2.26** | 1.09 | -3.87** | 6.90** | 7.26** | 23.79** | 3.49** | 33.77 |
| APMS-6A × HRSV – 7 | 2.39** | 5.67** | 0.92** | 0.70** | 58.49** | -3.68** | -1.83** | 1.10** | 10.27** | 34.97** | 10.18** | 34.46 |
| IR-68897A × ATR – 177 | 6.50** | -8.10** | -3.16** | 1.51** | 15.45** | -1.41* | -2.42** | 8.91** | 3.48** | 9.41** | -0.26 | 14.12 |
| IR-68897A × ATR – 186 | -2.16** | -6.62** | 1.26** | 0.41** | 15.30** | -2.12** | 2.31** | 2.91** | 7.87** | 28.09** | 6.94** | 27.42 |
| IR-68897A × AR - 19 -18 | 0.10 | 4.67** | 2.72** | 0.96** | -11.59** | -1.47* | -1.25** | 5.82** | 2.73** | 9.12** | -0.16 | 17.85 |
DFF - Days to 50% flowering, PH - Plant height, PL - Panicle length, PT - Number of productive tillers per plant, FG - Number of filled grains per panicle, SF - Spikelet fertility (%), TGW - 1000 grain weight, BM - Biomass per plant, GY - Grain yield per plant, PPD- Productivity per day, HI - Harvest index (%) , MGY – Mean grain yield in grams. * Significant at 5 % level; ** Significant at 1 %.
Table 7.
Percent heterosis, heterobeltiosis and standard heterosis recorded for best specific combiners.
Table 7.
Percent heterosis, heterobeltiosis and standard heterosis recorded for best specific combiners.
| Crosses | Heterosis | Heterobeltiosis | Standard Heterosis | |
|---|---|---|---|---|
| CR Dhan 201 | GK 5022 | |||
| Days to 50% flowering | ||||
| IR-68897A × KS - 22 | -2.25** | -12.50** | -0.25 | -6.83** |
| Plant height | ||||
| IR-68897A × HRSV - 7 | -8.00** | -15.41 ** | -31.36** | -18.27** |
| IR-68897A × ATR - 177 | -8.39 ** | -18.05** | -29.32 ** | -15.83** |
| IR-79156A × HRSV - 7 | -7.47** | -8.96** | -26.14** | -12.05** |
| IR-79156A × KS - 22 | -8.77 ** | -16.22** | -21.36** | -6.36 ** |
| Panicle length | ||||
| IR-68897A × KS - 22 | 24.66 ** | 18.41 ** | 13.37** | 16.71 ** |
| IR-79156A × KS - 24 | 25.88 ** | 21.46** | 13.18** | 16.51 ** |
| IR-68897A × KS - 24 | 22.01 ** | 17.41 ** | 9.40 ** | 12.62** |
| APMS-6A × ATR - 374 | 17.28** | 17.00** | 7.14** | 10.29** |
| IR-79156A × ATR - 177 | 27.17** | 21.68** | 5.42 ** | 8.52 ** |
| Productive tillers/plant | ||||
| APMS-6A × KS - 24 | 98.20 ** | 66.68** | 115.66** | 86.39** |
| APMS-6A × ATR - 374 | 78.91 ** | 54.53 ** | 99.94 ** | 72.81 ** |
| IR-79156A × ATR - 372 | 61.87** | 49.10** | 66.63** | 44.02 ** |
| APMS-6A × HRSV - 7 | 27.29** | 27.29** | 64.69 ** | 42.34 ** |
| Filled grains/panicle | ||||
| APMS-6A × HRSV - 7 | 90.74** | 78.31 ** | 54.55 ** | 107.59** |
| IR-79156A × ATR - 372 | 84.54** | 45.49** | 46.96** | 97.40** |
| Spikelet fertility percent | ||||
| IR-79156A × ATR - 372 | 11.21 ** | 1.17 | 6.15** | -3.52** |
| 1000 grain weight | ||||
| APMS-6A × ATR - 177 | 26.25 ** | 6.30** | 38.48** | 13.91 ** |
| IR-79156A × KS - 22 | 12.30** | -2.68 * | 27.07 ** | 4.52 ** |
| Contd. Table 7 | ||||
| Crosses | Heterosis | Heterobeltiosis | Standard Heterosis | |
| CR Dhan 201 | GK 5022 | |||
| Biomass/ plant | ||||
| APMS-6A × ATR - 374 | 51.41 ** | 50.56 ** | 80.91 ** | 23.15** |
| APMS-6A × ATR - 372 | 53.78** | 43.80 ** | 70.84 ** | 16.30** |
| Grain yield/plant | ||||
| APMS-6A × HRSV - 7 | 94.17** | 62.44 ** | 109.43** | 12.86** |
| APMS-6A × KS - 24 | 99.93** | 59.17** | 105.21 ** | 10.59** |
| IR-79156A × ATR - 372 | 131.13** | 119.25** | 99.21 ** | 7.36** |
| Productivity per day | ||||
| APMS-6A × HRSV - 7 | 90.08** | 62.54** | 95.44 ** | 10.69** |
| IR-79156A × ATR - 372 | 131.21 ** | 122.76** | 91.11** | 8.24 ** |
| APMS-6A × KS - 24 | 91.29** | 51.66** | 82.36 ** | 3.28 ** |
| Harvest index | ||||
| APMS-6A × HRSV - 7 | 28.79** | 20.01 ** | 29.91 ** | 10.54** |
| IR-68897A × ATR - 186 | 25.23 ** | 20.99 ** | 26.98** | 8.05** |
| IR-68897A × ATR - 372 | 30.56** | 26.77** | 24.04 ** | 5.54 ** |
| APMS-6A × KS - 24 | 27.70 ** | 14.38** | 23.81 ** | 5.35 ** |
* Significant at 5% level; ** Significant at 1% level.
Table 8.
Top ranking crosses based on high mean and their sca effects, gca effects of parents, standard heterosis for yield and its components in hybrid rice.
Table 8.
Top ranking crosses based on high mean and their sca effects, gca effects of parents, standard heterosis for yield and its components in hybrid rice.
| Crosses/Trait | Mean | SCA | GCA female | GCA male | Standard Heterosis | |
|---|---|---|---|---|---|---|
| CR-Dhan 201 | GK 5022 | |||||
| Days to 50% flowering | ||||||
| IR 68897A × KS - 22 | 89.44 | -6.91** | -0.47* | -3.13** | -0.25 | -6.83** |
| IR-79156A × ATR – 374 | 90.11 | -7.27** | -0.51** | -2.06** | 0.50 | -6.14** |
| IR-68897A × HRSV – 7 | 93.33 | -1.27* | -0.47* | -4.87** | 4.09** | -2.78** |
| IR-79156A × HRSV – 7 | 93.44 | -1.12 | -0.51** | -4.87** | 4.21** | -2.66** |
| APMS-6A × ATR – 177 | 93.67 | -6.94** | 0.98** | -0.32 | 4.46** | -2.43** |
| Plant height | ||||||
| IR-68897A × HRSV - 7 | 67.11 | -3.10** | -3.23** | -13.93** | -31.36** | -18.27** |
| IR-68897A × ATR-177 | 69.11 | -8.10** | -3.23** | -6.93** | -29.32 ** | -15.83** |
| IR-79156A × HRSV – 7 | 72.22 | -2.57** | 1.35** | -13.93** | -26.14** | -12.05** |
| IR-79156A × KS - 22 | 76.89 | -8.38** | 1.35** | -3.45** | -21.36** | -6.36 ** |
| APMS-6A × ATR – 216 | 78.67 | -10.73** | 1.88** | 0.14 | -19.55** | -4.20 ** |
| Panicle length | ||||||
| IR-68897A × KS – 22 | 25.23 | 3.94** | -0.98** | 1.14** | 13.37** | 16.71 ** |
| IR79156A × KS-24 | 25.18 | 1.25** | 0.62** | 2.19** | 13.18** | 16.51 ** |
| IR-68897A × KS – 24 | 24.34 | 2.01** | -0.98** | 2.19** | 9.40 ** | 12.62** |
| APMS 6A × ATR-374 | 23.84 | 2.59** | 0.37** | -0.23** | 7.14** | 10.29** |
| IR79156A × ATR-177 | 23.46 | 2.48** | 0.62** | -0.76** | 5.42 ** | 8.52 ** |
| No. of productive tillers/plant | ||||||
| APMS-6A × KS – 24 | 12.22 | 1.29** | 1.30** | 2.33** | 115.66** | 86.39** |
| APMS 6A × ATR-374 | 11.33 | 2.66** | 1.30** | 0.07** | 99.94 ** | 72.81 ** |
| IR79156A × ATR-372 | 9.44 | 1.26** | 0.26** | 0.63** | 66.63** | 44.02 ** |
| APMS 6A × HRSV-7 | 9.33 | 0.70** | 1.30** | 0.03 | 64.69 ** | 42.34 ** |
| APMS 6A × ATR-372 | 9.33 | 0.11** | 1.30** | 0.63** | 64.69 ** | 42.34 ** |
| No. of filled grains per panicle | ||||||
| APMS-6A × HRSV – 7 | 203.67 | 58.49** | 18.44** | 7.40** | 54.55 ** | 107.59** |
| IR-79156A × ATR – 372 | 193.67 | 31.25** | 1.42** | 73.51** | 46.96** | 97.40** |
| APMS-6A × ATR – 372 | 181.22 | 1.78* | 18.44** | 73.51** | 37.52** | 84.71 ** |
| IR-79156A × ATR – 216 | 178.78 | 52.32** | 1.42** | 5.70** | 35.67** | 82.22** |
| APMS-6A × ATR – 375 | 167.00 | 23.23** | 18.44** | 6.00** | 26.73 ** | 70.22 ** |
| Spikelet fertility (%) | ||||||
| IR-79156A × ATR – 372 | 91.56 | 6.69** | 2.56** | 0.90* | 6.15** | -3.52** |
| IR-68897A × KS – 24 | 90.81 | 5.82** | 1.80** | 1.76** | 5.29** | -4.31 ** |
| IR79156A × ATR-177 | 90.69 | 4.13** | 2.56** | 2.58** | 5.14** | -4.44 ** |
| IR79156A × ATR-216 | 89.48 | 4.38** | 2.56** | 1.12** | 3.75** | -5.71 ** |
| IR-68897A × HRSV-7 | 89.37 | 3.52** | 1.80** | 2.63** | 3.62** | -5.83** |
| * Significant at 5 % level, ** significant at 1 % level | ||||||
| Crosses/Trait | Mean | SCA | GCA female | GCA male | Heterosis | |
| CR-Dhan 201 | GK 5022 | |||||
| 1000 grain weight | ||||||
| APMS-6A × ATR – 177 | 26.73 | 3.71** | -0.06 | 2.28** | 38.48** | 13.91 ** |
| IR-79156A × KS – 22 | 24.53 | 1.69** | 0.53** | 1.50** | 27.07 ** | 4.52 ** |
| APMS-6A × AR - 19 -18 | 23.42 | 1.12** | -0.06 | 1.55** | 21.31** | -0.21 |
| IR-79156A × HRSV – 7 | 23.32 | 0.78** | 0.53** | 1.19** | 20.78** | -0.65 |
| IR-68897A × KS – 22 | 23.07 | 1.22** | -0.47** | 1.50** | 19.49** | -1.71 |
| Biomass per plant | ||||||
| APMS-6A × ATR – 374 | 44.60 | 7.55** | 2.44** | 4.11** | 80.91 ** | 23.15** |
| APMS-6A × ATR – 372 | 42.12 | 1.09** | 2.44** | 8.08** | 70.84 ** | 16.30** |
| IR-79156A × ATR-372 | 41.79 | 3.47** | -0.27** | 8.08** | 69.50** | 15.39** |
| APMS-6A × KS – 24 | 40.30 | 6.90** | 2.44** | 0.45** | 63.47** | 11.28** |
| APMS-6A × ATR – 375 | 38.02 | 1.77** | 2.44** | 3.31** | 54.22 ** | 4.98** |
| Grain yield/plant | ||||||
| APMS-6A × HRSV-7 | 34.46 | 10.27** | 3.39** | 0.30** | 109.43** | 12.86** |
| APMS-6A × KS – 24 | 33.77 | 7.26** | 3.39** | 2.61** | 105.21 ** | 10.59** |
| IR-79156A × ATR – 372 | 32.78 | 2.71** | -1.00** | 10.57** | 99.21 ** | 7.36** |
| APMS-6A × ATR – 375 | 30.40 | 5.66** | 3.39** | 0.84** | 84.73** | -0.45 |
| Productivity per day | ||||||
| APMS-6A × HRSV-7 | 118.10 | 34.97** | 10.63** | 3.20** | 95.44 ** | 10.69** |
| IR-79156A × ATR – 372 | 115.48 | 12.13** | -2.93** | 36.99** | 91.11** | 8.24 ** |
| APMS-6A × KS – 24 | 110.19 | 23.79** | 10.63** | 6.48** | 82.36 ** | 3.28 ** |
| APMS-6A × ATR – 375 | 97.24 | 17.17** | 10.63** | 0.14 | 60.91 ** | -8.86** |
| Harvest Index | ||||||
| APMS-6A × HRSV-7 | 50.57 | 10.18** | 2.27** | -1.79** | 29.91 ** | 10.54** |
| IR-68897A × ATR – 186 | 49.23 | 6.94** | -1.46** | 4.04** | 26.98** | 8.05** |
| IR-68897A × ATR – 372 | 48.29 | 2.84** | -1.46** | 6.99** | 24.04 ** | 5.54 ** |
| APMS-6A × KS – 24 | 48.20 | 3.49** | 2.27** | 2.53** | 23.81 ** | 5.35 ** |
| IR-79156A × ATR – 372 | 46.74 | 0.64** | -0.80** | 6.99** | 20.07 ** | 2.17** |
* Significant at 5 % level, ** significant at 1 % level.
Table 9.
Analysis of variance for yield and yield components for stability in rice.
| Source | df | DFF | PH | PL | PT | FG | SF | TGW | BM | GY | PPD | HI |
|---|---|---|---|---|---|---|---|---|---|---|---|---|
| Replication within environment | 6 | 0.45 | 0.83 | 0.03 | 0.00 | 1.16 * | 0.71 | 0.00 | 0.06 | 0.02 | 0.95 | 0.01 |
| Genotypes | 44 | 142.06** | 262.58** | 14.03** | 9.72 ** | 3768.59 ** | 118.40** | 20.85** | 126.68** | 123.47** | 1372.20** | 97.37** |
| Env.+ (Var.* Env.) | 90 | 35.45** | 17.57** | 0.43** | 0.32 ** | 15.39 ** | 4.03** | 0.34 | 1.26** | 1.17** | 6.35** | 8.47 |
| Environments | 2 | 1357.50** | 710.03** | 17.41** | 12.26 ** | 620.26 ** | 57.21** | 1.22* | 47.66** | 38.88** | 8.05* | 5.68 |
| Genotype x Environment | 88 | 5.40** | 1.84** | 0.04 | 0.04 | 1.64 ** | 2.82** | 0.32 | 0.21** | 0.32* | 6.31** | 8.53 |
| Environment (linear) | 1 | 2715.00** | 1420.07** | 34.81** | 24.52 ** | 1240.53 ** | 114.42** | 2.43** | 95.31** | 77.76** | 16.10** | 11.35 |
| Genotype x Environment (linear) | 44 | 8.64** | 3.19** | 0.04 | 0.03 | 2.85 ** | 4.26** | 0.30 | 0.33** | 0.43** | 10.66** | 5.28 |
| Pooled Deviation | 45 | 2.12** | 0.47 | 0.04 | 0.06 ** | 0.42 | 1.36 | 0.31** | 0.09 | 0.20** | 1.92** | 11.51** |
| Pooled Error | 264 | 1.14 | 0.76 | 0.05 | 0.00 | 1.27 | 1.00 | 0.14 | 0.13 | 0.05 | 0.54 | 0.10 |
* Significant at 5% level ** Significant at 1% level. DFF - Days to 50% flowering, PH - Plant height, PL - Panicle length, PT - Number of productive tillers per plant, FG - Number of filled grains per panicle, SF - Spikelet fertility (%), TGW - 1000 grain weight, BM - Biomass per plant, GY - Grain yield per plant, PPD- Productivity per day, HI - Harvest index (%).
Table 10.
Environmental indices for yield and yield components in rice.
| Character | Locations | ||
|---|---|---|---|
| Rajendranagar | Warangal | Kampasagar | |
| Days to 50% flowering | -5.281 | -0.400 | 5.681 |
| Plant height | -4.040 | 0.138 | 3.901 |
| Panicle length | -0.561 | 0.669 | -0.107 |
| No. of productive tillers per plant | -0.286 | 0.602 | -0.316 |
| No. of filled grains per panicle | -3.126 | -0.978 | 4.104 |
| Spikelet fertility (%) | -1.221 | 0.218 | 1.003 |
| 1000 grain weight | -0.19 | 0.094 | 0.096 |
| Biomass per plant | -0.839 | -0.309 | 1.148 |
| Grain yield per plant | -0.873 | -0.105 | 0.978 |
| Productivity per day | -0.320 | -0.159 | 0.479 |
| Harvest index (%) | -0.408 | 0.170 | 0.239 |
Table 11.
Stable parents and crosses for grain yield and its component traits.
| S.No. | Characters | X > X, bi =1, S2di=0 | bi >1, S2di=0 | bi <1, S2di=0 | |
|---|---|---|---|---|---|
| Average stability | Suitable for favourable environments | Specifically adapted to poor environments | |||
| 1 | Days to 50% flowering | P | IR-68897B, ATR – 216 | ATR – 177, ATR – 186 | - |
| C | IR-79156A × ATR – 372IR-79156A × ATR – 374IR-79156A × HRSV – 7IR-68897A × KS – 22IR-68897A × HRSV – 7 | APMS-6A × KS – 22APMS-6A × KS – 24 | - | ||
| 2 | Plant height | P | IR-79156B, IR-68897B, ATR – 375, HRSV – 7 | ATR-372 | - |
| C | IR-79156A × KS – 22IR-79156A × HRSV – 7APMS-6A × ATR – 216IR-68897A × ATR – 177IR-68897A × ATR – 186IR-68897A × HRSV – 7 | APMS-6A × ATR – 372APMS-6A × ATR – 374 | |||
| 3 | Number of filled grains per panicle | P | ATR-372, AR-19-18 | APMS-6B, ATR – 216 | - |
| C | IR-79156A × ATR –216IR-79156A × ATR – 372APMS-6A × ATR – 372APMS-6A × ATR – 375APMS-6A × KS – 22APMS-6A × KS – 24APMS-6A × HRSV – 7 | IR-79156A × ATR – 374IR-79156A × HRSV – 7APMS-6A × AR - 19 -18IR-68897A × ATR – 177 | |||
| 4 | Spikelet fertility (%) | P | - | - | - |
| C | - | IR-79156A × ATR – 374APMS-6A × HRSV - 7IR-68897A × ATR – 216IR-68897A × KS – 22IR-68897A × HRSV – 7 | |||
| 5 | Biomass per plant | P | AR-19-18 | - | - |
| C | IR-79156A × ATR – 372APMS-6A × ATR – 374APMS-6A × ATR – 375APMS-6A × KS – 24 | APMS-6A × ATR – 372IR-79156A × ATR –216 | |||
| 6 | Grain yield per plant | P | ATR-186 | ATR-374 | - |
| C | IR-79156A × ATR – 372APMS-6A × HRSV – 7 | - | - | ||
| 7 | Productivity per day | P | APMS-6B, ATR-186 | - | - |
| C | - | IR-79156A × ATR –216 | IR-79156A × ATR – 372APMS-6A × ATR – 374APMS-6A × ATR – 375APMS-6A × HRSV – 7 |
P – Parents (Lines & testers); C – Crosses.
Disclaimer/Publisher’s Note: The statements, opinions and data contained in all publications are solely those of the individual author(s) and contributor(s) and not of MDPI and/or the editor(s). MDPI and/or the editor(s) disclaim responsibility for any injury to people or property resulting from any ideas, methods, instructions or products referred to in the content. |
© 2023 by the authors. Licensee MDPI, Basel, Switzerland. This article is an open access article distributed under the terms and conditions of the Creative Commons Attribution (CC BY) license (http://creativecommons.org/licenses/by/4.0/).
Copyright: This open access article is published under a Creative Commons CC BY 4.0 license, which permit the free download, distribution, and reuse, provided that the author and preprint are cited in any reuse.


