
Submitted:
21 July 2023
Posted:
24 July 2023
You are already at the latest version
Abstract
Heterochromatin formation plays a pivotal role in regulating chromatin organization and influences nuclear architecture, and genome stability and expression. Among the regions at which heterochromatin is present, pericentric regions are known to recruit the histone variant macroH2A1. However, the factors and mechanisms behind macroH2A1 incorporation into these regions have not been explored. In this study, we probe different conditions that lead to the recruitment of macroH2A1 to pericentromeric regions and elucidate its underlying functions. Through experiments conducted on murine fibroblastic cells, we discover that partial chromatin relaxation resulting from DNA damage, senescence or histone hyper-acetylation, is necessary for the recruitment of macroH2A1 to pericentric regions. Furthermore, macroH2A1 is required for up-regulation of noncoding pericentric RNA expression but not for pericentric chromatin organization. Our findings shed light on the functional rather than structural significance of macroH2A1 incorporation into pericentric chromatin.
Keywords:
chromatin
; macroH2A1
; pericentromere
1. Introduction
Histone post-translational modifications, histone variants, DNA-binding factors and architectural proteins regulate the three-dimensional (3D) chromatin organization and DNA-related processes [1,2]. Histone variants replace canonical histones in a locus-specific manner, which endows chromatin with properties required for nuclear functions [3]. The histone variant macroH2A1 (mH2A1) is a vertebrate-specific [4,5] histone H2A variant, composed of an N-terminal “H2A-like” domain (64% identical to H2A) and a “linker” domain that positions a C-terminal 25 kDa “macro” domain outside the nucleosome [6]. Expression of the highly conserved H2AFY gene produces two splicing isoforms, mH2A1.1 and mH2A1.2, that differ in a 30 amino-acid region within the macro domain [6]. mH2A1 is enriched at heterochromatin domains on the inactive X chromosome (Xi) [7,8] or on autosomes. Concerning the latter, mH2A1 forms large domains at facultative heterochromatin [9,10,11], to a lesser extent, at constitutive heterochromatin marked with the histone mark H3K9me3 [12] and at silent ribosomal DNA segments (rDNA) [13]. Moreover, in senescent cells, this histone variant is incorporated into Senescence Associated Heterochromatin Foci (SAHFs) [14], which are composed of both heterochromatin types and pericentromeric regions [15,16]. In quiescent lymphocytes or cells treated with HDAC and DNMT1 inhibitors, mH2A1 was found to be recruited to pericentric regions in mouse and human cells [17,18]. While the presence of mH2A1 is associated with condensation of the Xi chromosome, mH2A1 is not essential for initiating or maintaining inactivation of this chromosome [7,19,20,21,22]. However, some genes present on the Xi chromosome were reactivated upon experimentally induced loss of mH2A1 when cells were treated with trichostatin A (TSA) [23]. At autosomes, loss of mH2A1 modified heterochromatin marks and gene expression only marginally [12,19,24,25,26]. The functions of mH2A1 at pericentric heterochromatin or within SAHFs have not yet been uncovered. In this study, we investigated the mechanisms underlying the recruitment of mH2A1 to pericentric regions and explored its functional significance in these genomic areas. Our findings reveal that senescence and various insults, such as induction of double-strand breaks (DSBs), and hyperacetylation, lead to a robust recruitment of mH2A1 to pericentric regions in murine fibroblast cells. Pericentric chromatin relaxation was a prerequisite for mH2A1 incorporation. Although mH2A1 was not required for this relaxation to occur, it is necessary for the activation of transcription of pericentromeric noncoding RNA, which has been suggested to be essential for heterochromatinization of pericentromeric regions [27].
2. Materials and Methods
Cell Culture. The L929 cell line was kindly provided by Jerome Cavaillé from CBI-Toulouse, France. MCF7 cell lines were purchased from ATCC, and were maintained and amplified in Dulbecco’s Modified Eagle’s (DMEM) for L929 and in DMEM-F12 for MCF-7 cells, supplemented with gentamycin (50 µg/ml) (Gibco), fetal bovine serum (10%, Gibco) and sodium pyruvate (100 mM, Sigma). Cells were maintained in a humidified incubator at 37°C with 5% CO2. Cell lines were regularly tested for mycoplasma infection (MycoAlert, Lonza). Senescence induction was done using 12.5 µM etoposide (Cell Signaling #2200) during 24h followed by 3-4 days release [27,28]. Trichostatin A (TSA) treatment was done using 500 nM TSA (T8552, Sigma) during 48h. ATM inhibitor treatment was done using 20 µM of Ku55933 inhibitor (Tocris Bioscience), added 1h before Cas9-MajS transfection. The generation of L929 mH2A1 KO clones was done according to the procedure presented in [29]. gRNA and plasmids used are given in S1 and S2 Tables. The expression of mH2A1 in selected clones was tested by western blot, IF and PCR-based screening strategy. We also selected these two clones using PCR-based screening strategy showing the presence of two different homozygous DNA mutations (Materials and Methods).
Transfection and siRNA Knockdown. At 30-50% confluence, transfection of siRNA (11 nM) against HIRA was performed using INTERFERin (Polyplus-Ozyme) according to the manufacturer’s protocol. Transfections of plasmids were done with FuGene HD (Promega) according to the manufacturer’s protocol. siRNA and plasmid sequences are available in S3 and S2 Tables, respectively. Cells were recovered two- and three-days post plasmid and siRNA transfections, respectively. Knockdown efficiency was analyzed by western blot.
Real-Time qPCR. Total RNA was isolated using the RNAeasy midi kit (Qiagen) followed by digestion of residual genomic DNA by Invitrogen Turbo DNA-free kit. Purified RNA was reversed transcribed to cDNA using Maxima H Minus first Strand cDNA synthesis kit (Promega). The sequences of the primers used are available in S4 Table. RT-PCR was performed using iTAq Universal SYBR Green (Bio-Rad) according to manufacturer’s instructions. The relative expression levels of MajS ncRNA were normalized to GAPDH RNA expression and evaluated according to the 2-Ct method. Same method was used for senescence markers but normalized with 18S rRNA expression (Figure A3B).
Western Blot Analysis. Cells were lysed and subjected to Immunoblot analysis as previously described [30]. Briefly, protein extracts were separated in 10% polyacrylamide (1:125 bisacrylamide:acrylamide) SDS gels, transferred onto nitrocellulose membrane (Bio-Rad) and blocked with PBS-Tween 0.4% - Milk 5% for 1h at room temperature (RT) with rotation. Membranes were then incubated with primary antibodies overnight (O/N) at 4°C or 1h30 at RT in PBS-Tween 0.4% - Milk 5% with rotation. Primary antibodies are described in the S5 Table. Membranes were next incubated with secondary antibody in PBS-Tween 0.4% - Milk 5% 1h at RT with rotation and the signal was detected using chemiluminescence. Secondary antibodies are described in the S5 Table. Signal quantifications were carried out with Image Lab software (Bio-Rad).
Senescence-associated galactosidase assay. Cells were treated with etoposide (Cell Signaling #2200) (12.5 µM) during 24h following by an etoposide release for 3-4 days. Senescence-associated galactosidase assay was then performed with Senescence -Galactosidase Staining Kit (Cell Signaling #9860) according to manufacturer’s instructions. Cells were photographed using a light microscope at x20 magnification (Invitrogen EVOS Digital Color Fluorescence Microscope). Cell counting was done with ImageJ in ten different fields per condition. Two independent experiments were performed for each condition.
Immunofluorescence and confocal Microscopy. Two- or three-days post-transfection, cells were fixed with 4% paraformaldehyde for 10 min at RT. Cells permeabilization was carried out using 0.1% Triton X-100 in PBS for 10 min at RT. Cells were then blocked with 5% BSA-0.15% Tween in PBS for 1h at RT. Next, cells were incubated with primary antibody O/N at 4°C. Cells were then incubated with Alexa conjugated secondary antibody for 1h at RT. Antibody references and dilutions are provided in S5 Table. The coverslips were finally incubated with Hoechst (Invitrogen, 33342) for 30 min and then mounted with mounting media (Vectashield). Images were acquired with Zeiss LSM 710 big confocal microscope using an x63 PL APO oil DIC On 1.4 objective for all experiments. Images were taken in Z-stacks with a voxel size of 300 nm. Max intensity projection of Z-stacks are shown.
Analysis of microscopy images. Image analysis of chromocenters, other foci and whole nuclei were performed using ImageJ. Max intensity projection images were used. Cells were selected based on Hoechst staining and chromocenters were defined as the Hoechst-dense regions. For the experiments using Cas9-MajS gRNA, positive cells were selected on the basis of the presence of Cas9-GFP and/or H2AX foci at chromocenters. Different parameters were evaluated: area, mean intensity, perimeter and circularity. For Figure S8E, whole nucleus intensities of H3K9me3 and HP1 were measured and used to generate boxplots. For Figure S4C, whole nucleus intensities of mH2A1 were measured when mH2A1 does not form foci at chromocenters. Per cell, we calculated the mean of the different parameters (area, mean intensity, perimeter and circularity) measured for each focus. Boxplots were generated using R studio. The number of cells presenting foci of mH2A1, H2AX and SA-gal positive cells were counted manually from different biological replicates. Results are presented as mean ± SD. The number of cells presenting decondensed chromocenters was counted by eye, based on the comparison with chromocenter organization in untreated cells. Scatter plot was generated using R studio.
Statistics and reproducibility. Results from at least 2 biological replicas are presented except for Figures S3B and S4B and 4B. All statistical analyses were performed using R. Wilcoxon tests were used to assess the significance of the observed differences between samples. Differences were considered significant at a P value of 0.05 or less. **** P value < 0.0001, *** P < 0.001, ** P < 0.01, * P < 0.05, ns: non-significant.
3. Results
3.1. The histone variant mH2A1 accumulates at pericentric heterochromatin in mouse senescent cells.
During senescence induction in human cells, mH2A1 is known to be recruited to SAHFs that contain pericentric regions [14]. We asked if mH2A1 was also recruited to murine pericentric regions during senescence induction. Murine “chromocenters” offer the possibility to easily visualize the clustering of pericentromeric regions as large dense foci with Hoechst. We therefore examined the localization of mH2A1 in proliferating murine L929 fibroblasts. mH2A1 presented a general faint staining throughout the nucleus but was not detectable at chromocenters (Figure 1A). We then treated L929 fibroblasts with 12.5 µM of etoposide, a topoisomerase II inhibitor, followed by an etoposide release during 3-4 days to induce senescent cells [27,28] (Materials and Methods). In addition to general diffuse nuclear staining, the most striking feature of mH2A1 distribution in senescent cells was a pronounced labeling of chromocenters which co-localized with HP1 (Figure 1A). The percentage of cells showing pronounced pericentric mH2A1 staining (91% ± 12 SD) of cells (Figure 1A) was in the same range as senescence-associated galactosidase-positive cells (SA-gal) (89,8% (± 0,76 SD)) (Figure 1B). Immunoblot analysis of mH2A1 protein levels indicated no increase in total mH2A1 protein in senescent cells compared to proliferative cells (Figure 1C), suggesting that the endogenous mH2A1 content was redistributed to pericentric regions upon senescence induction. Increased levels of phosphorylated histone H2AX (H2AX) are consistent with the fact that senescent cells are known to permanently maintain a DNA damage response [31,32]. Therefore, we compared H2AX staining intensities in proliferative and senescent mouse cells. H2AX signals in proliferative cells were weaker than in senescent cells (Figure 1D). In senescent cells, in addition to small foci uniformly distributed throughout the nucleus, H2AX formed larger foci which partly co-localized with chromocenters. These larger foci also partly co-localized with mH2A1 at pericentric centers (Figure 1A). We noted that H2AX foci were frequently found near the periphery of chromocenters in agreement with the idea that DSBs within pericentric DNA relocalize to the periphery of chromocenters upon repair [33,34,35]. To assess the nature and extent of chromatin alterations in response to senescence induction, we measured the area and the average intensity of Hoechst, mH2A1 and H2AX labeling (Figure 1E,F). We found that the nuclear volume increased drastically upon senescence induction (a∼3-fold increase) (Figure 1E). Moreover, we discovered that chromocenter areas were larger in senescent cells compared to the ones in proliferative cells. Fluorescence intensity was decreased within the enlarged chromocenters (Figure 1F). These results indicate that chromocenters of mouse senescent cells are partially decondensed compared to chromocenters of proliferative cells. Surprisingly, chromatin relaxation was accompanied neither by the eviction of HP1 (Figure 1A) nor by the reduction of H3K9me3 (data not shown).
3.2. Cas9-mediated Induction of DSBs at pericentric heterochromatin triggers recruitment of mH2A1.
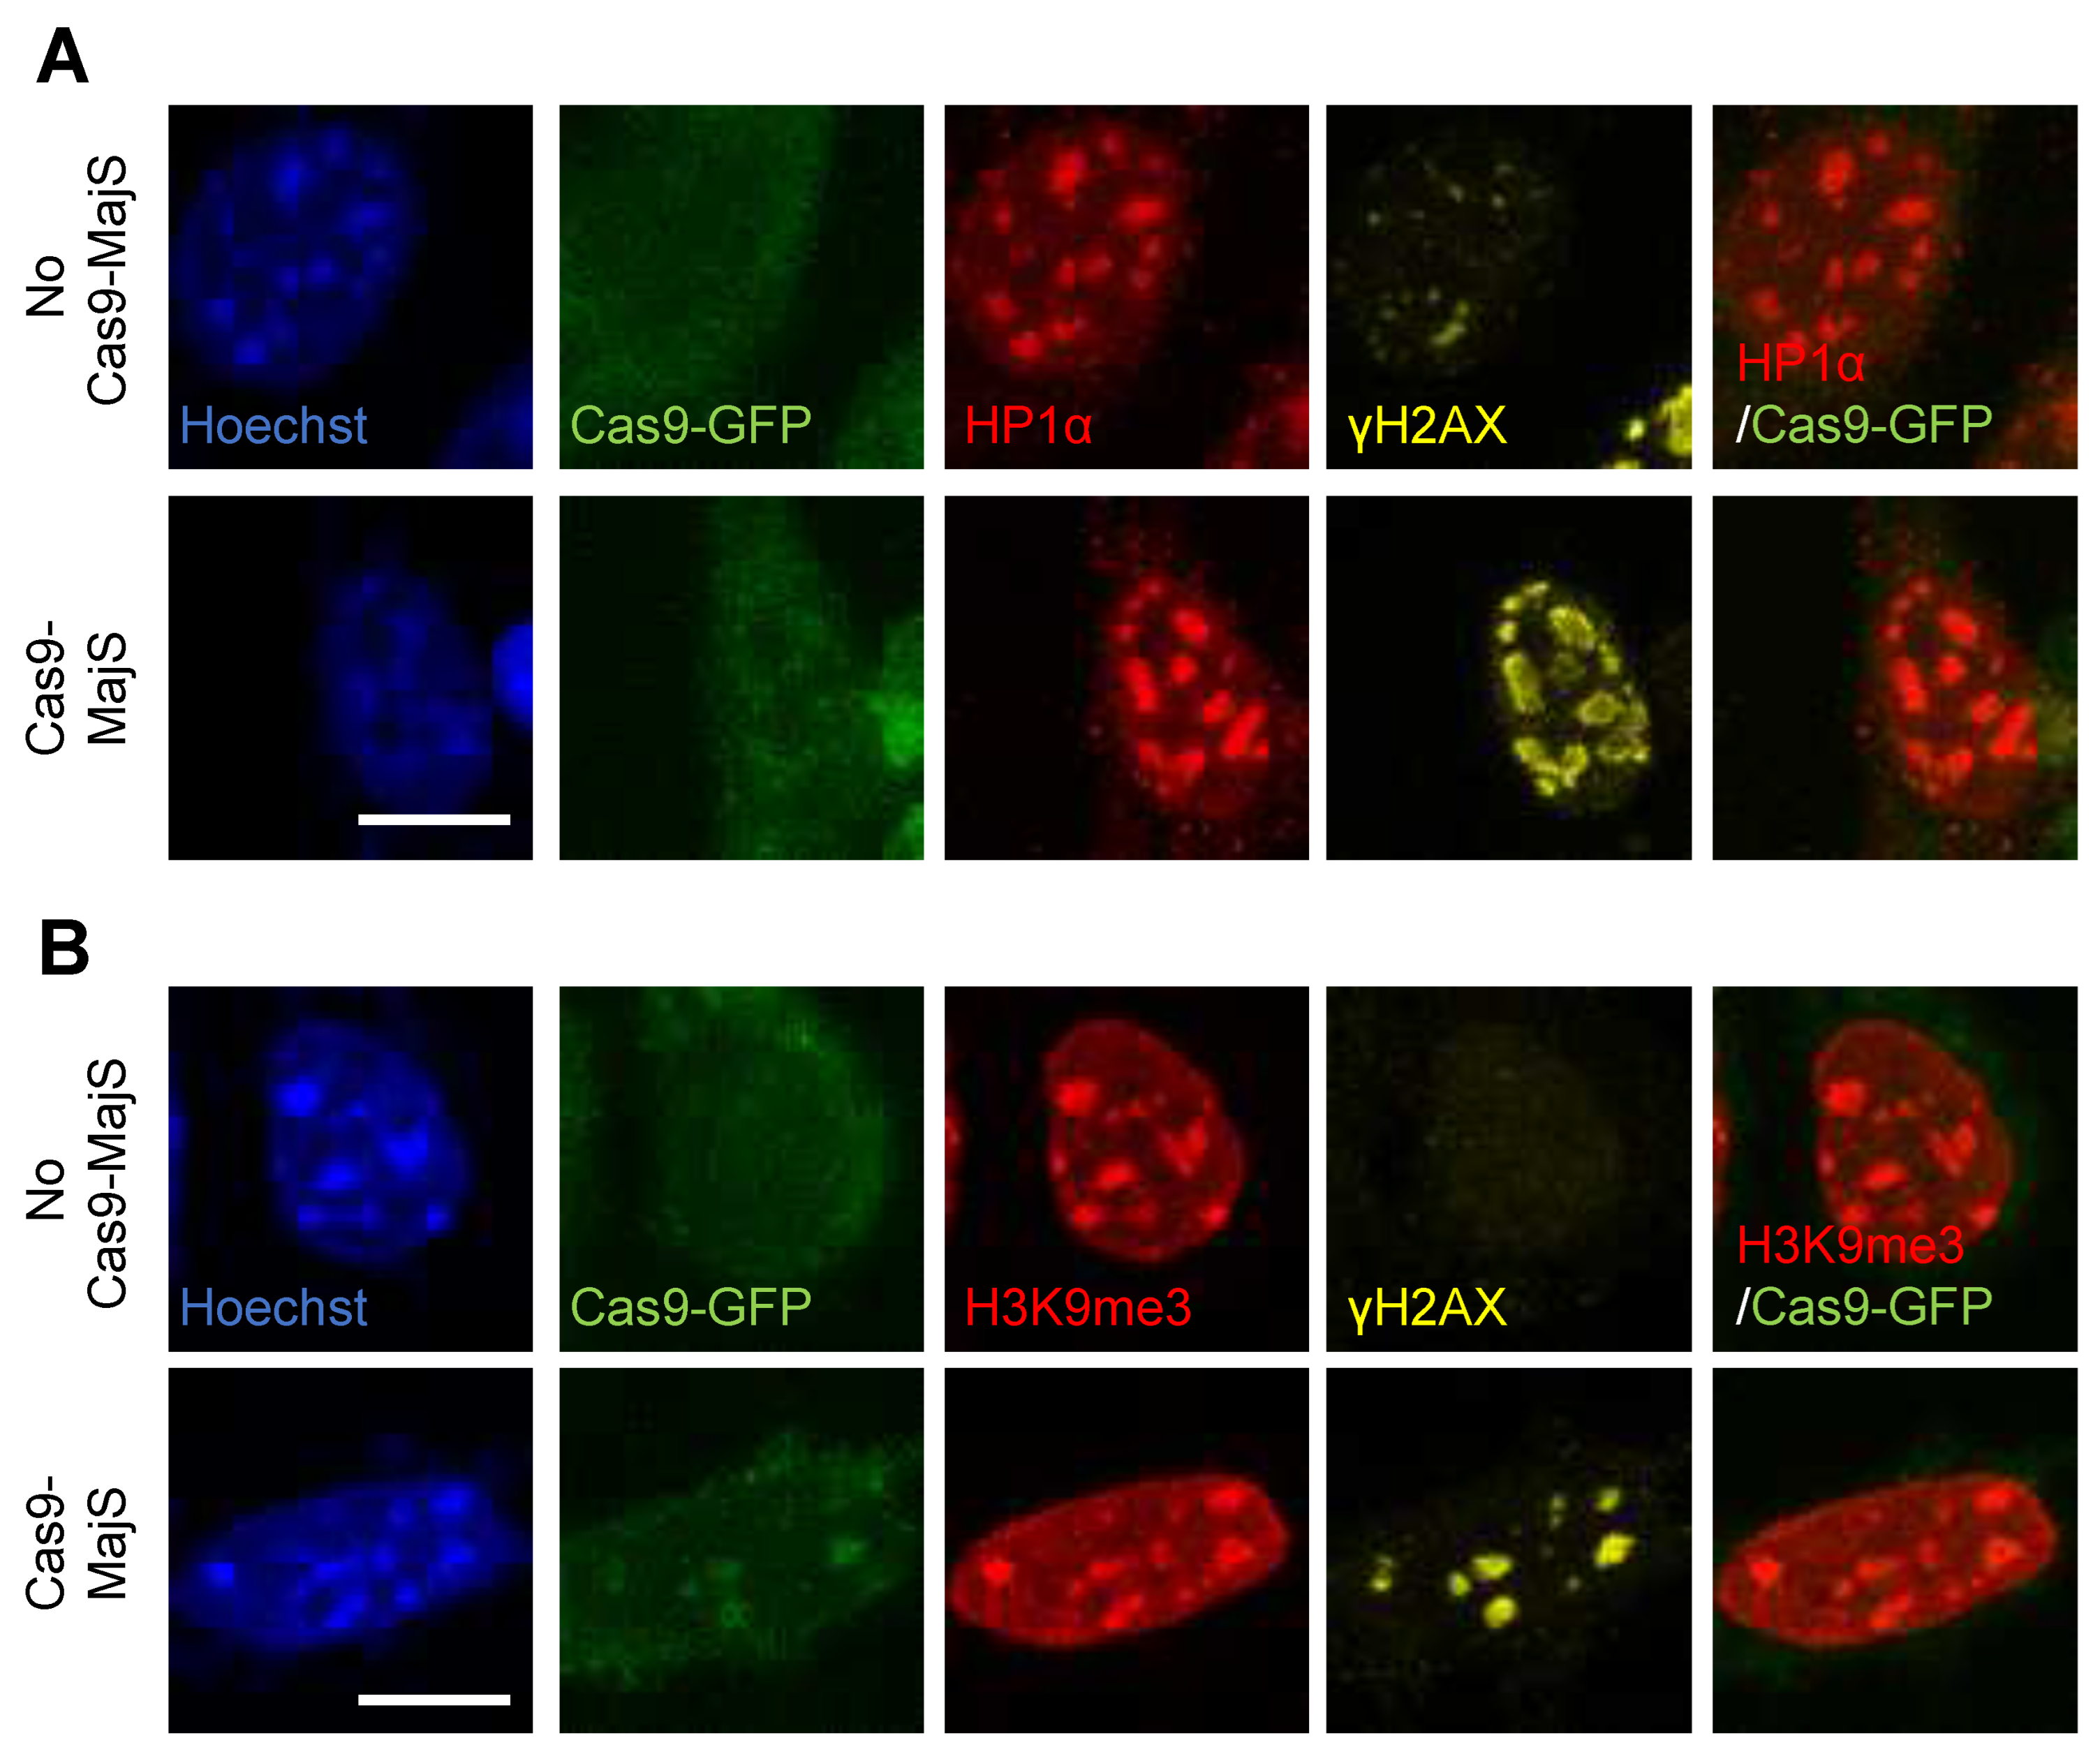
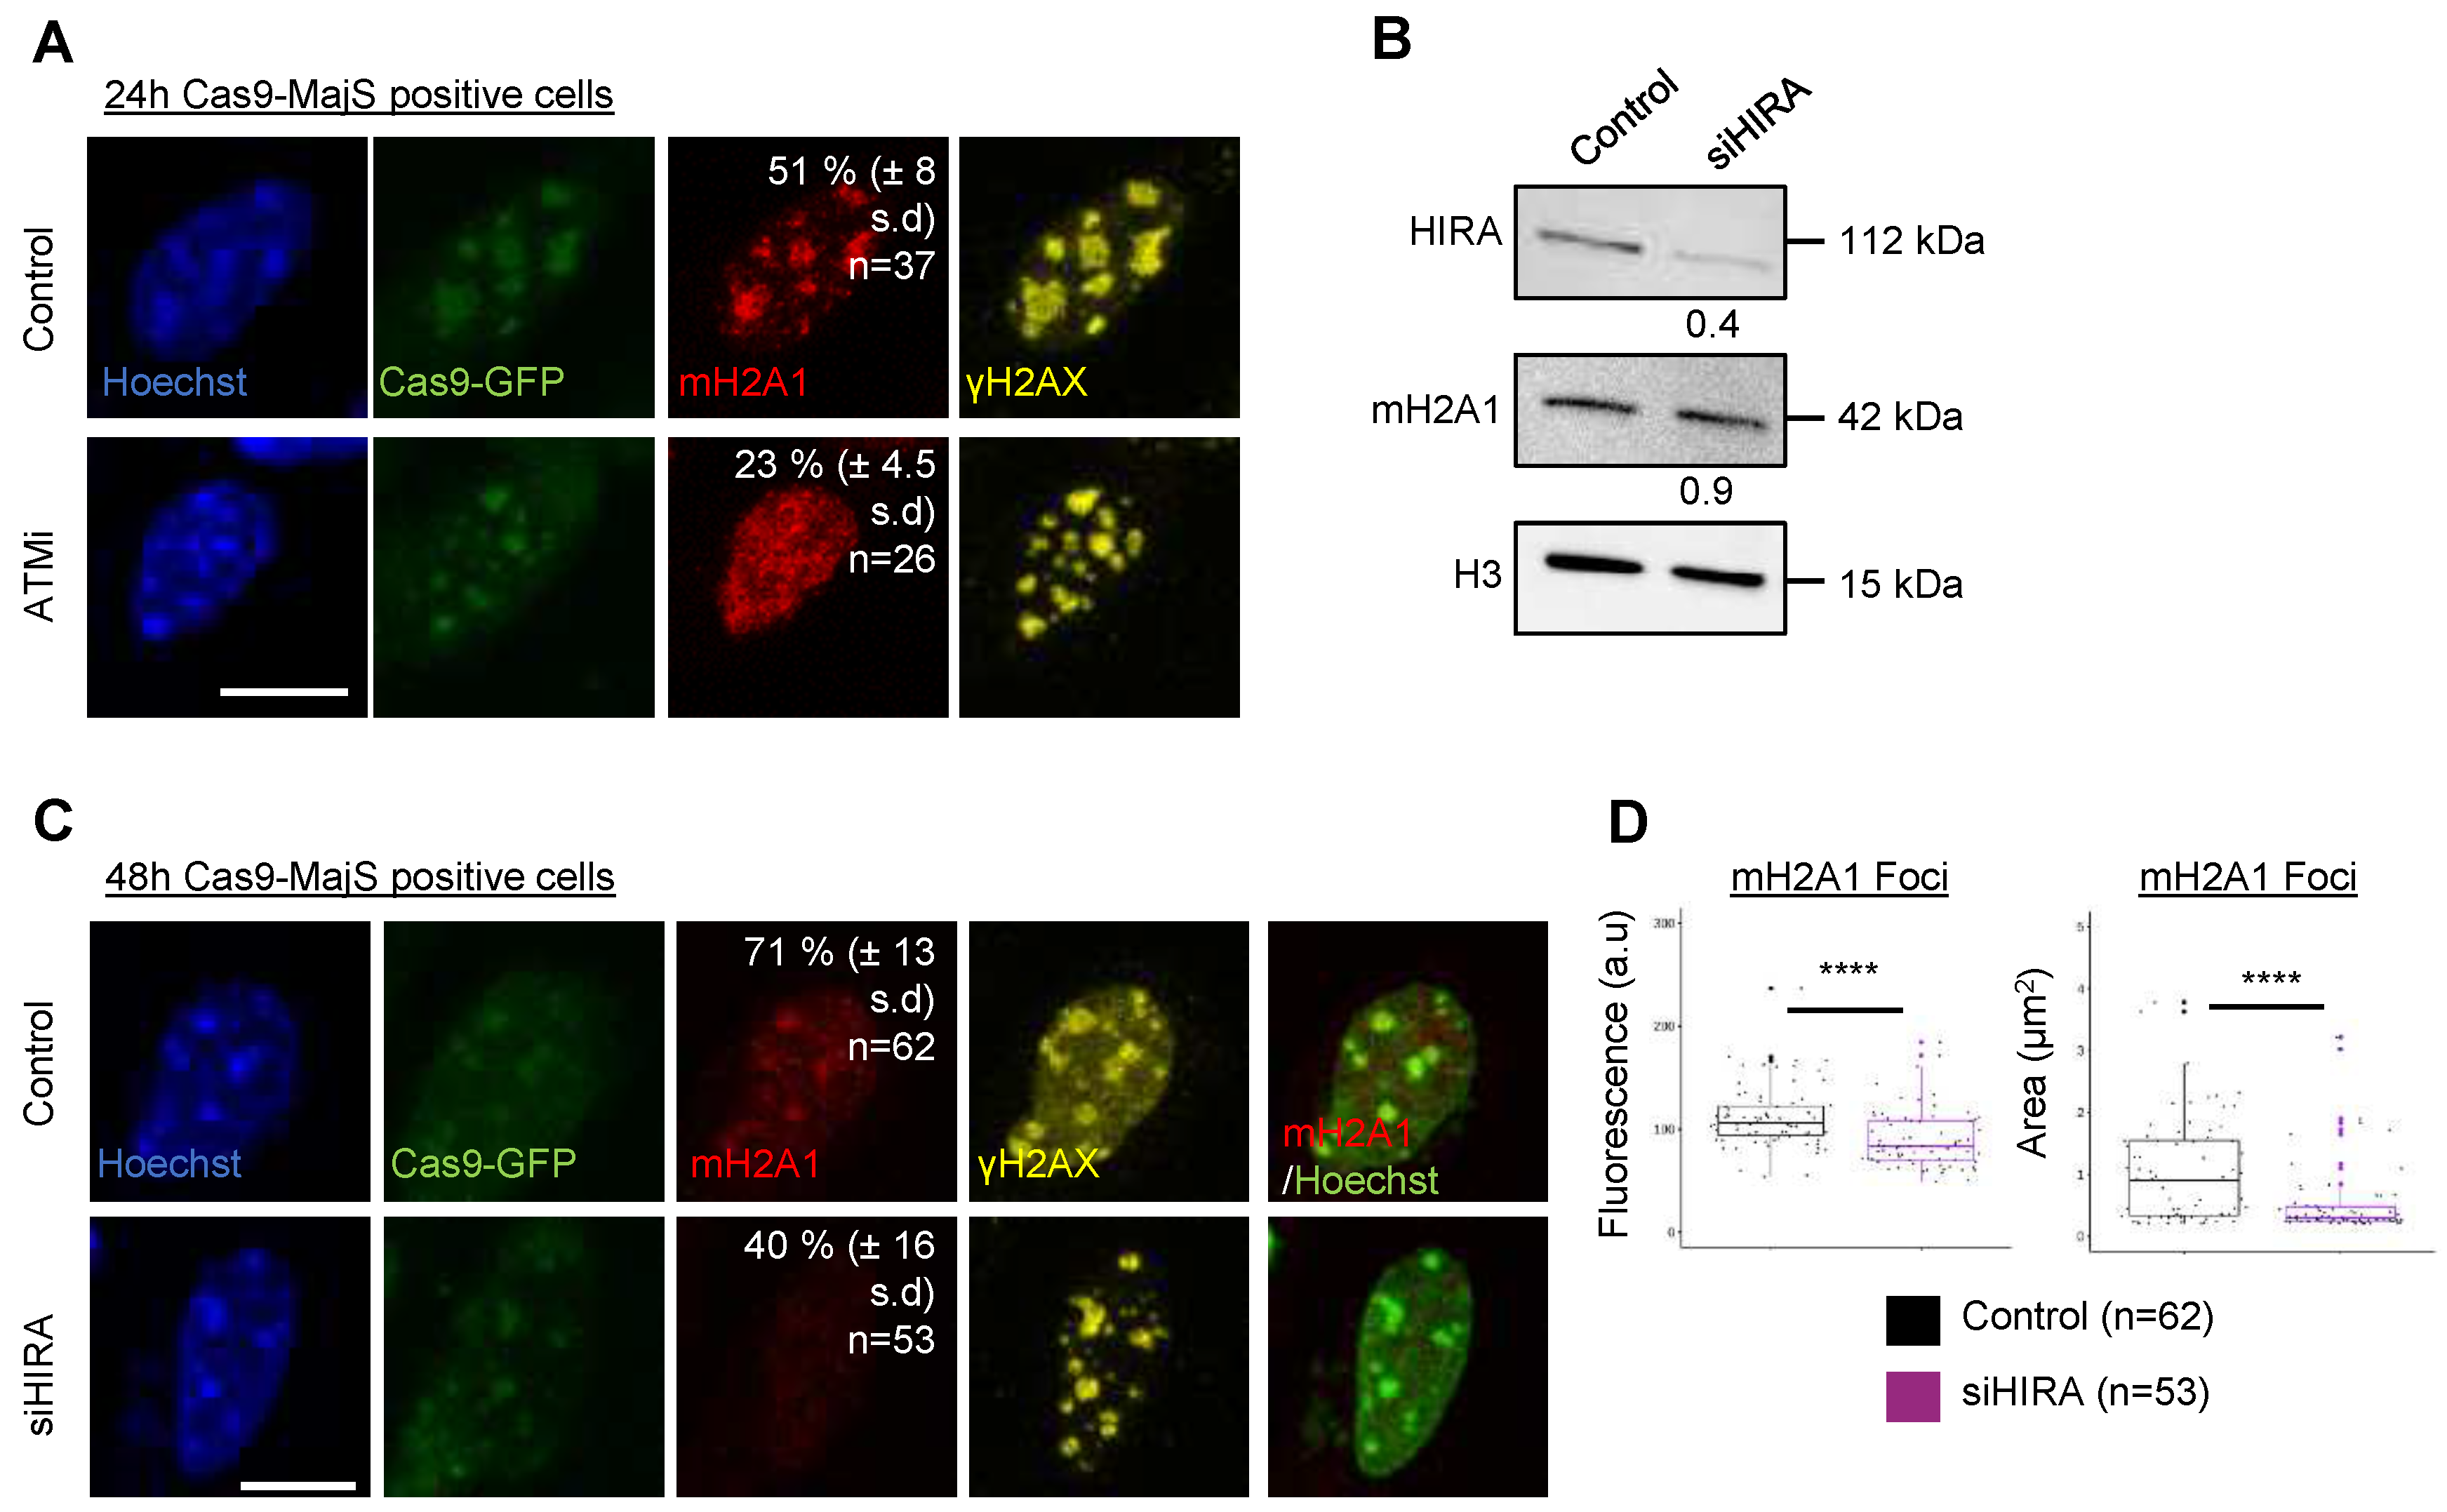
The pericentric distribution of mH2A1 in mouse senescent cells characterized by the proximity of DNA damage (H2AX foci), led us to investigate whether DNA damage within pericentric regions could trigger mH2A1 recruitment. Expression of the Cas9 nuclease fused to GFP (Cas9-GFP) together with a guide RNA (gRNA) targeting major satellite (MajS) repeats of pericentric regions in mouse cells allowed us to efficiently and specifically induce DSBs at pericentric heterochromatin (Figure 2). The efficiency of generating DSBs with this synthetic system was rigorously evaluated using DSB markers such as H2AX and DNA repair protein- and DNA damage response (DDR)-markers [35]. Cas9-GFP formed nuclear foci which co-localized with H2AX-stained chromocenters (Figure 2A). mH2A1 specifically and massively associated with chromocenters upon DSB induction at pericentromeric sequences but not when induced at Minor satellites, (MinS) nor at telomeres (Telo) [36]. To assess the nature and extent of chromatin alterations occurring after DSB induction at pericentric regions, we measured the area and the average intensity of chromocenters, H2AX, H3K9me3, HP1 and whole nucleus (Figure 2B). We observed that the size of chromocenters was increased upon DSB induction while the average intensity of Hoechst-labeled DNA decreased. These results demonstrate that DSB-containing chromocenters are partially expanded as compared to control chromocenters. Chromatin relaxation was accompanied neither by the eviction of HP1 nor by a reduction in H3K9me3 (Figure 2B and Figure A1A,B). We hence asked if mH2A1 recruitment to pericentromeric regions was caused by DNA breakage or by the ensuing DNA repair process. To that end, we tested if treating cells with an ATM inhibitor (ATMi) (Ku55933, 20 µM) during DSB induction affected mH2A1 association. 24h post-transfection of Cas9-gRNA majS, the number of mH2A1-positive cells (corresponding to cells presenting pronounced pericentric mH2A1 staining) decreased in ATMi treated cells (23% ± 5 SD vs 51% ± 8 SD) (Figure A2A) suggesting that mH2A1 recruitment is in part dependent on ATM activation. We next assessed the role of HIRA, a chaperone necessary for the recruitment of mH2A1 to SAHFs [14] and required for chromatin reassembly after DSB repair [37] in the recruitment of mH2A1 to pericentric regions. Partial depletion of HIRA by siRNA (Figure A2B) reduced mH2A1 binding to pericentric regions upon DSB induction (40% ± 16 SD vs 71% ± 13 SD) (Figure A2C,D). Similar results were obtained in senescent cells (data not shown). Our results indicate that mH2A1 recruitment to damaged pericentric regions requires a functional repair pathway.
3.3. mH2A1 recruitment to pericentric regions is not cell type dependent.
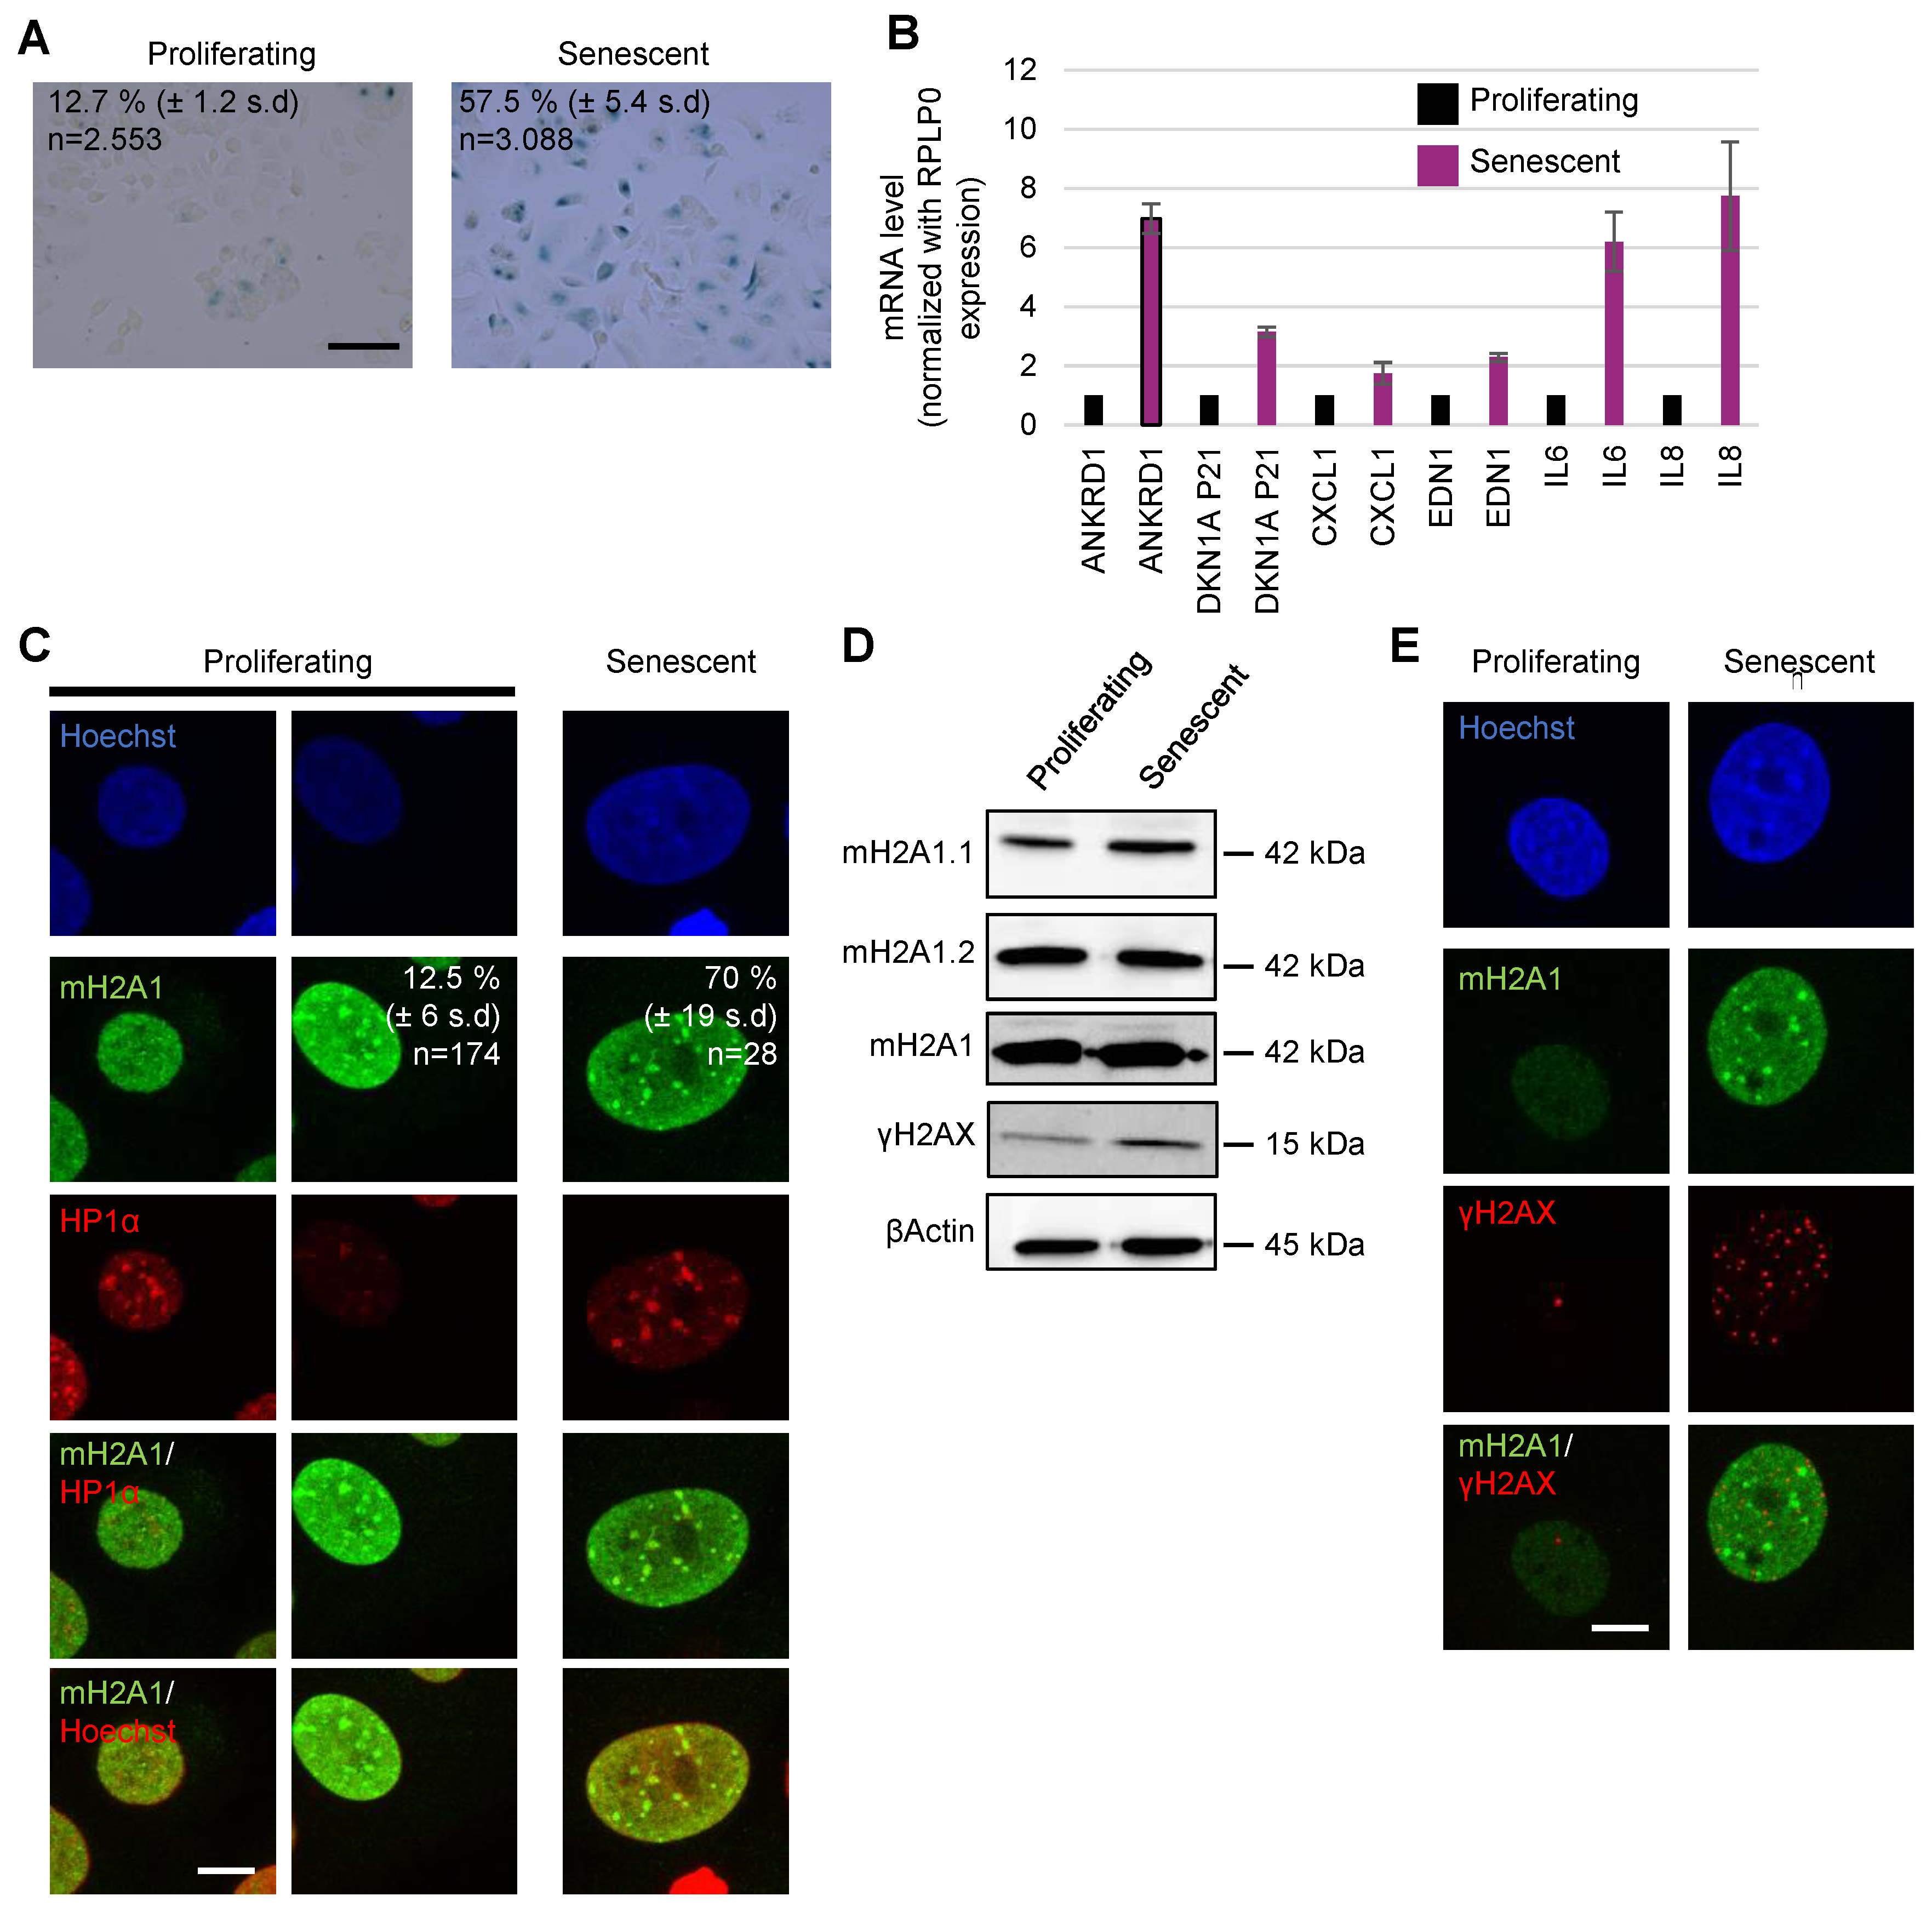
To assess whether mH2A1 association with pericentric regions upon DSBs is cell type specific, we induced senescence in human MCF-7 breast cancer cells using etoposide. Using the same protocol as for murine fibroblast, we confirmed senescence induction using SA-gal marker (58% ± 5.4 SD of SA-gal-positive cells) and we quantified the expression of some relevant mRNAs through quantitative real-time PCR (qPCR) known to be up-regulated upon senescence induction (Figure A3A,B) [38]. As for mouse cells, in addition to a general diffuse staining throughout the nucleus, the most striking feature of mH2A1 distribution was a pronounced accumulation at dense HP1-stained foci (Figure A3C). The fraction of senescent cells with pericentric mH2A1 staining was ∼70% ± 19 SD) of cells, equivalent to the number of SA-gal-positive cells (Figure A3A). A fraction of proliferative cells also exhibited pronounced pericentric mH2A1 staining (∼12.5% ± 6 SD cells) (Figure A3C) a similar proportion as SA-gal-positive cells observed in proliferative conditions (∼12.7% ± 1.2 SD) (Figure A3A). Total mH2A1 protein levels were unchanged in senescent cells compared to proliferative cells (Figure A3D), suggesting that the native human mH2A1 content was redistributed to pericentric regions upon senescence induction. Surprisingly, despite an increase in H2AX protein levels in senescent cells (Figure A3D,E) H2AX foci were not associated with pericentric regions.
3.4. DSBs are not necessary for mH2A1 recruitment to pericentric regions.
We then investigated if the pericentric recruitment of mH2A1 only occurred upon DNA damage in murine fibroblasts. To that end, we treated murine fibroblast L929 cells with TSA (500 nM, 48h), an HDAC inhibitor previously shown to promote mH2A1 recruitment to pericentromeres in human cells [17] (Figure 3). We found that mH2A1 associated with pericentromeres in 59% (± 1 SD) of TSA-treated cells, while HP1 was evicted from pericentric regions in all TSA-treated cells (Figure 3A). The significant increase in mH2A1 protein levels upon TSA treatment likely promoted this recruitment (Figure 3B). To assess the nature and extent of TSA induced chromatin alterations at chromocenters, we measured nuclear fluorescence intensity and circularity in control and TSA-treated cells, separating TSA-treated cells without mH2A1 foci from TSA-treated cells with mH2A1 foci (Figure 3C). Interestingly, we found that fluorescence intensity and circularity of Hoechst-labelled chromocenters of TSA-treated cells with mH2A1 foci were reduced compared to control cells and TSA-treated cells without mH2A1 foci. We conclude that hyperacetylation leads to partial decondensation and expansion of mouse chromocenters which incorporate mH2A1. Although H2AX phosphorylation levels (Figure 3B,D) and the overall number of H2AX foci (∼30% ± 1 SD) H2AX-foci positive cells) (Figure 3E) increased in TSA treated cells, H2AX foci did not colocalize with chromocenters. Moreover, cells with mH2A1 foci were not correlated with cells containing H2AX foci (data not shown). Thus, TSA treatment promoted mH2A1 relocalization to undamaged chromocenters. These results highly suggest that presence of DSBs is not necessary for mH2A1 recruitment to pericentric regions.
3.5. Recruitment of mH2A1 proteins to pericentric heterochromatin depends on chromocenter partial decondensation.
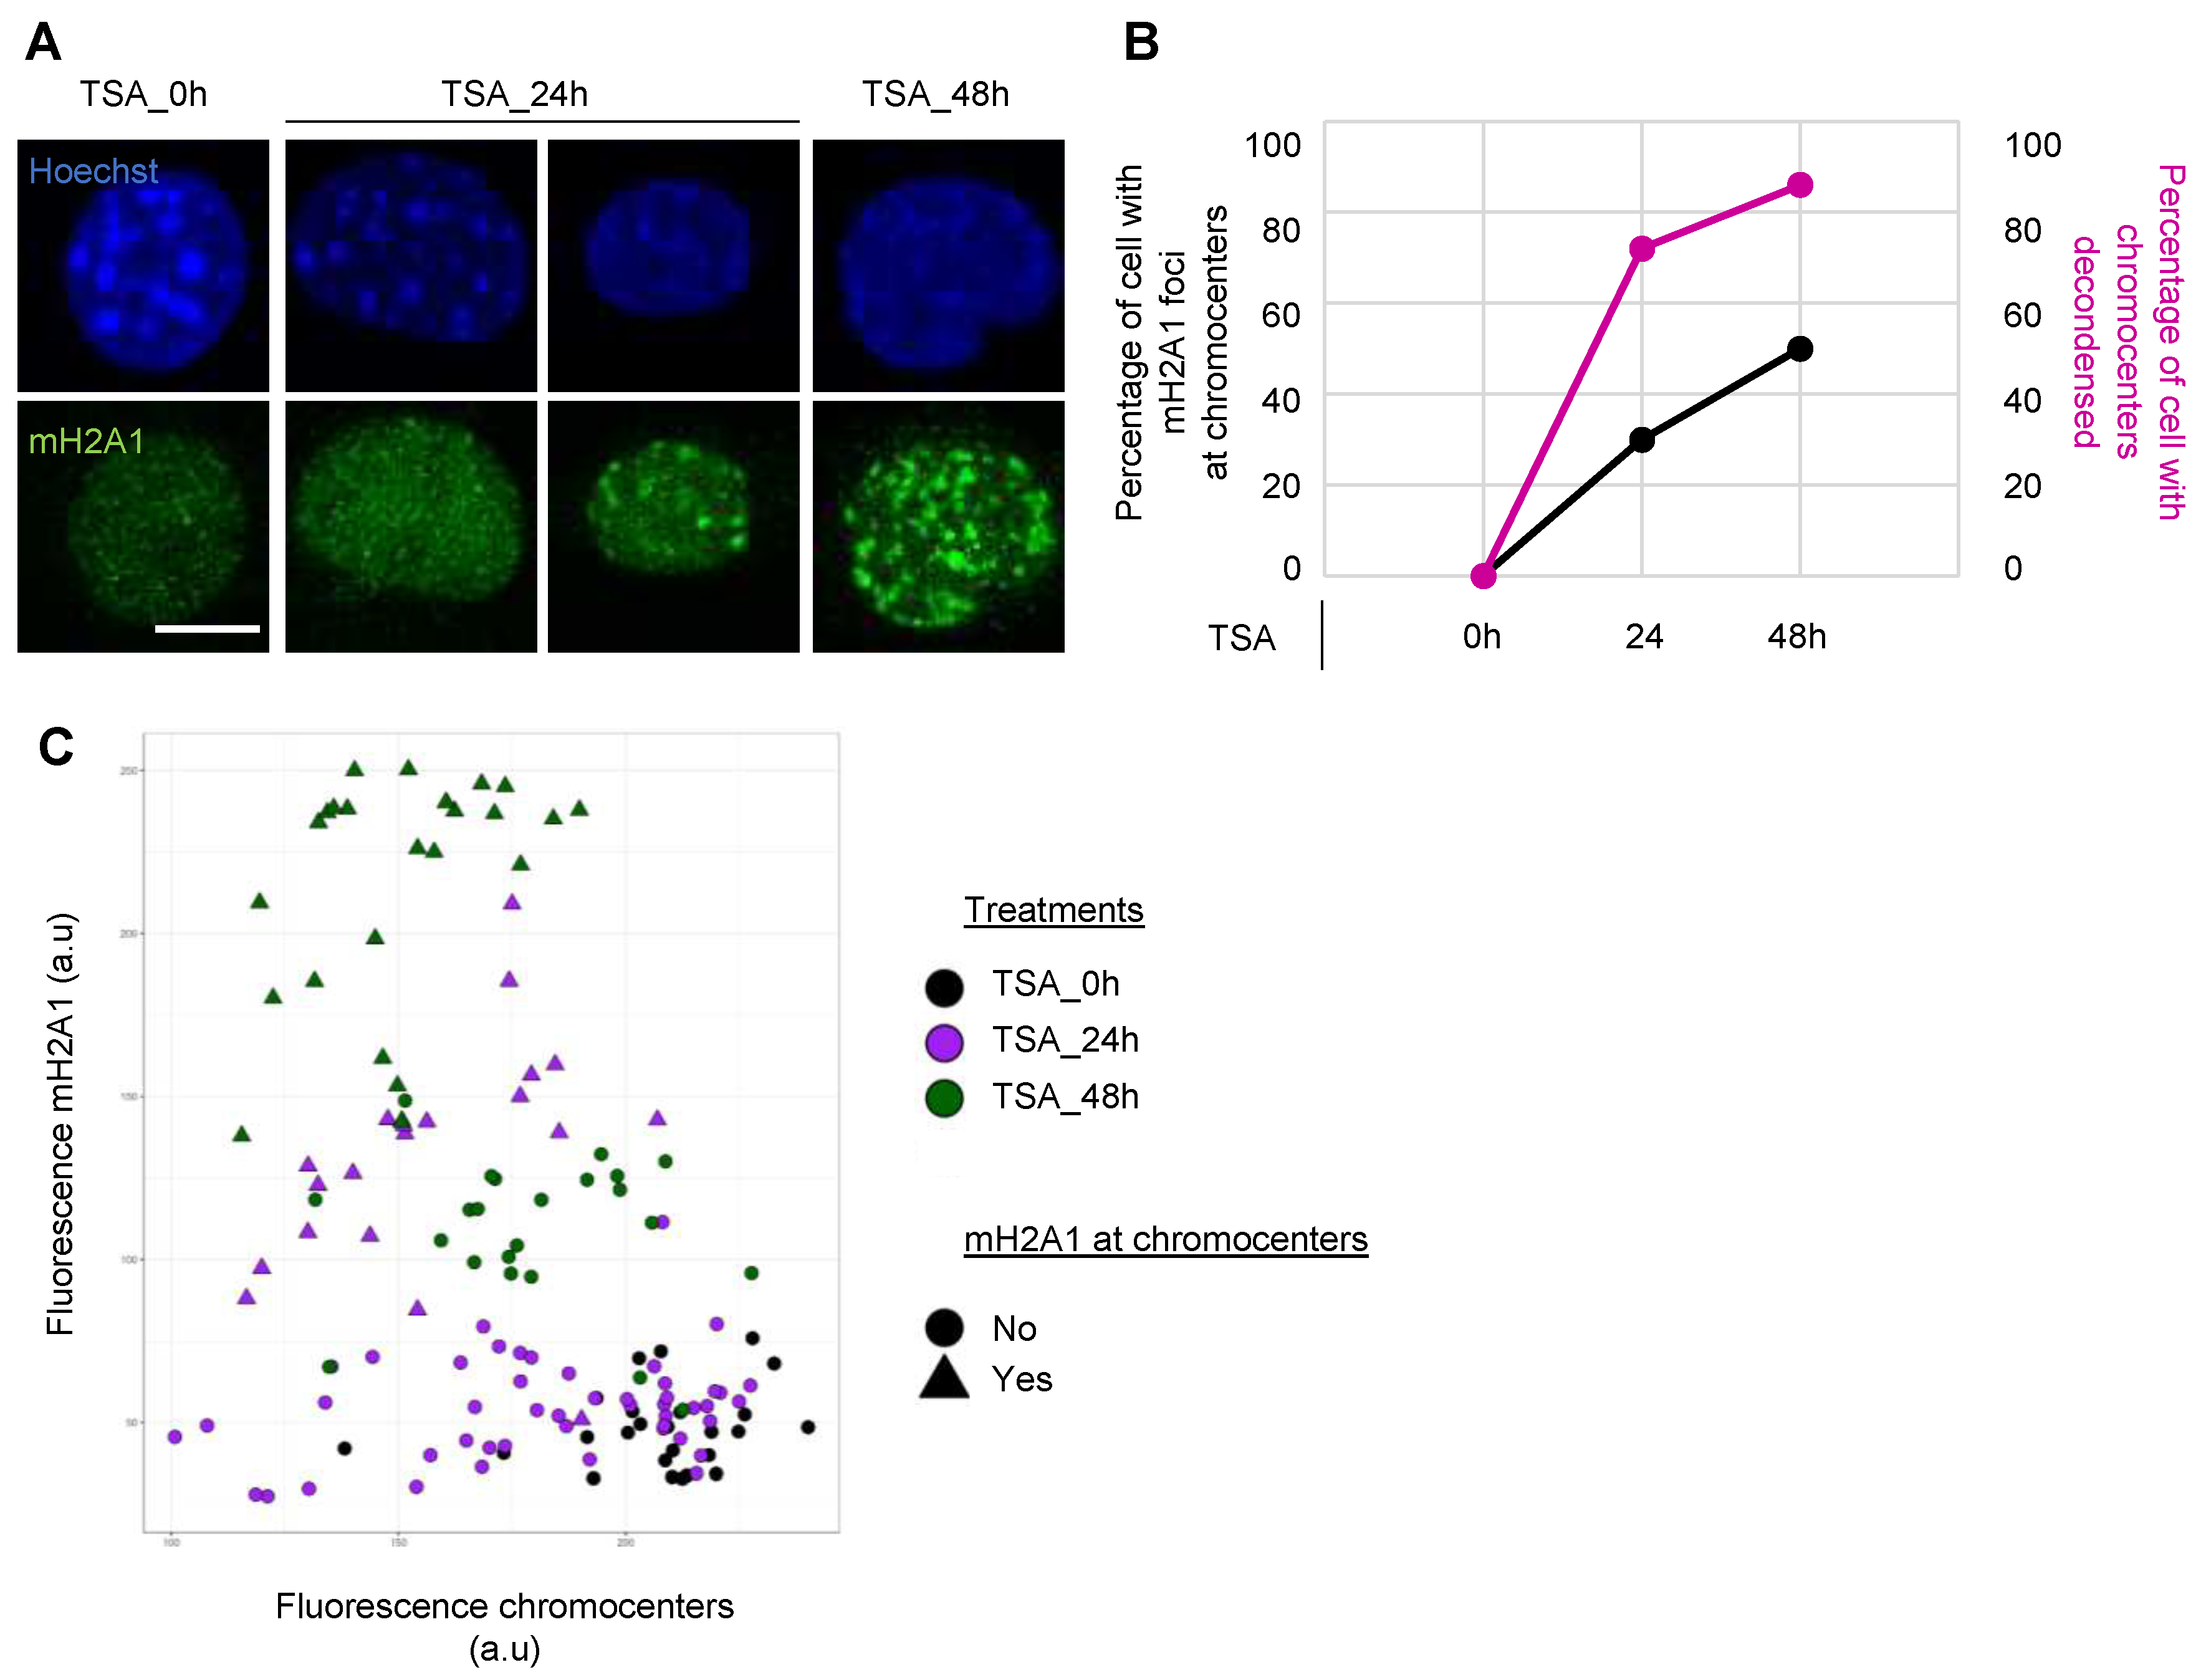
The only parameter that seemed to be shared by the different insults previously tested is decondensation of the chromocenters. So, we investigated whether mH2A1 recruitment was a consequence or a cause of chromocenter decondensation. To that end, we induced Cas9-MajS DBS for varying durations (16h, 24h, 48h and 96h) and measured mH2A1 recruitment relative to the extent of chromocenter decondensation. We show that mH2A1 was recruited only after 24h of transfection (Figure 4A,B) even though chromocenters were already decondensed after 16h of transfection (Figure 4C). As a means of generalizing these observations, we treated cells for varying times with TSA (0h, 24h, 48h of TSA treatment). After 24h of treatment, we observed that mH2A1 formed foci at chromocenters in 30% of cells while 70% of cells already presented decondensed chromocenters (Figure A4A,B). mH2A1 foci formation at chromocenters increased progressively during the duration of the treatment and correlated with the decrease in fluorescence intensity (Figure A4C). These results suggest that mH2A1 recruitment appears as a consequence of chromocenter decondensation. Finally, we transfected cells using nuclease-null Cas9 (dCas9) fused with a tripartite activator (VP64-p65-Rta (VPR)) and a gRNA targeting MajS, known to induce chromocenter decondensation [39,40]. The loss of HP1 foci combined with a disappearance of the Hoechst chromocenter staining pattern suggested that the decondensation of chromocenters was more important than in our previous experiments (Figure 4D). Under this condition, we never detected the presence of mH2A1 foci at chromocenters. We conclude that only “partial” decondensation of chromocenters promotes mH2A1 recruitment.
3.6. The “H2A-like” domain of mH2A1 is sufficient to recruit mH2A1 proteins to pericentric heterochromatin.
To test if pericentric recruitment of mH2A1 was isoform specific, we co-transfected cells with either a plasmid coding for Flag-mH2A1.1 or a plasmid coding for Flag-mH2A1.2 (Figure A5A) in addition to the plasmids expressing Cas9-GFP/MajS gRNA. We observed that both isoforms were recruited to pericentric regions upon DSBs (Figure A5B). Similar results were obtained in TSA-treated cells (Figure A5C). To investigate which protein domains of mH2A1 are necessary for its recruitment to pericentric chromatin, we generated GFP fusions with mH2A1.1 (WT) and with truncation mutants that eliminate either its macrodomain (M) or its macrodomain and linker (LM) (Figure A6A,B). Transient expression of these GFP fusions in TSA-treated cells showed that all mH2A1.1-truncated forms were recruited to pericentric regions (Figure S6C). In contrast, diffuse faint staining of H2B-GFP and GFP alone was seen throughout the nucleus with no preference for pericentric regions (Figure A6C).
3.7. mH2A1 is not required for pericentric heterochromatin organization.
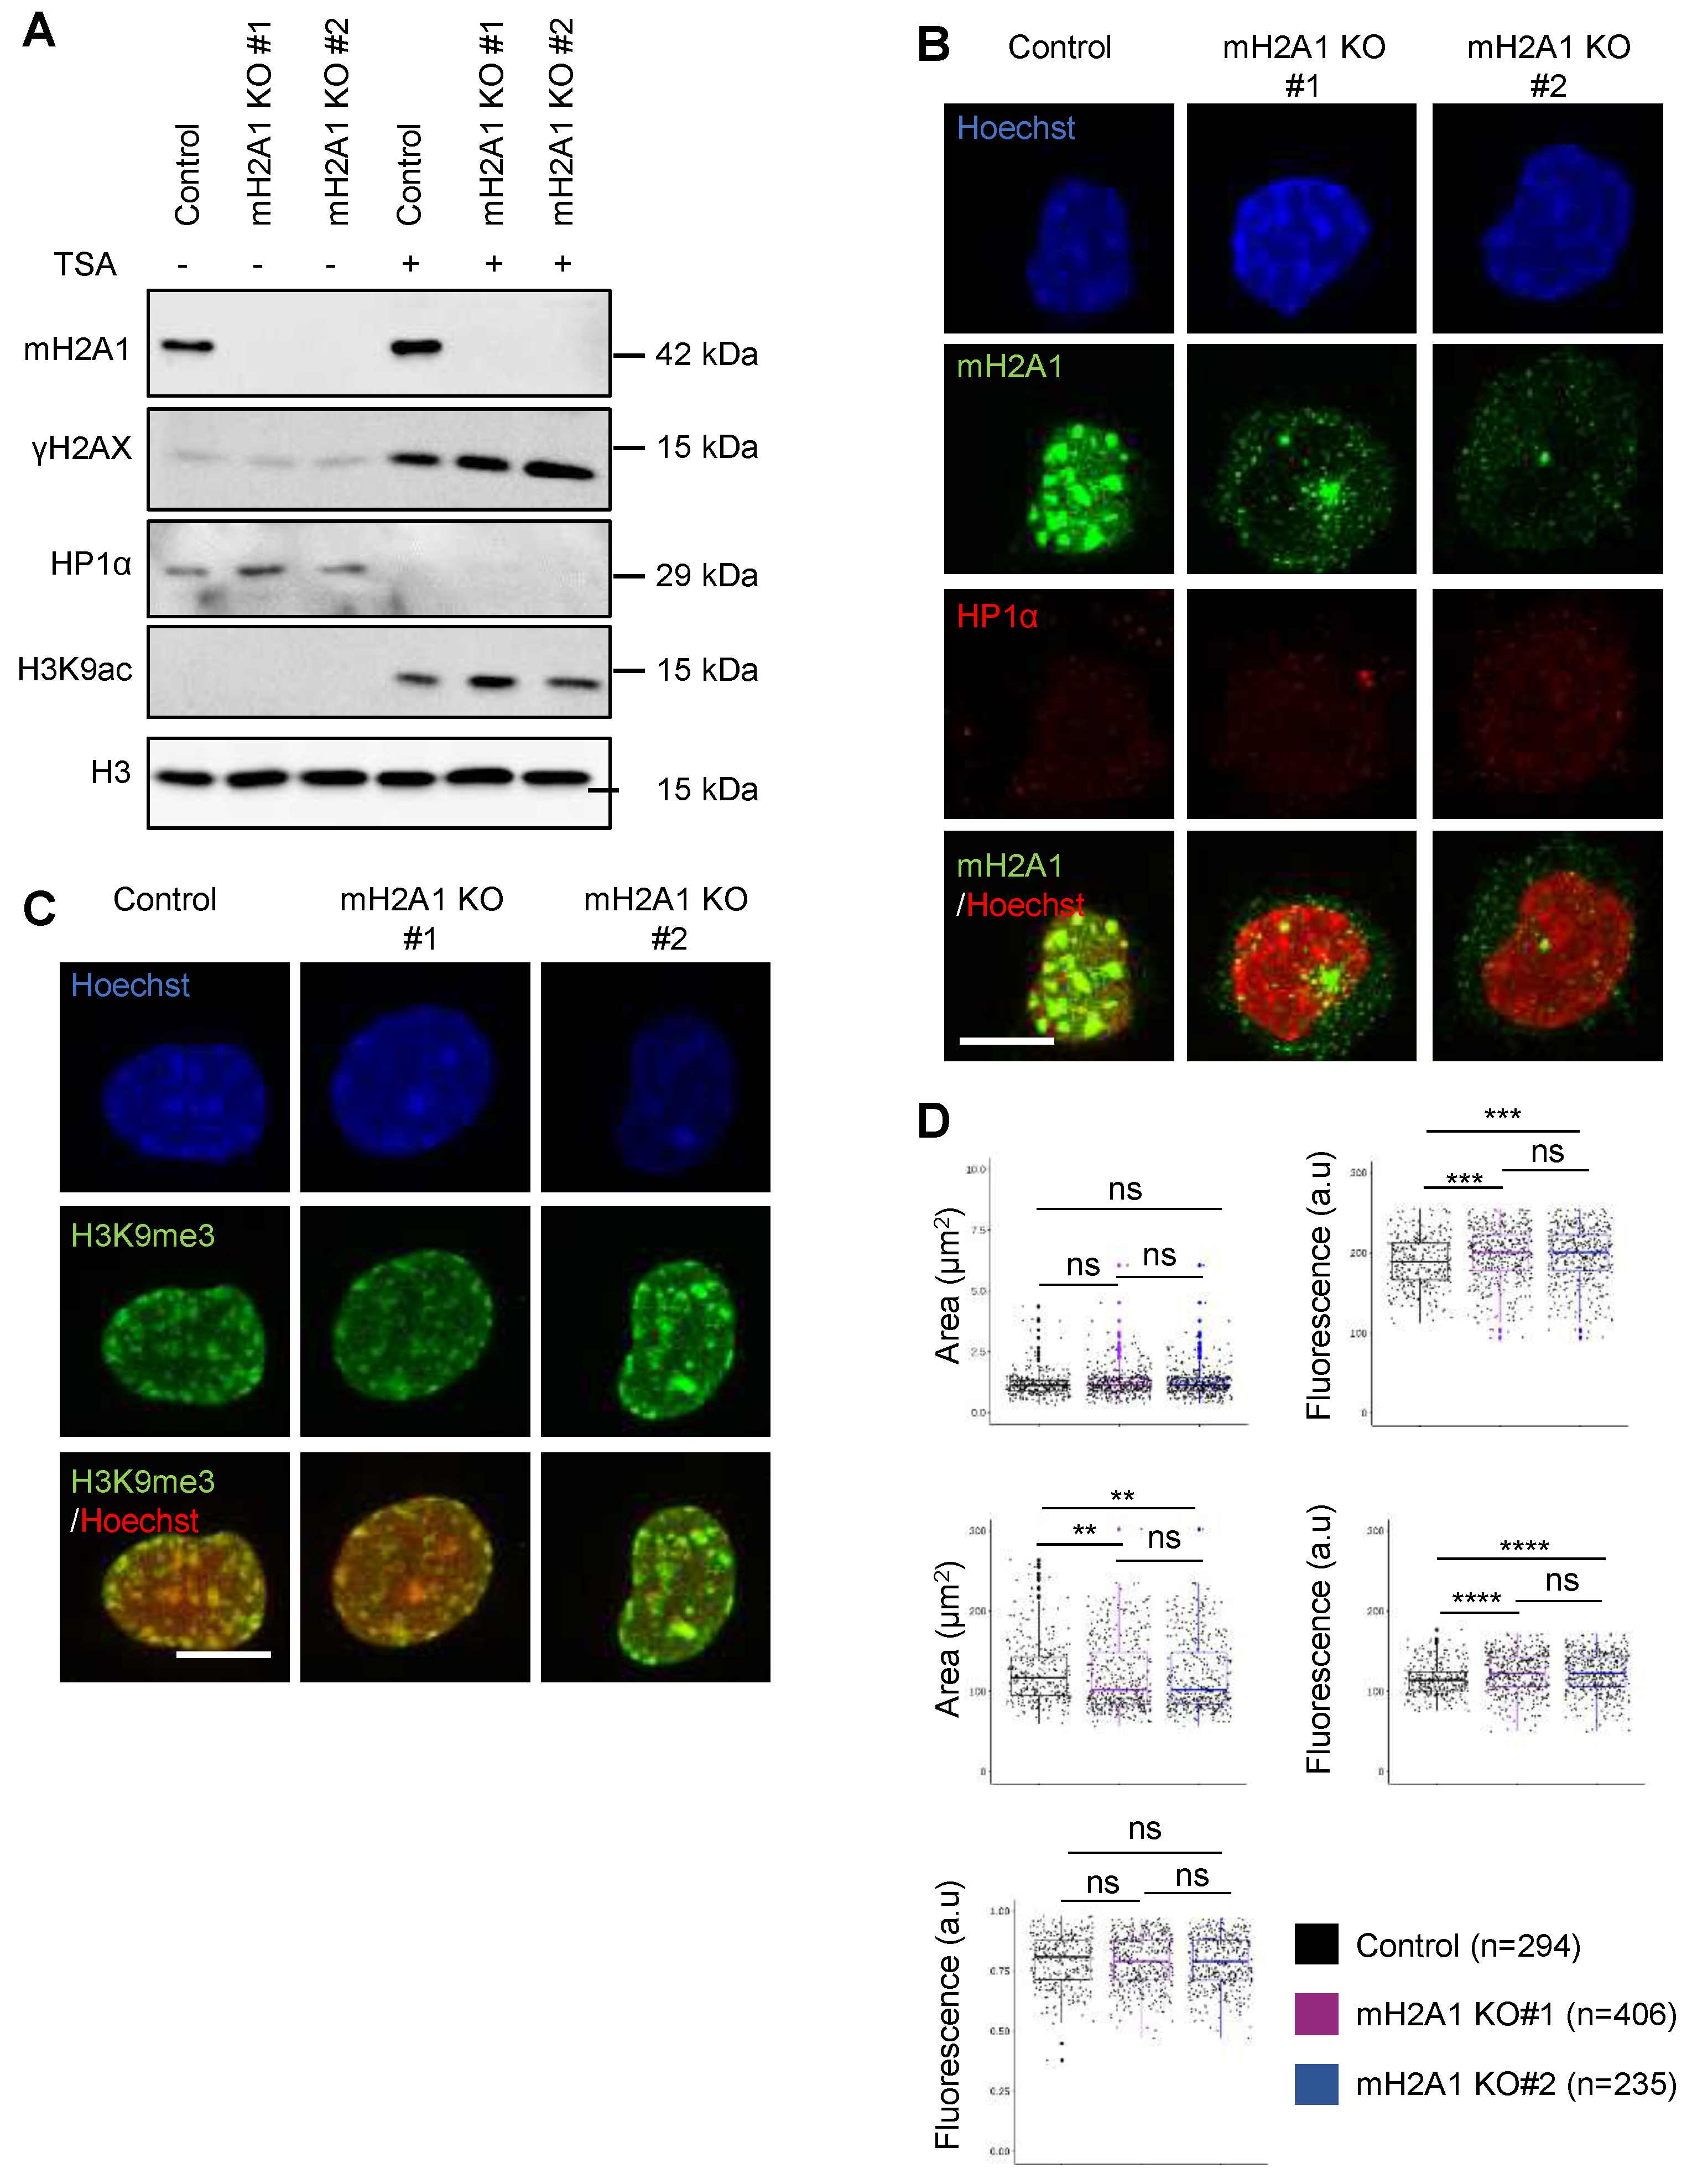
We generated mH2A1 KO L929 mouse cell lines using a CRISPR/Cas9 system. We selected two mH2A1 KO clones (mH2A1 KO #1 and mH2A1 KO #2) showing no expression of mH2A1 protein by immunofluorescence visualization and immunoblot analysis (Figure 5A and Figure A7). Upon DSB induction using Cas9-GFP/MajS gRNA, we still observed H2AX, HP1 and H3K9me3 foci at pericentric regions in mH2A1 KO clones (Figure 5A-C). Mean average intensity and area of H2AX, HP1 and H3K9me3 foci showed no significant differences between WT and either one of the mH2A1 KO clones (Figure 5D). Partial decondensation of chromocenters induced by DSBs also occurred in mH2A1 KO cells. Also, the percentage of cells expressing SA-gal after etoposide treatment, as well as H2AX, HP1, H3K9me3 labelling and chromocenter organization upon etoposide-induced senescence and TSA treatment were similar in WT and mH2A1 KO cells (Figure A8 and Figure A9).
3.8. mH2A1 regulates pericentromeric RNA transcription.
We finally asked whether mH2A1 could regulate pericentromeric satellite repeat transcription (MajS ncRNA) in cells exposed to previously used treatments. In WT cells, we observed a 3 to 5 fold increase in the transcriptional level of MajS ncRNA after TSA treatment or etoposide-induced senescence, respectively (Figure 6). Strikingly, this transcriptional upregulation of MajS ncRNA was largely compromised in mH2A1 KO cells following the same treatments. This finding highlights a key role of mH2A1 in up-regulating the transcriptional expression or stabilization of MajS ncRNA under conditions of cellular stress.
4. Discussion
In this study, we demonstrate that the histone variant mH2A1 massively associates with partially decondensed pericentric regions upon stress. Our findings further show that mH2A1 contributes to the adaptation of transcriptional expression of pericentric noncoding RNA, without affecting the establishment and maintenance of pericentric chromatin reorganization. We discovered that perturbation of pericentric heterochromatin led to significant enrichment in mH2A1 at these regions. Moreover, partial decondensation of pericentric chromatin was a prerequisite for mH2A1 recruitment while complete decondensation of pericentric chromatin prevented mH2A1 association. Our results illustrate that mH2A1 recruitment to decondensed pericentric chromatin occurs independently of the source of damage and may play a general role in the response to genotoxic stress. The finding that mH2A1 is recruited to partially decondensed pericentric regions was unexpected, as previous studies had mainly associated this variant with highly condensed regions, such as the Xi chromosome [17,19,20,21,22] and the SAHFs [14]. We also show that relaxation of pericentric chromatin upon insults occurred also in cells in which mH2A1 was knocked out. Therefore, the presence of mH2A1 does not seem to be necessary for decondensation to occur nor to be maintained, at least in the context of long-term external insults or stresses. We can not exclude, however, that other variants compensate for the absence of mH2A1 [12]. Our observations are nonetheless consistent with previous studies showing that mH2A1 is not involved in condensation of the X inactivated chromosome [23,41,42]. Murine cells do not form SAHFs during senescence [43], making it difficult to identify senescent states. Hence, the presence of mH2A1 at pericentric regions could be used as a marker of DSBs-induced senescent mouse cells. In addition, we demonstrated that mH2A1 is recruited to pericentric regions in etoposide-induced human senescent MCF-7 cells that do not form SAHFs. Further research is required to confirm whether mH2A1 could serve as a universal marker for senescent cells, including replicative- and oncogenic-induced senescent cells [44]. Since decondensation of pericentric chromatin has been proposed to be a new marker of senescence [45], mH2A1 could be a promising alternative for the identification of senescent cells, particularly in cases where SAHFs are absent or not easily detectable. mH2A1 was massively recruited to pericentric regions in response to DSBs induction. Previous research has established that mH2A1 plays a significant role in DSBs repair efficiency, acting on the two main repair pathways, Homologous Recombination (HR) and Non-Homologous End-Joining (NHEJ) [46,47,48,49,50,51,52]. Although, in our study, we did not investigate the role of mH2A1 in the repair of pericentric-DSBs because the CRISPR Cas9 system used leads to permanent DSBs (Cas9 is always active), we were still able to observe that recruitment of ATM to DSBs was independent of mH2A1. To further investigate the role of mH2A1 in the repair of pericentric-DSBs, the use of a degradable Cas9 [35] could be considered. The role of mH2A1 on DSBs repair depending on the chromatin landscapes, particularly in heterochromatin, had not been thoroughly examined. Our results suggest that mH2A1 is massively recruited to DSBs present on constitutive heterochromatin (pericentric regions), whereas it did not accumulate at DSBs associated with euchromatin, such as centromeric (MinS)-DSBs, or at DSBs associated with specific chromatin, such as telomeric-DSBs. These results suggest that the recruitment of mH2A1 may be influenced by the pre-existing chromatin status of the DSBs. A previous model proposed that mH2A1 replaces HP1 in pericentric regions to maintain their condensation state, based on an inverse correlation between the recruitment of mH2A1 and loss of HP1 in lymphocytes [17]. We found that mH2A1 can be recruited to the pericentric regions independently of HP1. Moreover, we did not observe retention of HP1 in mH2A1 KO cells upon TSA treatment. Therefore, our results indicate that this model may not apply universally and may be specific to certain cell types or conditions. Our results suggest that the two proteins may have distinct functions at pericentric regions. Under normal physiological conditions, the levels of MajS ncRNA are very low [52,53], but in various pathological conditions such as cellular stress [54] and cancer [55], the levels are significantly increased. Here we found that in mH2A1 KO cells, expression of MajS ncRNA was no longer stimulated upon TSA and etoposide treatment. While the specific function of MajS ncRNA in stress response is unclear, it has been shown in S. pombe and in plants that these transcripts could participate in the re-establishment of heterochromatin [56]. Moreover, depletion of MajS ncRNA in mouse cells during early developmental stages has been shown to result in the failure of pericentric chromatin reorganization into chromocenters [53]. Therefore, it is possible that mH2A1 plays a role in ensuring proper expression of MajS ncRNA to restore pericentric chromatin homeostasis after stress. Based on these findings, it would be valuable to conduct additional research to elucidate the precise mechanisms by which mH2A1 modulates the expression of MajS ncRNA and its possible contribution to maintaining chromatin stability in response to stress.
Author Contributions
Conceptualization, L.R, A-C.L and K.B; methodology, L.R, A-C.L, N.T-L and K.B; validation, L.R, A-C.L, N.T-L and K.B; investigation, L.R performed all the experiments and data analysis, excepted RTqPCR against MajS ncRNA (Figure 6) performed by N.T-L and F.M.; writing—original draft preparation, L.R, A-C.L, N.T-L and K.B; writing—review and editing, L.R, A-C.L, N.T-L and K.B All authors have read and agreed to the published version of the manuscript.
Funding
The work was generously funded by the Institut National du Cancer (INCA PL-BIO-16-269) to KB.
Acknowledgments
We thank J. Cavaillé (CBI Toulouse) for kindly providing L929 mouse fibroblastic cell line. We thank M. Buschbeck (Josep Carreras Leukemia Research Institute, Barcelona) for kindly providing Flag-mH2A1.1 and Flag-mH2A1.2 expression plasmids, as well as mH2A1.1-trunquated expression plasmids. We thank Fabian Erdel (CBI Toulouse) for kindly providing dCas9-VPR plasmid and help with interpreting resulting results. We thank the team of Gaëlle Legube (CBI Toulouse) for kindly providing ATM inhibitor and the rabbit H2AX antibody. We acknowledge support from the light imaging Toulouse CBI platform.
Conflicts of Interest
The authors declare no conflict of interest.
Appendix A
Appendix A.1
Figure A1.
Cas9-induced DSBs induction does not perturb HP1 and H3K9me3 at pericentric regions. (A) IF confocal images of cells co-expressing Cas9-GFP and MajS gRNA or not, stained with Hoechst and antibodies specific for HP1 and H2AX. (B) As in (A) but stained with antibodies specific for H3K9me3 and H2AX. Scale bar = 10 µm.
Appendix A.2
Figure A2.
ATM and the chaperone HIRA participate in the recruitment of mH2A1 to pericentric regions upon Cas9-induced DSBs. (A) IF confocal images of cells co-expressing Cas9-GFP and MajS gRNA, stained with Hoechst and antibodies specific for mH2A1 and H2AX in untreated and ATMi-treated cells (Ku55933, 20 µM). ATMi was added 1h before plasmid transfections. Cells were fixed 24h post-transfection. Percentage of cells presenting mH2A1 foci at MajS are shown, represented as means ± SD from 2 biological replicates. Scale bar = 10 µm. (B) Immunoblot analysis for HIRA, mH2A1 and H3 in protein extracts prepared from control and 72h post-transfected cells with an siRNA against HIRA. Apparent molecular weights are indicated. Quantifications of HIRA and mH2A1 protein expression are given, normalized by H3. (C) IF confocal images of 48h Cas9-MajS post-transfected cells co-expressing Cas9-GFP and MajS gRNA, stained with Hoechst and antibodies specific for mH2A1 and H2AX in control and HIRA-partially depleted cells (siHIRA, 72 h post-transfection). Percentage of cells presenting mH2A1 foci at MajS are shown, represented as means ± SD from 2 biological replicates. Scale bar = 10 µm. (D) Quantifications of the mean fluorescence intensity and area of mH2A1 foci in control and HIRA partially depleted cells (siHIRA) in Cas9 positive cells, taken from 2 biological replicates. The number of cells analyzed for each condition is given (n). On boxplots, each point corresponds to the mean of foci per cell. Wilcoxon tests were used to assess the significance of the observed differences. **** P < 0.0001.
Appendix A.3
Figure A3.
mH2A1 is recruited to pericentric regions in senescent human MCF-7 cells. (A) Representative images of a SA-gal activity assessed by X-gal staining of proliferating and etoposide-treated (12.5 µM, 24h + 4 days release) senescent human MCF-7 cells. Percentage of SA-gal-positive cells are given, represented as means ± SD from 2 biological replicates. The number of counted cells is given (n). (B) Relative expression of mRNA senescence markers using real-time PCR in proliferating and senescent MCF-7 cells. Assay was performed in a technical triplicate and normalized to RPLP0 mRNA. The bars represent the mean ± SD. (C) IF confocal images of proliferating and senescent MCF-7 human cells stained with Hoechst and antibodies specific for mH2A1 and HP1. Percentage of cells presenting mH2A1 foci at pericentric regions are shown, represented as means ± SD from two biological replicates. Scale bar = 10 µm. (D) Immunoblot analysis for mH2A1.1, mH2A1.2, mH2A1, H2AX and actin in protein extracts prepared from proliferating and senescent cells. Apparent molecular weights are indicated. (E) IF confocal images of proliferating and senescent MCF-7 cells stained with Hoechst and antibodies specific for mH2A1 and H2AX. Scale bar = 10 µm.
Appendix A.4
Figure A4.
The recruitment of mH2A1 to chromocenters upon TSA treatments is proportional to the decondensation states of chromocenters. (A) IF confocal images of cells after 0h, 24h and 48h of TSA treatment, stained with Hoechst and antibody specific for mH2A1. Scale bar = 10 µm. (B) Lines plot showing the percentage of cells with mH2A1 foci at chromocenters and the percentage of cells with decondensed chromocenters at different time points TSA treatment (0h, 24h, and 48h). One biological experiment was performed for each time point. (C) Scatter plot showing the correlation between the fluorescence of chromocenters and the fluorescence of mH2A1 per cell at different durations of TSA treatment (0h, 24h and 48h). Each point corresponds to the mean of foci per cell. Presence of mH2A1 foci at chromocenters is also indicated.
Appendix A.5
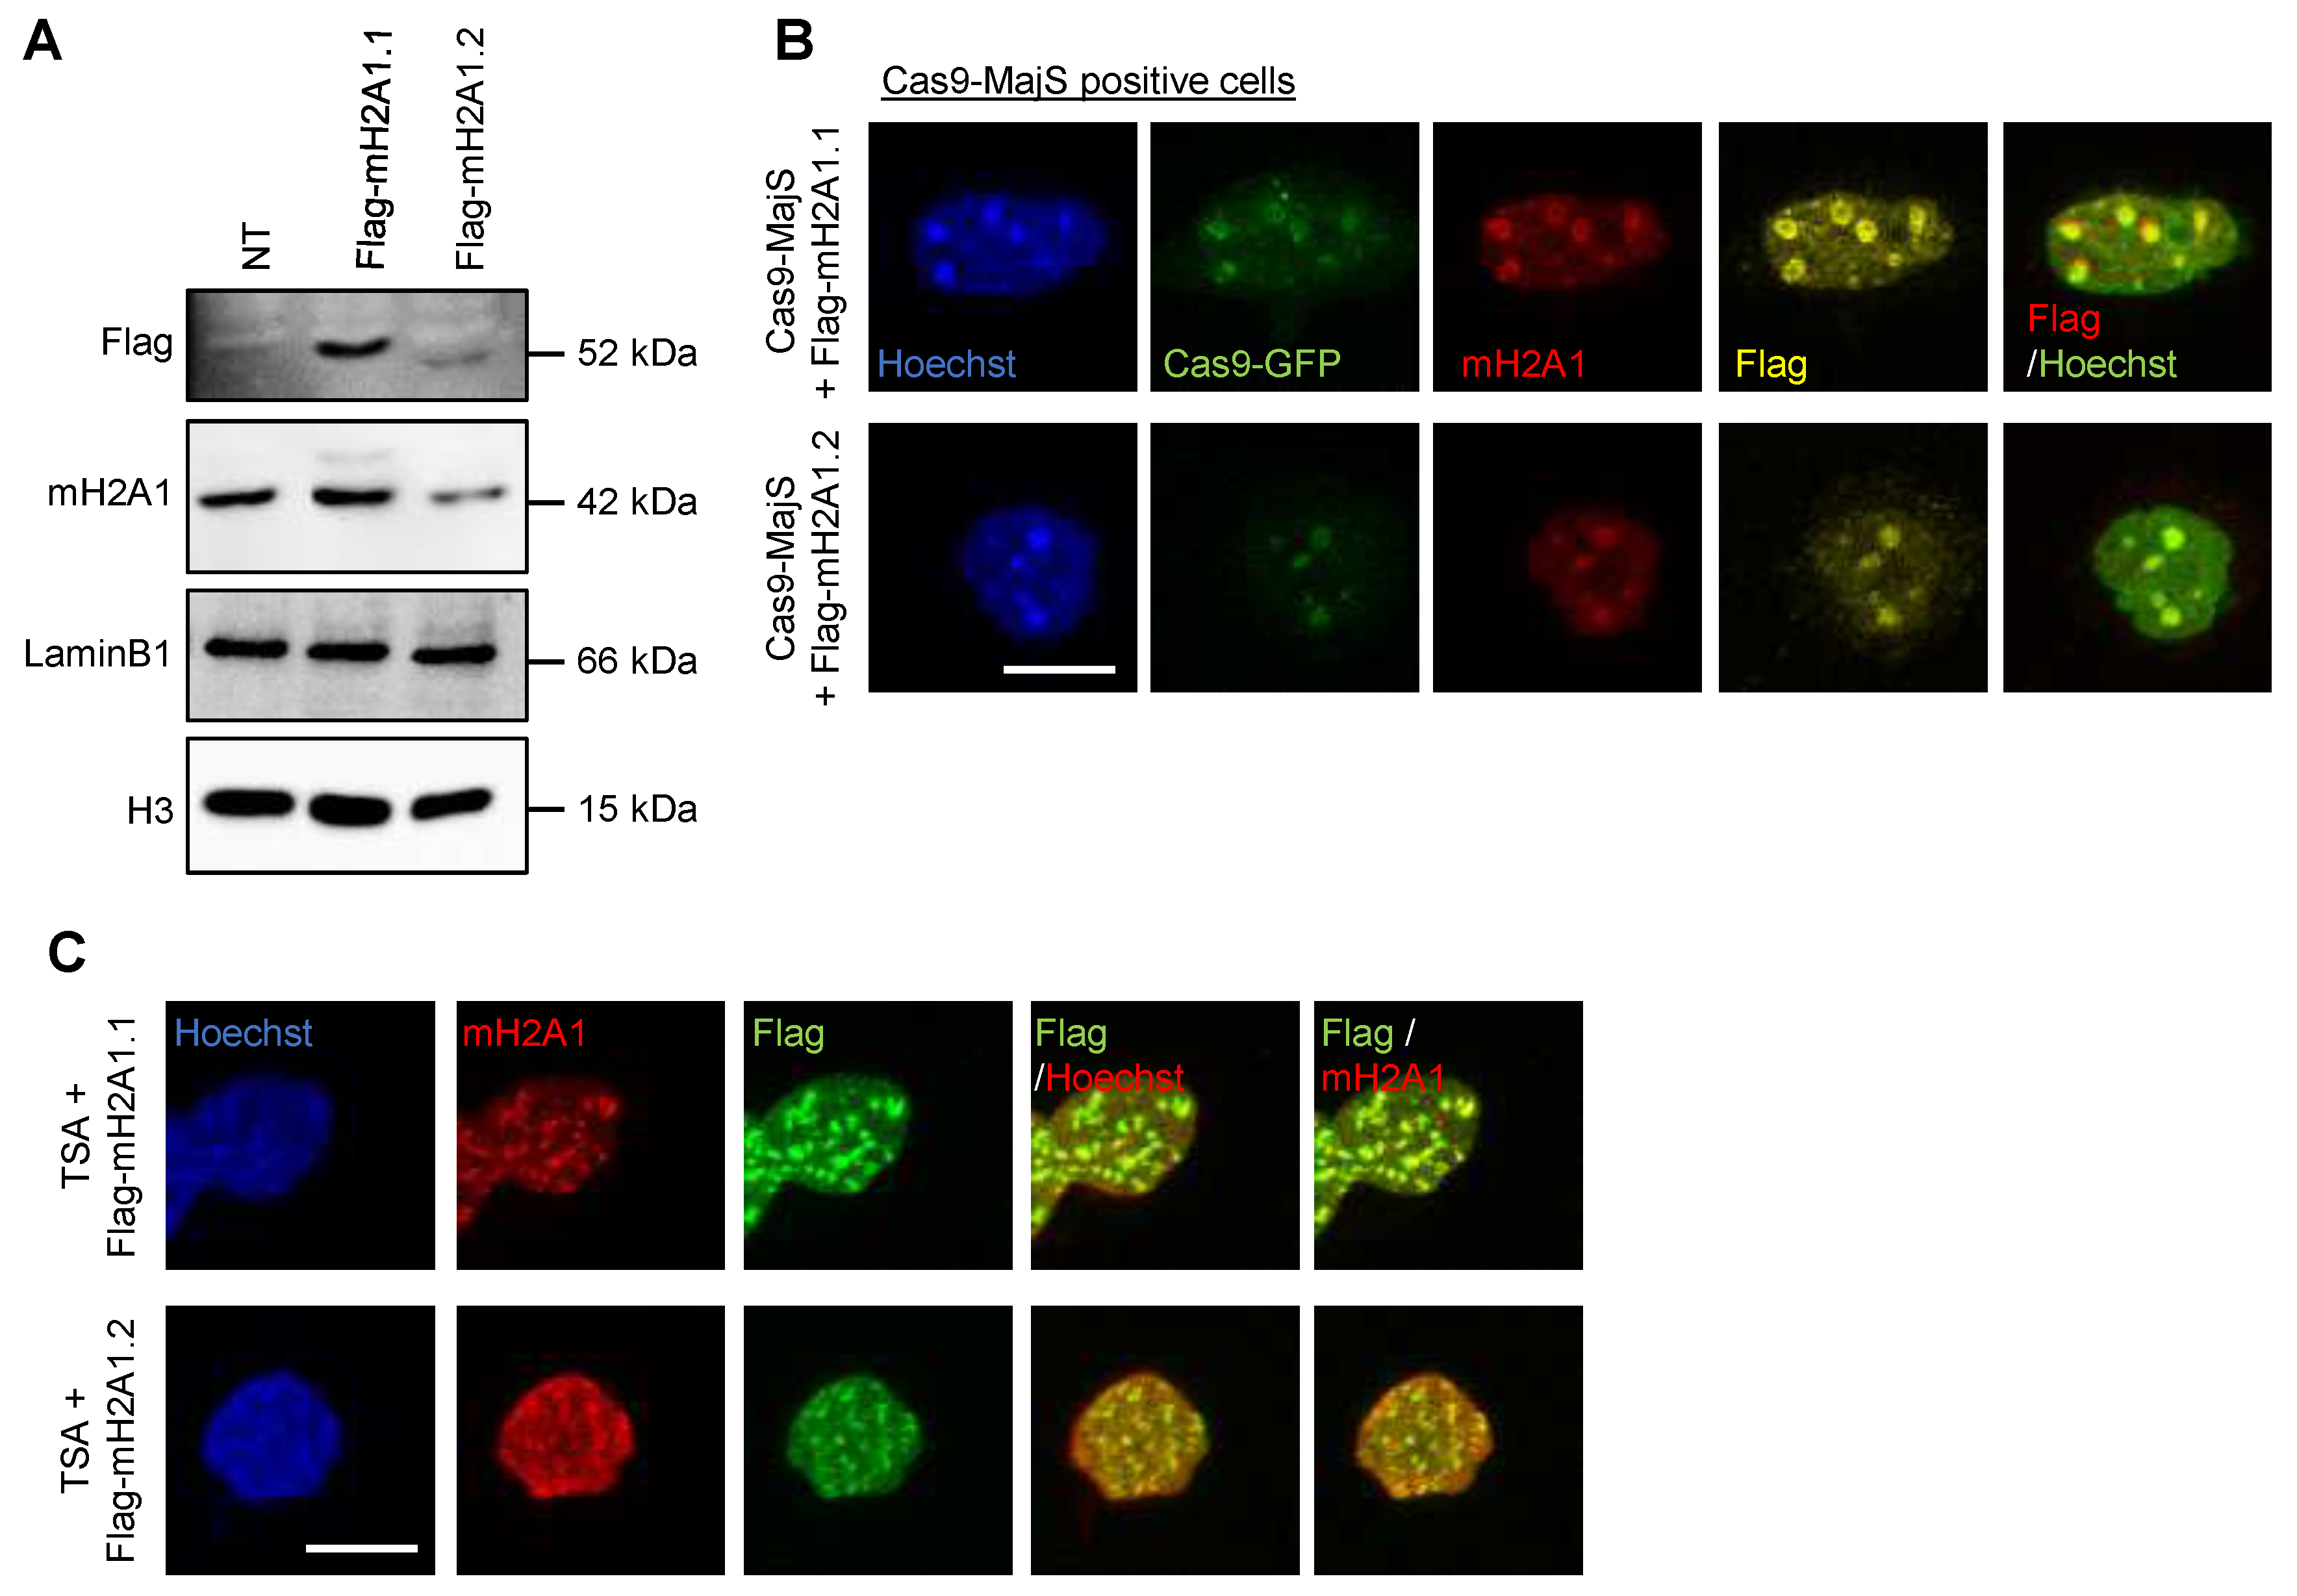
Figure A5.
Both isoforms of the histone variant mH2A1 are recruited to pericentric heterochromatin upon DSBs and TSA treatment. (A) Immunoblot analysis for Flag, mH2A1, LaminB1 and H3 in extracts prepared from control and 48h post-transfected cells with plasmids coding for mH2A1.1-Flag (Flag-1.1) or mH2A1.2-Flag (Flag-1.2). Apparent molecular weights are indicated. (B) IF confocal images of cells co-expressing Cas9-GFP, MajS gRNA and mH2A1 Flag-tagged isoforms, stained with Hoechst and antibodies specific for Flag and mH2A1. Scale bar =10 µm. (C) IF confocal images of cells treated with 500 nM of TSA during 48h and transfected with mH2A1 Flag-tagged isoforms, stained with Hoechst and antibodies specific for Flag and mH2A1. Scale bar =10 µm.
Appendix A.6
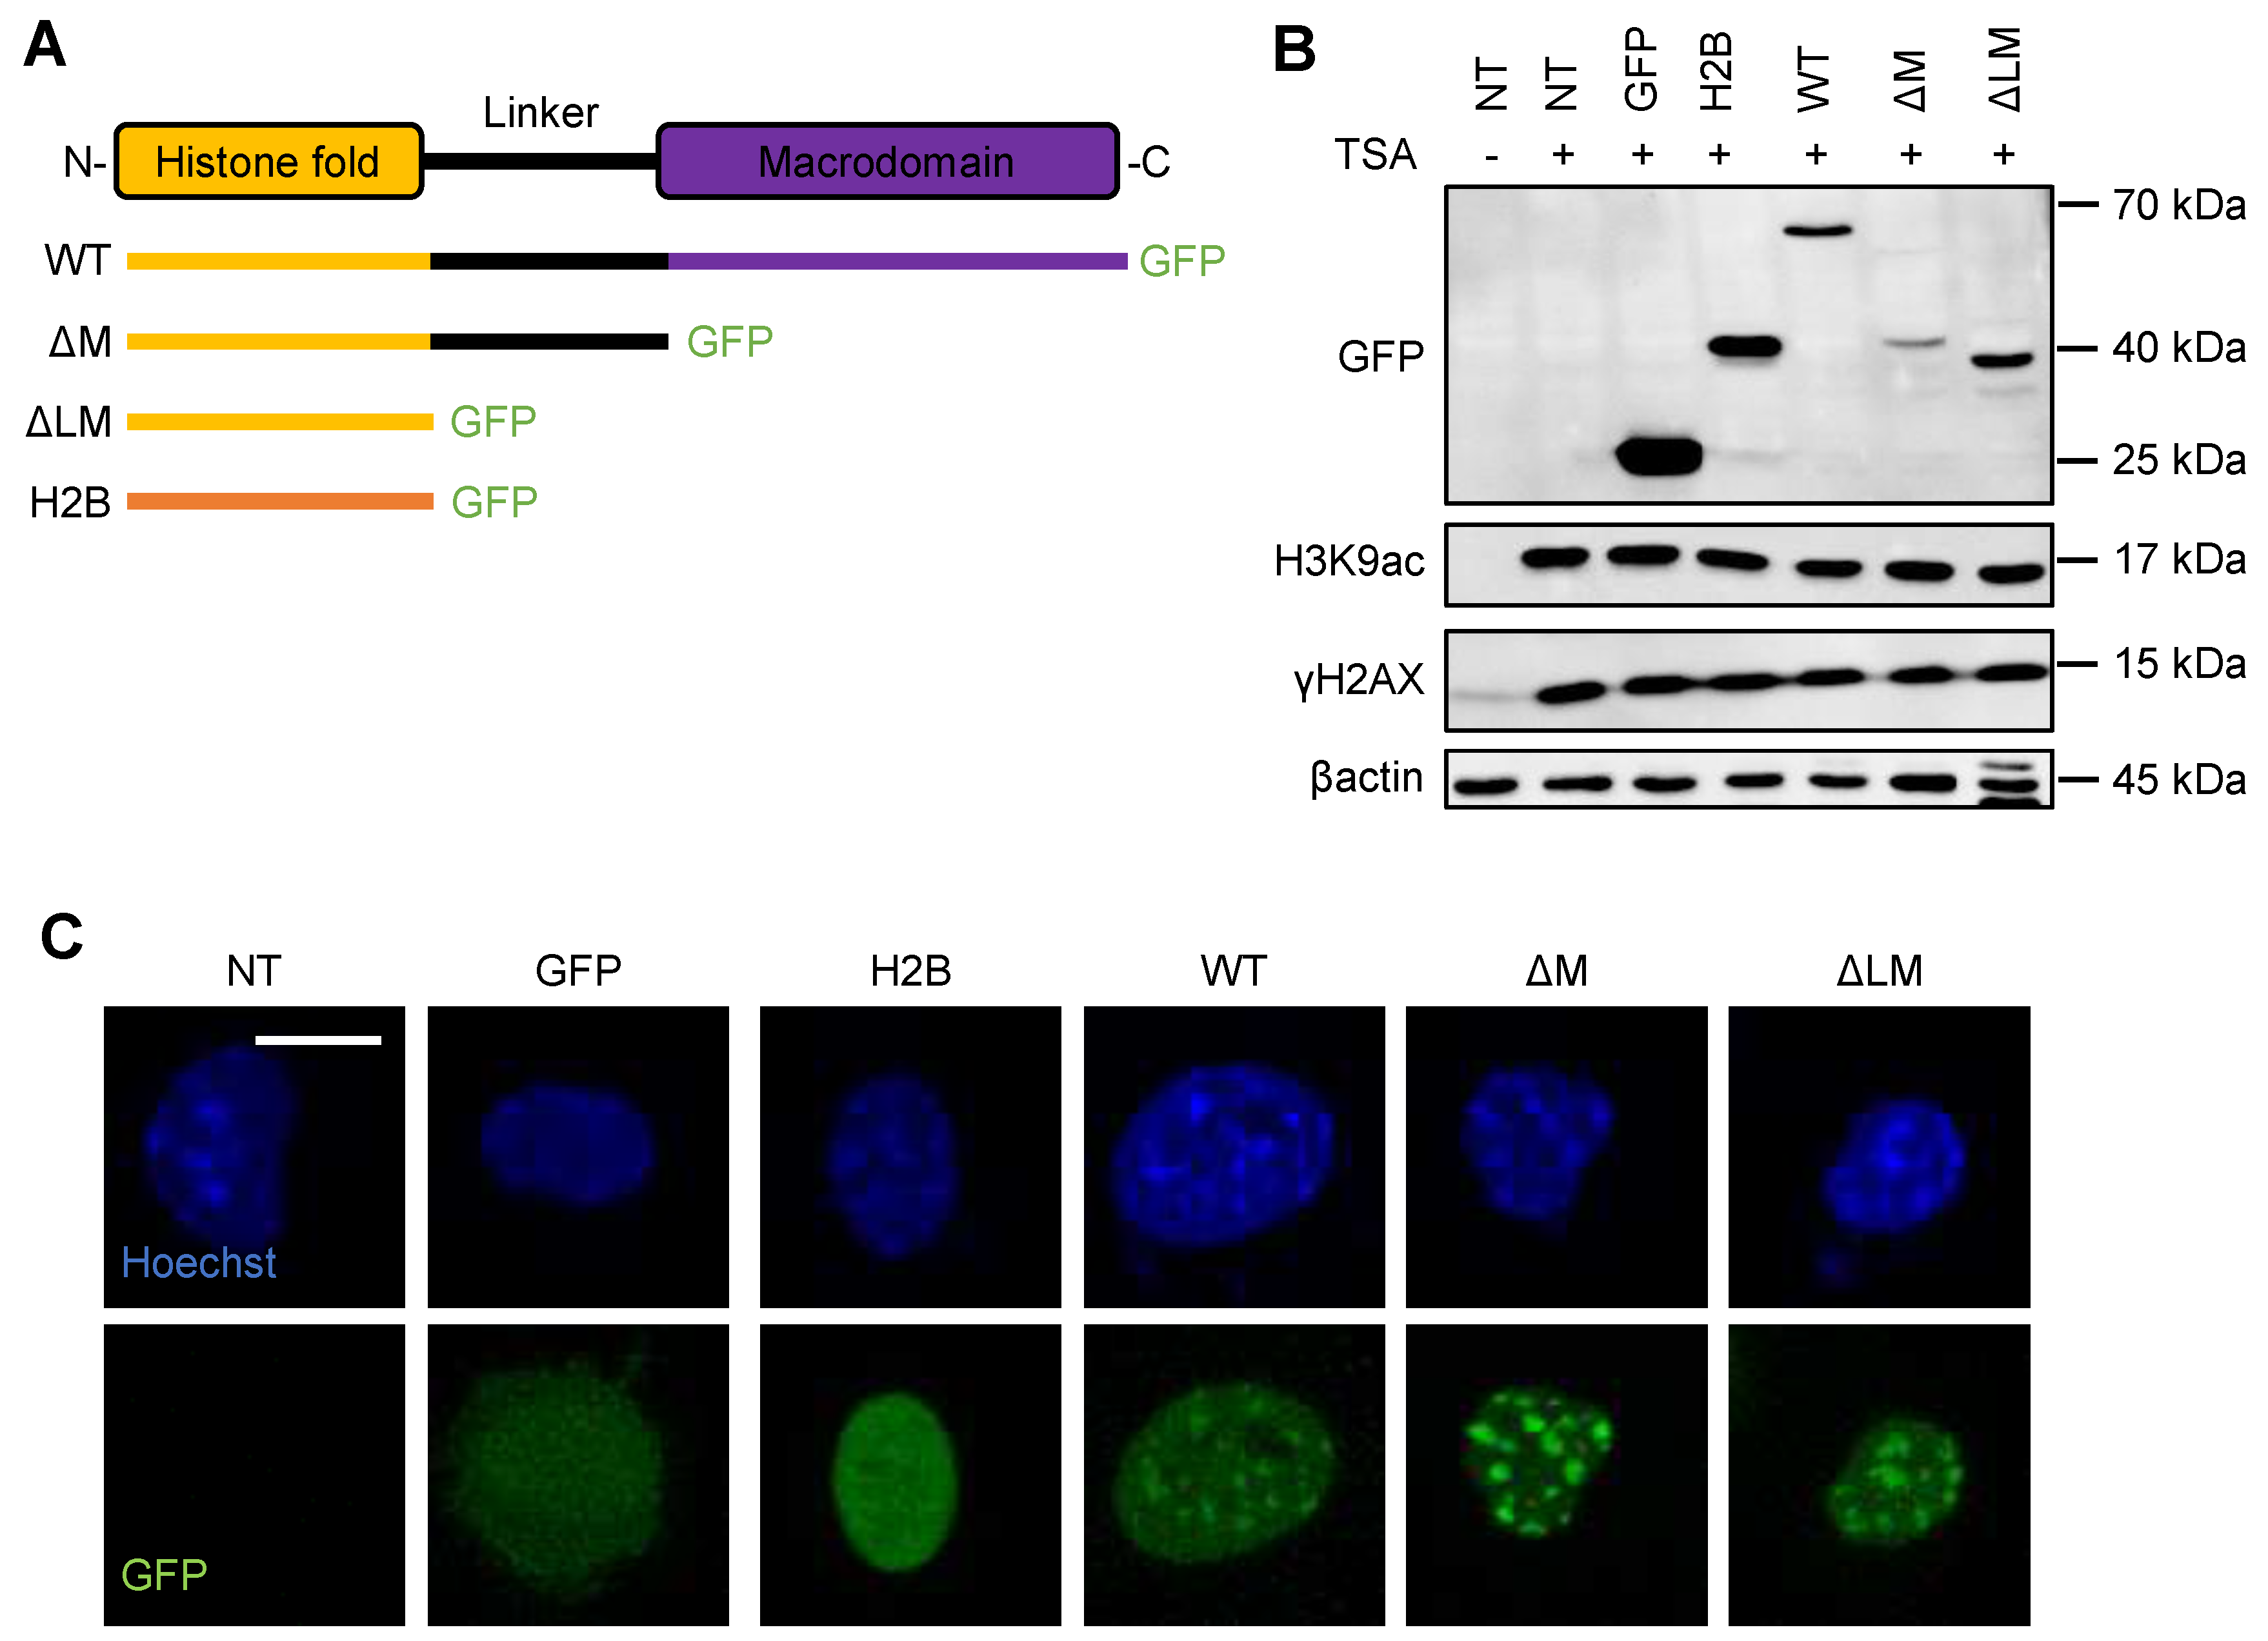
Figure A6.
The « H2A-like » domain of mH2A1 is sufficient for its recruitment to pericentric regions. (A) Schema of mH2A1 variants used in the study: full-length wild type mH2A1.1-GFP (WT), constructs with deleted macro-domain (M), constructs with depletion of both the linker and macro-domain (LM) and H2B-GFP. (B) Immunoblot analysis for GFP, H3K9ac, H2AX and -actin in protein extracts prepared from TSA-treated cells (500 nM during 48h) co-transfected with mH2A1 variants, as indicated in (A). Apparent molecular weights are indicated. (C) IF confocal images of 48h TSA-treated cells and co-transfected with mH2A1 variants presented in (A), stained with Hoechst. Scale bar = 10 µm.
Appendix A.7
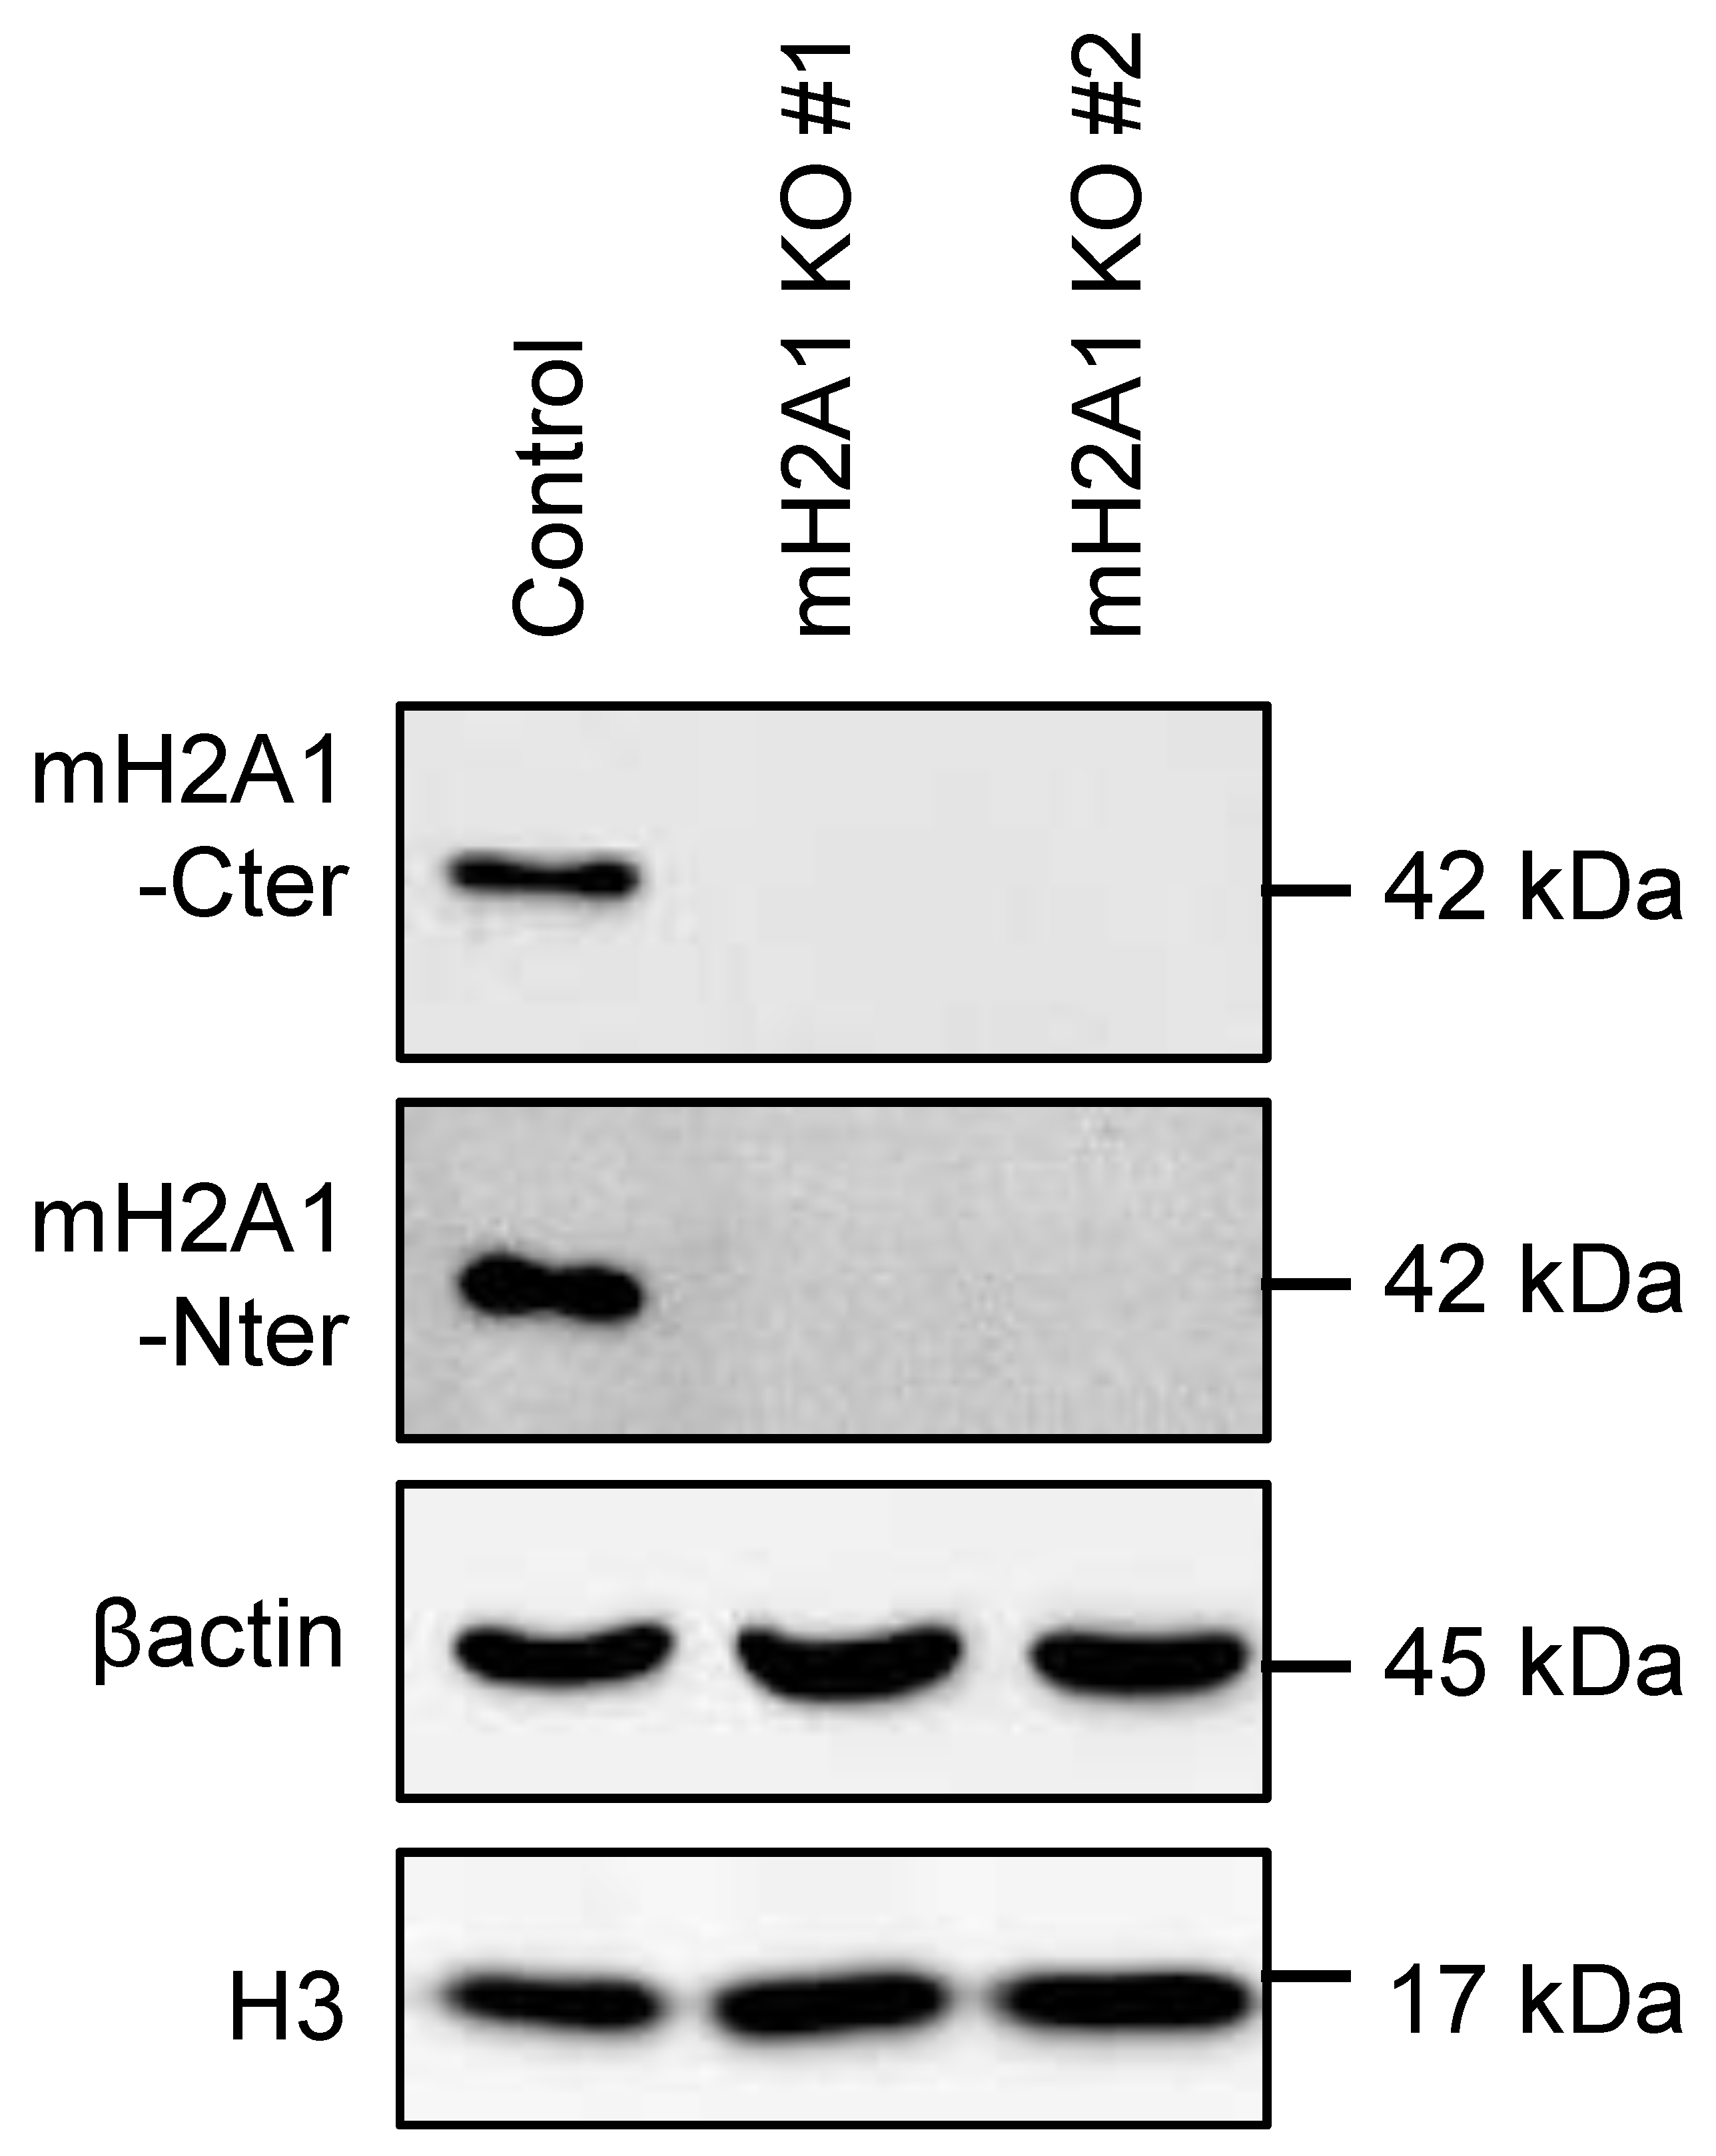
Figure A7.
Validation of mH2A1 KO clones using immunoblot analysis. Immunoblot analysis of mH2A1, -actin and H3 in protein extracts prepared from control and two mH2A1 KO clones (#1, #2). To ensure the absence of mH2A1, two different mH2A1-specific antibodies were used, specific either of the C-terminal part (-Cter) or of the N-terminal part (-Nter) of mH2A1. Apparent molecular weights are indicated.
Appendix A.8
Figure A8.
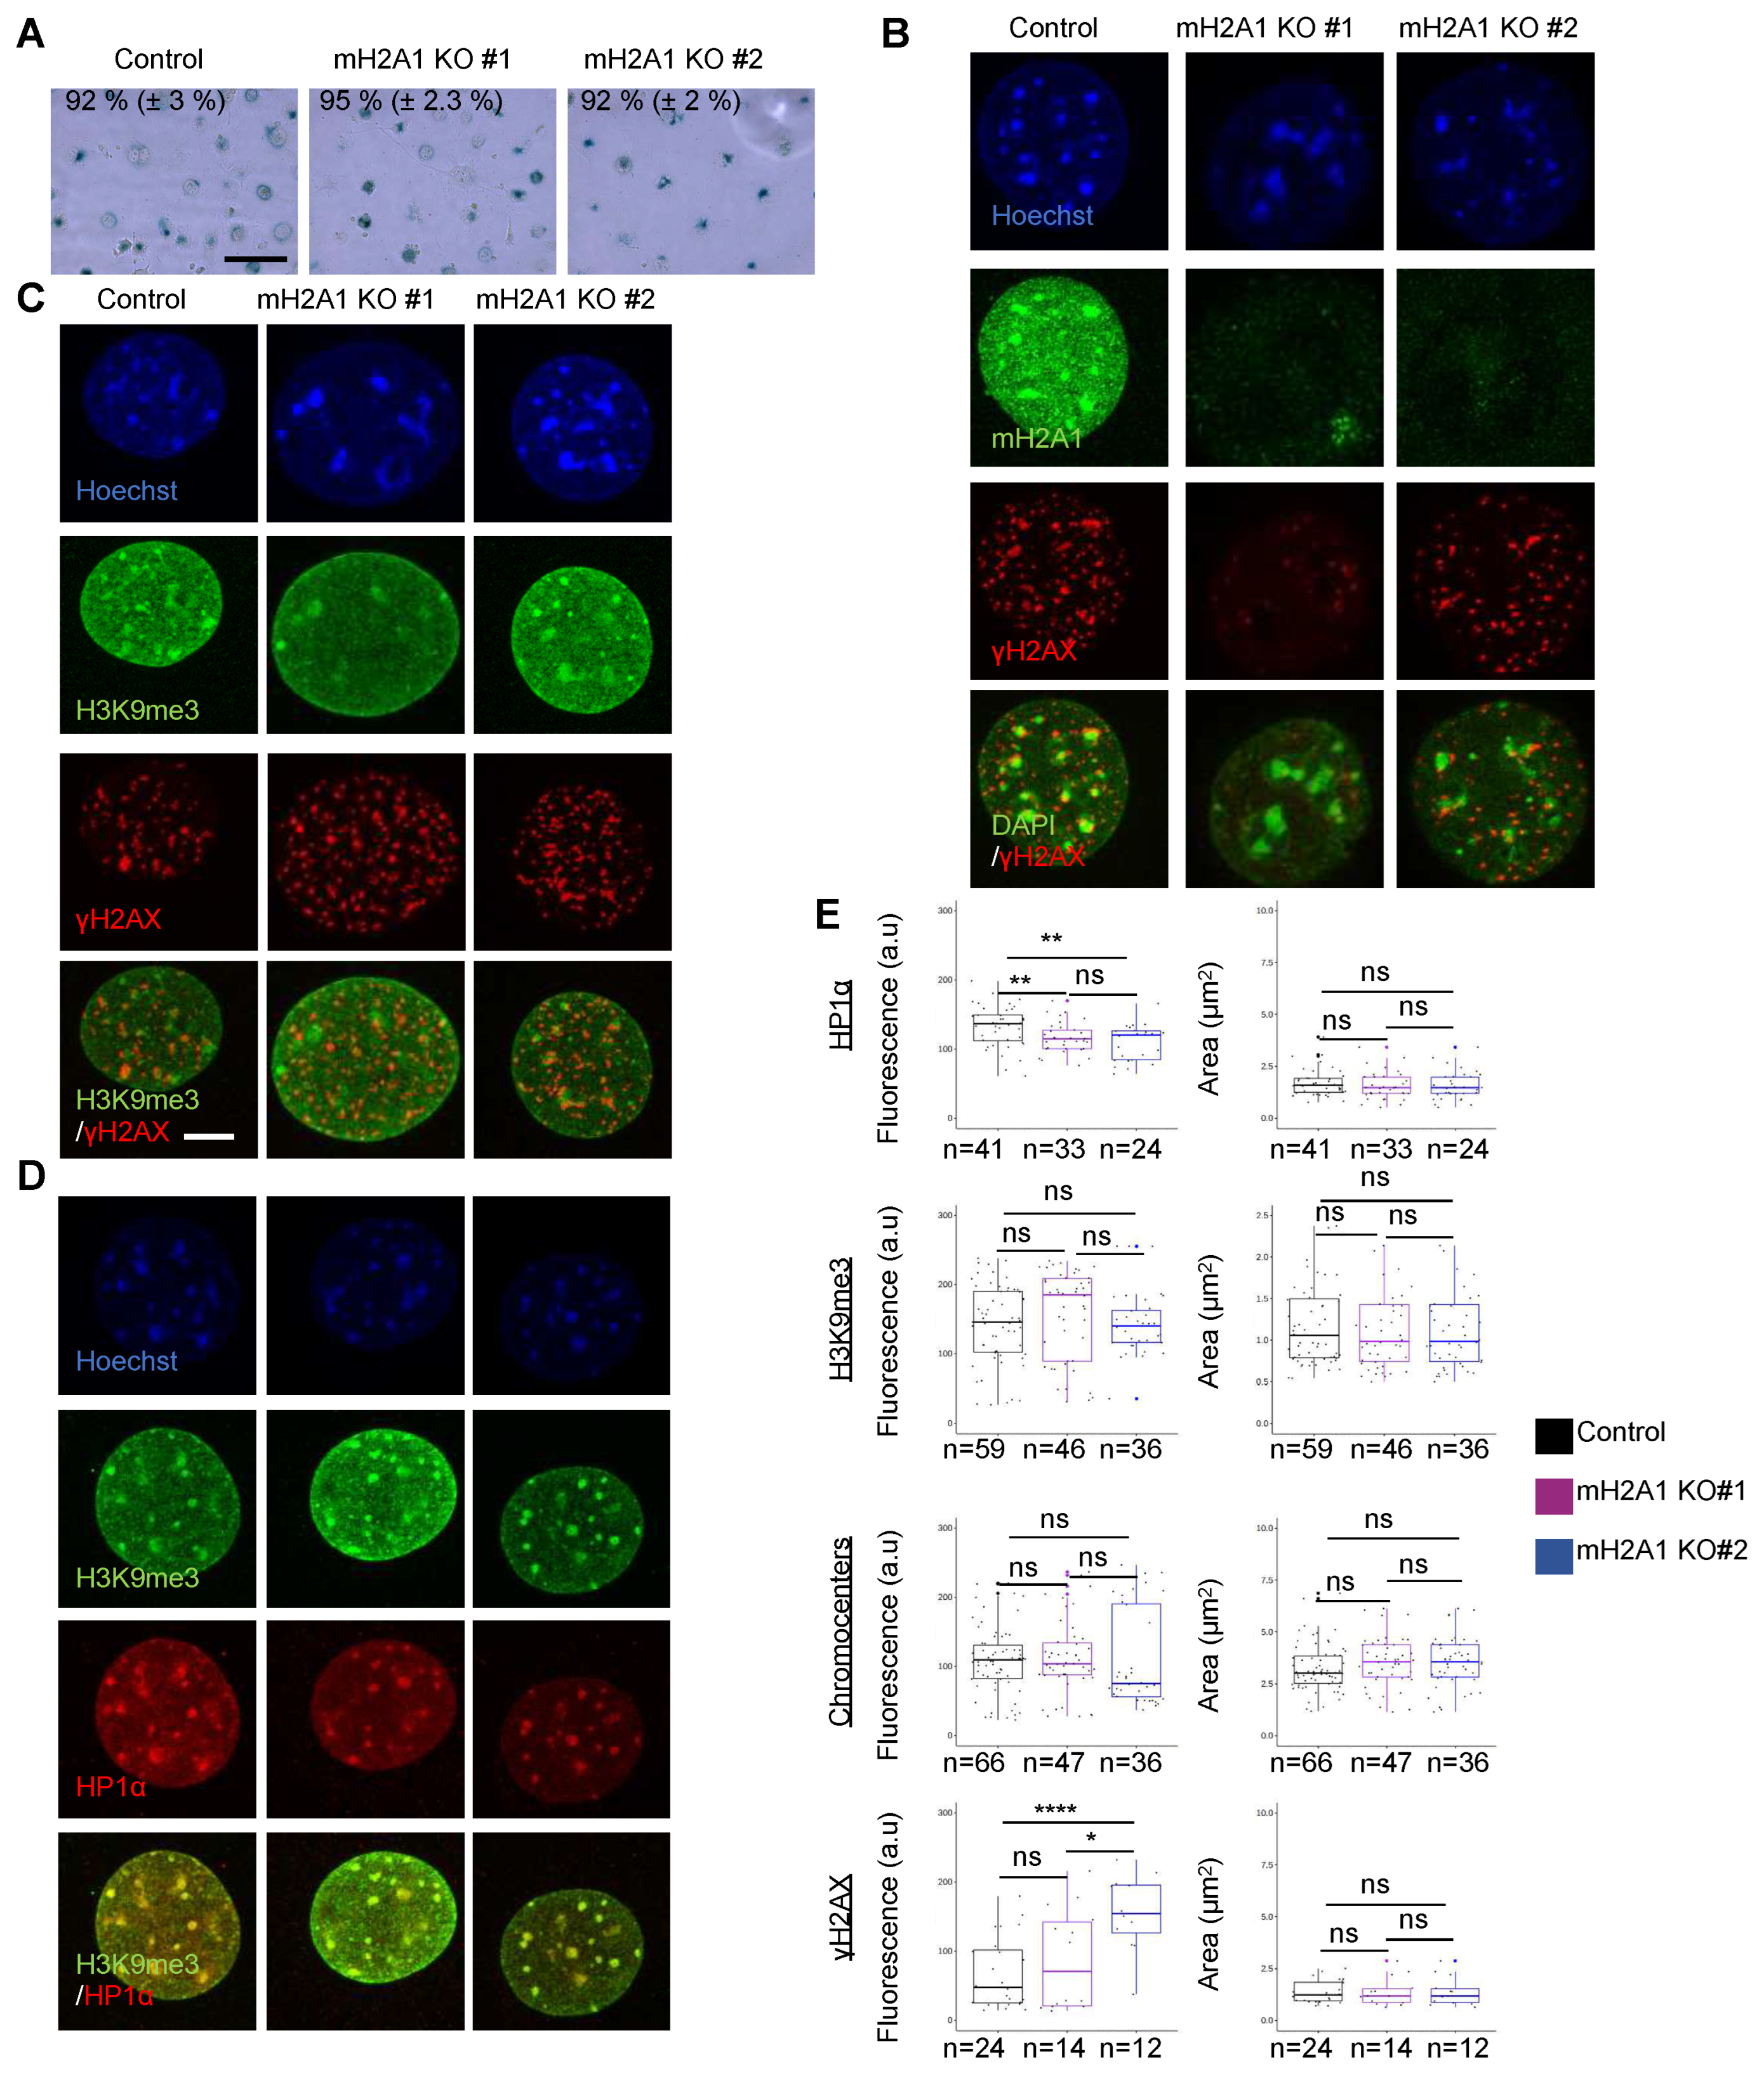
Chromocenter organization in senescent cells is independent of mH2A1. (A) Representative images of SA-gal, assessed by X-gal staining for mouse control cell and the two mH2A1 KO clones upon senescence induction using etoposide treatment (12.5 µM, 24h and release during 4 days). Percentage of X-gal positive cells are given, represented as means ± SD from two biological replicates. Scale bar = 100 µm. (B) IF confocal images of senescent control cell and mH2A1 KO clones stained with Hoechst and antibodies specific for mH2A1 and H2AX. Scale bar = 10 µm. (C) Same as in (B) but cells are stained with Hoechst and antibodies specific for H3K9me3 and H2AX. (D) As in (B) but cells are stained with Hoechst and antibodies specific for H3K9me3 and HP1. (E) Quantifications of HP1, H3K9me3, chromocenters (Hoechst-dense labelling), and H2AX mean fluorescence intensities and area in control and mH2A1 KO cells. The number of cells analyzed for each condition is given (n). Each point corresponds to the mean of foci per cell, taking from 3 biological replicates, except from H2AX (2 biological replicates) and HP1 (1 biological replicate). Wilcoxon tests were used to assess the significance of the observed differences. **** P < 0.0001, ** P < 0.01, * P < 0.05, ns: non-significant.
Figure A8.
Chromocenter organization in senescent cells is independent of mH2A1. (A) Representative images of SA-gal, assessed by X-gal staining for mouse control cell and the two mH2A1 KO clones upon senescence induction using etoposide treatment (12.5 µM, 24h and release during 4 days). Percentage of X-gal positive cells are given, represented as means ± SD from two biological replicates. Scale bar = 100 µm. (B) IF confocal images of senescent control cell and mH2A1 KO clones stained with Hoechst and antibodies specific for mH2A1 and H2AX. Scale bar = 10 µm. (C) Same as in (B) but cells are stained with Hoechst and antibodies specific for H3K9me3 and H2AX. (D) As in (B) but cells are stained with Hoechst and antibodies specific for H3K9me3 and HP1. (E) Quantifications of HP1, H3K9me3, chromocenters (Hoechst-dense labelling), and H2AX mean fluorescence intensities and area in control and mH2A1 KO cells. The number of cells analyzed for each condition is given (n). Each point corresponds to the mean of foci per cell, taking from 3 biological replicates, except from H2AX (2 biological replicates) and HP1 (1 biological replicate). Wilcoxon tests were used to assess the significance of the observed differences. **** P < 0.0001, ** P < 0.01, * P < 0.05, ns: non-significant.
Appendix A.9
Figure A9.
Chromocenter organization in TSA-treated cells in independent of mH2A1. (A) Immunoblot analysis for mH2A1, H2AX, HP1, H3K9ac and H3 in protein extracts prepared from control and mH2A1 KO cells treated or not with 500 nM of TSA during 48h. Apparent molecular weights are indicated. (B) IF confocal images TSA-treated control cells and both mH2A1 KO clones stained with Hoechst and antibodies specific for mH2A1 and HP1. Scale bar = 10 µm. (C) Same as in (B) but cells are stained with Hoechst and antibody specific for H3K9me3. (D) Quantification of the mean of chromocenters (Hoechst-dense labelling) and nuclear area and fluorescence intensities in control and mH2A1 KO cells, taken from 3 biological replicates. The last boxplot shows the mean of chromocenter fluorescence normalized by the whole nuclear fluorescence from the same cell. The number of cells analyzed for each condition is given (n). Each point corresponds to the mean of foci per cell. Wilcoxon tests were used to assess the significance of the observed differences. **** P < 0.0001, ** P < 0.01, * P < 0.05, ns: non-significant.
Appendix B
Appendix B.1
The appendix is an optional section that can contain details and data supplemental to the main text—for example, explanations of experimental details that would disrupt the flow of the main text but nonetheless remain crucial to understanding and reproducing the research shown; figures of replicates for experiments of which representative data are shown in the main text can be added here if brief, or as Supplementary Data. Mathematical proofs of results not central to the paper can be added as an appendix.

Table A1.
gRNAs.
| gRNAs | gRNA Sequence | PAM |
|---|---|---|
| gRNA 1 | ATTCGGCAACACGCCCCCGC | TGG |
| gRNA 2 | CACGCCTCCGCCGGCCAAAA | AGG |
Table A2.
Plasmids *.
| Cas9 | pSpCas9(BB)-2A-Puro (PX459) V2.0 (Plasmid #62988, addgene) |
| Cas9-GFP | pSpCas9(BB)-2A-GFP (PX458) (Plasmid #48138, addgene) |
| Cas9_gRNA1 | pSpCas9(BB)-2A-Puro gRNA 1 ex4 H2AFY MS |
| Cas9-GFP_gRNA2 | pSpCas9(BB)-2A-GFP (PX458) gRNA 2 ex4 H2AFY Ms |
| MajS gRNA | pEX-A-U6-MaSgRNA_Puro_R (Plasmid #84780,addgene) |
| MinS gRNA | pEX-A-U6-MiSgRNA_Puro_R (Plasmid #84781,addgene) |
| Telo gRNA | pEX-A-U6-TelgRNA_Puro_R (Plasmid #84782,addgene) |
| EGFP | pLVX-EGFP |
| EGFP-mH2A1.1 | pLVX-EGFP-mH2A1.1 |
| EGFP-mH2A1 delMD (aa1-179) | pLVX-EGFP-mH2A1 delMD (aa1-179) |
| EGFP-mH2A1 delLMD (aa1-123) | pLVX-EGFP-mH2A1 delLMD (aa1-123) |
| H2B-EGFP | pBOS-H2B-GFP (BD Pharmingen) |
| Flag-mH2A1.1 | Given by Marcus Buschbeck |
| Flag-mH2A1.2 | Given by Marcus Buschbeck |
| dCas9-VPR | Given by Fabian Erdel [40] |
* Plasmids and sequences available upon request.
| siRNA | Sequence |
|---|---|
| HIRA (5’ -> 3’) | GGAGAUGACAAACUGAUUAUU |
Table A4.
Primers
| Target | Forward primer | Reverse primer |
|---|---|---|
| 18S rDNA | CCCTATCAACTTTCGATGGTAGTCG | CCAATGGATCCTCGTTAAAGGATTT |
| ANKRD1 | AGTAGAGGAACTGGTCACTGG | TGGGCTAGAAGTGTCTTCAGAT |
| CDKN1A (p21) | GACACCACTGGAGGGTGACT | CAGGTCCACATGGTCTTCCT |
| CXCL1 | GAAAGCTTGCCTCAATCCTG | CACCAGTGAGCTTCCTCCTC |
| EDN1 | CAGCAGTCTTAGGCGCTGAG | ACTCTTTATCCATCAGGGACGAG |
| IL6 | CCGGGAACGAAAGAGAAGCT | GCGCTTGTGGAGAAGGAGTT |
| IL8 | CTTTCCACCCCAAATTTATCAAAG | CAGACAGAGCTCTCTTCCATCAGA |
| MajS | GACGACTTGAAAAATGACGAAATC | CATATTCCAGGTCCTTCAGTGTGC |
| GAPDH | AACTTTGGCATTGTGGAAGG | ACACATTGGGGGTAGGAACA |
| gRNA 1 | CACCGATTCGGCAACACGCCCCCGC | AAACGCGGGGGCGTGTTGCCGAAT |
| gRNA 2 | CACCGCACGCCTCCGCCGGCCAAAA | AAACTTTTGGCCGGCGGAGGCGTG |
Table A5.
Antibodies.
| Antibody | Supplier (reference) | Dilution (Use)* |
|---|---|---|
| HIRA | Cell signaling (D2A5E) | 1/1000 (WB) |
| H2AX | Abcam Ab26350 [9F3] | 1/1000 (WB & IF) |
| H2AX | Abcam Ab81299 | 1/1000 (IF) |
| mH2A1.2 | Millipore #MABE61 Clone 14GT | 1/1000 |
| mH2A1 | Millipore #AbE215 | 1/1000 (WB & IF) |
| H3K9me3 | Abcam Ab8898 | 1/1000 (IF) |
| H3K9me3 | Abcam (Ab1991) | 1/1000 (WB) |
| Flag | Sigma (F3165) M2 | 1/1000 (WB & IF) |
| actin | Abcam (Ab8227) | 1/1000 (WB) |
| HP1 | Upstate #05-689 | 1/1000 (WB & IF) |
| H3K9ac | Upstate #06-942 | 1/1000 (WB) |
| LaminB1 | Abcam Ab16048 | 1/1000 (WB) |
| GFP | Roche 1814460001 | 1/1000 (WB) |
| mH2A1-Nter | Abcam (Ab137117) | 1/1000 (IF) |
| mH2A1.1 | Ab mH2A1.1 Home-made | 1/1000 (IF) |
| Anti-mouse-Peroxidase | Sigma A2304 | 1:10.000 (WB) |
| Anti-Rabbit-Peroxidase | Sigma A0545 | 1:10.000 (WB) |
| Alexa Fluor 488 Anti-mouse | Invitrogen A11029 | 1:1000 (IF) |
| Alexa Fluor 647 Anti-Rabbit | Invitrogen A21245 | 1:1000 (IF) |
References
- Ferrand, J.; Rondinelli, B.; Polo, S.E. Histone Variants: Guardians of Genome Integrity. Cells 2020, 9, 2424. [Google Scholar] [CrossRef]
- Martire, S.; Banaszynski, L.A. The roles of histone variants in fine-tuning chromatin organization and function. Nature reviews. Molecular cell biology 2020, 21, 522–541. [Google Scholar] [CrossRef]
- Buschbeck, M.; Hake, S.B. Variants of core histones and their roles in cell fate decisions, development and cancer 2017. 18, 299–314. [CrossRef]
- Pehrson, J.R.; Fuji, R.N. Evolutionary conservation of histone macroH2A subtypes and domains. Nucleic Acids Research 1998, 26, 2837–2842. [Google Scholar] [CrossRef] [PubMed]
- Rivera-Casas, C.; Gonzalez-Romero, R.; Cheema, M.S.; Ausió, J.; Eirín-López, J.M. The characterization of macroH2A beyond vertebrates supports an ancestral origin and conserved role for histone variants in chromatin. Epigenetics 2016, 11, 415–425. [Google Scholar] [CrossRef] [PubMed]
- Gamble, M.J.; Kraus, W.L. Multiple facets of the unique histone variant macroH2A: From genomics to cell biology 2010. 9, 2568–74. [CrossRef]
- Costanzi, C.; Pehrson, J.R. Histone macroH2A1 is concentrated in the inactive X chromosome of female mammals. Nature 1998, 393, 599–601. [Google Scholar] [CrossRef] [PubMed]
- Galupa, R.; Heard, E. X-chromosome inactivation: A crossroads between chromosome architecture and gene regulation 2018. 52, 535–566. [CrossRef]
- Gamble, M.J.; Frizzell, K.M.; Yang, C.; Krishnakumar, R.; Kraus, W.L. The histone variant macroH2A1 marks repressed autosomal chromatin, but protects a subset of its target genes from silencing. Genes and Development 2010, 24, 21–32. [Google Scholar] [CrossRef]
- Recoules, L.; Heurteau, A.; Raynal, F.; Karasu, N.; Moutahir, F.; Bejjani, F.; Jariel-Encontre, I.; Cuvier, O.; Sexton, T.; Lavigne, A.C.; Bystricky, K. The histone variant macroH2A1.1 regulates RNA polymerase II-paused genes within defined chromatin interaction landscapes. Journal of cell science 2022, 135, jcs259456. [Google Scholar] [CrossRef]
- Sun, Z.; Filipescu, D.; Andrade, J.; Gaspar-Maia, A.; Ueberheide, B.; Bernstein, E. Transcription-associated histone pruning demarcates macroH2A chromatin domains. Nature Structural and Molecular Biology 2018, 25, 958–970. [Google Scholar] [CrossRef]
- Douet, J.; Corujo, D.; Malinverni, R.; Renauld, J.; Sansoni, V.; Marjanović, M.P.; Cantariño, N.; Valero, V.; Mongelard, F.; Bouvet, P.; Imhof, A.; Thiry, M.; Buschbeck, M. MacroH2A histone variants maintain nuclear organization and heterochromatin architecture. Journal of Cell Science 2017, 130, 1570–1582. [Google Scholar] [CrossRef]
- Cong, R.; Das, S.; Douet, J.; Wong, J.; Buschbeck, M.; Mongelard, F.; Bouvet, P. MacroH2A1 histone variant represses rDNA transcription. Nucleic Acids Research 2014, 42, 181–192. [Google Scholar] [CrossRef]
- Zhang, R.; Poustovoitov, M.V.; Ye, X.; Santos, H.A.; Chen, W.; Daganzo, S.M.; Erzberger, J.P.; Serebriiskii, I.G.; Canutescu, A.A.; Dunbrack, R.L.; Pehrson, J.R.; Berger, J.M.; Kaufman, P.D.; Adams, P.D. Formation of macroH2A-containing senescence-associated heterochromatin foci and senescence driven by ASF1a and HIRA. Developmental Cell 2005, 8, 19–30. [Google Scholar] [CrossRef]
- Chandra, T.; Kirschner, K.; Thuret, J.Y.; Pope, B.D.; Ryba, T.; Newman, S.; Ahmed, K.; Samarajiwa, S.A.; Salama, R.; Carroll, T.; Stark, R.; Janky, R.S.; Narita, M.; Xue, L.; Chicas, A.; Nũnez, S.; Janknecht, R.; Hayashi-Takanaka, Y.; Wilson, M.D.; Marshall, A.; Odom, D.T.; Babu, M.M.; Bazett-Jones, D.P.; Tavaré, S.; Edwards, P.A.W.; Lowe, S.W.; Kimura, H.; Gilbert, D.M.; Narita, M. Independence of Repressive Histone Marks and Chromatin Compaction during Senescent Heterochromatic Layer Formation. Molecular Cell 2012, 47, 203–214. [Google Scholar] [CrossRef]
- Narita, M.; Nũnez, S.; Heard, E.; Narita, M.; Lin, A.W.; Hearn, S.A.; Spector, D.L.; Hannon, G.J.; Lowe, S.W. Rb-mediated heterochromatin formation and silencing of E2F target genes during cellular senescence. Cell 2003, 113, 703–716. [Google Scholar] [CrossRef]
- Grigoryev, S.A.; Nikitina, T.; Pehrson, J.R.; Singh, P.B.; Woodcock, C.L. Dynamic relocation of epigenetic chromatin markers reveals an active role of constitutive heterochromatin in the transition from proliferation to quiescence. Journal of Cell Science 2004, 117, 6153–6162. [Google Scholar] [CrossRef]
- Zhang, R.; Liu, S.t.; Chen, W.; Bonner, M.; Pehrson, J.; Yen, T.J.; Adams, P.D. HP1 Proteins Are Essential for a Dynamic Nuclear Response That Rescues the Function of Perturbed Heterochromatin in Primary Human Cells. Molecular and Cellular Biology 2007, 27, 949–962. [Google Scholar] [CrossRef] [PubMed]
- Changolkar, L.N.; Singh, G.; Cui, K.; Berletch, J.B.; Zhao, K.; Disteche, C.M.; Pehrson, J.R. Genome-Wide Distribution of MacroH2A1 Histone Variants in Mouse Liver Chromatin. Molecular and Cellular Biology 2010, 30, 5473–5483. [Google Scholar] [CrossRef] [PubMed]
- Mermoud, J.E.; Costanzi, C.; Pehrson, J.R.; Brockdorff, N. Histone macroH2A1.2 relocates to the inactive X chromosome after initiation and propagation of X-inactivation. Journal of Cell Biology 1999, 147, 1399–1408. [Google Scholar] [CrossRef] [PubMed]
- Pasque, V.; Gillich, A.; Garrett, N.; Gurdon, J.B. Histone variant macroH2A confers resistance to nuclear reprogramming. EMBO Journal 2011, 30, 2373–2387. [Google Scholar] [CrossRef] [PubMed]
- Perche, P.Y.; Vourc’h, C.; Konecny, L.; Souchier, C.; Robert-Nicoud, M.; Dimitrov, S.; Khochbin, S. Higher concentrations of histone macroH2A in the Barr body are correlated with higher nucleosome density. Current Biology 2000, 10, 1531–1534. [Google Scholar] [CrossRef]
- Hernández-Muñoz, I.; Lund, A.H.; Van Der Stoop, P.; Boutsma, E.; Muijrers, I.; Verhoeven, E.; Nusinow, D.A.; Panning, B.; Marahrens, Y.; Van Lohuizen, M. Stable X chromosome inactivation involves the PRC1 Polycomb complex and requires histone MACROH2A1 and the CULLIN3/SPOP ubiquitin E3 ligase. Proceedings of the National Academy of Sciences of the United States of America 2005, 102, 7635–7640. [Google Scholar] [CrossRef]
- Chen, H.; Ruiz, P.D.; Novikov, L.; Casill, A.D.; Park, J.W.; Gamble, M.J. MacroH2A1.1 and PARP-1 cooperate to regulate transcription by promoting CBP-mediated H2B acetylation. Nature Structural and Molecular Biology 2014, 21, 981–989. [Google Scholar] [CrossRef]
- Dell’Orso, S.; Wang, A.H.; Shih, H.Y.; Saso, K.; Berghella, L.; Gutierrez-Cruz, G.; Ladurner, A.G.; O’Shea, J.J.; Sartorelli, V.; Zare, H. The Histone Variant MacroH2A1.2 Is Necessary for the Activation of Muscle Enhancers and Recruitment of the Transcription Factor Pbx1. Cell Reports 2016, 14, 1156–1168. [Google Scholar] [CrossRef]
- Gaspar-Maia, A.; Qadeer, Z.A.; Hasson, D.; Ratnakumar, K.; Adrian Leu, N.; Leroy, G.; Liu, S.; Costanzi, C.; Valle-Garcia, D.; Schaniel, C.; Lemischka, I.; Garcia, B.; Pehrson, J.R.; Bernstein, E. MacroH2A histone variants act as a barrier upon reprogramming towards pluripotency. Nature Communications 2013, 4, 1565. [Google Scholar] [CrossRef]
- Lozano-Torres, B.; Estepa-Fernández, A.; Rovira, M.; Orzáez, M.; Serrano, M.; Martínez-Máñez, R.; Sancenón, F. The chemistry of senescence 2019, 3, 426–441. [CrossRef]
- Nagano, T.; Nakano, M.; Nakashima, A.; Onishi, K.; Yamao, S.; Enari, M.; Kikkawa, U.; Kamada, S. Identification of cellular senescence-specific genes by comparative transcriptomics. Scientific Reports 2016, 6, 31758. [Google Scholar] [CrossRef]
- Giuliano, C.J.; Lin, A.; Girish, V.; Sheltzer, J.M. Generating Single Cell–Derived Knockout Clones in Mammalian Cells with CRISPR/Cas9. Current Protocols in Molecular Biology 2019, 128, e100. [Google Scholar] [CrossRef]
- Mahmood, T.; Yang, P.C. Western blot: Technique, theory, and trouble shooting. North American Journal of Medical Sciences 2012, 4, 429–434. [Google Scholar] [CrossRef] [PubMed]
- Fumagalli, M.; Rossiello, F.; Mondello, C.; d’Adda di Fagagna, F. Stable cellular senescence is associated with persistent DDR activation. PLoS ONE 2014, 9, e11096. [Google Scholar] [CrossRef] [PubMed]
- Hernandez-Segura, A.; Nehme, J.; Demaria, M. Hallmarks of Cellular Senescence 2018. 28, 436–453. [CrossRef]
- Chiolo, I.; Minoda, A.; Colmenares, S.U.; Polyzos, A.; Costes, S.V.; Karpen, G.H. Double-strand breaks in heterochromatin move outside of a dynamic HP1a domain to complete recombinational repair. Cell 2011, 144, 732–744. [Google Scholar] [CrossRef] [PubMed]
- Ryu, T.; Spatola, B.; Delabaere, L.; Bowlin, K.; Hopp, H.; Kunitake, R.; Karpen, G.H.; Chiolo, I. Heterochromatic breaks move to the nuclear periphery to continue recombinational repair. Nature cell biology 2015, 17, 1401. [Google Scholar] [CrossRef]
- Tsouroula, K.; Furst, A.; Rogier, M.; Heyer, V.; Maglott-Roth, A.; Ferrand, A.; Reina-San-Martin, B.; Soutoglou, E. Temporal and Spatial Uncoupling of DNA Double Strand Break Repair Pathways within Mammalian Heterochromatin. Molecular Cell 2016, 63, 293–305. [Google Scholar] [CrossRef]
- Anton, T.; Bultmann, S.; Leonhardt, H.; Markaki, Y. Visualization of specific DNA sequences in living mouse embryonic stem cells with a programmable fluorescent CRISPR/Cas system. Nucleus 2014, 5, 163–172. [Google Scholar] [CrossRef] [PubMed]
- Li, X.; Tyler, J.K. Nucleosome disassembly during human non-homologous end joining followed by concerted HIRA- and CAF-1-dependent reassembly. eLife 2016, 5, e15129. [Google Scholar] [CrossRef] [PubMed]
- Noren Hooten, N.; Evans, M.K. Techniques to induce and quantify cellular senescence. Journal of Visualized Experiments 2017, May 1, 55533. [Google Scholar] [CrossRef]
- Chavez, A.; Scheiman, J.; Vora, S.; Pruitt, B.W.; Tuttle, M.; P R Iyer, E.; Lin, S.; Kiani, S.; Guzman, C.D.; Wiegand, D.J.; Ter-Ovanesyan, D.; Braff, J.L.; Davidsohn, N.; Housden, B.E.; Perrimon, N.; Weiss, R.; Aach, J.; Collins, J.J.; Church, G.M. Highly efficient Cas9-mediated transcriptional programming. Nature Methods 2015, 12, 326–328. [Google Scholar] [CrossRef] [PubMed]
- Erdel, F.; Rademacher, A.; Vlijm, R.; Tünnermann, J.; Frank, L.; Weinmann, R.; Schweigert, E.; Yserentant, K.; Hummert, J.; Bauer, C.; Schumacher, S.; Al Alwash, A.; Normand, C.; Herten, D.P.; Engelhardt, J.; Rippe, K. Mouse Heterochromatin Adopts Digital Compaction States without Showing Hallmarks of HP1-Driven Liquid-Liquid Phase Separation. Molecular Cell 2020, 78, 236–249.e7. [Google Scholar] [CrossRef]
- Changolkar, L.N.; Costanzi, C.; Leu, N.A.; Chen, D.; McLaughlin, K.J.; Pehrson, J.R. Developmental Changes in Histone macroH2A1-Mediated Gene Regulation. Molecular and Cellular Biology 2007, 27, 2758–2764. [Google Scholar] [CrossRef]
- Tanasijevic, B.; Rasmussen, T.P. X Chromosome Inactivation and Differentiation Occur Readily in ES Cells Doubly-Deficient for MacroH2A1 and MacroH2A2. PLoS ONE 2011, 6, e21512. [Google Scholar] [CrossRef]
- Kennedy, A.L.; McBryan, T.; Enders, G.H.; Johnson, F.B.; Zhang, R.; Adams, P.D. Senescent mouse cells fail to overtly regulate the HIRA histone chaperone and do not form robust Senescence Associated Heterochromatin Foci. Cell Division 2010, 5, 16. [Google Scholar] [CrossRef]
- Kudlova, N.; De Sanctis, J.B.; Hajduch, M. Cellular Senescence: Molecular Targets, Biomarkers, and Senolytic Drugs 2022. 23, 4168. [CrossRef]
- Swanson, E.C.; Manning, B.; Zhang, H.; Lawrence, J.B. Higher-order unfolding of satellite heterochromatin is a consistent and early event in cell senescence. Journal of Cell Biology 2013, 203, 929–942. [Google Scholar] [CrossRef]
- Clouaire, T.; Rocher, V.; Lashgari, A.; Arnould, C.; Aguirrebengoa, M.; Biernacka, A.; Skrzypczak, M.; Aymard, F.; Fongang, B.; Dojer, N.; Iacovoni, J.S.; Rowicka, M.; Ginalski, K.; Côté, J.; Legube, G. Comprehensive Mapping of Histone Modifications at DNA Double-Strand Breaks Deciphers Repair Pathway Chromatin Signatures. Molecular Cell 2018, 72, 250–262.e6. [Google Scholar] [CrossRef]
- Hassa, P.O.; Hothorn, M.; Kustatscher, G.; Nijmeijer, B. A macrodomain-containing histone rearranges chromatin upon sensing PARP1 activation. Nature Structural Molecular Biology 2009, 16, 923–929. [Google Scholar] [CrossRef]
- Khurana, S.; Kruhlak, M.J.; Kim, J.; Tran, A.D.; Liu, J.; Nyswaner, K.; Shi, L.; Jailwala, P.; Sung, M.H.; Hakim, O.; Oberdoerffer, P. A macrohistone variant links dynamic chromatin compaction to BRCA1-dependent genome maintenance. Cell Reports 2014, 8, 1049–1062. [Google Scholar] [CrossRef]
- Kim, J.; Sturgill, D.; Sebastian, R.; Khurana, S.; Tran, A.D.; Edwards, G.B.; Kruswick, A.; Burkett, S.; Hosogane, E.K.; Hannon, W.W.; Weyemi, U.; Bonner, W.M.; Luger, K.; Oberdoerffer, P. Replication Stress Shapes a Protective Chromatin Environment across Fragile Genomic Regions. Molecular Cell 2018, 69, 36–47.e7. [Google Scholar] [CrossRef]
- Mehrotra, P.V.; Ahel, D.; Ryan, D.P.; Weston, R.; Wiechens, N.; Kraehenbuehl, R.; Owen-Hughes, T.; Ahel, I. DNA repair factor APLF Is a histone chaperone. Molecular Cell 2011, 41, 46–55. [Google Scholar] [CrossRef]
- Xu, C.; Xu, Y.; Gursoy-Yuzugullu, O.; Price, B.D. The histone variant macroH2A1.1 is recruited to DSBs through a mechanism involving PARP1. FEBS Letters 2012, 586, 3920–3925. [Google Scholar] [CrossRef]
- Lu, J.; Gilbert, D.M. Proliferation-dependent and cell cycle regulated transcription of mouse pericentric heterochromatin. The Journal of cell biology 2007, 179, 411–421. [Google Scholar] [CrossRef]
- Probst, A.V.; Okamoto, I.; Casanova, M.; El Marjou, F.; Le Baccon, P.; Almouzni, G. A strand-specific burst in transcription of pericentric satellites is required for chromocenter formation and early mouse development. Developmental cell 2010, 19, 625–638. [Google Scholar] [CrossRef]
- Valgardsdottir, R.; Chiodi, I.; Giordano, M.; Rossi, A.; Bazzini, S.; Ghigna, C.; Riva, S.; Biamonti, G. Transcription of Satellite III non-coding RNAs is a general stress response in human cells. Nucleic acids research 2008, 36, 423–434. [Google Scholar] [CrossRef]
- Ting, D.T.; Lipson, D.; Paul, S.; Brannigan, B.W.; Akhavanfard, S.; Coffman, E.J.; Contino, G.; Deshpande, V.; Iafrate, A.J.; Letovsky, S.; Rivera, M.N.; Bardeesy, N.; Maheswaran, S.; Haber, D.A. Aberrant overexpression of satellite repeats in pancreatic and other epithelial cancers. Science (New York, N.Y.) 2011, 331, 593–596. [Google Scholar] [CrossRef]
- Lejeune, E.; Bayne, E.H.; Allshire, R.C. On the connection between RNAi and heterochromatin at centromeres. Cold Spring Harbor Symposia on Quantitative Biology 2010, 75, 275–83. [Google Scholar] [CrossRef] [PubMed]
Figure 1.
The histone variant mH2A1 is recruited to pericentric heterochromatin in mouse senescent cells. (A) Immunofluorescence (IF) confocal images of proliferating and senescent L929 mouse cells stained with Hoechst and antibodies specific for mH2A1, HP1 and H2AX. Senescence was induced using etoposide treatment (12.5 µM, 24h + 4 days release). Percentage of cell presenting mH2A1 foci at pericentric regions are shown, represented as means ± standard deviation (SD) from two biological replicates. Scale bar = 10 µm. (B) Representative images of a Senescence-associated -galactosidase activity (SA-gal) assessed by X-gal staining of proliferating and senescent cells. Percentage of SA-gal-positive cells are indicated as means ± SD from two biological replicates. Scale bar = 100 µm. (C) Immunoblot analysis of mH2A1, H2AX, -actin and H3 in total extract of proliferating and senescent cells. Apparent molecular weights are indicated. (D) IF confocal analysis of proliferating and senescent cells stained with Hoechst and antibody specific for H3K9me3. Scale bar = 10 µm. (E) Quantifications of nuclear and chromocenter areas (Hoechst-dense labelling) in proliferating and senescent cells. (F) Quantifications of chromocenters (Hoechst-dense labelling), mH2A1 and H2AX mean fluorescence intensities in proliferating and senescent cells. The number of cells analyzed for each condition is given (n). On boxplots, each point corresponds to the mean of foci per cell, except for ‘nucleus’ where they represent the actual values. For statistical analysis, Wilcoxon tests were used to assess the significance of the observed differences. Differences were considered significant at a P value of 0.05 or less. **** P value < 0.0001.
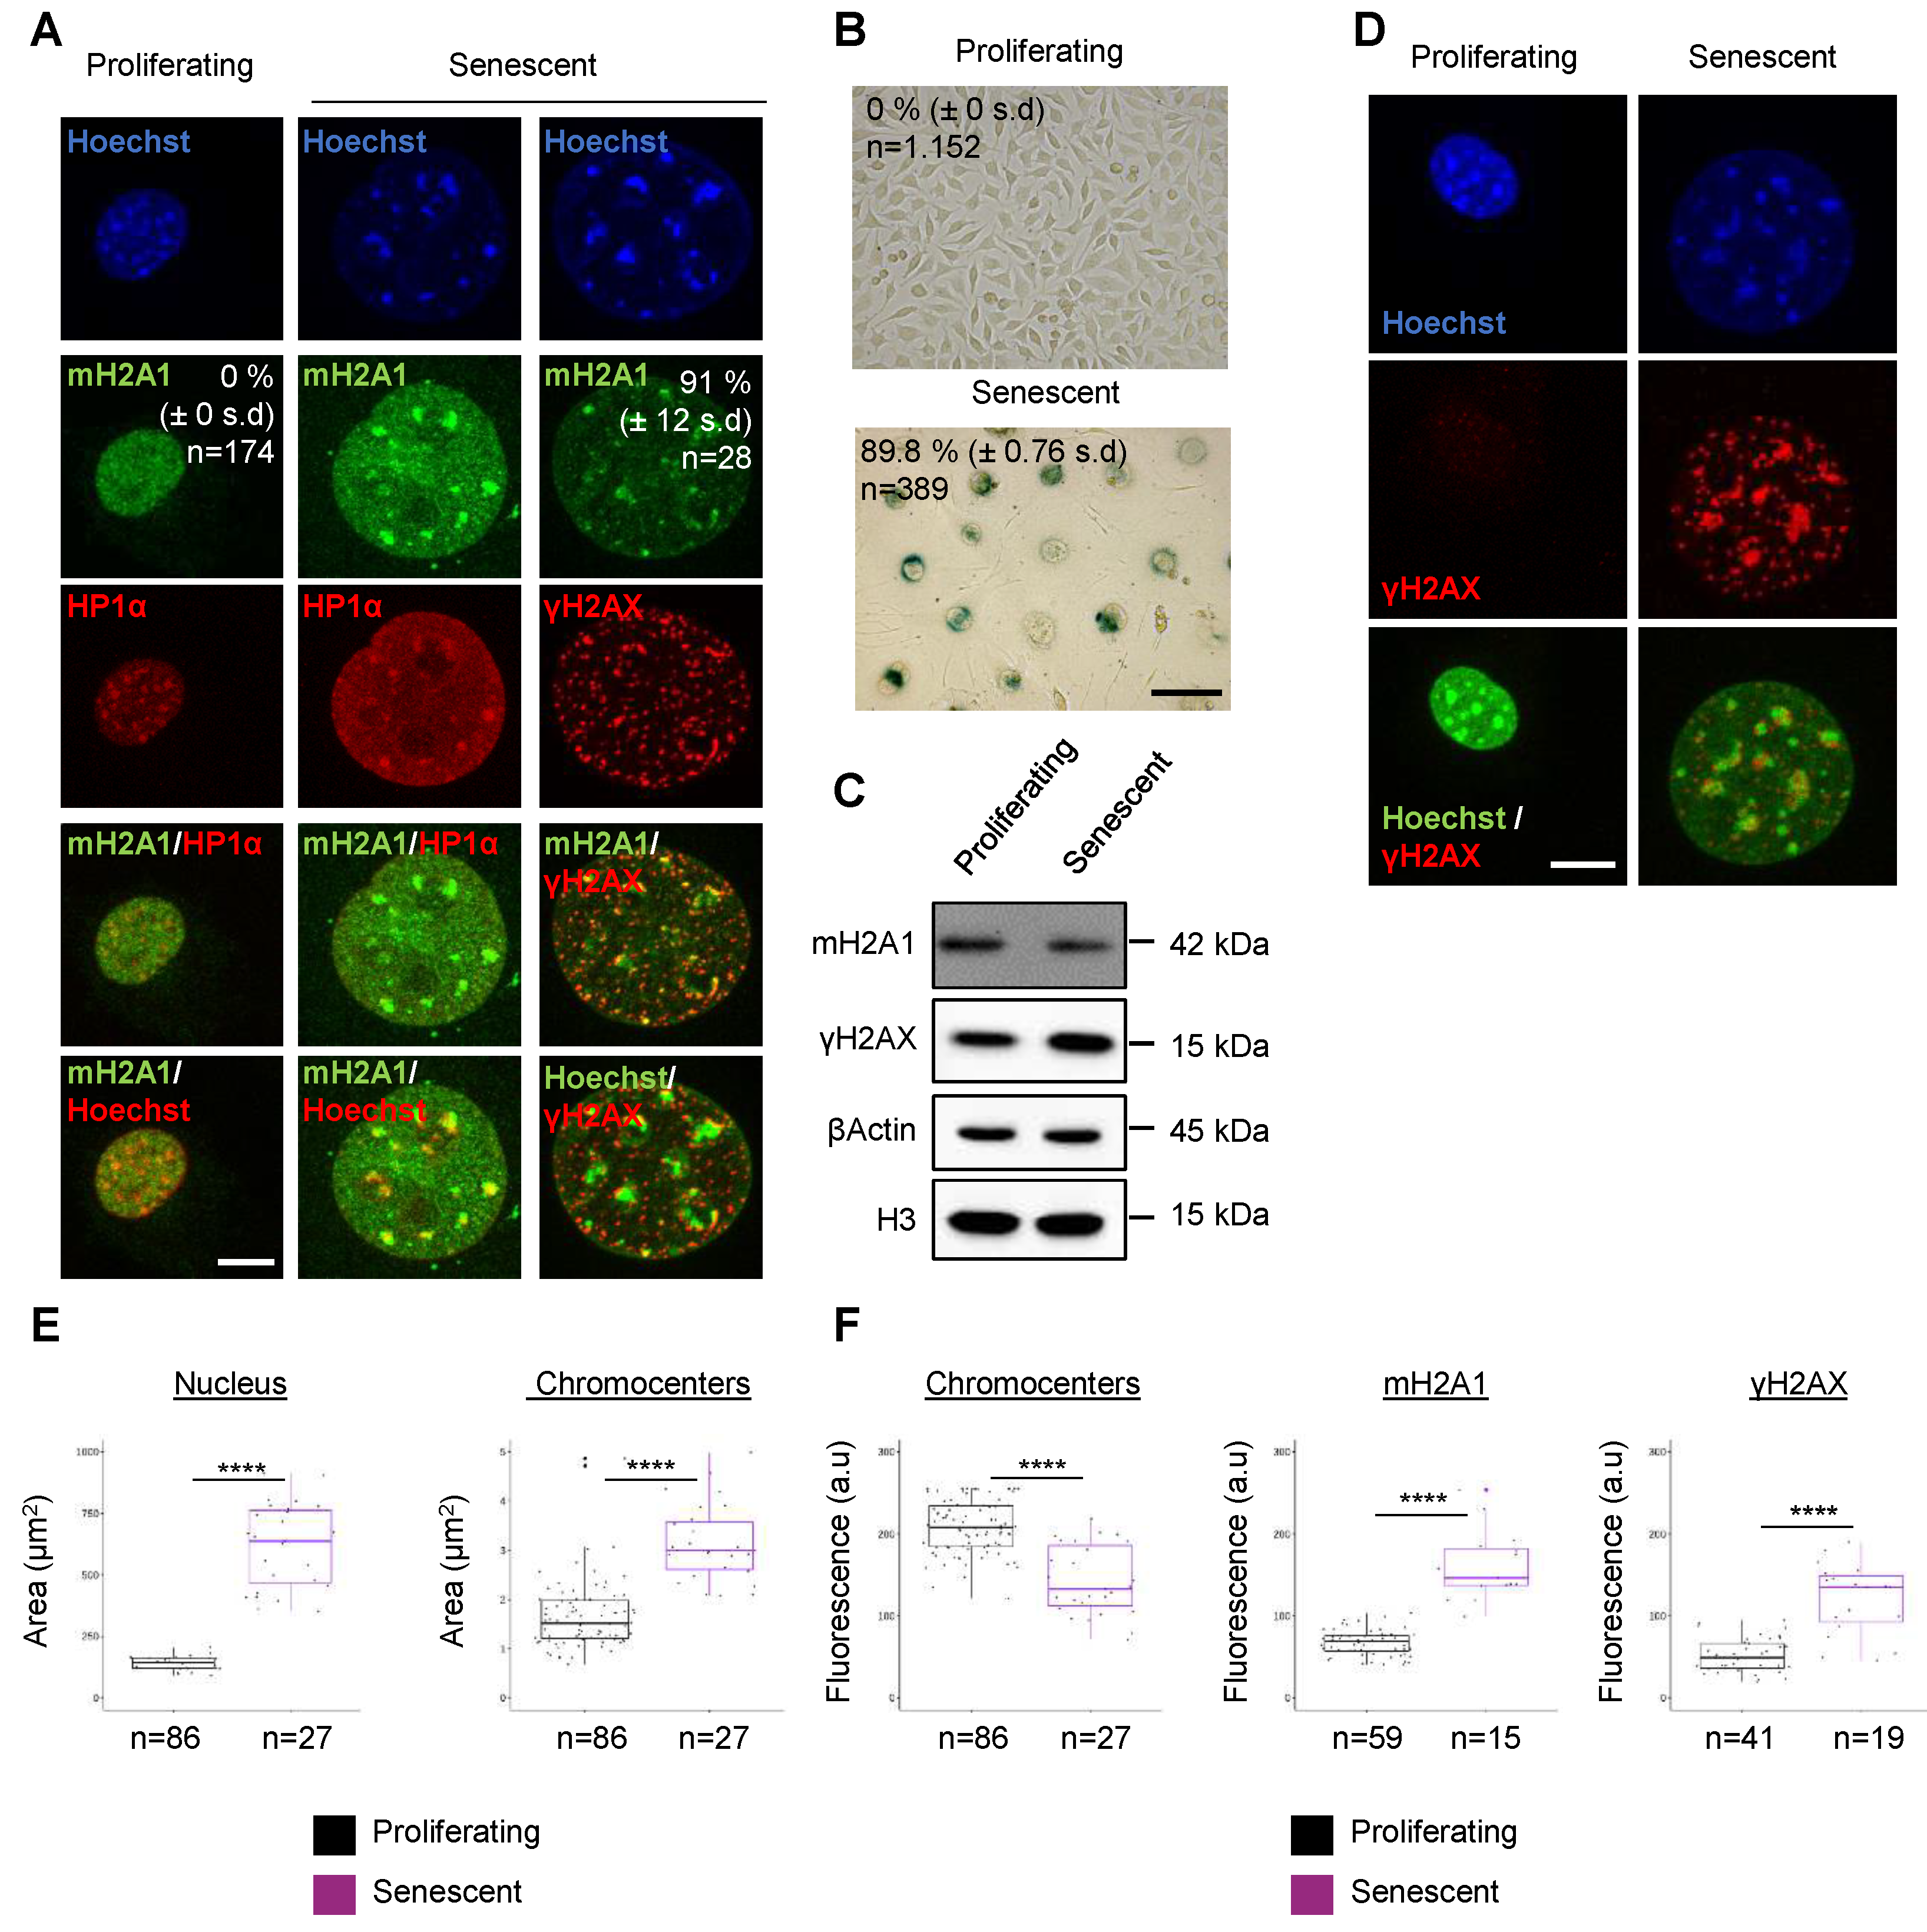
Figure 2.
mH2A1 is recruited to Cas9- induced DSBs at pericentric regions. (A) IF confocal images of 48h post-transfected cells co-expressing Cas9-GFP and gRNAs, stained with Hoechst and antibodies specific for mH2A1 and H2AX. Three different gRNA are used: a gRNA targeting major satellites (MajS), corresponding to the pericentric DNA, a gRNA targeting minor satellites (MinS), corresponding to the centromeric DNA, and a gRNA targeting telomeres (Telo). Percentage of cells exhibiting mH2A1 foci at MajS are shown, represented as means ± SD from 6 biological replicates. Scale bar = 10 µm. (B) Quantifications of the mean areas and fluorescence intensities of chromocenters (Hoechst-dense labelling), H2AX, H3K9me3, HP1 and nucleus (Hoechst labelling) in 48h post-transfected negative (No Cas9-MajS) and positive cells (Cas9-MajS), taken from > 3 biological replicates, except for HP1 (2 biological replicates) and H3K9me3 (1 biological replicate). The number of cells analyzed for each condition is given (n). On boxplots, each point corresponds to the mean of foci per cell, except for ‘nucleus’ where they represent the actual values. Wilcoxon tests were used to assess the significance of the observed differences. **** P < 0.0001, ** P < 0.01, * P < 0.05, ns: non-significant.
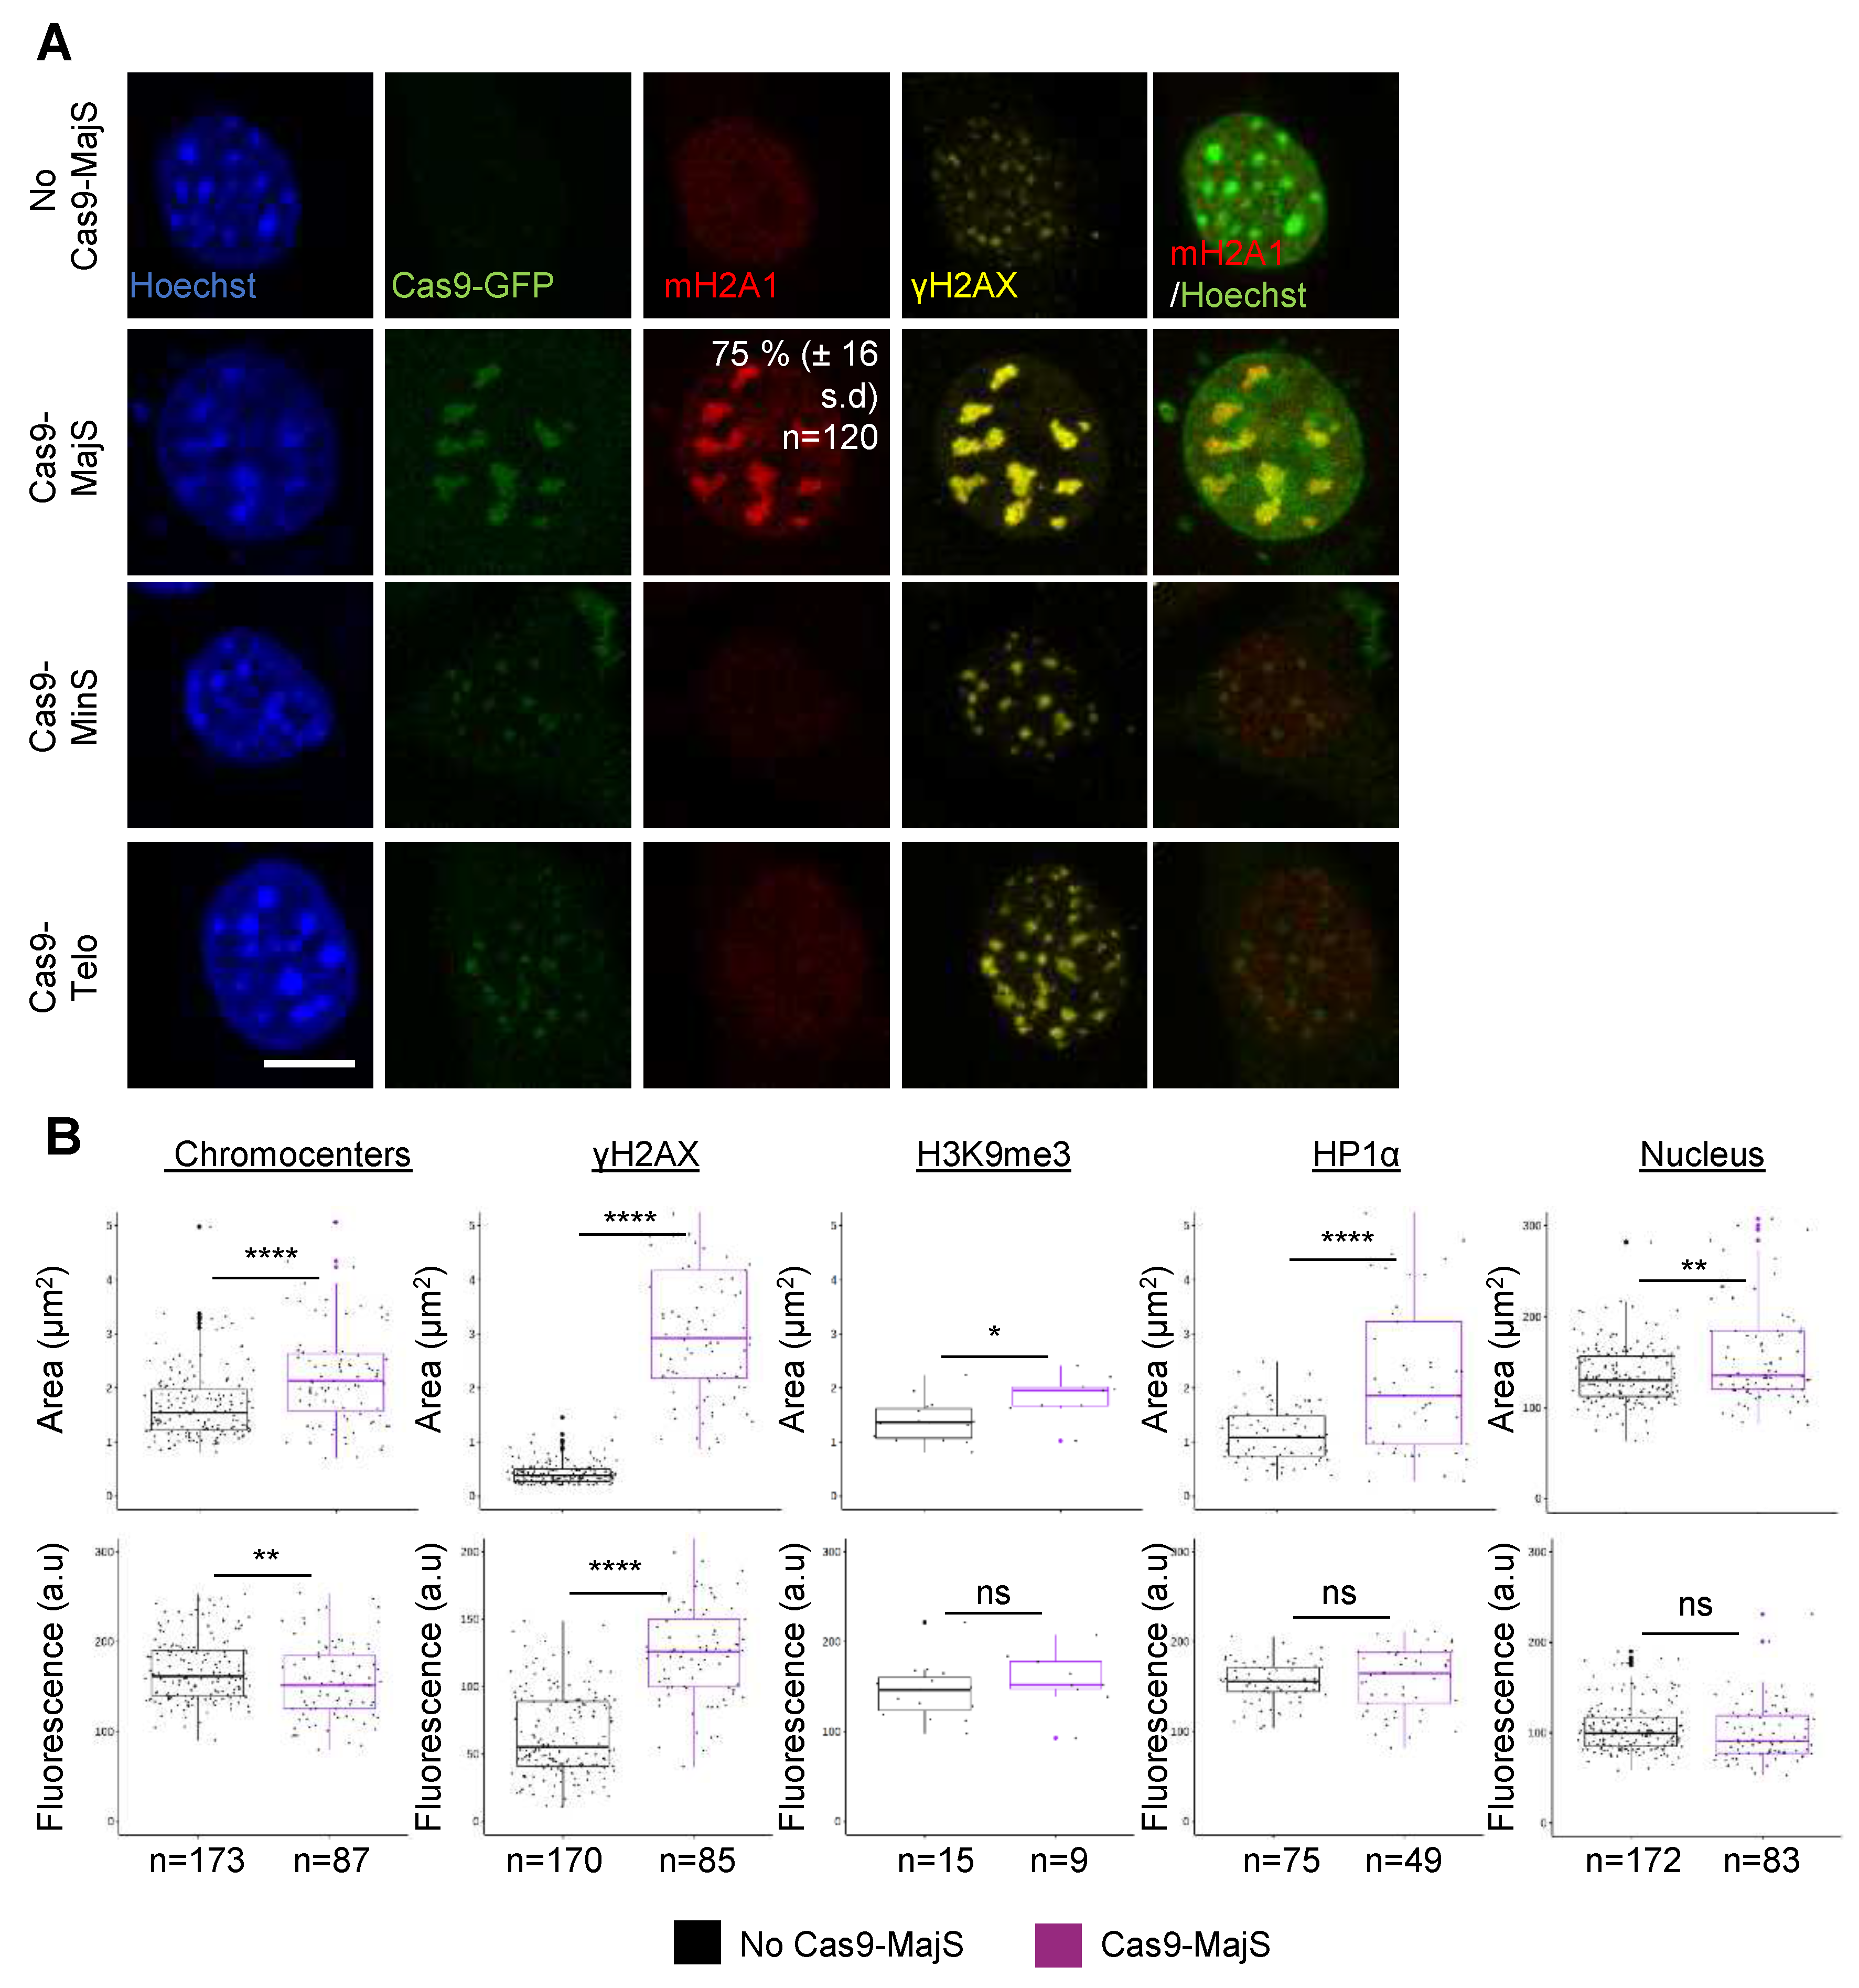
Figure 3.
TSA treatment promotes mH2A1 recruitment to pericentric regions in the absence of pericentric DSBs. (A) IF confocal images of untreated cells or cells treated with 500 nM of TSA during 48h, stained with Hoechst and antibodies specific for mH2A1 and HP1. Percentage of cells presenting mH2A1 foci at chromocenters are shown, represented as means ± SD from 3 biological replicates. Scale bar = 10 µm. (B) Immunoblots of mH2A1, HP1, H3K9ac, H2AX and -actin in protein extracts prepared from untreated and TSA-treated cells. Apparent molecular weights are indicated. Fold change increase of mH2A1 protein level, normalized by -actin from 4 biological replicates (as mean ± SD), is indicated. (C) Quantifications of the mean chromocenters (Hoechst-dense labelling) fluorescence and circularity in untreated and TSA-treated cells, taken from 2 biological replicates. TSA-treated cells are divided in two groups, depending on the presence of mH2A1 foci. (D) Quantifications of the mean H2AX and mH2A1 fluorescence intensities in untreated and TSA-treated cells, taken from 2 biological replicates. The number of cells analyzed for each condition is given (n). (E) Same as in (A) but with H2AX labelling. Percentage of cells presenting H2AX foci at chromocenters are shown, represented as means ± SD from 3 biological replicates. Scale bar = 10 µm. On boxplots, each point corresponds to the mean of foci per cell. Wilcoxon tests were used to assess the significance of the observed differences. **** P < 0.0001, ns: non-significant.
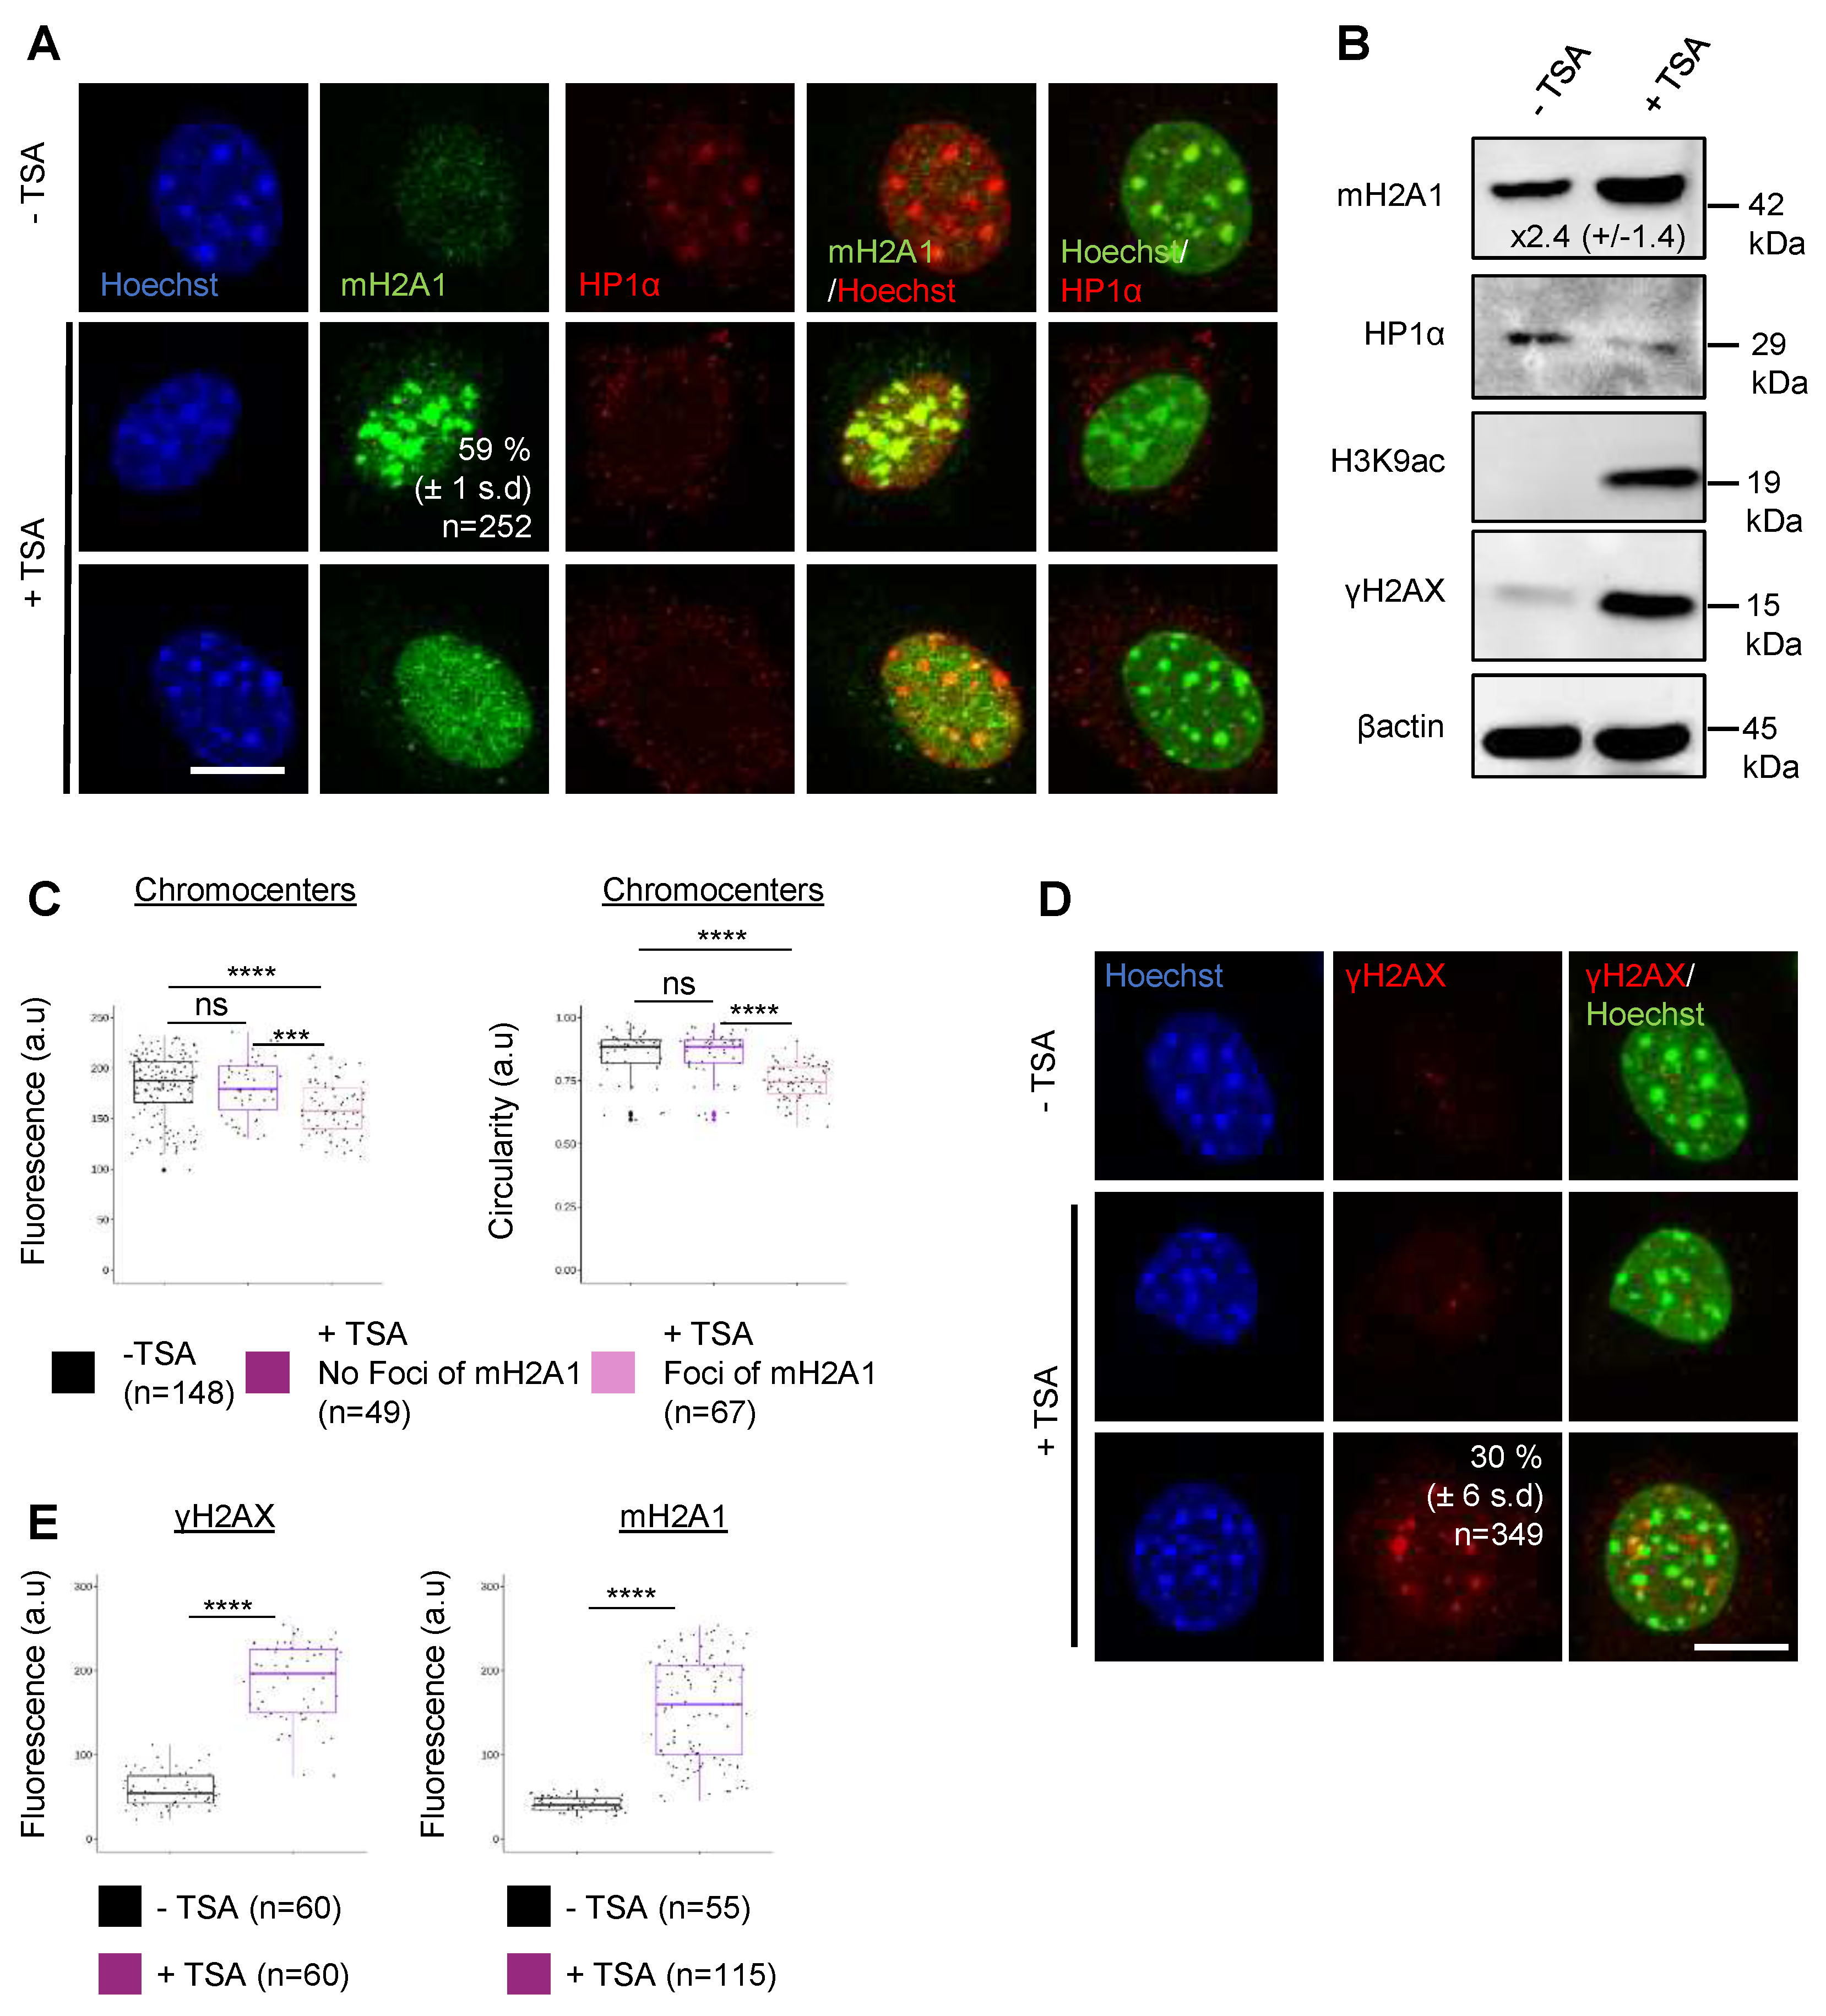
Figure 4.
mH2A1 recruitment to DSBs correlates with chromocenter decondensation. (A) IF confocal images of 0h, 16h or 24h-transfected cells co-expressing Cas9-GFP and MajS-gRNAs, stained with Hoechst and antibodies specific for mH2A1 and H2AX. Scale bar = 10 µm. (B) Line plot showing the percentage of cells with mH2A1 foci at chromocenters after different time points of Cas9-MajS transfection (0h, 16h, 24h, 48h and 96h). Percentages are based on Cas9-MajS positive cells. One biological experiment was performed for each time point. (C) Quantifications of the mean fluorescence, area, perimeter and circularity of chromocenters (Hoechst-dense labeling) after 16h transfection without (No- Cas9-MajS 16h) and or with MajS gRNA (Cas9-MajS 16h). The number of cells analyzed for each condition is given (n). Each point corresponds to the mean of foci per cell. Wilcoxon tests were used to assess the significance of the observed differences. * P < 0.05, *** P < 0.001, **** P < 0.0001. (D) IF confocal images of 48h post-transfected cells co-expressing or not dCas9-VPR and MajS gRNA, stained with Hoechst and antibodies specific for mH2A1 and HP1. Scale bar = 10 µm.
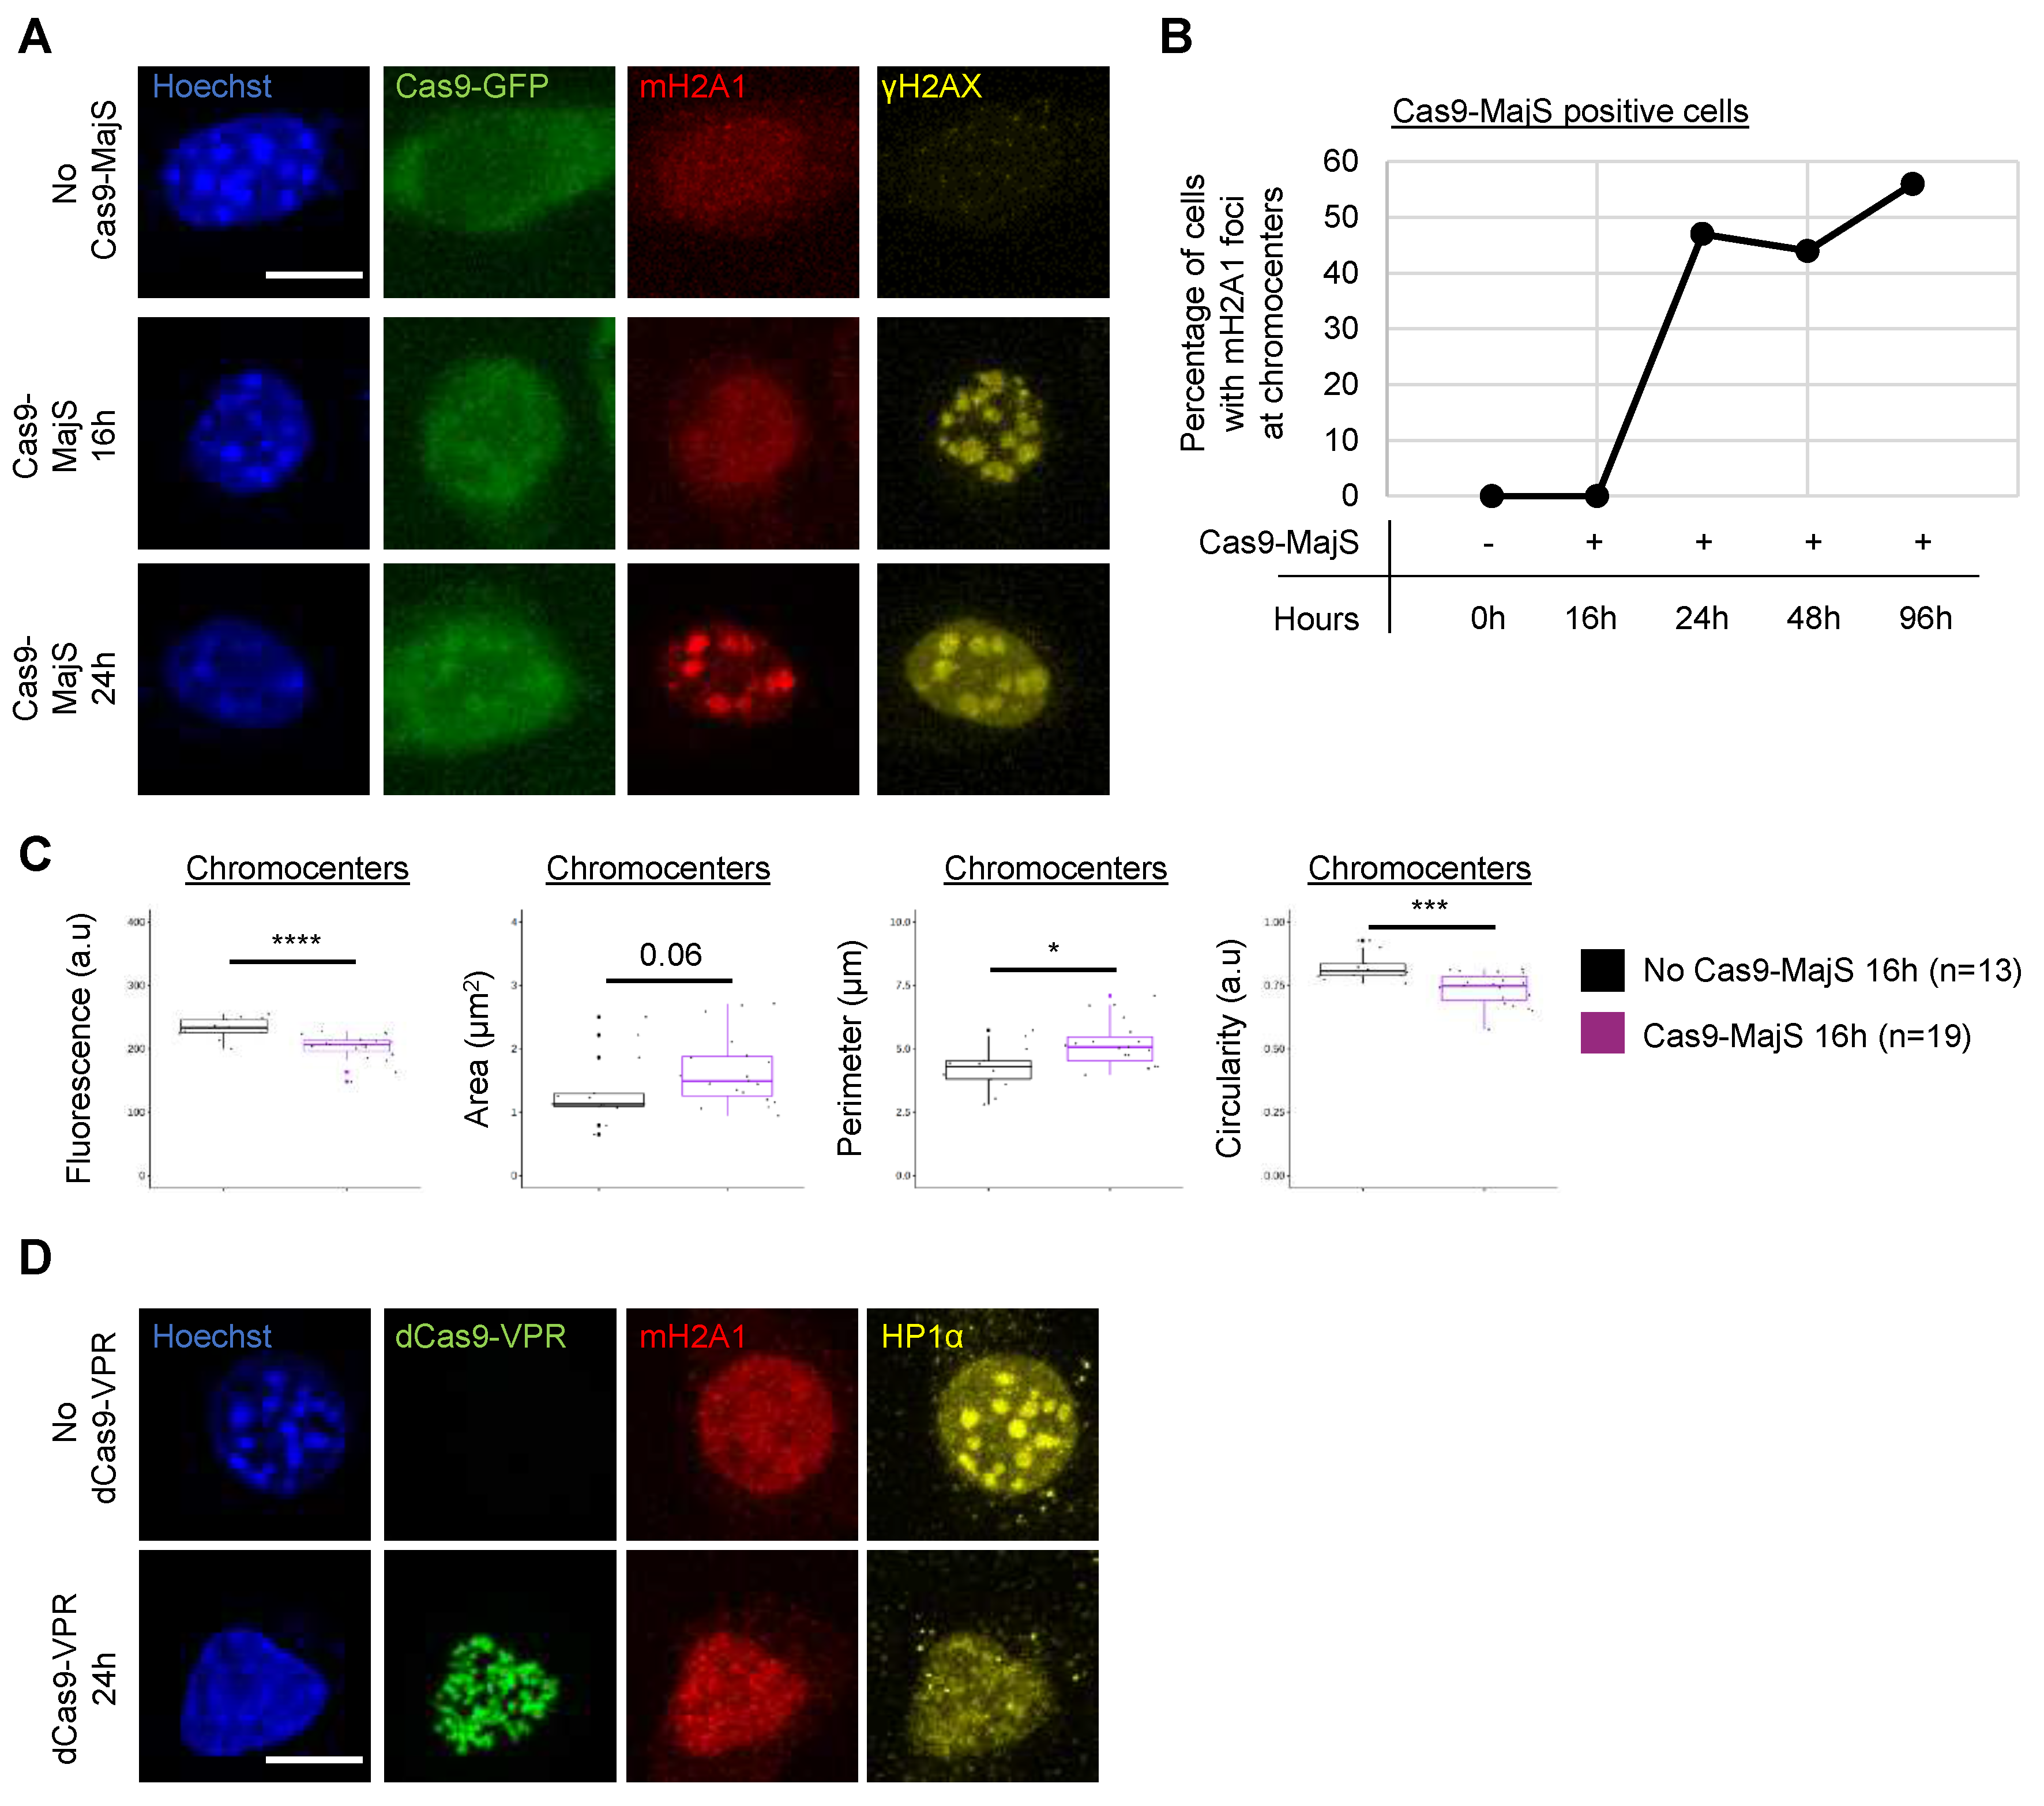
Figure 5.
DSB-induced chromocenter relaxation is independent of mH2A1. (A) IF confocal images of cells co-expressing Cas9-GFP and MajS gRNA, stained with Hoechst and antibodies specific for mH2A1 and H2AX in control and mH2A1 KO #1 cells. Scale bar = 10 µm. (B) As in (A) but cells were stained with Hoechst and antibodies specific for H3K9me3 and H2AX. (C) As in (A) but cells were stained with Hoechst and antibodies specific for HP1 and H2AX. (D) Quantifications of the mean areas and fluorescence intensities of, H2AX, H3K9me3, HP1 and chromocenters (Hoechst-dense labelling) in control and mH2A1 KO clones, taken from > 3 biological replicates, except for HP1 and H3K9me3 (only 1 biological replicate). The number of cells analyzed for each condition is given (n). Each point corresponds to the mean of foci per cell. Wilcoxon tests were used to assess the significance of the observed differences. **** P < 0.0001, *** P < 0.001, ** P < 0.01, * P < 0.05, ns: non-significant.
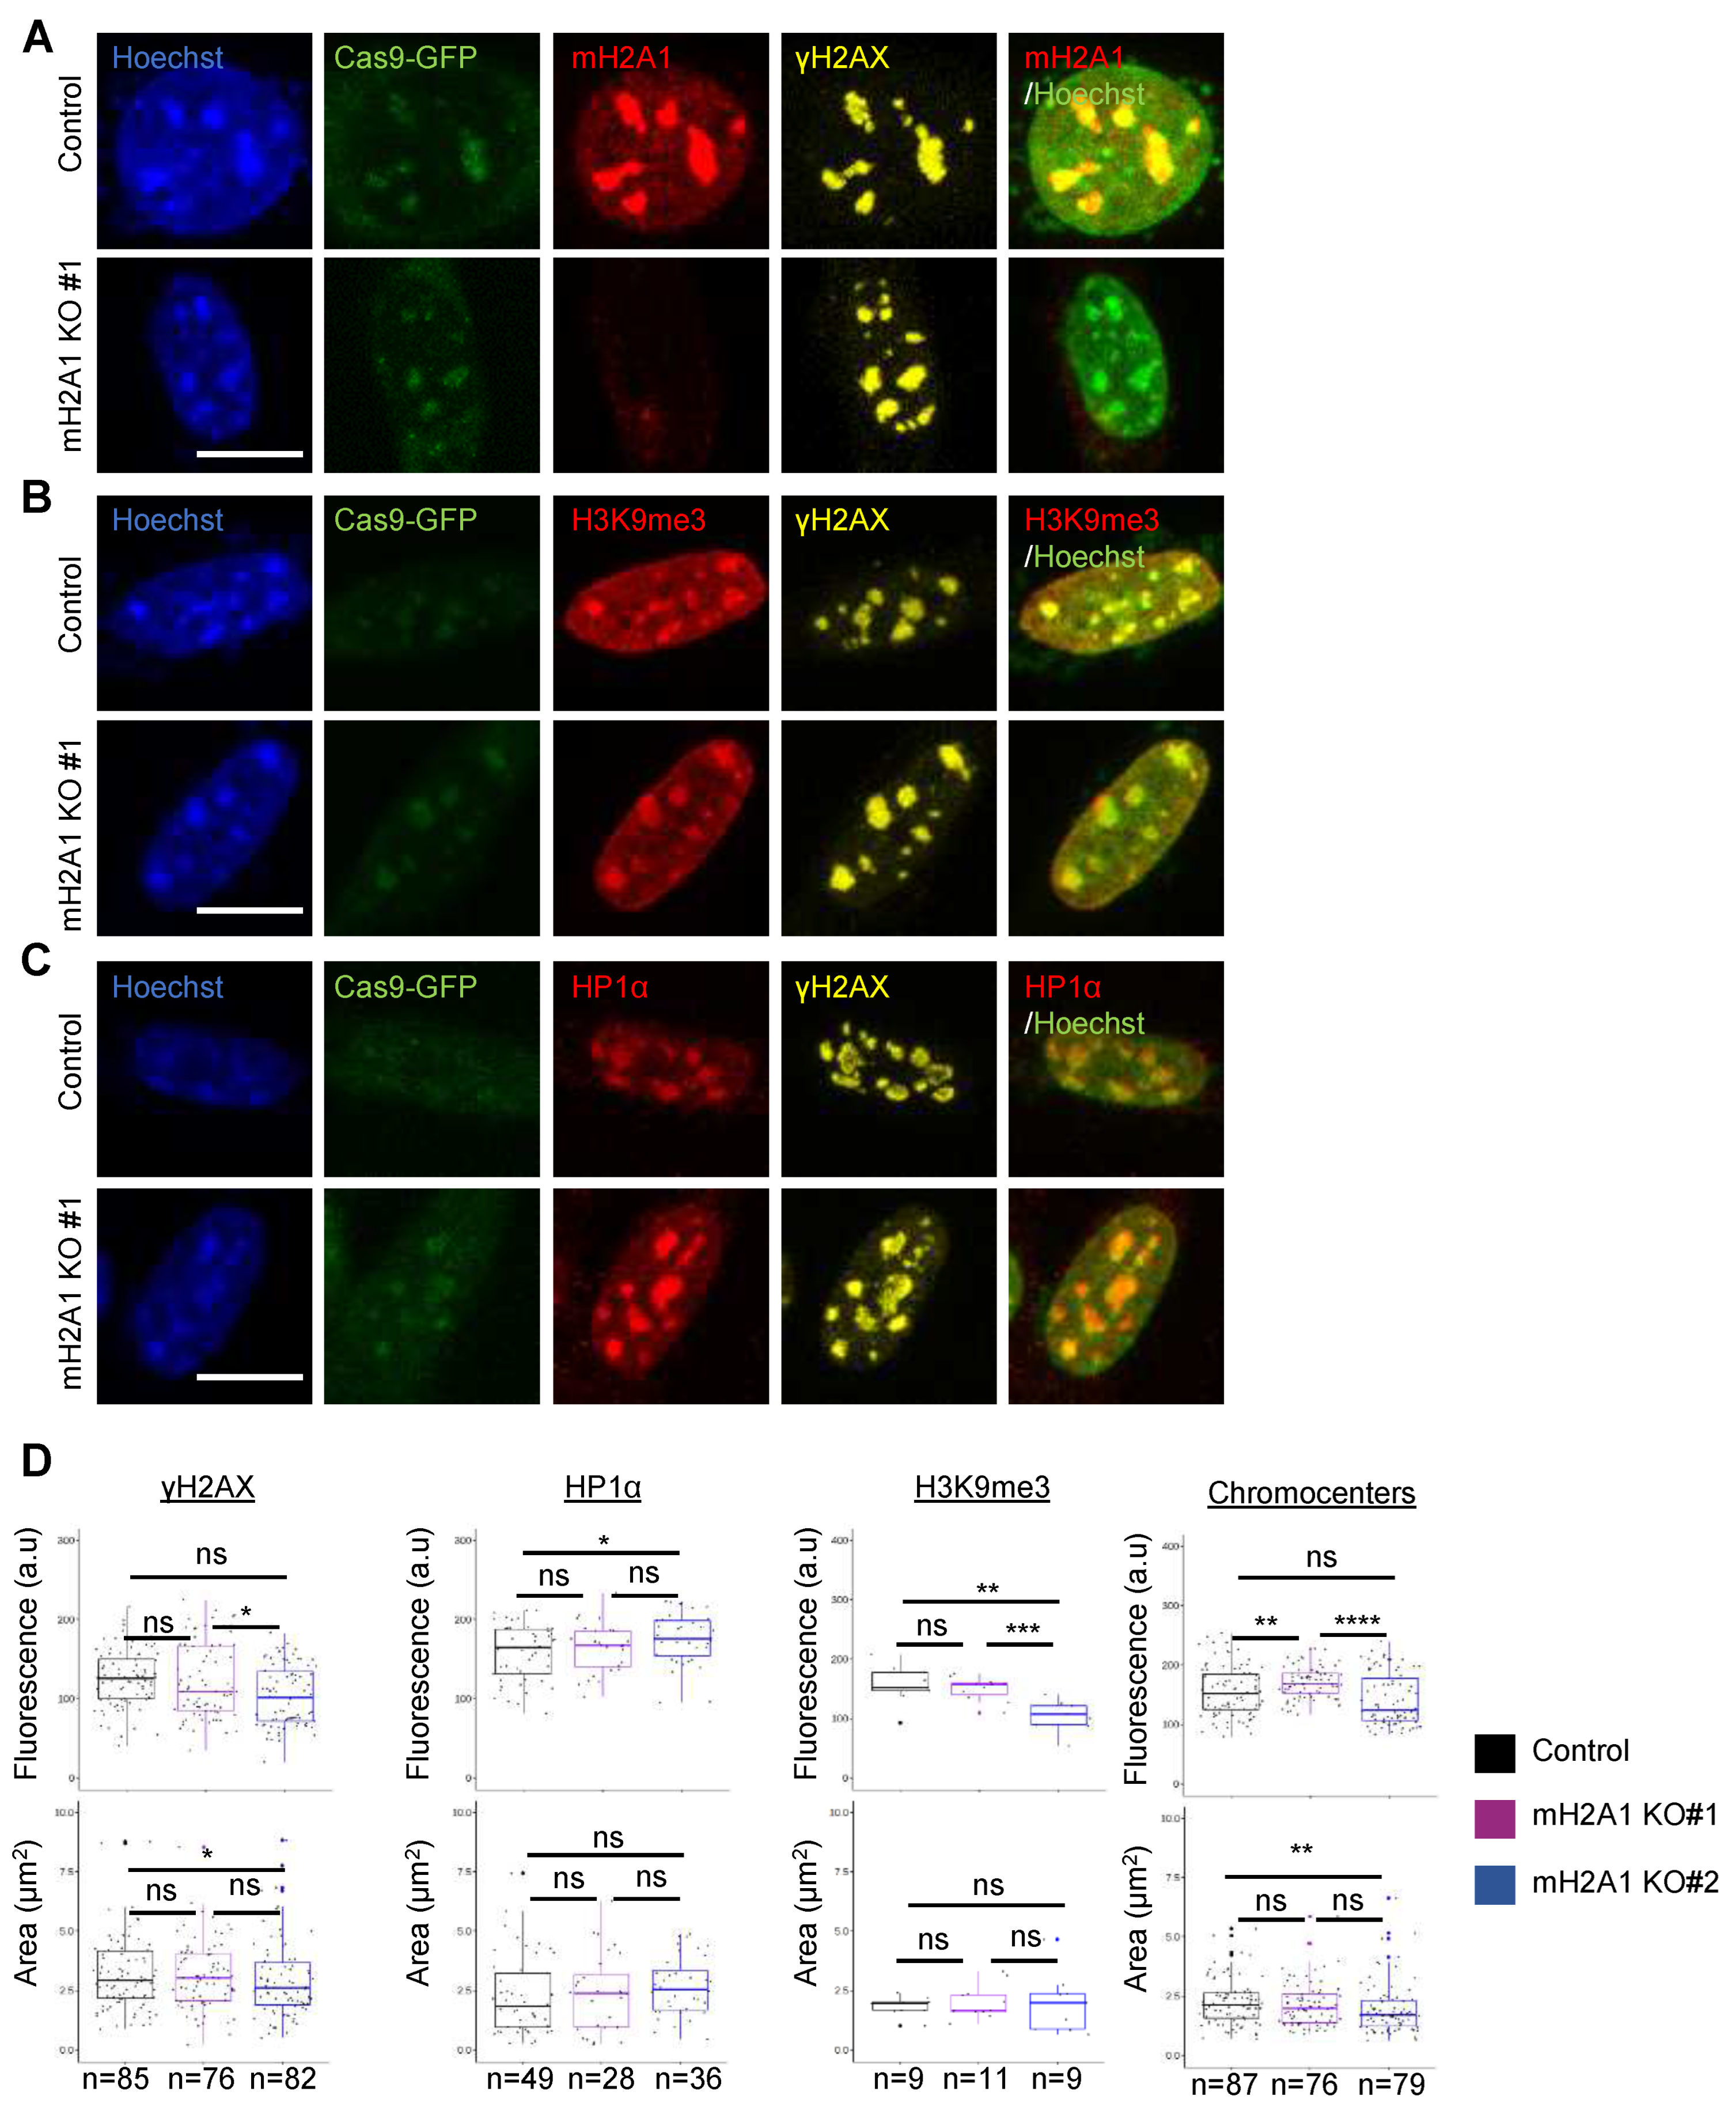
Figure 6.
mH2A1 is necessary for pericentric ncRNA upregulation upon chromocenter decondensation. Reverse transcription quantitative PCR (RT-qPCR) with total RNA isolated from unsynchronized WT or macroH2A1 KO#1 mouse L919 cells. (A) The ratio of major satellite repeat expression between cells treated with 500 nM TSA for 48h and control cells are plotted. (B) The ratio of major satellite repeat expression between cells treated with 12.5 µM etoposide for 24h and control cells are plotted. For (A) and (B) Amplified signals were normalized to GAPDH. The data represent the mean ± SD of two independent experiments.
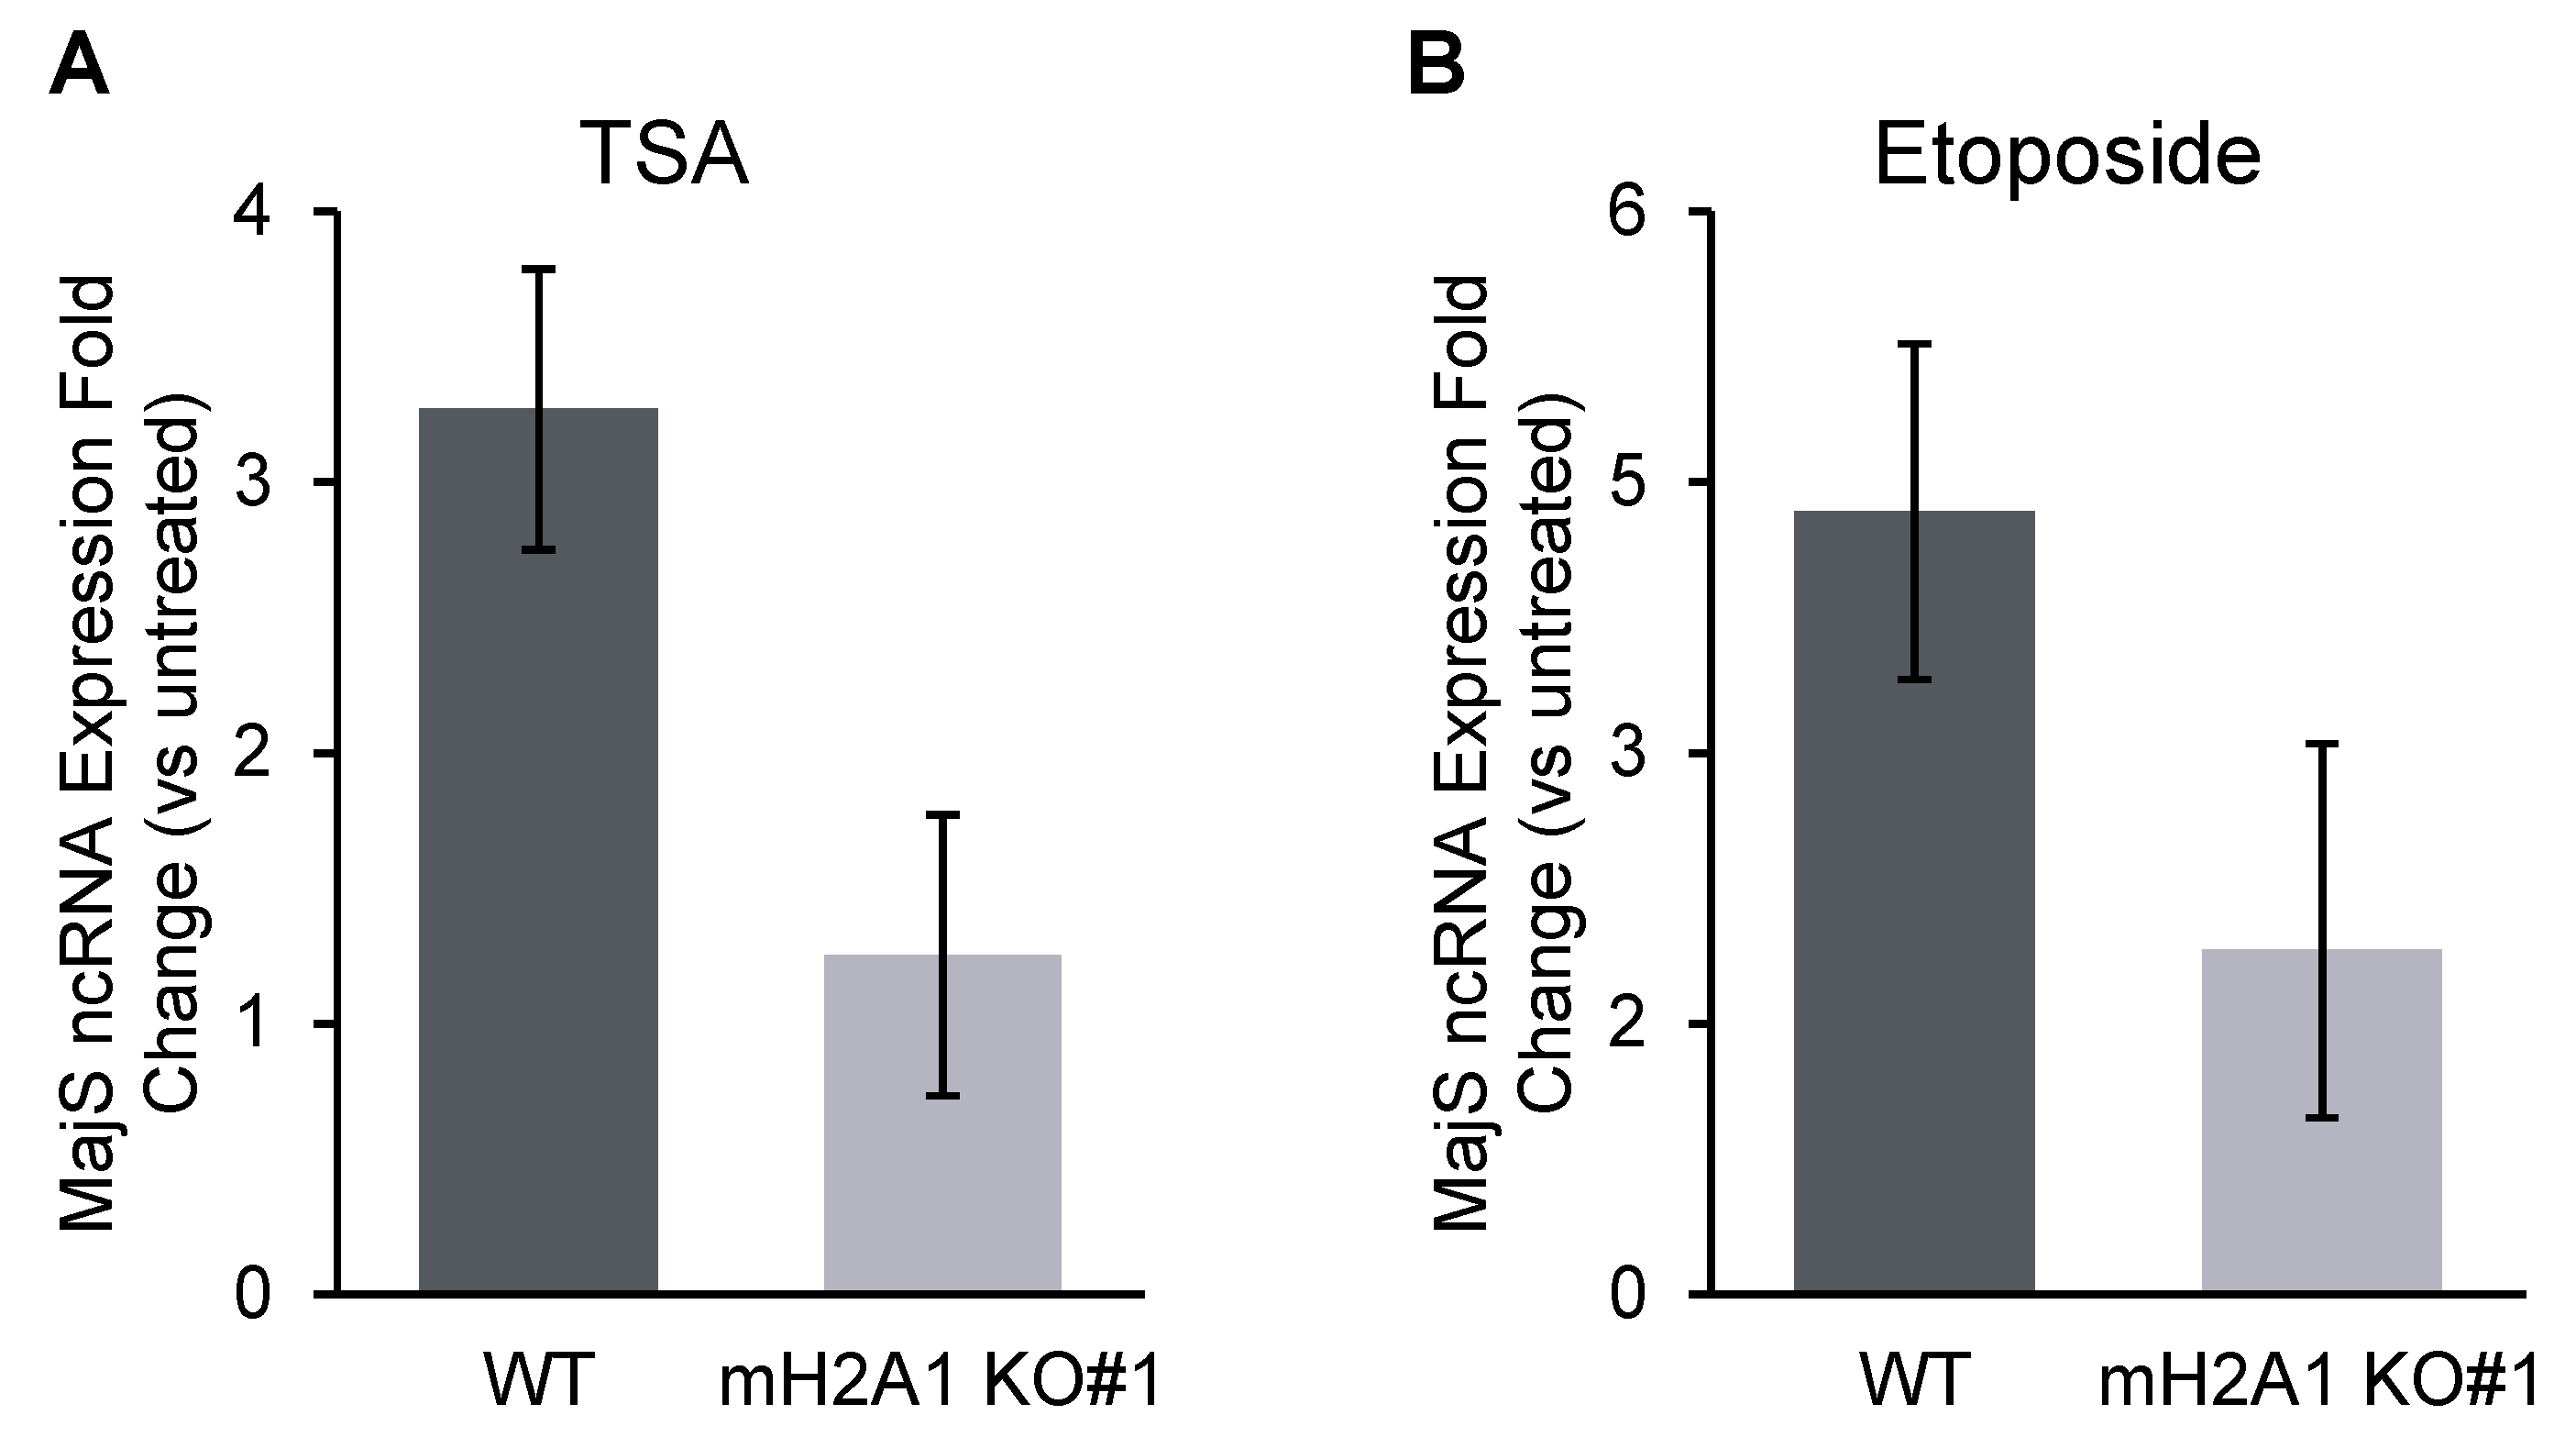
Disclaimer/Publisher’s Note: The statements, opinions and data contained in all publications are solely those of the individual author(s) and contributor(s) and not of MDPI and/or the editor(s). MDPI and/or the editor(s) disclaim responsibility for any injury to people or property resulting from any ideas, methods, instructions or products referred to in the content. |
© 2023 by the authors. Licensee MDPI, Basel, Switzerland. This article is an open access article distributed under the terms and conditions of the Creative Commons Attribution (CC BY) license (http://creativecommons.org/licenses/by/4.0/).
Copyright: This open access article is published under a Creative Commons CC BY 4.0 license, which permit the free download, distribution, and reuse, provided that the author and preprint are cited in any reuse.


