
Submitted:
17 July 2023
Posted:
18 July 2023
You are already at the latest version
Abstract
In this work, the influence of catalyst reuse and reaction time on the yield and quality of organic liquid products (OLP) obtained in a cracking pilot plant at 450 °C and 1.0 atm has been systematically investigated. The distillation of OLP produced 04 (four) distilled fractions. The quality of the biofuels was certified by physical-chemical analysis, as well as FT-IR and GC-MS analysis. The experimental results showed the feasibility of applying the spent sodium carbonate twice in catalytic cracking of vegetable oils. The physical-chemical properties (density, viscosity, acid value, saponification value, and flash point) of OLP decrease as the reaction time increases. The distillation of OLP yields 62.35% (wt.), producing green-like gasoline, kerosene, and diesel fractions rich in hydrocarbons. Therefore, biofuels-like fractions produced by distillation of OLP have a great potential for replacing partially petroleum derived fuels.
Keywords:
Palm oil
; Sodium carbonate
; Catalytic cracking
; Reused catalyst
; Reaction time
; Physical-chemistry properties
; Distillation fractions
1. Introduction
The growing world population requires high amounts of energy to improve the quality of life. Currently, fossil fuels (coal, natural gas, and oil) represent the primary sources of energy that have been serving the energy demand for modern society [1]. Approximately 19% of global energy demand comes from the transportation sector [2], which is considered the second-fastest-growing sector concerning energy consumption [3]. However, limited fossil fuel reserves and global warming make their use unsustainable and cause environmental problems related to their combustion because they emit large amounts of CO2 [1]. In this context, biofuels, which are environmentally friendly, can be an alternative source of renewable and sustainable energy to meet the global energy demand for the transport sector [1,4].
Production of biofuels consisting of hydrocarbons can be carried out by several different routes [5]. Pyrolysis, also known as thermal cracking [6,7,8,9,10] and thermal catalytic cracking (or simply, catalytic cracking) [11,12,13,14,15,16,17,18,19,20,21,22,23] is one of the routes that can be effectively applied to lipid-based feedstocks (vegetable oils and fats, i.e., raw materials such as oilseeds, lipid-rich algae, residues such as used cooking oil or animal fat, among others) to produce hydrocarbons [24]. Different systems and reaction conditions have been applied to the thermal catalytic cracking of oleaginous feedstocks. However, it has usually been performed in a fixed-bed reactor, middle temperature, atmospheric pressure and in the presence of acid catalysts [11,12,21]. The major groups of catalysts applied to thermal catalytic cracking of lipid-based feedstocks are microporous (zeolite) [25,26], mesoporous (MCM-41 and SBA-15) [22,27], macroporous (silica-alumina, alumina) [28], and composite microporous–mesoporous catalysts [29,30], and aluminum-containing mesostructured materials (Al-MCM-41, Al-SBA-15) [11]. Thermal catalytic cracking of lipids such as vegetable oils can generate the following products: gaseous biofuels, including bio-hydrocarbons C1-C5, CO and CO2; liquid biofuels, which are called bio-oil or organic liquid product (OLP); water and coke [5,31,32].
The parameters that influence the thermal catalytic cracking process of lipid-based feedstocks such as temperature, reaction time, heating rate, gas flow rate, feed rate, particle size, presence of water and catalysts and biomass composition, among others and the effect of these parameters on yield and physical-chemical property values of OLP are described in several publications [6,9,17,21,22,24,33,34,35]. The values of the physical properties of OLP are the result of its chemical composition [31], which in turn is dependent on the source of biomass and the operational conditions used in its production [9,36]. Despite the enormous amount of research done on the subject, few investigated the effect of reaction time on the quality of organic liquid products. According to Guedes et al. [36], which reviewed the parameters that influence the process, only nine articles investigated the effect of the variable reaction time on OLP quality.
Generally, thermal catalytic cracking of oleaginous feedstocks on acid catalysts like zeolite is characterized by an increase in OLP yield, which consists mainly of highly aromatic hydrocarbons in the gasoline range, while amorphous catalysts predominantly produce a more considerable amount of gases [37]. However, zeolite-type acid catalysts have the disadvantage of producing OLP with high carboxylic acid content [38,39,40]. Therefore, basic catalysts such as sodium carbonate (Na2CO3) have also been investigated in order to convert, via thermal catalytic cracking, lipid-based feedstocks into biofuels with low carboxylic acid content [13,23,33,41,42]. Junming et al. [41] cracked soybean oil with basic catalysts (Na2CO3, Al2O3, K2CO3) in the temperature range of 623 to 673 K. Basic catalysts produced biofuels with a diesel-like chemical composition with low acid values and good cold flow properties. Weber et al. [42] investigated the thermal degradation of free fatty acids and animal fat using Na2CO3 and 5% (wt.) water at 430 ± 20 °C at a pilot plant. Free fatty acids yielded 64-74% (wt.) OLP with acid values ranging from 0.64 to 0.80 mg KOH/g, while animal fat yielded 60-70% (wt.) with acid values ranging from 0.5 to 1.8 mg KOH/g. Gaseous product yields ranged from 25 to 30% (wt.) and coke yields from 4 to 6% (wt.).
Another important issue regarding the catalyst is to evaluate its recovery and reuse, as it is a way to make the process sustainable. In the literature, few studies have addressed catalyst recovery and reuse or investigated catalyst activity after repeated use [43]. However, the few studies that investigated this parameter reported promising results, with some achieving good catalytic activity after catalyst reuse, even without the regeneration step. Furthermore, the effect of catalyst reuse without regeneration on OLP yield and physical-chemical properties has not been systematically studied [44,45].
The OLP consists of oxygenated compounds and bio-hydrocarbons, which correspond to the boiling range of gasoline, aviation kerosene and diesel [5,20,31]. Some components such as oxygenated compounds promote undesirable characteristics to OLP, limiting their use as a direct substitute for liquid transport fuel [46,47,48]. Therefore, various types of distillation, including atmospheric pressure distillation, has been applied to the fractionation and upgrading of organic liquid products [9,14,19,23,42,47,49,50,51,52,53,54,55,56,57,58,59,60], in order to provide biofuels with better physical-chemical property values than those presented by the feed (OLP) or within the limits specified by regulatory agencies of each country [52]. Due to the complex composition of the OLP, its boiling temperature starts with values below 100 °C and reaches the range of 250 to 280 °C [36]. Atmospheric distillation has the advantages of being an uncomplicated and mature separation process widely used in the petrochemical industry, presenting itself as a technical and economically viable way to separate a complex composition of OLP in biofuels similar to gasoline, aviation kerosene, and diesel [5,59,60,61].
Capunitan and Capareda [47] performed fractional distillation of bio-oil under atmospheric conditions and reduced pressure (vacuum). The results showed high yields of heavy fractions and a significant reduction in humidity and acid value. The chemical composition analysis showed that the aromatic and oxygenated compounds were distributed in the light and medium fractions (15-20%), while the phenolic compounds were concentrated in the heavy fraction (53%). The distillation process was effective in separating the components and producing a heavy fraction with improved properties and composition and which can be further utilized as feedstock for future upgrading procedures or as a blending material with other liquid fuels. Ferreira et al. [53] investigated the de-acidification of OLP by laboratory-scale fractional distillation, using columns of different heights, with and without reflux, and pilot scale. Biofuels (distillates) showed yields for the laboratory-scale with and without reflux ranging from 62.15 to 76.41% (wt.) and 71.65 to 89.44% (wt.), respectively, while on the pilot scale it was of 32.68% (wt.). For pilot scale distillation experiments, the acid values of gasoline, kerosene, and light diesel fractions were 0.33, 0.42, and 0.34 mg KOH/g. The GC–MS results of the OLP showed 92.84% (area.) of bio-hydrocarbons and 7.16% (area.) of oxygenates. The fraction named light diesel presented 100% bio-hydrocarbons with an acid value of 0.34 mg KOH/g, proving the feasibility of OLP deacidification by fractional distillation.
In this context, the main objective of the present study is to investigate the thermal catalytic cracking process of palm oil in pilot scale, aiming to obtain biofuels similar to gasoline, aviation kerosene, and diesel fuel. The specific objectives are as follows: a) investigate the influence of the reaction time on the quality (physical-chemical properties) of OLP; b) investigate the influence of spent catalyst reuse without regeneration on the yield and quality (physical-chemical properties) of OLP; c) investigate the influence of the fractional distillation process of OLP on yield and quality (physical-chemical properties and chemical composition) of biofuels similar to petroleum derived fuels such as gasoline, aviation kerosene, and diesel fuel.
2. Materials and Methods
2.1. Crude palm oil
Crude palm oil (Elaeis guineensis Jacq) was provided by Engefar Ltd.a (Ananindeua-Pará-Brazil). The crude palm oil has been physical-chemically characterized as described in the literature [23]. Palm oil has also been characterized by FTIR spectroscopy and GC-MS analysis. The absorption spectrum in the infrared (IR) region of biofuels were obtained with a Shimadzu FTIR spectrometer, model Prestige 21. The liquid samples were added between the KBr plates, using pipettes to allow the light pressure of the liquid and aiming to guarantee the uniformity of the formed film. The spectrum resolution was 16 cm-1, and the scanning range was 400 to 4000 cm-1. The fatty acid composition of palm oil was determined by gas chromatography according to the official method AOCS Ce 1-62, using a CP 3800 Variam auto-injector chromatograph, equipped with Flame Ionization Detector (FID), as described by Llamas [62].
2.2. Catalyst
The fresh Sodium Carbonate (Na2CO3), commercial soda ASH Light (D50), with a purity of 98.0% (wt.) and spent Na2CO3 ware the catalysts used in this work. Solvay Chemicals International SA (Brussels, Belgium) supplied sodium carbonate, which was characterized by FTIR spectroscopy, X-Ray diffraction and thermal analysis (thermal gravimetric analysis and differential thermal analysis) as described in the literature [23]. The spent Na2CO3 was characterized only by X-Ray diffraction as described in the literature [23].
2.3. Experimental apparatus
2.3.1. Thermal catalytic cracking pilot plant
The experimental apparatus used in performing this work was a thermal catalytic cracking pilot plant, where the central equipment is the sludge bed reactor of carbon stainless steel with a capacity of 143 L. Mota et al. [23] describe in detail the pilot plant used in this study.
2.3.2. Distillation laboratory unit
The OLP was distilled into four fractions (green gasoline/Range 1, green gasoline/Range 2, green aviation kerosene, green diesel) using the experimental apparatus described by Mota et al. [23].
2.4. Experimental procedures
2.4.1. Thermal catalytic cracking
The experimental procedure of the thermal catalytic cracking of crude palm oil to obtain Organic Liquid Product was performed as described by Mota et al. [23] under the following conditions: (1) 450 °C, 1 atm and 10% (w/w) of fresh sodium carbonate as the catalyst; (2) 450 °C, 1 atm and 20% (w/w) of fresh sodium carbonate as the catalyst, and (3) 450 °C, 1 atm and 10% (w/w) of reused sodium carbonate as the catalyst.
2.4.2. Mass balance of the thermal catalytic cracking process
Eq. (1) was used to calculate the yield of the products (OLP, gas, and coke) of the cracking process:
where mPalm oil is the mass of crude palm oil (kg), mProduct is the mass of the product (kg). The mass of the gaseous products was estimated as the difference between the initial mass of oil and catalyst, and the sum of the masses of organic liquid products and coke.
2.4.3. Evaluation of reaction time
During the experimental procedure of thermal catalytic cracking (Section 2.4.1), there was a parallel study to evaluate the influence of reaction time on the quality of OLP. Thus, the experimental procedure consists in collecting samples OLP (Figure 1) at different reaction times (10, 20, 30, 40, 50, and 60 minutes) during crude palm oil cracking. Then, the OLP samples were adequately stored in 1000 ml glass bottles and amber color. Finally, the OLP containing the mixture of all OLP obtained at different reaction times were stored in a polyethylene container of 50 L.
It is important to highlight that the experimental procedure to evaluate the influence of reaction time on OLP quality was adopted for the three conditions mentioned in Section 2.4.1.
2.4.4. Evaluation of catalyst reuse
In order to evaluate the influence of spent sodium carbonate reuse on the yield and quality of the OLP obtained, it was used for a consecutive cracking experiment without regeneration, which was called reused sodium carbonate (RSC).
According to Section 2.4.1, an amount equivalent to 5 kg of catalyst (sodium carbonate) was used in the first cracking experiment. Therefore, the experimental procedure for the Evaluation of catalyst reuse initially consisted of removing the catalyst from the inside of the reactor. Then, the spent catalyst from the first cracking process was properly collected (Figure 2a) and was impregnated with a cracking reaction by-product, coke, in the form of a heterogeneous mixture, which was called the remaining mixture (Na2CO3 + coke). In order to significantly reduce the granulometry of the mixture, as shown in Figure 2b, it was subjected to a comminution process in a ball mill (CIMAQS.S.A.IND.ECOM, Series Nº 005), which had a diameter ranging from 1.55 to 3.97 cm. After comminution, the remaining mixture was dried in a preheated oven and kept at 150 °C for 30 min. After drying, the residual mixture, now called reused sodium carbonate, was removed from the stove and immediately weighed and packed in plastic bags with 500 g of RSC.
With the RSC accurately weighed and packed, it was inserted into the reactor. Then, the experimental procedure of the thermal catalytic cracking of crude palm oil to obtain Organic Liquid Product was performed as described by Mota et al. [23] under the following conditions: 450 °C, 1 atm, and 10% (w/w) of reused sodium carbonate as the catalyst.
2.4.5. Distillation of the OLP
The OLP (60 min) has been submitted to laboratory-scale fractional distillation using a Vigreux Column with three stages. To obtain four fractions, the OLP was distilled within the following distillation temperature ranges: <90 °C (green gasoline/Range 1); 90-160 °C (green gasoline/Range 2); 160-245 °C (green aviation kerosene); 245-340 °C (green diesel). The distillation temperature intervals were reported to give bio-hydrocarbon fractions having similar properties with particular petroleum products.
The experimental procedure of fractional distillation of OLP consisted of a batch, aiming to obtain some of the fractions previously fixed for the analysis of physical-chemical characterization and composition.
The OLP was heated gradually to enter the first distillation temperature range (DT<90 °C). Then, the distilled fraction was collected in a separation funnel with 250 ml capacity and stored in amber glass bottles. After obtaining the first distilled fraction, the temperature controller of the heating mantle was adjusted to achieve the second distillation range (90-160 °C). The same procedure was done for obtaining the two remaining fractions (160-245 °C and 245-340 °C). At the end of the experimental procedure, there were four distilled fractions and a bottoms product, as shown in Figure 3.
2.4.6. Mass balance of the distillation process
It was applied the Eq. (2) to find out the yield of the distilled fractions (green gasoline/Range 1, green gasoline/Range 2, green aviation kerosene, and green diesel), as well as bottoms products.
where mDF is the mass of distilled fraction (g), and mOLP is the mass of the organic liquid product (g).
2.5. Characterization of the OLP and distilled fractions
2.5.1. Physical-chemical properties
OLP has been physical–chemically characterized according to AOCS and ASTM official methods for Acid Value (AOCS Cd 3d-63), Saponification Value (AOCS Cd 3-25), Specific Gravity at 20 °C (ASTM D854), Refractive Index (AOCS Cc 7-25), Kinematics Viscosity at 40 °C (ASTM D446 and ASTM D515), Flash Point (ASTM D93), and Corrosiveness to Copper (ASTM D130).
Distilled fractions have been characterized with the same official methods adopted for the physical-chemical characterization of OLP plus the following official methods for Content of FFA (AOCS Ca 5a-40), carbon residue (ASTM D4530), and Ester value, which is the difference between the saponification value and the acid value as described by Paquot [63].
2.5.2. FTIR spectroscopy
The OLP and distilled fractions have been analyzed by FTIR Spectroscopy using a spectrometer (Shimadzu/Model: Prestige 21). The absorbance spectrum were obtained within the interval 4000 – 400 cm−1 and resolution of 16 cm−1 with the aid of a KBr Window. The samples were dropped onto the KBr surfaces by using micropipettes in order to spread the liquid to produce a uniform layer.
2.5.3. Distillation curve of the distilled fractions
The distillation curves of the distilled fractions have been obtained according to the official method (ABNT/NBR 9619) using an automatic distillation apparatus (TANAKA, Model: AD6).
2.5.4. GC–MS analysis of the distilled fractions
The GC–MS analysis of the distilled fractions was performed using a gas chromatograph coupled to a mass spectrometer (Shimadzu, Model: GCMS-QP2010 Plus), as described by Mota et al. [23]. The relative content of compounds in the samples of distilled fractions was calculated by the ratio of its peak area to total peak area of the GC–MS spectrum.
3. Results and discussion
3.1. GC-MS Analysis of Crude Palm Oil
Lhamas [62] performed GC-MS analysis of the same crude palm oil used in the present study and noted that it consists mainly of oleic acid (43.12%) followed by palmitic (36.62%), linoleic (12.93%) and stearic (4.92%), while lauric (0.46%), myristic (0.86%), palmitoleic (0.14%), linolenic (0.26%) and arachidic (0.35%) acids showed trace amounts. According to Lhamas [62], the result of the composition of crude palm oil is in agreement with the literature.
3.2. X-ray diffraction
In order to investigate the influence of the reuse of sodium carbonate (Na2CO3) on the yield and quality of biofuels obtained from the thermal catalytic cracking reaction of crude palm oil at a pilot scale, an X-ray diffraction analysis was carried out for the sodium carbonate after each cracking reaction, and the results are shown in Figure 4. The results obtained for fresh sodium carbonate are discussed in detail by Mota et al. [23] According to Figure 4, the predominant phases in the composition of fresh sodium carbonate are natrite and thermonatrite corresponding to the respective file catalogs PDF 00-037-0451 and PDF 00-08-0448, as described in the literature [64]. For reused sodium carbonate after a cracking reaction, the compounds were identified according to the 2θ position for the highest intensity peaks: 100% (32.40 °) with spacing of 2.64; 67% (29.01 °) with spacing of 3.07 and 37% (36.74 °) with spacing of 2.44 according to the file catalogs PDF 00-029-1447, corresponding to the hydrated sodium hydrogen carbonate compound (Trona). This result shows the effect of the cracking reaction of crude palm oil on the surface and structural and compositional reorganization of the catalyst. Besides, there was a change in the file catalogs of reused sodium carbonate after a cracking process when compared to fresh sodium carbonate, resulting from the hydration of fresh sodium carbonate due to the production of water molecules during the secondary cracking reaction [64,65,66,67,68,69].
In order to understand the number of reuse cycles of the sodium carbonate, an analysis of the catalyst sample (sodium carbonate plus coke) from the second catalytic cracking reaction was carried out. In this sample, the compounds Natrite, Sodium Stearate, Sodium Phosphate, Dimethylglyoxime, and Potassium Acetate were identified, according to the file catalogs PDF 00-037-0451, PDF 00-002-0016, PDF 00-003-0394, PDF 00-003-0436 and PDF 00-001-0039. Except for the natrite phase, the presence of these compounds indicates that they are products from numerous parallel reactions, which occur during the main reaction (cracking of triglycerides), where these compounds are deposited on the surface of the catalyst. The presence of such compounds may be related to the fact that crude palm oil was used, which did not undergo refining processes such as degumming and neutralization. Also, the diffractogram (C) of Figure 4 shows a range from 0 to 25 ° according to the 2θ position, which is characterized by the absence of crystallographic phases, indicating that there was a deposition of amorphous carbon-based compounds, which are present in the coke formed during the cracking process. This results in a decrease in the catalytic activity of sodium carbonate as it is reused without a previous regeneration step.
Therefore, the importance of the results obtained regarding the reuse of sodium carbonate without any regeneration step as a catalyst in the cracking process of vegetable oils is emphasized, since, despite the reduction in its catalytic activity, it remains with the crystalline phase that characterizes it, which is the natrite phase. This even indicates that sodium carbonate can be reused more than once in the cracking process.
3.3. Influence of catalyst reuse on OLP yield
In this study, the influence of catalyst reuse on OLP yield is assessed by comparing the yield obtained using the fresh catalyst, and the yield obtained using spent catalyst without regeneration for a consecutive cracking experiment, that is, a reuse cycle. As shown in Table 1, there was an increase in gas yield, to the detriment of a reduction in OLP and coke yield when 10% (w/w) of RSC was used, indicating that there was a reduction in catalytic performance in the first cycle of the spent catalyst without regeneration. The reduction in catalytic performance of the catalyst can be explained by the impregnation of coke in the catalyst, as corroborated by the X-ray diffraction analysis (Figure 4), increasing the initial cracking time and process time of the experiment that used 10% (w/w) of reused sodium carbonate when compared to the same parameters of the experiment that used 10% (w/w) of fresh sodium carbonate. Karnjanakom et al. [70] compared the long-term stability of catalysts (2.5 wt% Cu/γ-Al2O3, 2.5 wt% Fe/γ-Al2O3, and 2.5 wt% Zn/γ-Al2O3) after regeneration and without regeneration by reusing them for up to 4 cycles and report that there was a significant reduction in catalytic performance in each spent catalyst cycle without regeneration due to deposition of coke in the catalyst, which can lead to coverage of active sites and pore blockage in the catalyst. Dandik and Aksoy [71] cracked residual sunflower oil in the presence of different concentrations of fresh sodium carbonate, obtaining yields in OLP that varied from 19 to 48%.
Therefore, the results of OLP yield obtained in the present study, from a cycle of reuse of sodium carbonate without regeneration, are consistent with the literature, and the 10% (w/w) RSC is a promising catalyst for the thermal catalytic cracking of palm oil, which can potentially be applied in a practical process and significantly reduce any costs associated with a step of regenerating sodium carbonate.
3.4. Influence of catalyst reuse on OLP quality
3.4.1. Physical-chemical properties
The influence of catalyst reuse on the quality of the OLP is assessed by comparing the physical-chemical properties of the OLP obtained using the fresh catalyst, and the physical-chemical properties of the OLP obtained using the spent catalyst without regeneration for a consecutive cracking experiment, that is, a reuse cycle. According to Table 2, the thermal catalytic cracking of crude palm oil with 10% (w / w) of fresh sodium carbonate produced an OLP with physical-chemical properties such as kinematic viscosity and corrosivity to copper within limits established by the resolution ANP Nº 65 for petroleum-derived diesel. In contrast, other properties such as specific gravity and flash point were significantly different from the limits established for petroleum diesel. When comparing the results of this experiment with data available in the literature, it can be emphasized that properties of the OLP such as the acid value, which corresponds to 8.98 mg KOH/g, presented a satisfactory result, since studies on thermal cracking and thermal catalytic of vegetable oils reached values much higher than those found in the present study. Seifi and Sadrameli [6] reached acid values of OLPs that varied between 66.16 and 123.41 mg KOH/g for experiments involving thermal cracking of sunflower oil. Xu et al. [19] obtained an OLP with an acid value of 69.30 mg KOH/g for the thermal catalytic cracking of soybean oil using Na2CO3 as a catalyst. Prado and Antoniosi Filho [72] performed thermal and thermal catalytic cracking of soybean oil using bauxite as a catalyst and obtained OLPs with acid values ranging from 120-139 mg KOH/g and 44-91 mg KOH/g, respectively.
Table 2 also indicates that even after a cycle of reuse, spent sodium carbonate without regeneration continues to show catalytic activity for the thermal catalytic cracking reactions, despite showing that the thermal catalytic cracking with 10% (w/w) of spent sodium carbonate without regeneration produced an OLP with physical-chemical characteristics very different from those determined for the OLP obtained with fresh sodium carbonate. The value of the corrosivity property to copper is the only one that is within limits established by ANP Nº 65 for petroleum-derived diesel. Even so, the OLP obtained with 10% (w/w) RSC still manages to reach very satisfactory values of physical-chemical properties, mainly concerning its acid value, equal to 39 mg KOH/g, which is lower than the values shown in the literature, as explained above. These facts not only confirm the catalytic activity of the catalyst for the thermal catalytic cracking reactions but also raise the importance of the present study since most of the experiments carried out on the technological route for cracking vegetable oils were developed on a scale of bench or semi-pilot. Therefore, the reuse of spent sodium carbonate without regeneration was shown to be feasible when comparing the results presented in Table 2 with those obtained in thermal cracking and thermal catalytic reactions reported in the literature, even showing quite promising concerning some catalysts typically employed in the cracking process.
3.4.2. FTIR spectroscopy
Both the thermal catalytic cracking experiment of crude palm oil using 10% (w/w) fresh sodium carbonate and that experiment that reused it without any regeneration step were successful in the cracking process, since, in both experiments, the breakdown of triglyceride molecules into oxygenated compounds (carboxylic acids, fatty alcohols, and ketones) and, mainly, bio-hydrocarbons such as alkanes and alkenes was confirmed.
Figure 5 shows the results of the FTIR analysis of crude palm oil and OLPs produced from the thermal catalytic cracking of crude palm oil using 10% (w/w) fresh sodium carbonate and 10% (w/w) of reused sodium carbonate as catalysts, both at 450 °C, 1 atm and at a pilot scale. The identification of the bands was performed according to a previous study [23]. The qualitative composition of crude palm oil determined by FTIR analysis was discussed in detail by Mota et al. [23], in such a way that through the results obtained, it is possible to ensure that the spectrum of the analyzed oil is a typical spectrum of vegetable oils.
The comparison of the FTIR spectrum of crude palm oil with the OLP spectrum shows a displacement or disappearance of some bands, mainly those corresponding to the chemical functions of triglyceride esters such as the band 1748 cm-1 corresponding to the C=O bond, group that appears in the range of 1750–1735 cm-1 for simple aliphatic esters, corroborated by the bands 1259 cm-1 referring to long-chain acid methyl esters, which appear close to the band 1250 cm-1, in addition to the band 1033 cm-1 for secondary alcohol esters [74,75]. The analysis of the FTIR spectrum of OLPs shows that they have very similar or similar bands, such as the bands 3425 cm-1 and 3419 cm-1 corresponding to axial deformation related to alcohols and phenols, characteristic of the O-H bond [14,23,51,53,74,75]. Also, the OLP spectrum show characteristic bands of alkenes at 3078 cm-1, in addition to saturated hydrocarbons, such as the characteristic bands of vibration of axial deformation of C-H, in the region of 3,000 to 2,840 cm-1, corresponding to the function of hydrocarbons, more precisely of normal alkanes, and associated with these bands is the presence of the band 1375 cm-1 referring to C-H angular deformation vibrations of methyl groups, which further corroborates the presence of saturated alkanes (normal paraffins) in the OLPs produced [14,23,51,53,74,75]. In parallel, both OLPs have peaks between 995 and 905 cm-1, which are characteristic of an angular deformation outside the plane of the C-H bonds, indicating the presence of alkenes (olefins) [14,23,51,53,74,75]. It can also be highlighted the presence of bands between 720 and 660 cm-1 with peaks characteristic of an angular deformation outside the plane of the C-H bonds in the methylene group (CH2), indicating the presence of aromatic compounds [74,75].
According to Figure 5, the FTIR spectrum of the OLPs also show that they reflect with the absorption of the identified bands, the results of the physical-chemical analysis, especially concerning acid value, since the OLP obtained with reused sodium carbonate showed a higher acid value than that obtained with fresh sodium carbonate, confirming the presence of carboxylic acids and ketones in these OLPs represented by the bands characteristic of this function, that is, bands of intense axial deformation, characteristic of the carbonyl groups (C=O), with peaks at 1707 and 1716 cm-1 [14,23,51,53,74,75]. It is important to note that this functional group appears as a powerful band for the group C=O in the range of 1730-1700 cm-1 for simple aliphatic carboxylic acids in the dimeric form. The presence of carboxylic acids is confirmed by the appearance of the O-H bond, which appears in the spectrum as a very wide band that extends from 3400 to 2400 cm-1. This band has a characteristic peak close to or over 3000 cm-1 [74,75].
3.5. Influence of reaction time on the physical-chemical properties of the OLP
3.5.1. Physical-chemical properties
In Figure 6, Figure 7, Figure 8, Figure 9 and Figure 10, the reaction time significantly influenced the values of the physical-chemical properties of the OLPs during cracking crude palm oil. Through the operational conditions adopted in this study, as the reaction time increased from 0 to 60 min, these values of the physical-chemical properties reduced sharply for the three conditions employed. This fact can be explained by the breakdown of palm oil molecules due to prolonged exposure to high temperatures and the effect of the catalyst, resulting in products with lower molecular weight than palm oil. Zhao et al. [17] investigated the catalytic cracking of carinata oil in a continuous flow fixed-bed reactor at 450 °C, with a time of approximately 60 min. The results show that carinata oil was converted to bio-hydrocarbons with molecules smaller than those of crude carinata oil, which resulted in lower density and viscosity of the biofuel.
The results presented in Figure 6, Figure 7, Figure 8, Figure 9 and Figure 10 also show that most of the values of the physical-chemical properties of OLP significantly reduced between 10 and 30 min of cracking, remaining practically constant from 30 min. The reaction time is the primary factor in ensuring a catalytic process efficiently [76]. If the reaction time exceeds the optimum time, the majority of the components present in the liquid products will further decompose into other low molecular weight products [77]. It is added to this the fact that the longer the reaction time, the higher the process cost [78].
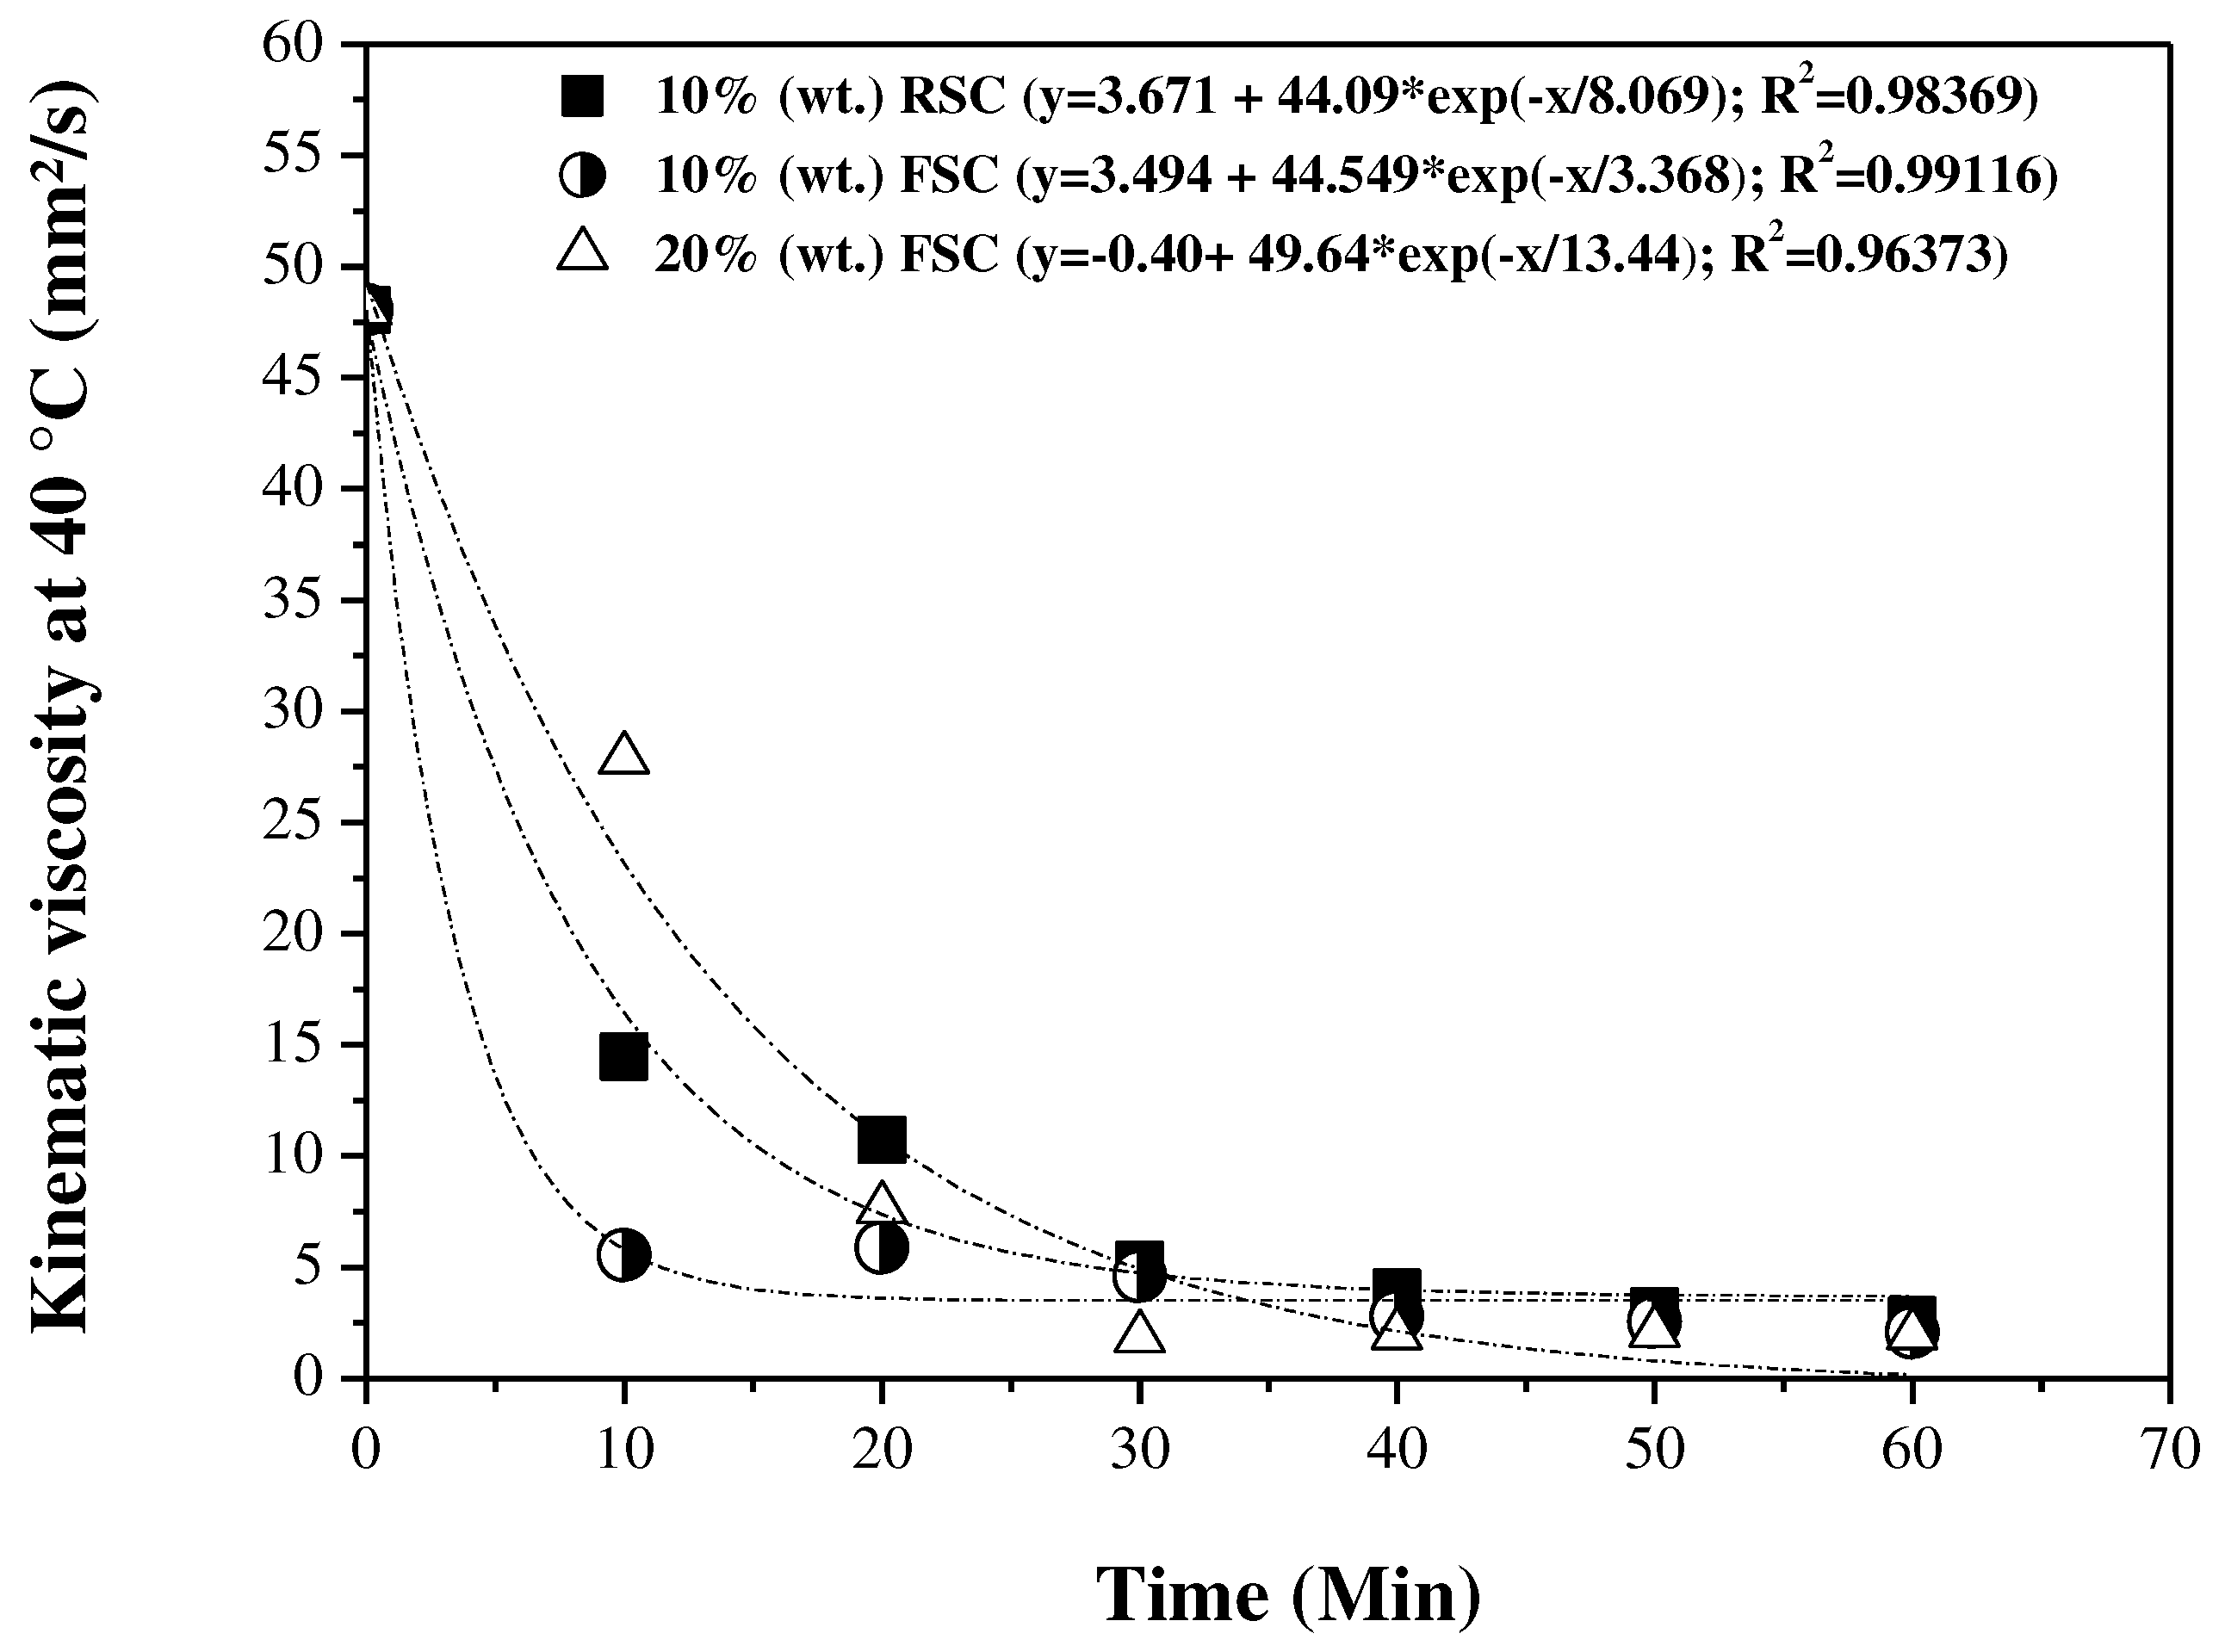
Figure 7 shows that for thermal catalytic cracking experiments of crude palm oil using 10% (w/w) fresh sodium carbonate, 20% (w/w) fresh sodium carbonate and 10% (w/w) of reused sodium carbonate, the values of the kinematic viscosity of the OLPs reduce significantly in the first 10 and 20 minutes of the process. However, in this period, none of the three experiments managed to produce an OLP with kinematic viscosity values within limits established by ANP Nº 65 (Diesel S10) [73] or ASTM D975 (Diesel Nº 1-D S15) [79], which are 2-4.5 mm²/s and 1.3-2.4 mm²/s, respectively. After 30 min, the OLP kinematic viscosity values from the experiments that used 10% (w/w) fresh sodium carbonate and 10% (w/w) reused sodium carbonate continued to slightly decrease, in such a way that after 40 min both experiments produce OLPs with values within limits established by ANP N° 65 (Diesel S10) [73]. On the other hand, after 30 min, for the experiment that used 20% (w/w) of fresh sodium carbonate, the OLP kinematic viscosity values are little changed, so that the kinematic viscosity values vary from 1.82 to 2.05 mm²/s in the period of 30 to 60 min of process. Therefore, the kinematic viscosity values of these OLPs are within limits established by ASTM D975 (Diesel Nº 1-D S15) [79].
The comparison between the experiments carried out with 10% (w/w) of fresh sodium carbonate and 10% (w/w) of reused sodium carbonate shows that the first promotes a more significant reduction in the kinematic viscosity values in the first 20 min than the second. This behavior can be explained due to the reduction in the catalytic activity of the reused sodium carbonate due to its impregnation with residual material (coke) on the catalyst surface, leading to the coverage of the active sites and the blocking of the catalyst pores, as reported by Karnjanakom et al. [70]. The result from the reduction in catalytic activity is a significant difference between the two experiments concerning the OLPs specific gravity values, as shown in Figure 6, and in the amount of oxygenated compounds formed during the cracking reaction [65,66,67,68,69], as Figure 8, leading to higher values of kinematic viscosity, higher values of acid value and higher values of specific gravity in the first 20 minutes of the process.
Figure 7.
Kinematic viscosity at 40 °C of OLP samples as a function of cracking time.
A more detailed analysis of Figure 8 shows that the carboxylic acids (free fatty acids) present in the crude palm oil underwent a deoxygenation process in the period of 0 to 10 min of reaction, resulting in a significant reduction of the acid value in the first 10 min. This fact is due to the direct and immediate influence of the use of 20% (w/w) of fresh sodium carbonate. Sodium carbonate has a significant effect on the deoxygenation stage of the carboxylic acids, causing a significant reduction in the content of oxygenated compounds (especially carboxylic acids) or acid phase, consequently reducing the acid value of OLP [13]. Between 10 and 40 min of reaction, the values of acid value presented a small variation and did not exceed 1.5 mg KOH/g, remaining constant from 40 min.
Figure 8.
Acid value of OLP samples as a function of cracking time.
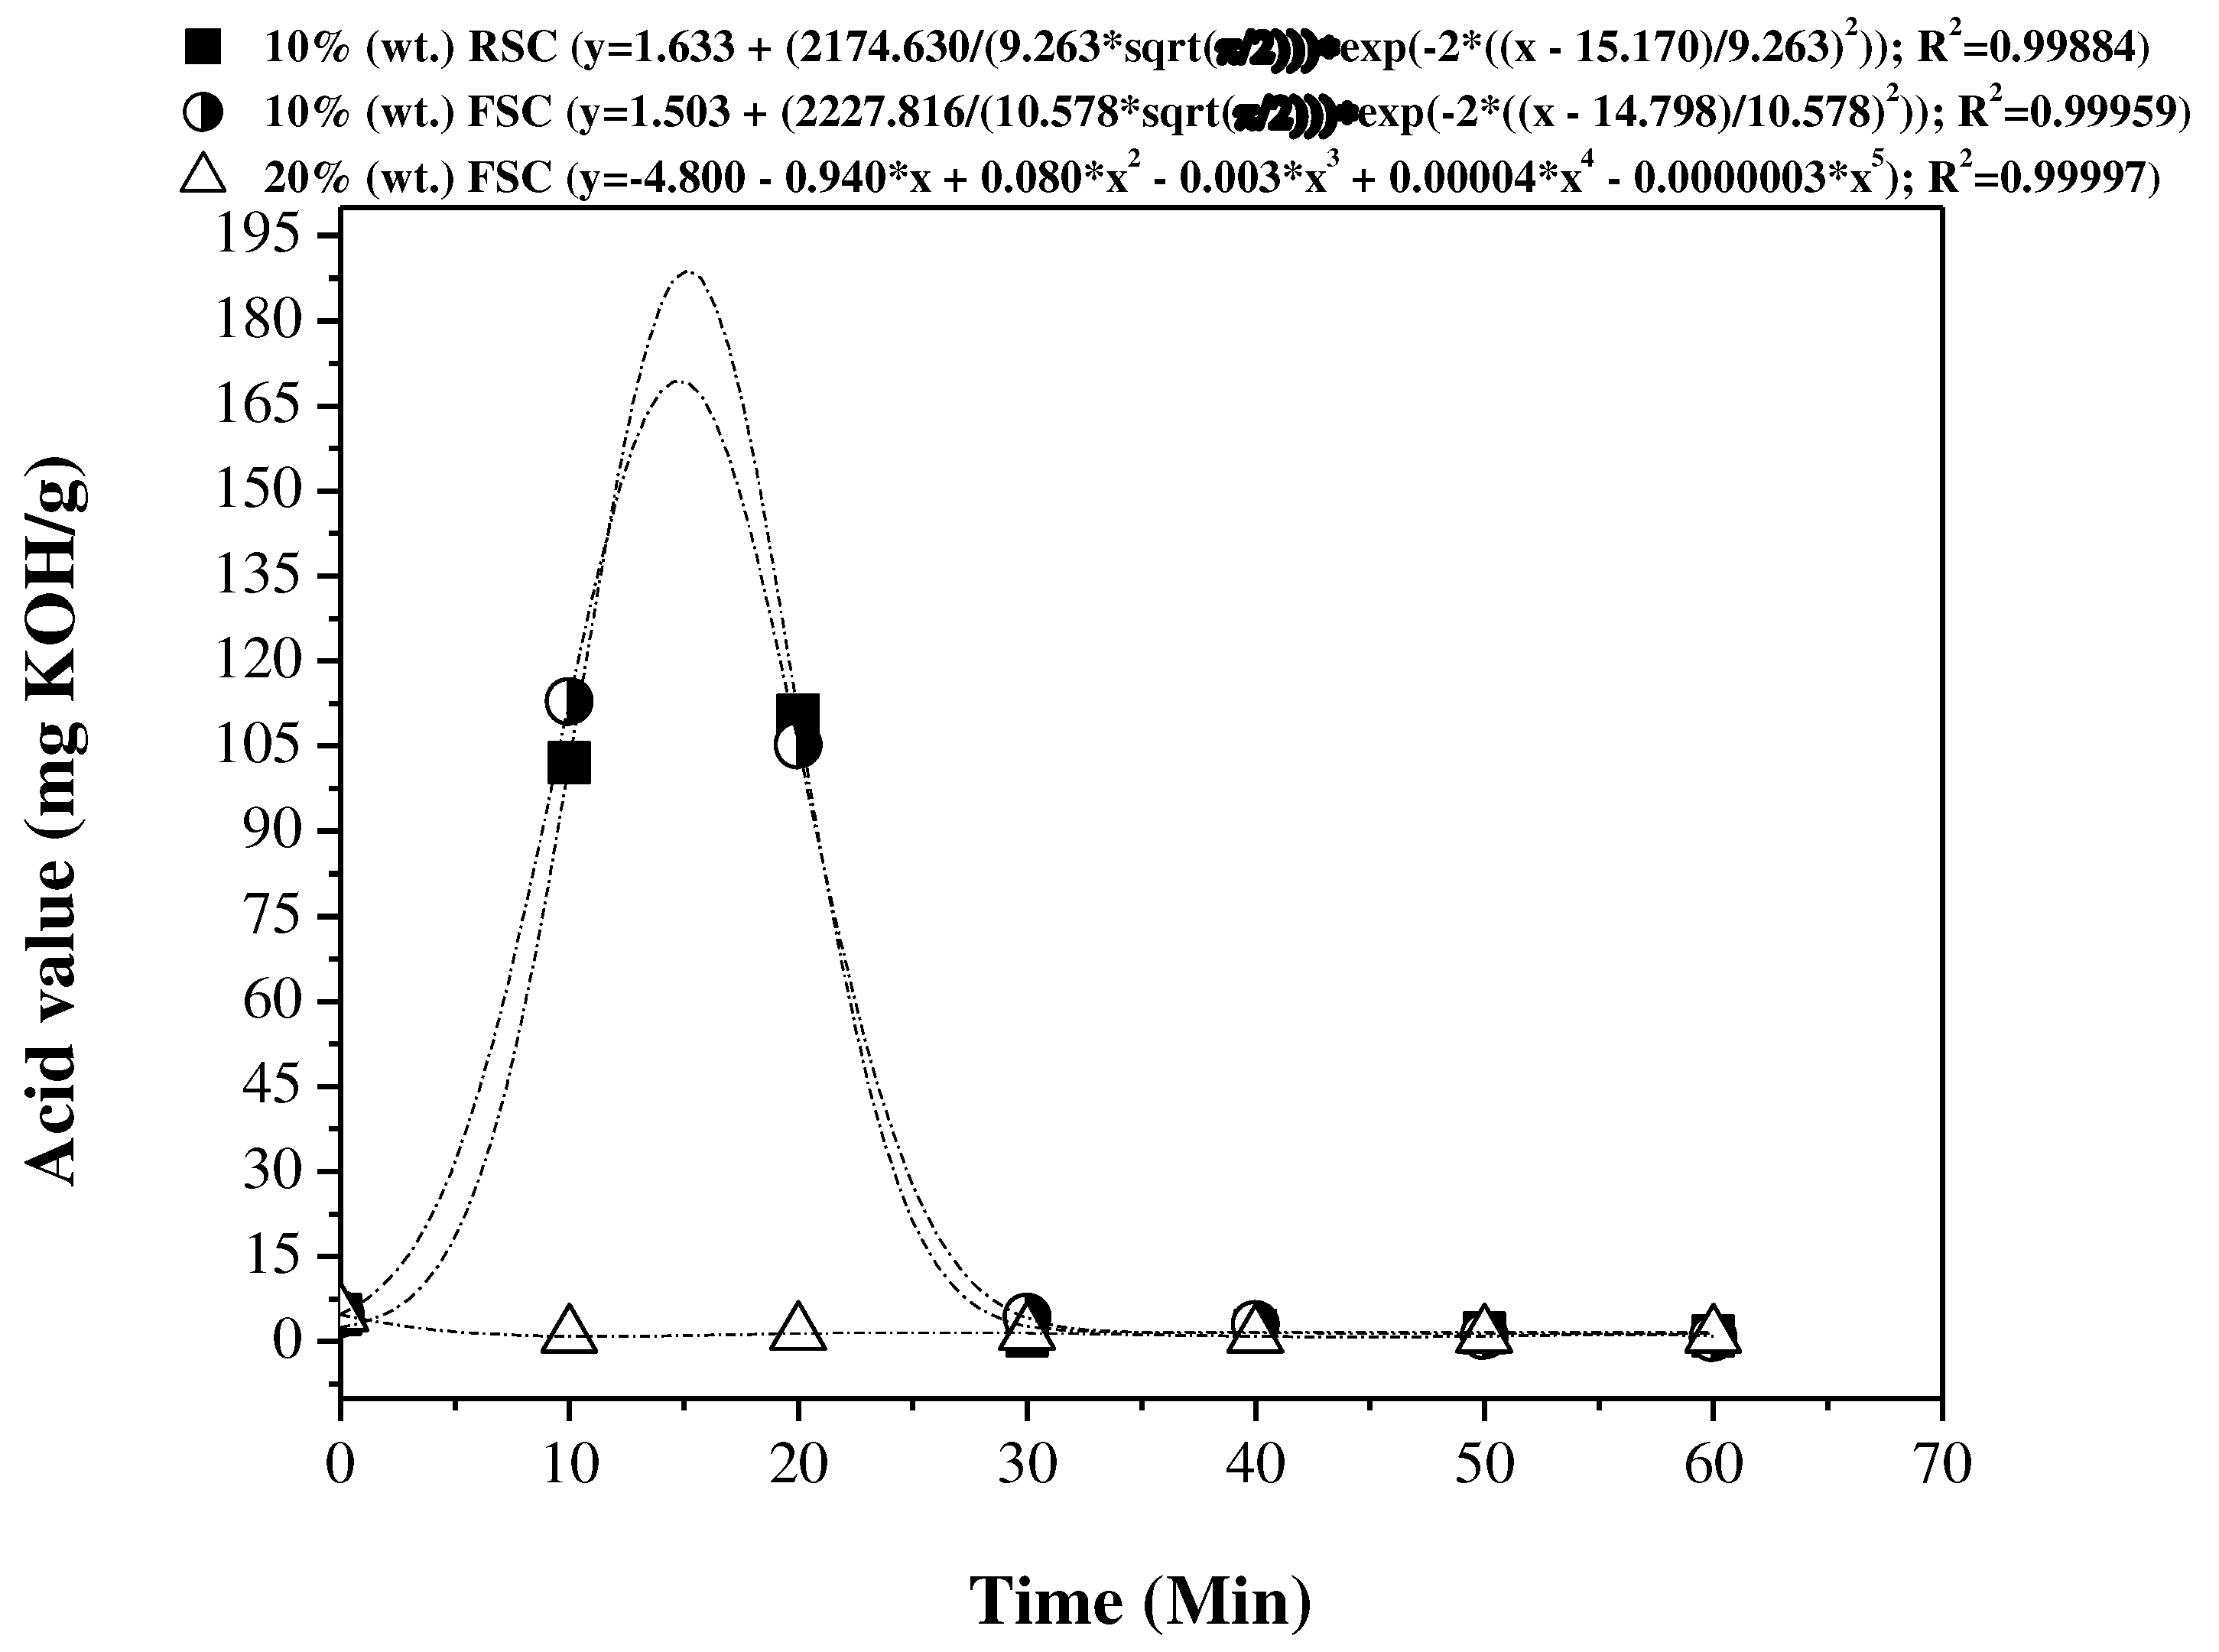
The experiments that used 10% (w/w) of fresh sodium carbonate and 10% (w/w) of reused sodium carbonate did not produce the same effect on the acid value of their OLPs when compared with the OLPs of the experiment that used 20% (w/w) of fresh sodium carbonate. According to Figure 8, in the first 20 min there was an increase in the acid values, probably due to the breakdown of the crude palm oil molecules and subsequently formation of compounds with predominance of carboxyl’s [66,67,68,69]. Only after 30 min of reaction, there is a decrease in the acid values mentioned above, in such a way that between 30 and 60 min of reaction, the acid values vary slightly and do not exceed 2.75 mg KOH/g for OLP obtained with 10% (w/w) FSC and 1.92 mg KOH/g for OLP obtained with 10% (w/w) RSC. This behavior in the period of 30 to 60 min is the result of the deoxygenation of carbonyls and carboxyl’s from the primary cracking of triglycerides, giving rise to gaseous products, paraffin, and olefins of long and short chains, CO, CO2, water and alcohols [66,67,68,69]. In this context, it is essential to highlight the performance of reused sodium carbonate, because even without any regeneration stage it produced an OLP with a lower acid value than that obtained for the OLP from the cracking of palm oil with fresh sodium carbonate and in the same percentage. This results yet another parameter that indicates the excellent catalytic activity of sodium carbonate after a reuse cycle compared to fresh sodium carbonate.
In parallel, Figure 9 shows that in the first 10 min of reaction, there was no significant change in the values of the saponification value for the OLP obtained with 20% (w/w) of FSC. Differently, in the period of 10 to 20 min, there was a significant reduction of the saponification value, which did not show significant alterations after 20 min of cracking. According to Canapi et al. [80], the saponification value is the number of milligrams of potassium hydroxide required to neutralize the free fatty acid and saponify the esters in one gram of fat. In other words, the saponification value informs the presence of carboxylic acids in the form of free fatty acids and bound fatty acids, i.e., in the form of esters. Therefore, the results indicate that there was a reaction of cracking (primary cracking followed by secondary cracking) of palm oil in the period of 10 to 20 min of reaction, promoting a significant reduction of the saponification value in that period. According to Vonghia et al. [66], Katikaneni et al. [67], Idem et al. [68], and Leng et al. [69], the triglyceride molecules undergo a thermal cracking on the surface of the catalyst to form bio-hydrocarbons and oxygenated compounds such as fatty acids, ketones, aldehydes, and esters, characterizing the primary cracking. Thus, these compounds are converted by secondary cracking in gaseous products, paraffin, and olefins of long and short chains, CO, CO2, water, and alcohols, resulting in deoxygenation of oxygenated compounds, particularly, carboxylic acids.
Figure 9.
Saponification value of OLP samples as a function of cracking time.
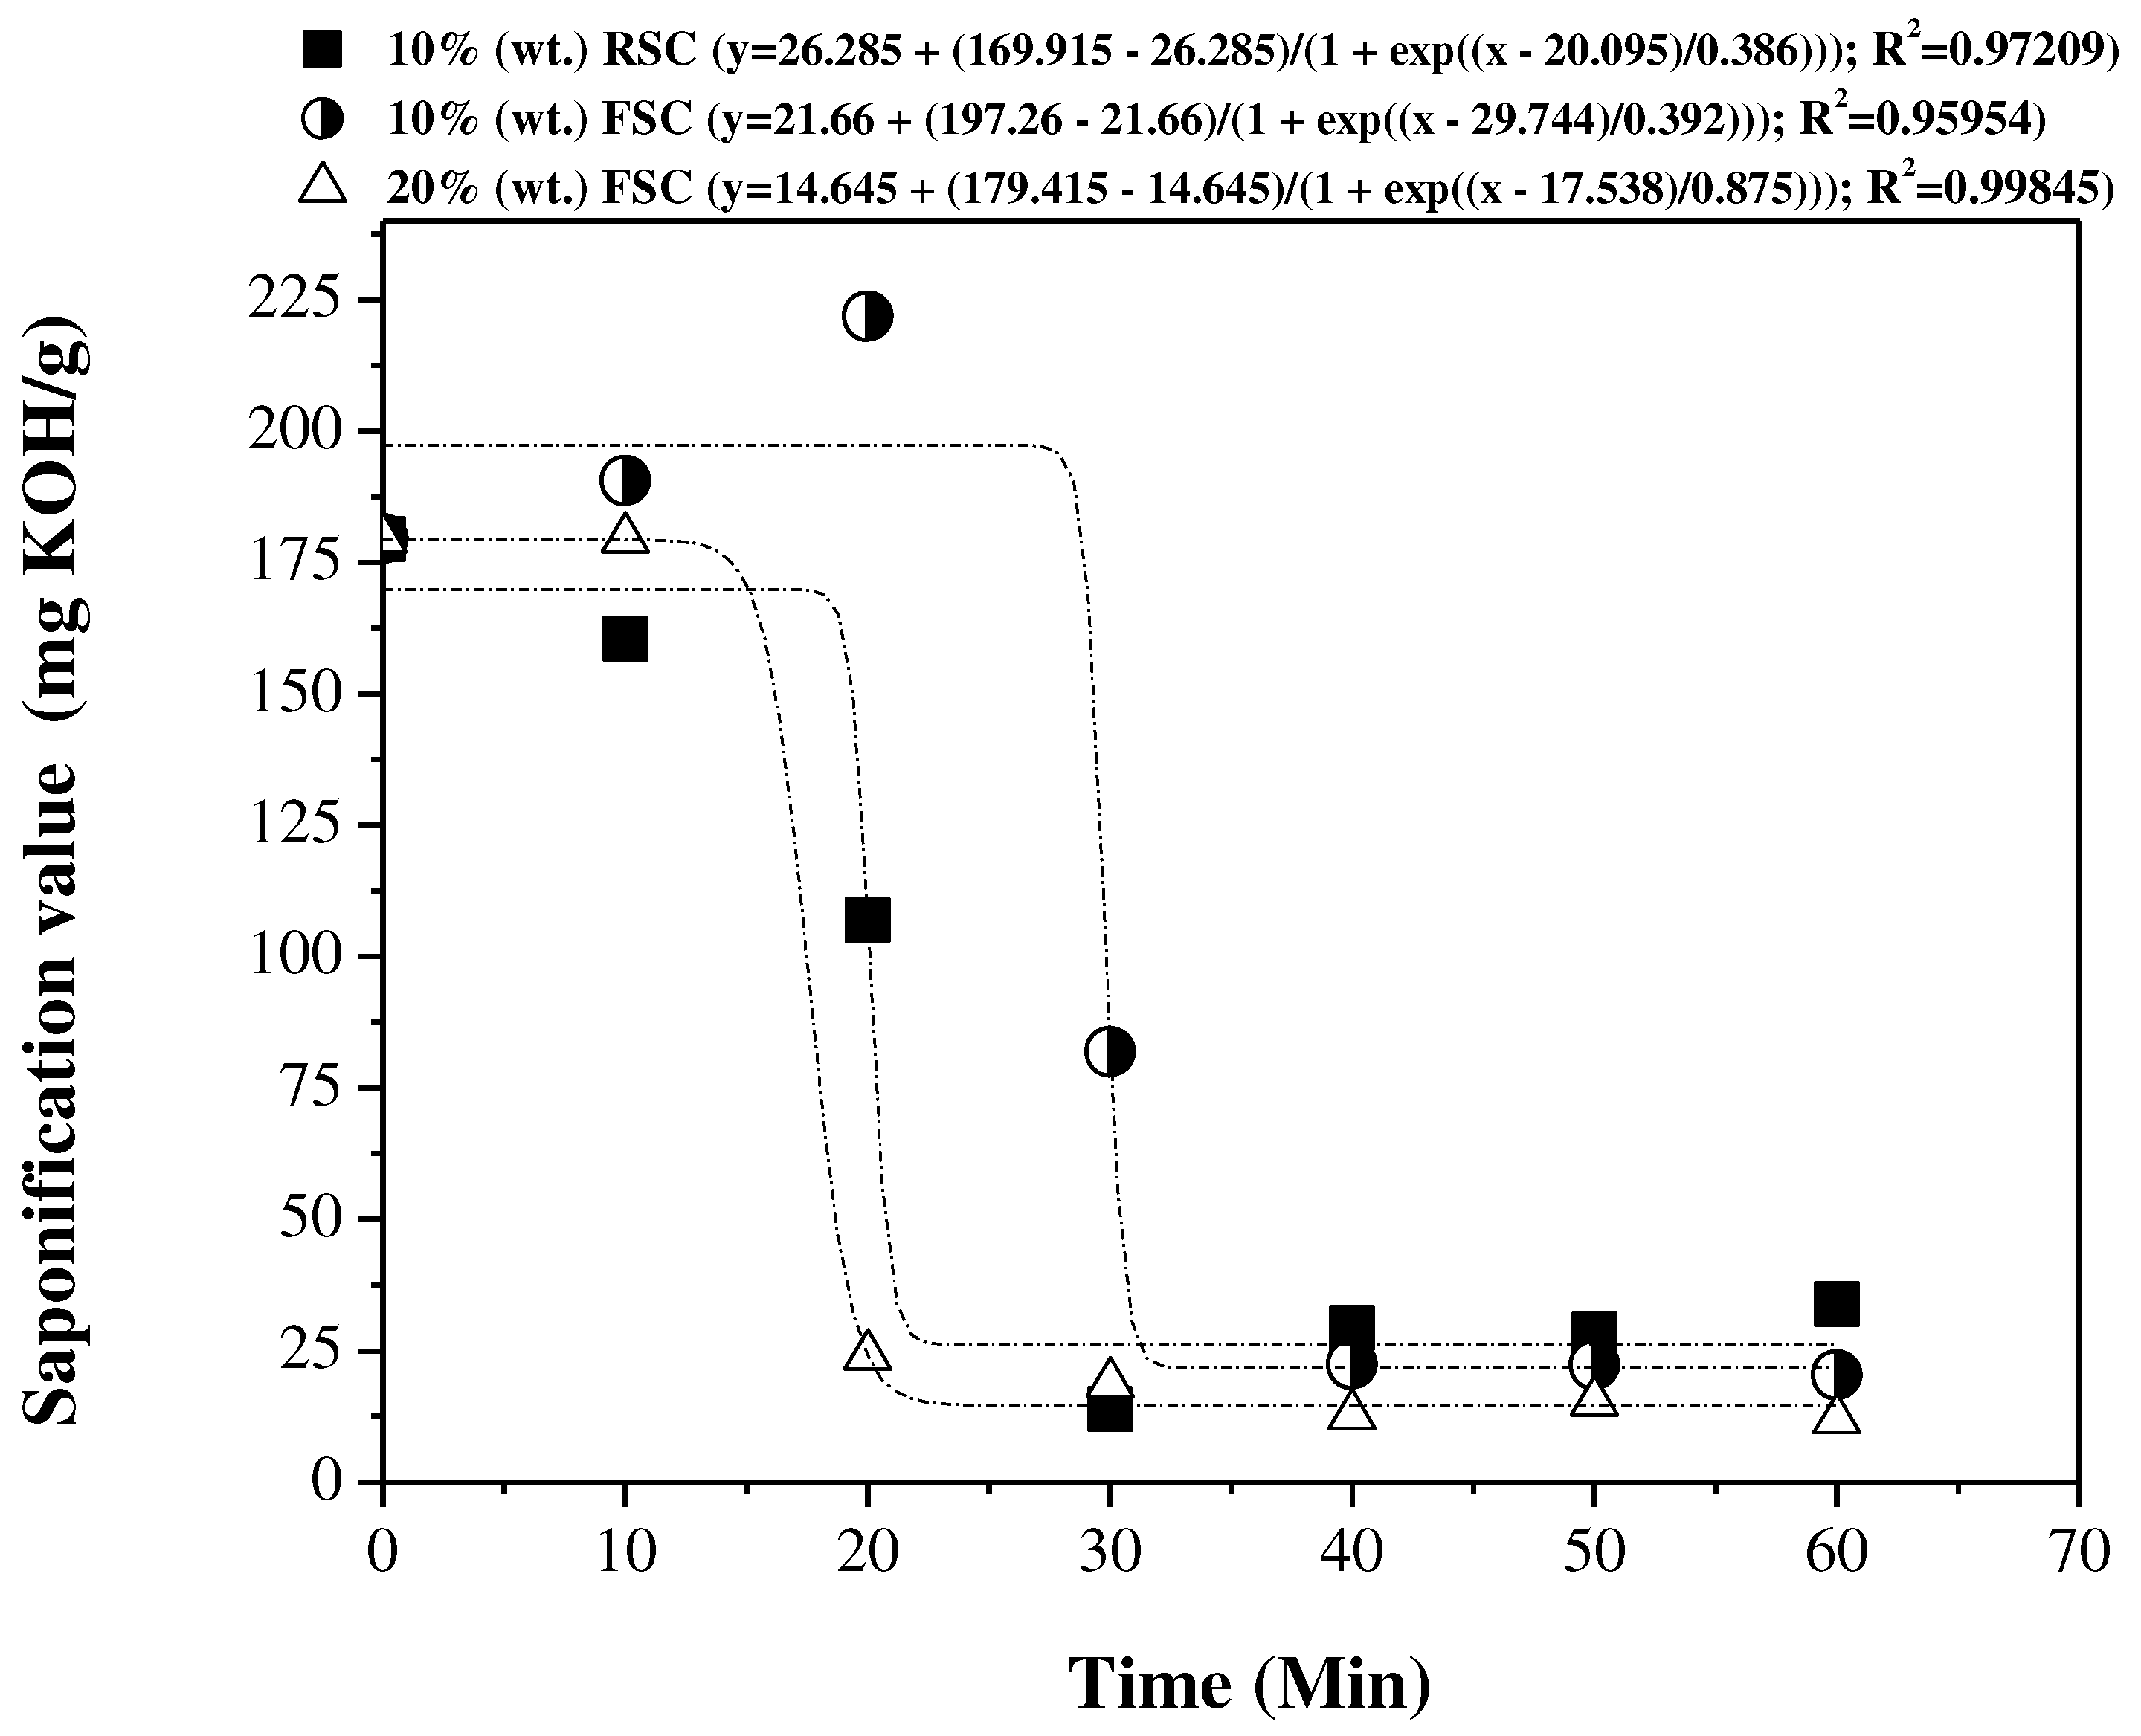
The experiments that used 10% (w/w) of fresh sodium carbonate and 10% (w/w) of reused sodium carbonate did not produce the same behavior in the saponification value of their OLPs when compared to the experiment that used 20% (w/w) of fresh sodium carbonate. According to Figure 9, in the first 20 min, there is an increase in the saponification values for the OLP obtained with 10% (w/w) of FSC. With 30 min of reaction time, the saponification value shows a decrease, which is due to the initial formation of linked and lower molecular weight carboxylic acids, due to the intense primary cracking reaction, which corresponds to the molecular breakdown and not the secondary reaction, characterized by the deoxygenation reactions of these new molecules [66,67,68,69]. Deoxygenation reactions are intensified after 30 min, as explained by the analysis of the behavior of the acid values (see Figure 8). On the other hand, the OLP obtained with 10% (w/w) of RSC has its saponification value reduced in the first 10 min of reaction, significantly reducing between 10 and 30 min. After 30 min of reaction, the saponification values increase until the cracking process ends with 60 min of reaction.
Figure 10.
Flash point of OLP samples as a function of cracking time.
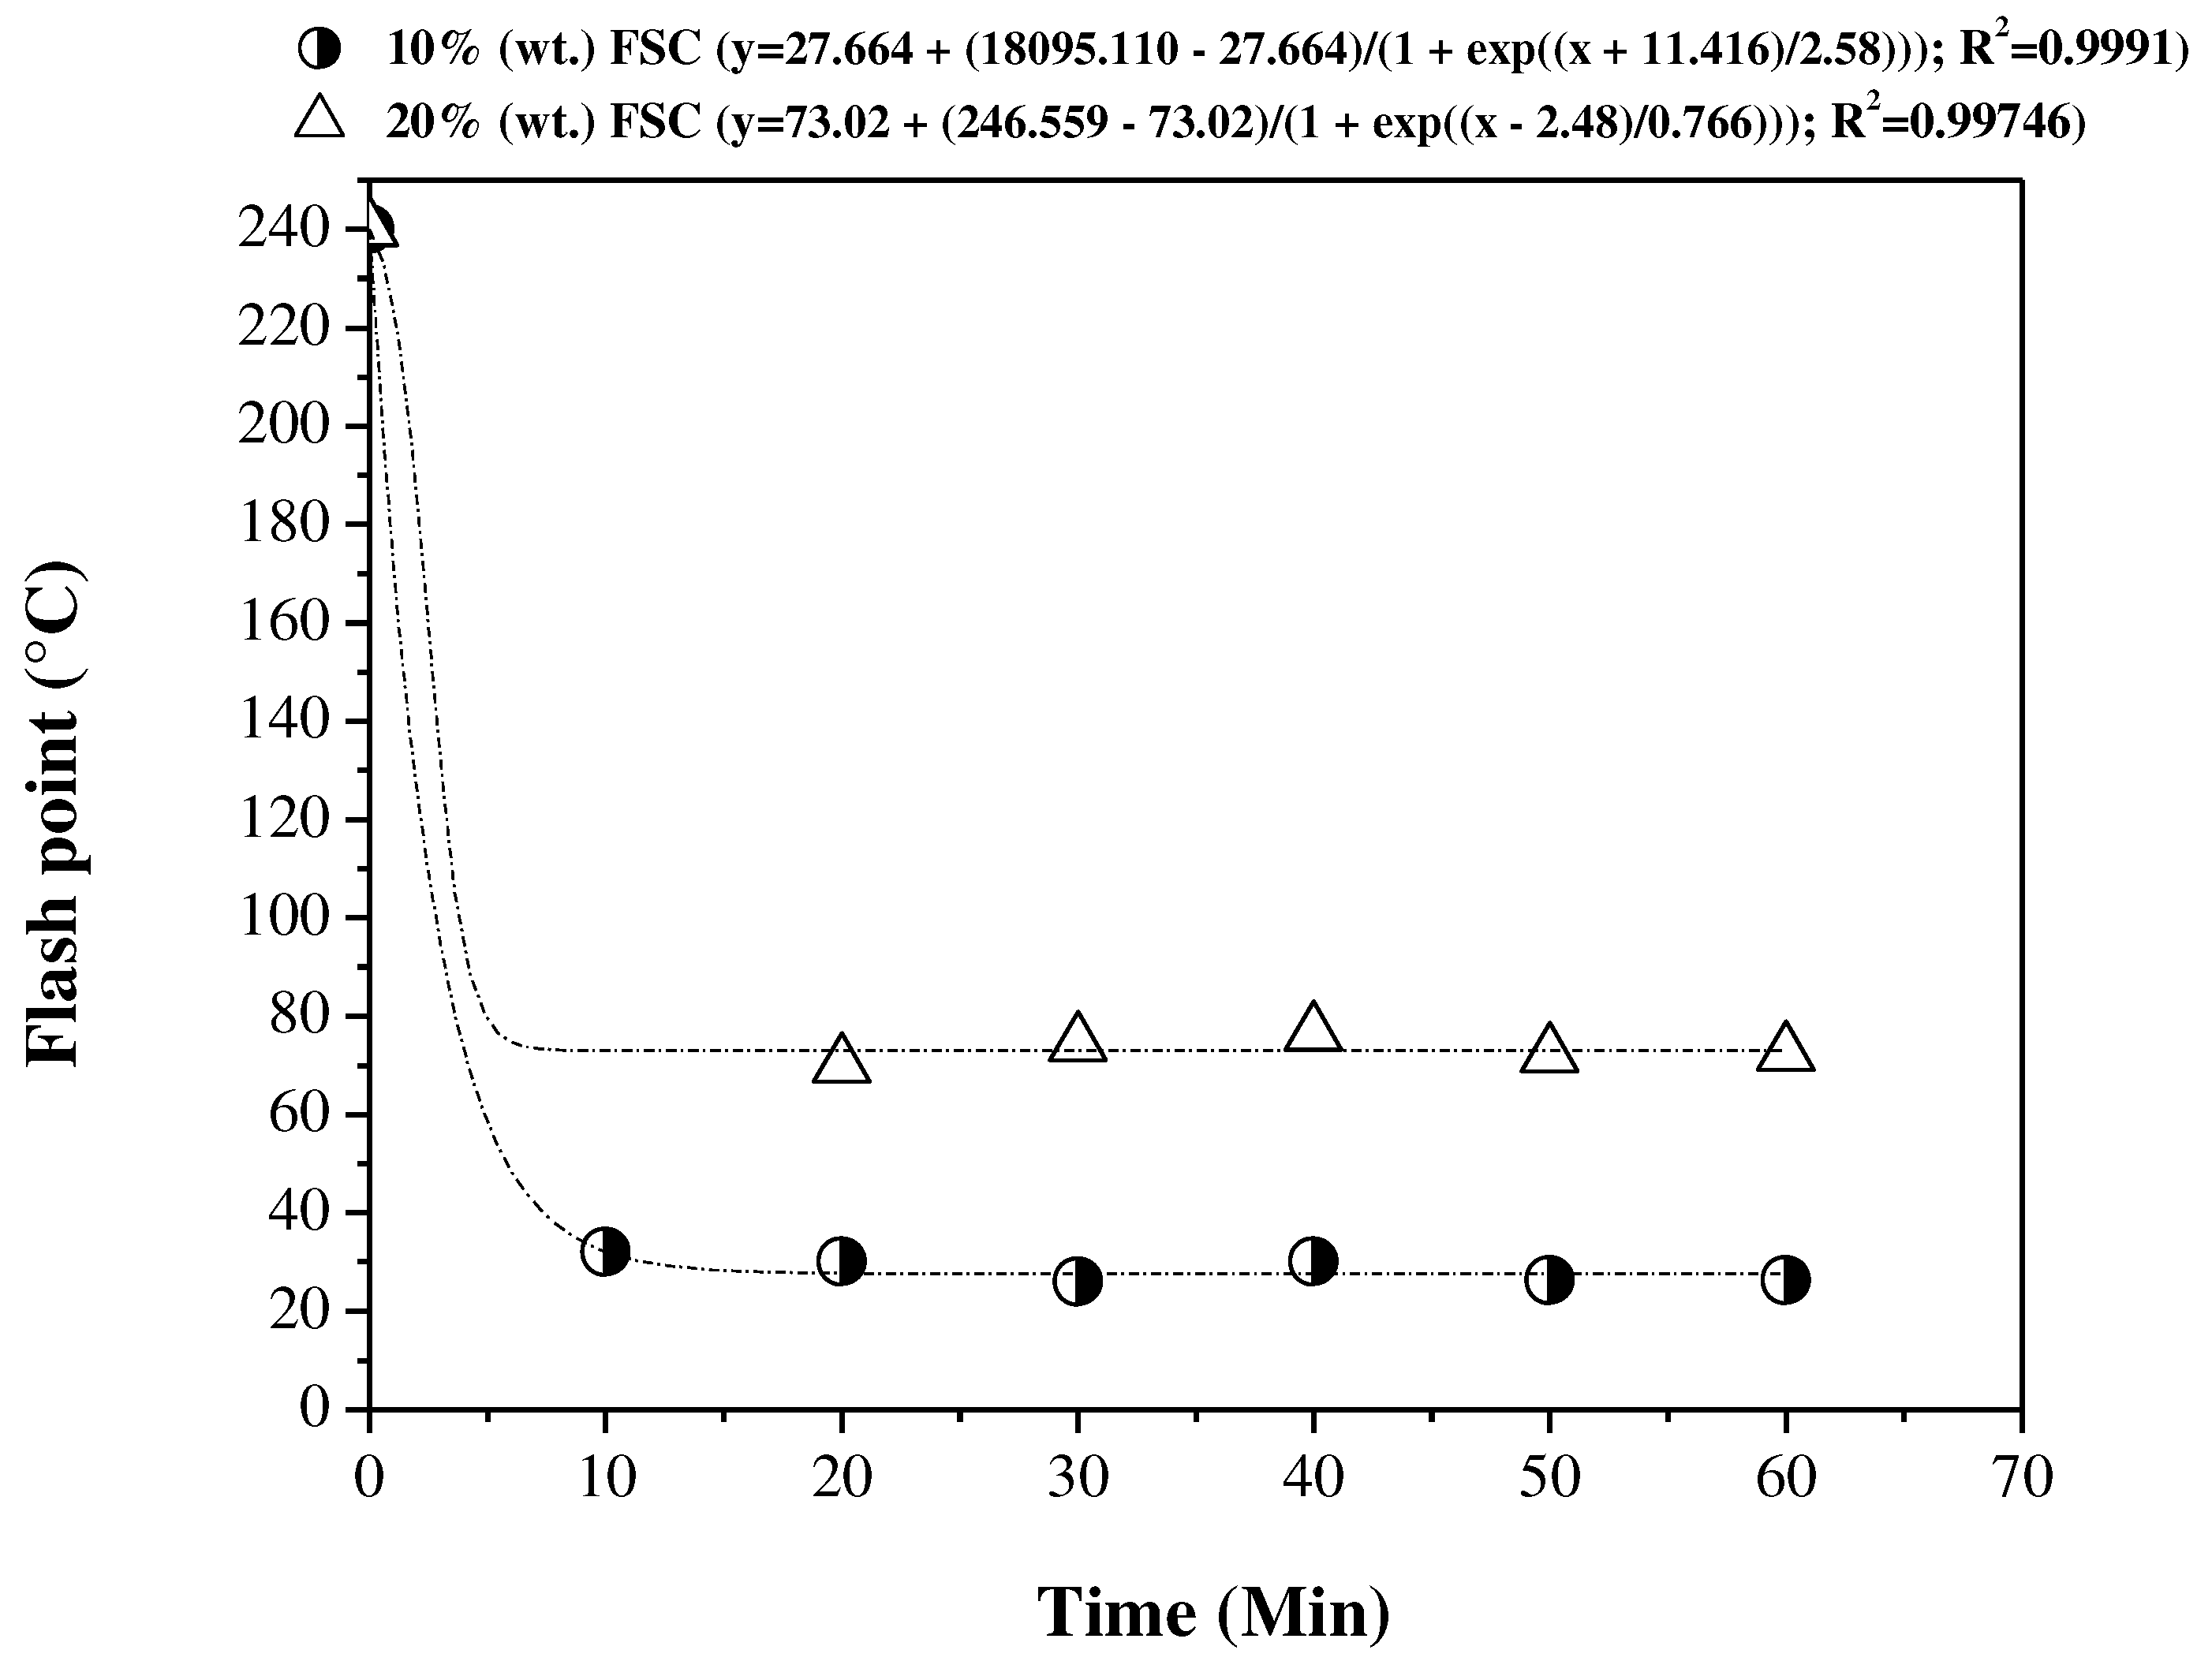
Table 3 shows that there were significant changes in the values of the refractive index (RI) and that there were no changes in the values of corrosiveness to the copper of the OLP during the 60 min of thermal catalytic cracking. The lowest refractive index value was reached at 20 minutes of reaction, becoming a more physical-chemical property of OLP considered an indication that in the interval of 10 to 20 min there was a useful cracking reaction of palm oil in molecules smaller when compared to the size of the molecules of the feedstock. According to Swern [81], one of the general relations between the refractive index and the composition of an oil-based product, with minor exceptions, is that the refractive index increases as the length of the carbon chain increases. From the 20 min of reaction, there was a gradual increase of the refractive index, without exceeding the value of the refractive index of palm oil (RI = 1.46, as explained by Mota et al. [23]), indicating that there were at least oligomerization reactions of the products formed during the cracking process. According to Ong and Bhatia [82], light alkenes can undergo oligomerization to produce a mixture of alkenes and heavier alkanes, which are arranged under the fractions of gasoline, kerosene, and diesel. The results of the fractional distillation of the OLP obtained in the present study show that it is composed of biofuels in the range of gasoline, kerosene, and diesel, as presented in Section 3.6.2.
3.5.2. FTIR spectroscopy
In order to study the quality of OLPs as a function of the reaction time along with the cracking reaction, the infrared spectrum of OLPs from the experiment that employed 10% (w/w) of fresh sodium carbonate were analyzed, as shown in Figure 11. Figure 11 shows that with 20 minutes of cracking process, bands such as 1748 cm-1 disappear, indicating the breakdown of triglyceride molecules and, consequently, the formation of oxygenated compounds such as carboxylic acids, aldehydes, and ketones [65,66,67,68,69]. Carboxylic acids are confirmed by the presence of a band in the range 3500 to 2500 cm-1, referring to the O-H bond, which according to Silverstein [74] and Pavia [75], corresponds to the function of carboxylic acids, whose appearance occurs through the presence of a broad and extensive band in the range of 3400 to 2400 cm-1. Associated with this band are the intense peaks of 1708 cm-1 and 1707 cm-1 corresponding to the group C=O, which appears in the range of 1730–1700 cm-1, more specifically close to or over 1710 cm-1, referring to carboxylic acids aliphatic [74,75]. The presence of carboxylic acids is also confirmed by the presence of the band 1284 cm-1 corresponding to the stretching of the C-O bond. Ketones and aldehydes are confirmed due to the presence of characteristic bands such as 1716 cm-1, 1718 cm-1, 1724 cm-1, and 2729 cm-1, corresponding to normal aliphatic aldehydes and ketones [74,75]. In addition, as the cracking time increases, the broadband in the range from 3500 to 2500 cm-1, becomes increasingly narrower, focusing near or over the 3000 cm-1 positions. Simultaneously, the bands move from right to left, that is, from the lowest to the highest value, such as the disappearance of the band 1284 cm-1 and consequently the appearance of bands close to or equal to 1375 cm-1, with a relative increase in intensity in the respective band, indicating the decomposition of oxygenated compounds, and with this the formation of alkanes or saturated hydrocarbons [66,67,68,69]. It is important to highlight the presence of bands in the range from 1000 cm-1 to 700 cm-1, which confirm the presence of olefins and aromatic compounds, indicating that oligomerization reactions of the products formed during the cracking process may have occurred as reaction time increases [82].
3.6. Influence of the fractional distillation process on the yield and quality of biofuels
3.6.1. Mass balances of the distillation process
The fractional distillation process yields a little more than 62% (w/w) of green gasoline/Range 1, green gasoline/Range 2, green aviation kerosene and green diesel from the OLP produced by thermal catalytic cracking of crude palm oil with 20% (w/w) sodium carbonate. In such a way, sodium carbonate yields a higher amount of green aviation kerosene, followed by green diesel and green gasoline. Similar results were reported by Kurniawan et al. [83], which produced a range of bio-hydrocarbons from the catalytic pyrolysis of coconut oil soap, most of which proved to be similar to jet fuel.
According to Table 4, the OLP produced by thermal catalytic cracking of crude palm oil with 20% (w/w) sodium carbonate generated four fractions after being subjected to a fractional distillation process at the following temperatures ranges: DT<90 °C (green gasoline/Range 1); 90≤DT≤160 °C (green gasoline/Range 2), 160≤DT≤245 °C (green aviation kerosene), 245≤DT≤340 °C (green diesel). Table 4 also shows that as the distillation temperature range increases, the yield of the distilled fractions increases, indicating that cracking of crude palm oil with Na2CO3 favored the production of heavier fractions such as green aviation kerosene, green diesel, and bottoms product. In other words, the results show that sodium carbonate was selective for the bio-hydrocarbon formation in the distillation temperature range of green aviation kerosene and green diesel. Weber et al. [42] obtained similar results, which performed the thermal degradation of animal fat at a pilot scale plant and temperatures between 410 and 450 °C, using a moving bed of sodium carbonate as the catalyst and 5% (w/w) of water, resulting in obtaining OLP. After, these authors also conducted the fractional distillation of the OLP produced to obtain the fractions in the boiling temperature range of gasoline and diesel oil. According to the results, fractional distillation of the OLP yielded 66% (w/w) of diesel fraction and 21% (w/w) of gasoline fraction.
The total yield from the sum of the four fractions yield (green gasoline/Range 1, green gasoline/Range 2, green aviation kerosene, and green diesel) is equal to 62.35% (w/w) and is higher than those found in the literature. Chew & Bhatia [84], for example, investigate the effect of additives (HZSM-5 in different Si/Al ratios, beta zeolite, SBA-15, and AlSBA-15) physically mixed with Rare Earth-Y (REY) as a catalyst in catalytic cracking of crude palm and used palm oil to produce biofuels. The best results in terms of yield showed that OLP consisted of 59.3% and 55.3% (w/w) of fractions in boiling temperature ranges of gasoline, kerosene and diesel oil to crude palm oil and used palm oil, respectively, both using HZSM-5 (Si/Al ratio = 40) with REY as catalyst. Besides, the bottom product was the product of the fractional distillation of the OLP that showed the highest yield in the present study. The bottom product contains a wide variety of valuable chemicals, making it possible to use it in resins, agrochemicals, fertilizers, emission control agents [47], fuels [58,85], carbon anodes, steel carburization, and graphite synthesis [86].
Therefore, the results in Table 4 show that OLP from the thermal catalytic cracking of crude palm oil with 20% (w/w) of fresh sodium carbonate, at 450 °C, 1 atm and at a pilot scale yielded a higher amount of fractions distilled when compared to OLP from cracking that uses commercial catalysts such as zeolites and, the bottom product formed in the fractional distillation process of the first OLP can find several applications.
3.6.2. Characterization of the distilled fractions
3.6.2.1. Physical-chemical properties
The fractional distillation at 1 atm of the OLP improves the values of the physical-chemical properties of the biofuels, allowing the majority of the values of the physical-chemical properties of the distilled fractions to be within limits established by the Agência Nacional do Petróleo, Gás Natural e Biocombustíveis (ANP). Therefore, biofuels in the form of distilled fractions (green gasoline/Range 1, green gasoline/Range 2, green aviation kerosene, and green diesel) may be used as partial or total substitutes for the particular petroleum products.
The green gasoline (Range 1 and 2), green aviation kerosene, and green diesel fractions were characterized by physical-chemical analyzes as described in Section 2.5.2, and the results are in Table 5, Table 6 and Table 7. These results were compared with the values of the physical-chemical properties of the OLP and petroleum products (gasoline, kerosene, and diesel).
As shown in Table 5, most of the values concerning the physical-chemical properties of green gasoline fractions (Range 1 and 2) were considerably lower than the values of the physical-chemical properties of the OLP. These values are also lower than those found in the works of Xu et al. [19] and Wisniewski Jr. et al. [50] for gasoline fractions. Besides, the experimental data for the green gasoline fraction (Range 1) are in agreement with the specifications defined for the regular gasoline (Type A) specification of ANP Nº 40 [87] and gasoline (Type A) specification of ASTM D4814 [88], mainly about the recovered volume. This fact indicates that the green gasoline fraction (Range 1) can be used as a fuel for Otto-cycle motor vehicles, acting as a partial or total replacement for petroleum gasoline.
Table 5 shows that the recovered volume of green gasoline (Range 2) fraction obtained in this study is not in agreement with the specifications established, since the reference temperatures exceed the limits specified for the respective recovered volume, according to the rules of the ANP Nº 40 [87] and ASTM D4814 [88]. However, this disagreement can be resolved by blending the green gasoline (Range 1) to green gasoline (Range 2) or performing fractional distillation under a distillation temperature range of less than 160 °C to obtain a single fraction of green gasoline that meets the limits fixed or the regular gasoline (Type A) specification of ANP Nº 40 [87] or gasoline (Type A) specification of ASTM D4814 [88].
Table 6 shows that most of the physical-chemical properties of the green aviation kerosene fraction or has values equal to or lower than those values relating to OLP. Although the acid value has not reached the limit established by the ANP Nº 37 [89] and ASTM D1655 [90], the value obtained for this property was equal to 1.68 mg KOH/g. This value is relatively low and can be further reduced by applying separation processes such as liquid-liquid extraction and adsorption [53,91] or even fractional distillation [53,62] in order to achieve the values set by ANP and ASTM.
The flash point value was lower than that established by the ANP Nº 37 [89] and ASTM D1655 [90], as shown in Table 6. This fact is due to the presence of low molecular weight compounds, lack of an adequate percentage of normal paraffinic and aromatic compounds, resulting in a value lower flash point for the green aviation kerosene fraction. The flash point indicates the presence of volatile components in the oil and is used to evaluate the overall flammability hazard of a material. The lower the flash point, the higher the concentration of light bio-hydrocarbons in the material [92]. This fact can be corroborated in Section 3.6.2.4, which corresponds to the chromatographic analysis results for the distilled fractions, including the fraction of green aviation kerosene. Also, the specific gravity and recovered volume of green aviation kerosene are in agreement with the specifications established for aviation kerosene according to ANP Nº 37 (Specification of Aviation Kerosene) [89] and ASTM D1655 (Jet A-1) [90].
Concerning Table 7, most of the values of the physical-chemical properties of the green diesel fraction were higher than those found for the OLP. However, the values of the physical-chemical properties (specific gravity and acid value) of green diesel fraction are lower than those found in the works of Xu et al. [19] and Wisniewski Jr. et al. [50] The values of properties such as specific gravity at 20 °C, Kinematic Viscosity at 40 °C, corrosiveness to copper and recovered volume referring to green diesel fraction are within limits established for the Diesel S10 specification of ANP Nº 65 [73]. Properties such as flash point and the acid value not presented values within limits established by that regulatory agency. The value of the flash point of green diesel fraction was lower than that established by the ANP Nº 65 [73] and ASTM D975 [79]. This fact is due to the presence of low molecular weight compounds, lack of an adequate percentage of normal paraffinic and aromatic compounds, as corroborated in Section 3.3.4, resulting in a value lower flash point for the green diesel fraction.
Flash point of a fuel is vital for safety, as it is necessary for legal and safety precautions in its handling and storage [93]. Removal of volatile components through an upgrading can quickly improve the flash point [54,94,95], making it possible for distillate fractions, especially green aviation kerosene and green diesel, to reach the limits set by regulatory agencies.
The acid value of green diesel fraction has not reached the limit established by the ANP Nº 65 [73], and the value obtained for this property was equal to 5.70 mg KOH/g, which is higher than the acid value of the other distilled fractions. This fact is the result of the higher concentration of carboxylic acids in green diesel fraction compared with other fractions distilled, as indicated in Table 12. Finally, according to Table 7, the recovered volume of green diesel fraction obtained is in agreement with the limits established for the Diesel S10 specification of ANP Nº 65 [73], except for the temperature related to 10% of recovered volume.

Table 6.
Physical-chemical properties of the green aviation kerosene fraction.
| Physical-chemical properties | Unit | OLP [23] | Green aviation kerosene | ANP Nº 37 (Aviation kerosene) [89] |
ASTM D1655 (Jet A-1) [90] |
|---|---|---|---|---|---|
| Specific gravity at 20 °C | kg/m³ | 790.00 | 790.00 | 771.30-836.60 | 775-840a |
| Kinematic viscosity at 40 °C | mm²/s | 2.02 | 1.48 | - | 8.0b |
| Flash point, min | ºC | 85.10 | 10.00 | 38.00 | 38.00 |
| Corrosiveness to copper, 3h 50 ºC, max. | - | 1 | 1 | - | 1c |
| Carbon residue, max. | wt.% | 0.64 | 0.02 | - | - |
| Acid value | mg KOH/g | 1.02 | 1.68 | 0.015d | 0.10d |
| Saponification value | mg KOH/g | 14.35 | 15.05 | - | - |
| Refractive index | - | 1.44 | 1.44 | - | - |
| Ester value | mg KOH/g | 13.33 | 13.37 | - | - |
| Content of FFA | wt.% | 0.51 | 0.84 | - | - |
| Distillation | |||||
| Initial Boiling Point (I.B.P), | ºC | n.r. | - | Annotate | - |
| 10% vol., recovered, max. | n.r. | 186.60 | 205.00 | 205.00 | |
| 50% vol., recovered | n.r. | 221.80 | Annotate | Annotate | |
| 90% vol., recovered | n.r. | 259.10 | Annotate | Annotate | |
| Final Boiling Point (F.B.P), max. | n.r. | 278.60 | 300.00 | 300.00 | |
| (90% vol., recovered) T90 – (10% vol., recovered) T10, min. | n.r. | 72.5 | - | - | |
FFA, free fatty acids; n.r., not rated; max, maximum; min, minimum; ANP: Agência Nacional do Petróleo, Gás Natural e Biocombustíveis, Resolution Nº 37 (Specification of Aviation kerosene). aDensity at 15 °C, kg/m3. bViscosity −20 °C, mm2/s (max.). cCopper strip, 2 h at 100 °C (max.). dASTM Test Method: ASTM D3242.
Table 7.
Physical-chemical properties of the green diesel fraction.
| Physical-chemical properties | Unit | OLP [23] | Green diesel | ANP Nº 65 (Diesel) [73] |
ASTM D975 (Diesel Nº 1-D S15) [79] |
Diesel fraction [19] | Diesel fraction [50] |
|---|---|---|---|---|---|---|---|
| Specific gravity at 20 °C | kg/m³ | 790.00 | 820.00 | 820-850 | - | 898 | 881.90 |
| Kinematic viscosity at 40 °C | mm²/s | 2.02 | 3.51 | 2-4.50 | 1.3-2.4 | 6.27a | - |
| Flash point, min | ºC | 85.10 | 24.00 | 38.00 | 38.00 | 115 | - |
| Corrosiveness to copper, 3h 50 °C, max | - | 1 | 1 | 1 | 3 | - | - |
| Carbon residue, max | wt.% | 0.64 | - | 0.25 | 0.15b | - | |
| Acid value | mg KOH/g | 1.02 | 5.70 | 0.50 | - | 2.50 | 86.90 |
| Saponification value | mg KOH/g | 14.35 | 15.80 | - | - | - | - |
| Refractive index | - | 1.44 | 1.45 | - | - | - | - |
| Ester value | mg KOH/g | 13.33 | 10.10 | - | - | - | - |
| Content of FFA | wt.% | 0.51 | 2.87 | - | - | - | - |
| Distillation | |||||||
| 10% vol., recovered | ºC | n.r | 260.20 | 180 | - | - | - |
| 50% vol., recovered | n.r | 282.30 | 245-295 | - | - | - | |
| 85% vol., recovered, max. | n.r | 326.57 | - | - | - | - | |
| 90% vol., recovered, max. | n.r | 332.90 | - | 288.00 | - | - | |
| 95% vol., recovered, max. | n.r | 353.30 | 370 | - | - | - | |
aviscosity at 20 °C; FFA, free fatty acids; n.r., not rated; max, maximum; min, minimum; ANP, Agência Nacional do Petróleo, Gás Natural e Biocombustíveis, Resolution Nº 65 (Specification of Diesel S10). bASTM Test Method: ASTM D524.
3.6.2.2. FTIR spectroscopy
Figure 12 exhibits the results of the FTIR spectrum of OLP and distilled fractions. The figure shows that the appearance and disappearance of the bands associated with organic functions such as hydrocarbons and carboxylic acids of distilled fractions concerning the OLP. Besides, the infrared spectrum enables the primary analysis of the physical-chemical properties of OLP and green gasoline (Range 1 and 2), green aviation kerosene, and green diesel fractions.
The FTIR spectrum of the distilled fractions indicates the presence of characteristic bands of saturated hydrocarbons, like vibration characteristic bands of axial deformation of CH within the region 3000-2840 cm-1, which correspond to hydrocarbons from class normal alkanes. Associated with these bands, we verified the presence of the band 1375 cm-1 relating to angular deformation vibration of methyl groups C-H [74,75], confirming of the presence of aliphatic hydrocarbons. It is also important to note that the spectrum corresponding to the fractions also shows broad bands in the range 3077-2750 cm-1, associated with the band 1716 cm-1 and 1722 cm-1, which confirm the presence of carboxylic acids, aldehydes, and ketones. This result is consistent with the physical-chemical analysis for the said distilled fractions since it presents the highest acid value of the four fractions is in the green diesel.
3.6.2.3. Distillation curve
The results concerning the distillation curves of the biofuels in the form of distilled fractions as green gasoline, green aviation kerosene, and green diesel show that they can be used as one of the fractions of the “pool” of biofuel for replacing form partial or total an oil derivative. Also, the results obtained for the four fractions distilled regarding the similarity of the experimental distillation curves with standard distillation curves come from the OLP quality, fractional distillation efficiency, and temperature range selected to obtain each fraction.
Figure 13, Figure 14 and Figure 15 show the distillation curves of distilled fractions. The figures exhibit the chemical and physical behavior of bio-hydrocarbon fractions present in the biofuel obtained in this study within the following temperature ranges: DT<90 °C (green gasoline fraction/Range 1); 90≤DT≤160 °C (green gasoline fraction/Range 2), 160≤DT≤245 °C (green aviation kerosene fraction), 245≤DT≤340 °C (green diesel fraction).
In Figure 13, the experimental distillation curves of green gasoline fractions (Range 1 and 2) show similarity to the standard distillation curve for the regular gasoline (Type A) specification of ANP Nº 40 [87], mainly the distillation curve of green gasoline fraction (Range 1). The experimental distillation curve of green gasoline fraction displays distillation temperature exceeds the standard value for 10% recovered volume. However, the distillation temperatures for other recovered volumes (50%, 80%, 90%, and 100%) are consistent with the standard distillation curve for the regular gasoline (Type A) from petroleum, as the specification of ANP Nº 40 [87]. Wiggers et al. [96] obtained similar results to those obtained in this study, which fractionated soybean bio-oil into light distilled fractions with similar distillation curves to those of gasoline A from petroleum.
Figure 14 indicates that the green aviation kerosene fraction reached the limits for the distillation curve of aviation kerosene according to the ANP Nº 37 [89]. Ertas and Alma [97] obtained simulated distillation curves for the kerosene fraction from the bio-oil of laurel (Laurus nobilis L.) and found that they could use it as fuel when blended with commercial petroleum products.
Figure 15 indicates that the experimental distillation curve of green diesel fraction is different from the standard distillation curve for Diesel S10 specification (ANP Nº 65) [73] until the recovered volume of approximately 40%. In the range of 0-40% recovered volume, the distillation temperatures are above established by ANP, indicating that there is an excessive concentration of heavy bio-hydrocarbons in the green diesel fraction when compared to petroleum diesel. In contrast, the temperatures related to the 50 and 95% recovered volume are consistent with those established for the standard distillation curve. Ertas and Alma [97] obtained simulated distillation curves for the diesel fraction from the bio-oil of laurel (Laurus nobilis L.) and also concluded that they could use it as fuel when mixed with petroleum products.
3.6.2.4. GC–MS analysis
The results of GC-MS analysis of the distilled fractions are presented in the form of chromatograms, as shown in Figure 16, Figure 17, Figure 18 and Figure 19. Table 8, Table 9, Table 10 and Table 11 describe the retention time, chemical compounds, and peak areas of chemical compounds identified by CG–MS analysis for the four distilled fractions. Therefore, we classify the components present in the distilled fractions into two significant groups: bio-hydrocarbons (normal paraffinic, olefin, naphthenic and aromatic) and oxygenates (carboxylic acids, alcohols, aldehydes, ketones, esters, and others).
From the analysis of Figure 16, Figure 17, Figure 18 and Figure 19, it was found the presence of several peaks, indicating a high number of compounds in each fraction distilled. Figure 16 shows that the compounds of the green gasoline (Range 1) were mainly located in the interval between 2.5 and 7.5 minutes and between 15 and 20 minutes, indicating the presence of long and short bio-hydrocarbon chains, according to Table 8. However, short bio-hydrocarbon chains are prevalent.
Figure 17 shows that the compounds of the green gasoline (Range 2) are at intervals between 2.5 and 10 minutes. However, the most intense peaks are located between 2.5 and 5.0 minutes, indicating the presence of peaks similar to the peaks found in the fraction of green gasoline (Range 1). Table 8 and Table 9 confirm the presence of compounds such as diacetone alcohol, 2-nonanone, 2-decanone, and hexadecane in both fractions (green gasoline/Range 1 and green gasoline/Range 2).
Figure 18 shows that the compounds of the green aviation kerosene fraction are located mainly between 3 and 12.5 minutes, indicating the presence of intermediate bio-hydrocarbon chains. The most intense peaks are between 7.5 and 10 minutes, where we can highlight the peaks relating to the retention times 8.503 min (1-Hexadecene) and 9.855 min [(3E)-3-Octadecene], as shown in Table 10.
Figure 19 shows that the compounds of the green diesel are located between 5 and 22.5 minutes, indicating the presence of a wide range of bio-hydrocarbon chains. However, unlike what was described for the green gasoline and green aviation kerosene fractions, there is a concentration peak between 10 and 17.5 minutes, indicating the presence of long-chain compounds, as can be seen in Table 11.
Figure 20 shows the presence of bio-hydrocarbons chain between C8 and C23 in the four distilled fractions. However, each distilled fraction has a specific bio-hydrocarbons range. Green gasoline fraction (Range 1) present chain in the C8-C19 range, with higher concentrations of bio-hydrocarbons ranging from C9 to C13. Green gasoline fraction (Range 2) is composed of bio-hydrocarbons with chains in the C8-C17 range, with higher concentrations of bio-hydrocarbons with chains in the C10-C12 range. According to Speight [98] and Speight [92], the gasoline consists of bio-hydrocarbons, which range from C4 to C12. Therefore, green gasoline fractions (Ranges 1 and 2) are consistent with the limits established in the literature about the number of carbons present in the bio-hydrocarbon chains.
The green aviation kerosene fraction consists of bio-hydrocarbons with C10-C21 chains in which the predominant bio-hydrocarbons are the C11-C16 range. These results are consistent with those described by Speight [92], which reports that the kerosene-type jet fuels (JP-4) are characterized by the hydrocarbon chain in the C4-C16 range. Unlike the distilled fractions corresponding to green gasoline fraction (Range 1 and 2), green aviation kerosene has, in its composition, a more significant amount of long-chain hydrocarbons. Finally, the green diesel fraction has chain hydrocarbons ranging C13-C23, wherein the majority of hydrocarbons are the C14-C17 range. Speight [92] reports that the carbon number limit for the diesel fuel is C8-C18. On the size of the hydrocarbon chain, green aviation kerosene and green diesel fraction are according to the literature. Therefore, a single fractionation of OLP by fractional distillation at atmospheric pressure resulted in fractions of green gasoline, green aviation kerosene, and green diesel, which are composed of hydrocarbons characterizing the respective petroleum derivatives.
In a previous study, Mancio et al. [13] produced an OLP from the thermal catalytic cracking of palm oil with 20% (w/w) Na2CO3 as the catalyst, in the same equipment and the same operating conditions used in this paper. The results of the GC-MS analysis of said OLP are in Table 12 for purposes of comparison with the results obtained in the present study for the distilled fractions. Therefore, according to Table 12, the chemical distribution of the classes of bio-hydrocarbons and oxygenates compounds of the four distilled fractions was very different from OLP. In OLP, bio-hydrocarbons were abundant relative to oxygenated compounds. The olefins were the bio-hydrocarbon class, which presented the highest content, followed by normal paraffin and naphthenic. For oxygenated compounds, the ketones had the highest levels, followed by alcohol and carboxylic acids.
Similarly, Table 12 also shows that all the biofuels produced in the present study in the form of distilled fractions have more bio-hydrocarbon than oxygenated compounds. The fractions with the most significant bio-hydrocarbon contents are green gasoline fraction (Range 2) and green aviation kerosene fraction, resulting in lower oxygenates compounds contents for these distilled fractions. Among the identified and quantified bio-hydrocarbons are normal paraffinic, olefinic, naphthenic, and aromatic, which second Speight [98] and Fahim et al. [93] are the main components also present in the distilled fractions from crude oil. Regarding the content of aromatic compounds, the green gasoline fractions (Range 1 and 2) are following the ANP Nº 40 [87], which states that regular gasoline must not contain more than 25% (w/w) of aromatic compounds in its composition.
Table 12.
Chemical composition of distilled fractions in terms of hydrocarbons and oxygenates compounds.
Table 12.
Chemical composition of distilled fractions in terms of hydrocarbons and oxygenates compounds.
| Product Groups | Area (% wt.) | ||||
| OLP [13] | Green gasoline | Green aviation kerosene | Green diesel | ||
| 20% (w/w) Na2CO3 | Range 1 | Range 2 | |||
| Hydrocarbons | 88.10 | 50.14 | 93.64 | 93.97 | 81.25 |
| Normal paraffin | 24.28 | 13.80 | 20.52 | 35.91 | 24.13 |
| Olefins | 51.74 | 32.93 | 45.28 | 53.90 | 55.22 |
| Naphthenic | 12.08 | 3.41 | 25.35 | 4.16 | 1.90 |
| Aromatics | 0.00 | 0.00 | 2.49 | 0.00 | 0.00 |
| Oxygenates | 11.90 | 49.86 | 6.36 | 6.03 | 18.75 |
| Carboxylic acids | 3.10 | 0.00 | 0.00 | 0.00 | 0.98 |
| Alcohols | 3.31 | 7.21 | 0.00 | 3.66 | 5.06 |
| Ketones | 5.49 | 15.13 | 3.95 | 1.26 | 11.59 |
| Esters | 0.00 | 14.53 | 0.00 | 0.00 | 0.00 |
| Others | 0.00 | 12.99 | 2.41 | 1.11 | 1.12 |
| Total | 100.00 | 100.00 | 100.00 | 100.00 | 100.00 |
The oxygenated compounds were distributed among the four distilled fractions in such a way that the green gasoline/range 1 and green diesel fractions contain the highest levels of the said class of components (See Table 12). It is to be expected that some oxygenate are not completely converted into bio-hydrocarbons, since during triglyceride cracking reactions one of the dominant steps is the elimination of heavy oxygenated bio-hydrocarbons such as carboxylic acids, aldehyde, ketones and esters [66,68]. Among the oxygenated compounds, alcohols, ketones, and esters represent the three largest chemical families in both distilled fractions. According to Oasmaa [94], the acidity of bio-oils comes from their compounds, including oxygenates. In the case of oxygenates, the class that promotes higher acidity is the class of carboxylic acids. For this reason, the green diesel fraction with 2.51% (w/w) of carboxylic acids is the distilled fraction with a higher acid value, as shown in Table 7.
Therefore, the results of the GC-MS analysis clearly show that most of the distilled fractions can be used as an energy source by applying the bio-additives of fuels due to high bio-hydrocarbon content and low levels of oxygenates. The use of distilled fractions such as bio-additives may occur by emulsification of the fraction with their respective oil derivative. Besides, the distilled fractions can be used as feedstock for further upgrading processes in a crude oil refinery by hydrotreating processes [47].
It is important to note that green gasoline fraction (Range 1) has characteristics that should be improved due to the presence of naphthenic and aromatic compounds at low concentrations. According to Speight [98], this characteristic influences the resistance to detonation, since the presence thereof is favorable for the antiknock power of the fuels used in spark-ignition engines such as gasoline. However, the presence of normal paraffinic implies greater stability or resistance to oxidation, which is the durability of the fuel.
The presence of oxygenates in green gasoline fractions (Range 1 and 2) can influence its volatility, as well as its energy efficiency. According to Speight [98], oxygenates drop the volatility of the gasoline, improving the time of ignition or burning of fuel. According to Fahim et al. [93], the presence of oxygenated compounds increases the latent heat of vaporization, that is, the energy required to vaporize the liquid fuel.
Unlike the results obtained for the green gasoline fractions (Range 1 and 2), it has not identified the presence of aromatic compounds in green aviation kerosene and green diesel fractions, contributing to the rise of other constituents, as Table 12. According Speight [98], the presence of paraffinic compounds and naphthenic compounds, as well as the absence of aromatic compounds in diesel composition derived petroleum contributes to a good quality fuel. These characteristics are favorable because the presence of aromatic compounds in fossil fuels promotes a higher resistance to detonation in diesel combustion engines by ignition, and the presence of normal (linear) paraffinic promotes greater stability, i.e., resistance to oxidation. On the other hand, the presence of olefins results in a low freezing point and a high cetane number. The high content of olefins can be reduced by hydrogenation typically simple hydrogenation or non-destructive hydrogenation, which are usually used to improve product quality without a significant change in the boiling range [95].
Table 13 compares the bio-hydrocarbon and oxygenates contents obtained from this study for the distilled fractions with those obtained by different researchers, highlighting the type of distillation selected, the feed used, as well as operating conditions of pressure and temperature. According to Table 13, the results of this study are similar or superior to those reported in the literature. The bio-hydrocarbon contents of the green gasoline fractions (Range 1 and 2) and green aviation kerosene fraction, for example, is significantly higher than the contents of bio-hydrocarbons present in the light, middle and heavy fraction obtained by fractional distillation in the temperature ranges corresponding to ≤100 °C, 100-180 °C and 180-250 °C, respectively, as described in Capunitan and Capareda [47]. The green gasoline (Range 2) also shows bio-hydrocarbon content higher than those obtained by Wisniewski et al. [50] that, despite the distillation temperature range to be corresponding to <200 °C obtained a light bio-oil fraction with only 60.06% (w/w) of bio-hydrocarbons from the reactive distillation. On the other hand, green gasoline (Range 2) shows bio-hydrocarbon content similar to those obtained by Zhao et al. [17], which obtained a distilled fraction with 91.97% of bio-hydrocarbons from the simple distillation in the corresponding temperature range at <200 °C. Green kerosene and green diesel fractions obtained in the present study also showed very similar bio-hydrocarbon content to those described by da Silva Almeida et al. [51] and da Silva Almeida et al. [14] for kerosene and light diesel fractions obtained by fractional distillation at 175-235 °C and 235-305 °C, respectively.
4. Conclusions
The use of 10% (w/w) of reused sodium carbonate without a previous regeneration step in the thermal catalytic cracking process of crude palm oil reduces the yield and the quality (regarding the physical-chemical properties) of the OLP when compared with the same parameters for OLP from cracking that used 10% (w/w) of fresh sodium carbonate. Despite this, the reuse of sodium carbonate without any regeneration step proved to be viable, since, despite the reduction in its catalytic activity, it remains with the crystalline phase that characterizes it, which is the natrite phase, and it managed to break the triglyceride molecules into oxygenated compounds (carboxylic acids, fatty alcohols, ketones) and mainly, bio-hydrocarbons such as alkanes and alkenes, promoting higher yield and better quality than those found for commercial catalysts. This even indicates that sodium carbonate can be reused more than once in the cracking process.
The reaction time significantly influenced the values of the physical-chemical properties and chemical composition of the OLPs during cracking crude palm oil. In such a way, as the reaction time increased from 0 to 60 min, these values of the physical-chemical properties reduced slightly for the three conditions employed: 10% (w/w) of fresh sodium carbonate as the catalyst; 20% (w/w) of fresh sodium carbonate, and 10% (w/w) of reused sodium carbonate as the catalyst. The reaction time of 30 min is the minimum cracking time for the three conditions employed that promotes the production of an organic liquid product with physical-chemical properties and chemical composition close to or within limits established for petroleum diesel by national and international regulatory agencies.
The fractional distillation at 1 atm of the OLP improves the values of the physical-chemical properties of the biofuels (green gasoline/Range 1, green gasoline/Range 2, green aviation kerosene and green diesel), promoting a similarity of the experimental distillation curves with standard distillation curves and allowing the majority of the values of the physical-chemical properties of the distilled fractions to be within limits established by the ANP. Besides, a single fractionation of OLP generates biofuels (green gasoline, green aviation kerosene, and green diesel) with higher bio-hydrocarbon contents than oxygenated compounds and which are composed of bio-hydrocarbons characterizing the respective petroleum derivatives. Therefore, biofuels have a promising potential to be used as new products in the area of renewable energy, allowing the current consumer market to purchase products that can partially or entirely replace petroleum products, as do bioethanol and biodiesel.
Author Contributions
The individual contributions of all the co-authors are provided as follows: S.A.P.M contributed with methodology, formal analysis, investigation, and writing the original draft preparation; A.A.M.M contributed with formal analysis, and writing the original draft preparation, J.S.S. contributed with formal analysis; V.J.P.G contributed with formal analysis; J.R.Z. contributed with investigation and methodology; L.E.P.B contributed with investigation and methodology; N.T.M. contributed with supervision, conceptualization, and data curation. All authors have read and agreed to the published version of the manuscript.
Funding
This research received no external funding.
Acknowledgments
This work was financially supported by the Brazilian governmental agencies (CAPES and Eletrobrás S/A).
Conflicts of Interest
The authors declare no conflict of interest.
References
- Rodionova, M. V; Poudyal, R.S.; Tiwari, I.; Voloshin, R.A.; Zharmukhamedov, S.K.; Nam, H.G.; Zayadan, B.K.; Bruce, B.D.; Hou, H.J.M.; Allakhverdiev, S.I. Biofuel Production: Challenges and Opportunities. Int J Hydrogen Energy 2017, 42, 8450–8461. [Google Scholar] [CrossRef]
- Council, W.E. Global Transport Scenarios 2050, London, 2011.
- Industry Market trends. The damage done in transportation – which energy source will lead to the greenest highways? April 30, 2012, <http://news.thomasnet.com/imt/2012/04/30/the-damage-done-in-transportation-which-energy-source-will-lead-to-the-greenest-highways> [accessed 20.05.2023].
- Popp, J.; Kovács, S.; Oláh, J.; Divéki, Z.; Balázs, E. Bioeconomy: Biomass and Biomass-Based Energy Supply and Demand. N Biotechnol 2021, 60, 76–84. [Google Scholar] [CrossRef] [PubMed]
- Naji, S.Z.; Tye, C.T.; Abd, A.A. State of the Art of Vegetable Oil Transformation into Biofuels Using Catalytic Cracking Technology: Recent Trends and Future Perspectives. Process Biochemistry 2021, 109, 148–168. [Google Scholar] [CrossRef]
- Seifi, H.; Sadrameli, S.M. Improvement of Renewable Transportation Fuel Properties by Deoxygenation Process Using Thermal and Catalytic Cracking of Triglycerides and Their Methyl Esters. Appl Therm Eng 2016, 100, 1102–1110. [Google Scholar] [CrossRef]
- Meier, H.F.; Wiggers, V.R.; Zonta, G.R.; Scharf, D.R.; Simionatto, E.L.; Ender, L. A Kinetic Model for Thermal Cracking of Waste Cooking Oil Based on Chemical Lumps. Fuel 2015, 144, 50–59. [Google Scholar] [CrossRef]
- Iha, O.K.; Alves, F.; Suarez, P.A.Z.; Silva, C.R.P.; Meneghetti, M.R.; Meneghetti, S.M.P. Potential Application of Terminalia Catappa L. and Carapa Guianensis Oils for Biofuel Production: Physical-Chemical Properties of Neat Vegetable Oils, Their Methyl-Esters and Bio-Oils (Hydrocarbons). Ind Crops Prod 2014, 52, 95–98. [Google Scholar] [CrossRef]
- Wiggers, V.R.; Zonta, G.R.; Franca, A.P.; Scharf, D.R.; Simionatto, E.L.; Ender, L.; Meier, H.F. Challenges Associated with Choosing Operational Conditions for Triglyceride Thermal Cracking Aiming to Improve Biofuel Quality. Fuel 2013, 107, 601–608. [Google Scholar] [CrossRef]
- Kozliak, E.; Mota, R.; Rodriguez, D.; Overby, P.; Kubatova, A.; Stahl, D.; Niri, V.; Ogden, G.; Seames, W. Non-Catalytic Cracking of Jojoba Oil to Produce Fuel and Chemical by-Products. Ind Crops Prod 2013, 43, 386–392. [Google Scholar] [CrossRef]
- Yu, F.; Gao, L.; Wang, W.; Zhang, G.; Ji, J. Bio-Fuel Production from the Catalytic Pyrolysis of Soybean Oil over Me-Al-MCM-41 (Me=La, Ni or Fe) Mesoporous Materials. J Anal Appl Pyrolysis 2013, 104, 325–329. [Google Scholar] [CrossRef]
- Teixeira, C.M.; Fréty, R.; Barbosa, C.B.M.; Santos, M.R.; Bruce, E.D.; Pacheco, J.G.A. Mo Influence on the Kinetics of Jatropha Oil Cracking over Mo/HZSM-5 Catalysts. Catal Today 2017, 279 Part, 202–208. [Google Scholar] [CrossRef]
- Mancio, A.A.; da Costa, K.M.B.; Ferreira, C.C.; Santos, M.C.; Lhamas, D.E.L.; da Mota, S.A.P.; Leão, R.A.C.; de Souza, R.O.M.A.; Araújo, M.E.; Borges, L.E.P.; et al. Thermal Catalytic Cracking of Crude Palm Oil at Pilot Scale: Effect of the Percentage of Na2CO3 on the Quality of Biofuels. Ind Crops Prod 2016, 91, 32–43. [Google Scholar] [CrossRef]
- da Silva Almeida, H.; Corrêa, O.A.; Eid, J.G.; Ribeiro, H.J.; de Castro, D.A.R.; Pereira, M.S.; Pereira, L.M.; de Andrade Mâncio, A.; Santos, M.C.; da Silva Souza, J.A.; et al. Production of Biofuels by Thermal Catalytic Cracking of Scum from Grease Traps in Pilot Scale. J Anal Appl Pyrolysis 2016, 118, 20–33. [Google Scholar] [CrossRef]
- Abbasov, V.; Mammadova, T.; Aliyeva, N.; Abbasov, M.; Movsumov, N.; Joshi, A.; Lvov, Y.; Abdullayev, E. Catalytic Cracking of Vegetable Oils and Vacuum Gasoil with Commercial High Alumina Zeolite and Halloysite Nanotubes for Biofuel Production. Fuel 2016, 181, 55–63. [Google Scholar] [CrossRef]
- Lovás, P.; Hudec, P.; Hadvinová, M.; Ház, A. Conversion of Rapeseed Oil via Catalytic Cracking: Effect of the ZSM-5 Catalyst on the Deoxygenation Process. Fuel Processing Technology 2015, 134, 223–230. [Google Scholar] [CrossRef]
- Zhao, X.H.; Wei, L.; Cheng, S.Y.; Cao, Y.H.; Julson, J.; Gu, Z.R. Catalytic Cracking of Carinata Oil for Hydrocarbon Biofuel over Fresh and Regenerated Zn/Na-ZSM-5. Applied Catalysis a-General 2015, 507, 44–55. [Google Scholar] [CrossRef]
- Biswas, S.; Sharma, D.K. Effect of Different Catalysts on the Cracking of Jatropha Oil. J Anal Appl Pyrolysis 2014, 110, 346–352. [Google Scholar] [CrossRef]
- Xu, J.M.; Jiang, J.C.; Zhang, T.J.; Dai, W.D. Biofuel Production from Catalytic Cracking of Triglyceride Materials Followed by an Esterification Reaction in a Scale-up Reactor. Energy & Fuels 2013, 27, 255–261. [Google Scholar] [CrossRef]
- Wang, S.; Guo, Z.; Cai, Q.; Guo, L. Catalytic Conversion of Carboxylic Acids in Bio-Oil for Liquid Hydrocarbons Production. Biomass Bioenergy 2012, 45, 138–143. [Google Scholar] [CrossRef]
- Wu, X.; Jiang, P.; Jin, F.; Liu, J.; Zhang, Y.; Zhu, L.; Xia, T.; Shao, K.; Wang, T.; Li, Q. Production of Jet Fuel Range Biofuels by Catalytic Transformation of Triglycerides Based Oils. Fuel 2017, 188, 205–211. [Google Scholar] [CrossRef]
- Li, L.; Quan, K.; Xu, J.; Liu, F.; Liu, S.; Yu, S.; Xie, C.; Zhang, B.; Ge, X. Liquid Hydrocarbon Fuels from Catalytic Cracking of Waste Cooking Oils Using Basic Mesoporous Molecular Sieves K2O/Ba-MCM-41 as Catalysts. ACS Sustain Chem Eng 2013, 1, 1412–1416. [Google Scholar] [CrossRef]
- Da Mota, S.A.P.; Mancio, A.A.; Lhamas, D.E.L.; de Abreu, D.H.; da Silva, M.S.; dos Santos, W.G.; de Castro, D.A.R.; de Oliveira, R.M.; Ara?jo, M.E.; Borges, L.E.P.; et al. Production of Green Diesel by Thermal Catalytic Cracking of Crude Palm Oil (Elaeis Guineensis Jacq) in a Pilot Plant. J Anal Appl Pyrolysis 2013. [Google Scholar] [CrossRef]
- Chiaramonti, D.; Buffi, M.; Rizzo, A.M.; Lotti, G.; Prussi, M. Bio-Hydrocarbons through Catalytic Pyrolysis of Used Cooking Oils and Fatty Acids for Sustainable Jet and Road Fuel Production. Biomass Bioenergy 2016, 95, 424–435. [Google Scholar] [CrossRef]
- Sousa, F.P.; Silva, L.N.; de Rezende, D.B.; de Oliveira, L.C.A.; Pasa, V.M.D. Simultaneous Deoxygenation, Cracking and Isomerization of Palm Kernel Oil and Palm Olein over Beta Zeolite to Produce Biogasoline, Green Diesel and Biojet-Fuel. Fuel 2018, 223, 149–156. [Google Scholar] [CrossRef]
- Silva Freitas, L.N.; de Sousa, F.P.; Rodrigues de Carvalho, A.; Pasa, V.M.D. Study of Direct Synthesis of Bio-Hydrocarbons from Macauba Oils Using Zeolites as Catalysts. Fuel 2021, 287. [Google Scholar] [CrossRef]
- Cao, X.; Li, L.; Shitao, Y.; Liu, S.; Hailong, Y.; Qiong, W.; Ragauskas, A.J. Catalytic Conversion of Waste Cooking Oils for the Production of Liquid Hydrocarbon Biofuels Using In-Situ Coating Metal Oxide on SBA-15 as Heterogeneous Catalyst. J Anal Appl Pyrolysis 2019, 138, 137–144. [Google Scholar] [CrossRef]
- Le-Phuc, N.; Tran, T. V.; Phan, T.T.; Ngo, P.T.; Ha, Q.L.M.; Luong, T.N.; Tran, T.H.; Phan, T.T. High-Efficient Production of Biofuels Using Spent Fluid Catalytic Cracking (FCC) Catalysts and High Acid Value Waste Cooking Oils. Renew Energy 2021, 168, 57–63. [Google Scholar] [CrossRef]
- Ramya, G.; Sudhakar, R.; Joice, J.A.I.; Ramakrishnan, R.; Sivakumar, T. Liquid Hydrocarbon Fuels from Jatropha Oil through Catalytic Cracking Technology Using AlMCM-41/ZSM-5 Composite Catalysts. Applied Catalysis a-General 2012, 433, 170–178. [Google Scholar] [CrossRef]
- Le, T.H.N.; Tran, Q. V; Nguyen, T.T.L.; Van, D.S.T.; Yang, X.Y.; Su, B.L. Preparation of Bio-Fuels by Catalytic Cracking Reaction of Vegetable Oil Sludge. Fuel 2011, 90, 1069–1075. [Google Scholar] [CrossRef]
- Yan, S.; DiMaggio, C.; Wang, H.; Mohan, S.; Kim, M.; Yang, L.; O. Salley, S.; Y. Simon Ng, K. Catalytic Conversion of Triglycerides to Liquid Biofuels Through Transesterification, Cracking, and Hydrotreatment Processes. Current Catalysis 2012, 1, 41–51. [Google Scholar]
- Melero, J.A.; García, A.; Clavero, M. Production of Biofuels via Catalytic Cracking. In Handbook of Biofuels Production; Woodhead Publishing, 2011; pp. 390–419 ISBN 978-1-84569-679-5.
- Mâncio, A.A.; da Costa, K.M.B.; Ferreira, C.C.; Santos, M.C.; Lhamas, D.E.L.; da Mota, S.A.P.; Leão, R.A.C.; de Souza, R.O.M.A.; Araújo, M.E.; Borges, L.E.P.; et al. Process Analysis of Physicochemical Properties and Chemical Composition of Organic Liquid Products Obtained by Thermochemical Conversion of Palm Oil. J Anal Appl Pyrolysis 2016. [Google Scholar] [CrossRef]
- Stedile, T.; Ender, L.; Meier, H.F.; Simionatto, E.L.; Wiggers, V.R. Comparison between Physical Properties and Chemical Composition of Bio-Oils Derived from Lignocellulose and Triglyceride Sources. Renewable & Sustainable Energy Reviews 2015, 50, 92–108. [Google Scholar] [CrossRef]
- Guedes, R.E.; Luna, A.S.; Torres, A.R. Operating Parameters for Bio-Oil Production in Biomass Pyrolysis: A Review. J Anal Appl Pyrolysis 2018, 129, 134–149. [Google Scholar] [CrossRef]
- Wang, S. High-Efficiency Separation of Bio-Oil. 2013. [Google Scholar] [CrossRef]
- Maher, K.D.; Bressler, D.C. Pyrolysis of Triglyceride Materials for the Production of Renewable Fuels and Chemicals. Bioresour Technol 2007, 98, 2351–2368. [Google Scholar] [CrossRef] [PubMed]
- Buzetzki, E.; Sidorová, K.; Cvengrošová, Z.; Cvengroš, J. Effects of Oil Type on Products Obtained by Cracking of Oils and Fats. Fuel Processing Technology 2011, 92, 2041–2047. [Google Scholar] [CrossRef]
- Buzetzki, E.; Sidorová, K.; Cvengrošová, Z.; Kaszonyi, A.; Cvengroš, J. The Influence of Zeolite Catalysts on the Products of Rapeseed Oil Cracking. Fuel Processing Technology 2011, 92, 1623–1631. [Google Scholar] [CrossRef]
- Wiggers, V.R.; Wisniewski, A.; Madureira, L.A.S.; Barros, A.A.C.; Meier, H.F. Biofuels from Waste Fish Oil Pyrolysis: Continuous Production in a Pilot Plant. Fuel 2009, 88, 2135–2141. [Google Scholar] [CrossRef]
- Junming, X.; Jianchun, J.; Yanju, L.; Jie, C. Liquid Hydrocarbon Fuels Obtained by the Pyrolysis of Soybean Oils. Bioresour Technol 2009, 100, 4867–4870. [Google Scholar] [CrossRef]
- Weber, B.; Stadlbauer, E.A.; Stengl, S.; Hossain, M.; Frank, A.; Steffens, D.; Schlich, E.; Schilling, G. Production of Hydrocarbons from Fatty Acids and Animal Fat in the Presence of Water and Sodium Carbonate: Reactor Performance and Fuel Properties. Fuel 2012, 94, 262–269. [Google Scholar] [CrossRef]
- Mecha, A.C.; Onyango, M.S.; Ochieng, A.; Momba, M.N.B. Ultraviolet and Solar Photocatalytic Ozonation of Municipal Wastewater: Catalyst Reuse, Energy Requirements and Toxicity Assessment. Chemosphere 2017, 186, 669–676. [Google Scholar] [CrossRef]
- Salmiaton, A.; Garforth, A.A. Multiple Use of Waste Catalysts with and without Regeneration for Waste Polymer Cracking. Waste Management 2011, 31, 1139–1145. [Google Scholar] [CrossRef]
- Widayatno, W.B.; Guan, G.; Rizkiana, J.; Yang, J.; Hao, X.; Tsutsumi, A.; Abudula, A. Upgrading of Bio-Oil from Biomass Pyrolysis over Cu-Modified β-Zeolite Catalyst with High Selectivity and Stability. Appl Catal B 2016, 186, 166–172. [Google Scholar] [CrossRef]
- Xiu, S.N.; Shahbazi, A. Bio-Oil Production and Upgrading Research: A Review. Renewable & Sustainable Energy Reviews 2012, 16, 4406–4414. [Google Scholar] [CrossRef]
- Capunitan, J.A.; Capareda, S.C. Characterization and Separation of Corn Stover Bio-Oil by Fractional Distillation. Fuel 2013, 112, 60–73. [Google Scholar] [CrossRef]
- Nam, H.; Choi, J.; Capareda, S.C. Comparative Study of Vacuum and Fractional Distillation Using Pyrolytic Microalgae (Nannochloropsis Oculata) Bio-Oil. Algal Res 2016, 17, 87–96. [Google Scholar] [CrossRef]
- Fegade, S.; Tande, B.; Kubatova, A.; Seames, W.; Kozliak, E. Novel Two-Step Process for the Production of Renewable Aromatic Hydrocarbons from Triacylglycerides. Ind Eng Chem Res 2015, 54, 9657–9665. [Google Scholar] [CrossRef]
- Wisniewski, A.; Wosniak, L.; Scharf, D.R.; Wiggers, V.R.; Meier, H.F.; Simionatto, E.L. Upgrade of Biofuels Obtained from Waste Fish Oil Pyrolysis by Reactive Distillation. J Braz Chem Soc 2015, 26, 224–232. [Google Scholar] [CrossRef]
- da Silva Almeida, H.; Corrêa, O.A.; Eid, J.G.; Ribeiro, H.J.; de Castro, D.A.R.; Pereira, M.S.; Pereira, L.M.; de Andrade Aâncio, A.; Santos, M.C.; da Mota, S.A.P.; et al. Performance of Thermochemical Conversion of Fat, Oils, and Grease into Kerosene-like Hydrocarbons in Different Production Scales. J Anal Appl Pyrolysis 2016, 120, 126–143. [Google Scholar] [CrossRef]
- Mancio, A.A.; da Mota, S.A.P.; Ferreira, C.C.; Carvalho, T.U.S.; Neto, O.S.; Zamian, J.R.; Araújo, M.E.; Borges, L.E.P.; Machado, N.T. Separation and Characterization of Biofuels in the Jet Fuel and Diesel Fuel Ranges by Fractional Distillation of Organic Liquid Products. Fuel 2018. [Google Scholar] [CrossRef]
- Ferreira, C.C.; Costa, E.C.; de Castro, D.A.R.; Pereira, M.S.; Mâncio, A.A.; Santos, M.C.; Lhamas, D.E.L.; da Mota, S.A.P.; Leão, A.C.; Duvoisin, S.; et al. Deacidification of Organic Liquid Products by Fractional Distillation in Laboratory and Pilot Scales. J Anal Appl Pyrolysis 2017, 127. [Google Scholar] [CrossRef]
- Varuvel, E.G.; Mrad, N.; Tazerout, M.; Aloui, F. Assessment of Liquid Fuel (Bio-Oil) Production from Waste Fish Fat and Utilization in Diesel Engine. Appl Energy 2012, 100, 249–257. [Google Scholar] [CrossRef]
- Yuan, X.; Sun, M.; Wang, C.; Zhu, X. Full Temperature Range Study of Rice Husk Bio-Oil Distillation: Distillation Characteristics and Product Distribution. Sep Purif Technol 2021, 263, 118382. [Google Scholar] [CrossRef]
- Ma, Y.K.; Yuan, X.H.; Luo, Z.J.; Zhu, X.F. Influence of Vacuum Degrees in Rectification System on Distillation Characteristics of Bio-Oil Model Compounds. Ranliao Huaxue Xuebao/Journal of Fuel Chemistry and Technology 2022, 50, 160–165. [Google Scholar] [CrossRef]
- Suota, M.J.; Simionatto, E.L.; Scharf, D.R.; Meier, H.F.; Wiggers, V.R. Esterification, Distillation, and Chemical Characterization of Bio-Oil and Its Fractions. Energy and Fuels 2019, 33, 9886–9894. [Google Scholar] [CrossRef]
- Elkasabi, Y.; Mullen, C.A.; Boateng, A.A.; Brown, A.; Timko, M.T. Flash Distillation of Bio-Oils for Simultaneous Production of Hydrocarbons and Green Coke. Ind Eng Chem Res 2019, 58, 1794–1802. [Google Scholar] [CrossRef]
- De Oliveira, B.F.H.; De França, L.F.; Corrêa, N.C.F.; Da Paixão Ribeiro, N.F.; Velasquez, M. Renewable Diesel Production from Palm Fatty Acids Distillate (Pfad) via Deoxygenation Reactions. Catalysts 2021, 11, 1–16. [Google Scholar] [CrossRef]
- Rocha de Castro, D.A.; da Silva Ribeiro, H.J.; Hamoy Guerreiro, L.H.; Pinto Bernar, L.; Jonatan Bremer, S.; Costa Santo, M.; da Silva Almeida, H.; Duvoisin, S.; Pizarro Borges, L.E.; Teixeira Machado, N. Production of Fuel-like Fractions by Fractional Distillation of Bio-Oil from Açaí (Euterpe Oleracea Mart.) Seeds Pyrolysis. Energies (Basel) 2021, 14, 1–27. [Google Scholar] [CrossRef]
- Zhang, X.S.; Yang, G.X.; Jiang, H.; Liu, W.J.; Ding, H.S. Mass Production of Chemicals from Biomass-Derived Oil by Directly Atmospheric Distillation Coupled with Co-Pyrolysis. Sci Rep 2013, 3, 7. [Google Scholar] [CrossRef]
- Lhamas, D.E.L. Estudo Do Processo de Craqueamento Termocatalítico Do Óleo de Palma (Elaeis Guineensis) e Do Óleo de Buriti (Mauritia Flexuosa L.) Para Produção de Biocombustível, Belém-PA, 2013, Vol. Tese de do.
- Paquot, C. 2.203 - Determination of the Ester Value (E.V.). In Standard Methods for the Analysis of Oils, Fats and Derivatives (Sixth Edition); Pergamon, 1979; p. 60 ISBN 978-0-08-022379-7.
- Reddy, V.; Rao, H.; Jayaveera, K. Influence of Strong Alkaline Substances (Sodium Carbonate and Sodium Bicarbonate) in Mixing Water on Strength and Setting Properties of Concrete. Indian Journal Of Engineering And Materials Sciences 2006, 13, 123–128. [Google Scholar]
- Taufiqurrahmi, N.; Bhatia, S. Catalytic Cracking of Edible and Non-Edible Oils for the Production of Biofuels. Energy Environ Sci 2011, 4, 1087–1112. [Google Scholar] [CrossRef]
- Vonghia, E.; Boocock, D.G.B.; Konar, S.K.; Leung, A. Pathways for the Deoxygenation of Triglycerides to Aliphatic Hydrocarbons over Activated Alumina. Energy & Fuels 1995, 9, 1090–1096. [Google Scholar] [CrossRef]
- Katikaneni, S.P.R.; Adjaye, J.D.; Bakhshi, N.N. Studies on the Catalytic Conversion of Canola Oil to Hydrocarbons - Influence of Hybrid Catalysts and Steam. Energy & Fuels 1995, 9, 599–609. [Google Scholar] [CrossRef]
- Idem, R.O.; Katikaneni, S.P.R.; Bakhshi, N.N. Thermal Cracking of Canola Oil: Reaction Products in the Presence and Absence of Steam. Energy & Fuels 1996, 10, 1150–1162. [Google Scholar] [CrossRef]
- Leng, T.Y.; Mohamed, A.R.; Bhatia, S. Catalytic Conversion of Palm Oil to Fuels and Chemicals. Can J Chem Eng 1999, 77, 156–162. [Google Scholar] [CrossRef]
- Karnjanakom, S.; Guan, G.; Asep, B.; Du, X.; Hao, X.; Yang, J.; Samart, C.; Abudula, A. A Green Method to Increase Yield and Quality of Bio-Oil: Ultrasonic Pretreatment of Biomass and Catalytic Upgrading of Bio-Oil over Metal (Cu, Fe and/or Zn)/γ-Al2O3. RSC Adv 2015, 5, 83494–83503. [Google Scholar] [CrossRef]
- Dandik, L.; Aksoy, H.A. Pyrolysis of Used Sunflower Oil in the Presence of Sodium Carbonate by Using Fractionating Pyrolysis Reactor. Fuel Processing Technology 1998, 57, 81–92. [Google Scholar] [CrossRef]
- Prado, C.M.R.; Antoniosi Filho, N.R. Production and Characterization of the Biofuels Obtained by Thermal Cracking and Thermal Catalytic Cracking of Vegetable Oils. J Anal Appl Pyrolysis 2009, 86, 338–347. [Google Scholar] [CrossRef]
- Agencia Nacional de Petróleo, Gás Natural e Biocombustíveis − ANP. Resolucão n° 65 de 09 de dezembro de 2011; http://www.anp.org. br (accessed Abril 10, 2020).
- Silverstein, R.M.; Webster, F.X.; Kiemle, D.J. Spectrometric Identification of Organic Compounds; 7th Editio.; John Wiley & Sons, Inc.: Hoboken, NJ, 2005. [Google Scholar]
- Pavia, D.L.; Lampman, G.M.; Kriz, G.S.; Vyvyan, J.R. Introduction to Spectroscopy; 4th Editio.; Cengage Learning: Belmont, CA - USA, 2009. [Google Scholar]
- Zhang, S.; Yan, Y.; Li, T.; Ren, Z. Upgrading of Liquid Fuel from the Pyrolysis of Biomass. Bioresour Technol 2005, 96, 545–550. [Google Scholar] [CrossRef] [PubMed]
- Hew, K.L.; Tamidi, A.M.; Yusup, S.; Lee, K.T.; Ahmad, M.M. Catalytic Cracking of Bio-Oil to Organic Liquid Product (OLP). Bioresour Technol 2010, 101, 8855–8858. [Google Scholar] [CrossRef] [PubMed]
- Abnisa, F.; Daud, W.M.A.W.; Husin, W.N.W.; Sahu, J.N. Utilization Possibilities of Palm Shell as a Source of Biomass Energy in Malaysia by Producing Bio-Oil in Pyrolysis Process. Biomass Bioenergy 2011, 35, 1863–1872. [Google Scholar] [CrossRef]
- ASTM D975-19a, Standard Specification for Diesel Fuel, ASTM International, West Conshohocken, PA, 2019, www.astm.org.
- Canapi, E.C.; Agustin, Y.T. V; Moro, E.A.; Pedrosa Jr., E.; Bendaño, M.L.J. Coconut Oil. In Bailey’s Industrial Oil and Fat Products; Shahidi, F., Ed.; John Wiley & Sons, Inc.: New Jersey, 2005. [Google Scholar]
- Swern, D. No Title. In Bailey’s Industrial Oils and Fat Products; Swern, D., Ed.; Interscience Publishers: New York, 1964; pp. 128–131. [Google Scholar]
- Ong, Y.K.; Bhatia, S. The Current Status and Perspectives of Biofuel Production via Catalytic Cracking of Edible and Non-Edible Oils. Energy 2010, 35, 111–119. [Google Scholar] [CrossRef]
- Kurniawan, T.; Setiawan, A.; Putri, N.A.; Irawan, A.; Nandiyanto, A.B.D.; Bindar, Y. Catalytic Pyrolysis of Coconut Oil Soap Using Zeolites for Bio-Hydrocarbon Production. Biomass Convers Biorefin 2021, 6847–6858. [Google Scholar] [CrossRef]
- Chew, T.L.; Bhatia, S. Effect of Catalyst Additives on the Production of Biofuels from Palm Oil Cracking in a Transport Riser Reactor. Bioresour Technol 2009, 100, 2540–2545. [Google Scholar] [CrossRef] [PubMed]
- Elkasabi, Y.; Mullen, C.A.; Jackson, M.A.; Boateng, A.A. Characterization of Fast-Pyrolysis Bio-Oil Distillation Residues and Their Potential Applications. J Anal Appl Pyrolysis 2015, 114, 179–186. [Google Scholar] [CrossRef]
- Elkasabi, Y.; Boateng, A.A.; Jackson, M.A. Upgrading of Bio-Oil Distillation Bottoms into Biorenewable Calcined Coke. Biomass Bioenergy 2015, 81, 415–423. [Google Scholar] [CrossRef]
- Agencia Nacional de Petróleo, Gás Natural e Biocombustíveis − ANP. Resolucão n° 40 de 25 de outubro de 2013; http://www.anp.org. br (accessed Abril 10, 2020).
- ASTM D4814-19a, Standard Specification for Automotive Spark-Ignition Engine Fuel, ASTM International, West Conshohocken, PA, 2019, www.astm.org.
- Agencia Nacional de Petróleo, Gás Natural e Biocombustíveis − ANP. Resolucão nº 37 de 01 de dezembro de 2009; http://www.anp.org. br (accessed Abril 10, 2020).
- ASTM D1655-19a, Standard Specification for Aviation Turbine Fuels, ASTM International, West Conshohocken, PA, 2019, www.astm.org.
- Silva, J.P.; Costa, A.L.H.; Chiaro, S.S.X.; Delgado, B.E.P.C.; de Figueiredo, M.A.G.; Senna, L.F. Carboxylic Acid Removal from Model Petroleum Fractions by a Commercial Clay Adsorbent. Fuel Processing Technology 2013, 112, 57–63. [Google Scholar] [CrossRef]
- Speight, J.G. Handbook of Petroleum Product Analysis; John Wiley & Sons, Inc.: Hoboken, New Jersey, 2002. [Google Scholar]
- Fahim, M.A.; Alsahhaf, T.A.; Elkilani, A. Fundamentals of Petroleum Refining; First edit.; Elsevier: Oxford, UK, 2010; ISBN 9780444527851. [Google Scholar]
- Oasmaa, A.; Elliott, D.C.; Korhonen, J. Acidity of Biomass Fast Pyrolysis Bio-Oils. Energy & Fuels 2010, 24, 6548–6554. [Google Scholar] [CrossRef]
- Speight, J.G. Synthetic Fuels Handbook: Properties, Process, and Performance; McGraw-Hill: New York, 2008. [Google Scholar]
- Wiggers, V.R.; Meier, H.F.; Wisniewski, A.; Barros, A.A.C.; Maciel, M.R.W. Biofuels from Continuous Fast Pyrolysis of Soybean Oil: A Pilot Plant Study. Bioresour Technol 2009, 100, 6570–6577. [Google Scholar] [CrossRef]
- Ertas, M.; Alma, M.H. Pyrolysis of Laurel (Laurus Nobilis L.) Extraction Residues in a Fixed-Bed Reactor: Characterization of Bio-Oil and Bio-Char. J Anal Appl Pyrolysis 2010, 88, 22–29. [Google Scholar] [CrossRef]
- Speight, J.G. The Chemistry and Technology of Petroleum; Fourth Edi.; CRC Press: New York, 2006. [Google Scholar]
- Majhi, A.; Sharma, Y.K.; Bal, R.; Behera, B.; Kumar, J. Upgrading of Bio-Oils over PdO/Al2O3 Catalyst and Fractionation. Fuel 2013, 107, 131–137. [Google Scholar] [CrossRef]
Figure 1.
OLP samples at different reaction times.
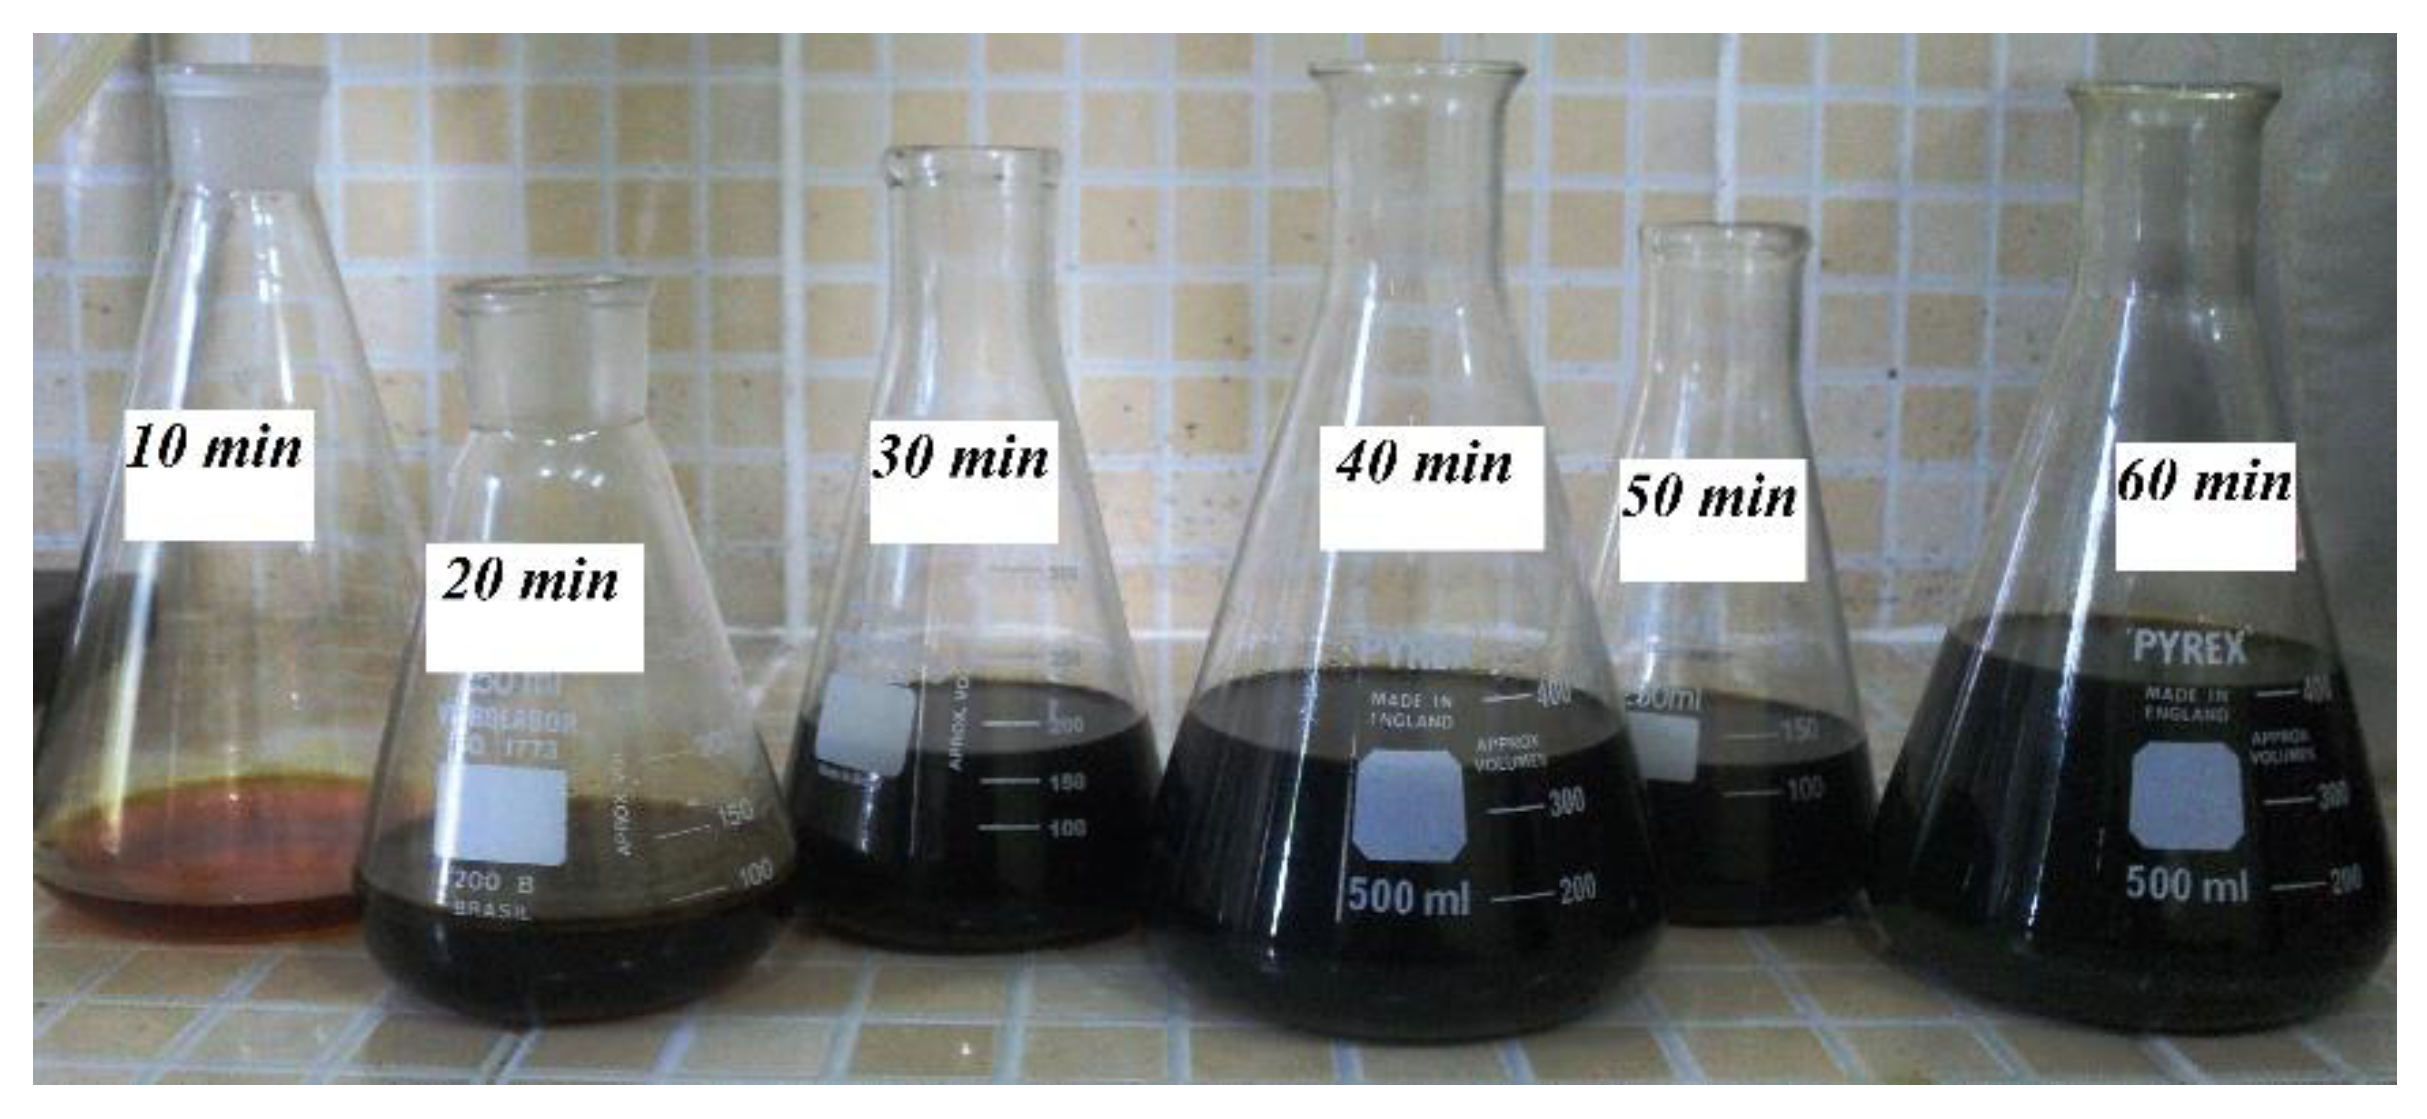
Figure 2.
Remaining mixture (Na2CO3 + coke): (a) before comminution; (b) after comminution.
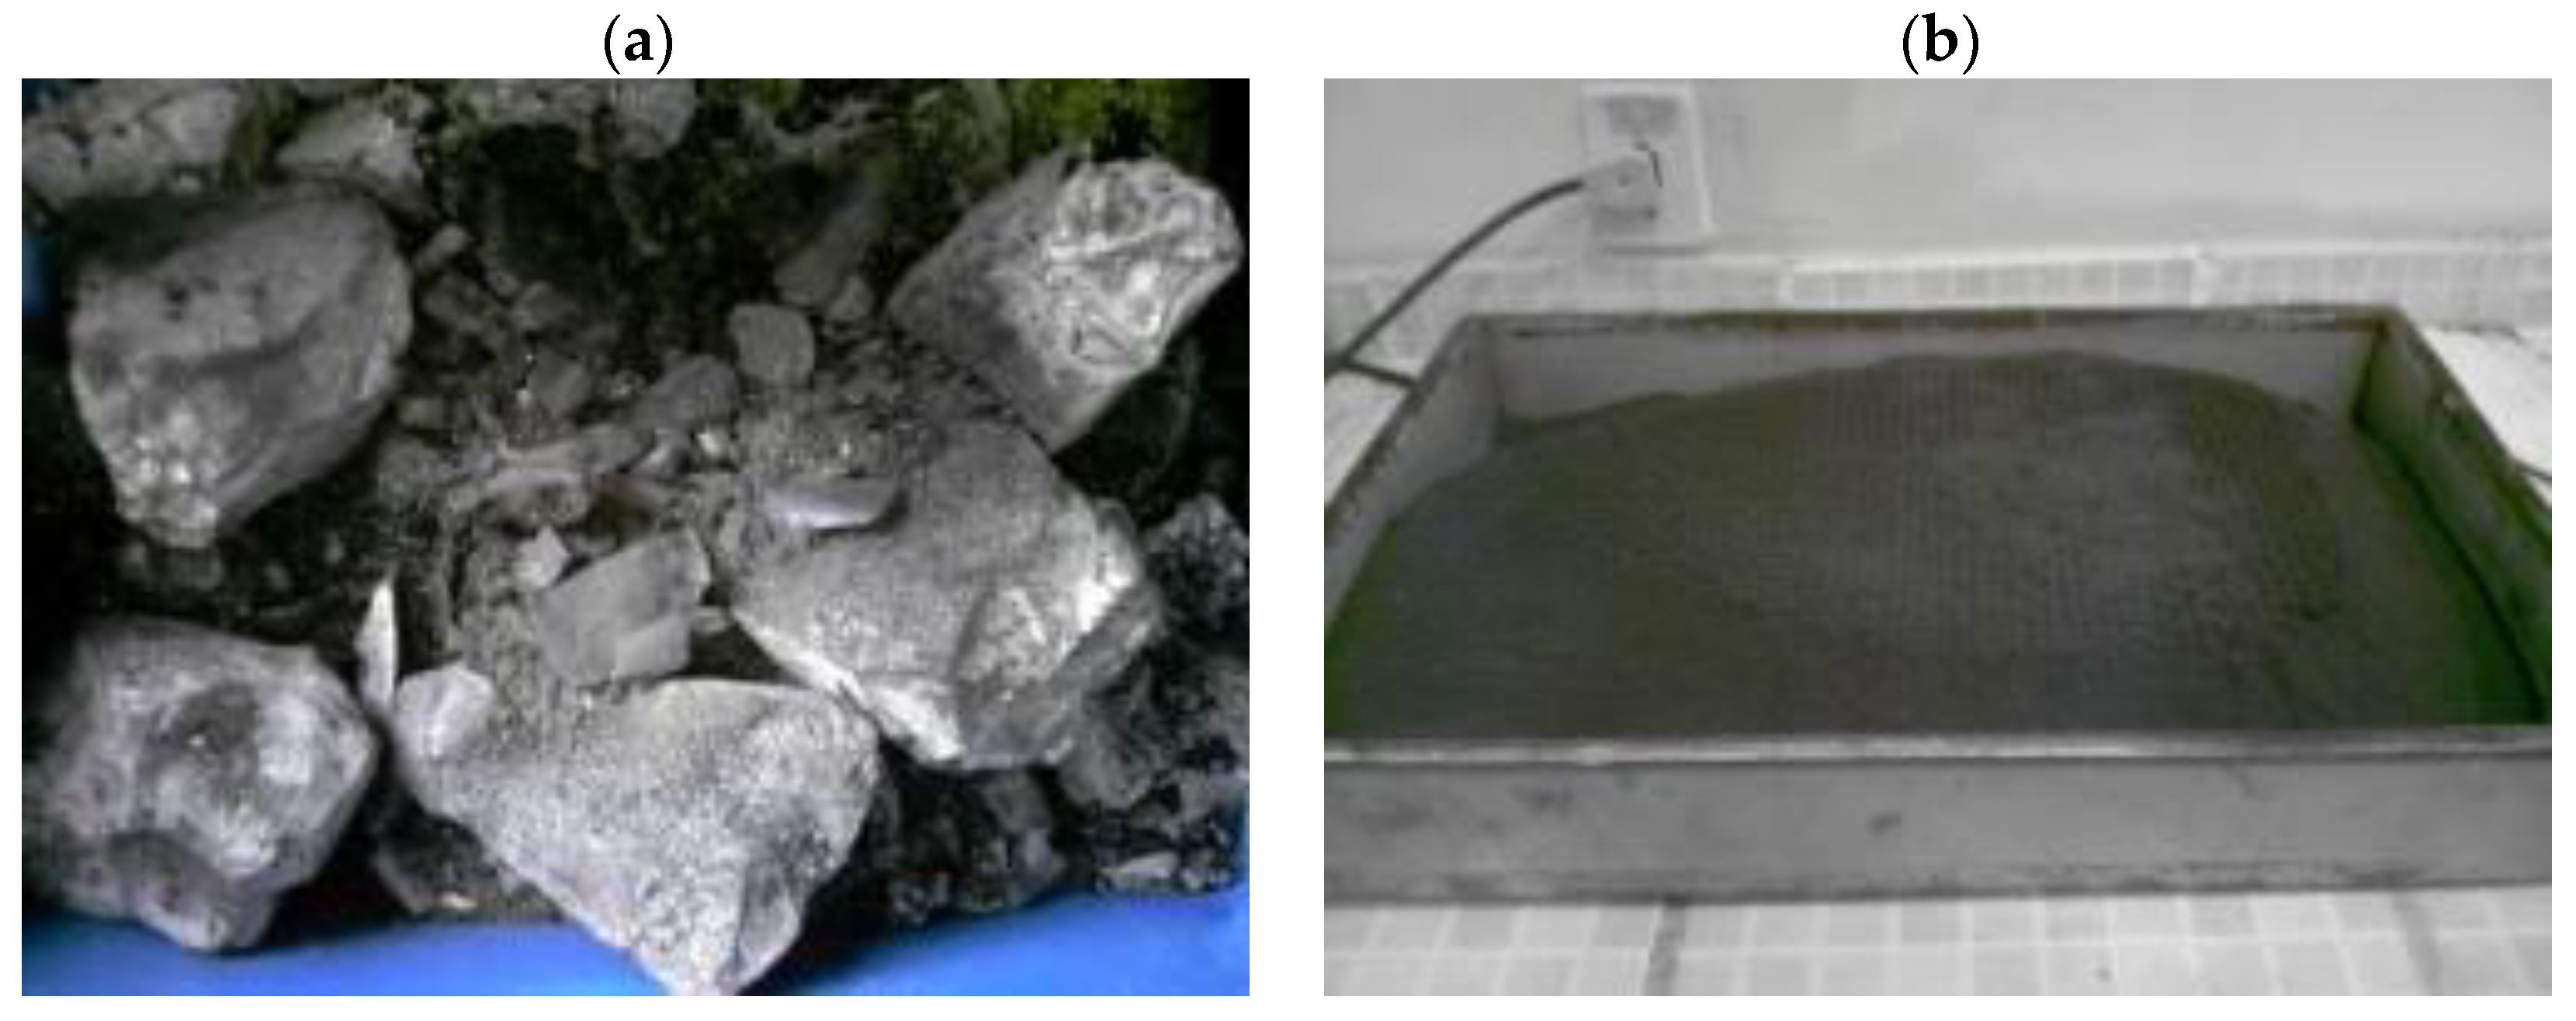
Figure 3.
Samples of the OLP (60 min) and their products after the laboratory fractional distillation: (A) OLP; (B) green gasoline (Range 1); (C) green gasoline (Range 2); (D) green aviation kerosene; (E) green diesel and (F) bottoms product.
Figure 3.
Samples of the OLP (60 min) and their products after the laboratory fractional distillation: (A) OLP; (B) green gasoline (Range 1); (C) green gasoline (Range 2); (D) green aviation kerosene; (E) green diesel and (F) bottoms product.
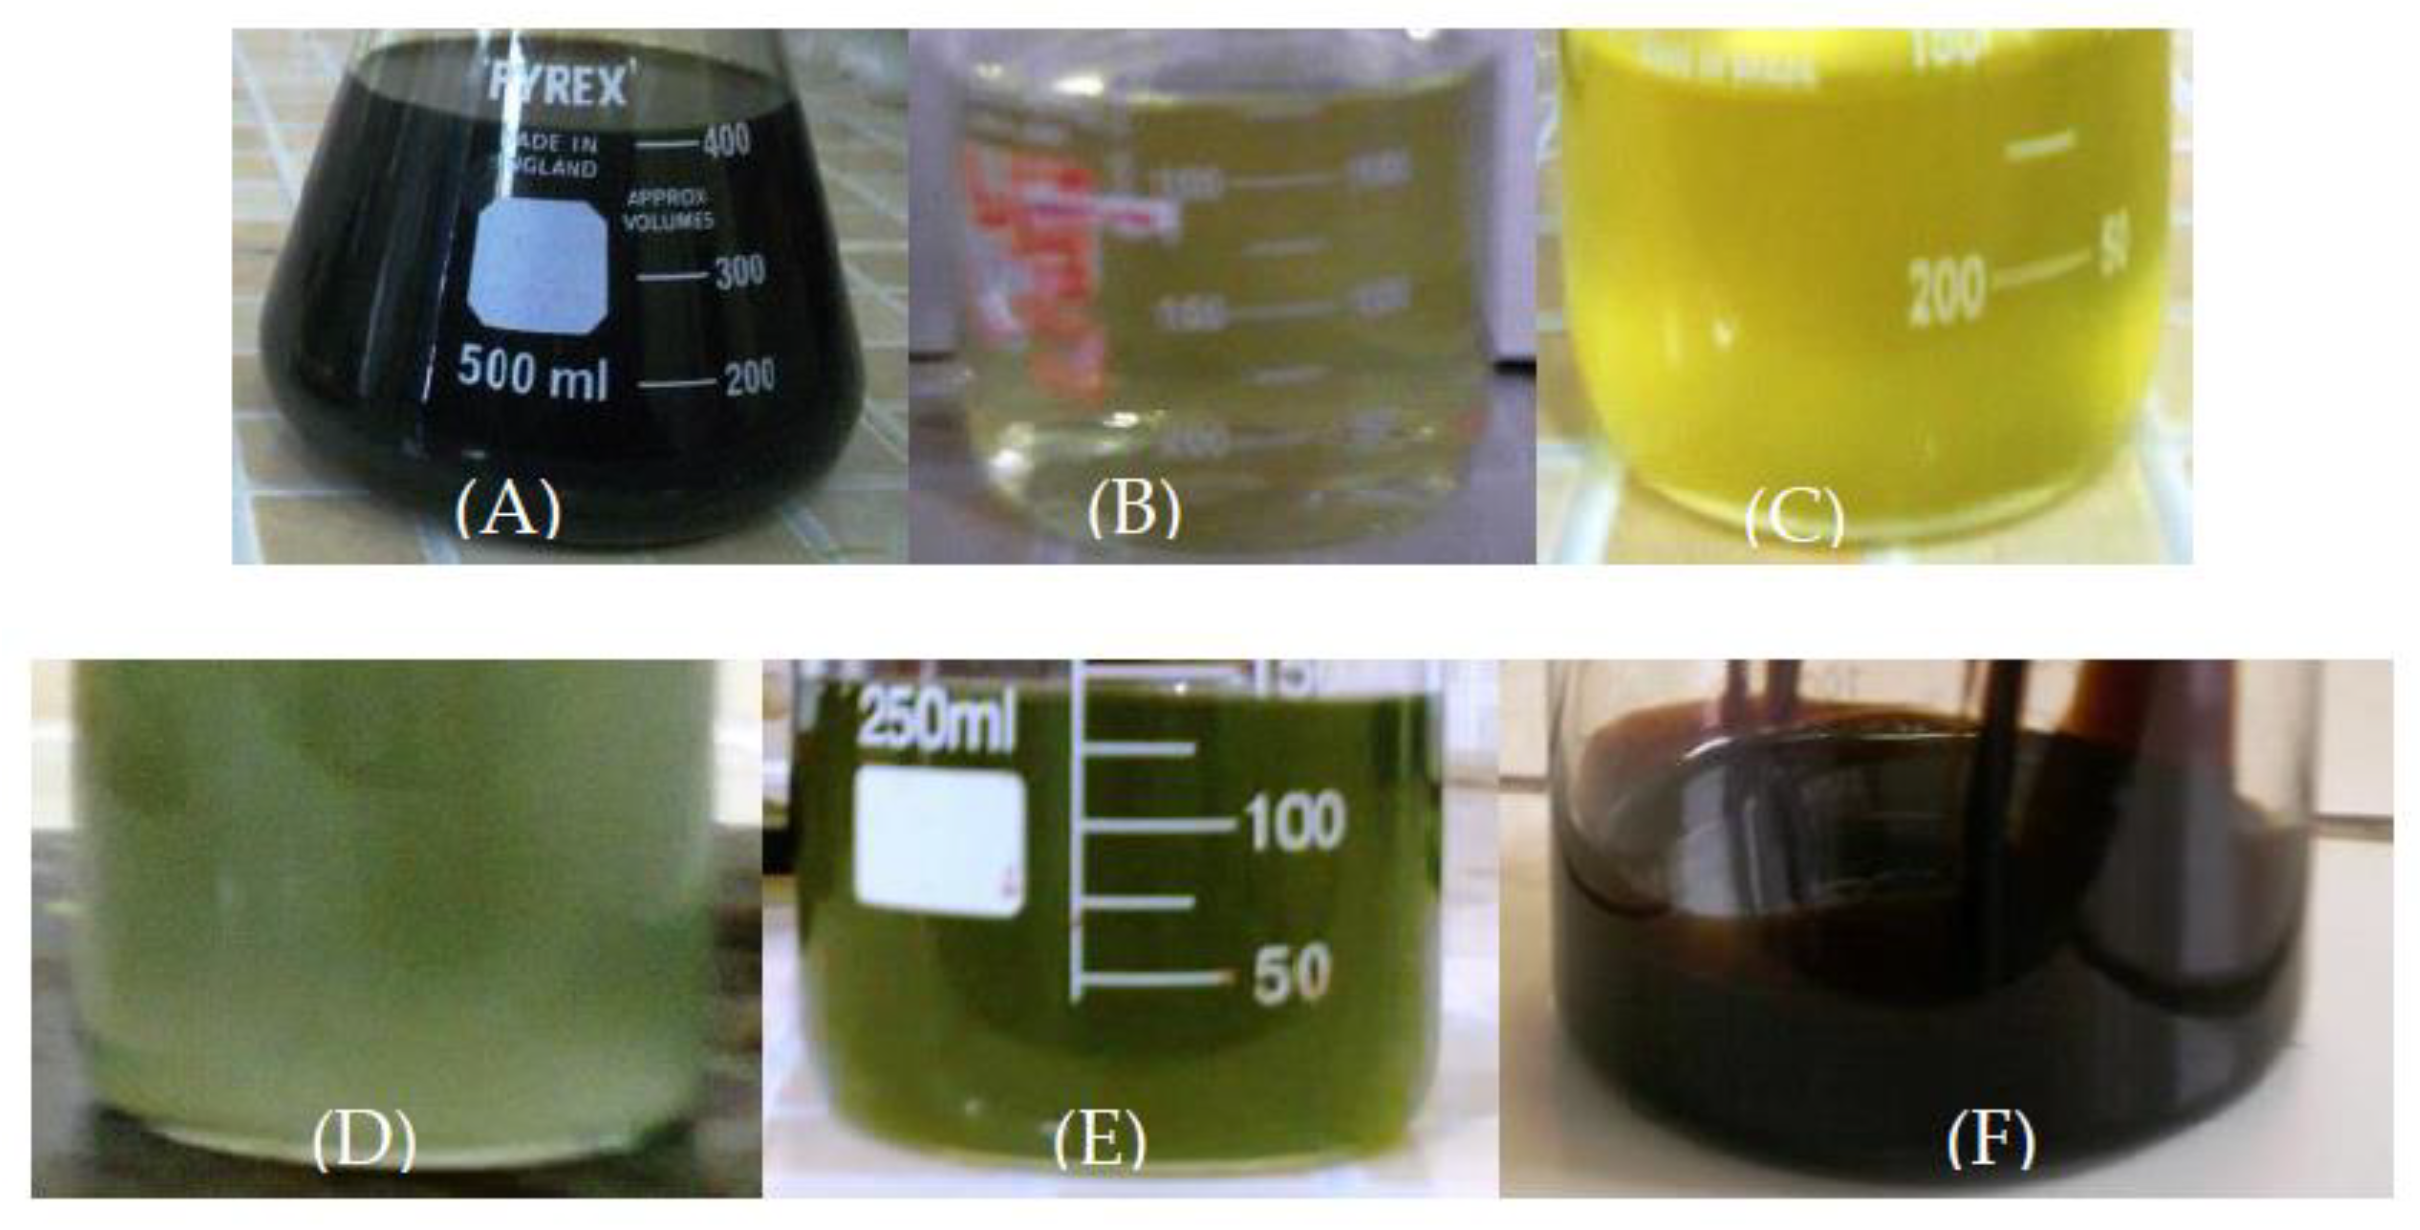
Figure 4.
X-ray diffraction of fresh sodium carbonate (A), reused sodium carbonate (B) and sodium carbonate after the first cycle of reuse (C): Thermonatrite (TN), Natrite (N), Trona (TR), Sodium Stearate (SS), Sodium Phosphate (SP), Dimethylglyoxime (D), and Potassium Acetate (PA).
Figure 4.
X-ray diffraction of fresh sodium carbonate (A), reused sodium carbonate (B) and sodium carbonate after the first cycle of reuse (C): Thermonatrite (TN), Natrite (N), Trona (TR), Sodium Stearate (SS), Sodium Phosphate (SP), Dimethylglyoxime (D), and Potassium Acetate (PA).
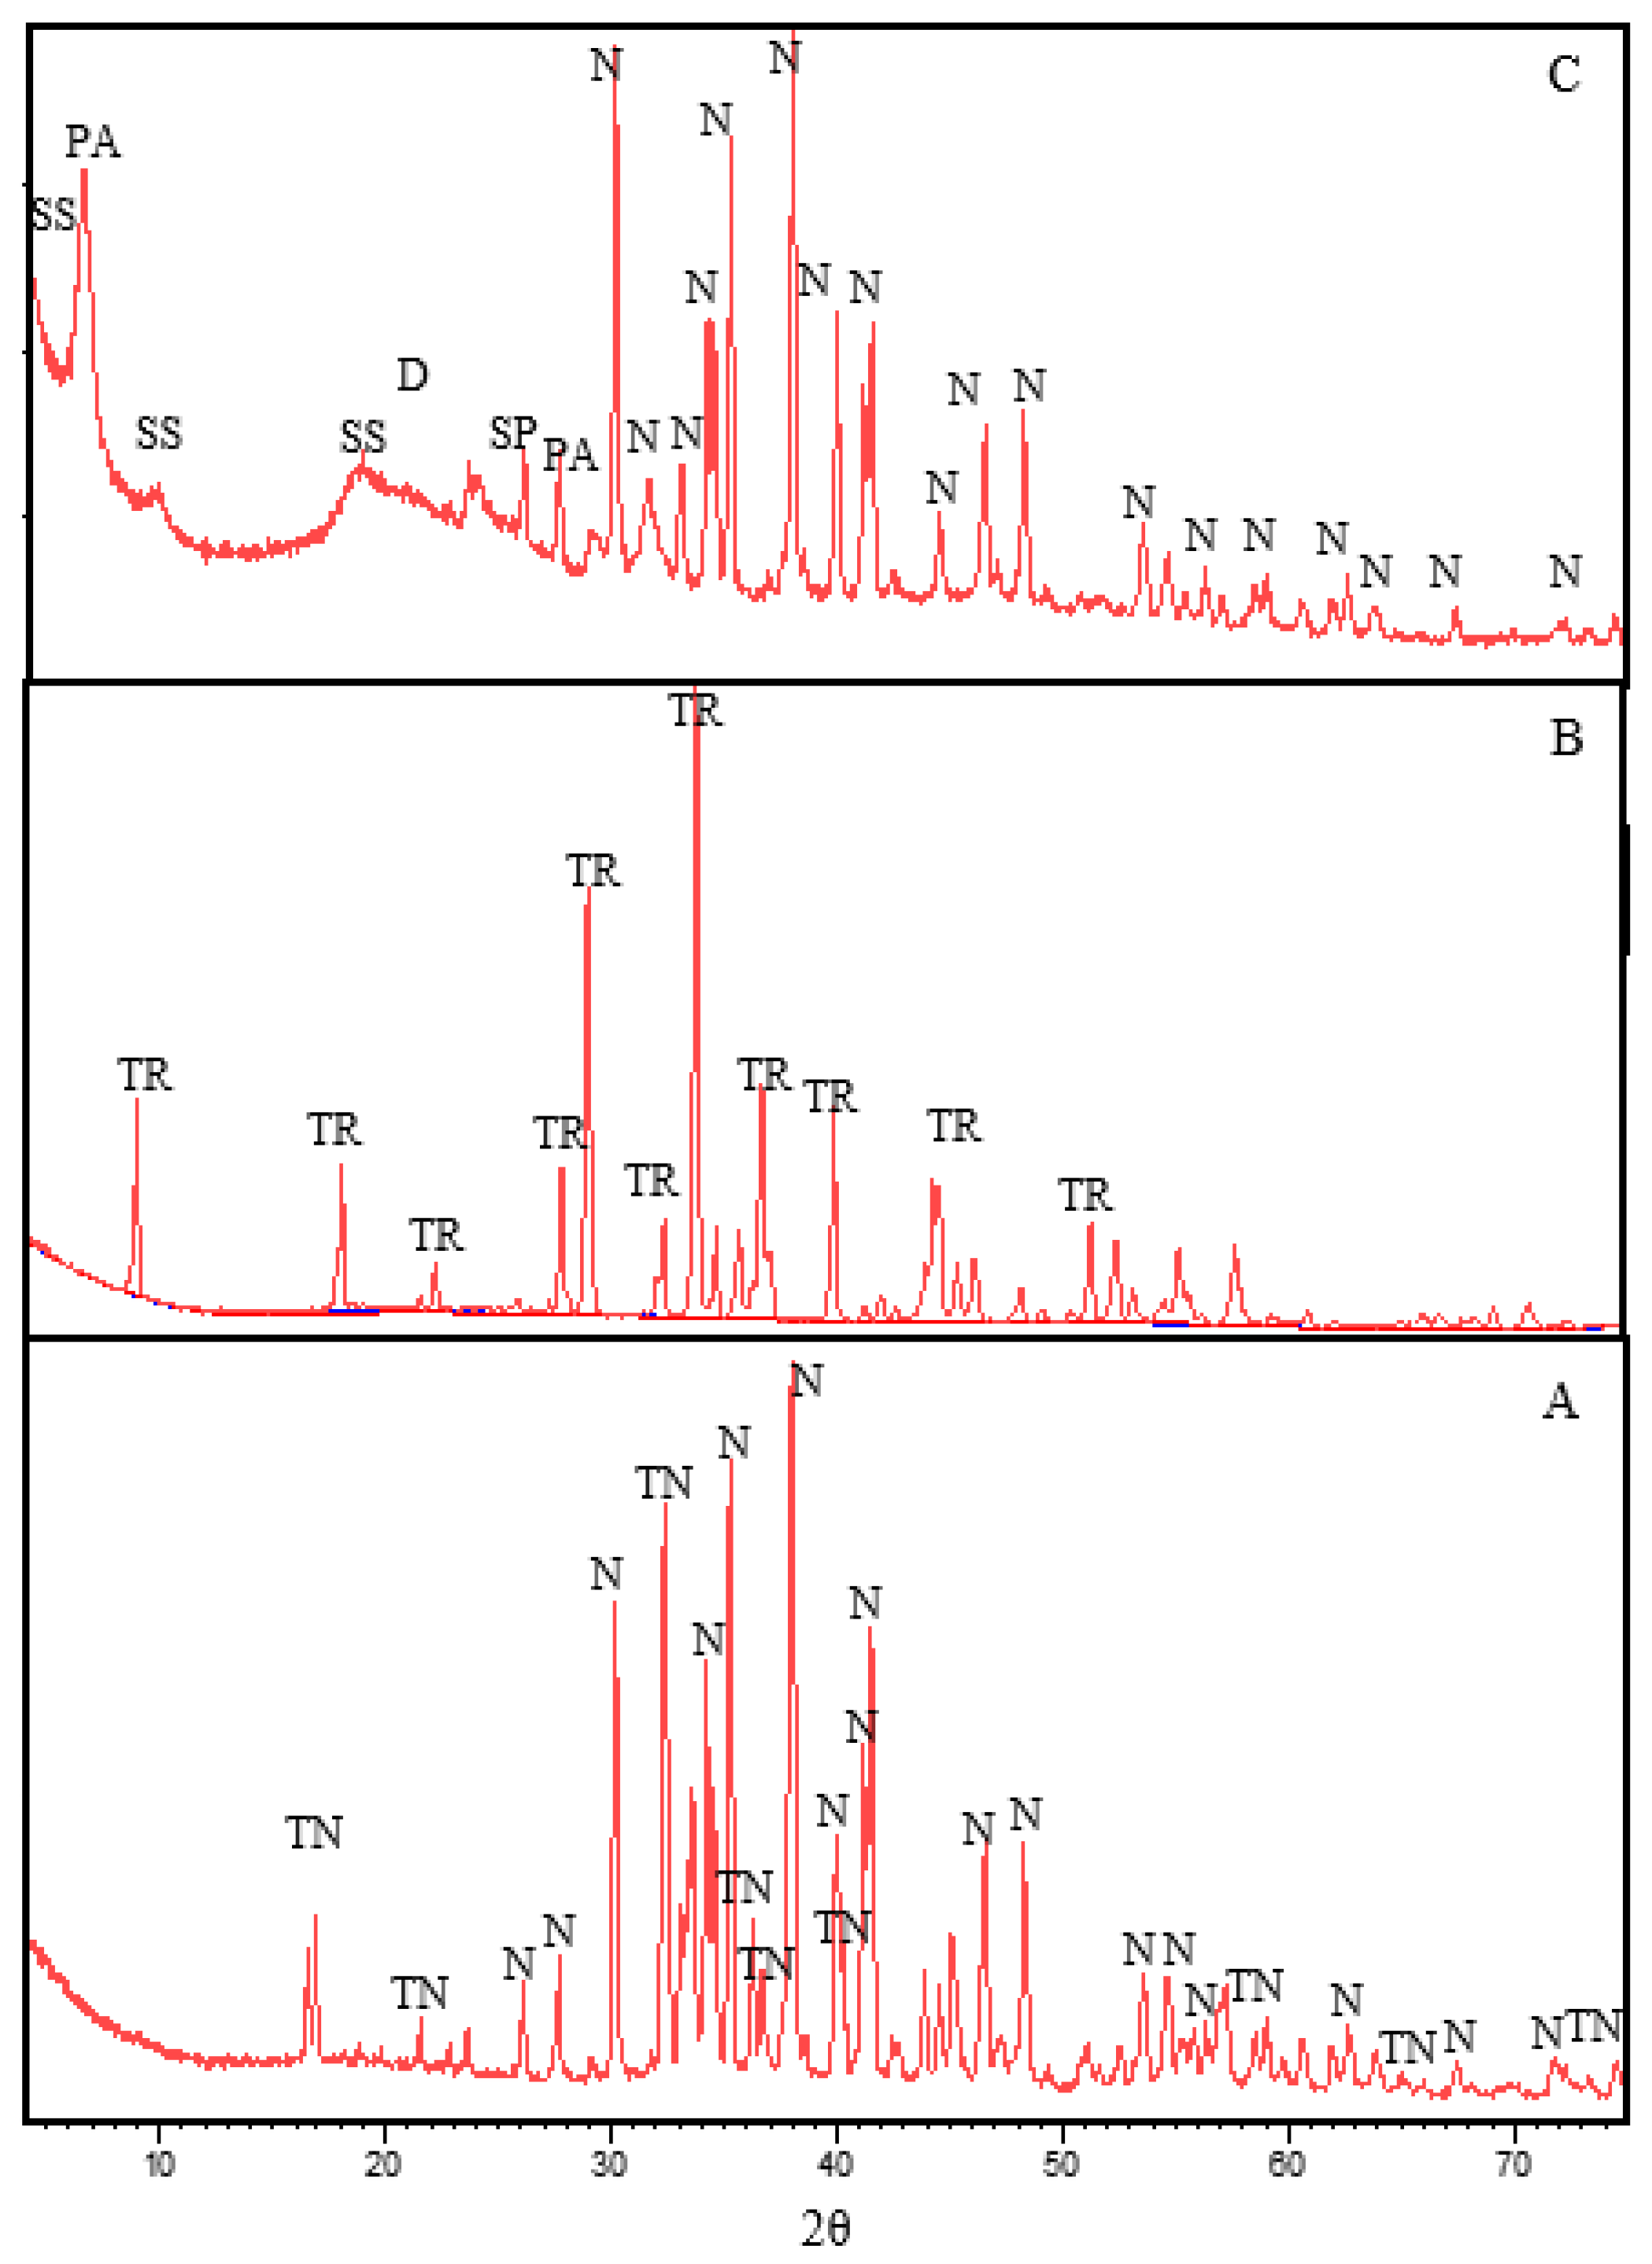
Figure 5.
FTIR of crude palm oil and OLPs produced from thermal and catalytic cracking of palm oil using fresh and reused sodium carbonate as the catalysts.
Figure 5.
FTIR of crude palm oil and OLPs produced from thermal and catalytic cracking of palm oil using fresh and reused sodium carbonate as the catalysts.
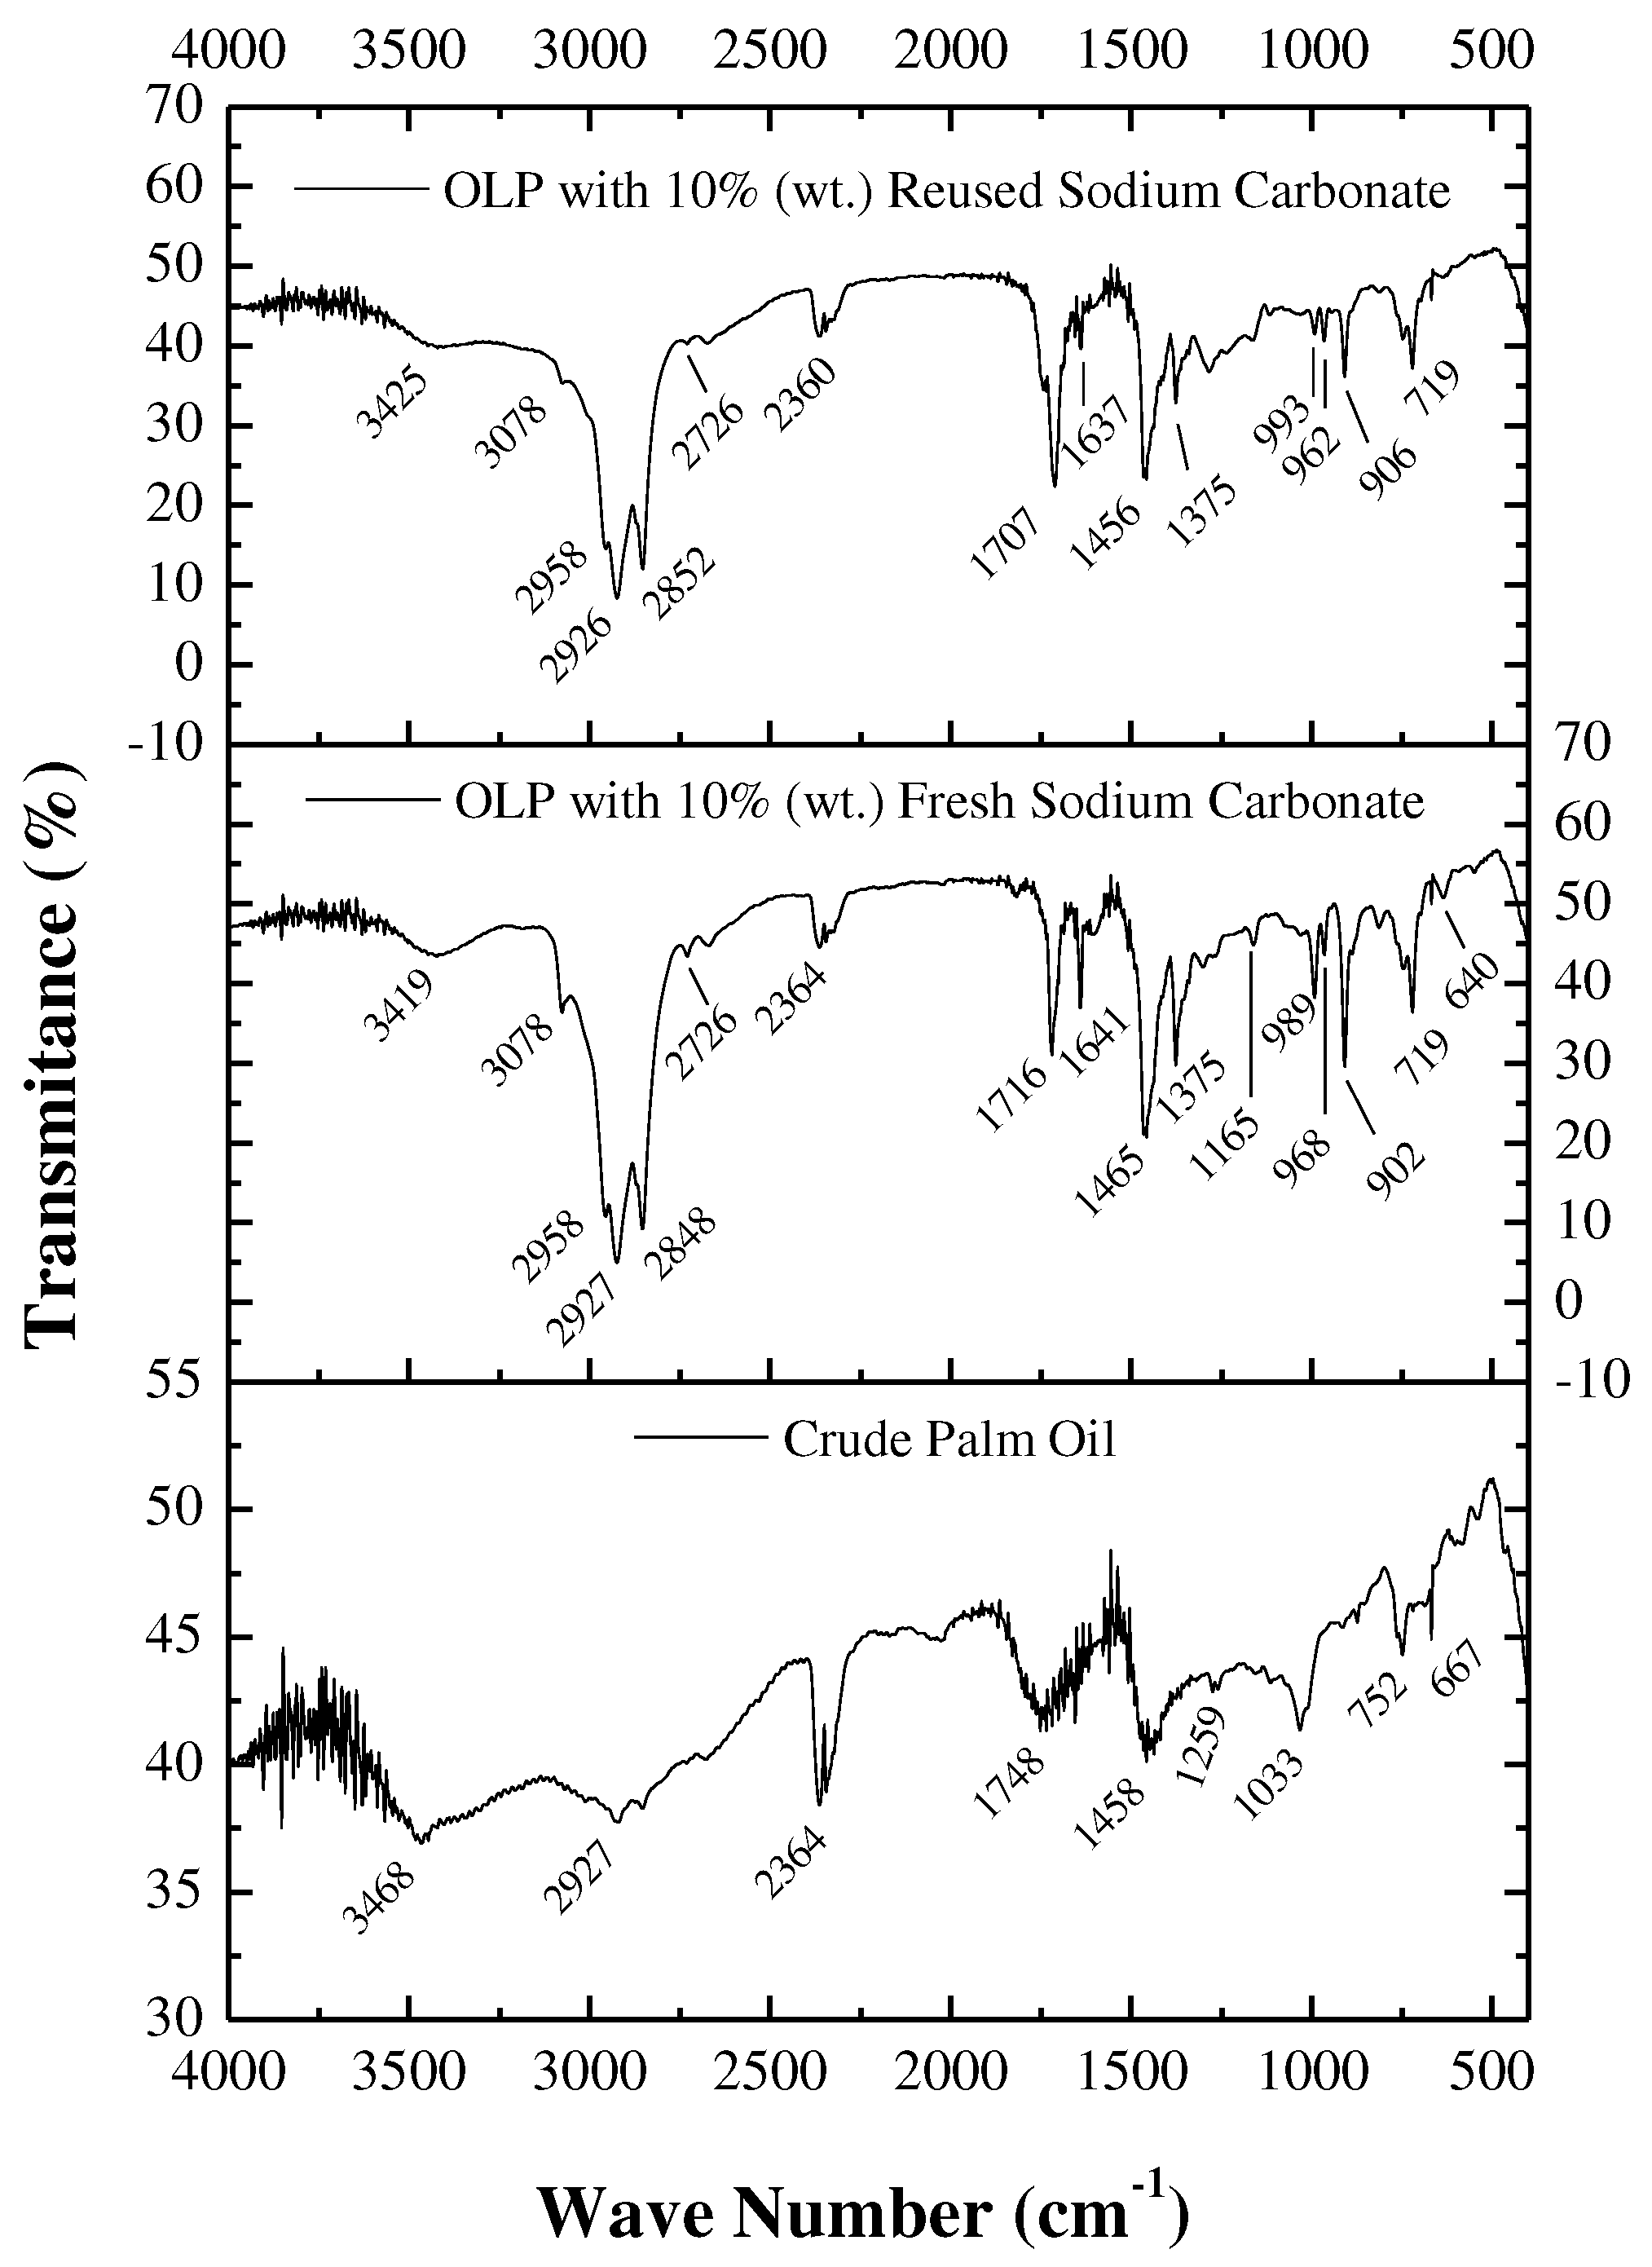
Figure 6.
Specific gravity at 20 °C of OLP samples as a function of cracking time.
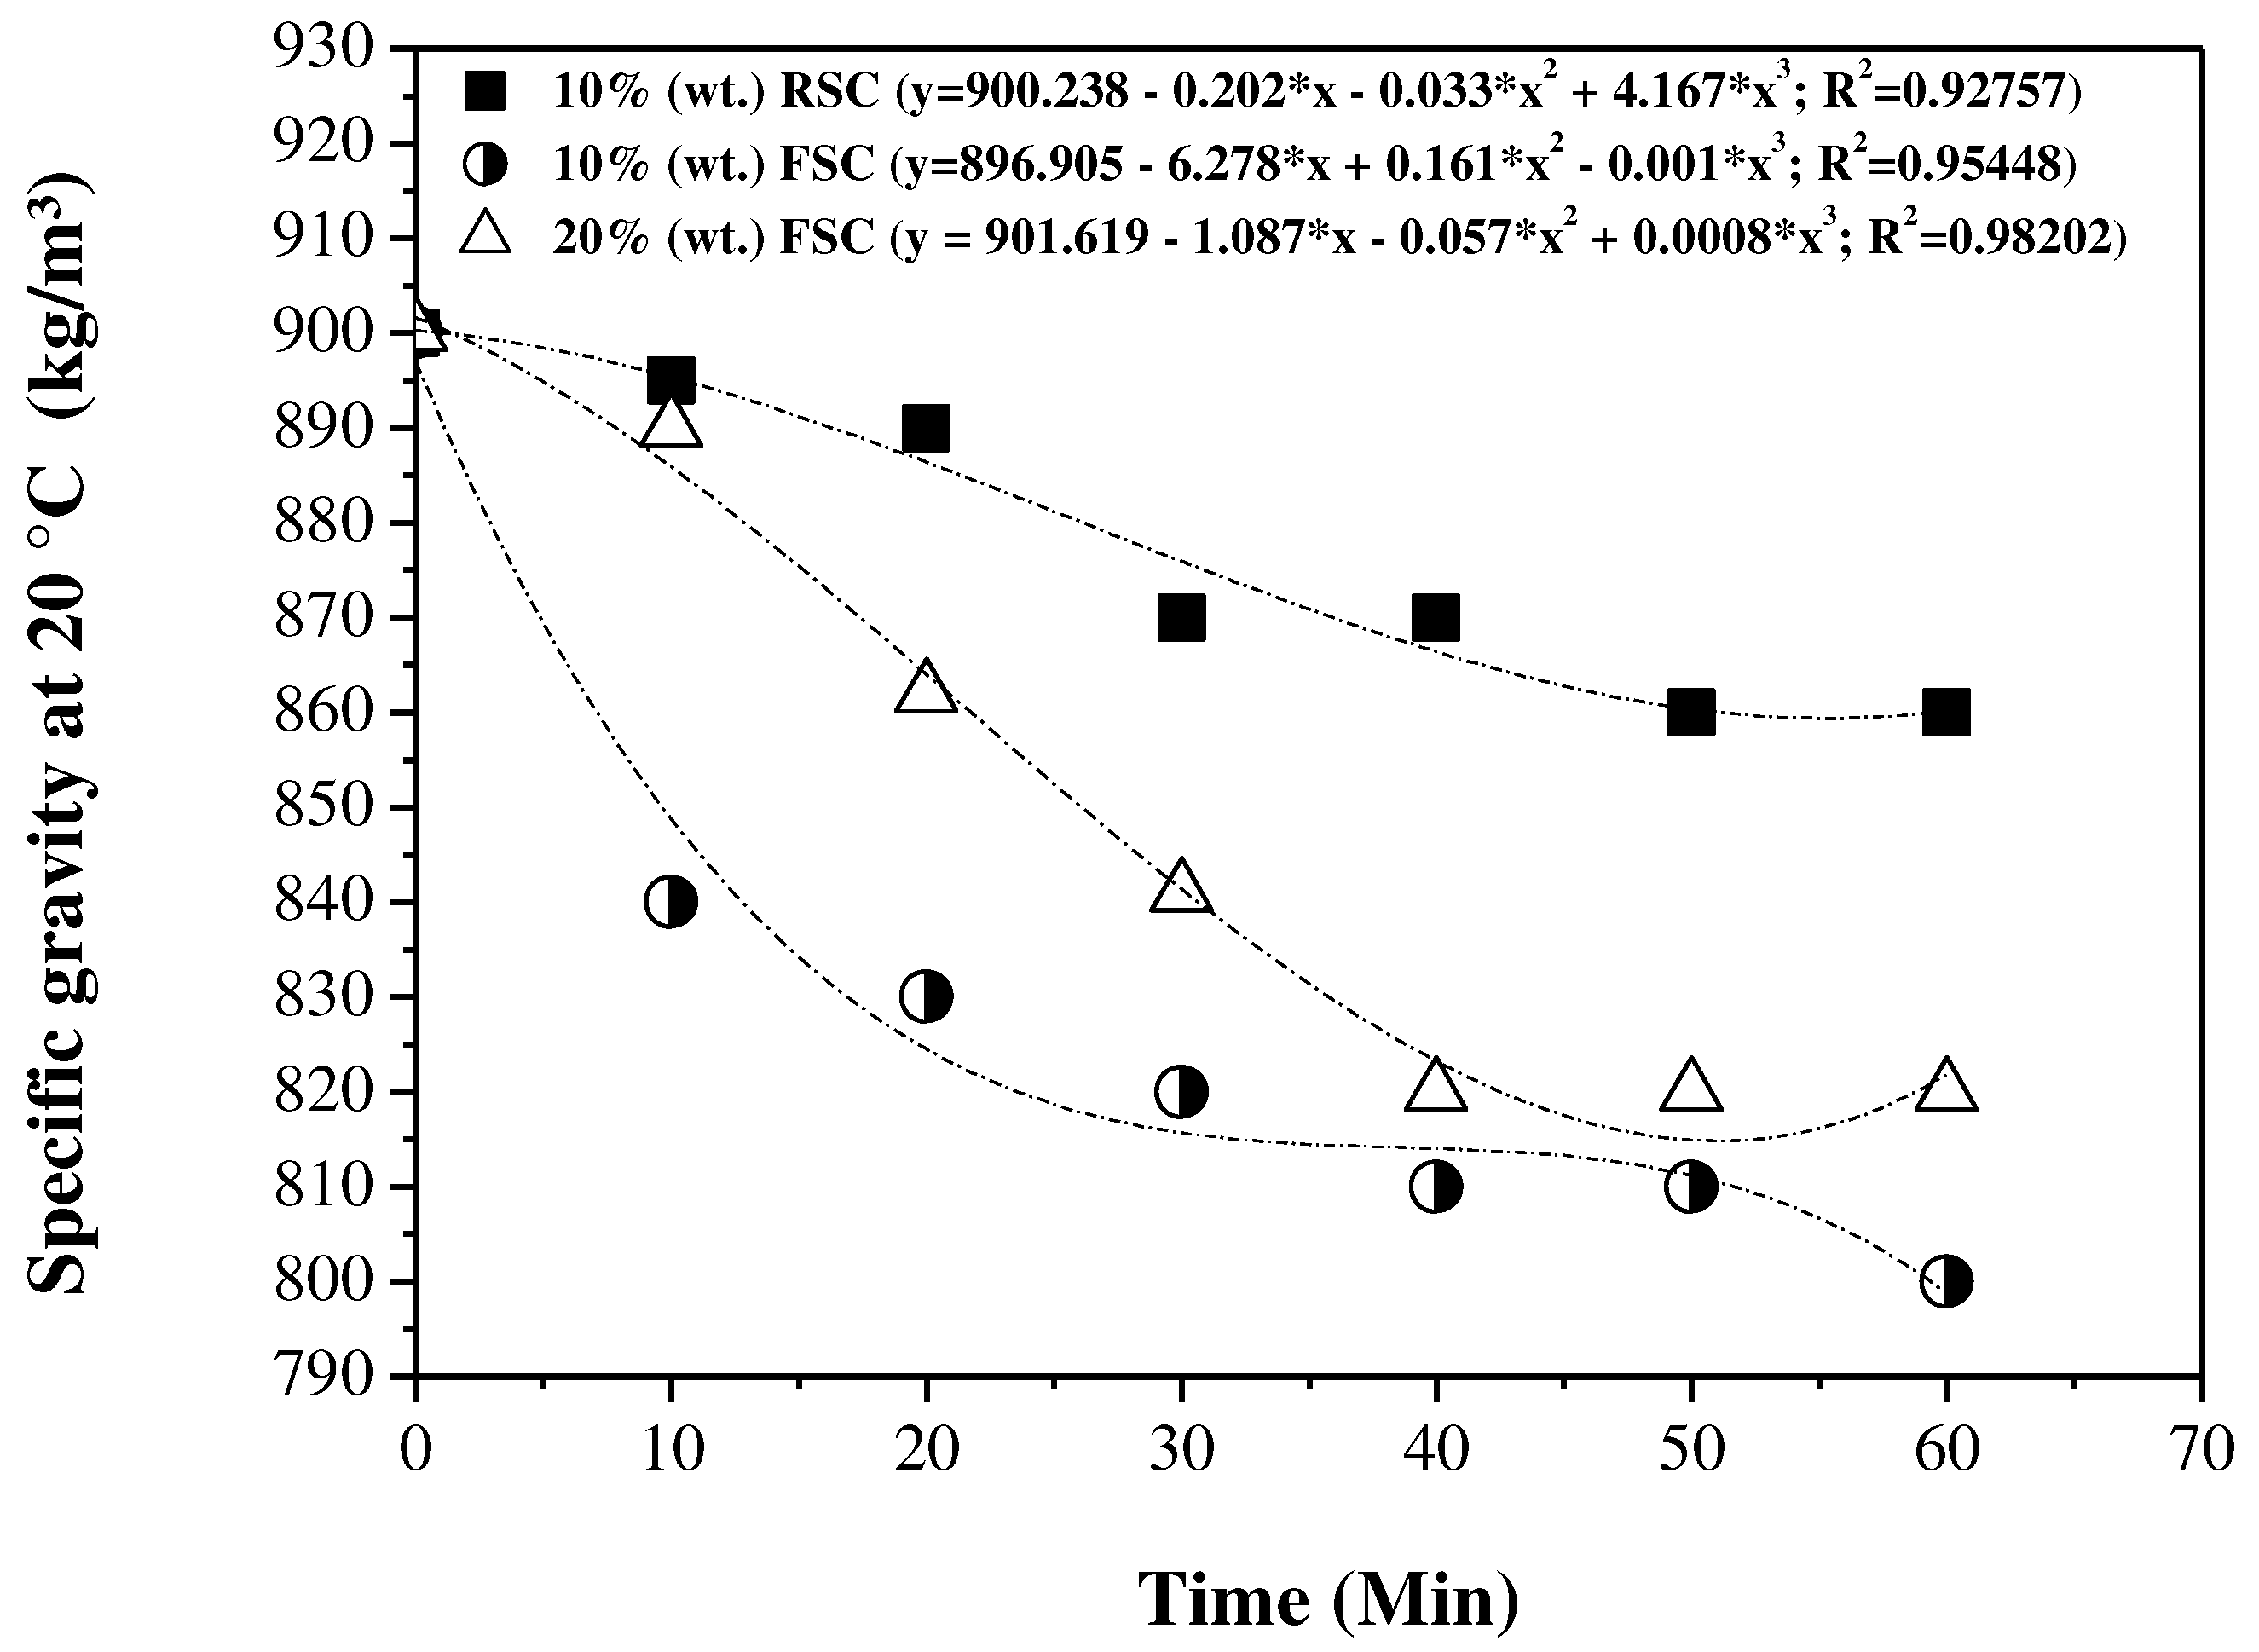
Figure 11.
FTIR of OLPs produced from the thermal catalytic cracking of crude palm oil using 10% (w/w) of fresh sodium carbonate and at different reaction times.
Figure 11.
FTIR of OLPs produced from the thermal catalytic cracking of crude palm oil using 10% (w/w) of fresh sodium carbonate and at different reaction times.
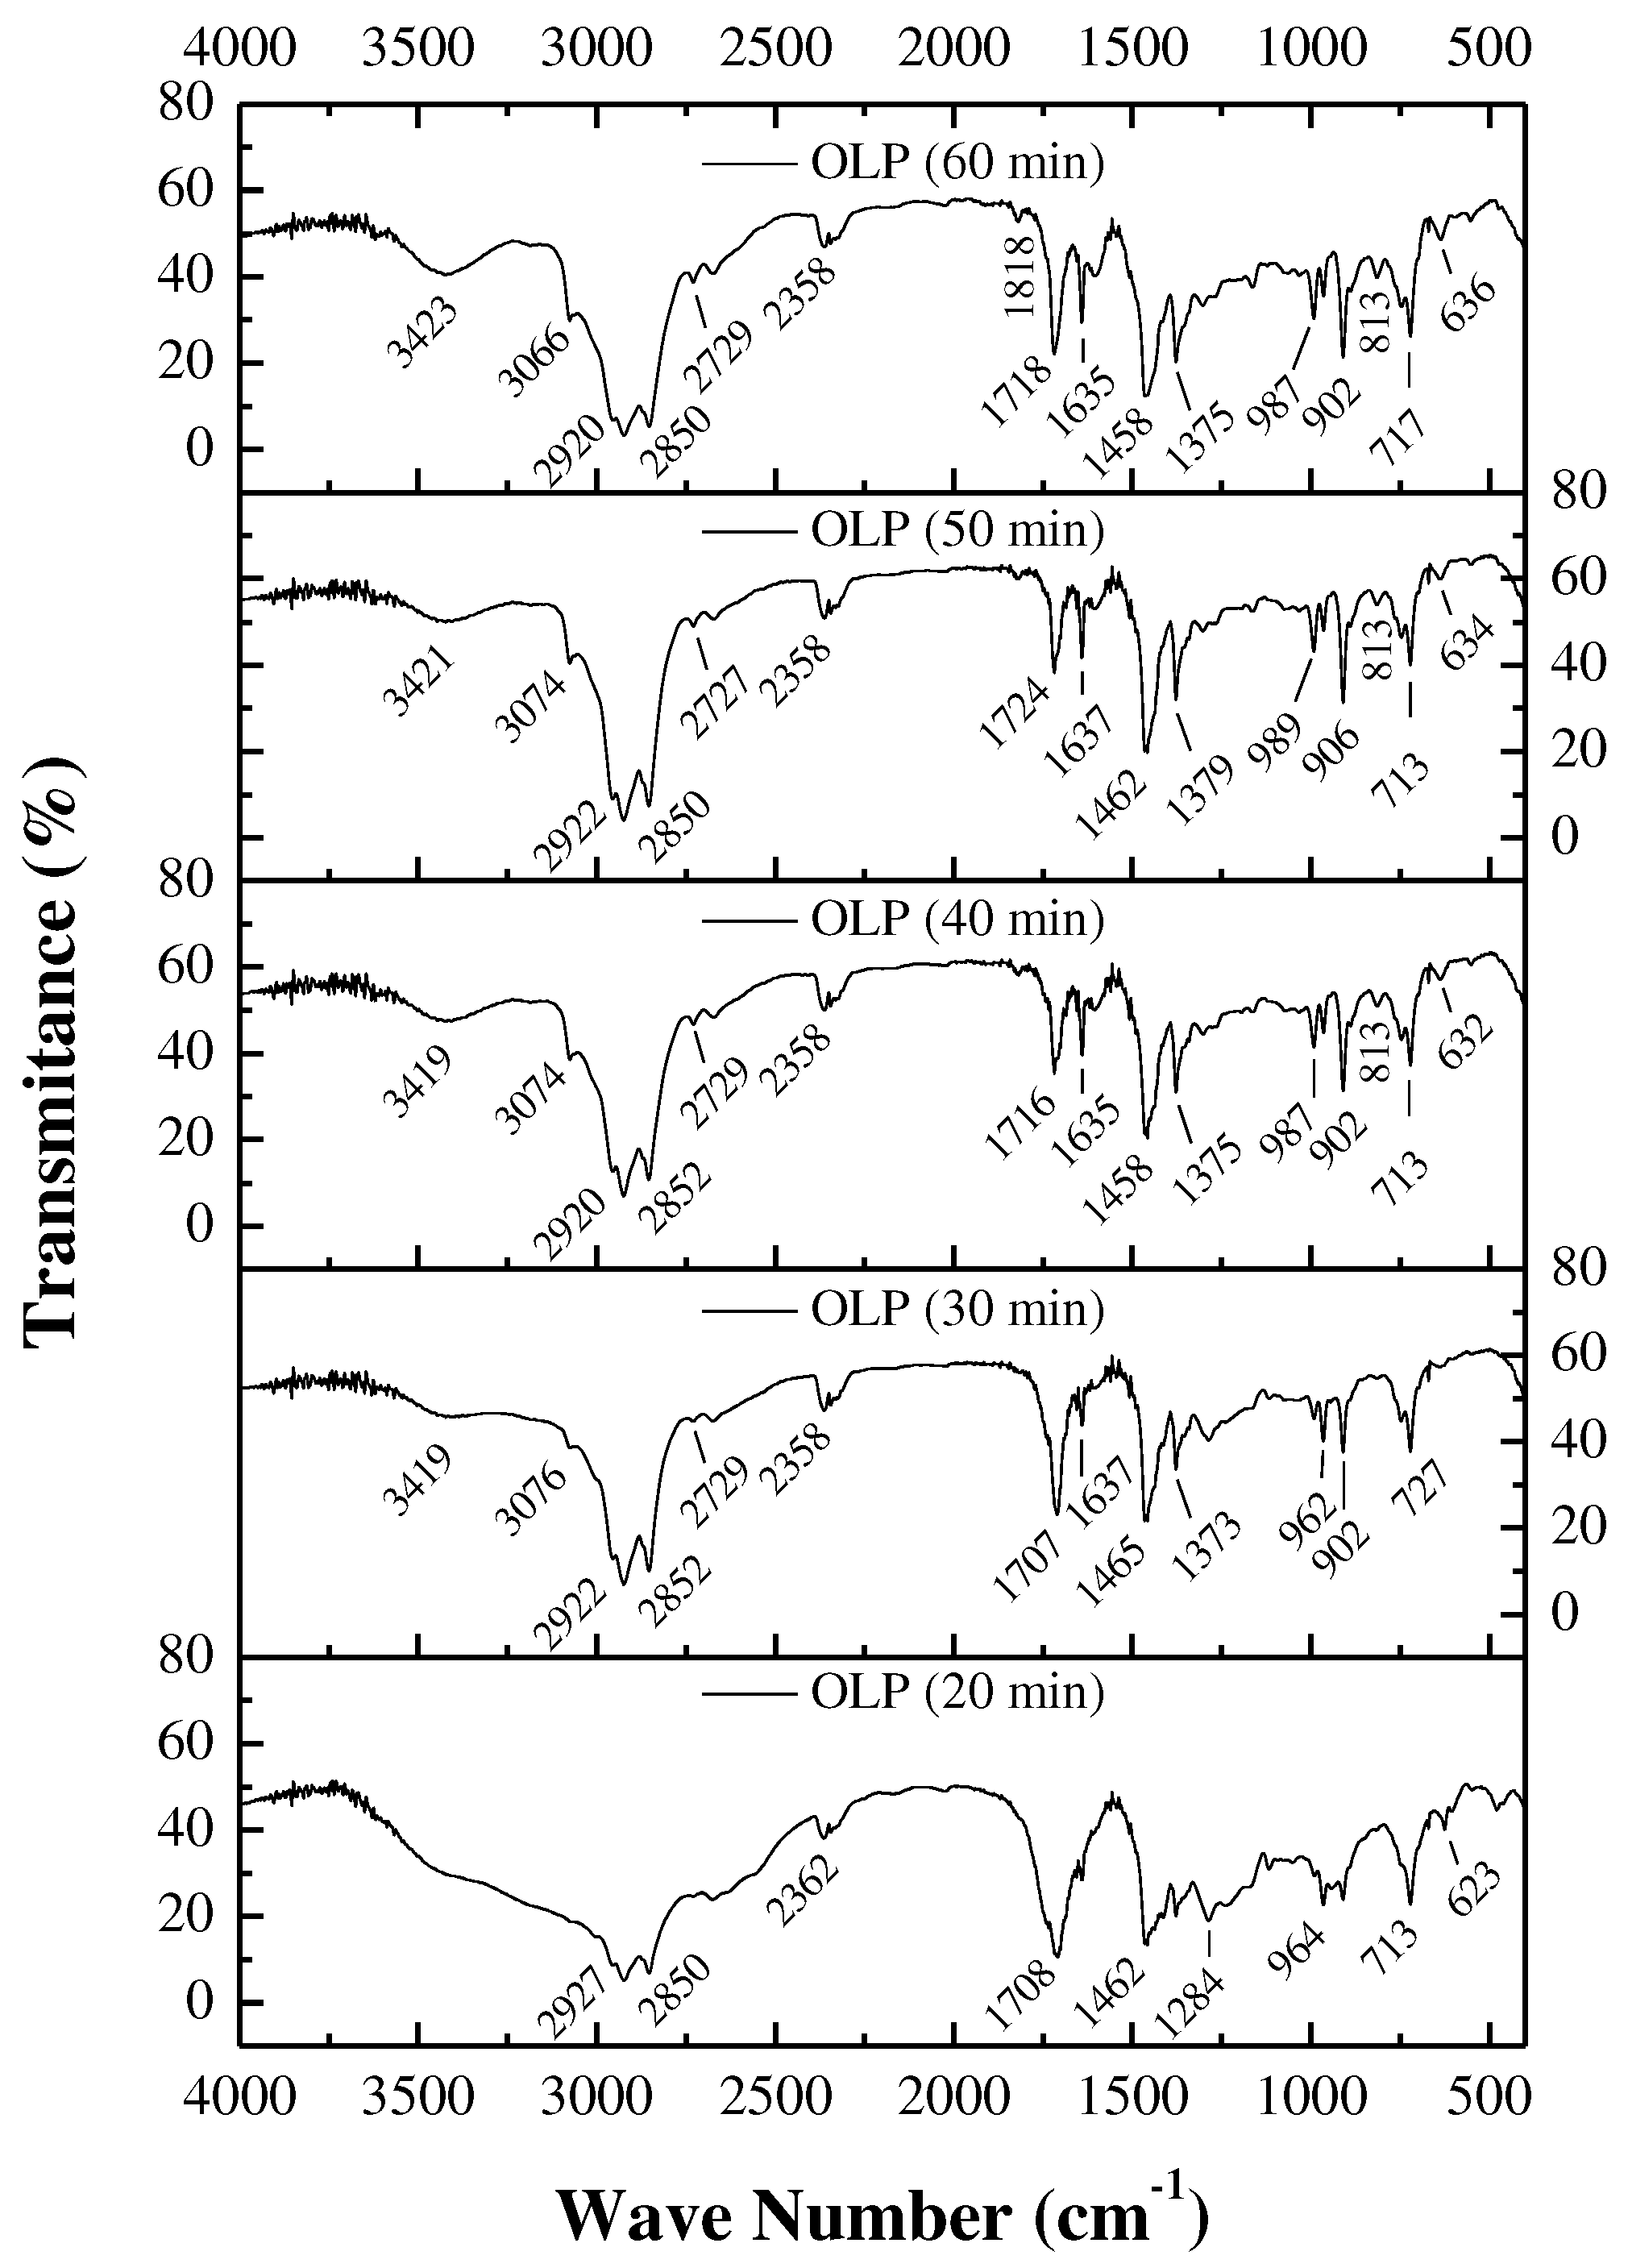
Figure 12.
FTIR of OLP and distilled fractions.
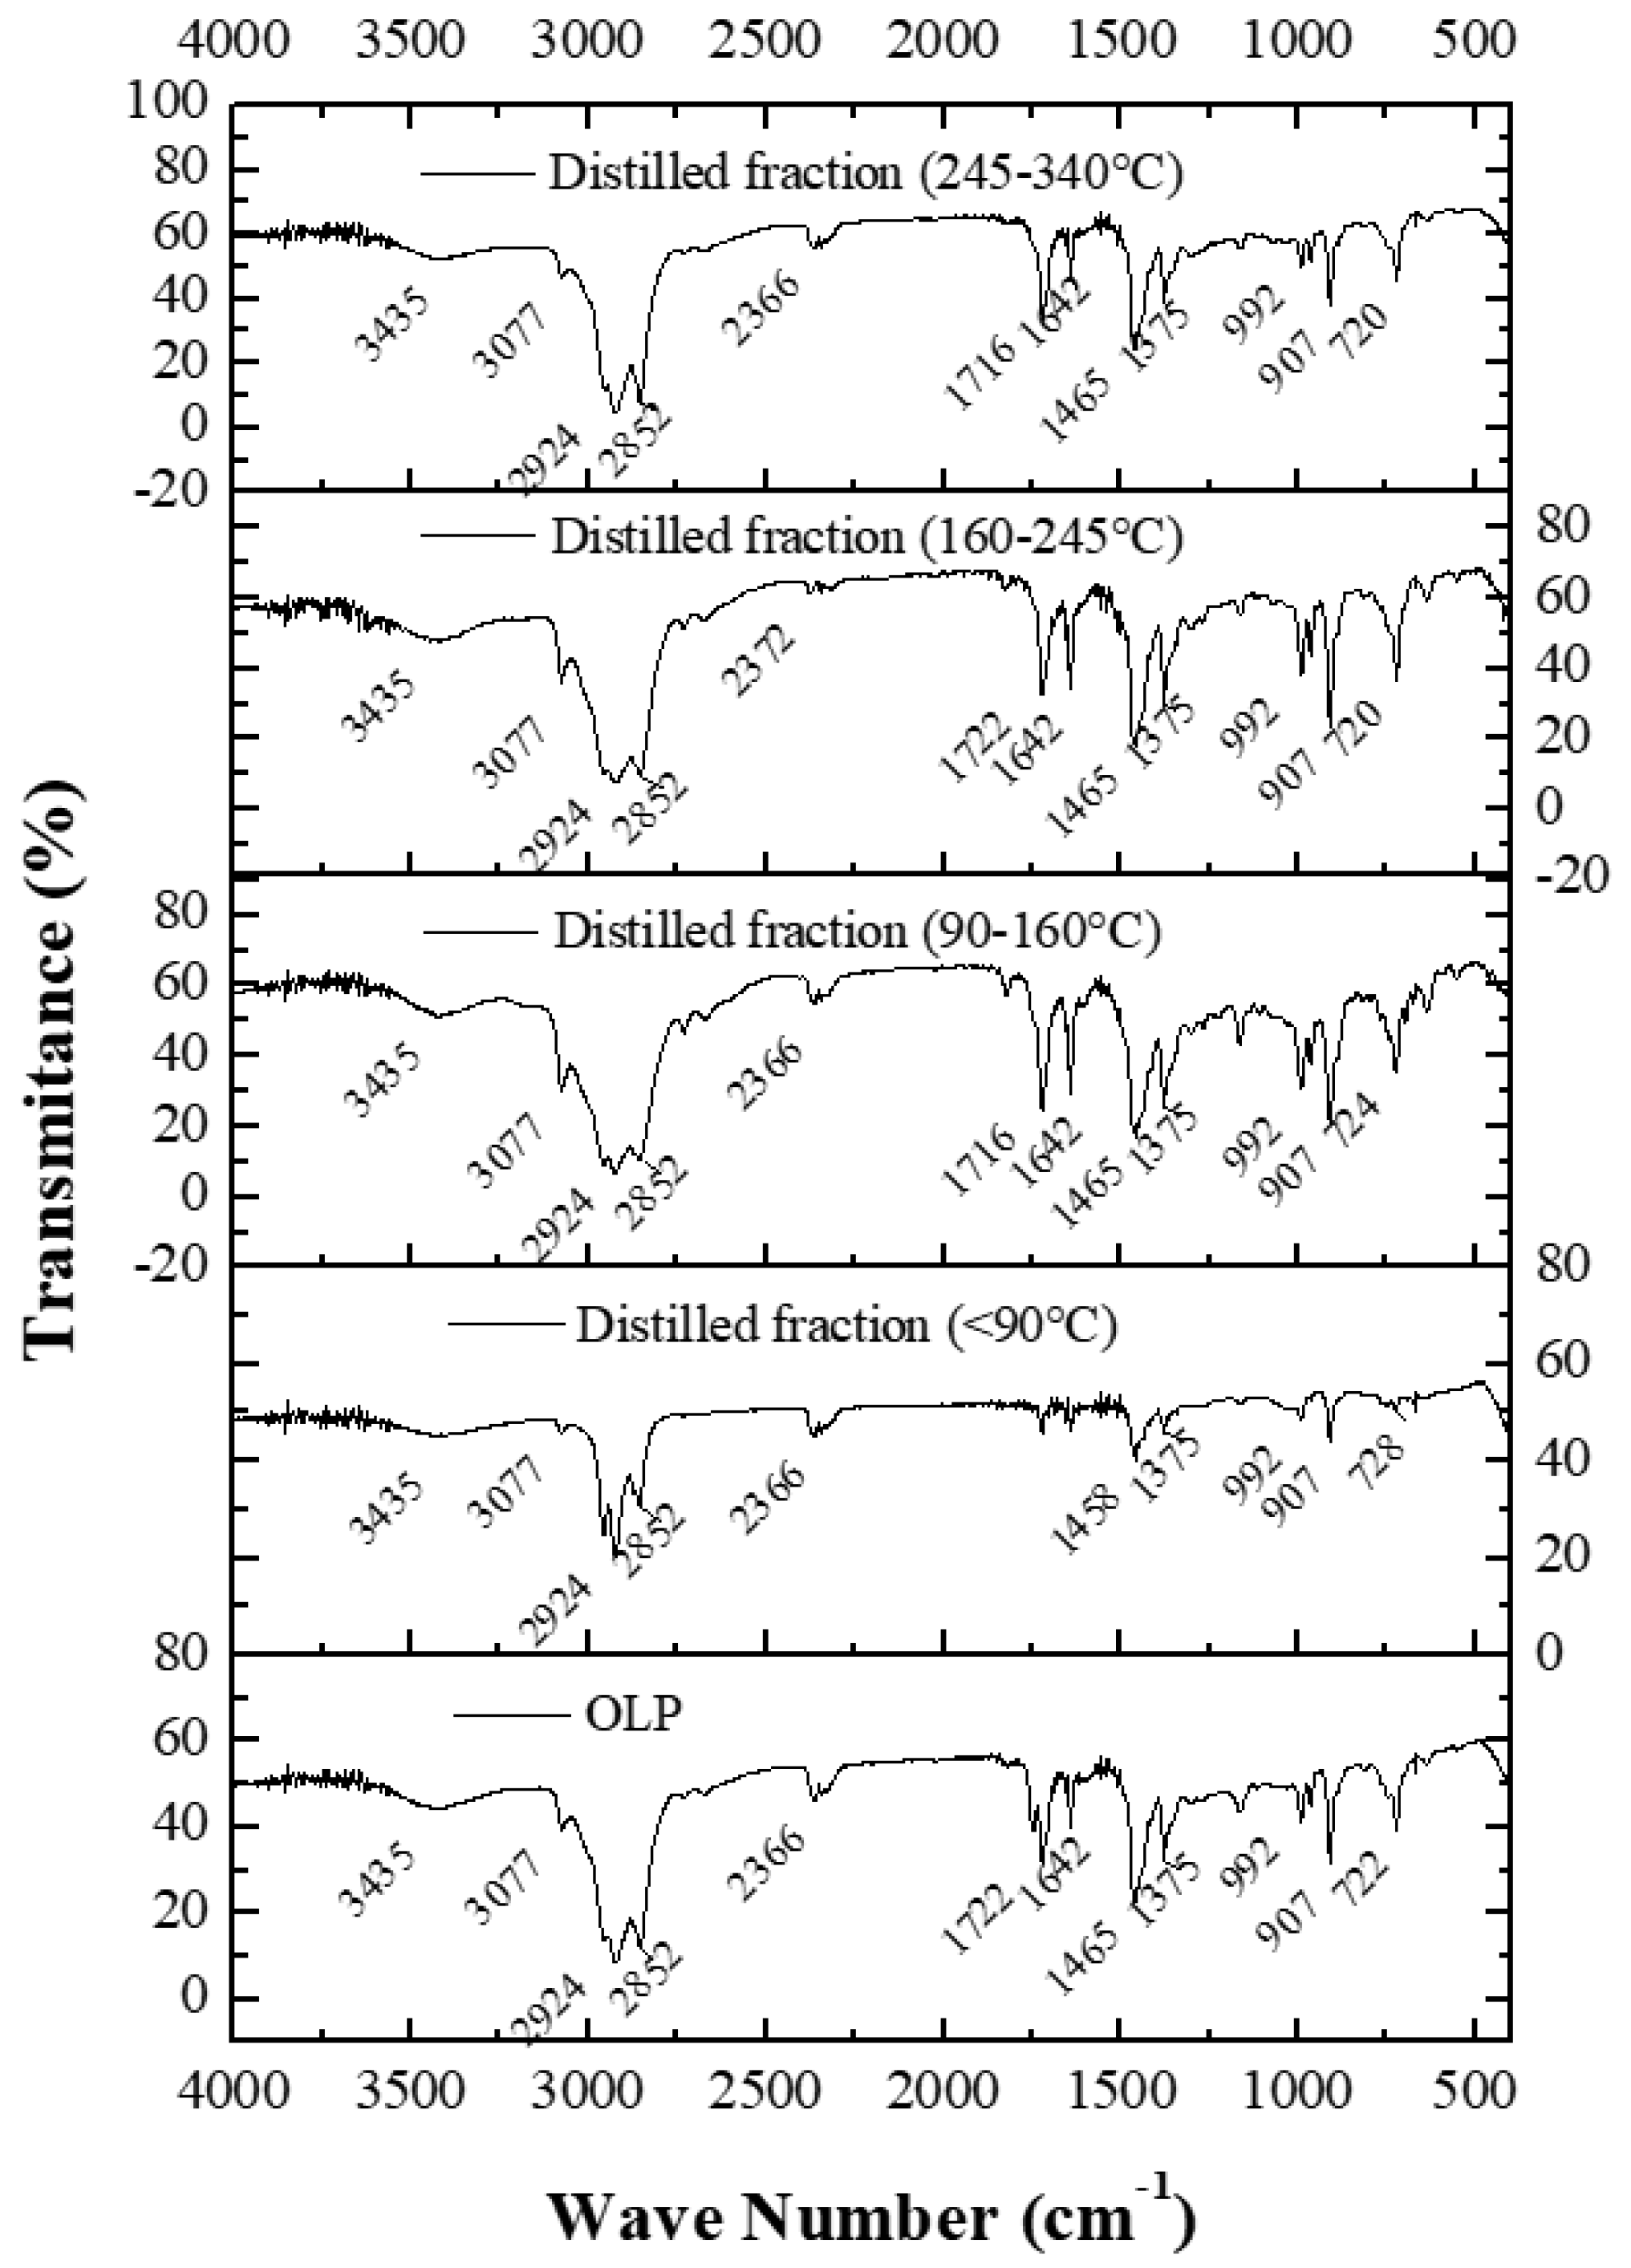
Figure 13.
Distillation curves of green gasoline (Range 1) and green gasoline (Range 2) fractions.
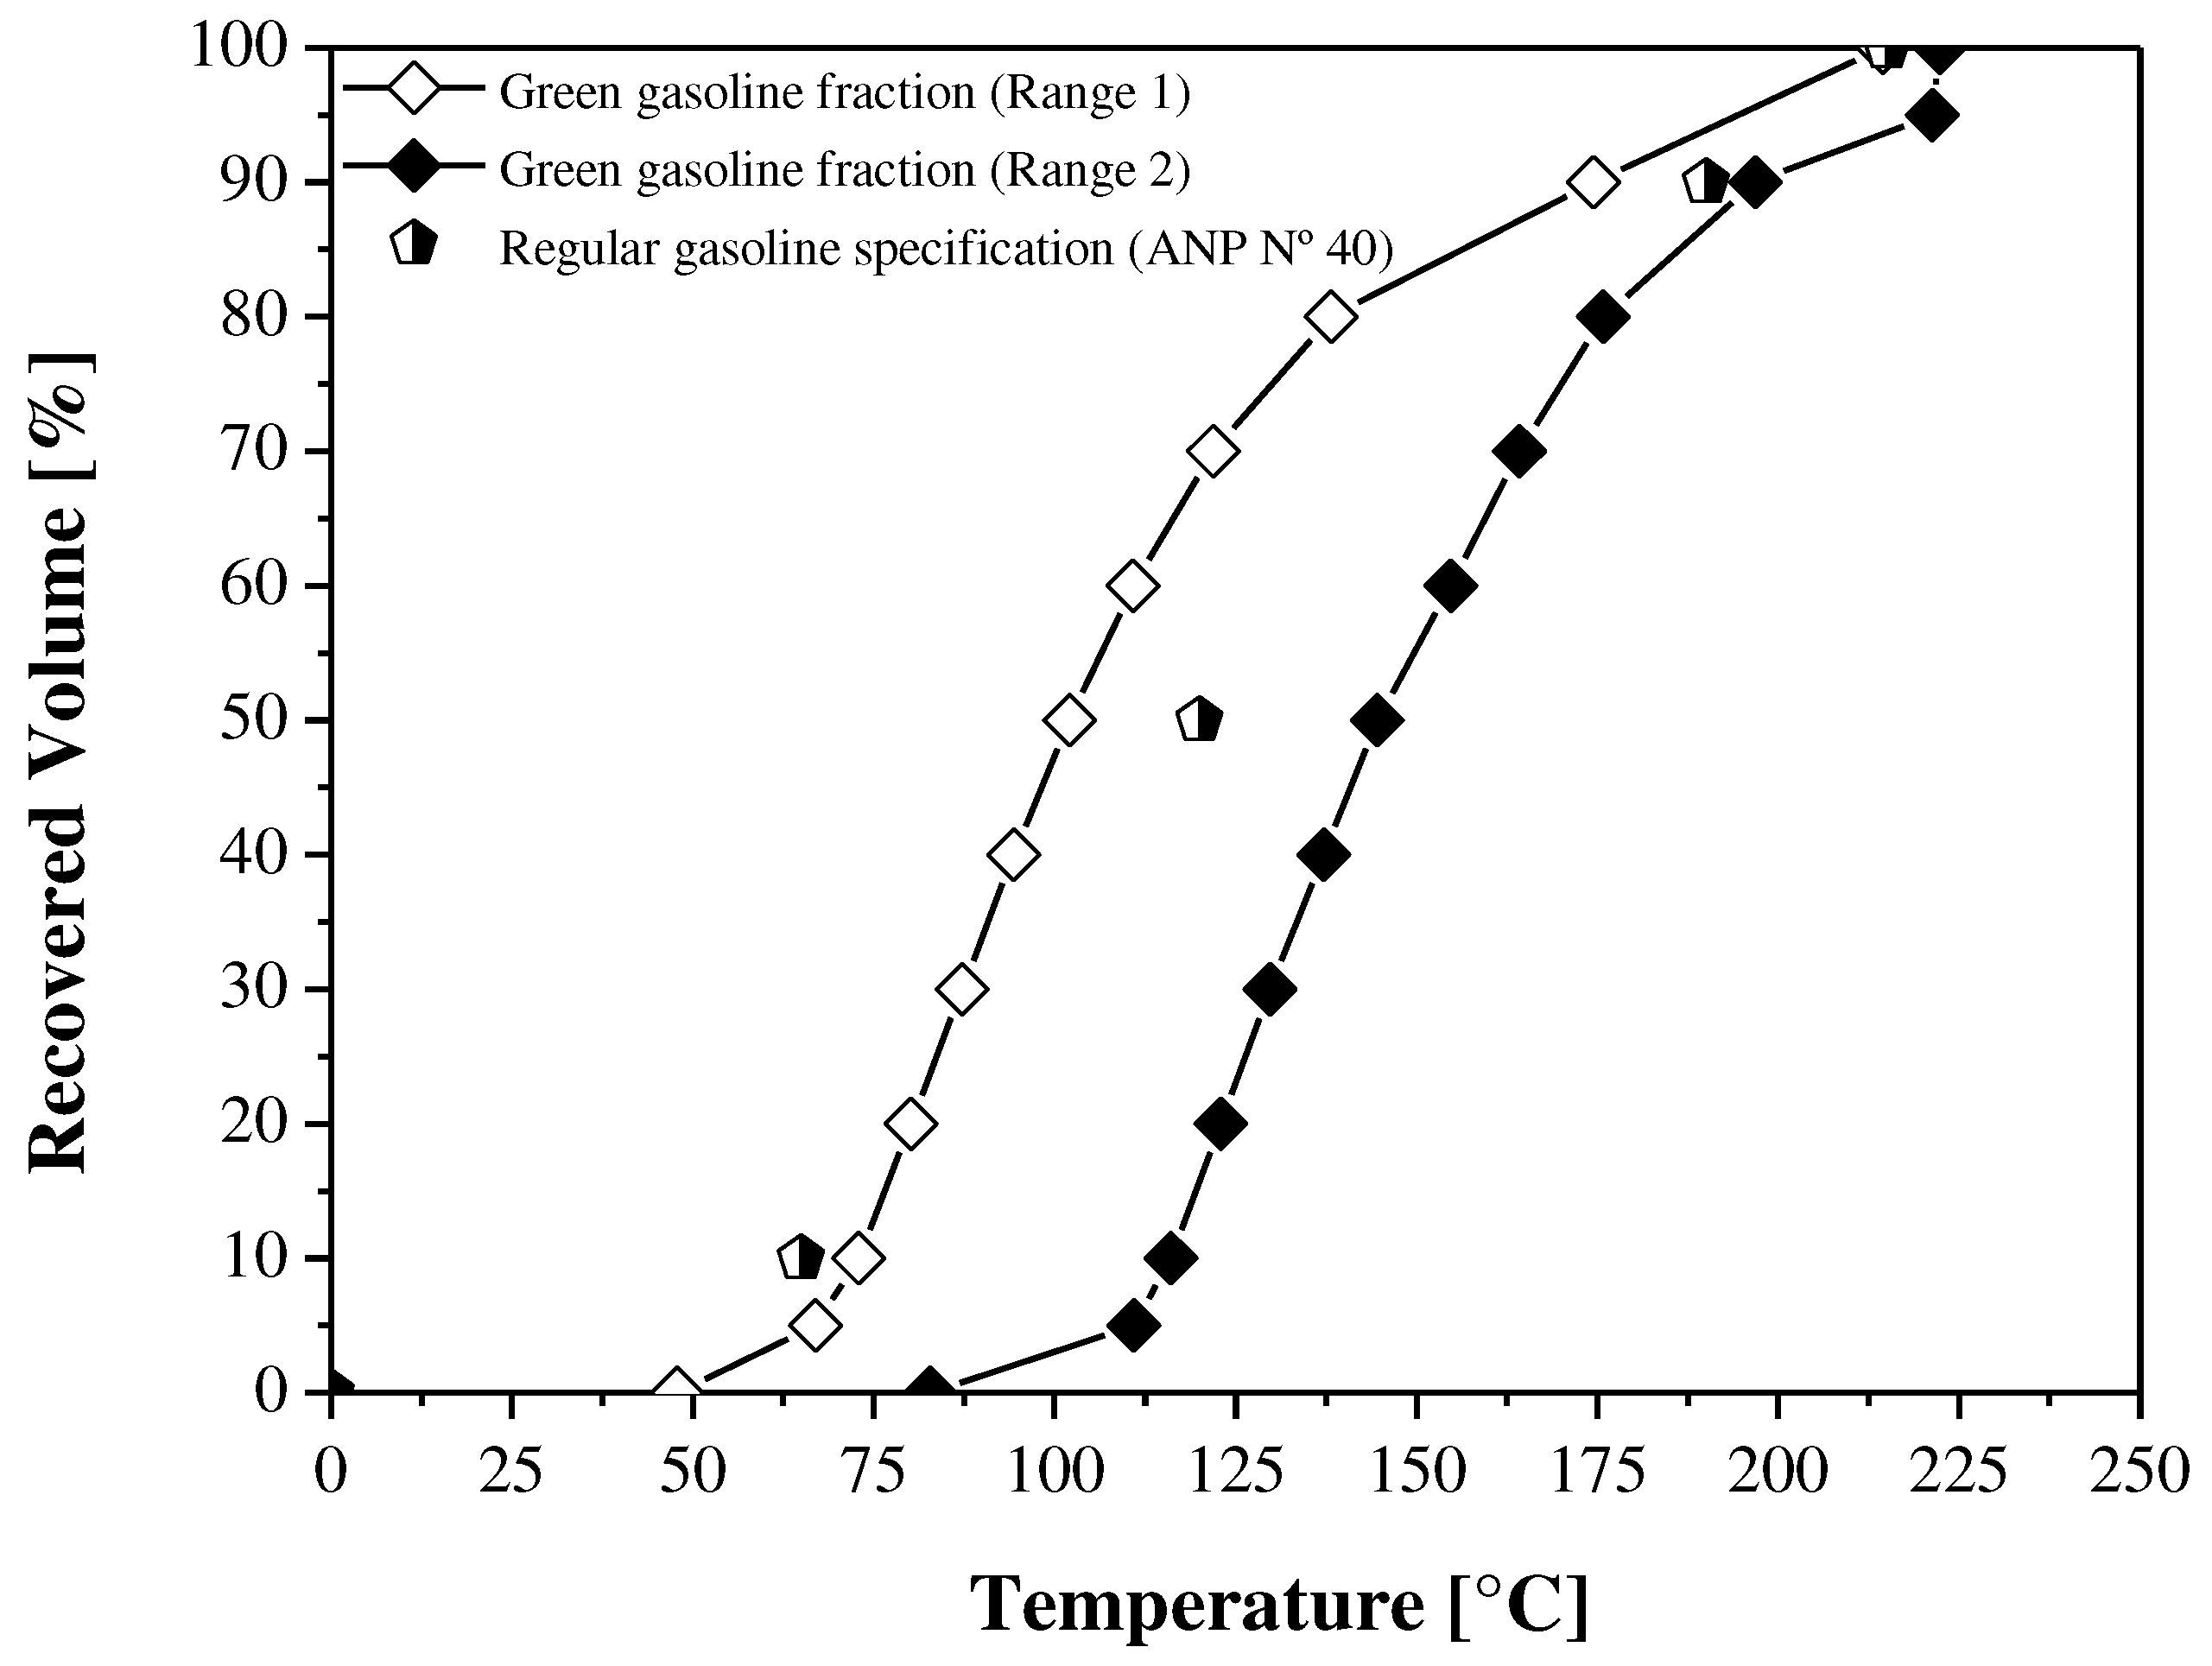
Figure 14.
Distillation curves of green aviation kerosene fraction.
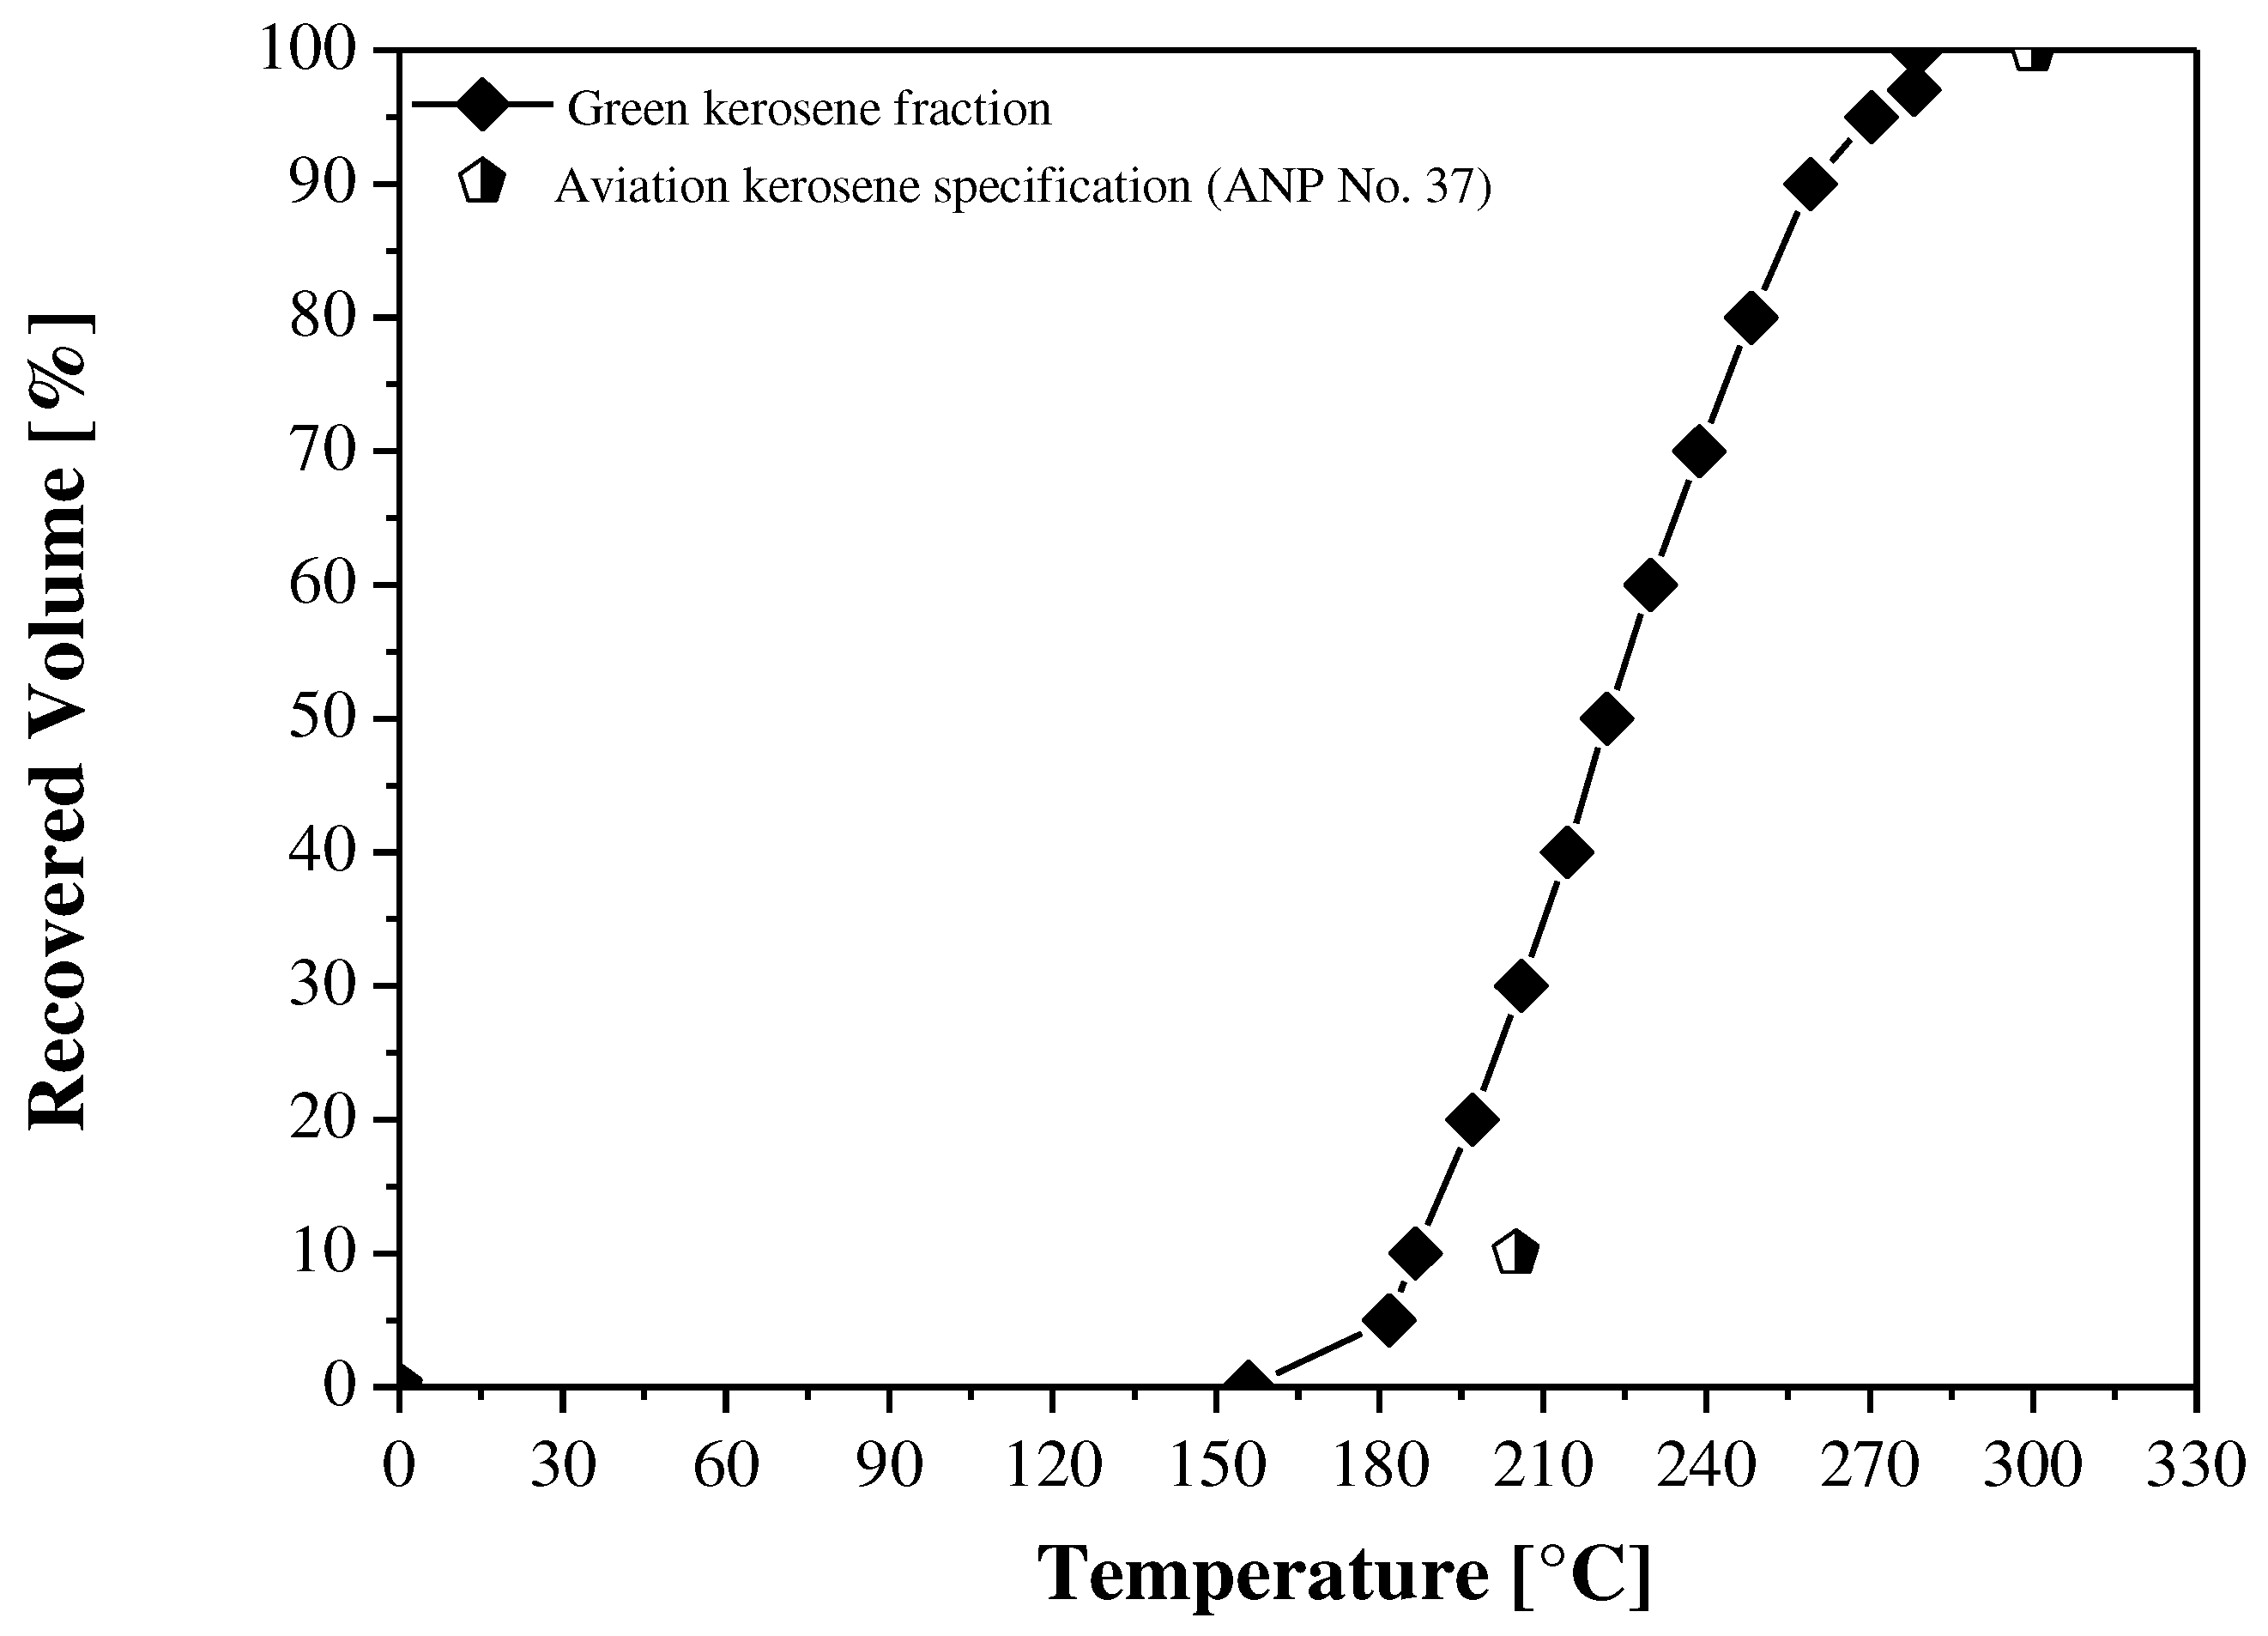
Figure 15.
Distillation curves of green diesel fraction.
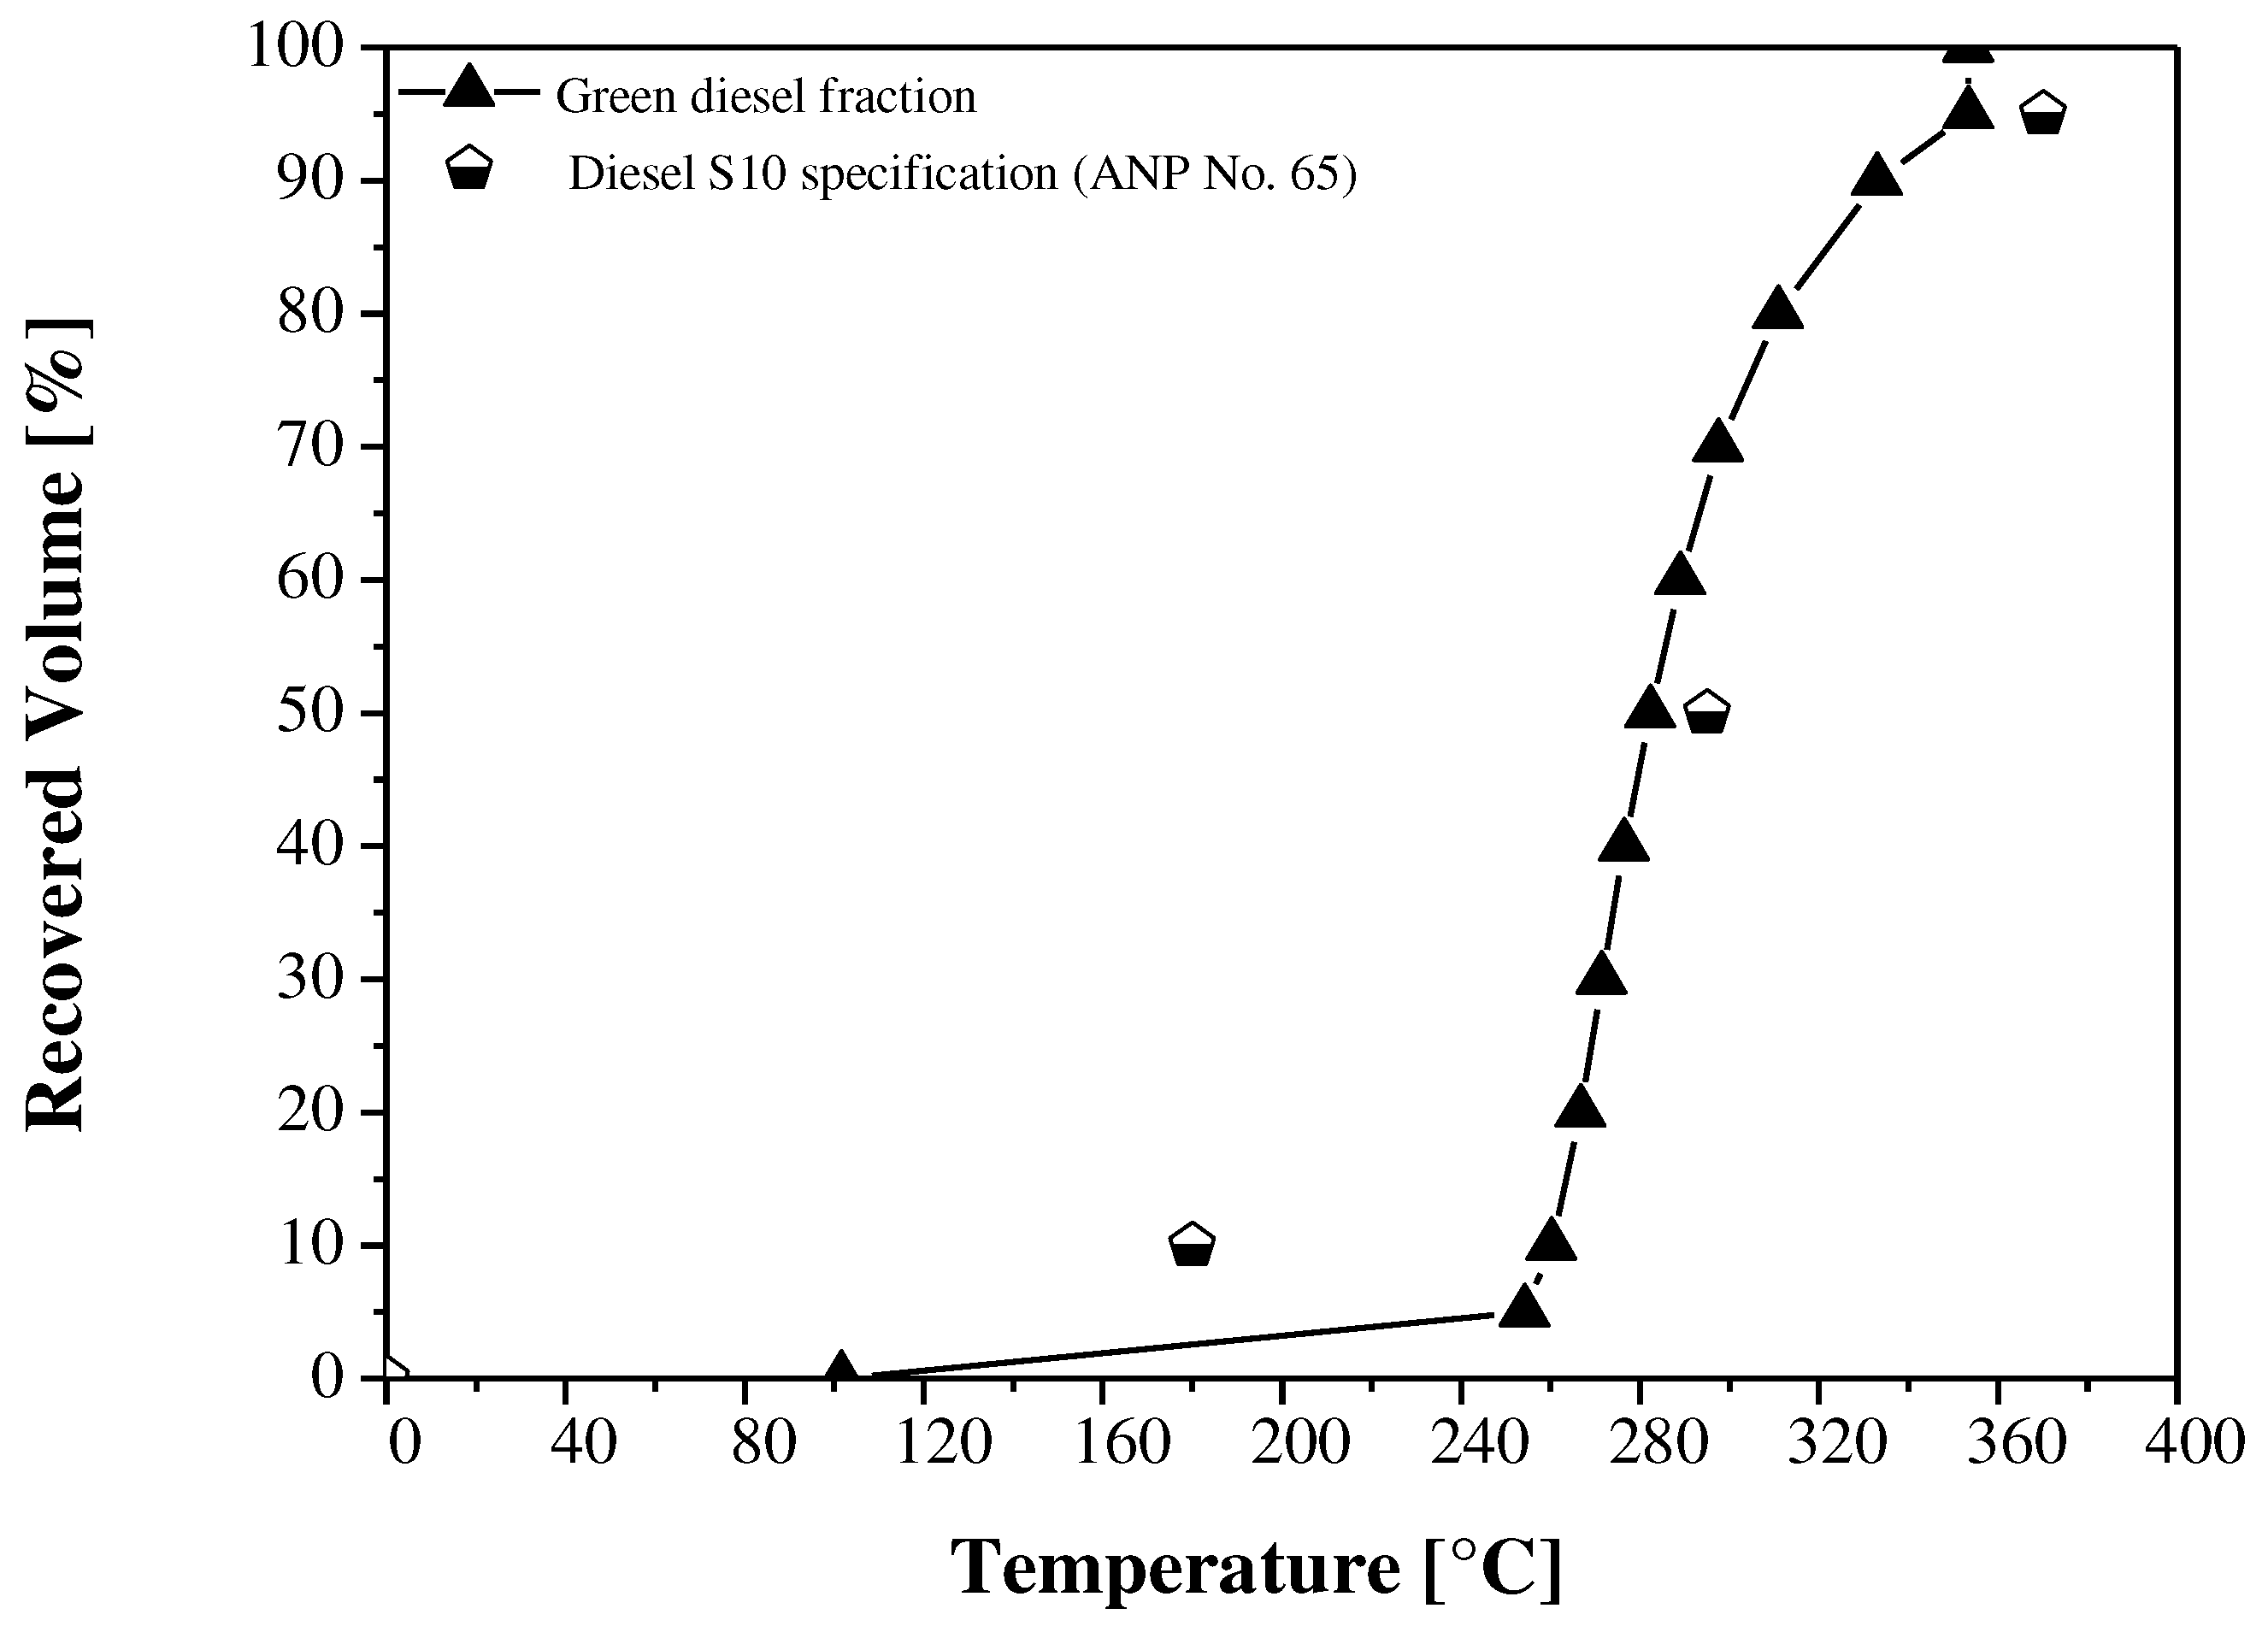
Figure 16.
GC-MS of green gasoline fraction (Range 1).
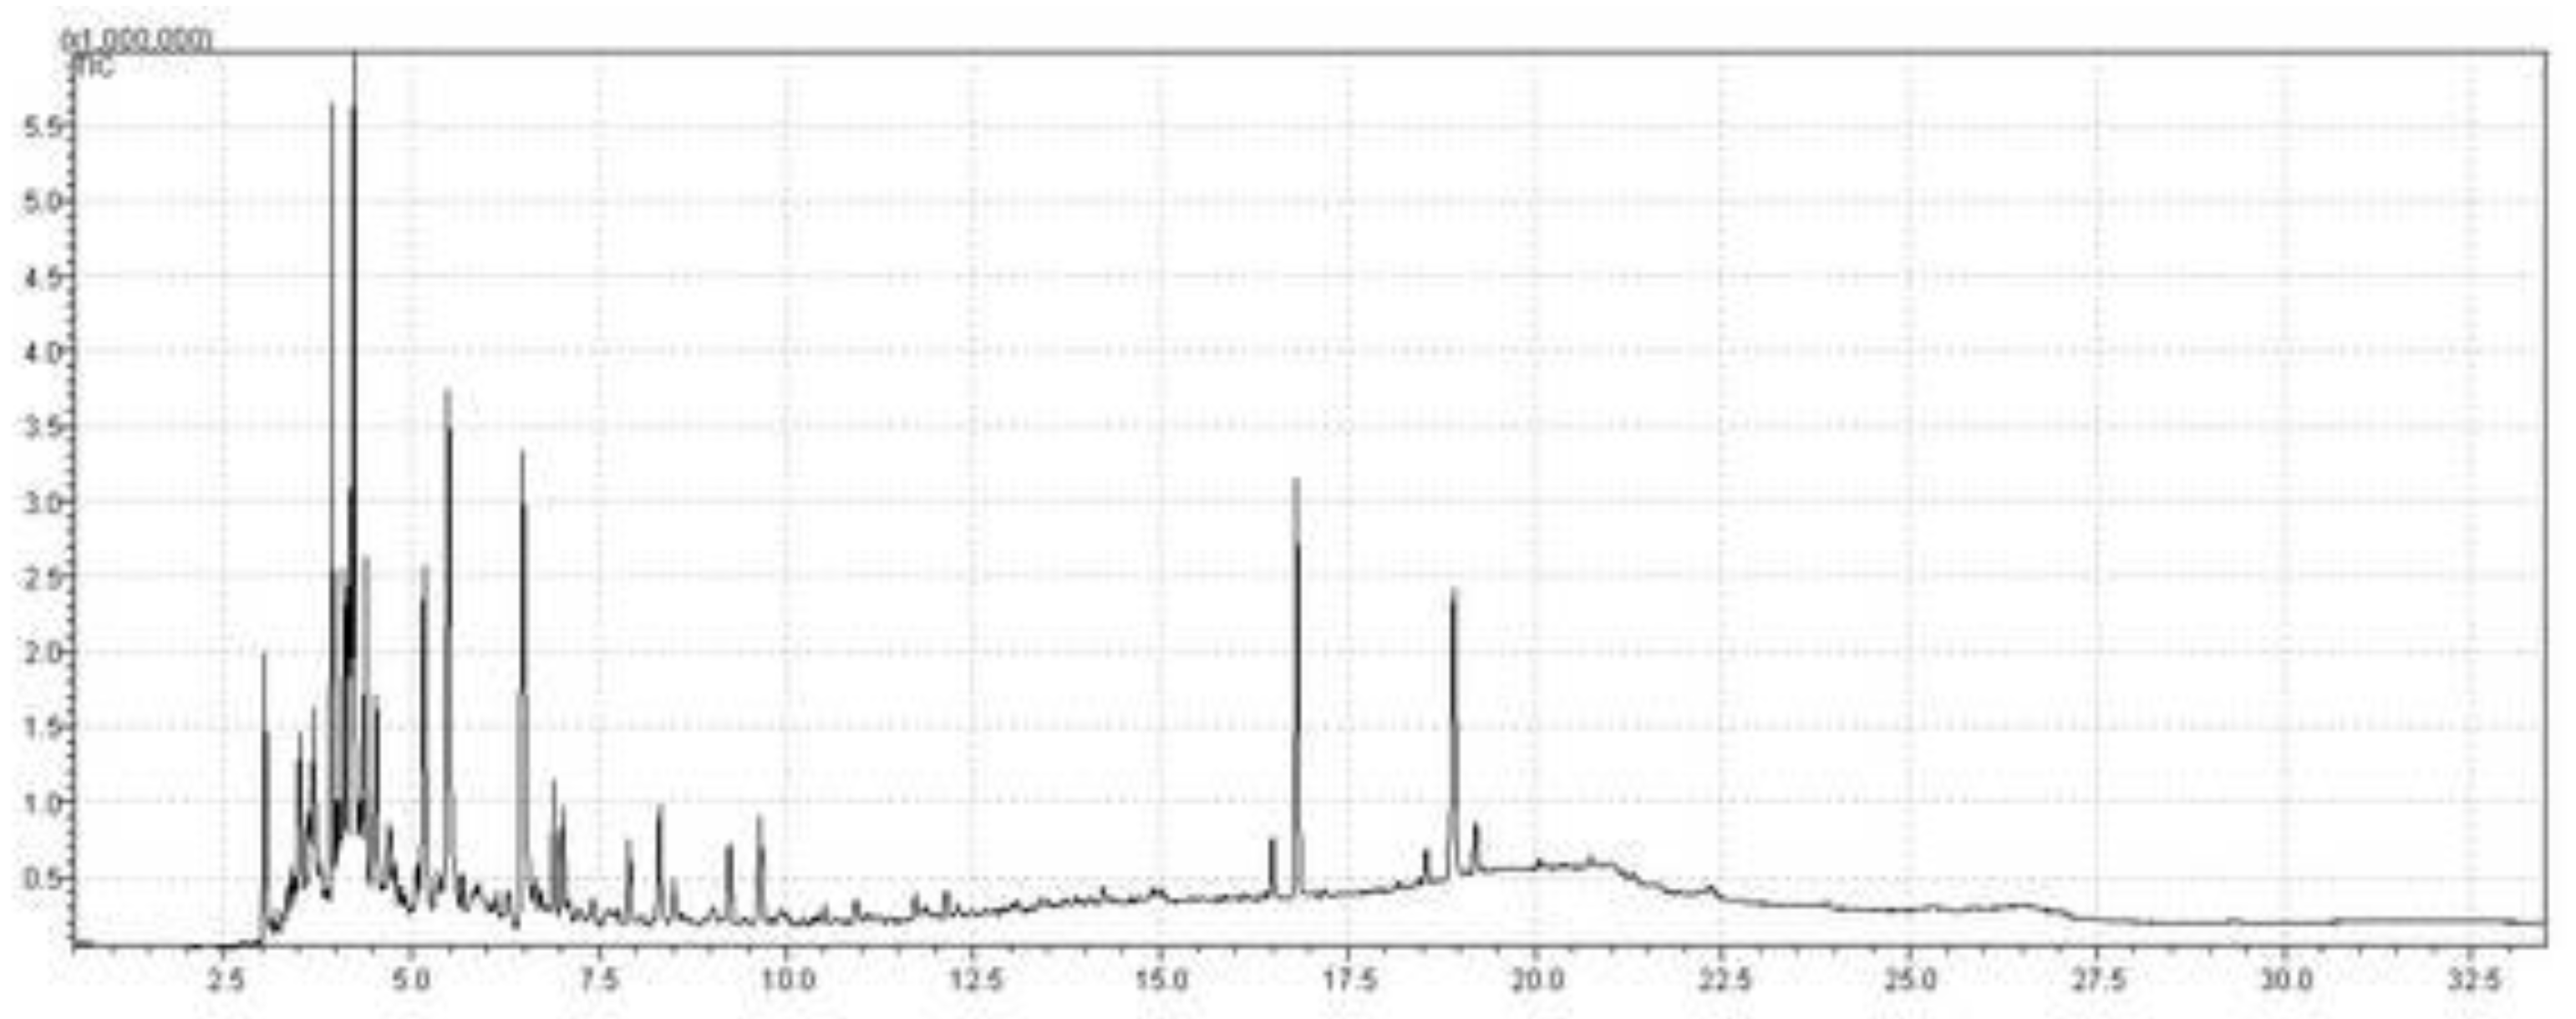
Figure 17.
GC-MS of green gasoline fraction (Range 2).
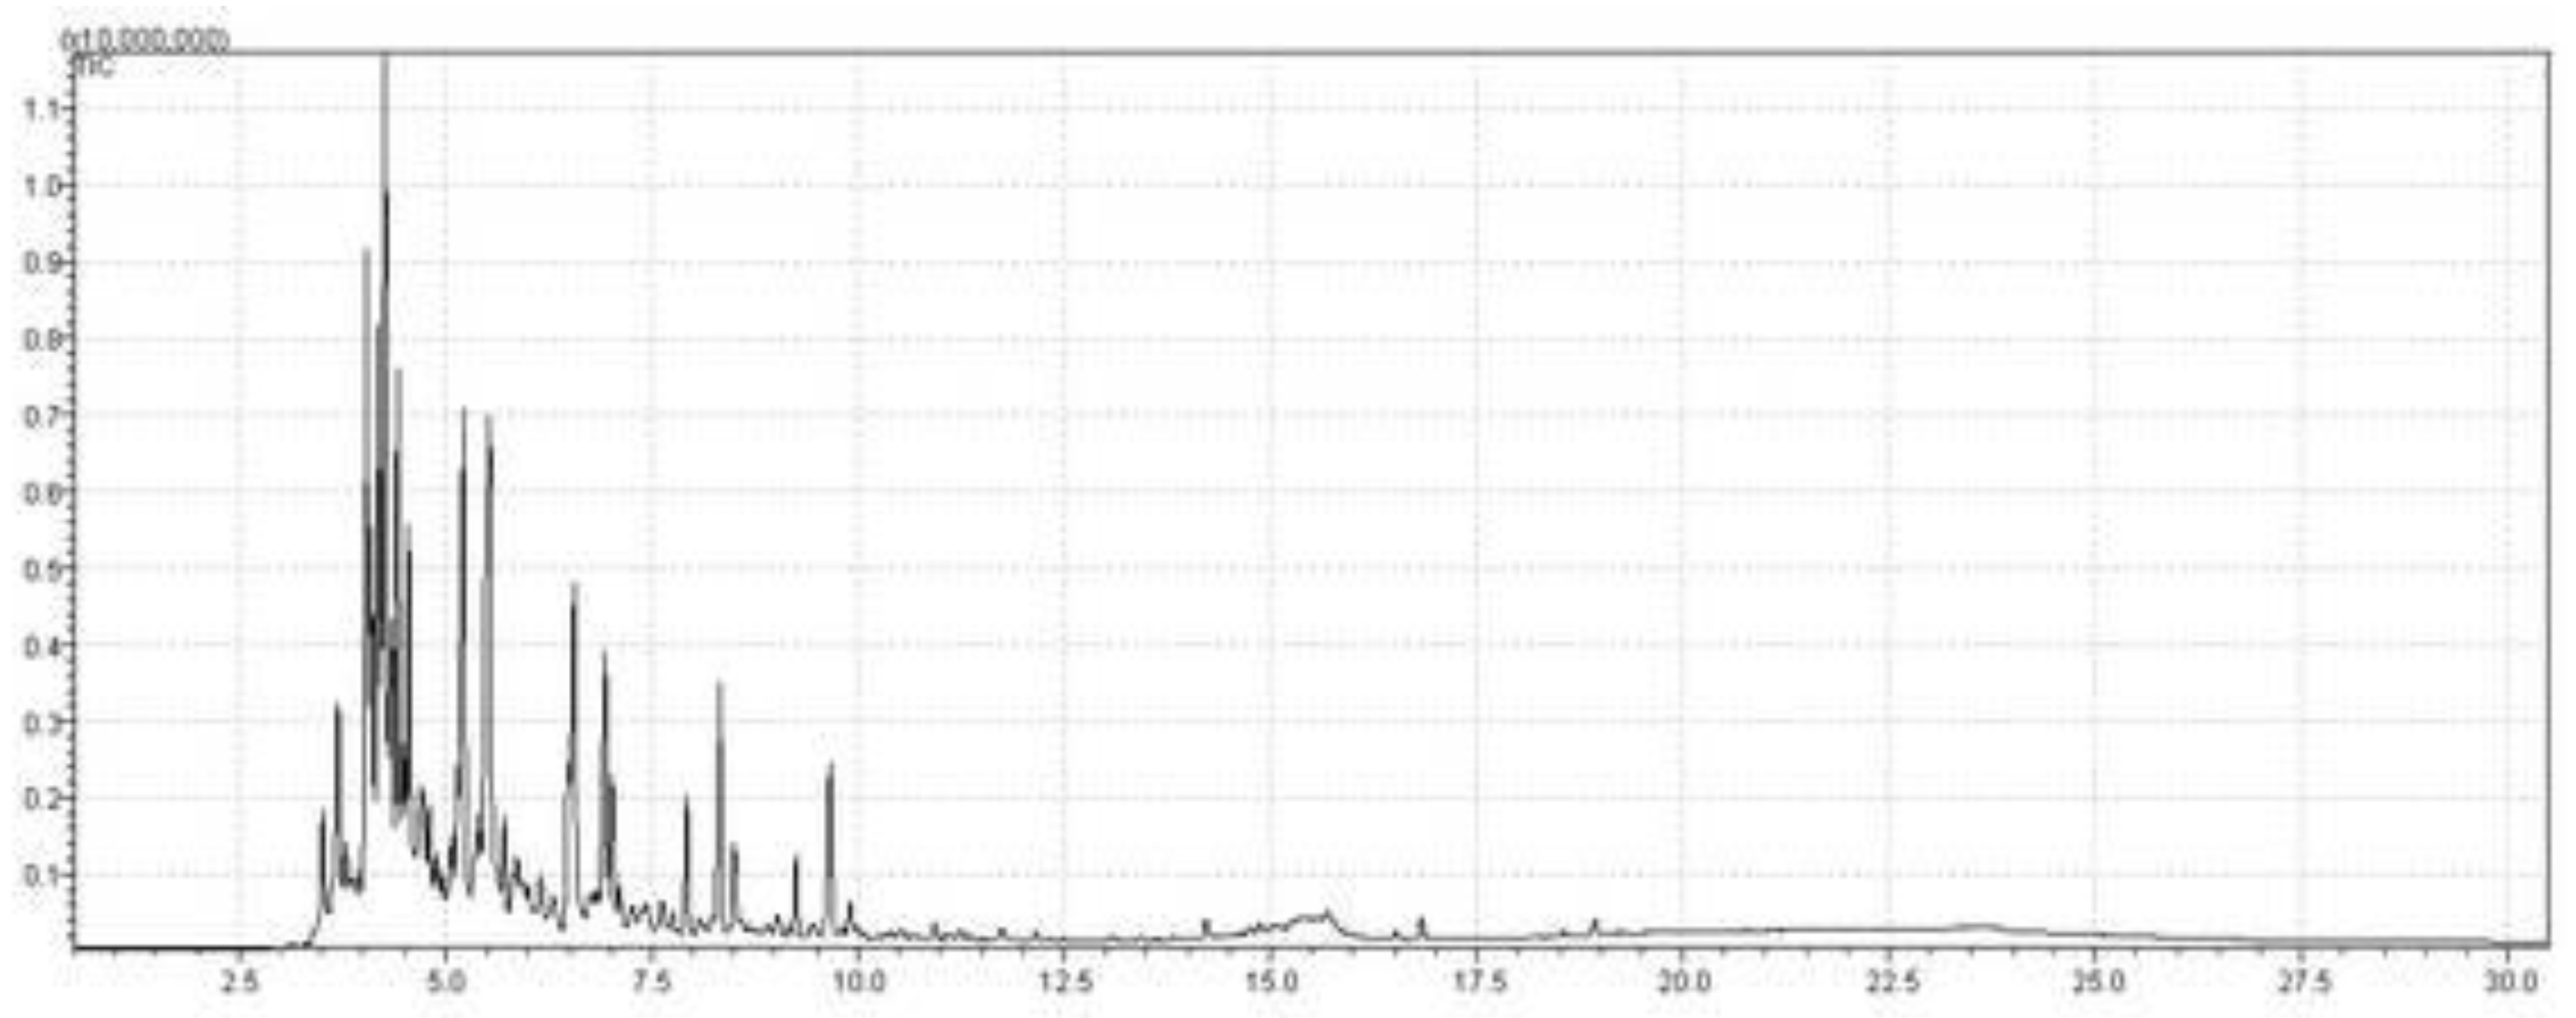
Figure 18.
GC-MS of green aviation kerosene fraction.
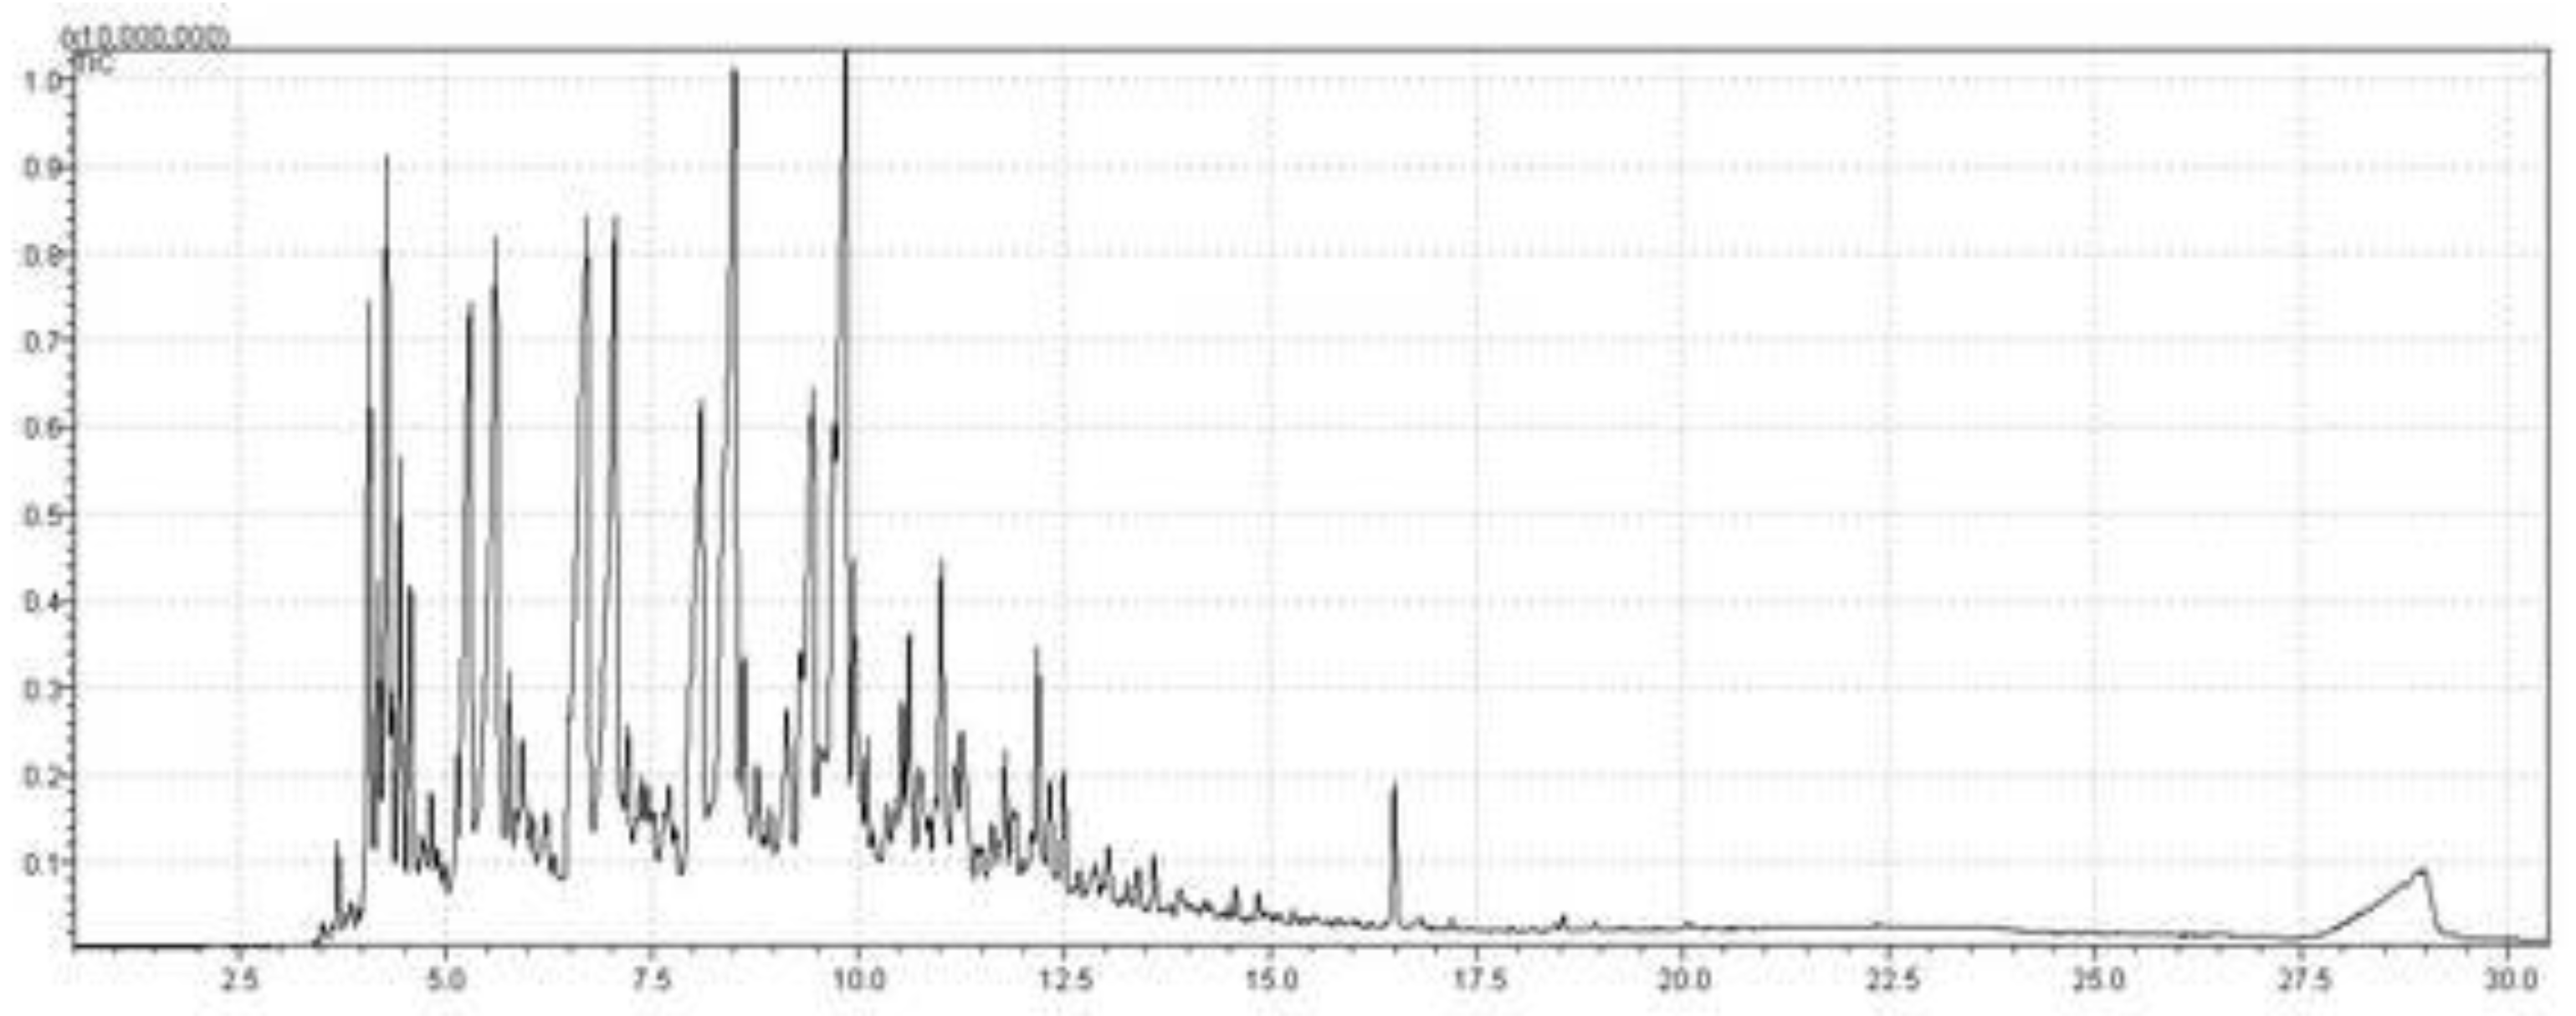
Figure 19.
GC-MS of green diesel fraction.
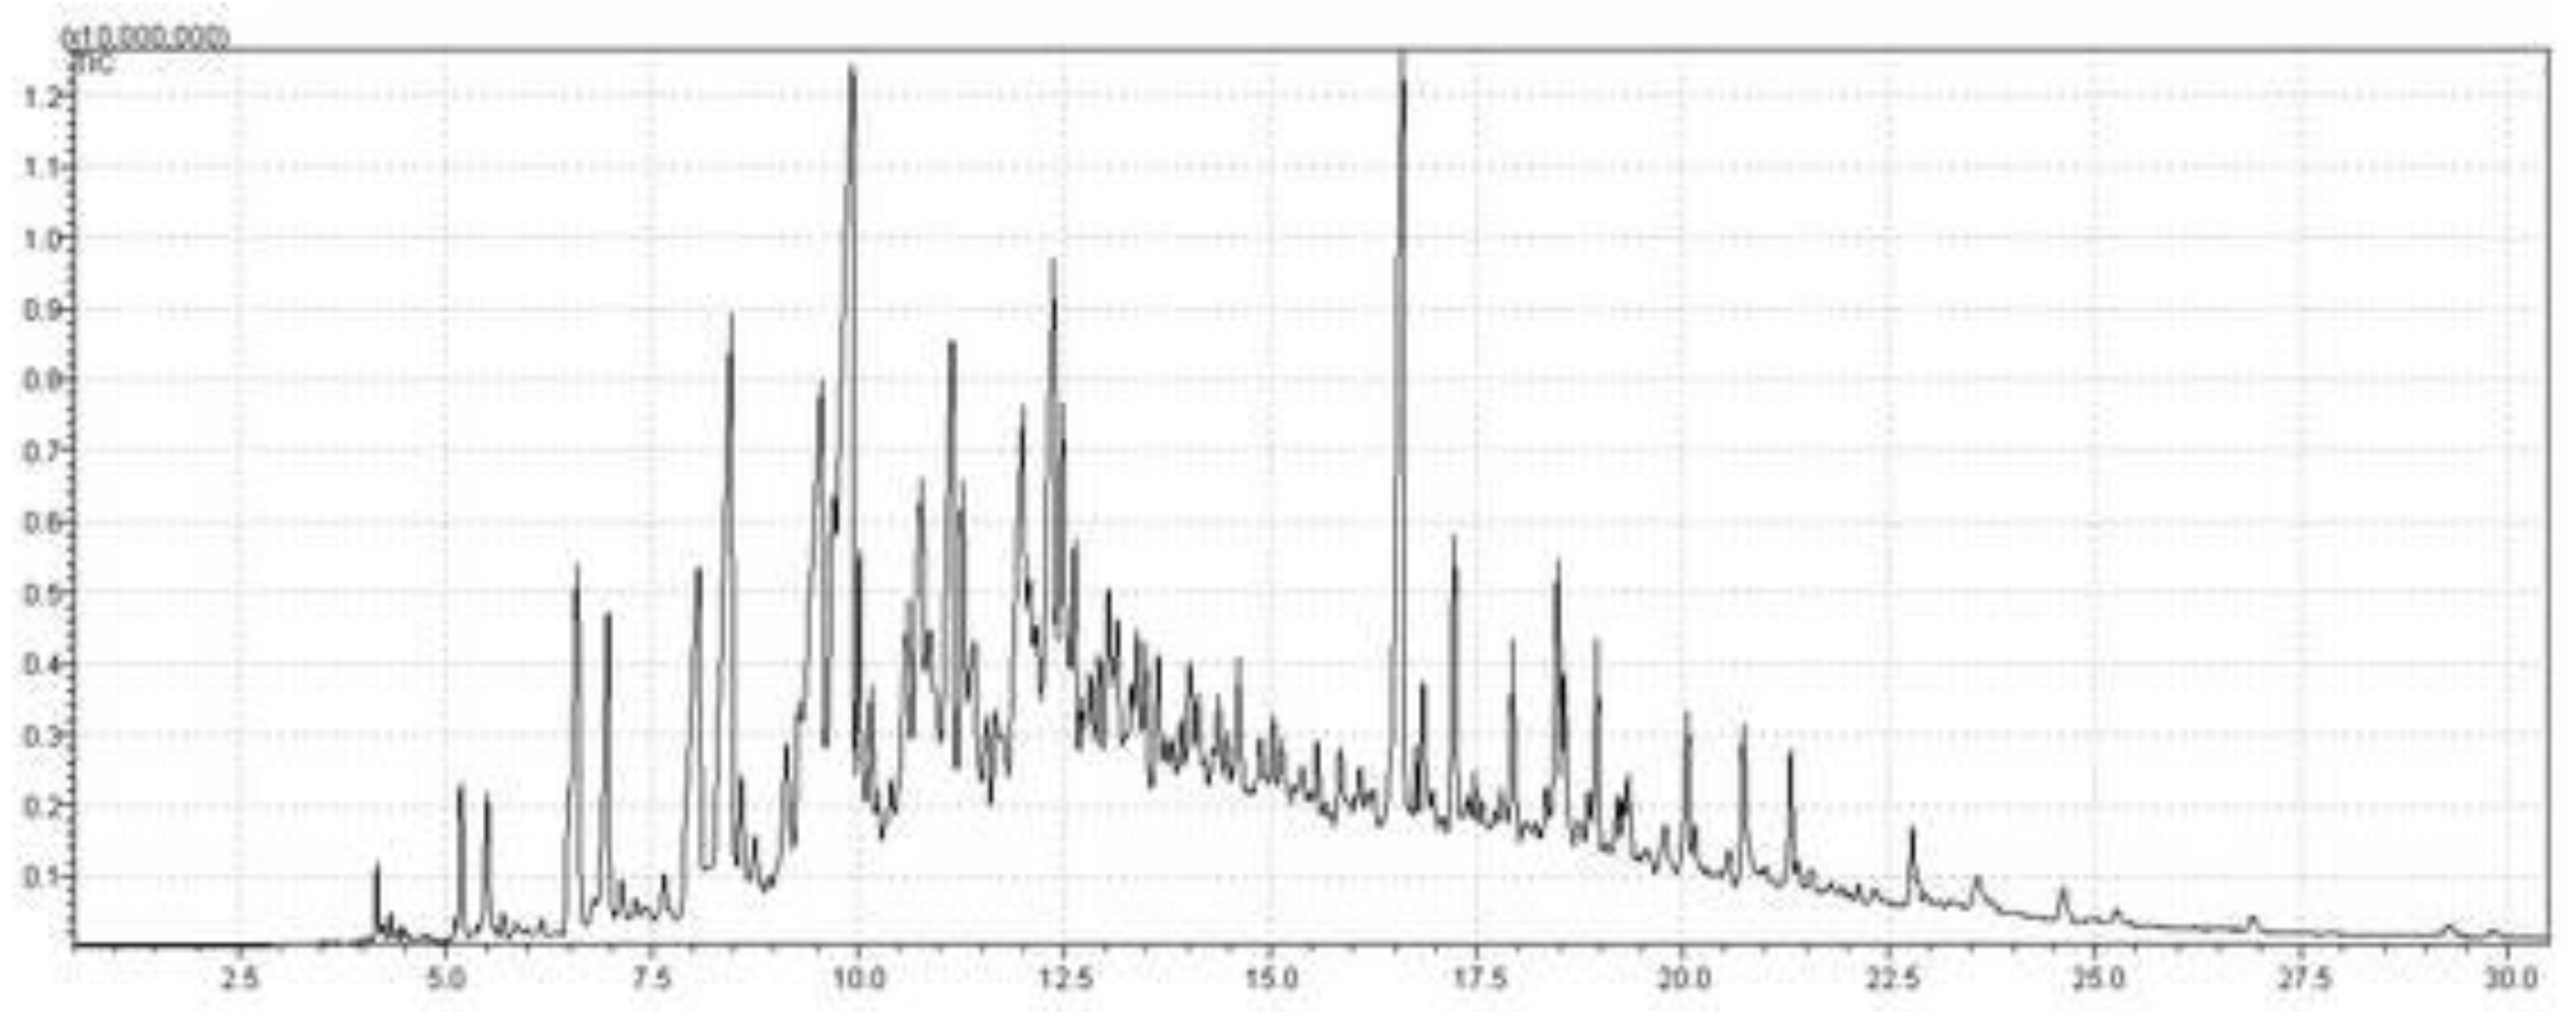
Figure 20.
Carbon number distribution of the distilled fractions.
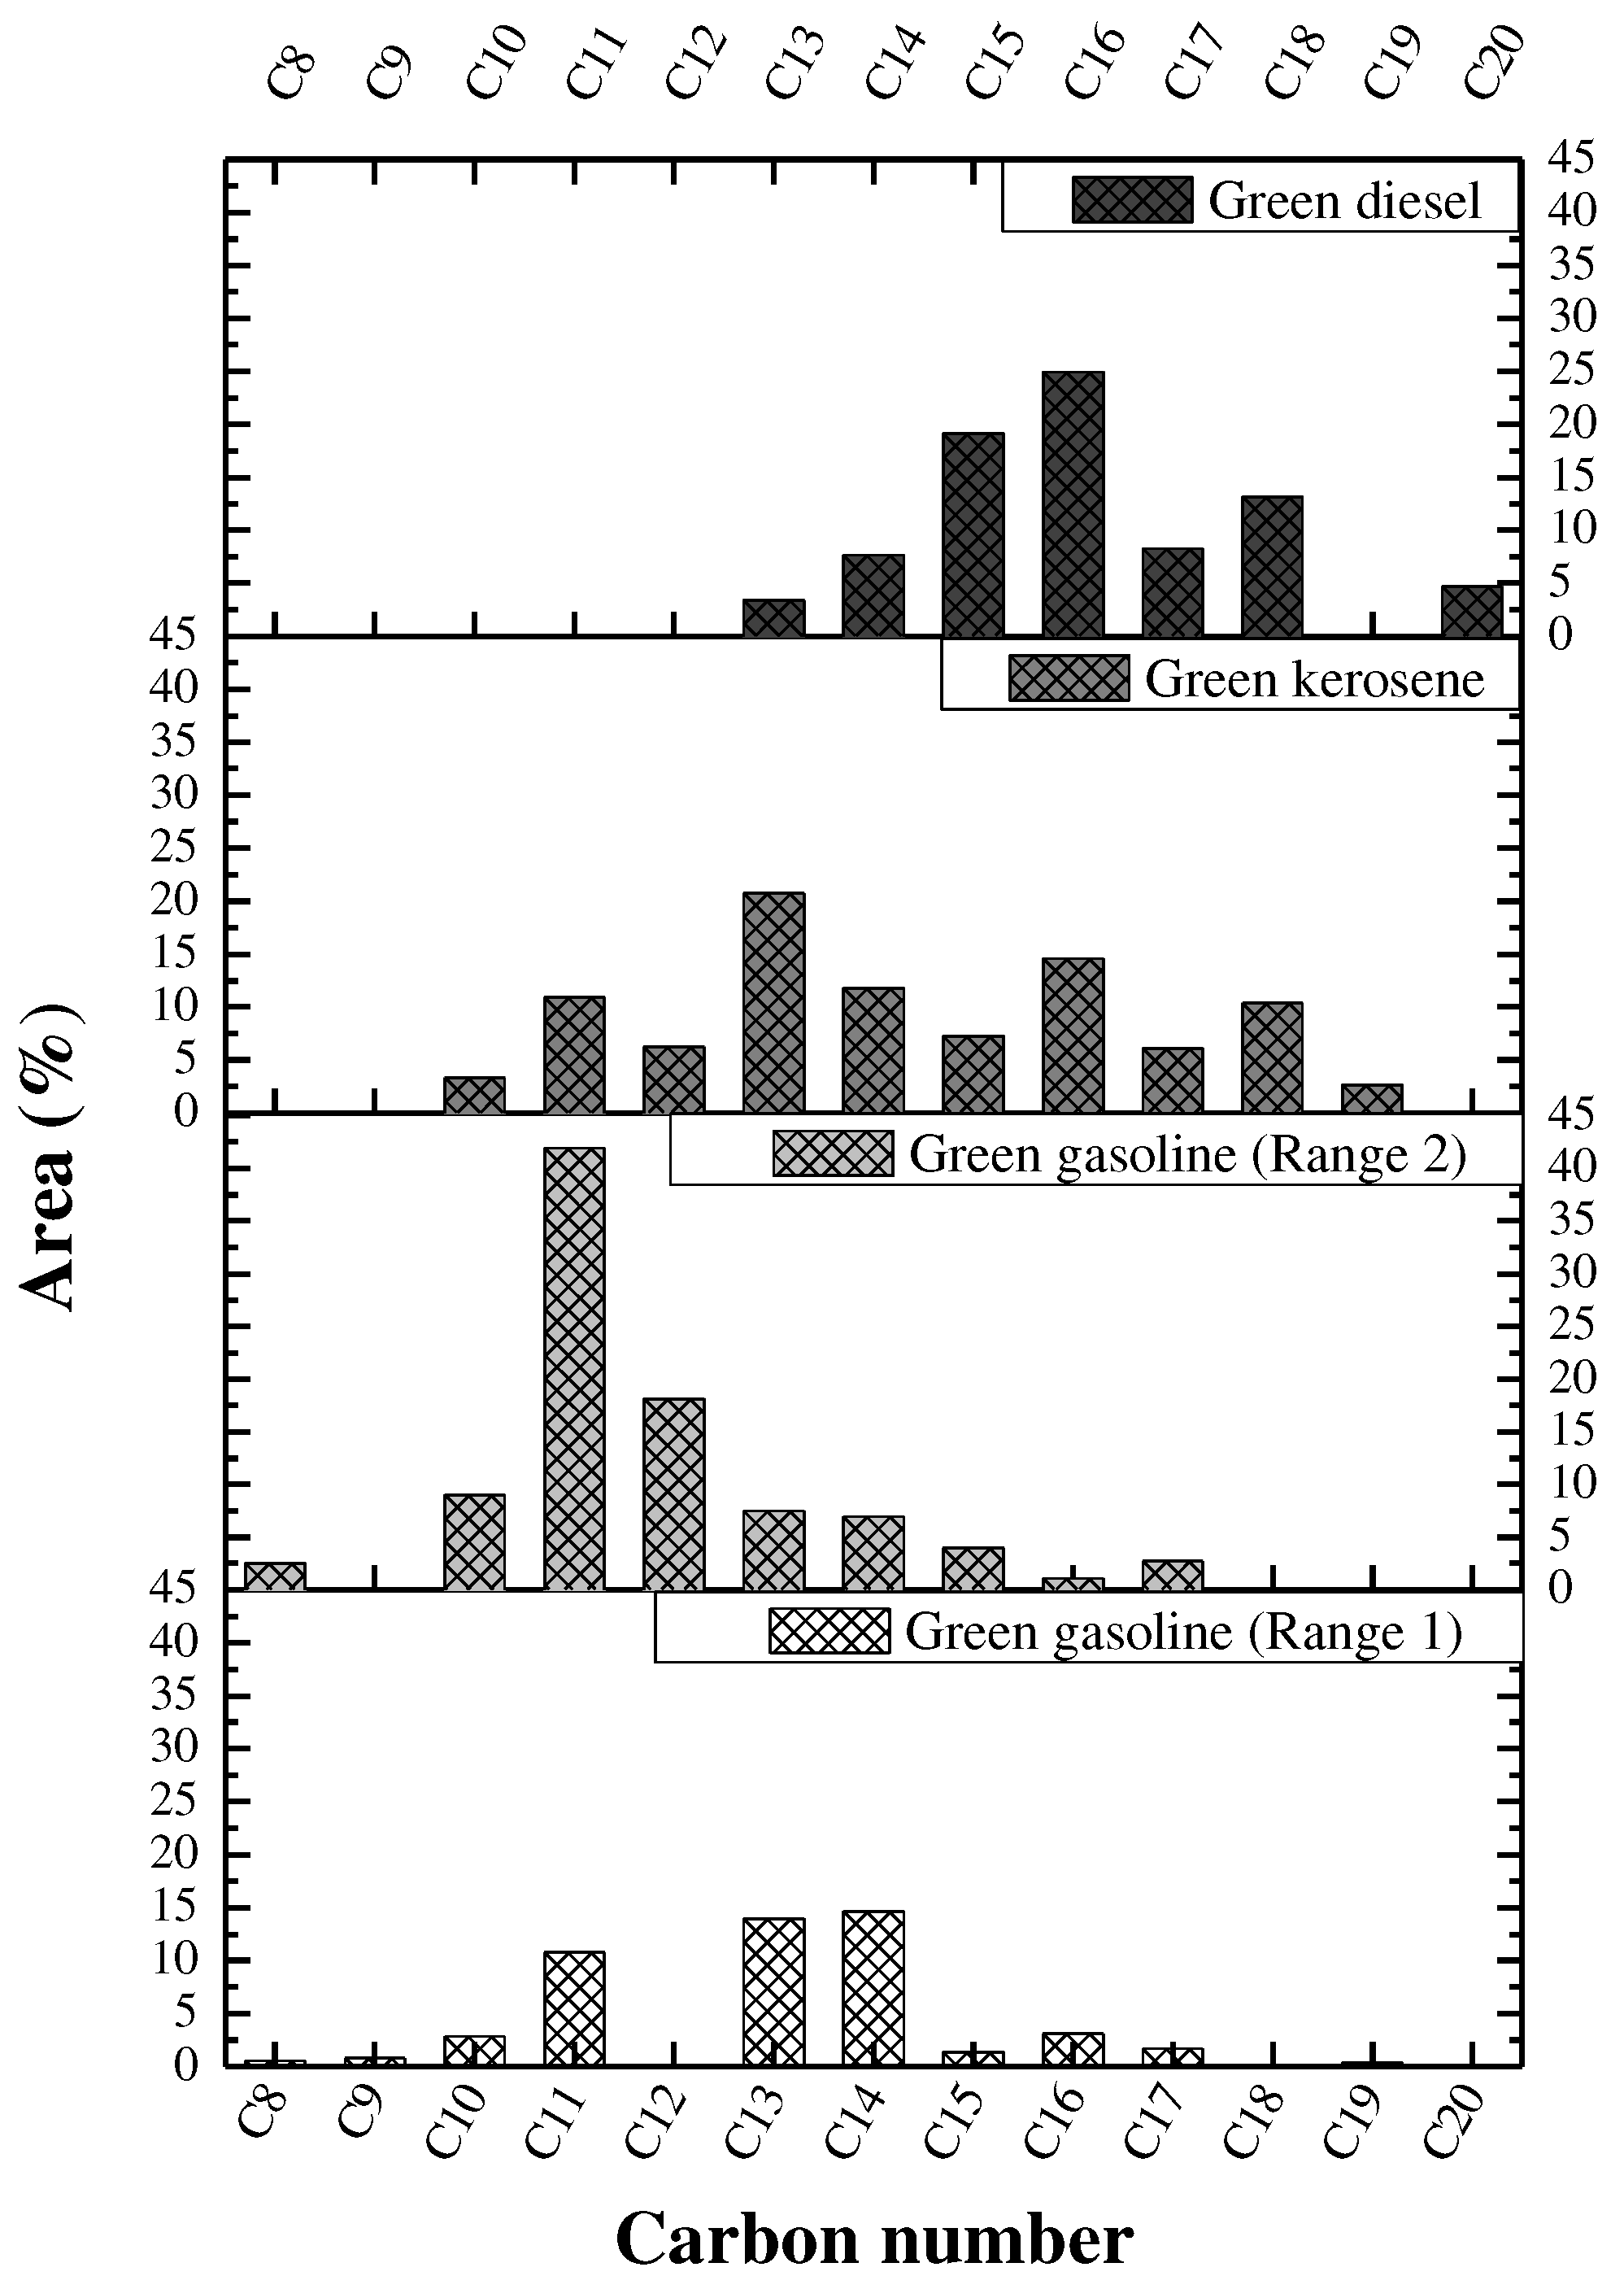
Table 1.
Process parameters and mass balance for the experiments of thermal catalytic cracking of crude palm oil using Fresh Sodium Carbonate (FSC) and Reused Sodium Carbonate (RSC) as the catalysts.
Table 1.
Process parameters and mass balance for the experiments of thermal catalytic cracking of crude palm oil using Fresh Sodium Carbonate (FSC) and Reused Sodium Carbonate (RSC) as the catalysts.
| Process Parameters and mass balance | Catalyst [% wt.] | |
|---|---|---|
| 10 (FSC) | 10 (RSC) | |
| Cracking Temperature [°C] | 450 | 450 |
| Mass of Feed [kg] | 50 | 50 |
| Mass of Catalyst [kg] | 5 | 5 |
| Process Time [min] | 145 | 155 |
| Initial cracking time [min] | 60 | 75 |
| Stirrer Speed [rpm] | 150 | 150 |
| Heating rate (°C) | n.r. | n.r. |
| Conversion [% wt.] | ||
| Mass of OLP (kg) | 31.8 | 29.50 |
| Mass of coke (kg) | 4.00 | 1.86 |
| Mass of gas (kg) | 14.20 | 18.64 |
| Mass of water (kg) | n.r. | n.r. |
| Yield of OLP (% wt.) | 63.60 | 59.00 |
| Yield of coke (% wt.) | 8.00 | 3.72 |
| Yield of gas (% wt.) | 28.40 | 37.28 |
| Yield of water (% wt.) | n.r. | n.r. |
n.r., not rated.
Table 2.
Physical-chemical properties of OLP produced with fresh and reused sodium carbonate.
| Physical-chemical Properties | Catalyst [% wt.] | ANP Nº 65 [73] | |
|---|---|---|---|
| 10 (FSC) | 10 (RSC) | ||
| Specific gravity at 20°C [g/cm3] | 0.950 | 0.980 | 0.82-0.85 |
| Kinematic viscosity at 40°C [mm2/s] | 2.90 | 4.96 | 2.0-4.5 |
| Corrosiveness to copper, 3h at 50°C | 1A | 1A | 1A |
| Acid value [mg KOH/g] | 8.98 | 39.00 | n.r. |
| Saponification value [mg KOH/g] | 9.19 | 89.46 | n.r. |
| Ester value [mg KOH/g] | 0.21 | 50.46 | n.r. |
| Content of FFA [%] | 4.51 | 19.62 | n.r. |
| Refractive index | 1.45 | 1.45 | n.r. |
| Flash point [°C] | 19.10 | 26.00 | ≥ 38 |
| Carbon residue [%] | 0.73 | 0.74 | 0.25 |
ANP: Brazilian National Petroleum Agency, Resolution Nº 65 (Specification of Diesel S10). n.r., not rated.
Table 3.
Refractive index and corrosiveness to the copper of the OLP collected at different times during the thermal catalytic cracking experiment of crude palm oil.
Table 3.
Refractive index and corrosiveness to the copper of the OLP collected at different times during the thermal catalytic cracking experiment of crude palm oil.
| Time (Min) |
Catalyst [% wt.] | |||||
|---|---|---|---|---|---|---|
| 10 (FSC) | 20 (FSC) | 10 (RSC) | ||||
| R.I. | Corrosiveness to Copper, 3h at 50 °C | R.I. | Corrosiveness to Copper, 3h at 50 °C | R.I. | Corrosiveness to Copper, 3h at 50 °C | |
| 0 | 1.45 | 1A | 1.44 | 1A | 1.45 | 1A |
| 10 | 1.46 | n.r. | 1.44 | n.r. | ||
| 20 | 1.42 | 1A | 1.45 | 1A | ||
| 30 | 1.44 | 1A | 1.46 | 1A | ||
| 40 | 1.44 | 1A | 1.45 | 1A | ||
| 50 | 1.45 | 1A | 1.45 | 1A | ||
| 60 | 1.45 | 1A | 1.45 | 1A | ||
n.r., not rated. R.I., Refractive index.
Table 4.
Process parameters and mass balance for the fractional distillation in a laboratory scale.
| Process Parameters | Unit | Values |
|---|---|---|
| Initial mass of OLP | g | 653.37 |
| Initial operating temperature | °C | 31 |
| Initial distillation temperature | °C | 102 |
| Final distillation temperature | °C | 400 |
| Mass of non-condensable gases | g | 37.17 |
| Mass of green gasoline/Range 1 | g | 31.69 |
| Mass of green gasoline/Range 2 | g | 62.00 |
| Mass of green aviation kerosene | g | 157.85 |
| Mass of green diesel | g | 155.84 |
| Mass of bottoms product | g | 208.82 |
| Yield of non-condensable gases | % wt. | 5.69 |
| Yield of green gasoline/Range 1 | % wt. | 4.85 |
| Yield of green gasoline/Range 2 | % wt. | 9.49 |
| Yield of green aviation kerosene | % wt. | 24.16 |
| Yield of green diesel | % wt. | 23.85 |
| Yield of bottoms product | % wt. | 31.96 |
Table 5.
Physical-chemical properties of the green gasoline (Range 1) and green gasoline (Range 2) fractions.
Table 5.
Physical-chemical properties of the green gasoline (Range 1) and green gasoline (Range 2) fractions.
| Physical-chemical properties | Unit | OLP [23] | Green gasoline | ANP Nº 40 [87] | ASTM D4814 (Gasoline/type A) [88] |
Gasoline fraction [19] | Gasoline fraction [50] | ||
|---|---|---|---|---|---|---|---|---|---|
| Range 1 | Range 2 | ||||||||
| Specific gravity at 20 °C | kg/m³ | 790.00 | 690.00 | 750.00 | Annotate | - | 866.00 | 843.80 | |
| Kinematic viscosity at 40 °C | mm²/s | 2.02 | 0.72 | 0.76 | - | - | 2.34 | - | |
| Flash point, min | ºC | 85.10 | 2.10 | 3.00 | - | - | 34.00 | - | |
| Corrosiveness to copper, 3h 50 °C, max. | - | 1 | 1 | 1 | 1 | 1 | - | - | |
| Carbon residue, max | wt.% | 0.64 | n.r. | - | - | - | - | - | |
| Acid value | mg KOH/g | 1.02 | 1.11 | 1.43 | - | - | 2.30 | 7.60 | |
| Saponification value | mg KOH/g | 14.35 | 12.96 | 14.29 | - | - | - | - | |
| Refractive index | - | 1.44 | 1.40 | 1.42 | - | - | - | - | |
| Ester value | mg KOH/g | 13.33 | 11.85 | 12.86 | - | - | - | - | |
| Content of FFA | wt.% | 0.51 | 0.55 | 0.72 | - | - | - | - | |
| Distillation | |||||||||
| 10% vol., recovered, max. | ºC | n.r. | 72.90 | 116.10 | 65.00 | 70.00 | - | - | |
| 50% vol., recovered, max. | n.r. | 102.10 | 144.60 | 120.00 | 121.00 | - | - | ||
| 90% vol., recovered | n.r. | 174.50 | 196.80 | 190.00 | 190.00 | - | - | ||
| Final Boiling Point (F.B.P), max. | n.r. | 214.5 | 222.30 | 215.00 | 225.00 | - | - | ||
aviscosity at 20 °C; FFA, free fatty acids; n.r., not rated; max, maximum; min, minimum; ANP: Agência Nacional do Petróleo, Gás Natural e Biocombustíveis, Resolution N° 40 (Specification of regular gasoline/Type A).
Table 8.
Retention time, chemical compounds, peak areas for the compounds identified by GC-MS analysis for the green gasoline fraction (Range 1).
Table 8.
Retention time, chemical compounds, peak areas for the compounds identified by GC-MS analysis for the green gasoline fraction (Range 1).
| Retention Time (min) |
Molecular formula | Chemical compounds | Area (%) |
|---|---|---|---|
| 3.044 | C6H12O | 2-Hexanone | 4.07 |
| 3.183 | C8H12 | 2,5,5-Trimethyl-1,3-cyclopentadiene | 0.54 |
| 3.397 | C9H16 | 1,8-Nonadiene | 0.81 |
| 3.621 | C10H20 | Butylcyclohexane | 2.87 |
| 3.948 | C11H24 | Undecane | 10.79 |
| 4.096 | C7H14O | 2-Heptanone | 7.43 |
| 4.232 | C13H26 | 1-Tridecene | 13.98 |
| 4.342 | C14H26 | 1-Tetradecyne | 3.01 |
| 4.392 | C11H24O | 1-Undecanol | 4.98 |
| 4.525 | C14H28 | (7E)-7-Tetradecene | 4.86 |
| 5.175 | C14H28 | (5E)-5-Tetradecene | 6.31 |
| 5.683 | C14H30 | Tetradecane | 0.45 |
| 6.485 | C6H12O2 | Diacetone alcohol | 12.99 |
| 6.903 | C13H28O | 1-Tridecanol | 2.23 |
| 7.015 | C9H18O | 2-Nonanone | 1.88 |
| 7.909 | C15H32 | Pentadecane | 1.37 |
| 8.311 | C16H32 | (3Z)-3-Hexadecene | 1.90 |
| 8.504 | C10H20O | 2-Decanone | 0.80 |
| 9.249 | C16H34 | Hexadecane | 1.19 |
| 9.657 | C17H34 | 1-Heptadecene | 1.69 |
| 12.142 | C19H38 | 1-Nonadecene | 0.38 |
| 16.5 | C15H30O | 2-Pentadecanone | 0.95 |
| 16.819 | C17H34O2 | Hexadecanoic acid, ethyl ester | 7.27 |
| 18.554 | C16H22O4 | Diisobutyl phthalate | 0.47 |
| 18.917 | C18H34O2 | Ethyl Oleate | 5.97 |
| 19.21 | C20H36O2 | 9,12-Octadecadienoic acid, ethyl ester | 0.82 |
Table 9.
Retention time, chemical compounds, peak areas for the compounds identified by GC-MS analysis for the Green gasoline fraction (Range 2).
Table 9.
Retention time, chemical compounds, peak areas for the compounds identified by GC-MS analysis for the Green gasoline fraction (Range 2).
| Retention Time (min) |
Molecular formula | Chemical Compounds | Area (%) |
|---|---|---|---|
| 3.511 | C8H10 | Ethylbenzene | 2.49 |
| 4.042 | C10H18 | 9-Methylbicyclo [3.3.1] nonane | 8.98 |
| 4.268 | C11H22 | 1-Undecene | 16.80 |
| 4.422 | C11H22 | 1-Pentyl-2-propylcyclopropane | 15.17 |
| 5.214 | C11H24 | Undecane | 9.93 |
| 5.531 | C12H24 | 1-Dodecene | 15.09 |
| 5.710 | C12H24 | (2Z)-2-Dodecene | 1.86 |
| 5.868 | C12H24 | Nonylcyclopropane | 1.20 |
| 6.484 | C6H12O2 | Diacetone alcohol | 2.41 |
| 6.561 | C13H28 | Tridecane | 7.47 |
| 6.931 | C14H28 | 1-Tetradecene | 4.91 |
| 7.016 | C9H18O | 2-Nonanone | 2.61 |
| 7.923 | C14H30 | Tetradecane | 2.01 |
| 8.326 | C15H30 | 1-Pentadecene | 3.93 |
| 8.496 | C10H20O | 2-Decanone | 1.34 |
| 9.253 | C16H34 | Hexadecane | 1.10 |
| 9.661 | C17H34 | 1-Heptadecene | 2.71 |
Table 10.
Retention time, chemical compounds, peak areas for the compounds identified by GC-MS analysis for the green aviation kerosene fraction.
Table 10.
Retention time, chemical compounds, peak areas for the compounds identified by GC-MS analysis for the green aviation kerosene fraction.
| Retention Time (min) |
Molecular formula | Chemical Compounds | Area (%) |
|---|---|---|---|
| 4.069 | C10H22 | Decane | 3.34 |
| 4.293 | C11H22 | 1-Undecene | 6.78 |
| 4.448 | C11H22 | 1-Pentyl-2-propylcyclopropane | 4.15 |
| 5.292 | C12H26 | Dodecane | 6.26 |
| 5.610 | C13H26 | 1-Tridecene | 9.42 |
| 5.924 | C12H26O | 1-Dodecanol | 1.10 |
| 6.492 | C6H12O2 | Diacetone alcohol | 1.11 |
| 6.713 | C13H28 | Tridecane | 11.30 |
| 7.057 | C14H28 | 1-Tetradecene | 10.53 |
| 7.206 | C14H28 | (7E)-7-Tetradecene | 1.26 |
| 7.958 | C15H32 | Pentadecane | 7.23 |
| 8.503 | C16H32 | 1-Hexadecene | 14.58 |
| 9.300 | C17H36 | Heptadecane | 6.08 |
| 9.855 | C18H36 | (3E)-3-Octadecene | 9.10 |
| 10.622 | C18H38 | Octadecane | 1.26 |
| 11.012 | C19H38 | 1-Nonadecene | 2.22 |
| 11.186 | C14H28O | (Z)-9-Tetradecen-1-ol | 1.03 |
| 11.780 | C19H40 | Nonadecane | 0.44 |
| 12.180 | C16H34O | 1-Hexadecanol | 0.97 |
| 12.319 | C18H36O | Oleyl Alcohol | 0.56 |
| 12.495 | C13H26O | 2-Tridecanone | 0.57 |
| 16.501 | C15H30O | 2-Pentadecanone | 0.69 |
Table 11.
Retention time, chemical compounds, peak areas for the compounds identified by GC-MS analysis for the green diesel fraction.
Table 11.
Retention time, chemical compounds, peak areas for the compounds identified by GC-MS analysis for the green diesel fraction.
| Retention Time (min) |
Molecular formula | Chemical Compounds | Area (%) |
|---|---|---|---|
| 6.483 | C6H12O2 | Diacetone alcohol | 1.12 |
| 6.599 | C13H28 | Tridecane | 3.40 |
| 6.964 | C14H28 | 1-Tetradecene | 2.39 |
| 8.067 | C14H30 | Tetradecane | 5.29 |
| 8.461 | C15H30 | 1-Pentadecene | 7.91 |
| 9.562 | C15H32 | Pentadecane | 11.23 |
| 9.926 | C16H32 | 1-Hexadecene | 18.81 |
| 10.014 | C16H34O | 1-Hexadecanol | 2.25 |
| 10.606 | C16H32 | Decylcyclohexane | 1.90 |
| 10.776 | C16H34 | Hexadecane | 4.21 |
| 11.138 | C17H34 | 1-Heptadecene | 6.13 |
| 11.265 | C17H36O | 1-Heptadecanol | 2.81 |
| 11.408 | C17H36 | Heptadecane | 2.11 |
| 11.998 | C18H34 | 1-Octadecyne | 5.78 |
| 12.371 | C18H36 | 1-Octadecene | 7.38 |
| 12.478 | C20H38 | 1,19-Eicosadiene | 4.71 |
| 16.598 | C17H34O | 2-Heptadecanone | 7.88 |
| 17.229 | C18H36O | 4-Octadecanone | 1.83 |
| 18.48 | C19H38O | 2-Nonadecanone | 1.88 |
| 20.74 | C15H30O2 | Pentadecanoic acid | 0.98 |
Table 13.
Comparison of chemical composition (hydrocarbons and oxygenates compounds) of distilled fractions reported in the literature with that of the present study.
Table 13.
Comparison of chemical composition (hydrocarbons and oxygenates compounds) of distilled fractions reported in the literature with that of the present study.
| Distillation | Feed | Temperature | Pressure | Distilled fraction |
Hydrocarbons (% area) |
Oxygenates (% area) |
References |
| Fractional distillation | OLP of Palm oil | <90 °C | 1 atm | Green gasoline (Range 1) | 56.02 | 43.98 | This study |
| Fractional distillation | OLP of Palm oil | 90-160 °C | 1 atm | Green gasoline (Range 2) | 86.37 | 13.63 | This study |
| Fractional distillation | OLP of Palm oil | 160-245 °C | 1 atm | Green aviation kerosene | 91.38 | 8.62 | This study |
| Fractional distillation | OLP of Palm oil | 245-340 °C | 1 atm | Green diesel | 70.78 | 29.22 | This study |
| Reactive distillation | Bio-oil | <200 °C | 1 atm | Light bio-oil | 60.06 | 1.88 | [50] |
| Simple distillation | Bio-oil of carinata oil | <200 °C | 1 atm | Hydrocarbon biofuel | 91.97 | 8.03 | [17] |
| Fractional distillation | Corn stover bio-oil | ≤100 °C | 1 atm | Light fraction | 23.1 | 15.9 | [47] |
| Fractional distillation | Corn stover bio-oil | 100-180 °C | 1 atm | Middle fraction | 24.9 | 14.9 | [47] |
| Fractional distillation | Corn stover bio-oil | 180-250 °C | 1 atm | Heavy fraction | 7.1 | 6.8 | [47] |
| Fractional distillation | OLP of residual FOGa from grease traps | 175-235 °C | 1 atm | Kerosene fraction | 94.62 | 5.38 | [51] |
| Fractional distillation | OLP of residual FOGa from grease traps | 235-305 °C | 1 atm | Light diesel fraction | 73.86 | 26.14 | [14] |
| Fractional distillation | Bio-oil of deodar saw dust | <140 °C | 1 atm | IBPb<140 °C fraction | 46.04 | 2.59 | [99] |
| Fractional distillation | Bio-oil of pine saw dust | <140 °C | 1 atm | IBPb<140 °C fraction | 42.87 | 1.06 | [99] |
aFat, oils, and grease: FOG; bInitial Boiling Point: IBP.
Disclaimer/Publisher’s Note: The statements, opinions and data contained in all publications are solely those of the individual author(s) and contributor(s) and not of MDPI and/or the editor(s). MDPI and/or the editor(s) disclaim responsibility for any injury to people or property resulting from any ideas, methods, instructions or products referred to in the content. |
© 2023 by the authors. Licensee MDPI, Basel, Switzerland. This article is an open access article distributed under the terms and conditions of the Creative Commons Attribution (CC BY) license (http://creativecommons.org/licenses/by/4.0/).
Copyright: This open access article is published under a Creative Commons CC BY 4.0 license, which permit the free download, distribution, and reuse, provided that the author and preprint are cited in any reuse.


