
Submitted:
17 July 2023
Posted:
18 July 2023
You are already at the latest version
Abstract
Summarizing radiological characteristics between primary lung adenocarcinoma subtypes and correlate them with FDG uptake on PET-CT are important for further treatment. A PET-CT examination was performed on some of the patients and the values of SUV-max were also correlated with the histological and morphological characteristics of masses in the lungs. Results of this analysis showed that the mean size of AIS-MIA cancer was significantly lower than for all other cancer types, while mean size of the acinar cancer was smaller than in solid type of cancer. Metastases were significantly more frequent in solid adenocarcinoma than in acinar, lepidic and AIS-MIA cancer subtypes. The maximum standardized FDG uptake was significantly lower in AIS-MIA than in all other cancer types, and in acinar compared to solid cancer. Papillary adenocarcinoma had higher odds to develop contralateral lymph node involvement compared to other types. Solid adenocarcinoma was associated with higher odds of having metastases and with higher SUVmax. AIS-MIA was associated with lower odds of one unit increase in tumour size, ipsilateral lymph node involvement. Radiology has a significant role in the diagnosis and monitoring of the disease, and in determining its prognosis, and influence on the decision on the method of treatment.
Keywords:
lung adenocarcinoma
; CT
; PET-CT
; lung cancer
1. Introduction
Lung cancer is the second most common form of cancer in the world both, men and women as well as the most common cause of cancer related death worldwide. Around 2 million new cases of lung cancer are discovered in the world every year, with an increasing trend from each year. 85% of all diagnosed cases of lung cancer, are non-small pathohistological type, and about 45% of them are lung adenocarcinomas [1].
The International Association for the Study of Lung cancer (IASLC), the American Thoracic Society (ATS) and the European Respiratory Society (ERS) published in 2011 a multidisciplinary classification of lung adenocarcinomas (ADCs), resulting from a consensus between chest physicians, oncologists, thoracic surgeons, pathologists, molecular biologists and radiologists. Further refinements were made in the WHO classification of 2015 and 2021, integrating genetic and molecular data [2].
The radiological presentation of peripheral ADCs is singular with a spectrum varying from subsolid to solid nodules and masses. This wide range of imaging findings was shown to have a good correlation with adenocarcinoma subtypes, histological patterns, as well as prognosis [3,4,5]. Recent advances in imaging techniques, such as positron emission tomography-computed tomography (PET-CT) and multidetector computed tomography (MDCT), have improved the diagnosis, staging, and management of lung adenocarcinoma. This essay aims to explore the histological subtypes of lung adenocarcinoma and their correlation with PET-CT and MDCT findings [6].
Terminology of lung adenocarcinoma has been significantly revised in the new WHO classification by discontinuing the terms bronchioloalveolar carcinoma (BAC) and mixed subtype adenocarcinoma and adding terms of adenocarcinoma in situ (AIS) as a preinvasive lesion and minimally invasive adenocarcinoma (MIA) (Figure 1-2). The subtypes of clear cell and signet ring adenocarcinoma and term mucinous cystadenocarcinoma have been discontinued and later included under the category of colloid adenocarcinoma, while keeping five general histological types: (acinar, papillary, micropapillary, lepidic, solid) [6,7].
The aim of this study is to show the correlation between morphological characteristics of primary lung adenocarcinoma and histopathological subtypes in order to use radiological illustration of tumor appearance and other findings for better understanding and diagnosis of lung adenocarcinoma itself, as well as suggestions for further treatment and prognosis. (Figure 1, Figure 2, Figure 3, Figure 4 and Figure 5) Another goal is the correlation between the values of the maximum uptake of FDG on the performed PET-CT with certain radiological characteristics and histological subtypes of the tumor.
2. Materials and Methods
2.1. Patients
This study included 102 patients with lung adenocarcinoma confirmed by pathohistological examination, starting from January 1st to December 31st, 2017. in Clinic for thoracic surgery and Clinic for pulmonology in University Clinical Center of Serbia. The sample was obtained by surgical resection or tru-cut and FNA biopsies under the guidance of ultrasound or CT.
2.2. CT and FDG PET CT Amage Acquisition
All CT examination were performed with CT scanners after intravenous contrast administration in late arterial phase in all patients. The chest CT features are reviewed by radiologists and included: tumor consistency, the size of the tumor (largest diameter in the axial plane in the lung window), shape and margins, as well as the relationship to the surrounding structures (pleura, vascular components, bronchi). The enlargement of lymph nodes (more than 15 mm in shorter axis) and their localization were monitored – paratracheal, hilar on the same side as tumor, contralateral and in the supraclavicular pits. Three patients with micropapillary subtypes of adenocarcinoma reported by pathologist in this group were excluded from study because of lack of statistical significance. (Figure 1- 5).
2.3. Statistical Methods
The normality of the distribution of continuous variables was evaluated by using visual inspection of histograms and probability plots. Data were presented as mean ± SD or median (interquartile range [IQR]) for continuous variables, depending on the normality of data distribution, and number (percentage) for categorical variables. Differences in patient and cancer characteristics between the five groups of caner types were assessed using the ANOVA or Kruskal-Wallis test for continuous data and Chi-square test for categorical data. To adjust for multiple comparisons, Bonferroni correction was applied for all post/hoc comparisons. Separate logistic regression analyses were performed to estimate the relationship between patient and cancer characteristics and occurrence of different cancer types adjusted for age, sex, and smoking status. “One vs. all” method was used to assess association between patient and cancer characteristics and certain type of cancer with respect to other cancer types. Odds ratios (OR) with 95%CI were calculated and the Hosmer-Lemeshow goodness-of-fit test was performed to assess overall model fit. All statistical tests were two-sided and were performed at 5% significance level or by using 95% confidence interval generated by the bootstrap method set to 1.000 reiterations. The statistical analysis was performed using SPSS version 23.0 software (SPSS Inc., Chicago, IL, USA).
3. Results
Baseline patients and cancer characteristics are summarised in Table 1, Table 2, Table 3 and Table 4, and compared between five categories of lung adenocarcinoma. Lepidic type of cancer was significantly more common in females than in males (78.9% vs. 21.1%, p=0.003) while acinar type was significantly more common in males than in females (65.6% vs. 34.4%, p=0.003). The mean size of AIS-MIA cancer was significantly lower than for all other cancer types, while mean size of the acinar cancer was smaller than in solid type of cancer (37.2±7.6 vs. 47.7±12.6, p=0.002). Metastases were significantly more frequent in solid adenocarcinoma (61%) than in acinar (9.4%, p=0.001), lepidic (0%, p<0.001) and AIS-MIA (0%, p=0.003) cancer subtypes. The maximum standardized uptake (SUVmax) was significantly lower in AIS-MIA than in all other cancer types, and in acinar compared to solid cancer (4.9±1.1 vs. 6.3±0.8, p=0.001).
Age, sex, and smoking status adjusted OR with 95%CI for the association between patient and cancer characteristics are presented in Table 5. Papillary adenocarcinoma had higher odds to develop contralateral lymph node involvement compared to other types (OR 4.49, 95%CI 1.02-19.73). Solid adenocarcinoma was associated with higher odds of having metastases (OR 14.09, 95%CI 3.51-56.41) and with higher SUVmax (OR for one unit increase 2.64, 95%CI 1.48-4.69). AIS-MIA was associated with lower odds of one unit increase in tumour size (OR 0.65 95%CI 0.51-0.83), ipsilateral lymph node involvement (0.20 95%CI 0.05-0.85) and one unit increase in SUVmax (OR 0.07 95%CI 0.02-0.29) and with higher odds of ground glass presentation (OR 7.19, 95%CI 1.35-38.34). There were no significant associations of the selected characteristics and acinar and solid cancer compared to other cancer types.
4. Discussion
Having in mind the fact that lung cancer is currently one of the most common form of cancer in the world, and lung adenocarcinoma is the most common histological type of lung cancer, we believe that timely diagnosis significantly improves the outcome of the course of the disease [8,9].
Invasive adenocarcinoma is most often seen as a solid nodule but it may also be partially solid, and occasionally a ground glass nodule. A lobar pattern of ground-glass opacity (GGO) can be seen in some of the cases. Lobulated tumors in Ia stage of lung adenocarcinoma correlate with well-differentiated, slowly growing tumors. Thick (≥2 mm) spiculation has been associated with vascular invasion, mediastinal lymphadenopathy and decreased survival rate. If in Ia stage lung adenocarcinoma is seen as a partially solid nodule, than an extensive ground-glass component suggests a favorable outcome [10,11,12]. Histologically, the solid component typically corresponds to invasive patterns, while a lepidic pattern is usually seen as the ground-glass component. Absence of pleural retraction in lung adenocarcinoma is also a sign of favorable prognosis [11]. In solid adenocarcinomas, the presence of nodules, or lobulated edges on thin section CT has usually been associated with poor differentiation on pathohistological examination and these cases have a much higher risk of an adverse outcome [5,9,11]. A number of studies conveyed to this date are dealing with the significance of determination of the type of lung adenocarcinoma, as well as with its further prognosis based on staging and certain gene mutations. It has been proven that the lepidic type associated with a better outcome in patients with lung adenocarcinoma is also a predictor of survival in numerous papers and morphological characteristics that we have correlated here. Also, the correlation of tumor morphological features with PET-CT results gave a clear picture of the prognosis of the outcome. Although the weakness of this study is that other histological types of non-small cell lung cancer are not included, which gives similar CT characteristics, it still gives its importance especially in a certain part of patients where surgical treatment is not possible. Then the histopathological type of tumor is obtained by bronchoscopy, tru-cut or FNA biopsy and the sample is significantly smaller in volume and the correlation with the morphological characteristics on CT is of great importance for making a final diagnosis. Findings on larger studies as also in our group of patients go for CT and PET-CT characteristics of histological subtypes [13,14,15,16,17,18,19]:
- Lepidic Pattern: The lepidic subtype, characterized by the growth of tumor cells along preexisting alveolar structures, often presents as a ground-glass opacity (GGO) on CT imaging. GGOs typically demonstrate a hazy or cloudy appearance and are associated with favorable prognosis. This type often exhibits low metabolic activity on PET imaging. This pattern typically manifests as a focal area of increased radiotracer uptake on CT, reflecting the underlying ground-glass opacity or consolidation.
- Acinar Pattern: The acinar subtype, composed of glandular structures, often appears as a solid nodule or a partially solid nodule with a central ground-glass component on CT scans. The solid component is associated with a higher likelihood of lymph node involvement and poorer prognosis. The acinar subtype, composed of glandular structures, generally demonstrates moderate to high metabolic activity on PET-CT imaging. PET scans reveal focal areas of increased radiotracer uptake corresponding to solid components within the tumor
- Papillary Pattern: The papillary subtype, characterized by the presence of papillary projections, may manifest as a solid nodule with lobulated margins on CT imaging. The papillary subtype, characterized by papillary projections, typically shows increased radiotracer uptake on PET scans. The presence of avid radiotracer uptake corresponds to the solid components or invasive portions of the tumor, highlighting a higher risk of lymph node metastasis and potential aggressiveness.
- Solid Pattern: The solid subtype, composed of sheets of tumor cells without distinctive glandular or papillary structures, typically appears as a homogeneous solid nodule on CT imaging. It is associated with a higher risk of lymph node metastasis, distant spread, and unfavorable prognosis. The solid subtype, composed of sheets of tumor cells without distinctive glandular or papillary structures, generally exhibits high metabolic activity on PET imaging.
And for PET - Given the increase in the number of patients from year to year as well as the beginning of screening for this disease in some countries for risk groups, it is necessary to work as much as possible in this area to see a better radiological picture and contribute to the correlation between different morphological features on CT with pathological, immune, genetic characteristics as well as the characteristics that the tumor shows on other imaging methods, all with the aim of better understanding this disease. An example can be the proof that in the first stage of the disease, as well as in patients with AIS and MIA, the five-year survival is almost 100% [6,14,19,20,21,22,23].
There were no other major studies that show gender correlation and based on our experience, there is no predilection for any gender to develop any subtype of adenocarcinoma, so basic gender results in this paper are consequence of relatively small sample [24,25,26].
Elevated standard uptake values (SUVs) on fluorodeoxyglucose positron emission tomography (PET) correlate with cellular proliferation and aggressiveness of the primary cancer. Sensitivity of PET for AIS is usually very low. PET is commonly used for staging and follow-up of invasive adenocarcinoma, and for lesions of 7 mm or larger, SUV for adenocarcinoma of the lung tends to be lower than for other histologic types of lung cancer and correlate inversely with survival [27,28,29,30,31,32,33].
5. Conclusions
Radiology has a significant role in the diagnosis and monitoring of the course of the disease, as well as in determining its prognosis, and thus the greatest influence on the clinical decision on the method of treatment. An example of this may be smaller ground glass lesions that have been shown to be minimally invasive, and a shorter follow-up may have been advised to rule out another etiology, rather than primary resection. The morphological characteristics of the tumor may to some extent indicate histological types of lung adenocarcinoma, but in correlation with PET-CT, they significantly help to differentiate them when the tumor tissue sample itself is small. CT is also the primary method for monitoring responses to chemotherapy and radiotherapy, as well as for diagnosing disease metastases.
The correlation between histopathological and radiological findings is crucial for accurate diagnosis and staging. By integrating both sets of data, clinicians can enhance diagnostic accuracy and determine the optimal treatment plan. Additionally, the presence of specific histopathological features, such as micropapillary or solid patterns, may indicate a higher risk of lymph node involvement, which can guide the decision for surgical resection or lymph node sampling.
Furthermore, histopathological and radiological correlation is crucial for assessing treatment response and disease progression. Changes in tumor size, density, and metabolic activity observed on follow-up imaging scans can help evaluate the effectiveness of treatment modalities, such as chemotherapy or targeted therapy. If there is discordance between the radiological and histopathological findings, additional investigations, such as repeat biopsies or molecular testing, may be necessary to guide treatment adjustments.
Histopathological and radiological correlation plays a fundamental role in the management of lung adenocarcinoma. The integration of histopathological findings with radiological imaging allows for accurate diagnosis, staging, treatment planning, and assessment of treatment response. A multidisciplinary approach involving pathologists, radiologists, and clinicians is essential to optimize patient care and improve outcomes in individuals with lung adenocarcinoma.
Author Contributions
Conceptualization N.C. and R.S.; methodology N.C.; software K.L., N. B. and D.A..; validation M.Sa. and M.St.; formal analysis S.B. and J.J.; investigation N. C.; resources N.C., J.P. and Z.G..; data curation Z.G.; writing—original draft preparation N.C.; writing—review and editing N.C. and Z.G..; visualization J.V.M. and M.K.; supervision D. S. and Z. G.; project administration, Z.G.
Funding
This research received no external funding.
Informed Consent Statement
Informed consent was obtained from all subjects involved in the study.
Data Availability Statement
The data that support the findings of this study are avaiable from the first author (N.C.) upon reasonable request.
Conflicts of Interest
The authors declare no conflict of interest.
References
- Cohen, J.G.; Reymond, E.; Jankowski, A.; Brambilla, E.; Arbib, F.; Lantuejoul, S.; Ferretti, G.R. Adénocarcinomes pulmonaires: corrélations entre TDM et histopathologie. Journal de Radiologie Diagnostique et Interventionnelle. 2016, 97, 375–384. [Google Scholar] [CrossRef]
- Lantuejoul, S.; Rouquette, I.; Brambilla, E.; Travis, W.D. Nouvelle classification OMS 2015 des adénocarcinomes pulmonaires et prénéoplasies. Annales de Pathologie. 2016, 36, 5–14. [Google Scholar] [CrossRef]
- Travis, W. D.; Brambilla, E.; Noguchi, M.; Nicholson, A.G.; Geisinger, K.R.; Yatabe, Y.; Beer, D.G.; Powell, C.A.; Riely, G.J.; Van Schil, P.E.; et al. International Association for the Study of Lung Cancer/American Thoracic Society/European Respiratory Society International Multidisciplinary Classification of Lung Adenocarcinoma. Journal of Thoracic Oncology 2011, 6, 244–285. [Google Scholar] [CrossRef]
- Yanagawa, M.; Johkoh, T.; Noguchi, M.; Morii, E.; Shintani, Y.; Okumura, M.; Hata, A.; Fujiwara, M.; Honda, O.; Tomiyama, N. Radiological prediction of tumor invasiveness of lung adenocarcinoma on thin-section CT. Medicine (Baltimore). 2017, 96, e6331. [Google Scholar] [CrossRef]
- Cohen, J.G.; Reymond, E.; Jankowski, A.; Brambilla, E.; Arbib, F.; Lantuejoul, S.; Ferretti, G.R. Lung adenocarcinomas: correlation of computed tomography and pathology findings. Diagn Interv Imaging. 2016, 97, 955–963. [Google Scholar] [CrossRef]
- Underwood, C.; Musick, A.; Glass, C. Adenocarcinoma overview. Available online: https://www.pathologyoutlines.com/topic/lungtumoradenocarcinoma.html (accessed on 14 July 2023).
- Kao, T.N.; Hsieh, M.S.; Chen, L.W.; Yang, C.F.J.; Chuang, C.C.; Chiang, X.H.; Chen, Y.C.; Lee, Y.H.; Hsu, H.H.; Chen, C.M.; et al. CT-Based Radiomic Analysis for Preoperative Prediction of Tumor Invasiveness in Lung Adenocarcinoma Presenting as Pure Ground-Glass Nodule. Cancers 2022, 14, 5888. [Google Scholar] [CrossRef] [PubMed]
- Castro, C.Y.; Coffey, D.M.; Medeiros, L.J.; Cagle, P.T. Prognostic significance of percentage of bronchioloalveolar pattern in adenocarcinomas of the lung. Annals of Diagnostic Pathology 2001, 5, 274–284. [Google Scholar] [CrossRef]
- Wang, X.W.; Chen, W.F.; He, W.J.; Yang, Z.M.; Li, M.; Xiao, L.; Hua, Y.Q. CT features differentiating pre- and minimally invasive from invasive adenocarcinoma appearing as mixed ground-glass nodules: mass is a potential imaging biomarker. Clin Radiol. 2018, 73, 549–554. [Google Scholar] [CrossRef]
- Nakazono, T.; Sakao, Y.; Yamaguchi, K.; Imai, S.; Kumazoe, H.; Kudo, S. Subtypes of peripheral adenocarcinoma of the lung: differentiation by thin-section CT. Eur Radiol. 2005, 15, 1563–1568. [Google Scholar] [CrossRef] [PubMed]
- Kuhn, E.; Morbini, P.; Cancellieri, A.; Damiani, S.; Cavazza, A.; Comin, C.E. Adenocarcinoma classification: patterns and prognosis. Pathologica. 2018, 110, 5–11. [Google Scholar] [PubMed]
- Yoshino, I.; Nakanishi, R.; Kodate, M.; Osaki, T.; Hanagiri, T.; Takenoyama, M.; Yamashita, T.; Imoto, H.; Taga, S.; Yasumoto, K. Pleural retraction and intra-tumoral air-bronchogram as prognostic factors for stage I pulmonary adenocarcinoma following complete resection. Int Surg. 2000, 85, 105–112. [Google Scholar] [PubMed]
- Wu, G.; Woodruff, H.C.; Shen, J.; Refaee, T.; Sanduleanu, S.; Ibrahim, A.; Leijenaar, R.T.H.; Wang, R.; Xiong, J.; Bian, J.; et al. Diagnosis of Invasive Lung Adenocarcinoma Based on Chest CT Radiomic Features of Part-Solid Pulmonary Nodules: A Multicenter Study. Radiology. 2020, 297, 451–458. [Google Scholar] [CrossRef]
- Pascoe, H.M.; Knipe, H.C.; Pascoe, D.; Heinze, S.B. The many faces of lung adenocarcinoma: A pictorial essay. J Med Imaging Radiat Oncol. 2018, 62, 654–661. [Google Scholar] [CrossRef] [PubMed]
- Wang, T.; Yang, Y.; Liu, X.; Deng, J.; Wu, J.; Hou, L.; Wu, C.; She, Y.; Sun, X.; Xie, D.; et al. Primary Invasive Mucinous Adenocarcinoma of the Lung: Prognostic Value of CT Imaging Features Combined with Clinical Factors. Korean J Radiol. 2021, 22, 652–662. [Google Scholar] [CrossRef]
- Kuriyama, K.; Yanagawa, M. CT Diagnosis of Lung Adenocarcinoma: Radiologic-Pathologic Correlation and Growth Rate. Radiology. 2020, 297, 199–200. [Google Scholar] [CrossRef] [PubMed]
- Shao, X.; Niu, R.; Jiang, Z.; Shao, X.; Wang, Y. Role of PET/CT in Management of Early Lung Adenocarcinoma. AJR Am J Roentgenol. 2020, 214, 437–445. [Google Scholar] [CrossRef] [PubMed]
- Sun, X.Y.; Chen, T.X.; Chang, C.; Teng, H.H.; Xie, C.; Ruan, M.M.; Lei, B.; Liu, L.; Wang, L.H.; Yang, Y.H.; et al. SUVmax of 18FDG PET/CT Predicts Histological Grade of Lung Adenocarcinoma. Acad Radiol. 2021, 28, 49–57. [Google Scholar] [CrossRef] [PubMed]
- Mogavero, A.; Bironzo, P.; Righi, L.; Merlini, A.; Benso, F.; Novello, S.; Passiglia, F. Deciphering Lung Adenocarcinoma Heterogeneity: An Overview of Pathological and Clinical Features of Rare Subtypes. Life 2023, 13, 1291. [Google Scholar] [CrossRef]
- Damirov, F.; Stoleriu, M.G.; Manapov, F.; Büsing, K.; Michels, J.D.; Preissler, G.; Hatz, R.A.; Hohenberger, P.; Roessner, E.D. Histology of the Primary Tumor Correlates with False Positivity of Integrated 18F-FDG-PET/CT Lymph Node Staging in Resectable Lung Cancer Patients. Diagnostics 2023, 13, 1893. [Google Scholar] [CrossRef]
- Lee, W.Y.; Chen, P.H.; Chen, K.C.; Hsu, H.H.; Chen, J.S. Computed Tomography-Guided Localization and Extended Segmentectomy for Non-Small Cell Lung Cancer. Diagnostics 2022, 12, 2043. [Google Scholar] [CrossRef]
- Divisi, D.; Rinaldi, M.; Necozione, S.; Curcio, C.; Rea, F.; Zaraca, F.; De Vico, A.; Zaccagna, G.; Di Leonardo, G.; Crisci, R.; et al. Is It Possible to Establish a Reliable Correlation between Maximum Standardized Uptake Value of 18-Fluorine Fluorodeoxyglucose Positron Emission Tomography/Computed Tomography and Histological Types of Non-Small Cell Lung Cancer? Analysis of the Italian VATS Group Database. Diagnostics 2021, 11, 1901. [Google Scholar]
- Nakada, T.; Takahashi, Y.; Sakakura, N.; Iwata, H.; Ohtsuka, T.; Kuroda, H. Prognostic Radiological Tools for Clinical Stage IA Pure Solid Lung Cancer. Curr. Oncol. 2021, 28, 3846–3856. [Google Scholar] [CrossRef]
- Kudura, K.; Ritz, N.; Kutzker, T.; Hoffmann, M.H.K.; Templeton, A.J.; Foerster, R.; Kreissl, M.C.; Antwi, K. Predictive Value of Baseline FDG-PET/CT for the Durable Response to Immune Checkpoint Inhibition in NSCLC Patients Using the Morphological and Metabolic Features of Primary Tumors. Cancers 2022, 14, 6095. [Google Scholar] [CrossRef] [PubMed]
- Carter, B.W.; Halpenny, D.F.; Ginsberg, M.S.; Papadimitrakopoulou, V.A.; de Groot, P.M. Immunotherapy in Non-Small Cell Lung Cancer Treatment: Current Status and the Role of Imaging. J Thorac Imaging. 2017, 32, 300–312. [Google Scholar] [CrossRef] [PubMed]
- Gao, J.; Shi, Y.; Niu, R.; Shao, X.; Shao, X. Association Analysis of Maximum Standardized Uptake Values Based on 18F-FDG PET/CT and EGFR Mutation Status in Lung Adenocarcinoma. J. Pers. Med. 2023, 13, 396. [Google Scholar] [CrossRef]
- Cha, H.K.; Lim, J.H.; Ryu, W.K.; Kim, L.; Ryu, J.-S. Solitary Uncommon Metastasis in Non-Small Cell Lung Cancer. Reports 2023, 6, 8. [Google Scholar] [CrossRef]
- Dunn, B.; Pierobon, M.; Wei, Q. Automated Classification of Lung Cancer Subtypes Using Deep Learning and CT-Scan Based Radiomic Analysis. Bioengineering 2023, 10, 690. [Google Scholar] [CrossRef] [PubMed]
- Monaco, L.; De Bernardi, E.; Bono, F.; Cortinovis, D.; Crivellaro, C.; Elisei, F.; L’Imperio, V.; Landoni, C.; Mathoux, G.; Musarra, M.; et al. The “digital biopsy” in non-small cell lung cancer (NSCLC): A pilot study to predict the PD-L1 status from radiomicsfeatures of [18F]FDG PET/CT. Eur. J. Nucl. Med. Mol. Imaging 2022, 49, 3401–3411. [Google Scholar] [CrossRef]
- Zhu, K.; Su, D.; Wang, J.; Cheng, Z.; Chin, Y.; Chen, L.; Chan, C.; Zhang, R.; Gao, T.; Ben, X.; Jing, C. Predictive value of baseline metabolic tumor volume for non-small-cell lung cancer patients treated with immune checkpoint inhibitors: A meta-analysis. Front Oncol. 2022, 12, 951557. [Google Scholar] [CrossRef]
- Hutchinson, B.D.; Shroff, G.S.; Truong, M.T.; Ko, JP. Spectrum of Lung Adenocarcinoma. Semin Ultrasound CT MR. 2019, 40, 255–264. [Google Scholar] [CrossRef]
- Succony, L.; Rassl, D.M.; Barker, A.P.; McCaughan, F.M.; Rintoul, R.C. Adenocarcinoma spectrum lesions of the lung: Detection, pathology and treatment strategies. Cancer Treat Rev. 2021, 99, 102237. [Google Scholar] [CrossRef] [PubMed]
- Nam, J.G.; Park, S.; Park, C.M.; Jeon, Y.K.; Chung, D.H.; Goo, J.M.; Kim, Y.T.; Kim, H. Histopathologic Basis for a Chest CT Deep Learning Survival Prediction Model in Patients with Lung Adenocarcinoma. Radiology. 2022, 305, 441–451. [Google Scholar] [CrossRef] [PubMed]
Figure 1.
Lepidic type of adenocarcinoma (a), with invasion of vein (b).
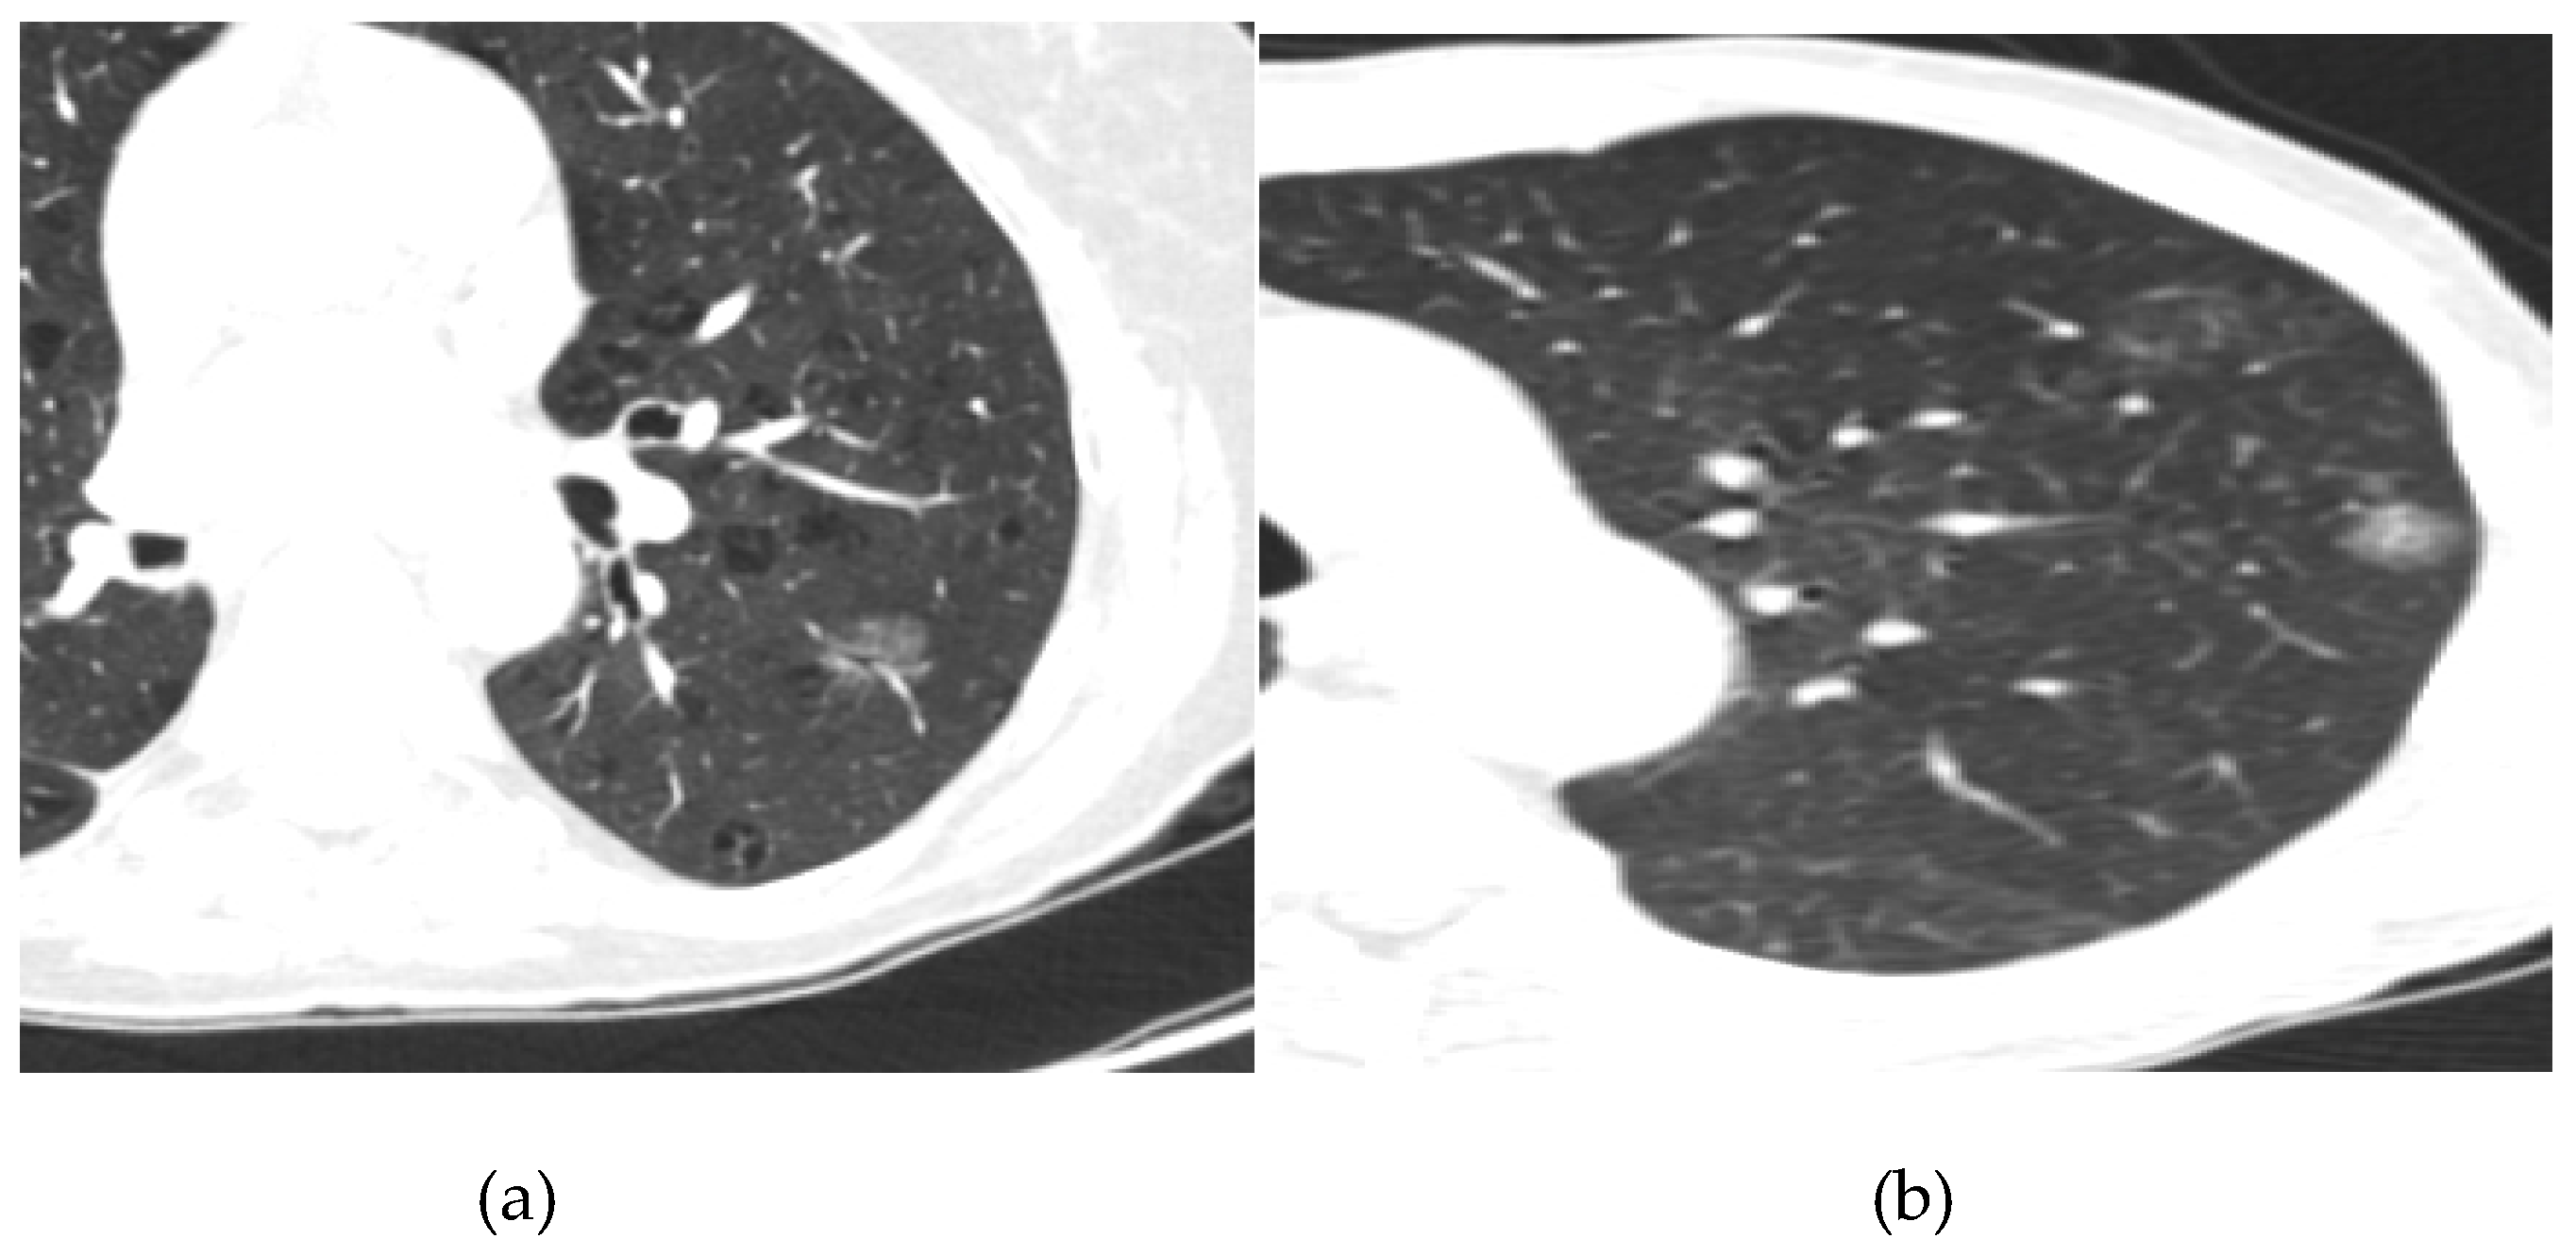
Figure 2.
Semisolid lung tumor with groundglass ans solid component.
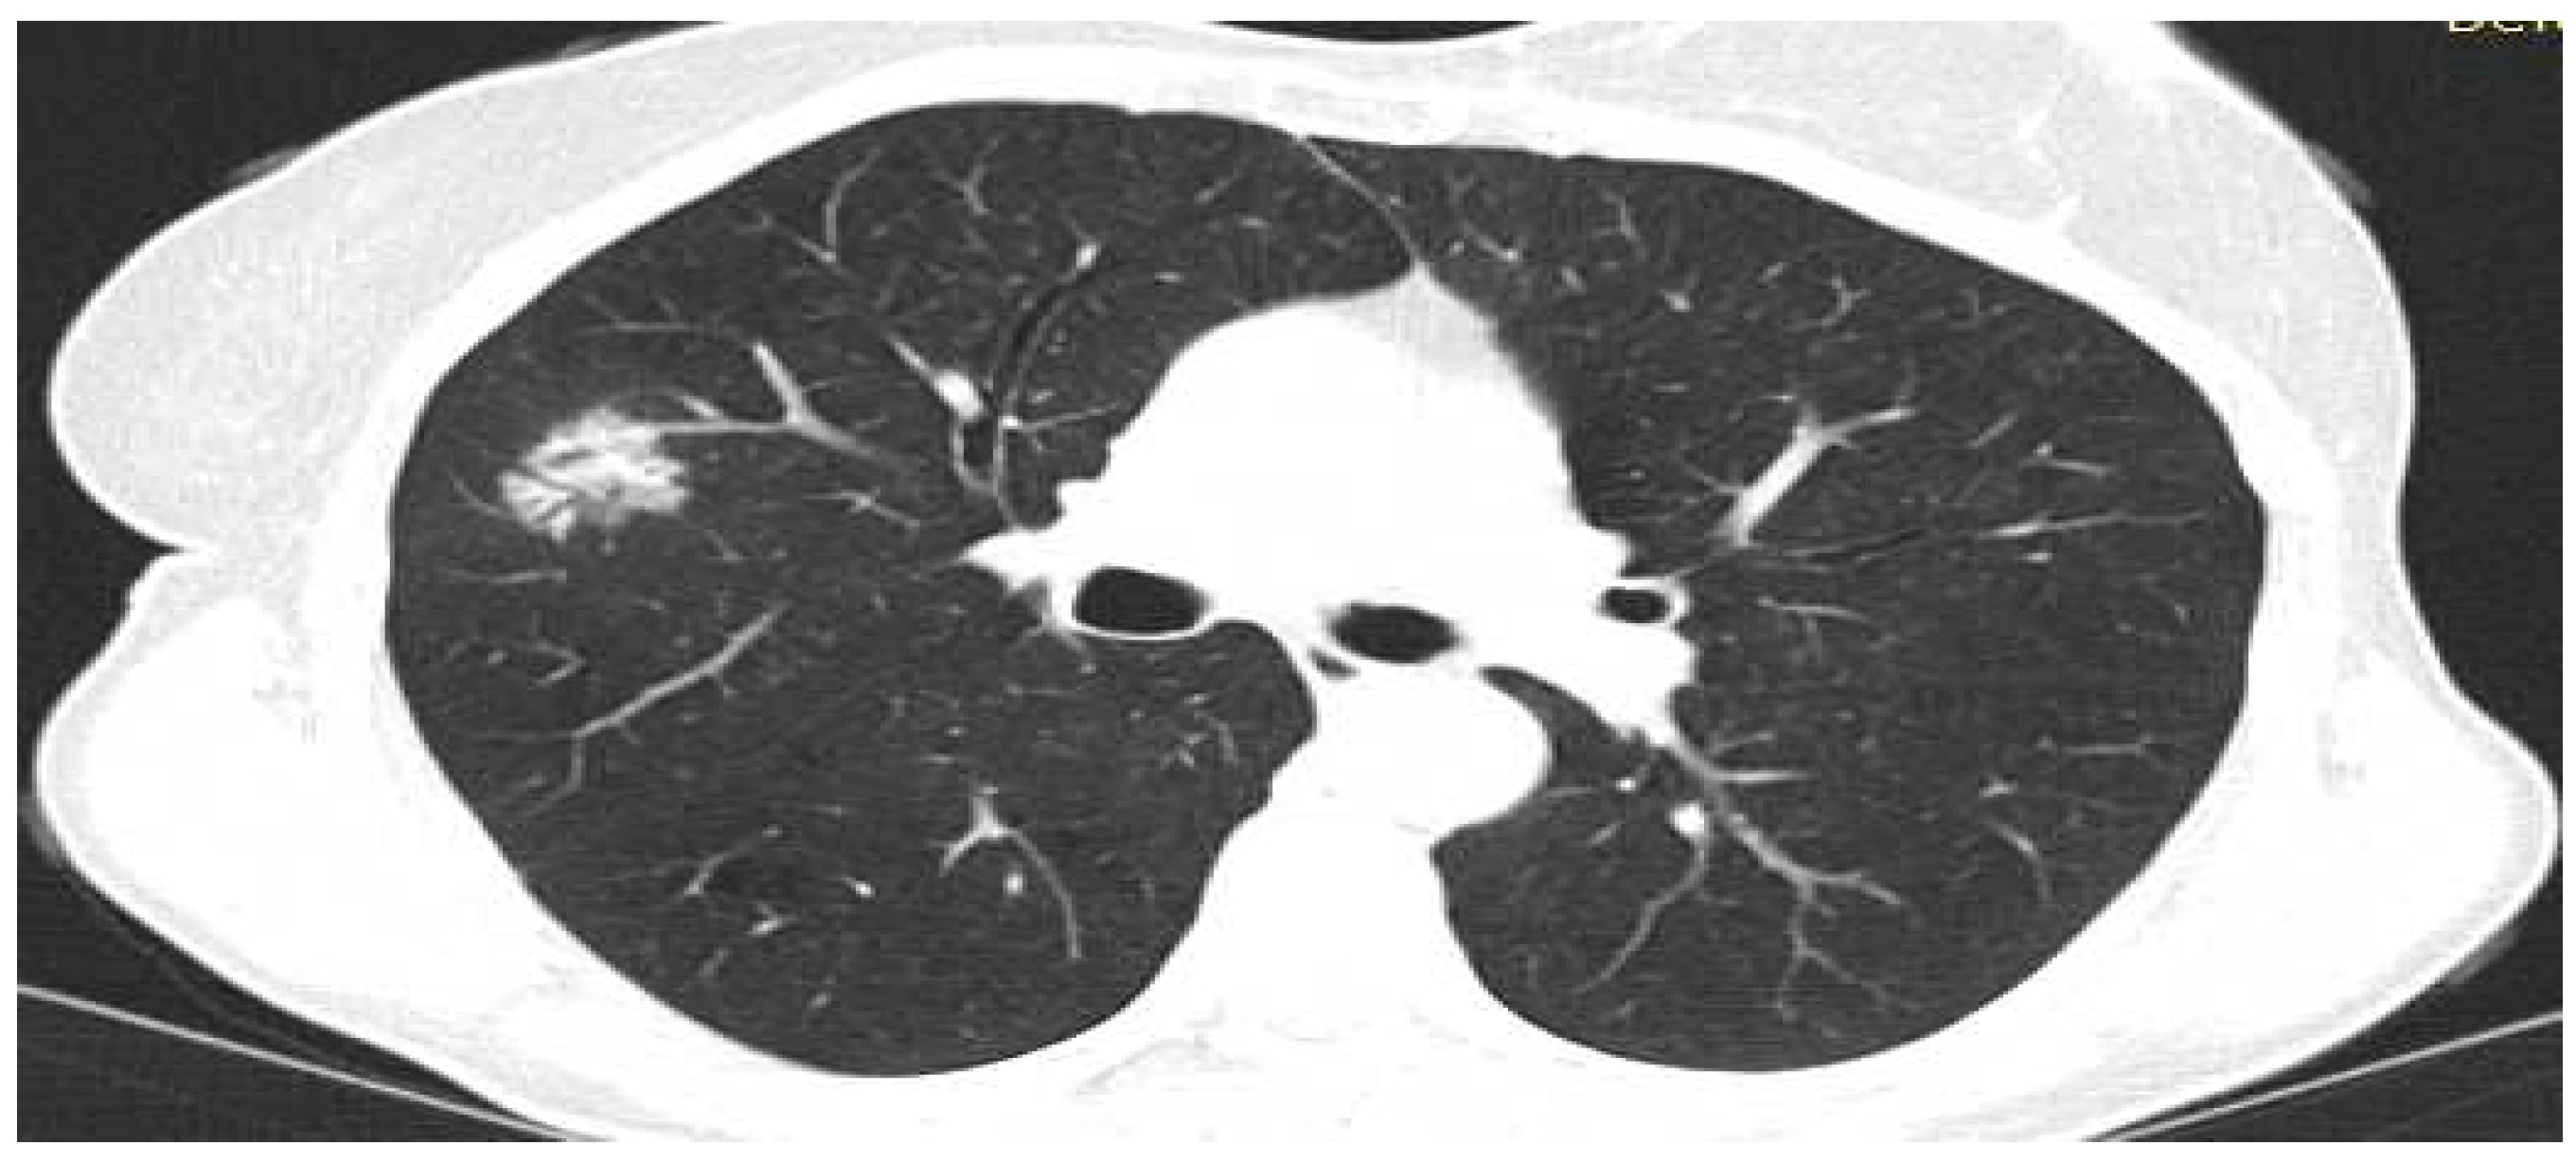
Figure 3.
Solid lung tumor with spiculations adherenting pleura.
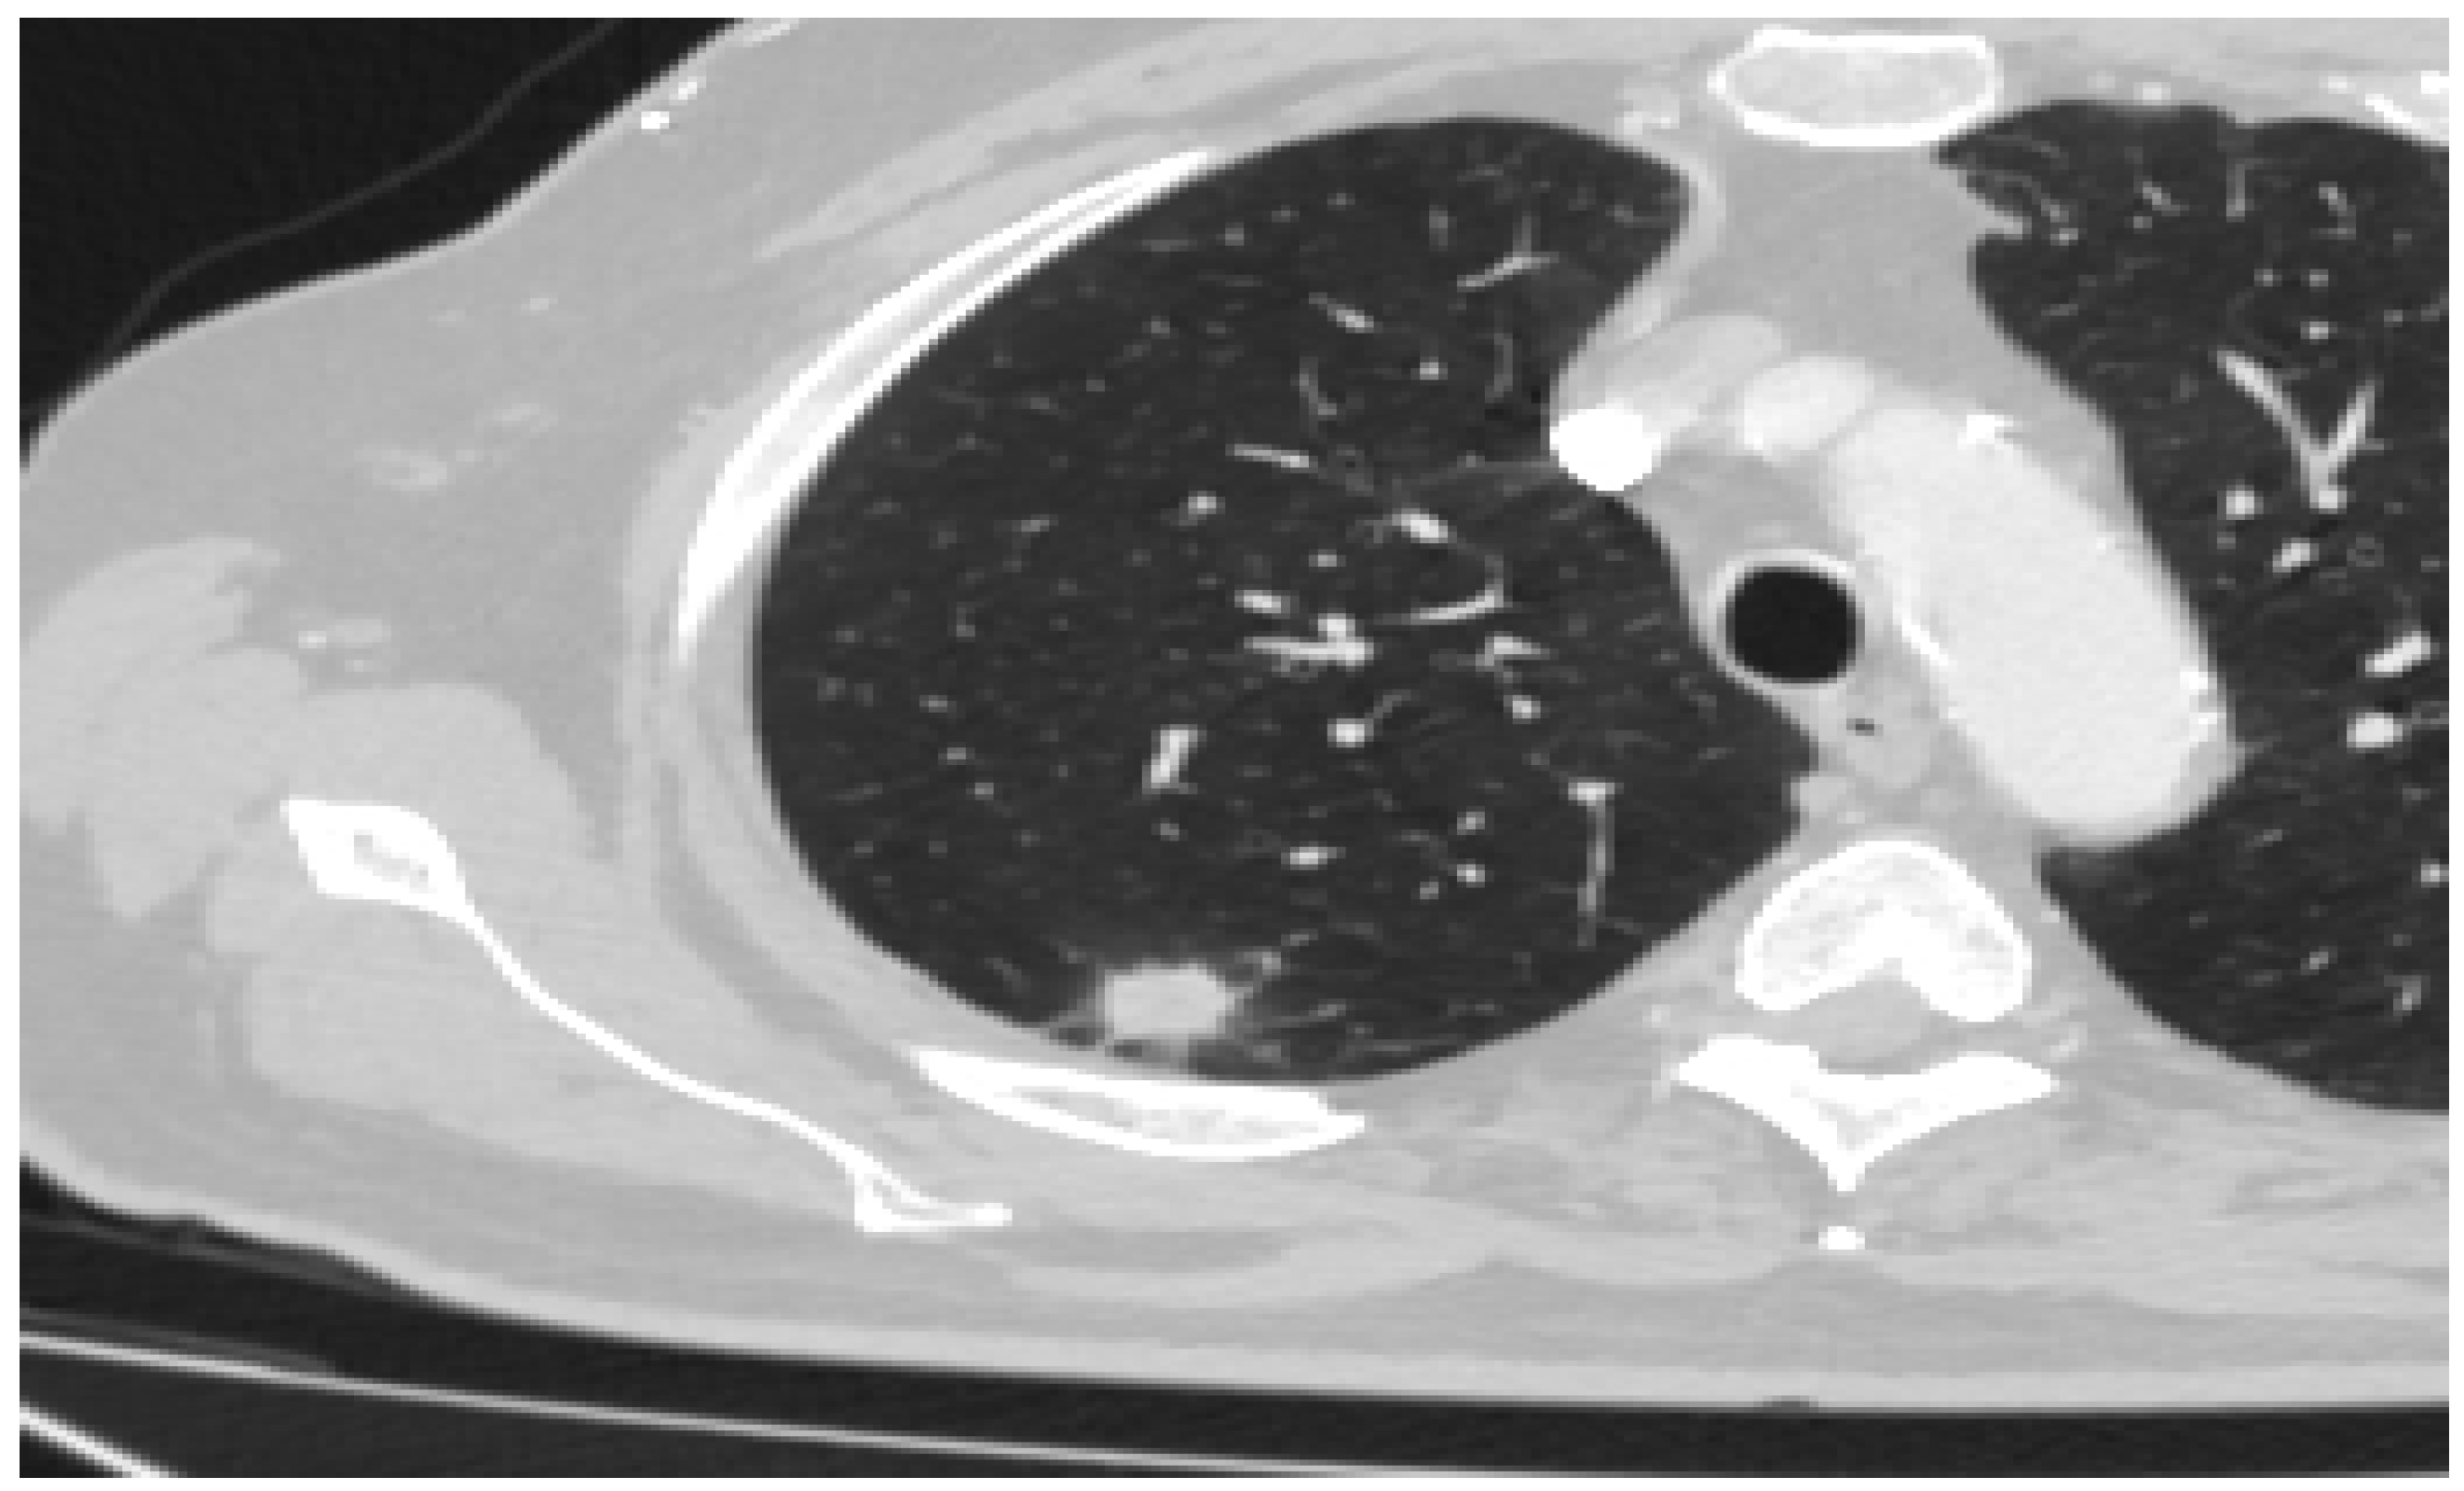
Figure 4.
Solid lung tumor with contralateral mediastinal lymphadenopathy.
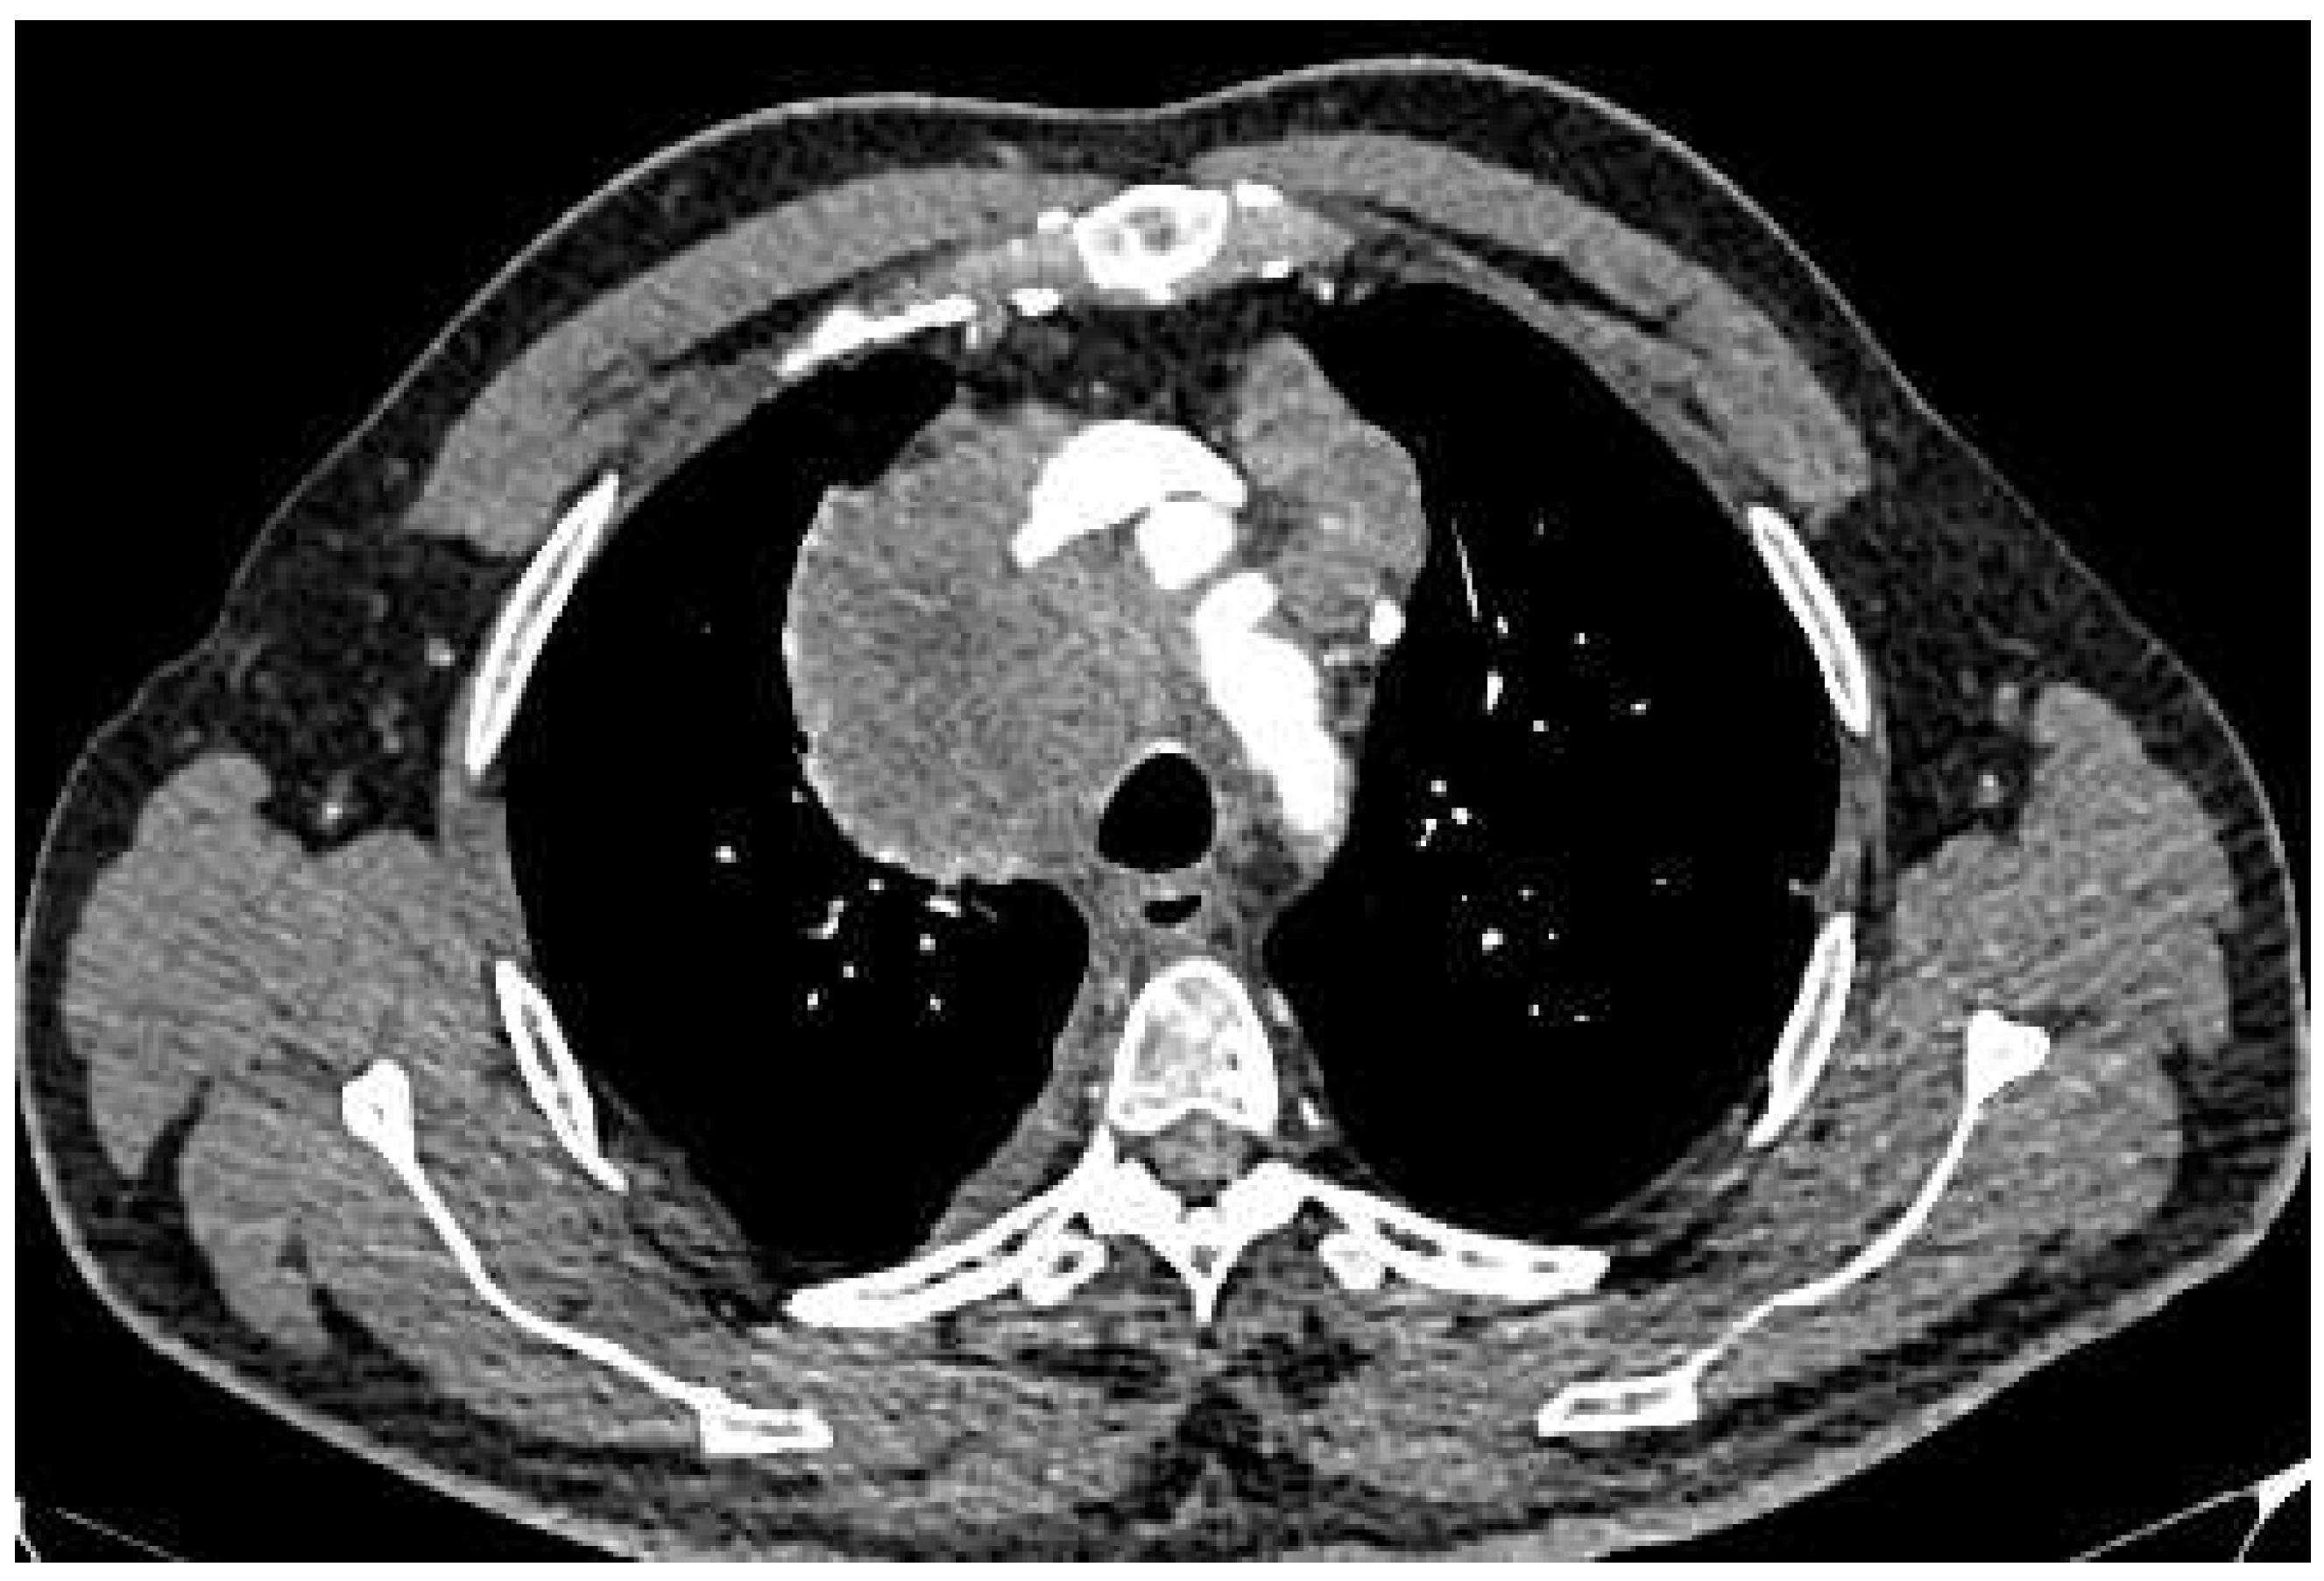
Figure 5.
Lobulated lung tumor with contralateral lung metastasis.
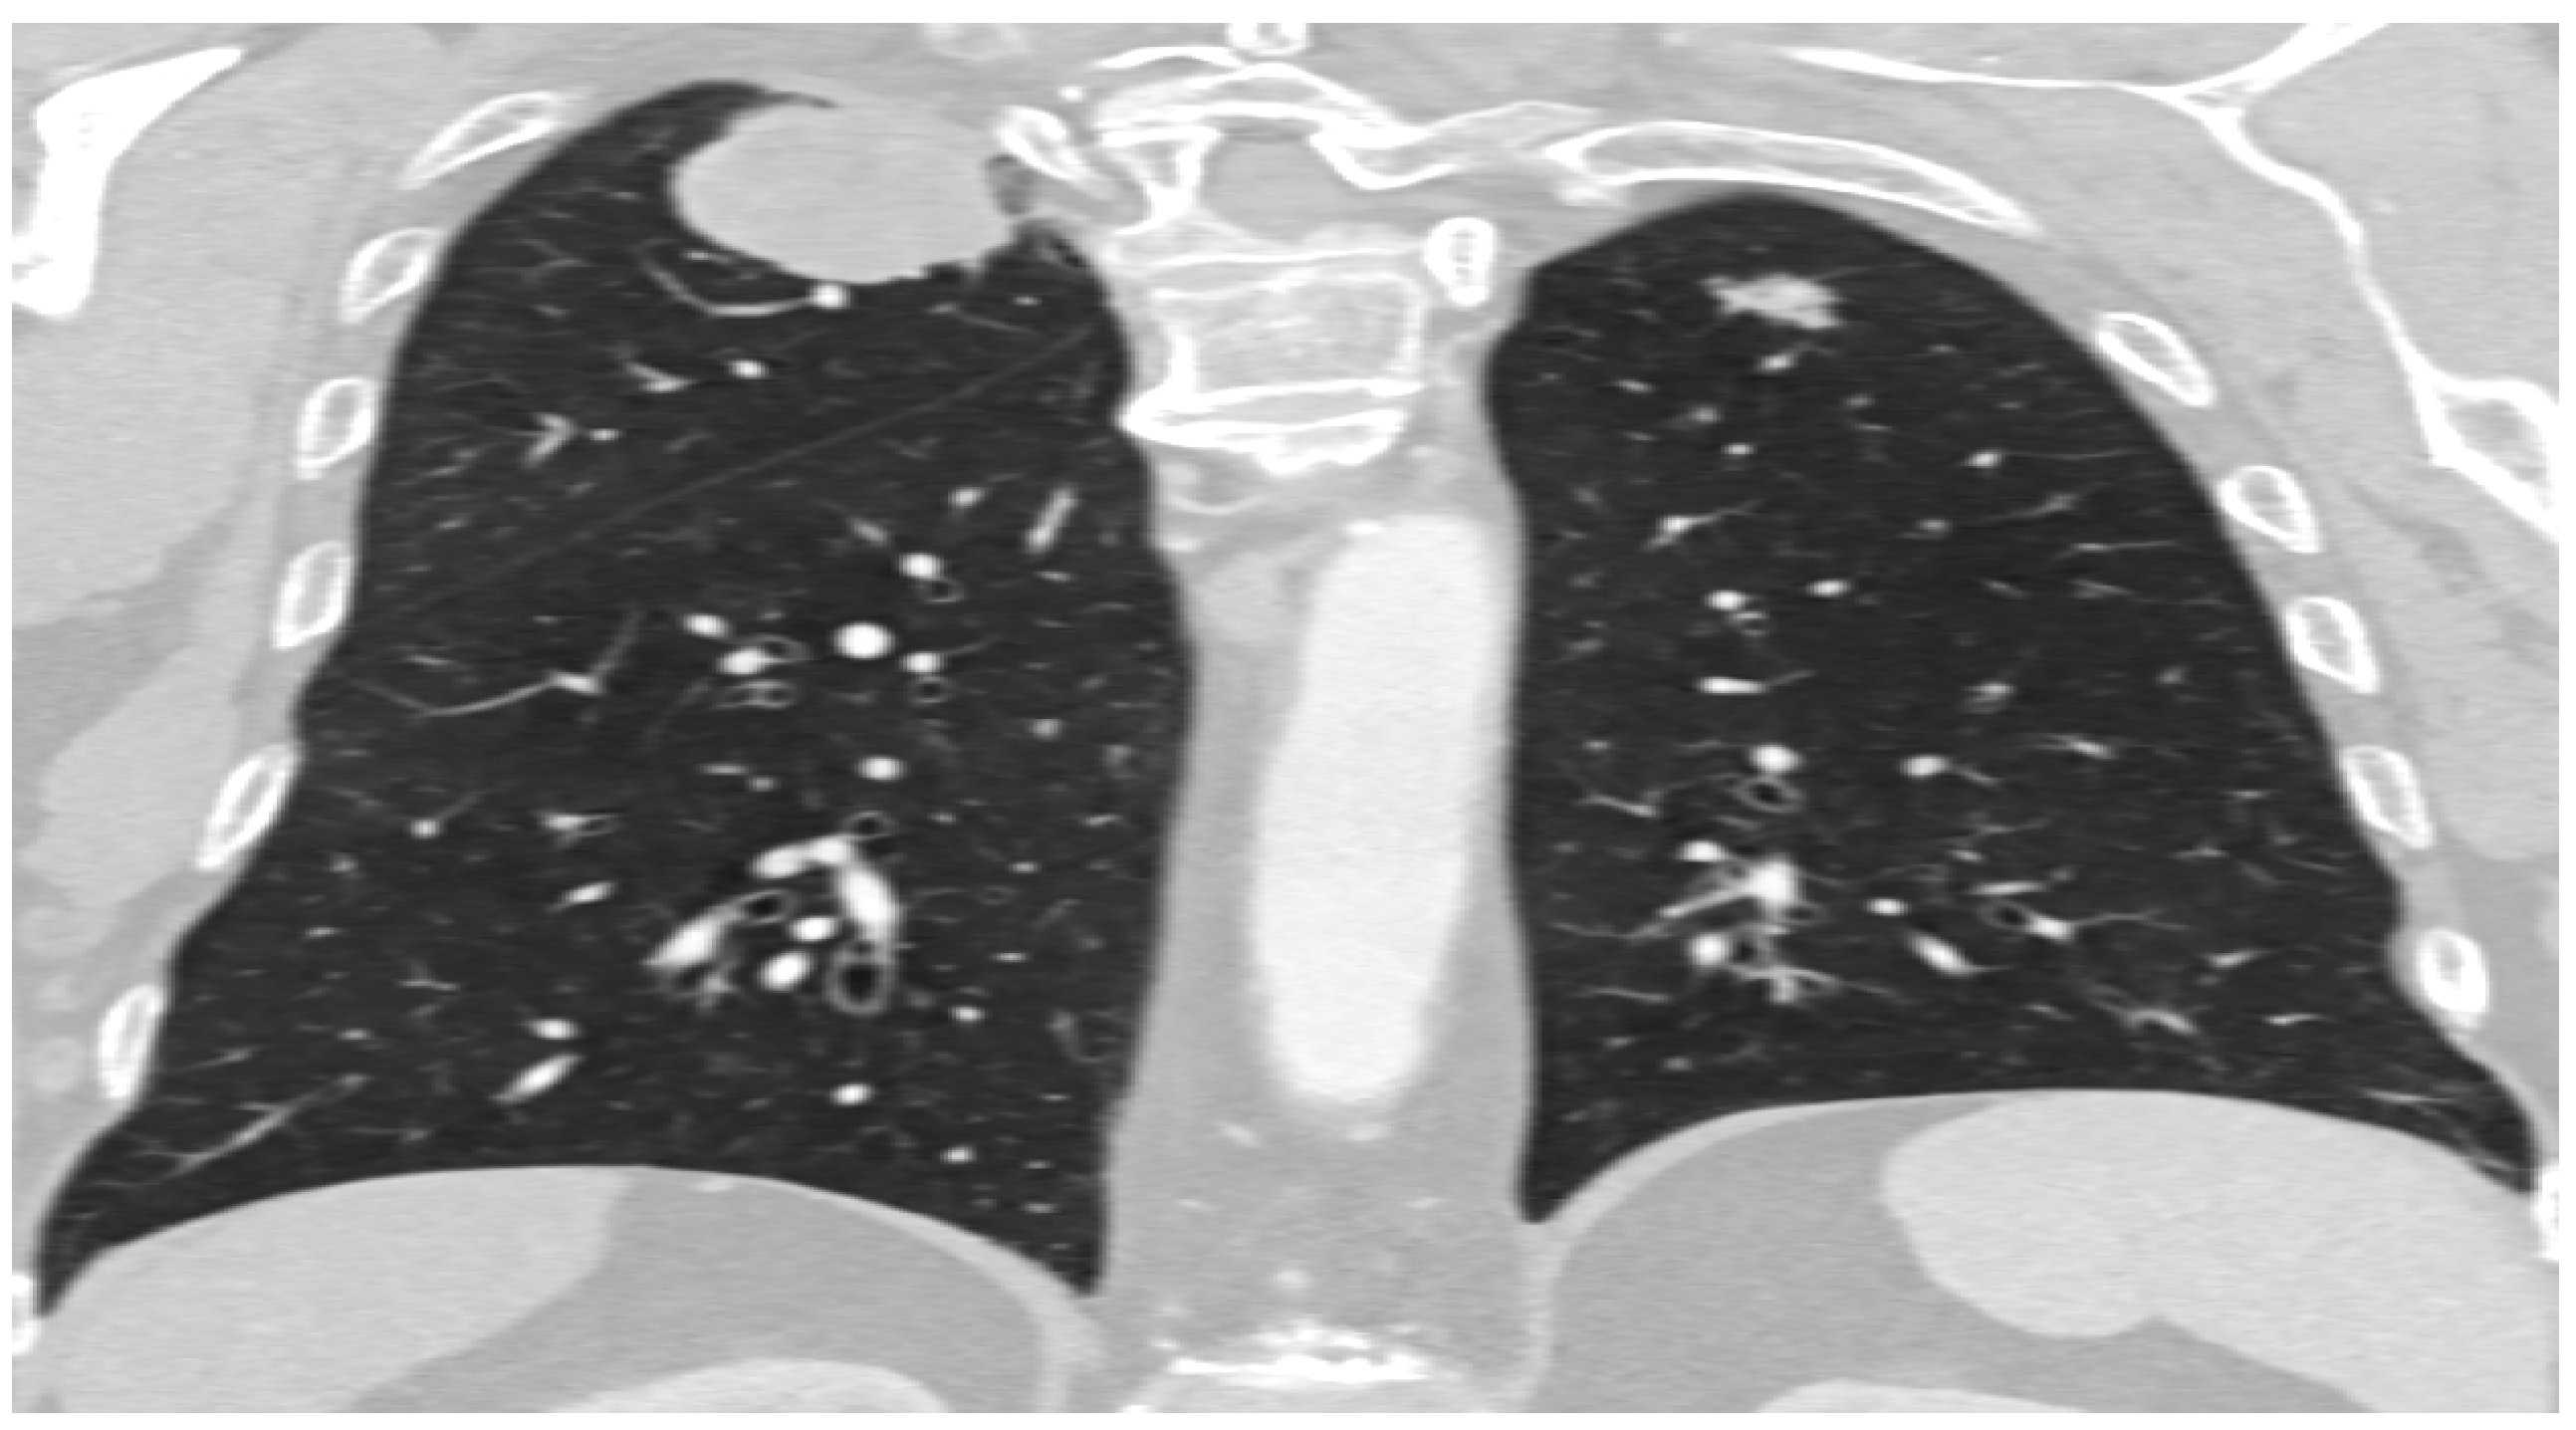

Table 1.
Characteristics of primary lung adenocarcinoma by subtype in relation to gender, age and smoking status.
Table 1.
Characteristics of primary lung adenocarcinoma by subtype in relation to gender, age and smoking status.
| Acinar | Papillary | Lepidic | Solid | AIS-MIA | Overall p value | Comparison group* | Mean difference | 95%CI** | Post-hoc p value¥ | |
| n=32 | n=28 | n=19 | n=13 | n=10 | ||||||
| Age, mean ± SD | 62.8±7.0 | 62.7±7.0 | 61.8±7.4 | 63.7±7.2 | 61.0±5.6 | 0.893 | ||||
| Gender, n (%) | ||||||||||
| Male | 21 (65.6) | 14 (50.0) | 4 (21.1) | 9 (69.2) | 5 (50.0) | 0.024 | Acinar vs. Lepidic | na | na | 0.003 |
| Female | 11 (34.4) | 14 (50.0) | 15 (78.9) | 4 (30.8) | 5 (50.0) | |||||
| Smoking status, n (%) | 0.052 | |||||||||
| Non-smoker | 10 (31.3) | 16 (57.1) | 5 (26.3) | 7 (53.8) | 1 (10.0) | |||||
| Former smoker | 8 (25.0) | 2 (7.1) | 2 (10.5) | 1 (7.7) | 1 (10.0) | |||||
| Current smoker | 14 (43.8) | 10 (35.7) | 12 (63.2) | 5 (38.5) | 8 (80.0) |
*Only comparisons significant at p<0.005 level are presented. **bootstrapped at 1000 iterations. ¥Bonferroni correction was applied for multiple comparisons (0.05/10 comparisons=0.005). Na, not applicable; ns, not significant. Interpretation: overall p value indicates whether there is an overall significant difference between these 5 categories. For those comparisons that are significant in the overall comparison (bold, p <0.05), a post-hoc analysis was performed to see exactly where the difference lies. Since there are a lot of comparisons because there are 5 categories to compare, only left are those that are significant (p <0.005 and not <0.05 due to multiple comparisons).
Table 2.
Characteristics of primary lung adenocarcinoma by subtype in relation to tumor size, component and edges.
Table 2.
Characteristics of primary lung adenocarcinoma by subtype in relation to tumor size, component and edges.
| Acinar | Papillary | Lepidic | Solid | AIS-MIA | Overall p value | Comparison group* | Mean difference | 95%CI** | Post-hoc p value¥ | |
| n=32 | n=28 | n=19 | n=13 | n=10 | ||||||
| Tumor size, mean ± SD | 37.2±7.6 | 41.8±8.6 | 38.2±6.0 | 47.7±12.6 | 24.9±3.7 | <0.001 | Acinar vs. Solid | -10.44 | -18.77 to -3.14 | 0.002 |
| Acinar vs. AIS-MIA | 12.35 | 8.88 to 16.14 | 0.001 | |||||||
| Papillary vs. AIS-MIA | 16.89 | 12.92 to 20.76 | <0.001 | |||||||
| Lepidic vs. AIS-MIA | 13.26 | 9.79 to 16.74 | 0.001 | |||||||
| Solid vs. AIS-MIA | 22.79 | 15.68 to 30.54 | 0.001 | |||||||
| Component, n (%) | ||||||||||
| Solid | 32 (100) | 28 (100) | 19 (100) | 13 (100) | 9 (90.0) | 0.054 | ns | |||
| Necrosis | 3 (9.4) | 9 (32.1) | 5 (26.3) | 4 (30.8) | 0 (0.0) | 0.074 | ns | |||
| Ground glass | 3 (9.4) | 0 (0.0) | 1 (5.3) | 1 (7.7) | 3 (30.0) | 0.051 | ns | |||
| Edges n (%) | ||||||||||
| Round | 19 (59.4) | 14 (50.0) | 14 (73.7) | 7 (53.8) | 5 (50.0) | 0.244 | ns | |||
| Lobular | 4 (12.5) | 4 (14.3) | 2 (10.5) | 5 (38.5) | 3 (30.0) | |||||
| Spiculated | 9 (28.1) | 10 (35.7) | 3 (15.8) | 1 (7.7) | 2 (20.0) |
*Only comparisons significant at p<0.005 level are presented. **bootstrapped at 1000 iterations. ¥Bonferroni correction was applied for multiple comparisons (0.05/10 comparisons=0.005). Na, not applicable; ns, not significant Interpretation: overall p value indicates whether there is an overall significant difference between these 5 categories. For those comparisons that are significant in the overall comparison (bold, p <0.05), a post-hoc analysis was performed to see exactly where the difference lies. Since there are a lot of comparisons because there are 5 categories to compare, only left are those that are significant (p <0.005 and not <0.05 due to multiple comparisons).
Table 3.
Characteristics of primary lung adenocarcinoma according to subtypes in relation to involvement of surrounding structures, involvement of lymph nodes.
Table 3.
Characteristics of primary lung adenocarcinoma according to subtypes in relation to involvement of surrounding structures, involvement of lymph nodes.
| Acinar | Papillary | Lepidic | Solid | AIS-MIA | Overall p value | Comparison group* | Mean difference | 95%CI** | Post-hoc p value¥ | |
| n=32 | n=28 | n=19 | n=13 | n=10 | ||||||
| Pleural involvement, n (%) | 11 (34.4) | 15 (53.6) | 5 (26.3) | 8 (61.5) | 2 (20.0) | 0.084 | ns | |||
| Bronchial cut-off, n (%) | 12 (37.5) | 13 (46.4) | 10 (52.6) | 9 (69.2) | 5 (50.0) | 0.41 | ns | |||
| Vascular invasion, n (%) | 11 (34.4) | 16 (57.1) | 9 (47.4) | 6 (46.2) | 3 (30.0) | 0.397 | ns | |||
| No lymph node involvment | 9 (28.1) | 4 (14.3) | 9 (47.7) | 2 (15.4) | 7 (70.0) | 0.049 | ns | |||
| Ipsilateral lymph node involvment | 18 (56.3) | 18 (64.3) | 8 (42.1) | 9 (69.2) | 3 (30.3) | |||||
| Contralateral lymph node involvment | 5 (15.6) | 6 (21.4) | 2 (10.5) | 2 (15.4) | 0 (0.0) |
*Only comparisons significant at p<0.005 level are presented. **bootstrapped at 1000 iterations. ¥Bonferroni correction was applied for multiple comparisons (0.05/10 comparisons=0.005). Na, not applicable; ns, not significant Interpretation: overall p value indicates whether there is an overall significant difference between these 5 categories. For those comparisons that are significant in the overall comparison (bold, p <0.05), a post-hoc analysis was performed to see exactly where the difference lies. Since there are a lot of comparisons because there are 5 categories to compare, only left are those that are significant (p <0.005 and not <0.05 due to multiple comparisons).
Table 4.
Characteristics of primary lung adenocarcinoma according to subtypes in relation to presence of metastases and PET findings.
Table 4.
Characteristics of primary lung adenocarcinoma according to subtypes in relation to presence of metastases and PET findings.
| Acinar | Papillary | Lepidic | Solid | AIS-MIA | Overall p value | Comparison group* | Mean difference | 95%CI** | Post-hoc p value¥ | |
| n=32 | n=28 | n=19 | n=13 | n=10 | ||||||
| Metastases present, n (%) | 3 (9.4%) | 7 (25.0%) | 0 (0.0%) | 8 (61.5%) | 0 (0.0%) | <0.001 | Acinar vs. solid | na | na | 0.001 |
| Lepidic vs. solid | na | na | <0.001 | |||||||
| Solid vs. AIS-MIA | na | na | 0.003 | |||||||
| SUVmax, mean ± SD | 4.9±1.1 | 5.3±1.3 | 5.1±0.7 | 6.3±0.8 | 3.3±0.8 | <0.001 | Acinar vs. solid | -1.35 | -1.89 to -0.76 | 0.001 |
| Acinar vs. AIS-MIA | 1.65 | 1.00 to 2.28 | <0.001 | |||||||
| Papillary vs. AIS-MIA | 2.01 | 1.35 to 2.72 | <0.001 | |||||||
| Lepidic vs. AIS-MIA | 1.83 | 1.23 to 2.38 | <0.001 | |||||||
| Solid vs. AIS-MIA | -3 | 2.32 vs. 3.59 | <0.001 |
*Only comparisons significant at p<0.005 level are presented. **bootstrapped at 1000 iterations. ¥Bonferroni correction was applied for multiple comparisons (0.05/10 comparisons=0.005). Na, not applicable; ns, not significant Interpretation: overall p value indicates whether there is an overall significant difference between these 5 categories. For those comparisons that are significant in the overall comparison (bold, p <0.05), a post-hoc analysis was performed to see exactly where the difference lies. Since there are a lot of comparisons because there are 5 categories to compare, only left are those that are significant (p <0.005 and not <0.05 due to multiple comparisons).
Table 5.
Odds ratios with bootstrapped 95%CI of the adjusted* relationship of cancer characteristics with type of cancer.
Table 5.
Odds ratios with bootstrapped 95%CI of the adjusted* relationship of cancer characteristics with type of cancer.
| Acinar | Papillary | Lepidic | Solid | AIS-MIA | |
| n=32 | n=28 | n=19 | n=13 | n=10 | |
| Characteristic | OR (95%CI) | OR (95%CI) | OR (95%CI) | OR (95%CI) | OR (95%CI) |
| Tumor size | 0.97 (0.92-1.02) | 1.04 (1.00-1.09) | 1.00 (0.95-1.05) | 1.11 (1.04-1.18) | 0.65 (0.51-0.83) |
| Solid component | na | na | na | na | na |
| Necrosis | 0.27 (0.07-1.03) | 2.57 (0.90-7.37) | 1.69 (0.46-6.17) | 1.80 (0.47-6.96) | na |
| Ground glass | 1.25 (0.27-5.89) | na | 0.69 (0.07-6.59) | 1.00 (0.11-9.38) | 7.19 (1.35-38.34) |
| Round edges | 1.0 [Reference] | 1.0 [Reference] | 1.0 [Reference] | 1.0 [Reference] | 1.0 [Reference] |
| Lobular edges | 0.62 (0.18-2.22) | 9.91 (0.25-3.22) | 0.32 (0.06-1.67) | 3.17 (0.83-12.19) | 2.28 (0.48-10.81) |
| Spiculated edges | 1.16 (0.42-3.16) | 2.16 (0.79-5.89) | 0.43 (0.11-1.74) | 0.28 (0.03-2.42) | 1.00 (0.18-5.62) |
| Pleural involvement | 0.62 (0.25-1.53) | 2.18 (0.89-5.34) | 0.52 (1.16-1.66) | 2.48 (0.73-8.43) | 0.35 (0.70-1.77) |
| Bronchial cut-off | 0.60 (0.25-1.48) | 0.87 (0.35-2.16) | 0.90 (0.31-2.62) | 3.53 (0.93-13.36) | 1.17 (0.30-4.56) |
| Vascular invasion | 0.55 (2.23-1.33) | 2.06 (0.85-4.99) | 1.17 (0.41-3.34) | 1.11 (0.34-3.60) | 0.52 (0.13-2.17) |
| No lymph node involvement | 1.0 [Reference] | 1.0 [Reference] | 1.0 [Reference] | 1.0 [Reference] | 1.0 [Reference] |
| Ipsilateral lymph node involvement | 1.08 (0.40-2.90) | 3.26 (0.98-10.80) | 0.43 (1.14-1.34) | 2.54 (0.50-12.98) | 0.20 (0.05-0.85) |
| Contralateral lymph node involvement | 1.32 (0.34-5.16) | 4.49 (1.02-19.73) | 0.30 (0.05-1.74) | 2.34 (0.29-19.04) | na |
| Metastases present | 0.34 (0.09-1.33) | 1.93 (0.65-5.72) | na | 14.09 (3.51-56.41) | na |
| SUVmax | 0.86 (0.59-1.23) | 1.21 (0.86-1.73) | 1.04 (0.69-1.57) | 2.64 (1.48-4.69) | 0.07 (0.02-0.29) |
*Adjusted for age, sex, and smoking status. Bolded values are significant. Na, not applicable. Interpretation: If the OR is less than 1, it means that the characteristic is less present in that cancer than in others, if the OR is greater than 1, it means that this characteristic is more present in that tumor than in the others. If 95% of the CI does not contain 1, it means that the difference is statistically significant (bold in each case).
Disclaimer/Publisher’s Note: The statements, opinions and data contained in all publications are solely those of the individual author(s) and contributor(s) and not of MDPI and/or the editor(s). MDPI and/or the editor(s) disclaim responsibility for any injury to people or property resulting from any ideas, methods, instructions or products referred to in the content. |
© 2023 by the authors. Licensee MDPI, Basel, Switzerland. This article is an open access article distributed under the terms and conditions of the Creative Commons Attribution (CC BY) license (https://creativecommons.org/licenses/by/4.0/).
Copyright: This open access article is published under a Creative Commons CC BY 4.0 license, which permit the free download, distribution, and reuse, provided that the author and preprint are cited in any reuse.


