
Submitted:
17 July 2023
Posted:
18 July 2023
You are already at the latest version
Abstract
Pancreas transplantation is a high-risk operation that requires significant skill and expertise from the surgeons and the postoperative care team. Prior to candidate qualification, all contraindications to this procedure must be excluded. The use of screening tools and nutritional assessment aims to emphasize the importance of accurately diagnosing nutritional status in order to implement early nutritional interventions and reduce complications associated with malnutrition. This plays a crucial role in improving postoperative outcomes for patients undergoing pancreas and/or kidney transplantation.
Objective: The aim of this study was to analyze the parameters of nutritional status in patients eligible for kidney transplantation and kidney with pancreas transplantation.
Methods: The study analyzed the database of hospitalized patients in our Center from 2020 to 2023 to identify preoperative parameters of nutritional status in patients eligible for kidney transplantation (Ktx) and kidney with pancreas transplantation (SPKTx).
Participants: A total of 59 patients participated in the study, who were candidates for kidney transplantation (23, including 11 females and 12 males) or kidney with pancreas transplantation (36, including 24 females and 12 males).
Parameters examined included: Onoder's Prognostic Nutritional Index (PNIO), Nutrition Risk Index (NRI), ideal body weight (IBW) calculated using the Lorenz formula, and the neutrophil-to-lymphocyte ratio (NLR). All patients admitted to the clinic underwent the NRS-2002 clinical assessment scale for nutritional status.
Results: Upon analyzing the obtained results, it was found that BMI was not a good differentiating parameter for the studied groups. The PNIO index also insufficiently differentiated the studied groups, and similarly, the NRI index was a weak differentiating parameter. The NRS-2002 index and albumin level were the best indicators of differences between the groups. In the group of transplantation candidates, several parameters indicated that patients in the Ktx group (kidney transplantation candidates) had better nutritional status than SPKtx candidates (kidney with pancreas transplantation candidates), despite the former group being older patients.
Conclusion: It seems that more effort should be made to start a proper nutrition plan for SPKTx (and especially peritoneal dialysis) patients. Regular assessment of nutrition status should be performed. SPKtx patients in the perioperative period should receive parenteral nutrition and, as soon as their general condition allows it, enteral nutrition, taking into account the caloric and protein needs
Keywords:
nutrition
; kidney
; pancreas
; transplantation
; renal replacement therapy
; hemodialysis
; peritoneal dialysis
1. Introduction:
Pancreas transplantation is a high-risk procedure that requires significant skill and level of expertise from the surgeon and the postoperative care team. The procedure is associated with high patient morbidity, often leading to complications and prolonged hospitalisation. The median length of stay after pancreas transplantation varies across centers but typically ranges from 8 to 27 days [1,2]. Some studies have reported a postoperative complication rate close to 40% and a reoperation rate exceeding 30% [3,4]. The patients themselves are at high risk, as almost all have type 1 diabetes, with many of them also having concomitant cardiovascular disease or stage 5 kidney disease, some od them receiving renal replacement therapy. Studies have shown that the presence of diabetes and concurrent kidney disease are independent risk factors for predicting poor postoperative outcomes [5,6,7].
The concept of implementing an Enhanced Recovery After Surgery (ERAS) program [8] began in 2000 as a series of protocols aimed at improving perioperative care for surgical patients. The goal was to increase patient satisfaction while reducing postoperative complications and shortening hospitalisation. Despite the wide application of these protocols in many surgical fields, they have not yet been widely adopted in pancreas transplantation, which is a high-risk operation with a frequently prolonged postoperative stay and a high rate of complications [9,10].
In this study, we analyzed the database of hospitalized patients in our center from 2020 to 2023 (COVID era) to identify preoperative parameters of nutritional status in patients eligible for kidney transplantation, pancreas transplantation, and kidney with pancreas transplantation. The use of screening tools and nutritional assessment aims to emphasize the importance of accurately diagnosing nutritional status in order to implement early nutritional interventions and reduce complications associated with malnutrition. This is crucial in improving postoperative outcomes for patients after pancreas and/or kidney transplantation.
This is the first such analysis conducted in Poland, in one of the two pancreas transplantation centers in our country.
Objective: The aim of this study was to analyze the parameters of nutritional status in patients eligible for kidney transplantation and kidney with pancreas transplantation.
2. Materials and Methods
The study obtained approval from the Ethics and Supervision Committee for Research on Humans and Animals at the National Medical Institute of the Ministry of Interior Affairs and Administration in Warsaw, with the reference number 08/2021. The observational study was conducted at the Department of Gastrointestinal Surgery and Transplantology of the National Medical Institute of the Ministry of Interior Affairs and Administration in Warsaw.
2.1. Study Design and Population:
A total of 59 patients participated in the study, who were candidates for kidney transplantation (23, including 11 females and 12 males) or kidney with pancreas transplantation (36, including 24 females and 12 males). All data were collected retrospectively from patients admitted to the Department of Gastrointestinal Surgery and Transplantology at PIM MSWiA in Warsaw between August 2021 and January 2023. The study population consisted of 35 females and 24 males, with a mean age of 44.77 ± 10.32 years overall, 43.47 ± 10.24 years for females, and 46.2 ± 10.89 years for males (Table 1A).
The inclusion criteria :
Candidates for kidney with pancreas transplantation: Indication was end-stage renal failure in a patient with type 1 diabetes, with an estimated glomerular filtration rate (eGFR) <15-20 ml/min (MDRD).
Candidates for kidney transplantation: Indication was end-stage renal failure of any cause, with an estimated glomerular filtration rate (eGFR) <15-20 ml/min.
Both groups included individuals on hemodialysis (n=34), peritoneal dialysis (n=12), and those in the pre-dialysis period (preemptive, n=13).
The profile of transplant candidates is presented in Table 1a and 1b. The patients were divided into two groups: the first group consisted of a smaller number of patients eligible for kidney transplantation (n=23), and the second group consisted of patients eligible for kidney with pancreas transplantation (n=36). The exclusion criteria included patients eligible for pancreas transplantation alone due to their low number during the specified period (n=5) and patients who declined participation in the study. The characteristics of both transplant candidates are presented in Table 1B.
2.2. Data Collection
All patients had blood samples collected from the antecubital vein in a fasting state for basic laboratory tests in an accredited hospital laboratory. The following data were collected:
Demographic parameters, including age, gender, anthropometric measurements (body weight and height), and calculation of their BMI.
Cause of end-stage renal failure and type of renal replacement therapy.
Vital signs, including heart rate (HR), systolic blood pressure (SBP), diastolic blood pressure (DBP), and mean arterial pressure (MAP).
Within 24 hours of admission, laboratory measurements were taken, including white blood cell count (WBC), neutrophil count, lymphocyte count, platelet count, red blood cells (RBC), hematocrit (HCT), hemoglobin (HGB), mean corpuscular volume (MCV), albumin (ALB), glucose (GLU), creatinine (CREA), estimated glomerular filtration rate (eGFR) using the MDRD equation, urea, total cholesterol (CHOL), HDL cholesterol, calculated LDL-C, triglycerides (TG), sodium, potassium, total calcium, phosphorus, serum albumin, serum protein, thyrotropin (TSH), parathyroid hormone (PTH), and HbA1c%.
2.3. Nutritional status indicators
The following nutritional status indicators were used:
2.3.1. Prognostic Nutritional Index Onoder's (PNIO)
PNIO = 10 x [albumin level (g/dL)] + 0.005 x total lymphocyte count (mm3). The cutoff value dividing PNIO into high and low is 45 (PNIO high > 45, PNIO low < 45) [11].
2.3.2. Nutrition Risk Index (NRI)
NRI = [1.489 x serum albumin level (g/L)] + [41.7 x (current weight/normal weight of the patient)]. NRI results: > 100 - no signs of malnutrition; 97.5 - 100 - mild malnutrition; 83.5-97.4 - moderate malnutrition; < 83.5 - severe malnutrition. The ideal body weight of the patient (IBW) was calculated using the Lorenz formula:
For women: IBW = H - 100 - (H - 150)/2,
For men: IBW = H - 100 - (H - 150)/4 [12].
2.3.3. Nutritional Risk Screening 2002 (NRS-2002)
This clinical scale assesses nutritional status and disease severity (degree of requirements) on a scale of 0-3 for each component. If the age of the patient being assessed exceeds 70 years, an additional 1 point should be added to the final score. In terms of interpreting the results obtained from the NRS 2002 assessment, the following determinants are distinguished: <3 points - consider conservative management, repeat the assessment in 7 days; ≥3 - nutritional treatment is recommended [13].
2.3.4. Neutrophil-to-lymphocyte ratio (NLR)
NLR is defined as the ratio of the absolute neutrophil count to the absolute lymphocyte count. The normal value remains undetermined. It is considered an indirect marker of subclinical inflammation, and a higher value indicates a worse prognosis [14].
2.4. Statistical Analysis
The statistical analysis was conducted using R 4.30 software (Open Source). To assess the distributions of variables, Shapiro-Wilk tests were utilized. Most of the data represented continuous variables with a normal distribution, therefore they were expressed as mean ± standard deviation. Results were considered statistically significant for p < 0.05. Subsequently, biochemical and anthropometric parameters underwent correlation matrix analysis. Significant associations with nutritional status indicators were presented in graphs.
3.1. Comparison of kidney and pancreas/kidney transplant candidates
In the group of kidney and pancreas transplant candidates (36 individuals), diabetic nephropathy accounted for 100% of cases of end-stage renal failure. Among the 36 individuals, 19 (52.8%) were undergoing hemodialysis, 8 (22.2%) were receiving peritoneal dialysis, and 9 (25%) were in the pre-dialysis period (preemptive).
In the group of kidney transplant candidates (23 individuals), the causes of end-stage renal failure varied. Five out of 23 patients had biopsy-confirmed focal segmental glomerulosclerosis (21.7%), 1 had type 1 diabetes (4.3%), 2 had autosomal dominant polycystic kidney disease (8.7%), 3 had secondary glomerulonephritis (13%), 3 had hypertensive nephropathy (13%), 3 had an unknown cause (13%), 4 had IgA nephropathy (17.4%), 1 had Alport syndrome (4.3%), and 1 had primary glomerulonephritis without biopsy (4.3%).
The examined groups did not differ significantly in terms of body weight, height, or BMI. However, they differed in terms of gender, with a predominance of women in the SPKtx group, where there were twice as many women as men (Table 1B). The Ktx group had an equal distribution of gender. The groups also differed in terms of the type of renal replacement therapy, as the Ktx group had a higher proportion of patients undergoing hemodialysis (18 individuals, 78.3%), 3 (13%) receiving peritoneal dialysis, and 2 (8.7%) in the pre-dialysis period. In contrast, the SPKTx group had 19 (52.8%) patients undergoing hemodialysis, proportionally more individuals receiving peritoneal dialysis (n=8, 22.2%), and as many as 9 (25%) in the pre-dialysis period.

Table 1B.
Characteristics of transplant candidates (Ktx and SPKtx).
| Parameters | Ktx n=23 | SPKtx n= 36 | p-value |
|---|---|---|---|
| Age [years] | 50.70 ±10.96 | 41.03 ±8.61 | 0.0004 |
| Body weight [kg] | 70.9 ± 13.3 | 67.6 ± 16.4 | 0.4179 |
| Height [m] | 1.70 ±0.10 | 1.66 ± 0.08 | 0.1957 |
| BMI [kg/m2] | 24.4 ± 3.0 | 24.1 ± 4.1 | 0.7614 |
| Gender F/M | 11/12 | 24/12 | - |
Ktx kidney and SPKtx pancreas/kidney transplant mean ±SD, statistical significance at p<0.05.
Figure 1.
Graphical presentation of age difference between study groups (p<0.01).
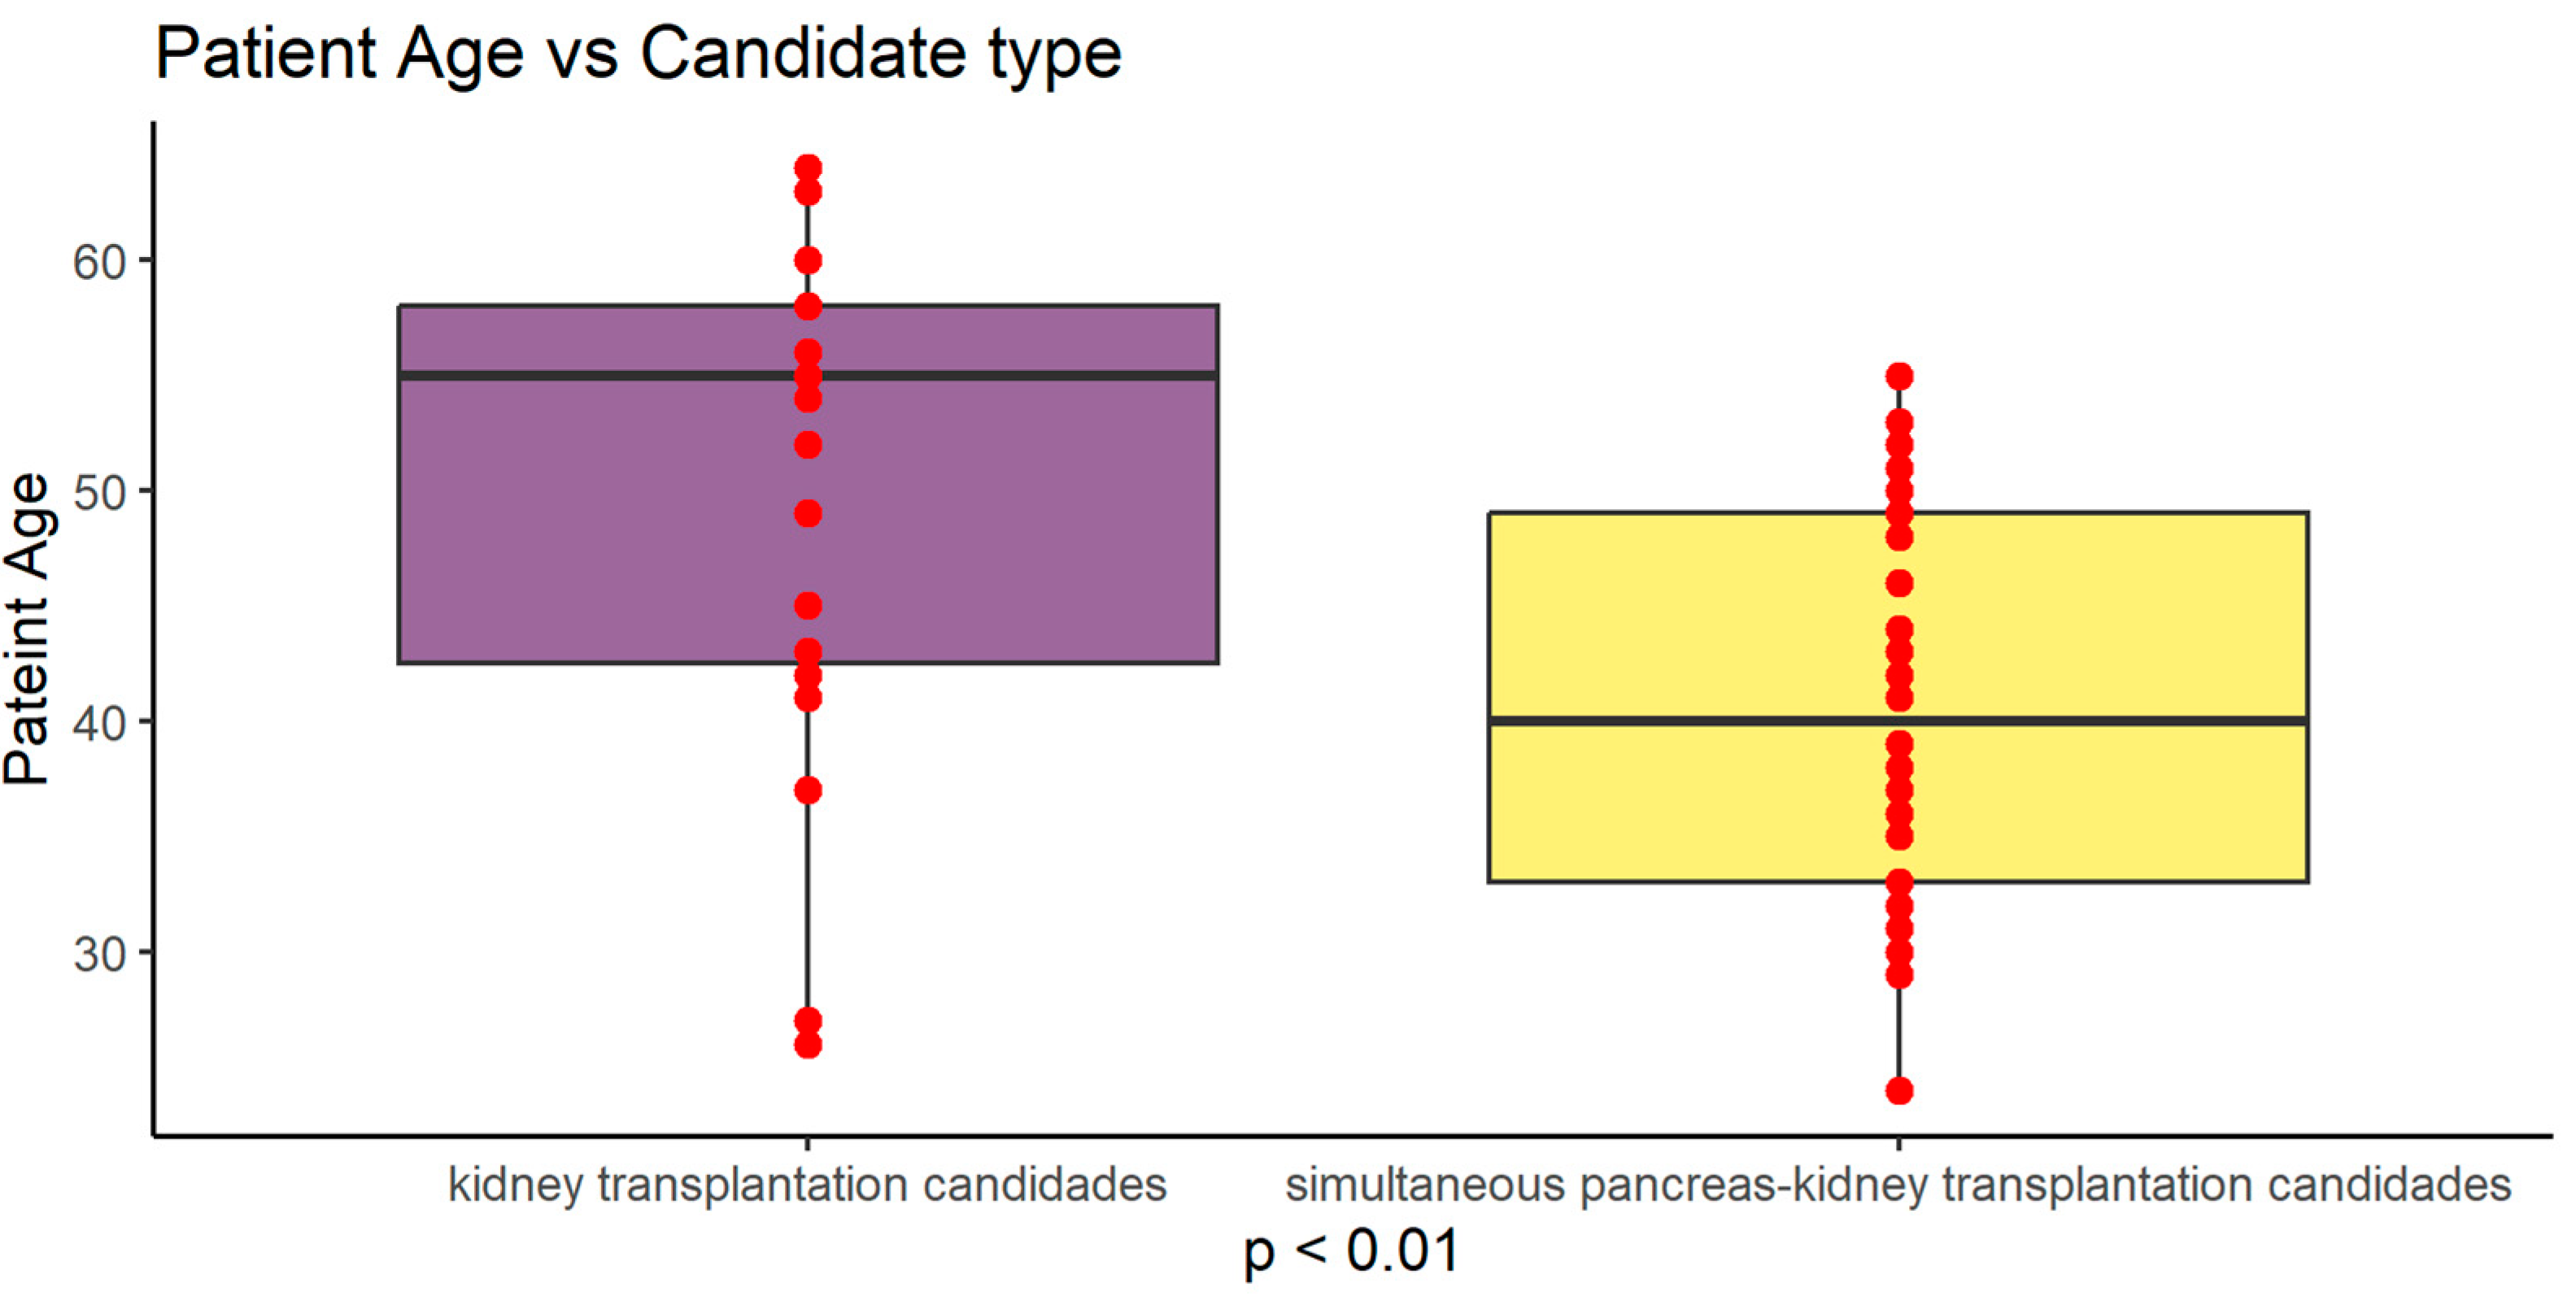
Table 2.
Biochemical parameter characteristics of transplant candidates taking into account groups. Mean ± SD is presented.
Table 2.
Biochemical parameter characteristics of transplant candidates taking into account groups. Mean ± SD is presented.
| Parameters (units) | KTx (n=23) | SPKTx (n=36) | p-value |
|---|---|---|---|
| WBC (10^6/ul) | 8.380 ± 3.088 | 7.550 ± 2.448 | 0.2602 |
| LY (10^6/ul) | 1.113 ± 0.668 | 1.591 ± 0.820 | 0.0236 |
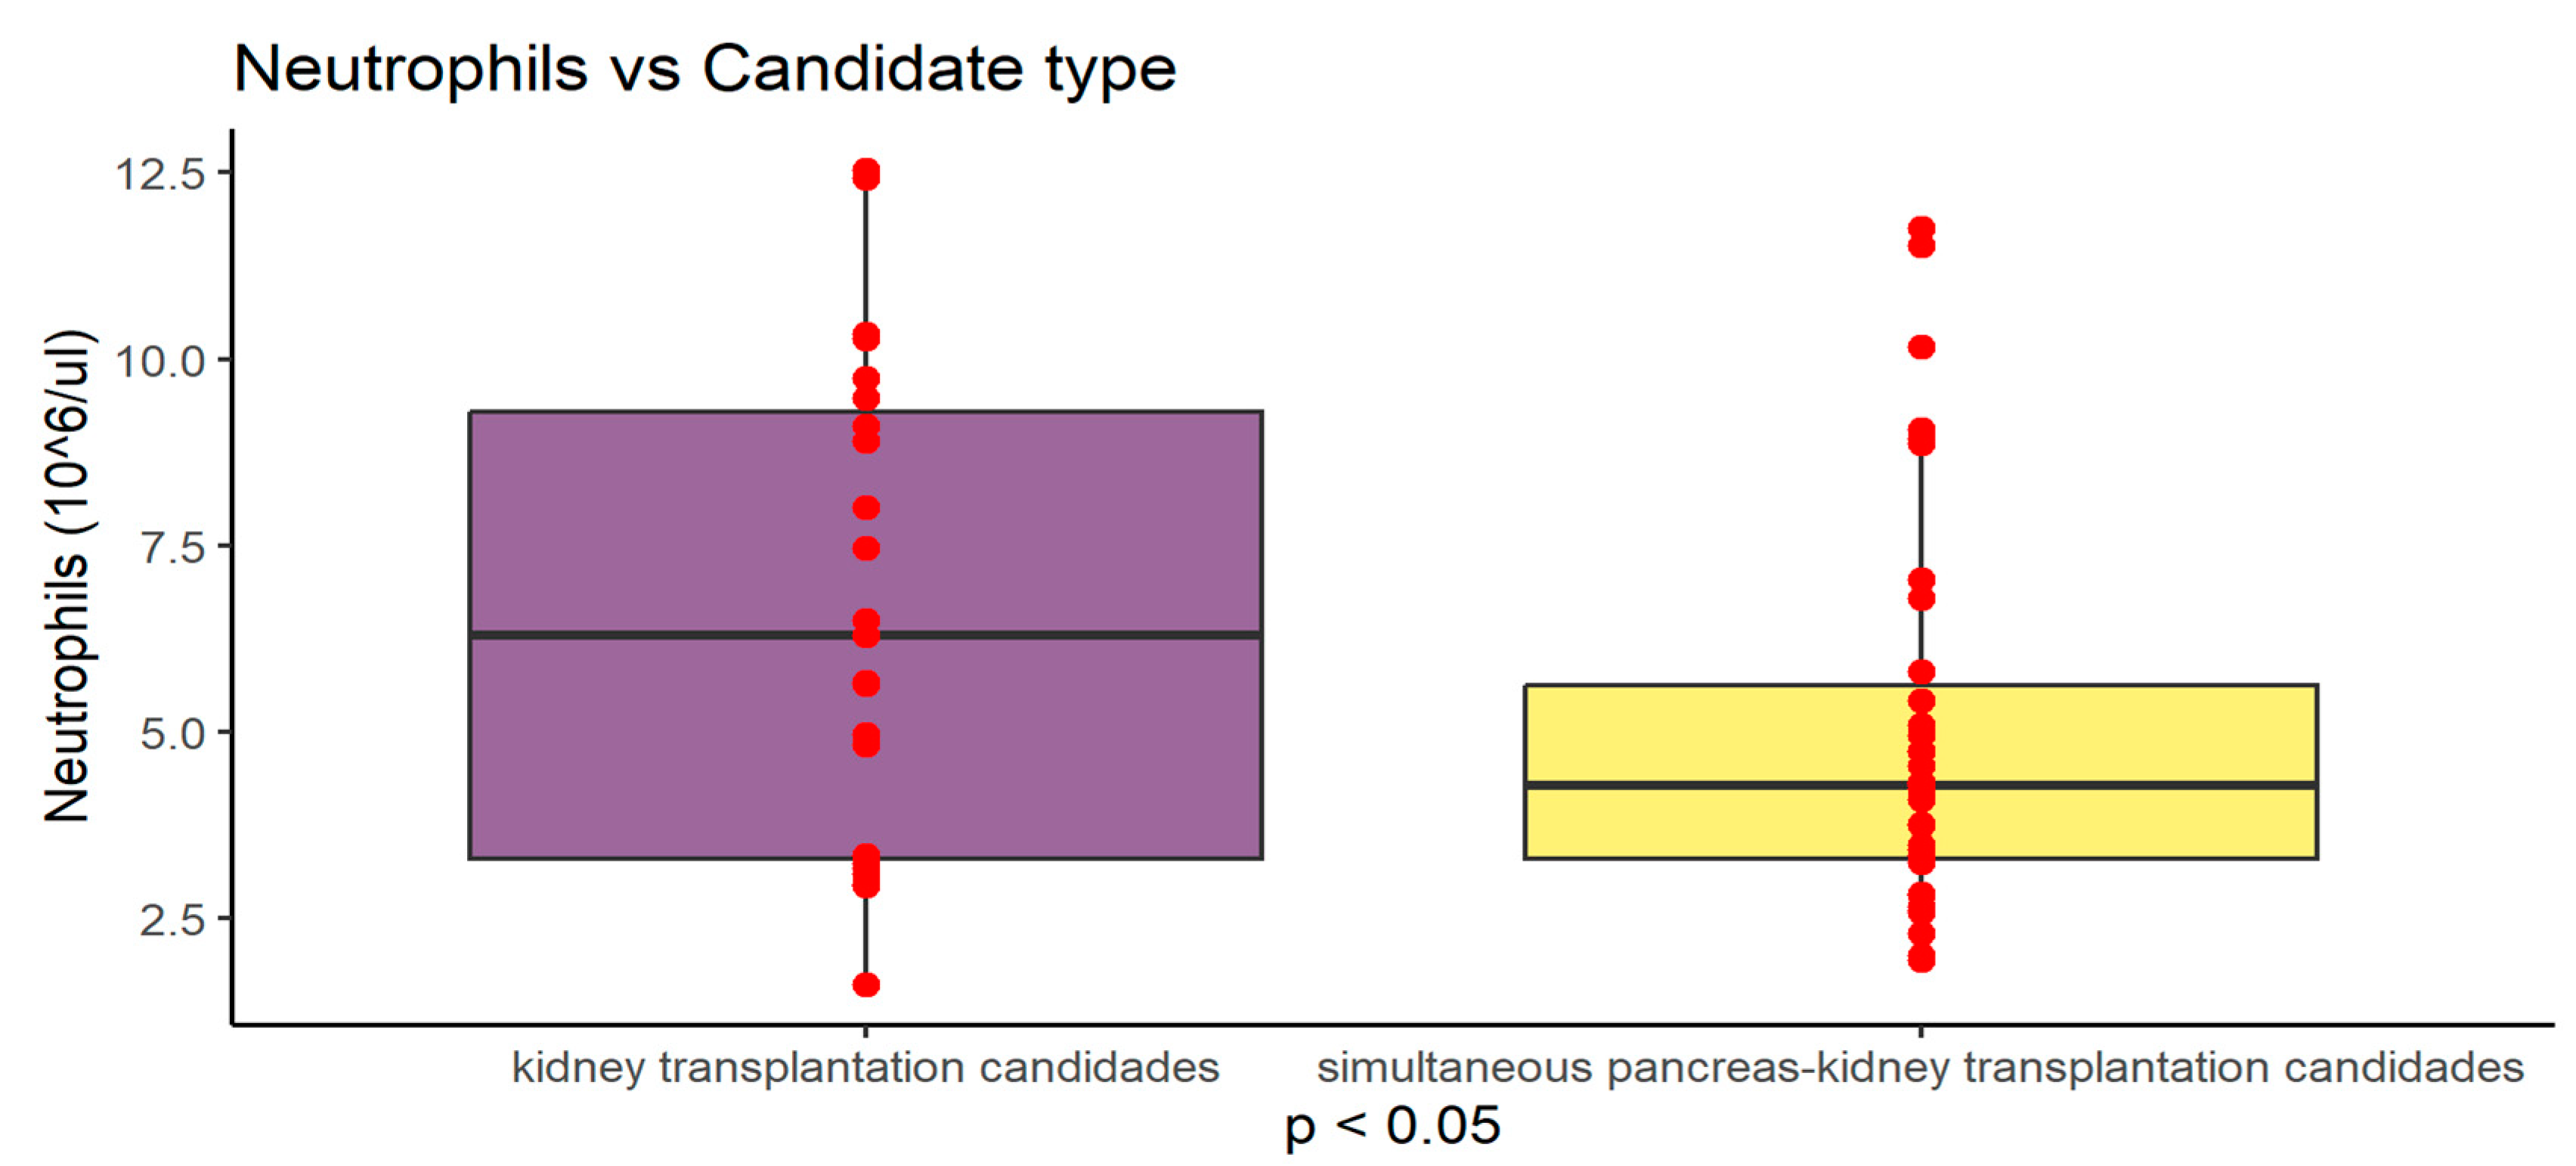
| NEU (10^6/ul) | 6.634 ± 3,263 | 5.00 ±2.67 | 0.0411 |
| RBC (10^9/ul) | 3.511 ± 0,458 | 3.743 ± 0.607 | 0,1251 |
| HCT (%) | 34.261 ± 4,324 | 34.869 ± 5.512 | 0.6575 |
| HGB (g/dl) | 11.096 ± 1,414 | 11.419 ± 1.881 | 0.4853 |
| MCV (fl) | 95.784 ± 4,707 | 92.682 ± 5.135 | 0.0237 |
| KREA (mg/dl) | 6.6 ± 2,32 | 6.3 ± 2.63 | 0.6547 |
| EGFR (mil/min/1,73 m2) | 9.259 ± 3,528 | 10.743 ± 7.770 | 0.3938 |
| UREA (mg/dl) | 91.380 ± 45,005 | 105.321 ± 30.664 | 0.1620 |
| GLU (mg/dl) | 116.718 ± 27,418 | 140.485 ± 65.659 | 0.1131 |
| HBA1C (%) | 5.786 ± 1,251 | 8.263 ± 1,636 | 0.0005 |
| CHOL (mg/dl) | 177.727 ± 41,165 | 163.833 ± 42,417 | 0.2261 |
| HDL (mg/dl) | 47.000 ± 12,096 | 53,576 ± 14,708 | 0.1479 |
| LDL-C (mg/dl) | 112.656 ± 27,917 | 87.469 ± 34,490 | 0.0148 |
| TG (mg/dl) | 135.381 ± 67,691 | 124.917 ± 50,761 | 0.5102 |
| CA total (mmol/l) | 2.331 ± 0,155 | 2.221 ± 0,193 | 0.0339 |
| P (mg/dl) | 5.019 ± 1,415 | 5.642 ± 1,610 | 0.2258 |
| PTH (pg/ml) | 624.300 ± 681,130 | 226.997 ± 154,623 | 0.0015 |
| TSH (uIU/ml) | 2.360 ± 1,123 | 2.351 ± 2,025 | 0.9867 |
| CRP (mg/l) | 3.964 ± 3,363 | 3.372 ± 4,921 | 0.6277 |
| NA (mmol/l) | 138.621 ± 2,462 | 138.384 ± 3,050 | 0.7588 |
| K (mmol/l) | 5.057 ± 0,462 | 5.059 ± 0,637 | 0.9888 |
| TP (g/dl) | 6.885 ± 0,683 | 6.528 ± 0,986 | 0.1768 |
| Albumin (g/dl) | 4.256 ± 0,551 | 3.511 ± 0,591 | 0.0097 |
statistical significance at p<0.05.
Figure 2.
Graphical presentation of MCV difference between study groups (P<0.05) Values are presented as mean +SD.
Figure 2.
Graphical presentation of MCV difference between study groups (P<0.05) Values are presented as mean +SD.
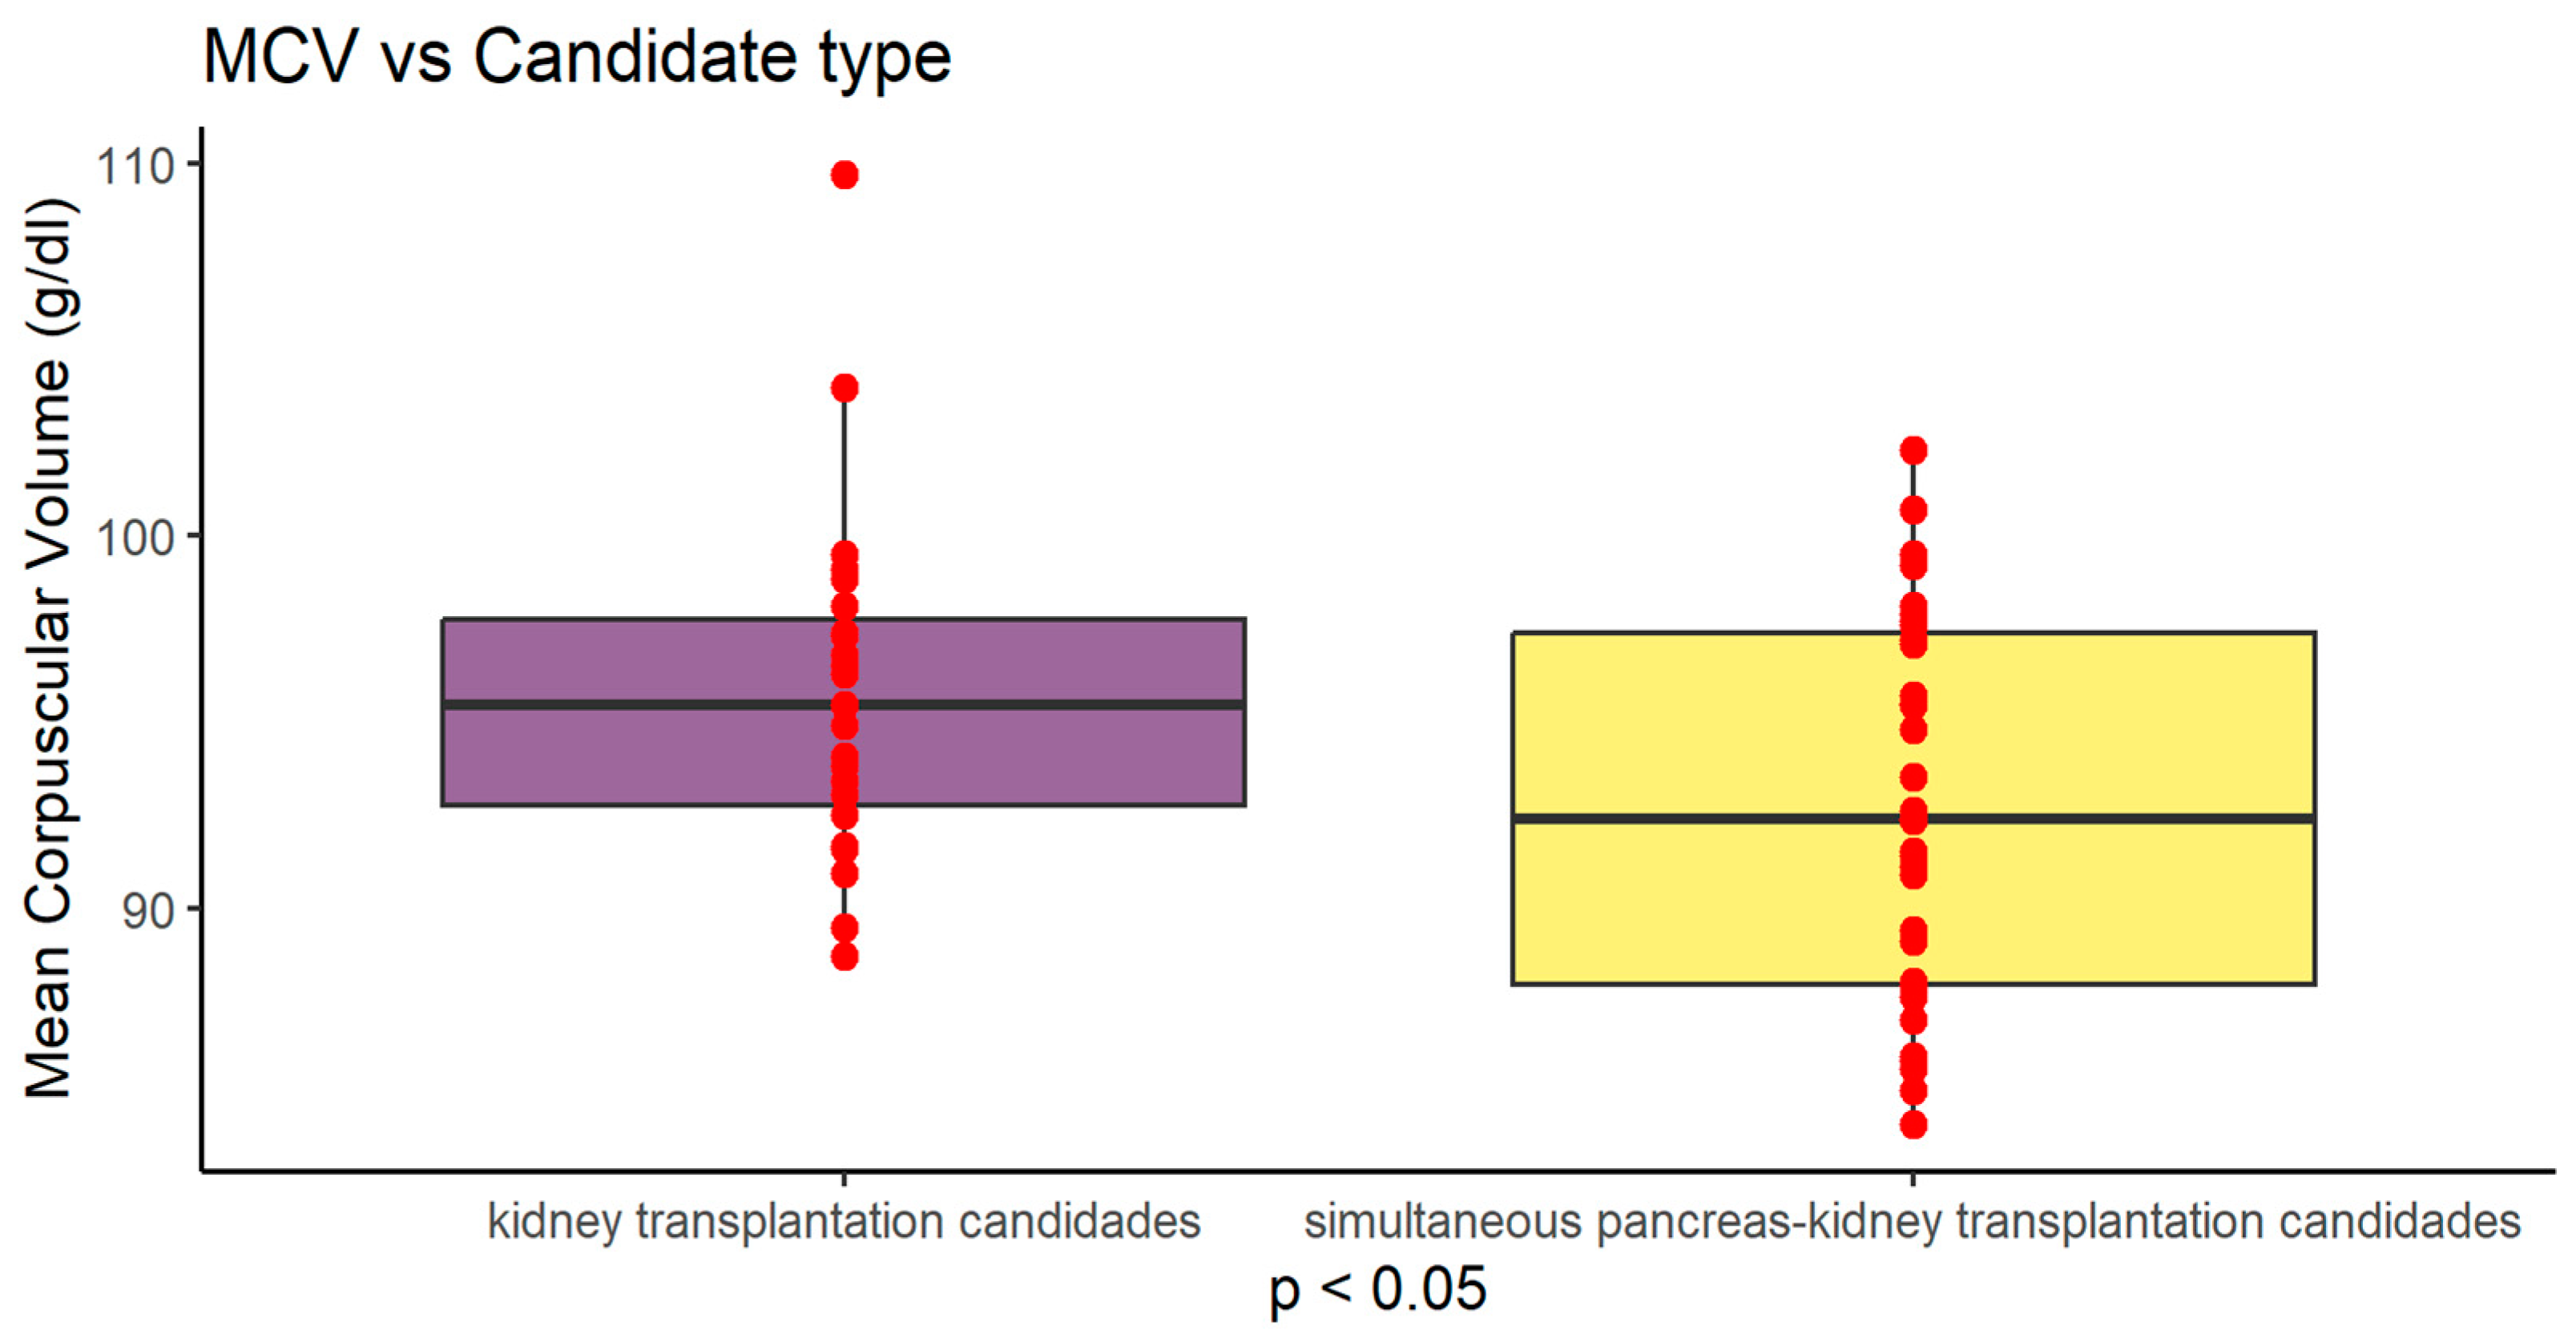
Figure 3.
Graphical presentation of neutrophil count differences between study groups (P<0.05) Values are presented as mean +SD.
Figure 3.
Graphical presentation of neutrophil count differences between study groups (P<0.05) Values are presented as mean +SD.
Assessment of nutritional status of our study group showed significant differences in NRS 2002 score between Ktx i SPKTx groups. In terms of interpreting the results obtained from the NRS 2002 assessment, the following determinants are distinguished: <3 points - consider conservative management, repeat the assessment in 7 days; ≥3 - nutritional treatment is recommended.
In Ktx group (23 pts) score 0-2 received 18 pts (78%) and 3-4 received only 5 pts (22%). No one received a score of 5. In SPKtx group (36 pts) score 0-2 received only 9 pts (25%) and score 3-5 received 27 pts (75%).
Table 3.
NRS 2002 scale according to candidate type.
| NRS 2002 scale | ||||||
|---|---|---|---|---|---|---|
| Group | 0 | 1 | 2 | 3 | 4 | 5 |
| KTx candidates | 4,35% | 17,39% | 56,52% | 4,35% | 17,39% | 0,00% |
| SPKtx candidates | 11,11% | 2,78% | 11,11% | 47,22% | 22,22% | 5,56% |
| summary | 8,47% | 8,47% | 28,81% | 30,51% | 20,34% | 3,39% |
Table 4.
NRS 2002 scale according to renal replacement therapy type (RRT).
| NRS 2002 scale | ||||||
|---|---|---|---|---|---|---|
| type of RRT | 0 | 1 | 2 | 3 | 4 | 5 |
| Hemodialysis | 10,81% | 10,81% | 35,14% | 18,92% | 18,92% | 5,41% |
| Peritoneal dialysis | 0,00% | 0,00% | 10,00% | 70,00% | 20,00% | 0,00% |
| Preemptive | 8,33% | 8,33% | 25,00% | 33,33% | 25,00% | 0,00% |
| summary | 8,47% | 8,47% | 28,81% | 30,51% | 20,34% | 3,39% |
Other nutritional parameters are presented in Table 5.
Noticing differences between study groups, we analyzed data according to renal replacement treatment methods (RRT) and found that peritoneal dialysis patients from both Ktx and SPKtx had slightly higher BMI =26.51 (±5.47) compared to hemodialysis 23.47 (±3.40) and preemptive patients 24.65 (±3.70) (p<0.1). This difference did not reach statistical significance (Figure 4). Serum albumin level was highest in haemodialysis (HD) patients 4.10 g/dl (±0.55) compared to peritoneal dialysis (PD) 3.61 g/dl (±0.45) and preemptive 3.78 g/dl (±0.55) (p<0.05). Serum protein level was highest in haemodialysis (HD) patients 6.95 g/dl (±0.80) compared to peritoneal dialysis (PD) 6.00 g/dl (±0.73) and preemptive 6.37 g/dl (±0.80) (p<0.05). MCV was also higher in HD group 95.88 fl (±4.16) compared to PD 90.99 fl (±5.00) and preemptive patients 90.05 fl (±5.19) (p<0.01) (Figure 5, Figure 6 and Figure 7).
What is more, HD patients had higher PNIO score 40.99 (±5.45) compared do PD 36.12 (±4.54) and preemptive patients 37.83 (±5.52) (p<0.05) - (Figure 8)
3.2. Correlations of parameters in the total group
After making the correlation matrix of the analyzed parameters, the occurrence of numerous dependencies was found (supplement 1). The most important significant correlations of the examined parameters with the nutritional indices PNIO, NRI, NLR and albumin are shown in Figure 9, Figure 10, Figure 11, Figure 12, Figure 13, Figure 14, Figure 15 and Figure 16.
3.2.1. Significant correlations of the PNIO indicator
In the case of the PNIO indicator, significant relationships were observed in many parameters, the most interesting are shown below. PNIO correlated with total serum protein, albumin, NRI, MCV Surprisingly there were no correlations with BMI or weight or IBW- Lorenz (Figure 9, Figure 10, Figure 11, Figure 12 and Figure 13)
3.2.2. Significant NRI (Nutrition Risk Index) correlations
When analyzing the NRI index, significant relationships with many parameters was observed: MCV, glucose, total protein, serum albumin, and with BMI.
The graphics of correlation between the NRI and those parameters are presented below (Figures 14–19).
3.2.3. Significant NLR (neutrophil-to-lymphocyte ratio) correlations
When analyzing the NLR index, no significant correlations were found.
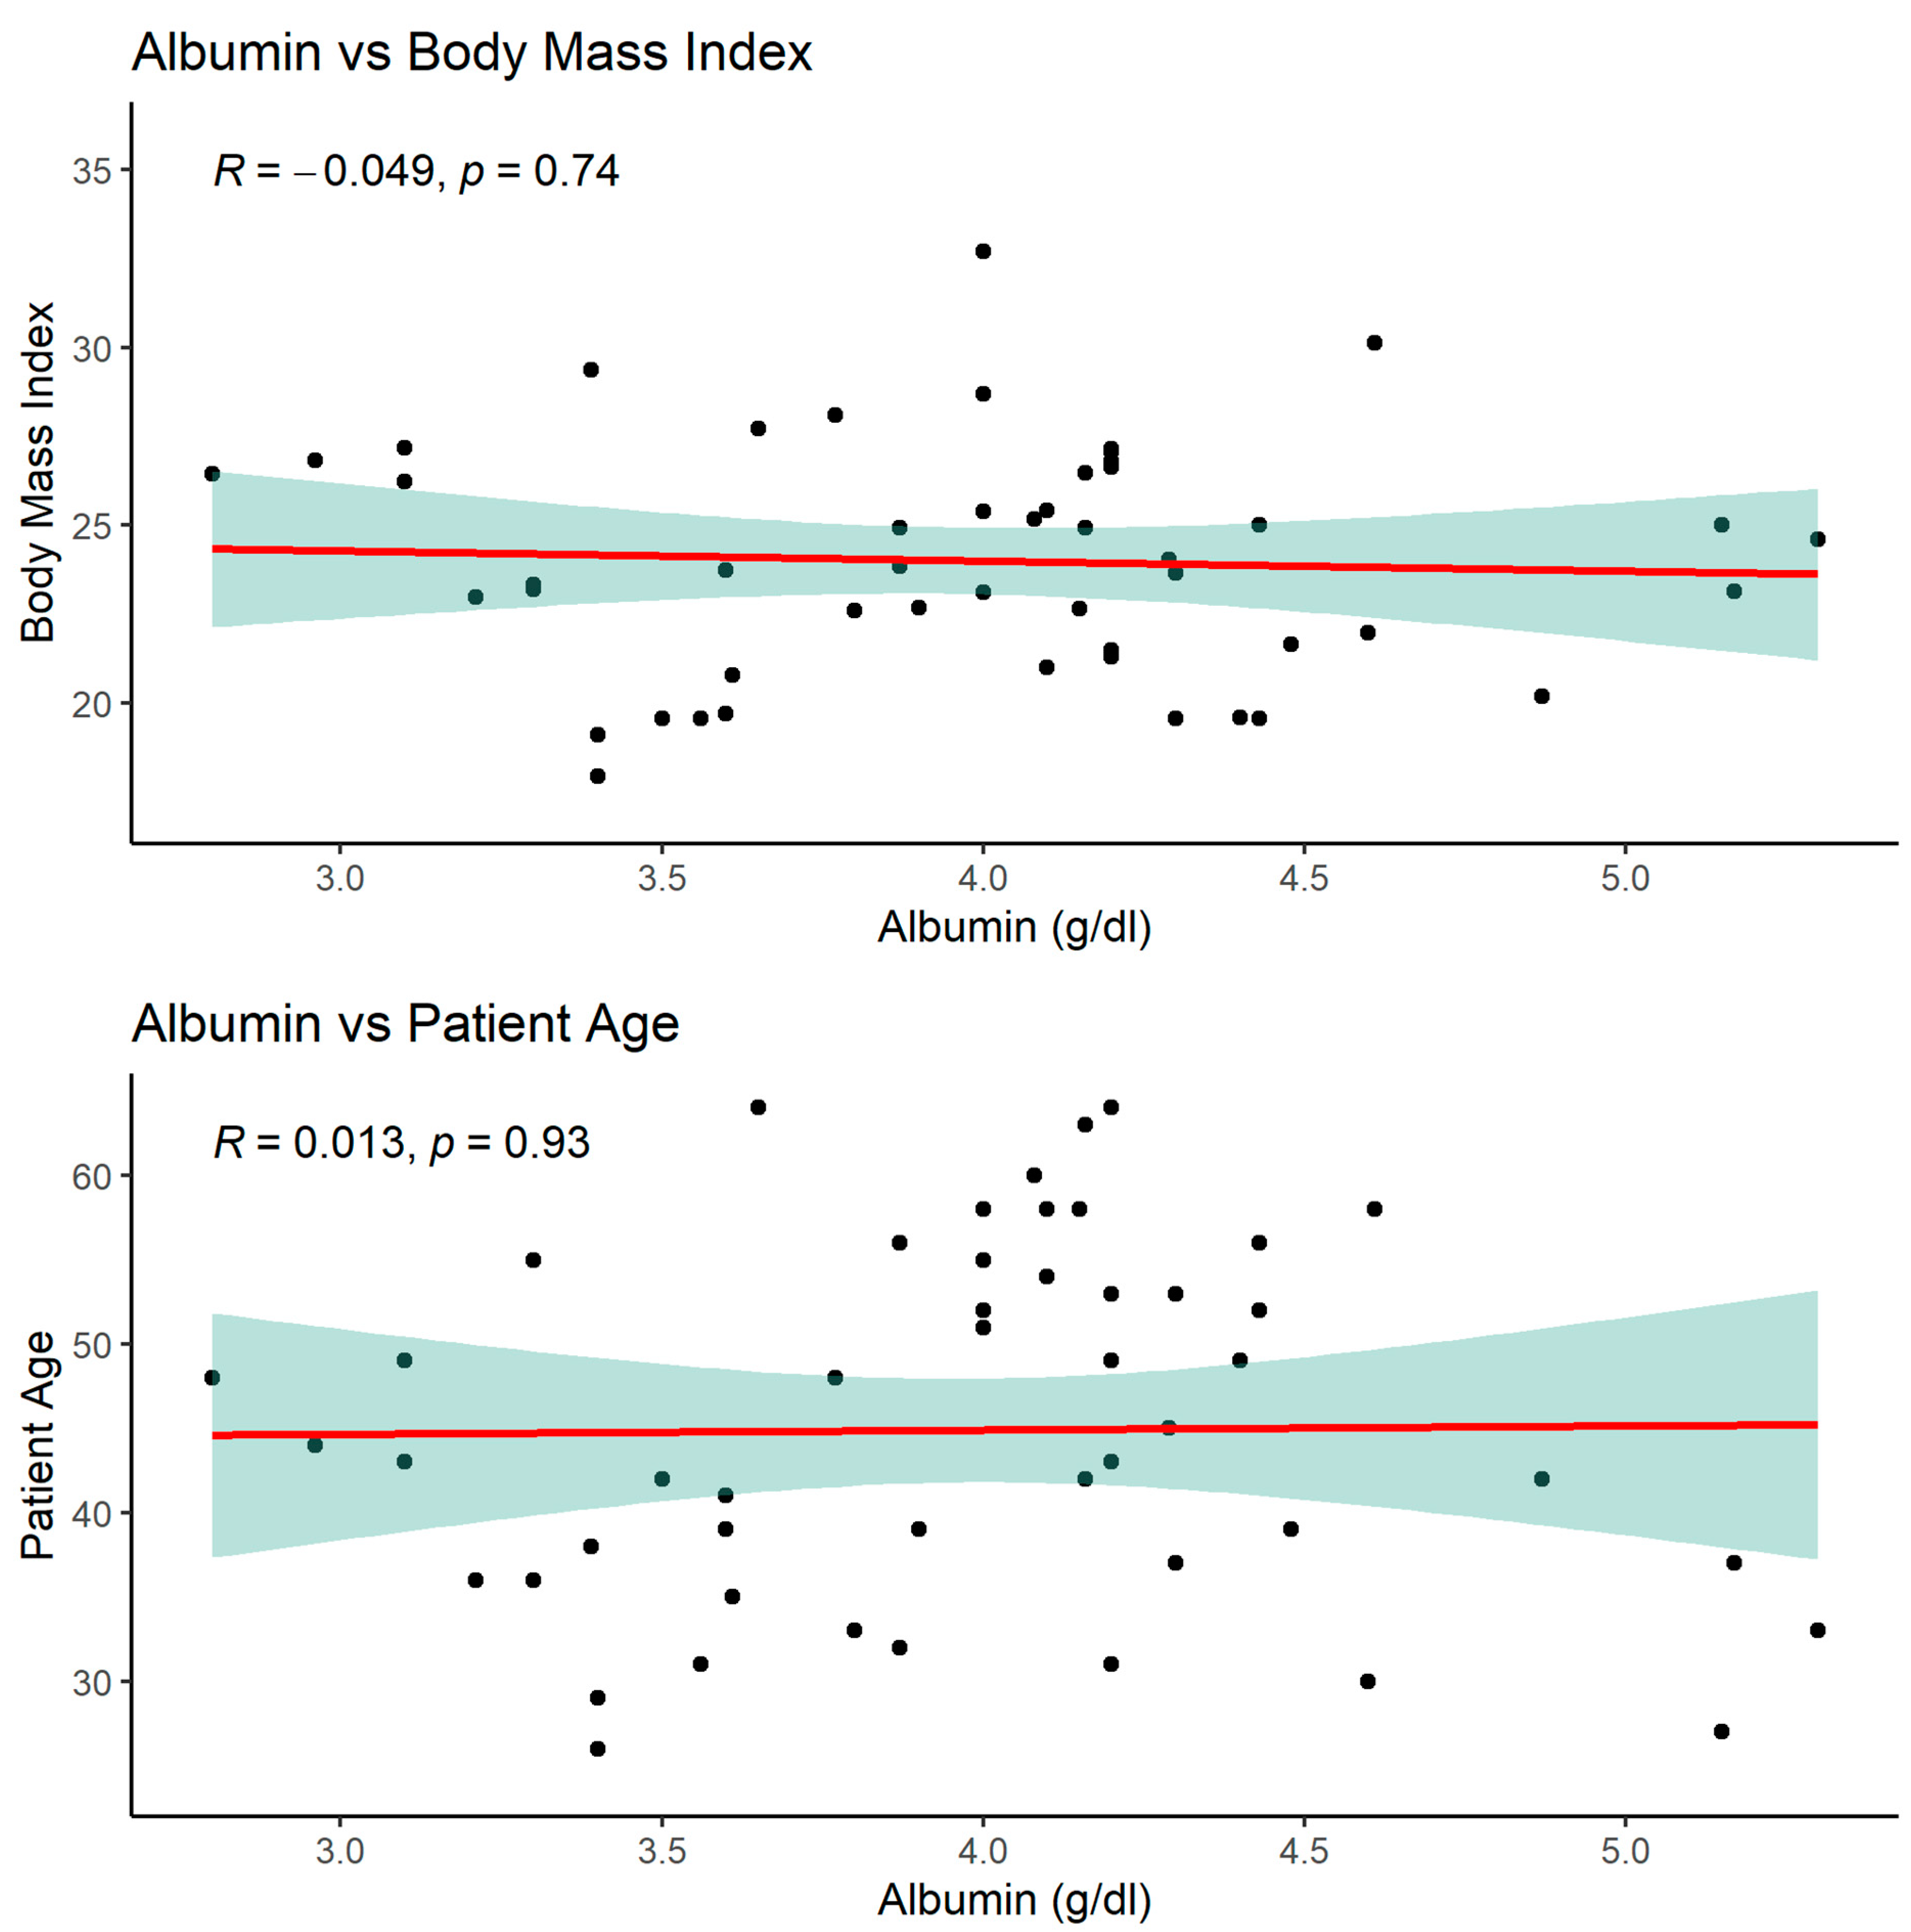
3.2.4. Significant albumin correlations
As mentioned above, serum albumin correlated with parameters such as PNIO or NRI but not with BMI, gender or patients age.
3.3. Summary of Results:
- Patients in the study group had normal BMI in both groups, with values of Ktx = 24.4 ± 3.0 and SPKTx = 24.1 ± 4.5 (NS)
- Peritoneal dialysis patients from combined Ktx and SPKtx had slightly higher BMI compared to hemodialysis and preemptive patients (p<0.1). This difference did not reach statistical significance
- MCV (fl) in Ktx group was significantly higher compared to SPKTx group 95.784 ± 4,707 vs 92.682 ± 5.135 (p=0.0237)
- MCV was also higher in HD group compared to PD and preemptive patients (p<0.01)
- Serum albumin in the Ktx group was 4.256 ± 0.551, and in the SPKTx group, it was 3.511 ± 0.591, showing a significant difference (p = 0.009).
- Serum albumin and total protein level was highest in haemodialysis (HD) patients compared to peritoneal dialysis (PD) and preemptive (p<0.05)
- The PNIO (Prognostic Nutritional Index) value was in the low range in both study groups, i.e., below < 45. In the Ktx group, PNIO was 41.1 ± 4.5, and in the SPKTx group, it was 38.8 ± 6.2.
- HD patients had higher PNIO score compared do PD and preemptive patients (p<0.05)
- The NRS 2002 (Nutrition Risk Screening) showed greater severity of nutritional disorders and higher energy requirements in the SPKTx group. In SPKtx group (36 pts) score 0-2 received only 9 pts (25%) and score 3-5 received 27 pts (75%). In Ktx group (23 pts) score 0-2 received 18 pts (78%) and 3-4 received only 5 pts (22%). No one received a score of 5.
- The NRI (Nutrition Risk Index) value in the Ktx group was 108.22 ±9.23 vs.103.03 ±10.01 the SPKTx group (p=0.0655) indicating a tendency to better results of nutrition in the Ktx group.
- In the studied group, the NLR (neutrophil-to-lymphocyte ratio) was 11.20 ±16.99 in the Ktx group and slightly higher at 12.5 ± 29.7 in the SPKTx group, but no statistically significant differences were observed due to a large variability in values.
- A number of correlations were found between examined parameters, eg. PNIO correlated positively with total serum protein, albumin, NRI, MCV.
- NRI index correlated positively with MCV, total protein, serum albumin, BMI and negatively with glucose.
4. Discussion
Patients with low albumin levels may exhibit poorer response to administered treatment and a higher incidence of postoperative complications. Albumin deficiency, with a half-life of 20 days, can also impact survival time. The assessment of the nutritional status of cancer patients includes the evaluation of prealbumin and transferrin, which have significantly shorter half-lives of 2 and 8 days, respectively.
The reduction in total protein and albumin levels indicates the presence of catabolism (protein breakdown), which, over an extended period, leads to the manifestation of clinical signs of malnutrition. Early assessment of this condition allows for a prompt response, such as the initiation of nutritional supplementation (increased protein and calorie intake), to reverse this unfavorable state. It should be noted that albumin reflects disease severity, not just malnutrition [15] (Serón-Arbeloa 2022).
Malnutrition leads to a decrease in the total lymphocyte count. Insufficient levels of lymphocytes result in impaired immune system function and an increased incidence of septic complications. The total lymphocyte count in moderately malnourished individuals ranges from 900-1500/mm³, while in severely malnourished individuals, this value falls below 900/mm³.
According to data published in 2014, in patients undergoing total gastrectomy for gastric cancer, early introduction of enteral nutrition significantly improves parameters assessing the degree of nutrition, such as albumin levels and total body mass [16]. Albumin level is also a prognostic factor in advanced gastric cancer, particularly when chemotherapy is initiated.
Albumin level is used as an element of the Prognostic Nutritional Index (PNIO), a prognostic indicator of nutrition. The cutoff value that divides PNIO into high and low categories is 45 (PNIO high > 45, PNIO low < 45). PNIO is calculated using the following formula:
PNIO = 10x (serum albumin level in g/dL) + 0.005x (total lymphocyte count in mm). A study assessing the impact of PNIO values demonstrated that a high index positively affects the survival of patients and is a statistically independent parameter, similar to tumor size and regional lymph node status [17].
The Nutritional Risk Index (NRI) formula is as follows: NRI = [1.489 x serum albumin level (g/L)] + [41.7 x (current weight/normal weight of the patient)]. NRI results are interpreted as follows: > 100 - no signs of malnutrition; 97.5 - 100 - mild malnutrition; 83.5-97.4 - moderate malnutrition; < 83.5 - severe malnutrition. A result below 83.5 is considered abnormal and is associated with a complication rate of 27.5% and mortality rate of 22%, whereas patients with higher values have rates of 14.6% and 2.8%, respectively. NRI is the oldest screening tool and was initially described by Buzby et al. to investigate the relationship between malnutrition and surgical outcomes [18]. A correlation has also been found between this nutritional risk scale and hospital stay, thus impacting hospitalization costs [19,20].
In our study group serum albumin was the most sensitive marker of nutrition status. It was significantly higher in Ktx compared to SPKtx group (p<0.01). It was also significantly higher in patients under hemodialysis compared to PD and premptive patients (p<0.05). Because both NRI and PNIO index are based on albumin level- we found that Ktx group had better results compared to SPKTx, but those results did not reach statistical significance. The only significant difference found was higher PNIO result in HD compared to PD and preemptive group (p<0.01). PNIO was lower than 45 in both study groups: in Ktx mean=41.1 ± 4,5 and 38.8 ± 6.2 in SPKtx, indicating worse nutrition results compared to the general population.
Negative correlation of NRI index with serum glucose in the study group of patients showed that the lower serum glucose concentration, the higher nutrition risk index is.
Positive correlation of NRI with MCV was another interesting finding in our group.
Over the past 10 years, the assessment of the neutrophil-to-lymphocyte ratio (NLR) as a novel marker of disease has become an exciting area of biomedical research. The ratio of lymphocytes to neutrophils (NLR) is approximately 1-3. An NLR of 6-9 indicates mild stress (eg, a patient with simple appendicitis). NLRs in critically ill patients are usually 9 or higher (sometimes reaching values close to 100).Although a precise and definitive cutoff point has not been found, its role as a marker of immune system homeostasis is well established. NLR has known prognostic value and is independently associated with mortality in the general population and several disease-specific subgroups (sepsis, pneumonia, COVID-19, cancer, cardiovascular diseases, transplant patients etc.) [21].
Hogendorf i wsp [22] found that higher absolute lymphocyte count (lnLymphocytes) and lower NLR were associated with lower eGFR on the 21st day after kidney transplantation. In our study group the neutrophil-to-lymphocyte ratio (NLR), due to a wide range of values within the Ktx and SPKTx groups, did not reveal statistically significant differences, but was higher than 9 indicating our patients were in stress (11.20 ±16.99 in the Ktx group and 12.5 ± 29.7 in the SPKTx group).
In light of the obtained results from our study, it is evident that SPKTx candidates were at a preoperative risk of malnutrition (significantly higher NRS-2002 and lower albumin levels compared to the Ktx group), despite having a normal BMI of 24.1 kg/m². Another important finding is that PD patients are at special risk of malnutrition which was indicated with lower PNIO.
Poor nutritional status in patients qualified for simultaneous kidney and pancreas transplantation (SPKTx) may be one of the causes of frailty in this particular group of individuals.
Frailty is a holistic, complex, and multidimensional phenomenon. It is important to carefully distinguish it from other related findings, such as sarcopenia, which specifically refers to muscle wasting and may coincide with frailty, but the two terms are not synonymous.
Frailty is common in people with chronic diseases such as diabetes mellitus (DM), chronic kidney disease (CKD), and End-Stage Kidney Disease (ESKD). The increased prevalence of frailty in the CKD population may be a result of aging and the increasing number of diabetes mellitus cases in the population.
Parsons et al., in their systematic review and meta-analysis, investigated the phenomenon of frailty in candidates for kidney and pancreas transplantation [23]. The authors found that the risk of frailty increases with age and is associated with a lower chance of being listed for transplantation, higher mortality on the waiting list, and reduced access to SPKT among adult candidates [23,24]. Furthermore, frailty is associated with adverse transplant outcomes, such as surgical complications, delayed graft function, postoperative delirium, poor tolerance of immunosuppression, and higher mortality [24]. The authors also noted that frailty assessment provides an opportunity to identify those in whom the risk of SPKTx outweighs the benefits [24]. Moreover, regular frailty assessment allows the identification of individuals with worsening frailty and increased risk of adverse transplantation outcomes [24]. The review analyzed the interplay of various factors exposing these patients to frailty, including immunological factors, aging, environmental factors, diabetes, and chronic kidney disease [23]. The authors recommend further research on frailty in the pancreas transplant population to better select patients for transplantation and develop strategies for dealing with its consequences [22].
Based on the obtained test results and in accordance with the ESPEN guidelines [9], we suggest implementing a continuous assessment of nutritional parameters in the pre-transplantation period. In accordance with the ESPEN guidelines on nutrition in surgical wards, we suggest the implementation of broadly understood perioperative nutritional therapy - oral and intravenous nutrition.
The waiting time on the list of kidney and pancreatic transplant recipients in Poland is 308 days from the moment of qualifying, and from the beginning of dialysis therapy over 800 days [25].
Patients undergoing peritoneal dialysis due to the loss of protein with the dialysis fluid and patients in the preemptive period due to protein restrictions in nutrition require special care.
Particularly noteworthy are patients qualified for SPKtx due to surgical intervention in the upper gastrointestinal tract, which results in the impossibility of effective enteral nutrition immediately after surgery.
In these patients, baseline malnutrition/frailty and the impossibility of introducing effective enteral nutrition after surgery overlap, therefore it seems reasonable to monitor their nutritional status in the preoperative period and early implementation of appropriate nutrition / supplementation while on waiting list. Lack of adequate control and nutrition may result in poor postoperative outcomes in this population, prolonged hospitalization time, more frequent infections, and higher mortality.
5. Conclusions
1. Analyzing the obtained results, it was found that BMI is not a good parameter for differentiating the study groups, nor does it indicate the risk of malnutrition present among the studied patients
2. The PNIO index is decreased in both groups, but similarly to the NRI index, it is a weak parameter for differentiating between the two groups of patients.
3. The NRS 2002 index and albumin level were the most effective in illustrating the differences between the groups. In the examined group of transplant candidates, both parameters indicate that patients in the KTx group (kidney transplant) are better nourished than candidates for SPKTx (kidney and pancreas transplant), despite the former being older patients.
4. It seems that more effort should be made to start a proper nutrition plan for SPKTx (and especially PD) patients. Regular assessment of nutrition status should be performed. SPKtx patients in the perioperative period should receive parenteral nutrition and, as soon as their general condition allows it, enteral nutrition, taking into account the caloric and protein needs.
5. Further studies are warranted to elucidate the impact of the nutritional status of transplant recipients on their survival and the duration of functioning renal and pancreatic grafts.
6. Study limitations:
Due to the "COVID era" from 2020 to 2023, there were not many transplantation procedures performed as the pancreas transplant program was suspended in Poland for 1.5 years by the decision of Poltransplant. On average, our center performs 25-30 kidney and pancreas transplant surgeries and approximately 40-50 kidney transplant surgeries alone annually.
References
- Durlik M., Baumgart-Gryn K. Almost 200 Pancreas Transplantations: A Single-Center Experience. Transplant. Proc. 2018, 50, 2124–2127. [CrossRef]
- Messner F., Etra J.W., Yu Y., Massie A.B., Jackson K.R., Brandacher G., Schneeberger S., Margreiter C., Segev D.L. Outcomes of simultaneous pancreas and kidney transplantation based on donor resuscitation. Am. J. Transplant. 2020, 20, 1720–1728. [CrossRef]
- Khubutia M.S., Pinchuk A.V., Dmitriev I.V., Balkarov A.G., Storozhev R.V., Anisimov Y.A. Surgical complications after simultaneous pancreas–kidney transplantation: A single-center experience. Asian J. Surg. 2016, 39, 232–237. [CrossRef]
- Lindahl J.P., Horneland R., Nordheim E., Hartmann A., Aandahl E.M., Grzyb K., Haugaa H., Kjøsen G., Åsberg A., Jenssen T. Outcomes in Pancreas Transplantation With Exocrine Drainage Through a Duodenoduodenostomy Versus Duodenojejunostomy. Am. J. Transplant. 2018, 18, 154–162. [CrossRef]
- Yong P.H., Weinberg L., Torkamani N., Churilov L., Robbins R.J., Ma R., Bellomo R., Lam Q.T., Burns J.D., Hart G.K., et al. The presence of diabetes and higher HbA1c are independently associated with adverse outcomes after surgery. Diabetes Care. 2018, 41, 1172–1179. [CrossRef]
- Kildow B.J., Agaba P., Moore B.F., Hallows R.K., Bolognesi M.P., Seyler T.M. Postoperative Impact of Diabetes, Chronic Kidney Disease, Hemodialysis, and Renal Transplant After Total Hip Arthroplasty. J. Arthroplast. 2017, 32, S135–S140. [CrossRef]
- Fu M.C., Boddapati V., Dines D.M., Warren R.F., Dines J.S., Gulotta L.V. The impact of insulin dependence on short-term postoperative complications in diabetic patients undergoing total shoulder arthroplasty. J. Shoulder Elb. Surg. 2017, 26, 2091–2096. [CrossRef]
- https://erassociety.org/guidelines/ access date 16.04.2023.
- Finlay S., Asderakis A., Ilham A., Elker D., Chapman D., Ablorsu E. The role of nutritional assessment and early enteral nutrition for combined pancreas and kidney transplant candidates. Clin Nutr ESPEN. 2017 Feb, 17, 22-27. [CrossRef]
- Elango M., Papalois V. Working towards an ERAS Protocol for Pancreatic Transplantation: A Narrative Review. J Clin Med. 2021 Apr, 1, 10(7), 1418. [CrossRef]
- Hirahara N., Tajima Y., Fujii Y., et al. Prognostic nutritional index as a predictor of survival in resectable gastric cancer patients with normal preoperative serum carcinoembryonic antigen levels: a propensity score matching analysis. BMC Cancer. 2018, 18(1), 285. [CrossRef]
- Al-Najjar Y., Clark A.L. Predicting Outcome in Patients With Left Ventricular Systolic Chronic Heart Failure Using a Nutritional Risk Index. The American Journal of Cardiology, 2012, 109(9), 1315–1320. [CrossRef]
- Kondrup J., Allison P., Elia M., Vellas B., Plauth M. ESPEN Guidelines for Nutrition Screening 2002. Clinical Nutrition. 2003, 22(4), 415–421. [CrossRef]
- Drăgoescu A.N., Pădureanu V., Stănculescu A.D., et al. Neutrophil to Lymphocyte Ratio (NLR)—A Useful Tool for the Prognosis of Sepsis in the ICU. Biomedicine . 2022; 10(1), 75. [CrossRef]
- Serón-Arbeloa C.; Labarta-Monzón L., Puzo-Foncillas J., Mallor-Bonet T.; Lafita-López A., Bueno-Vidales N., Montoro-Huguet M. Malnutrition Screening and Assessment. Nutrients 2022, 14, 2392. [CrossRef]
- Chen W. i wsp. Early enteral nutrition after total gastrectomy for gastric cancer. Asia Pac J Clin Nutr. 2014, 23, 607-611. [CrossRef]
- Sun J. i wsp. Value of the prognostic nutritional index in advanced gastric cancer treated with preoperative chemotherapy. J Surg Res 2017, 209, 37-44. [CrossRef]
- Buzby G.P., Peterson O.L., Page C.P., Reinhardt G.F., Mullen J.L., A Randomized Clinical Trial of Total Parenteral Nutrition in Malnourished Surgical Patients: The Rationale and Impact of Previous Clinical Trials and Pilot Study on Protocol Design. Am. J. Clin. Nutr. 1988, 47, 357–365. [CrossRef]
- Kyle U.G., Pirlich M., Schuetz T., Lochs H., Pichard C. Is Nutritional Depletion by Nutritional Risk Index Associated with Increased Length of Hospital Stay? A Population-Based Study. J. Parenter. Enter. Nutr. 2004, 28, 99–104. [CrossRef]
- Reine T.M., Kolseth I.B., Meen A.J., Lindahl J.P., Jenssen T.G., Reinholt F.P., Zaia J., Shao C., Hartmann A., Kolset S.O. Effects of restoring normoglycemia in type 1 diabetes on inflammatory profile and renal extracellular matrix structure after simultaneous pancreas and kidney transplantation. Diabetes Res Clin Pract. 2015, Jan, 107(1), 46-53. [CrossRef]
- Buonacera A., Stancanelli B., Colaci M., Malatino L. Neutrophil to Lymphocyte Ratio: An Emerging Marker of the Relationships between the Immune System and Diseases. Int J Mol Sci. 2022, Mar 26, 23(7), 3636. [CrossRef]
- Hogendorf P., Suska A., Skulimowski A., Rut J., Grochowska M., Wencel A., Dziwisz F., Nowicki M., Szymański D., Poznańska G., Durczyński A., Strzelczyk J. Neutrophil-lymphocyte ratio and creatinine reduction ratio predict good early graft function among adult cadaveric donor renal transplant recipients. Single institution series. Pol Przegl Chir. 2018, Apr, 30, 90(2), 28-33. [CrossRef]
- Parsons R.F., Tantisattamo E., Cheungpasitporn W., Basu A., Lu Y., Lentine K.L., Woodside K.J., Singh N., Scalea J., Alhamad T., Dunn T.B., Rivera F.H.C., Parajuli S., Pavlakis M., Cooper M. Comprehensive review: Frailty in pancreas transplant candidates and recipients. Clin Transplant. 2023, Feb, 37, (2). [CrossRef]
- McAdams-DeMarco M.A., Thind A.K., Nixon A.C., Woywodt A. Frailty assessment as part of transplant listing: yes, no or maybe? Clin Kidney J. 2022, Dec, 30, 16(5), 809-816. [CrossRef]
- Poltransplant bulletin 2022 https://www.poltransplant.org.pl/biuletyny.html accessed: 13 Jun 2023.
Figure 4.
BMI index according to renal replacement treatment method in both Ktx and SPKtx groups. Values are presented as mean +SD.
Figure 4.
BMI index according to renal replacement treatment method in both Ktx and SPKtx groups. Values are presented as mean +SD.
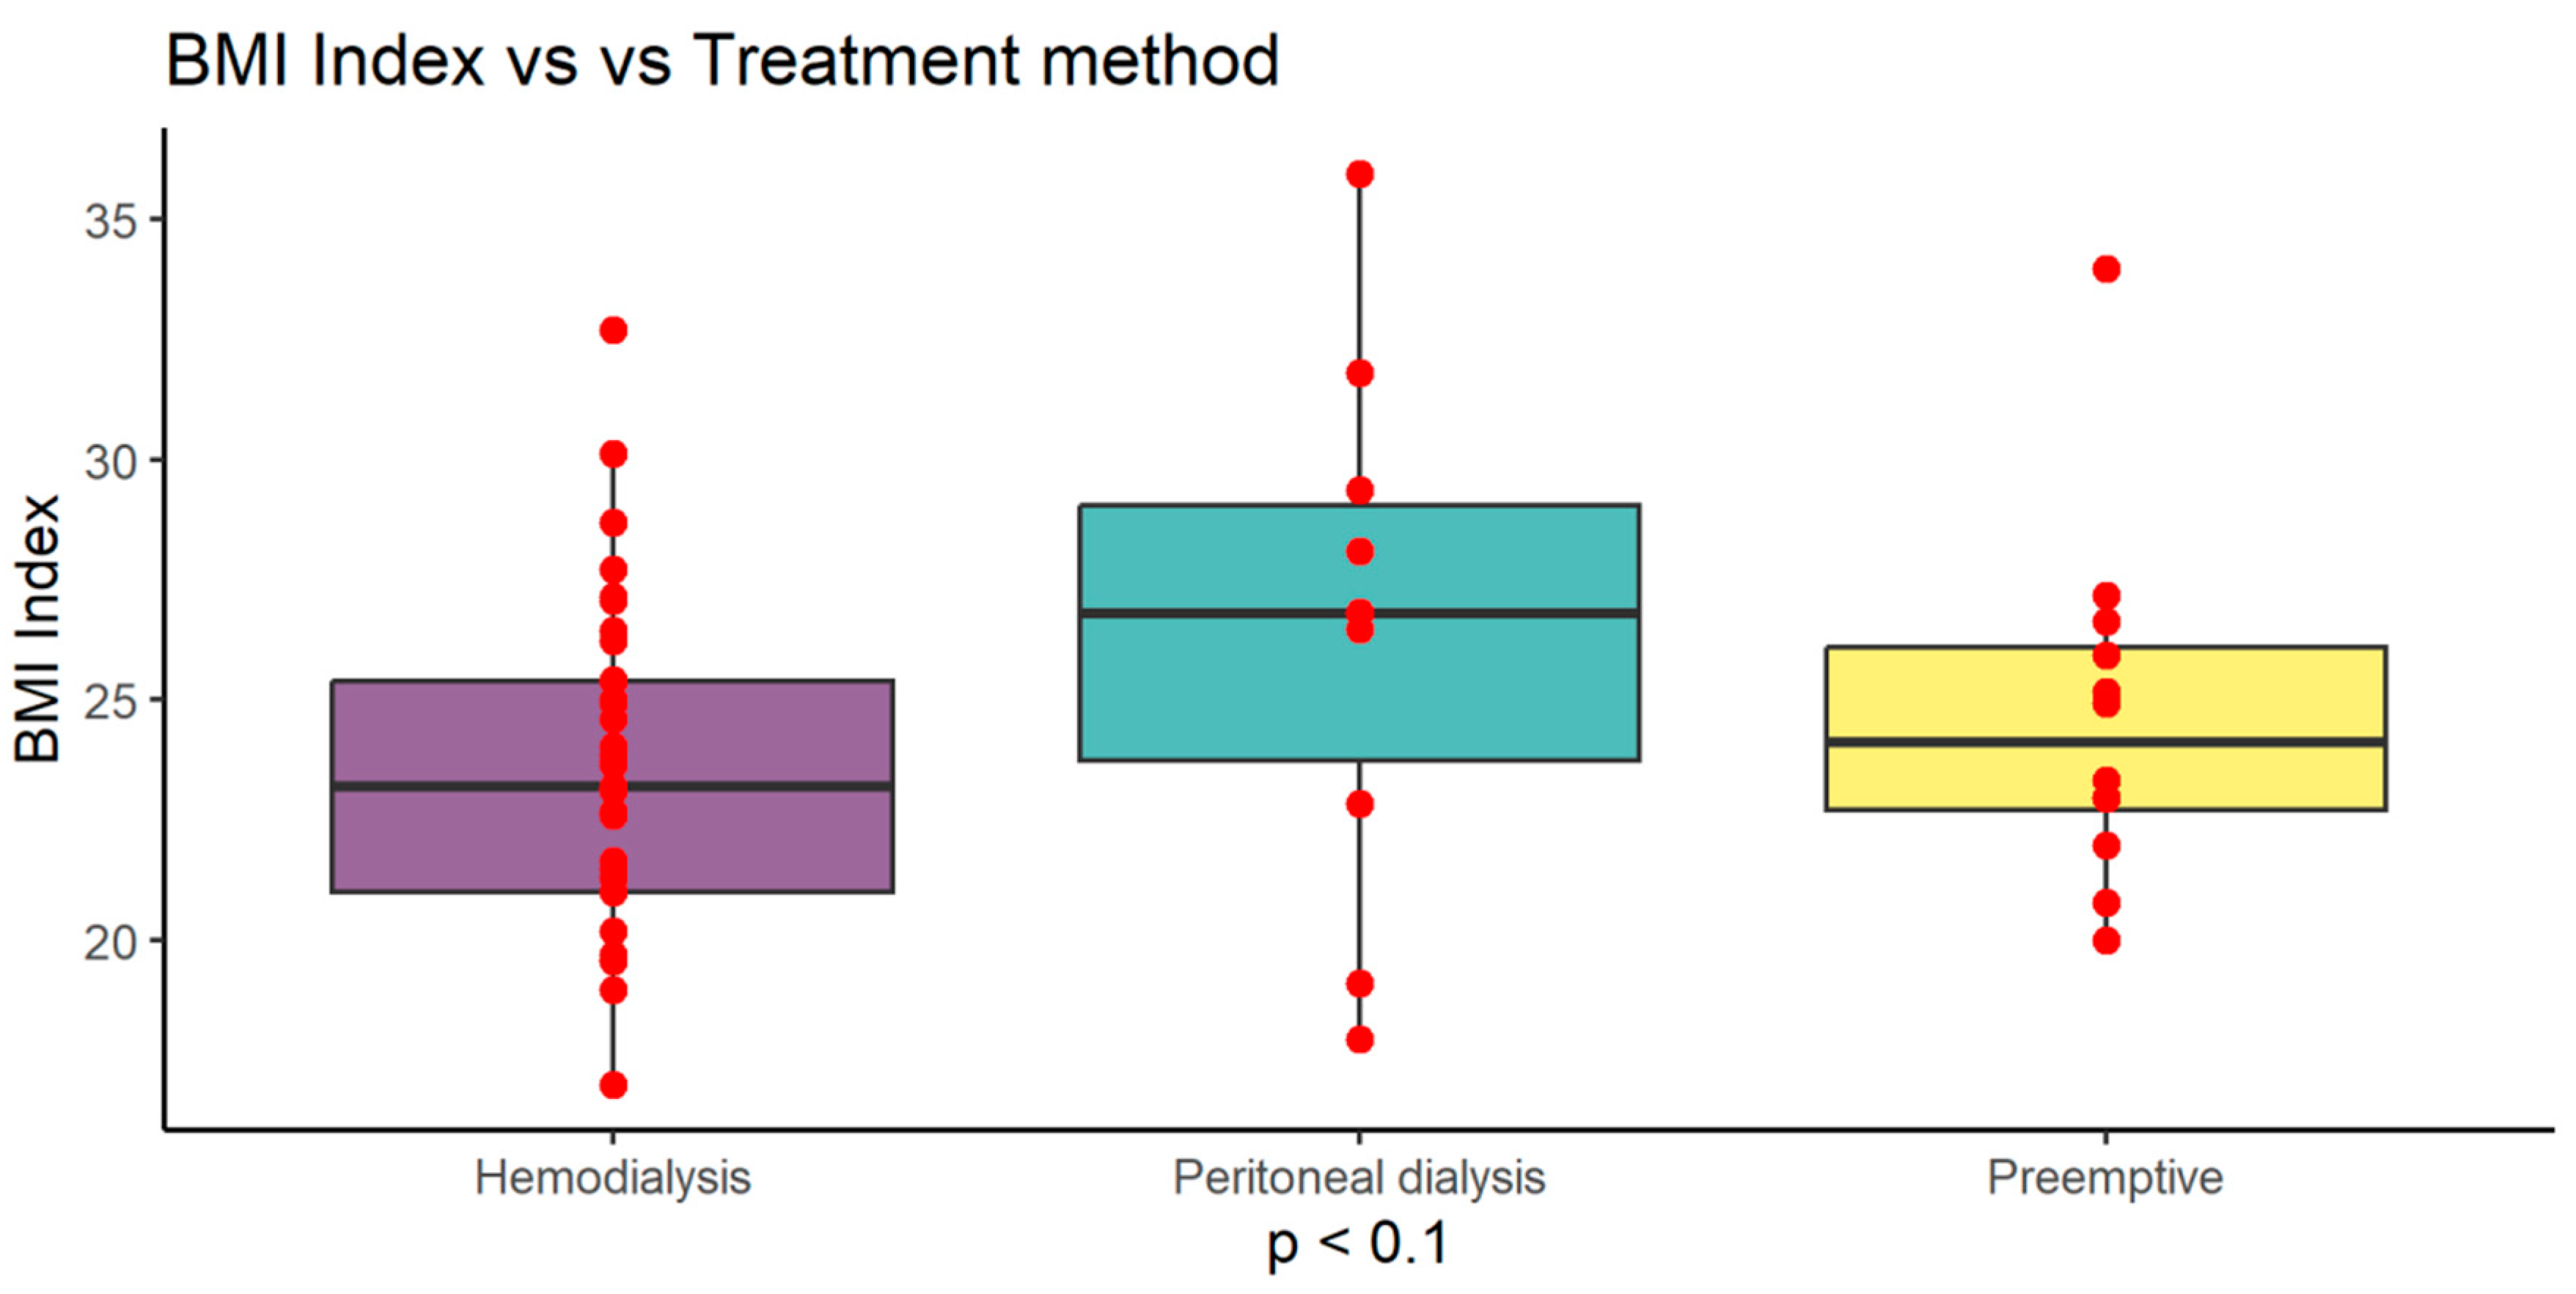
Figure 5.
Serum albumin concentration according to renal replacement treatment method in both Ktx and SPKtx groups. Values are presented as mean +SD.
Figure 5.
Serum albumin concentration according to renal replacement treatment method in both Ktx and SPKtx groups. Values are presented as mean +SD.
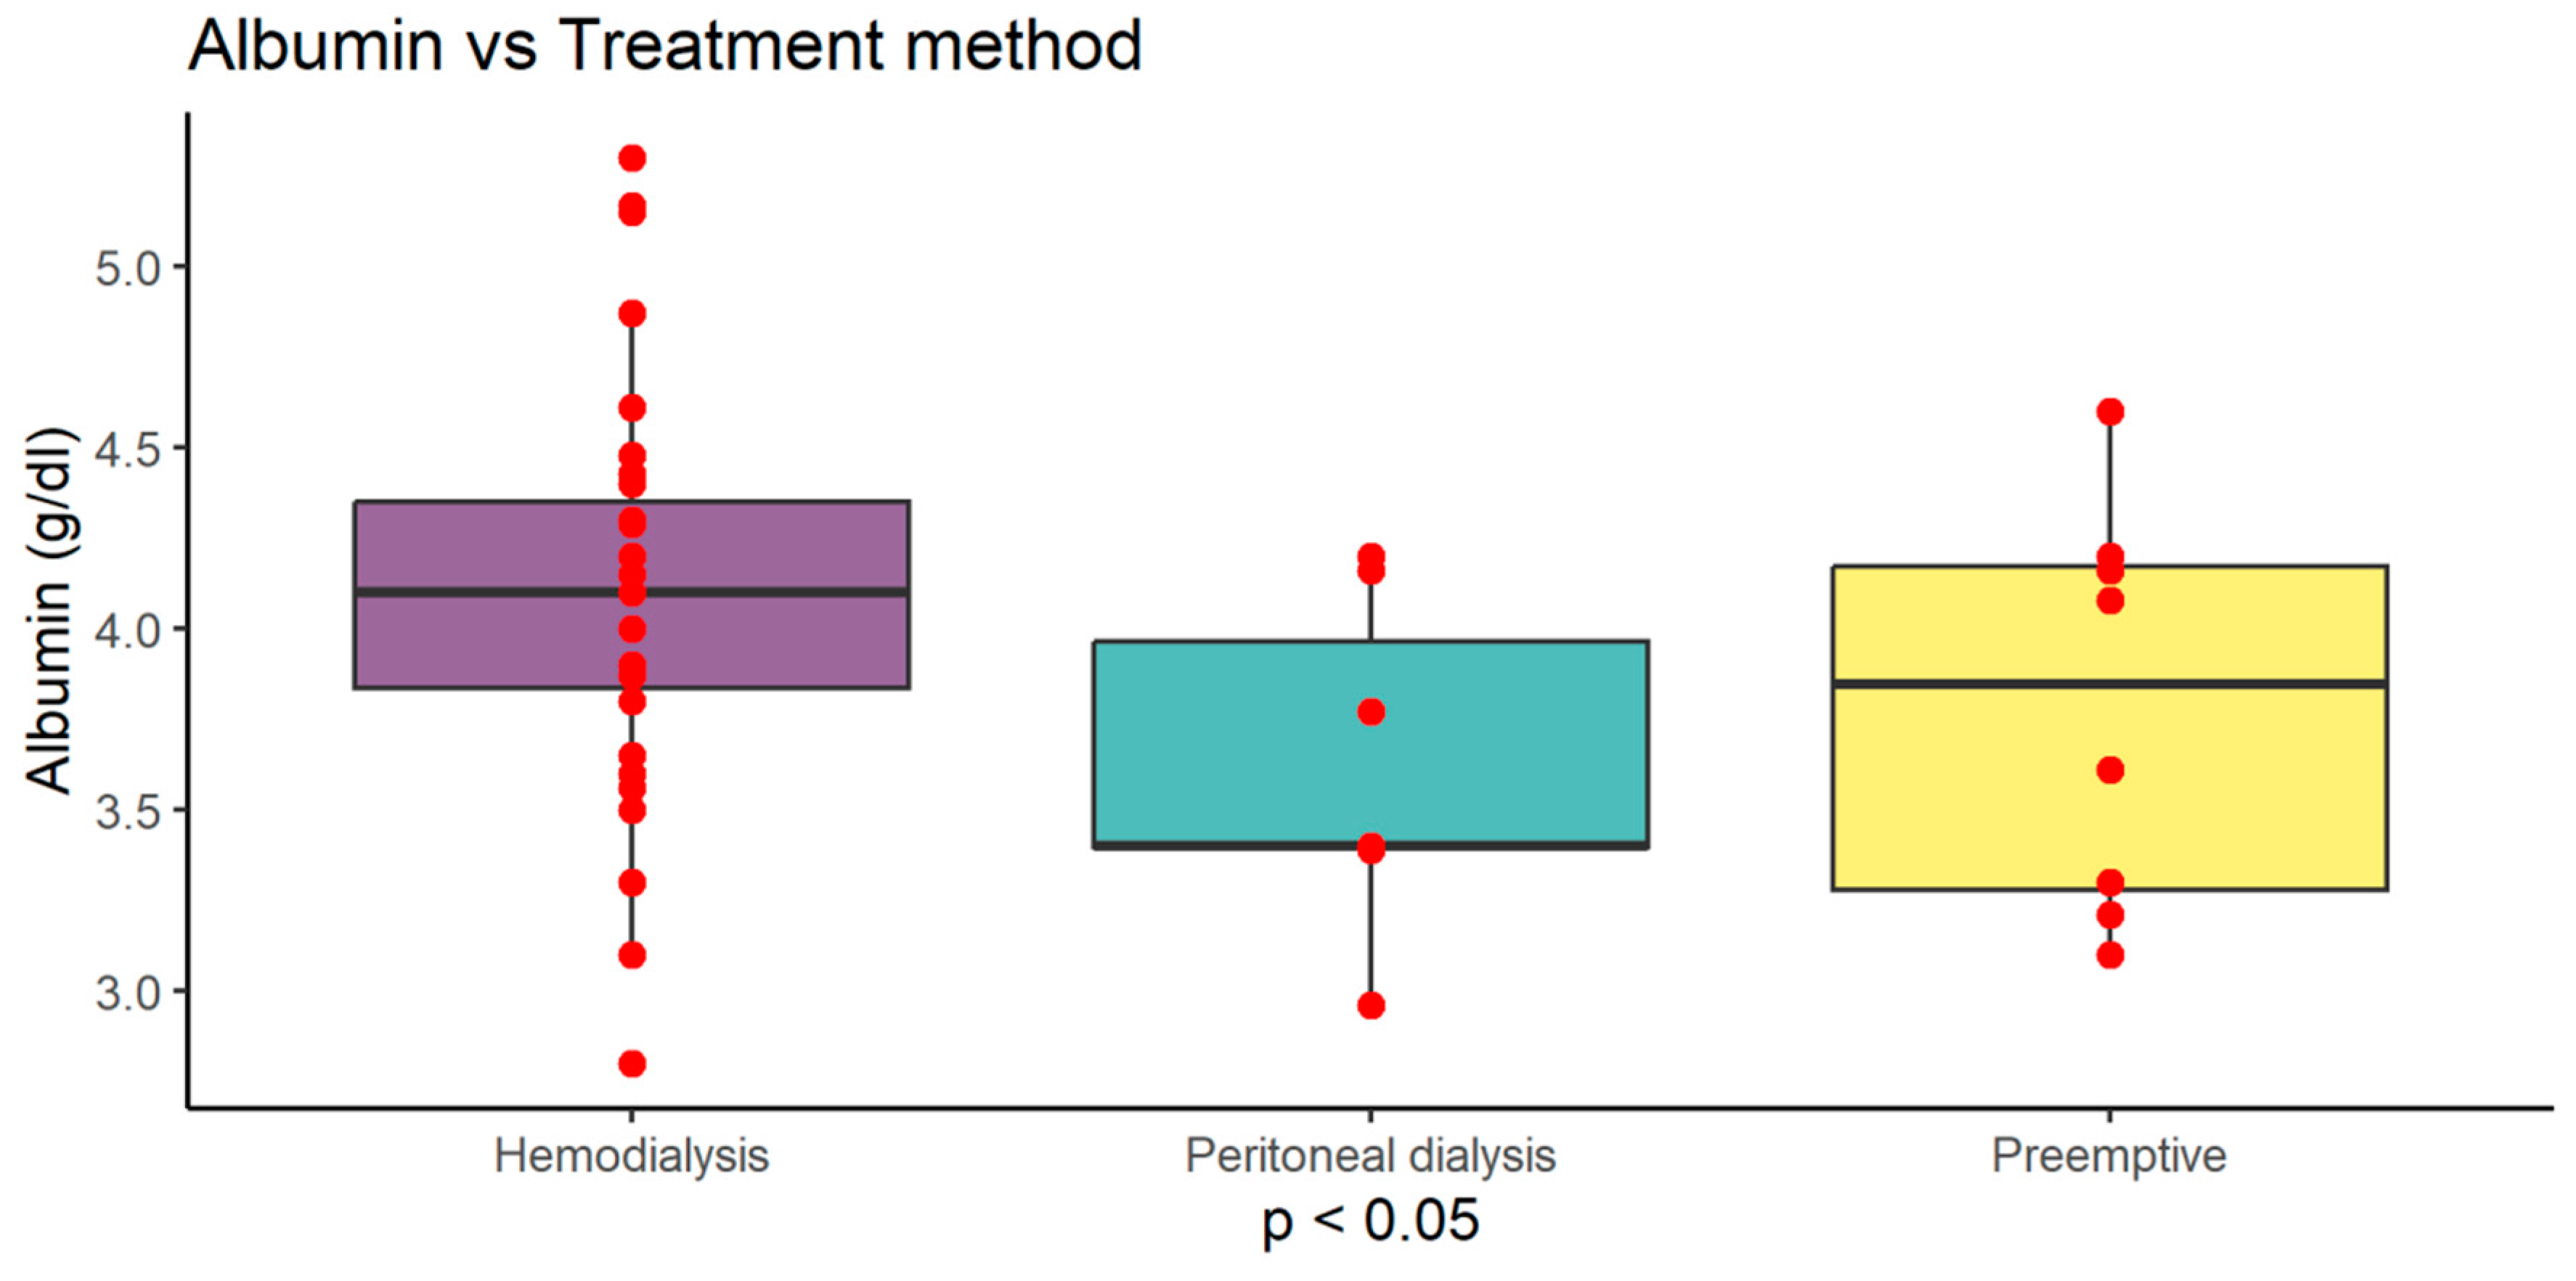
Figure 6.
Serum protein concentration according to renal replacement treatment method in both Ktx and SPKtx groups.
Figure 6.
Serum protein concentration according to renal replacement treatment method in both Ktx and SPKtx groups.
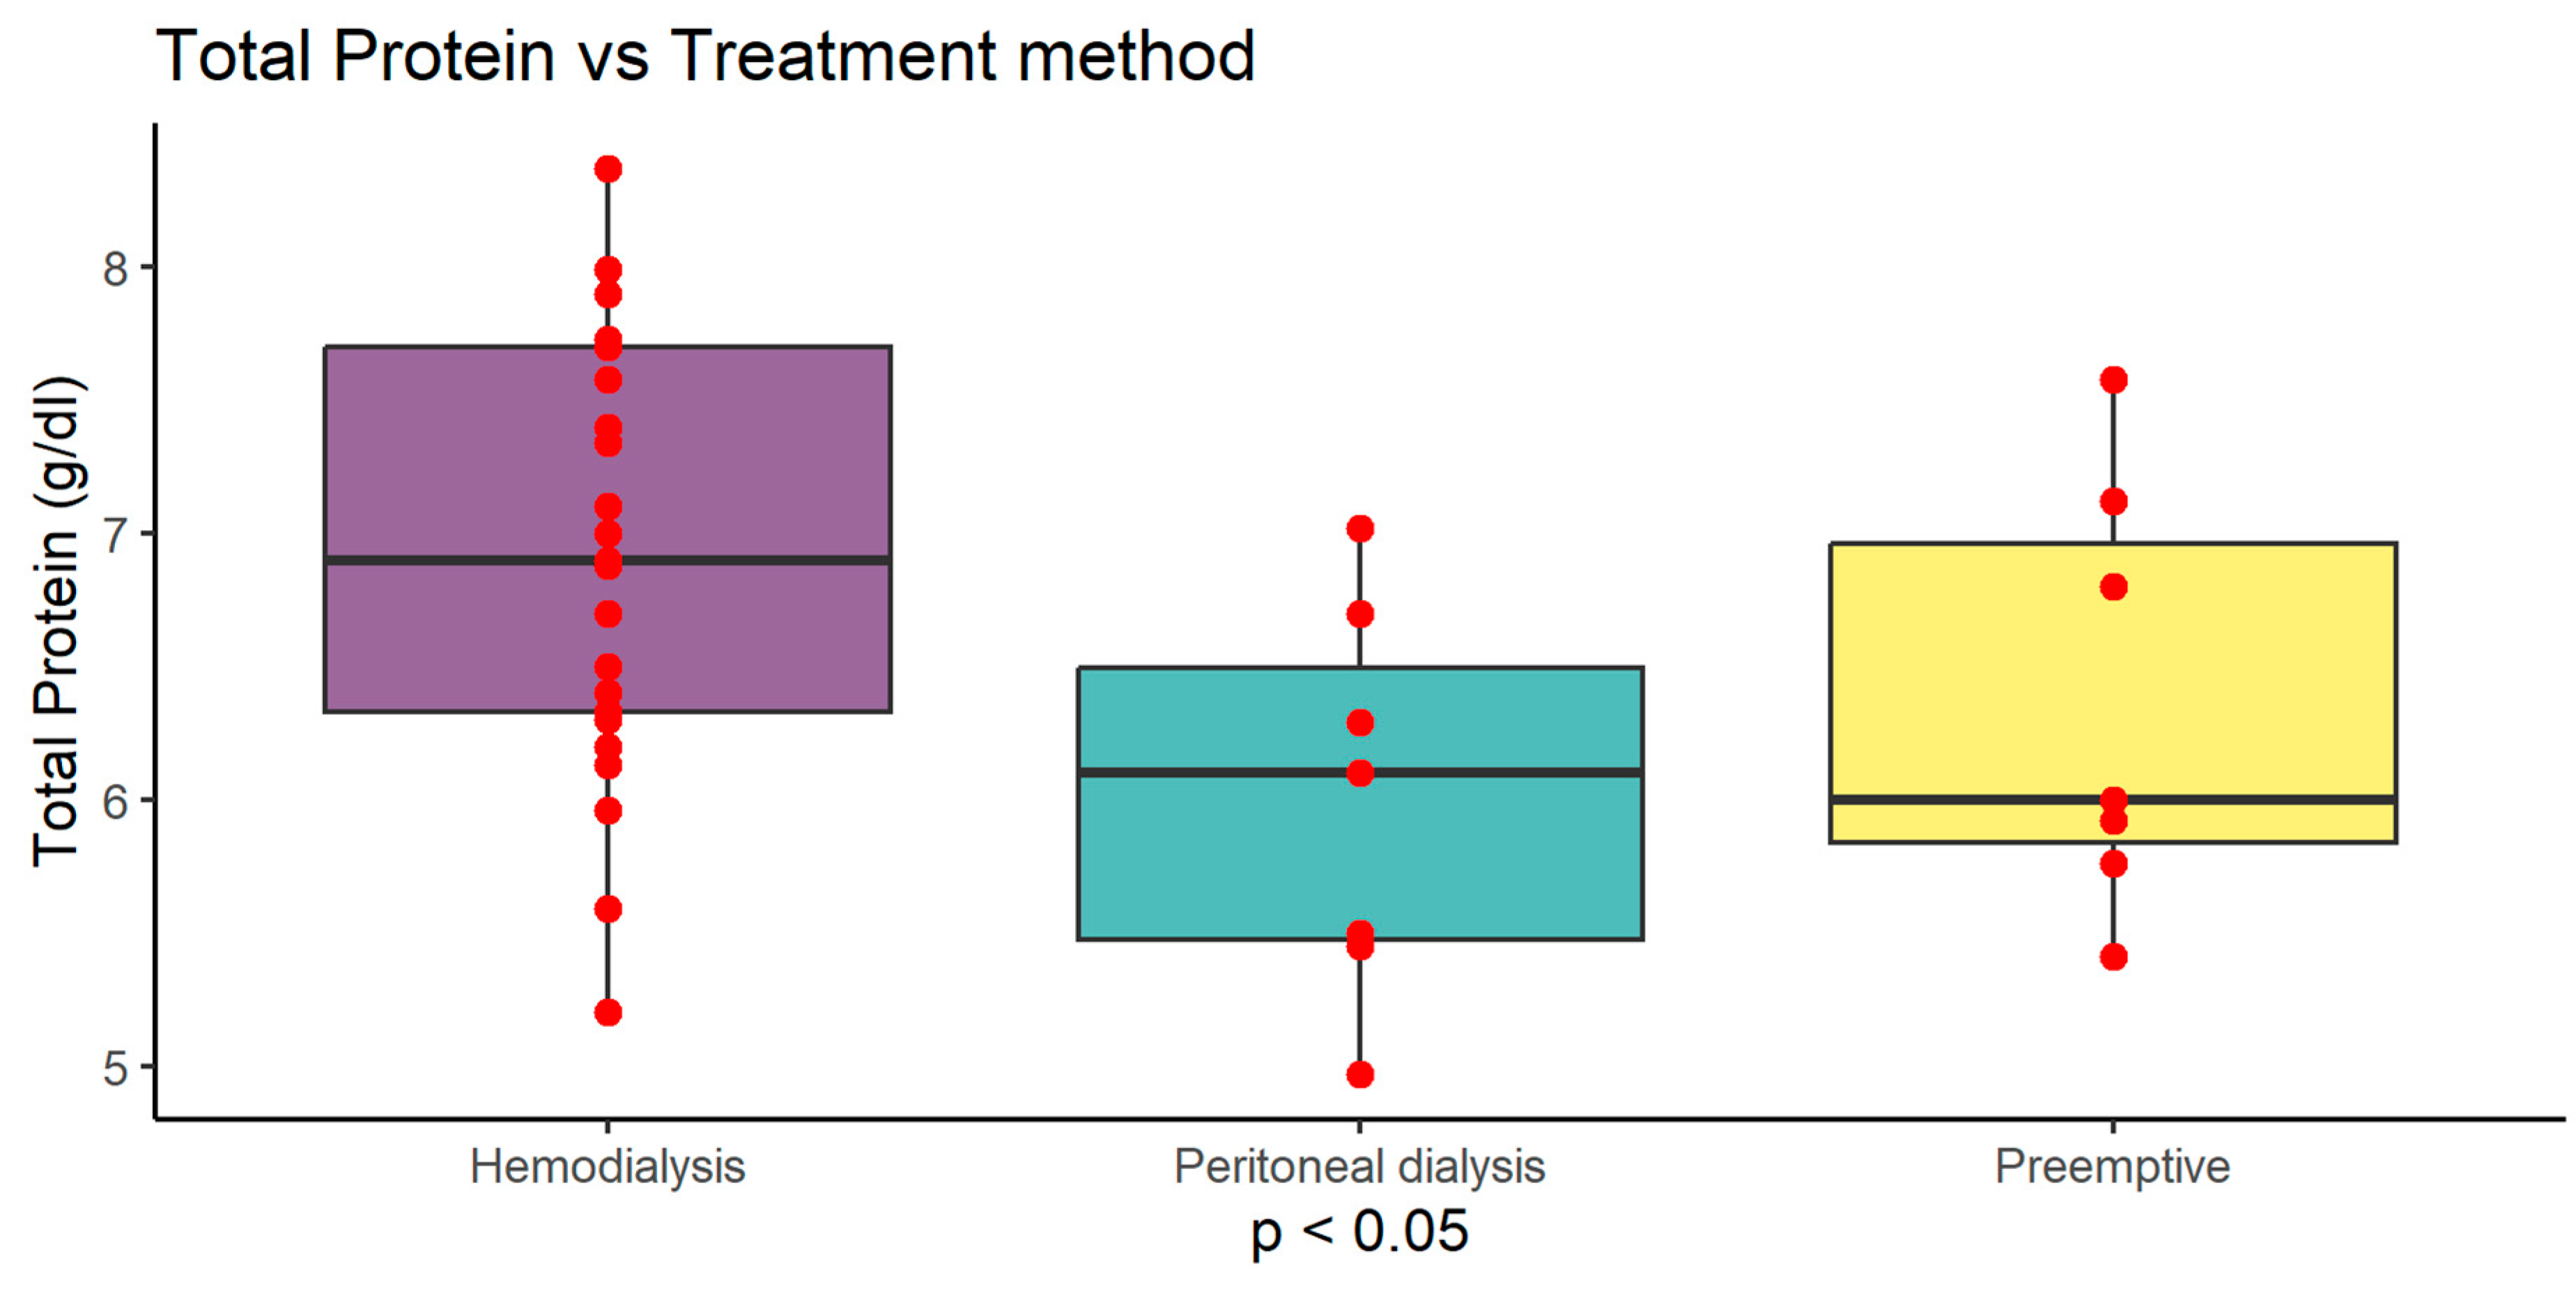
Figure 7.
Mean corpuscular volume (fl) according to renal replacement treatment method in both Ktx and SPKtx groups. Values are presented as mean +SD.
Figure 7.
Mean corpuscular volume (fl) according to renal replacement treatment method in both Ktx and SPKtx groups. Values are presented as mean +SD.
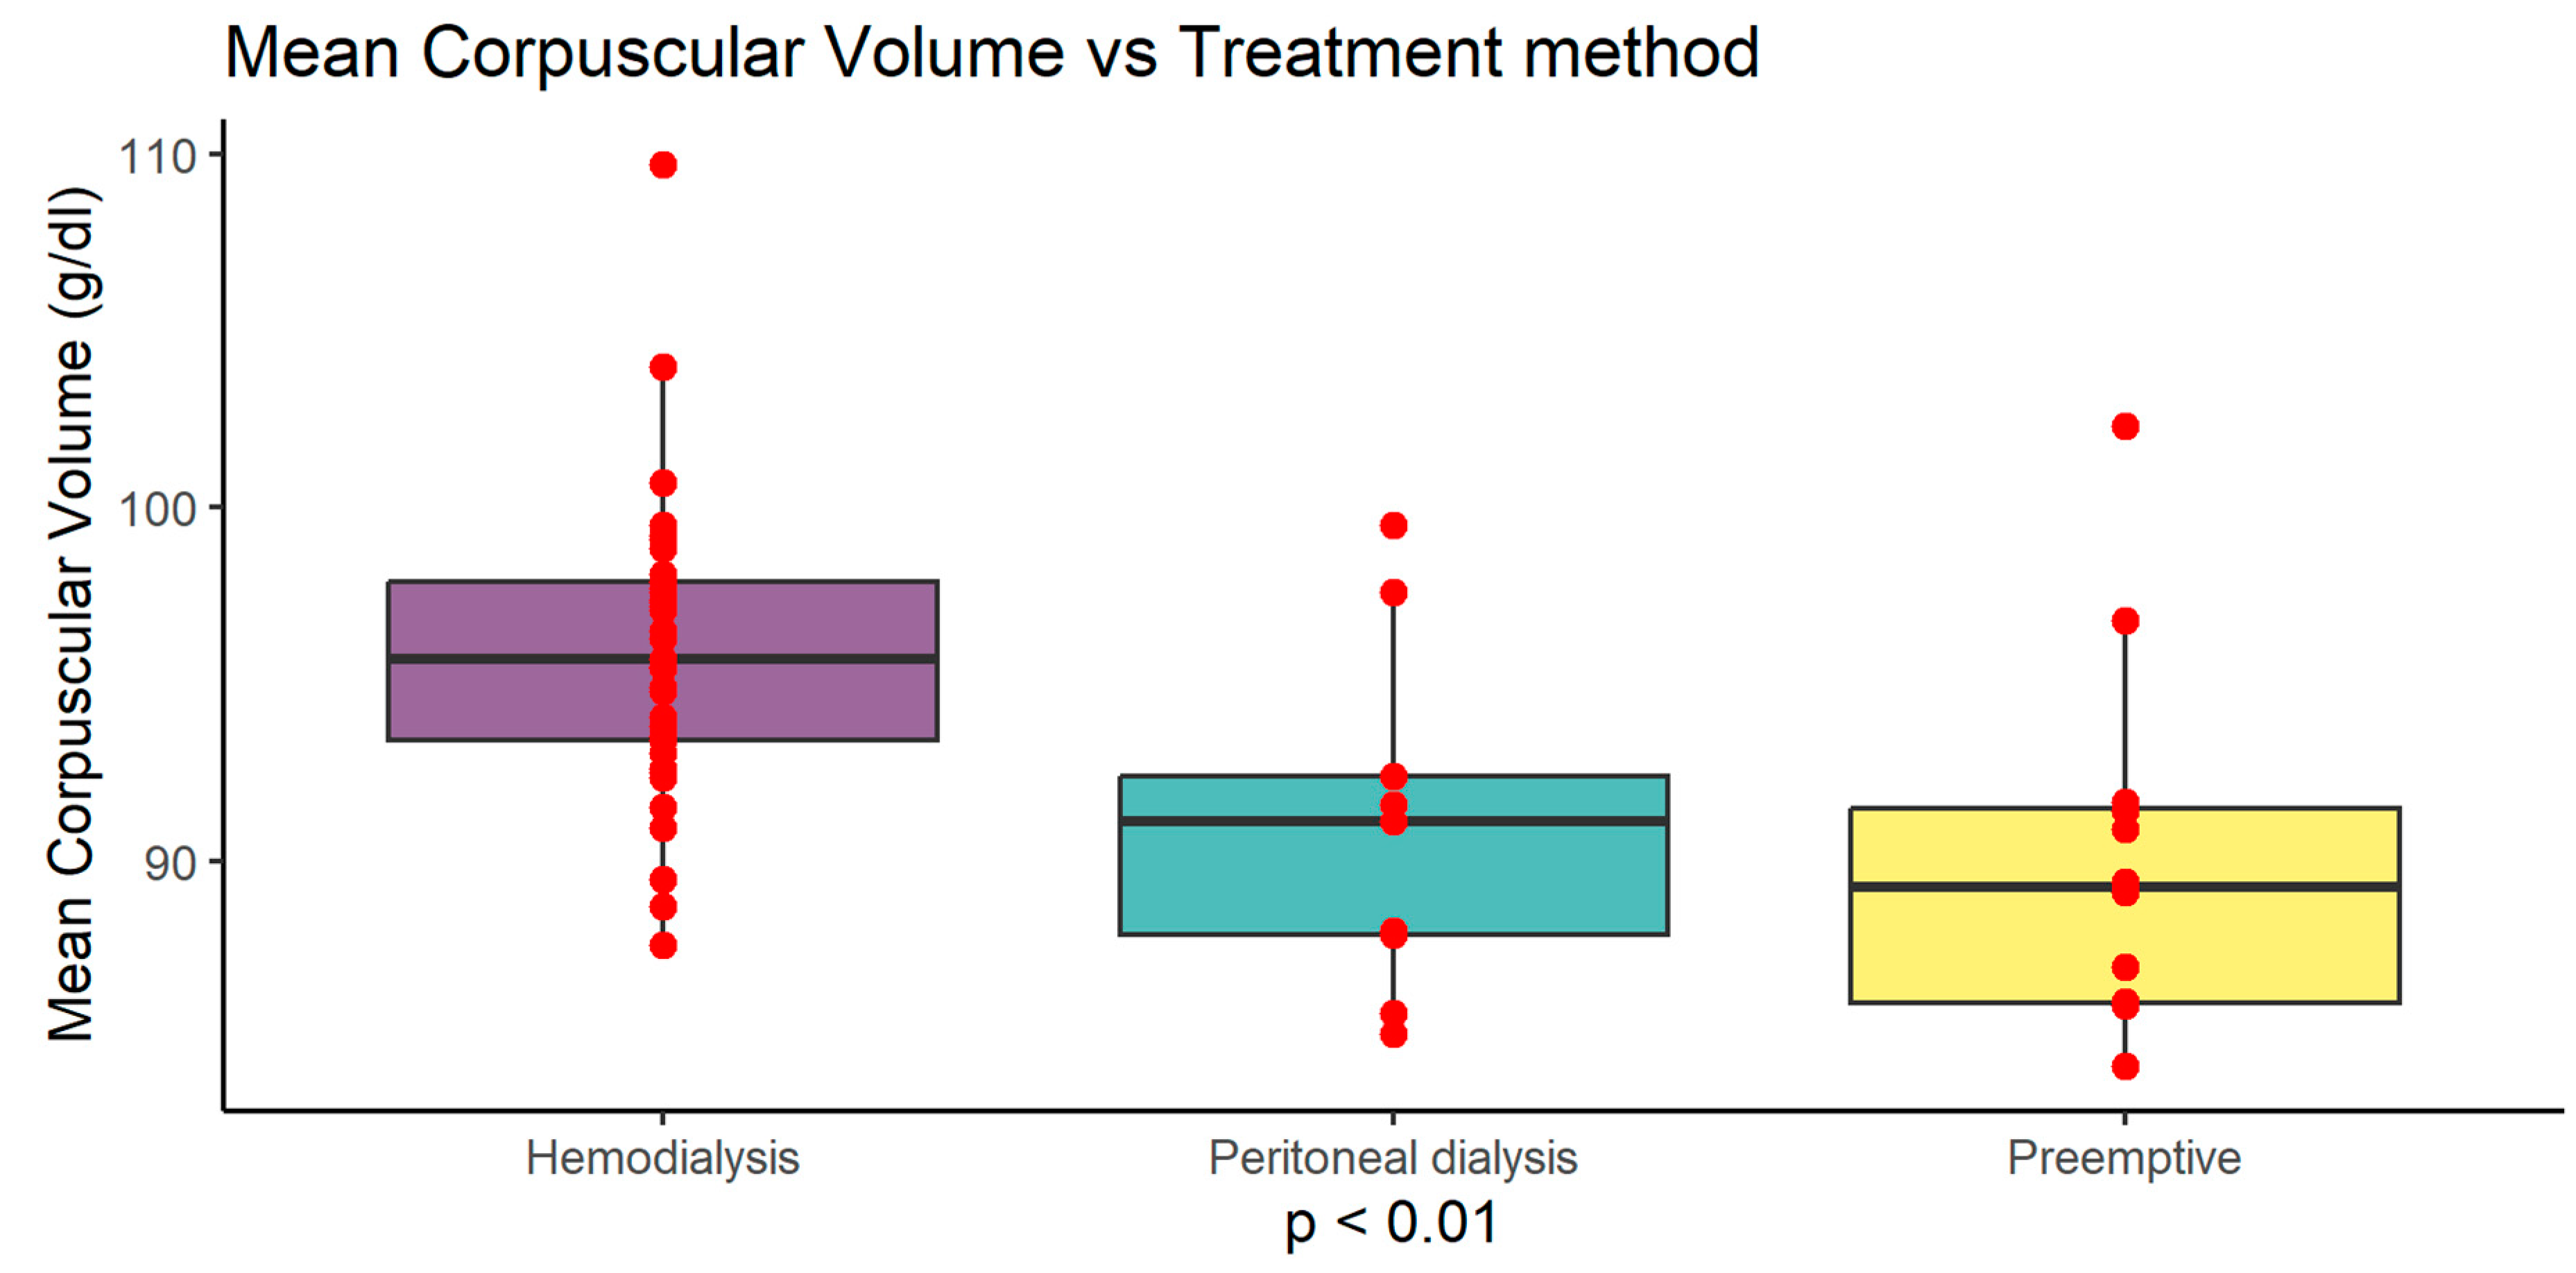
Figure 8.
Prognostic Nutritional Index Oonder (PNIO) according to renal replacement treatment method in both Ktx and SPKtx groups. Values are presented as mean +SD.
Figure 8.
Prognostic Nutritional Index Oonder (PNIO) according to renal replacement treatment method in both Ktx and SPKtx groups. Values are presented as mean +SD.
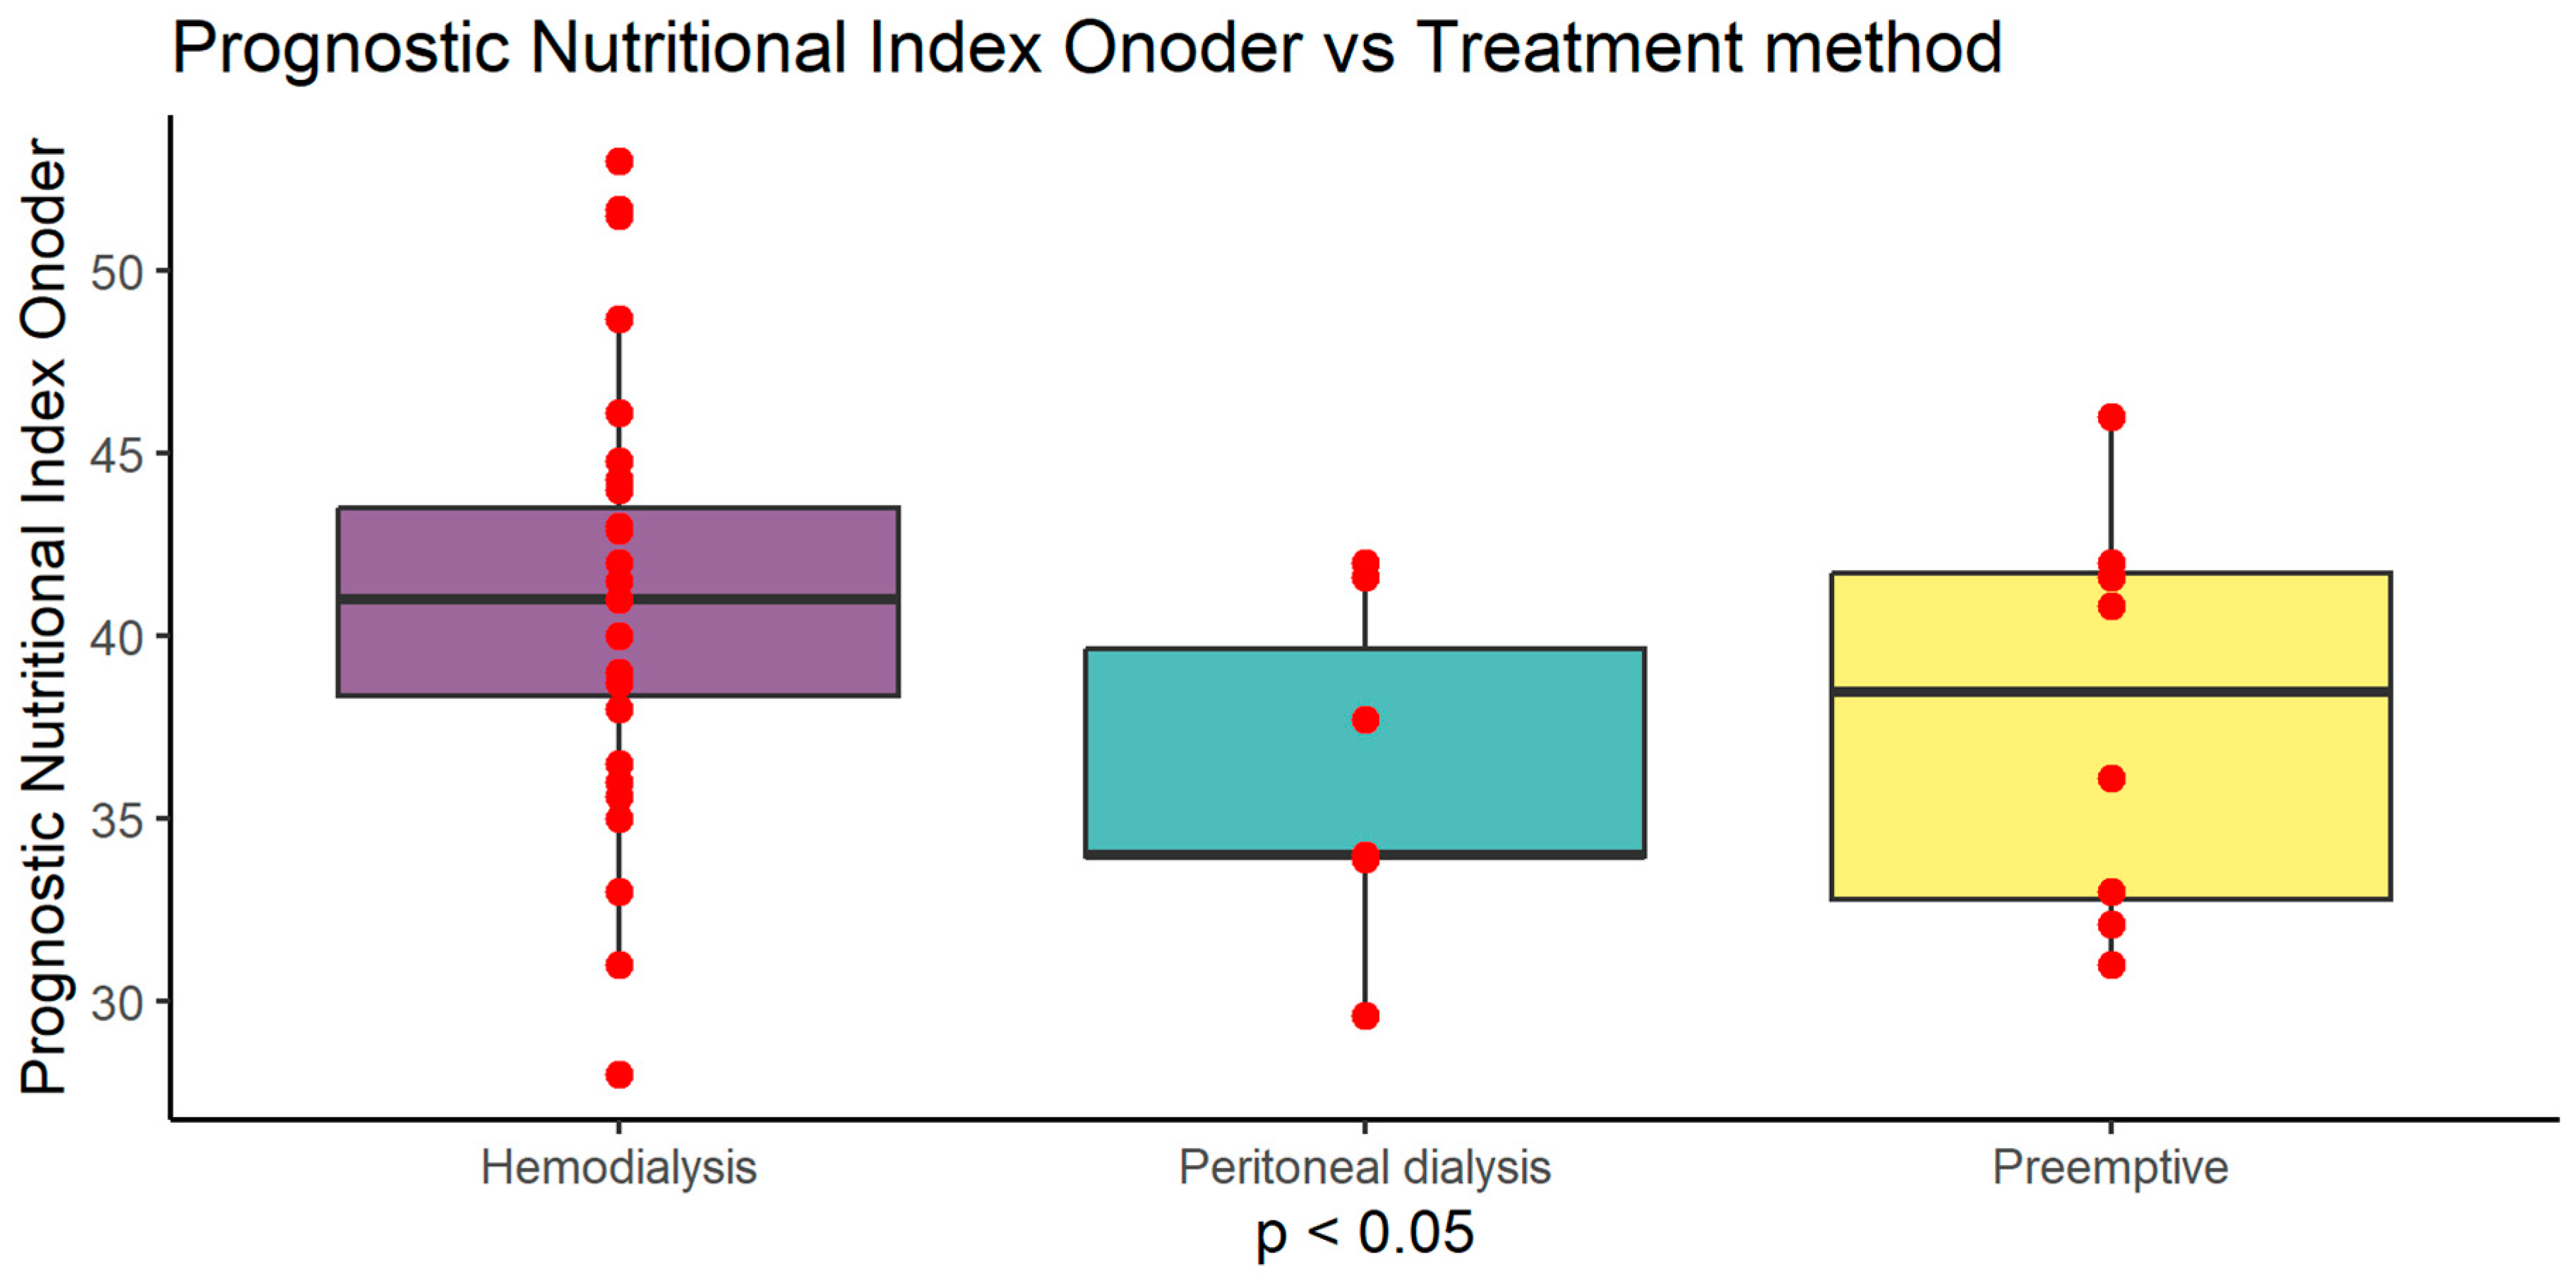
Figure 9.
Correlation of the PNIO (Prognostic Nutritional Index Onoder's) index with the concentration of total protein in the serum in the study group of patients.
Figure 9.
Correlation of the PNIO (Prognostic Nutritional Index Onoder's) index with the concentration of total protein in the serum in the study group of patients.
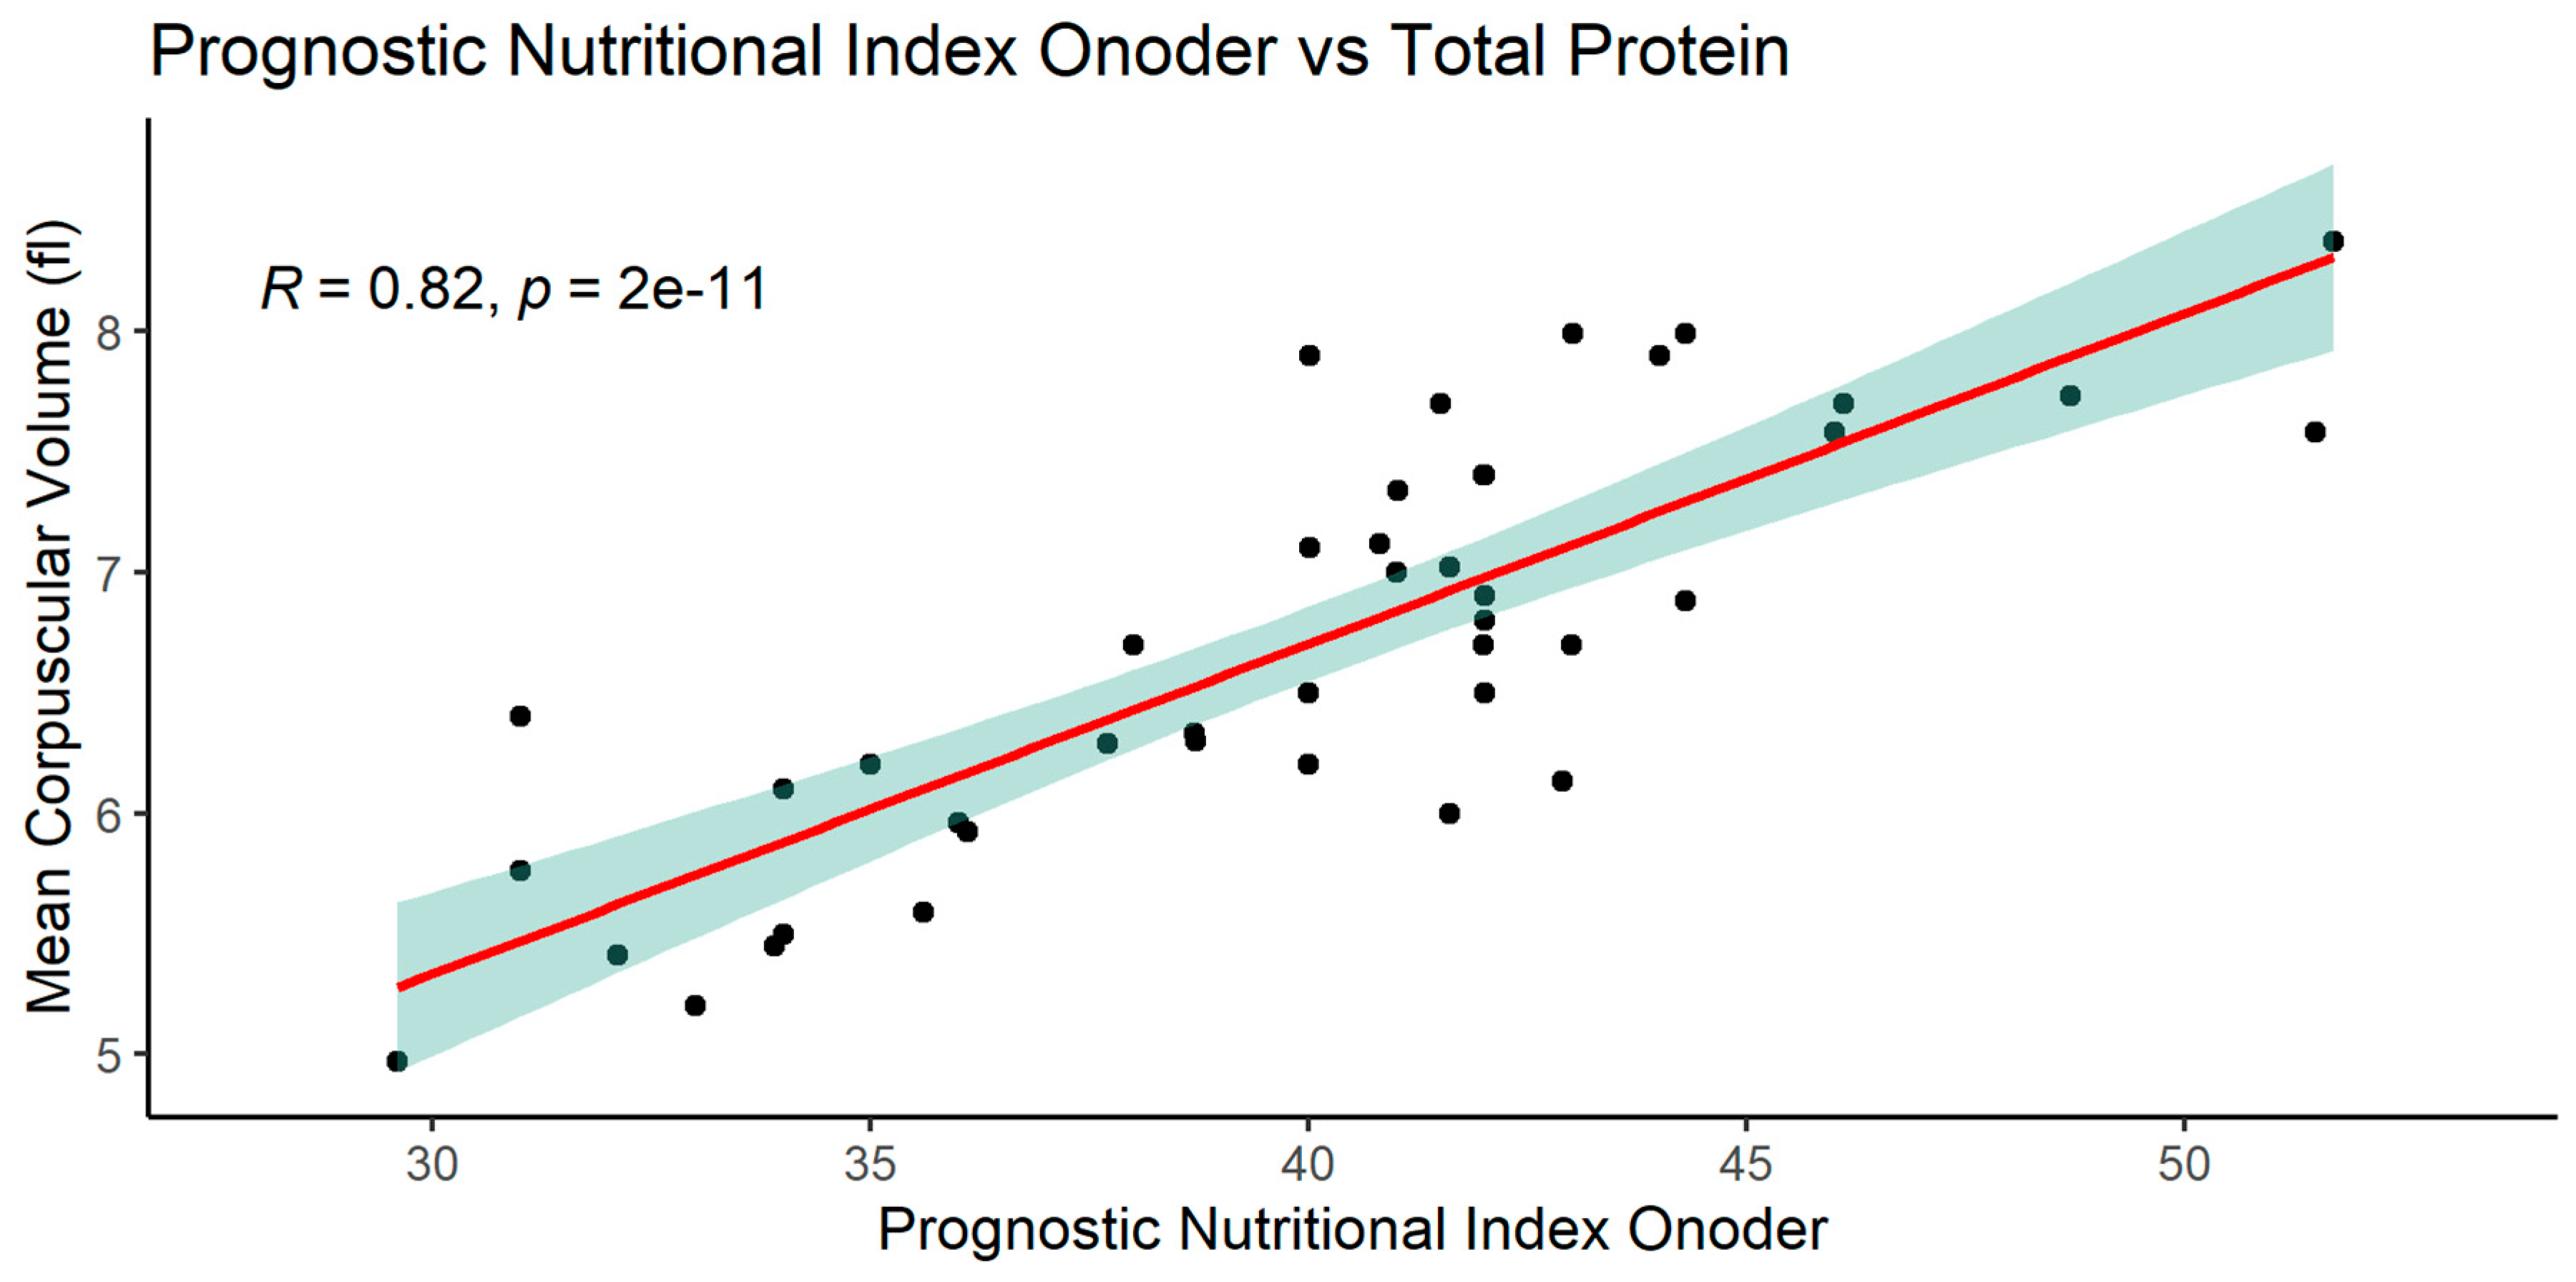
Figure 10.
Correlation of the PNIO index with the level of serum albumin in the study group of patients.
Figure 10.
Correlation of the PNIO index with the level of serum albumin in the study group of patients.
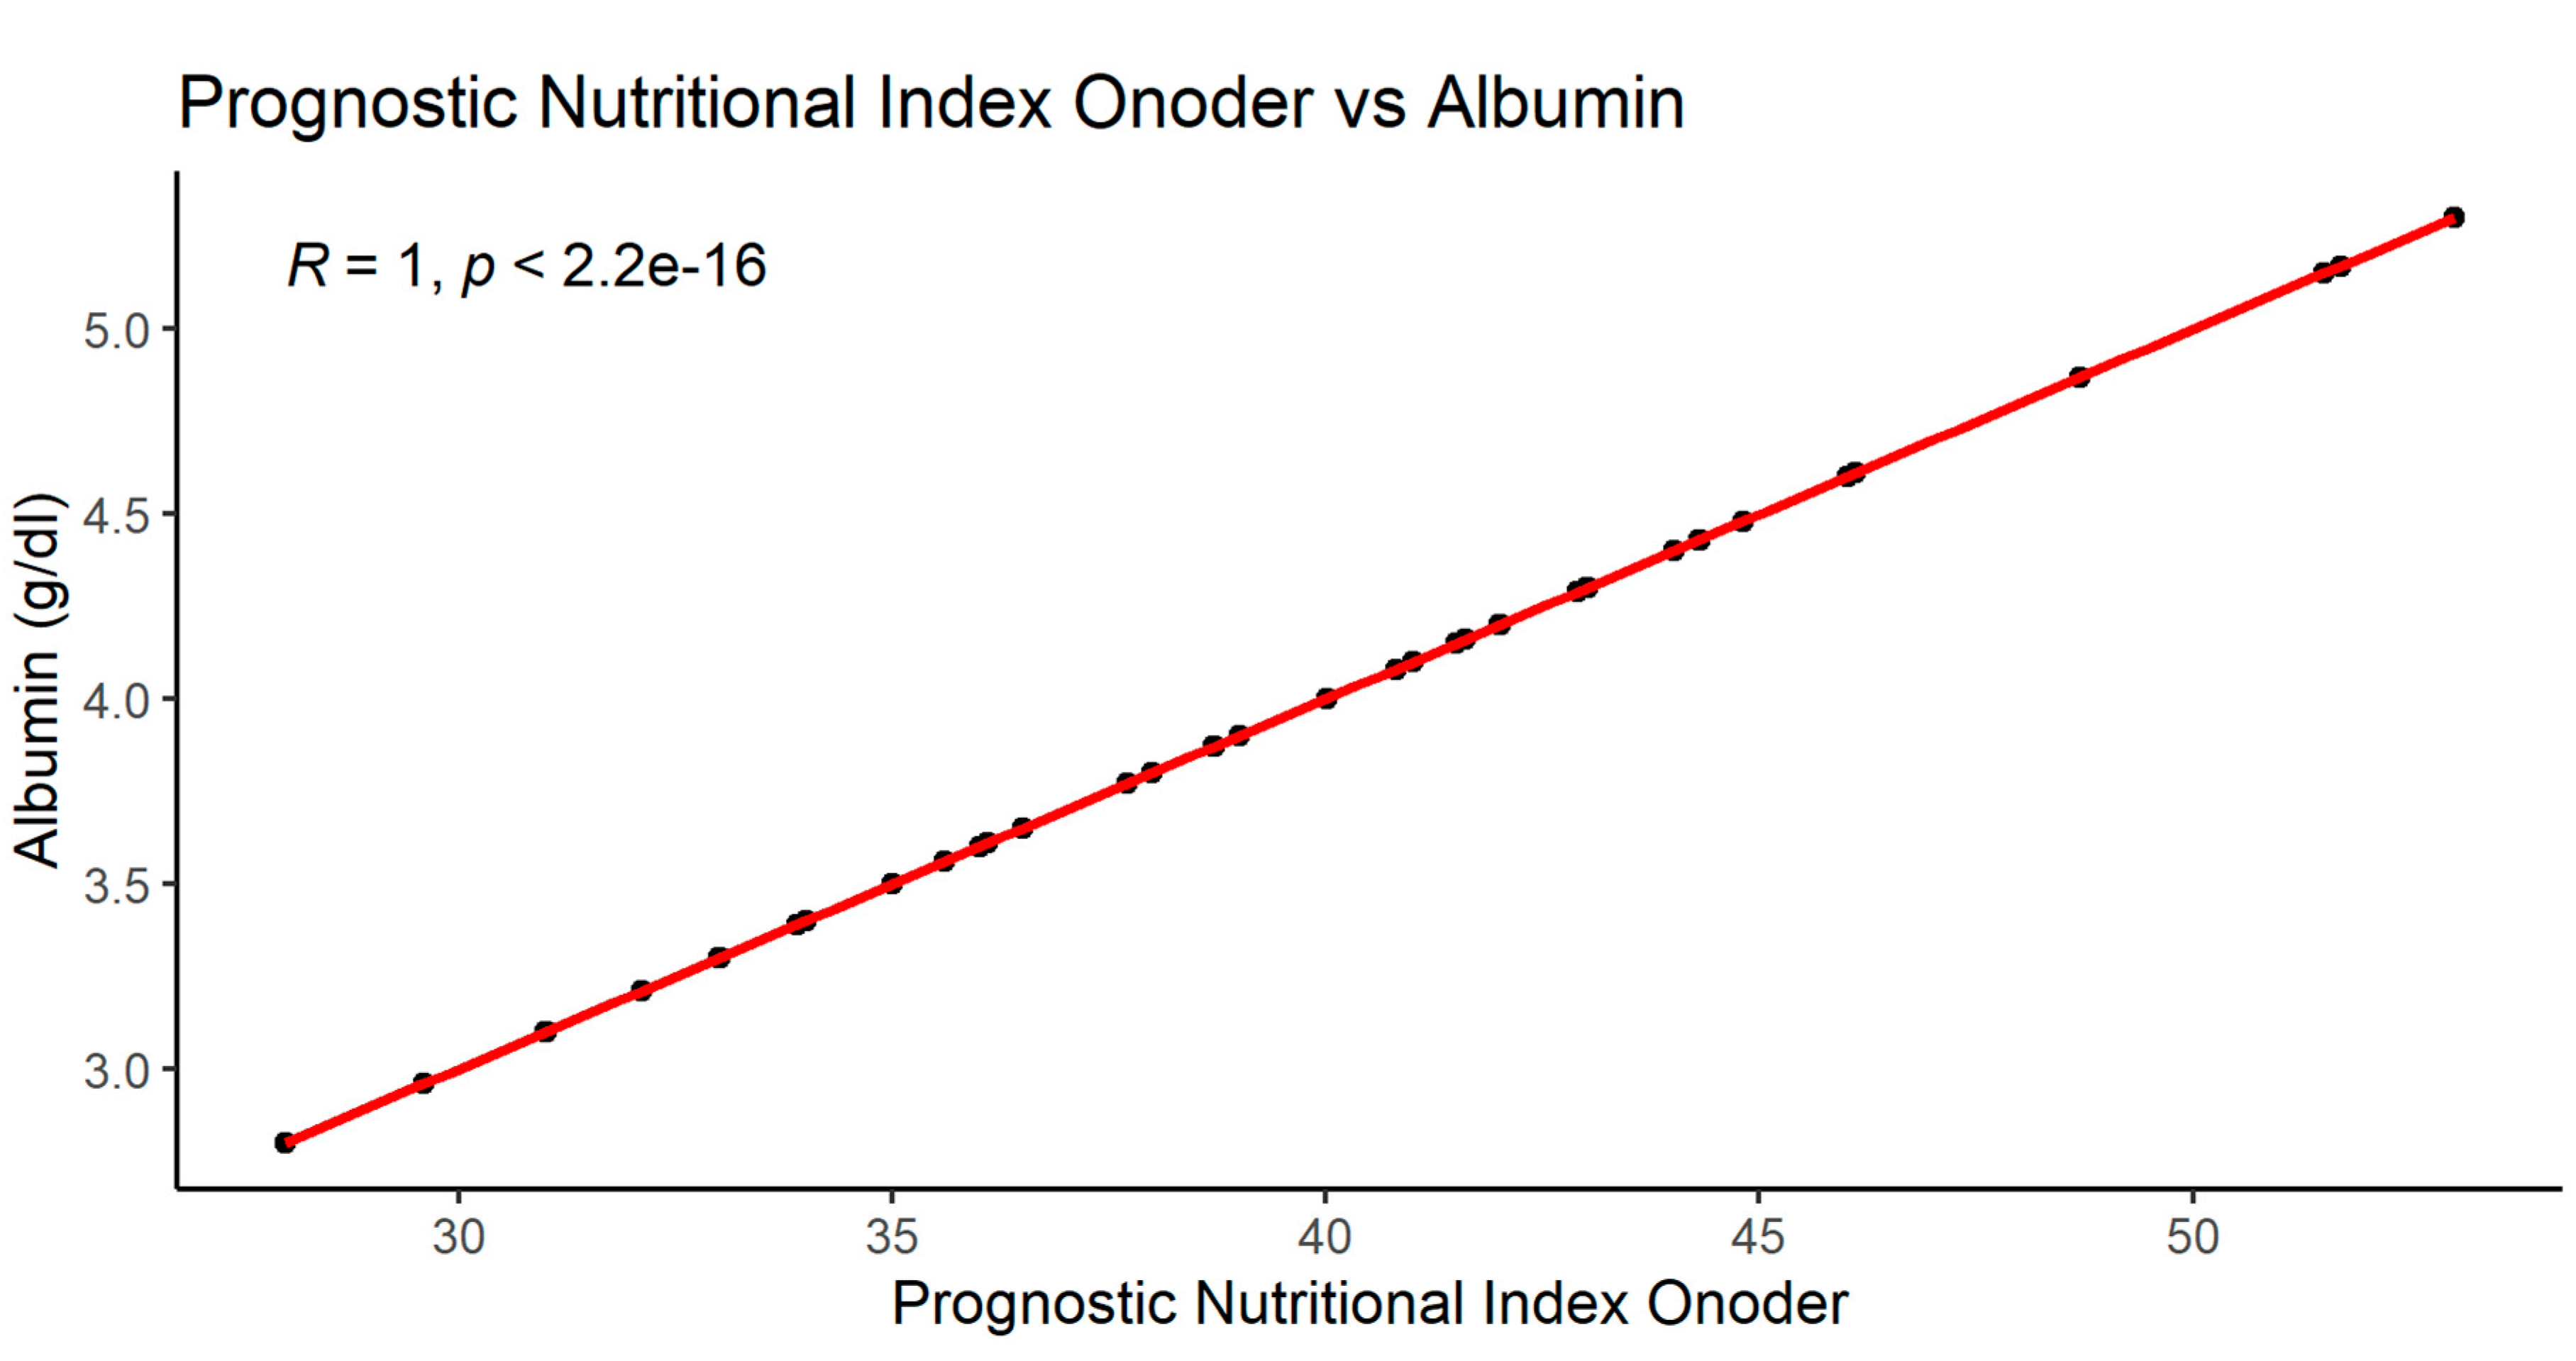
Figure 11.
Correlation of the PNIO index with the BMI in the study group of patients.
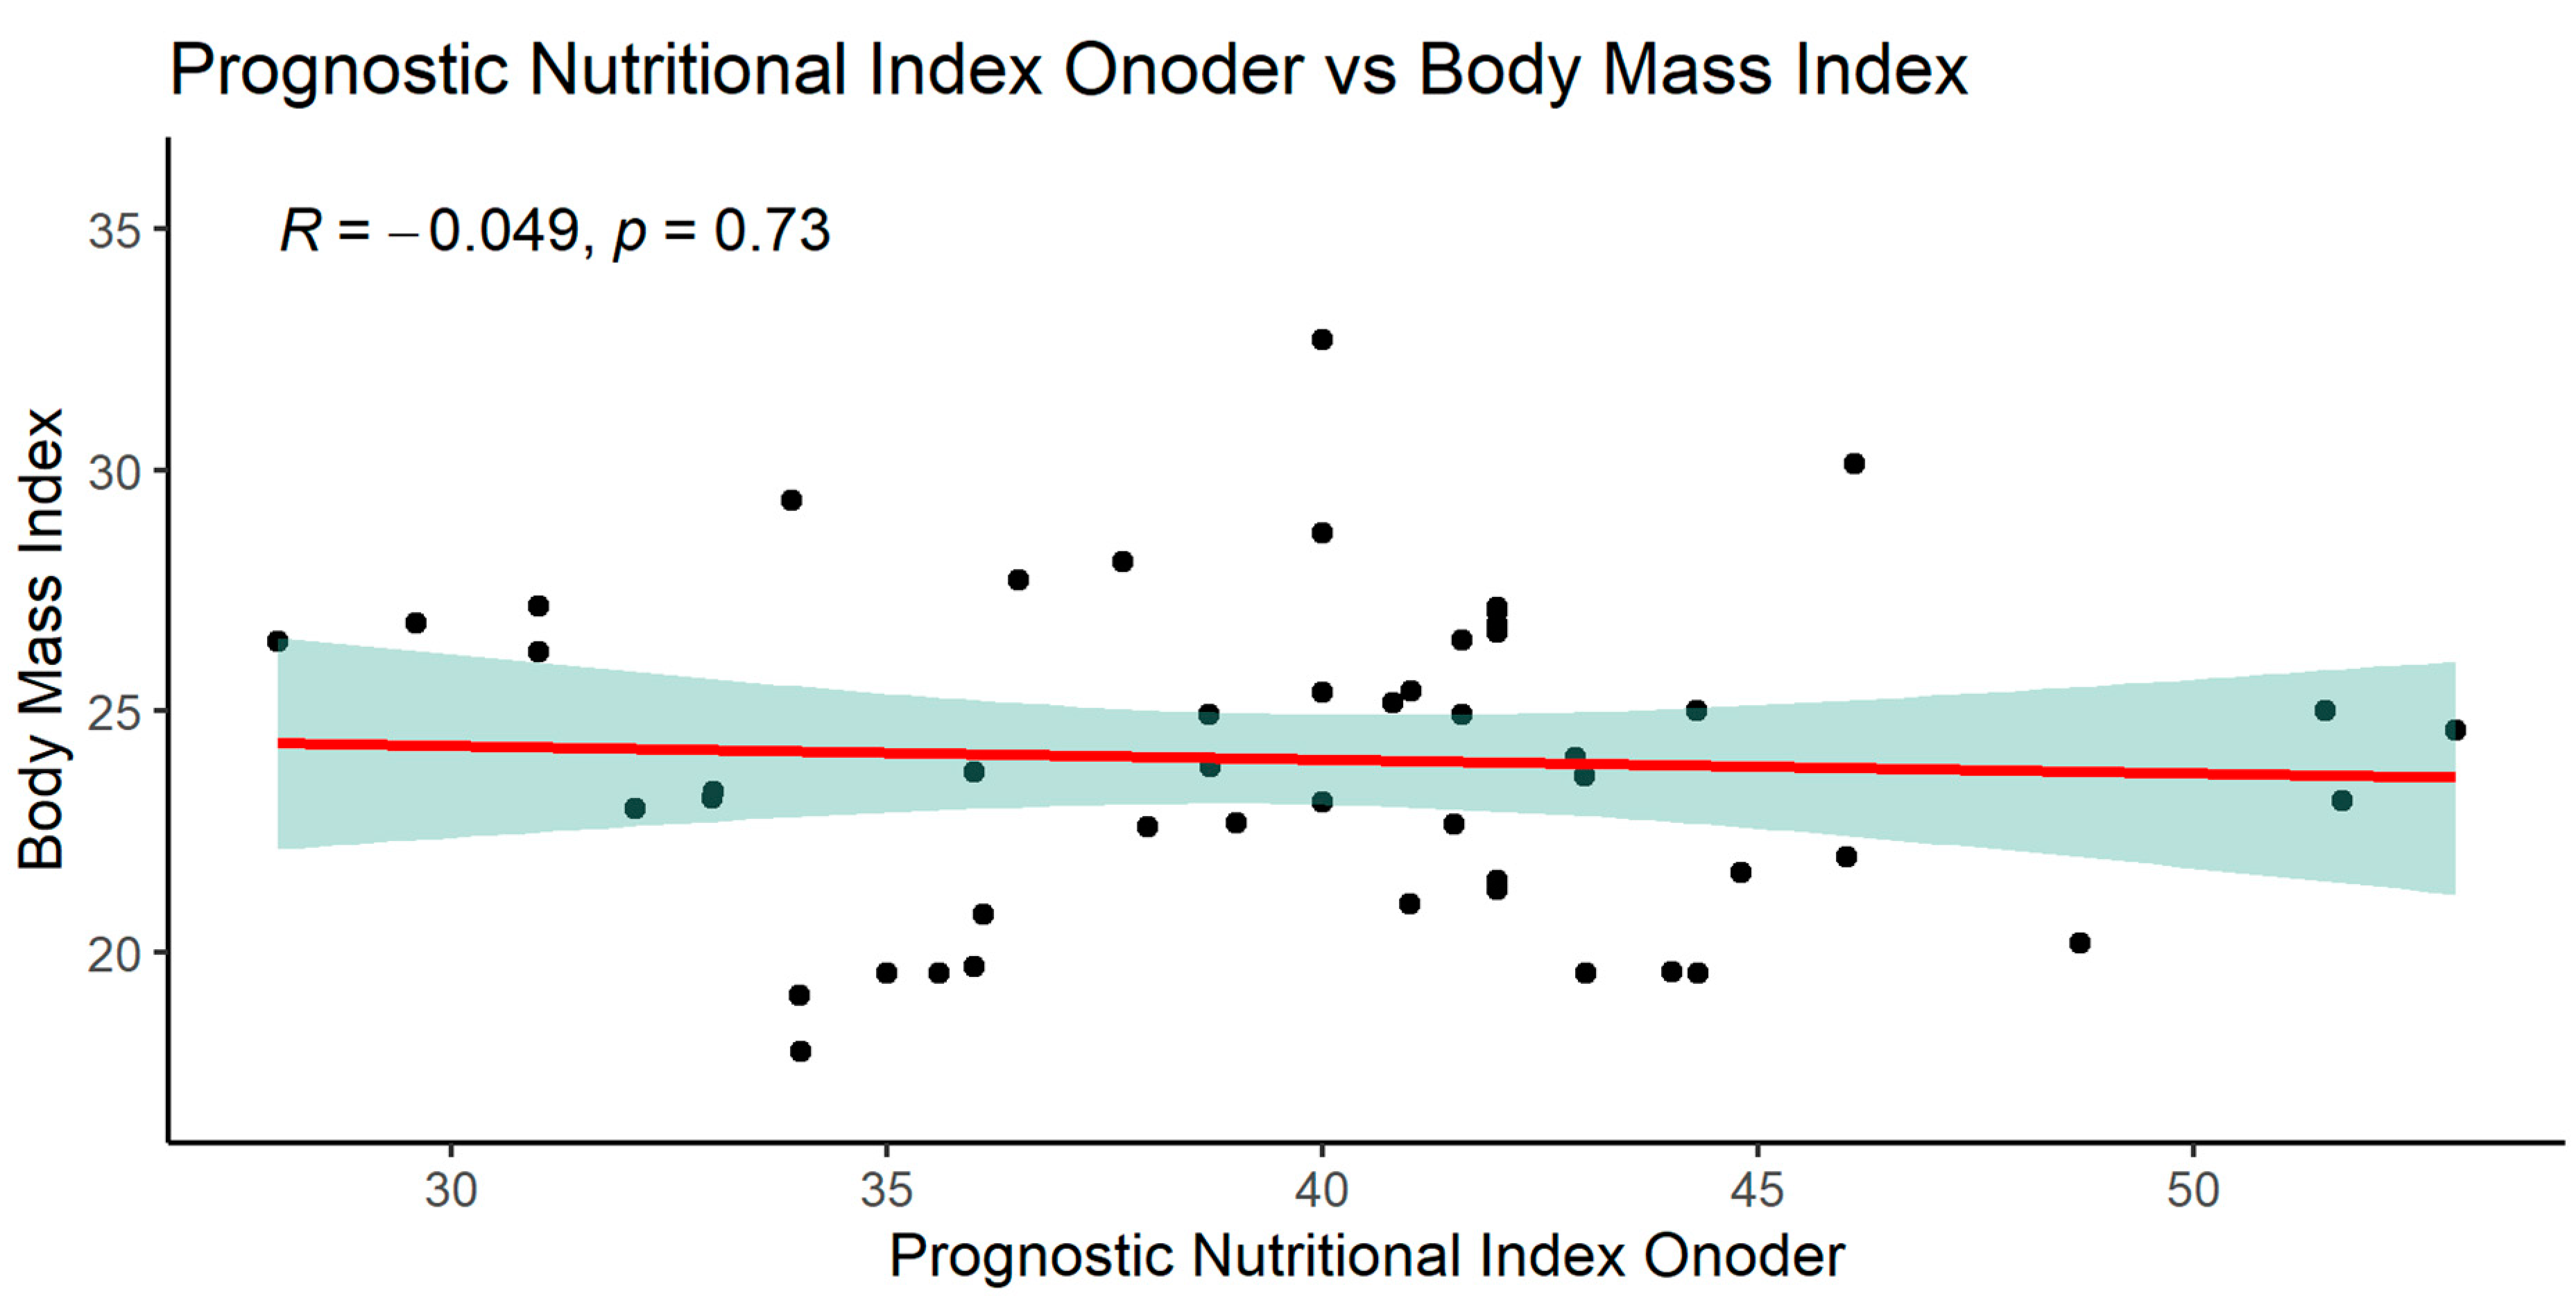
Figure 12.
Correlation of the PNIO index with the NRI in the study group of patients.
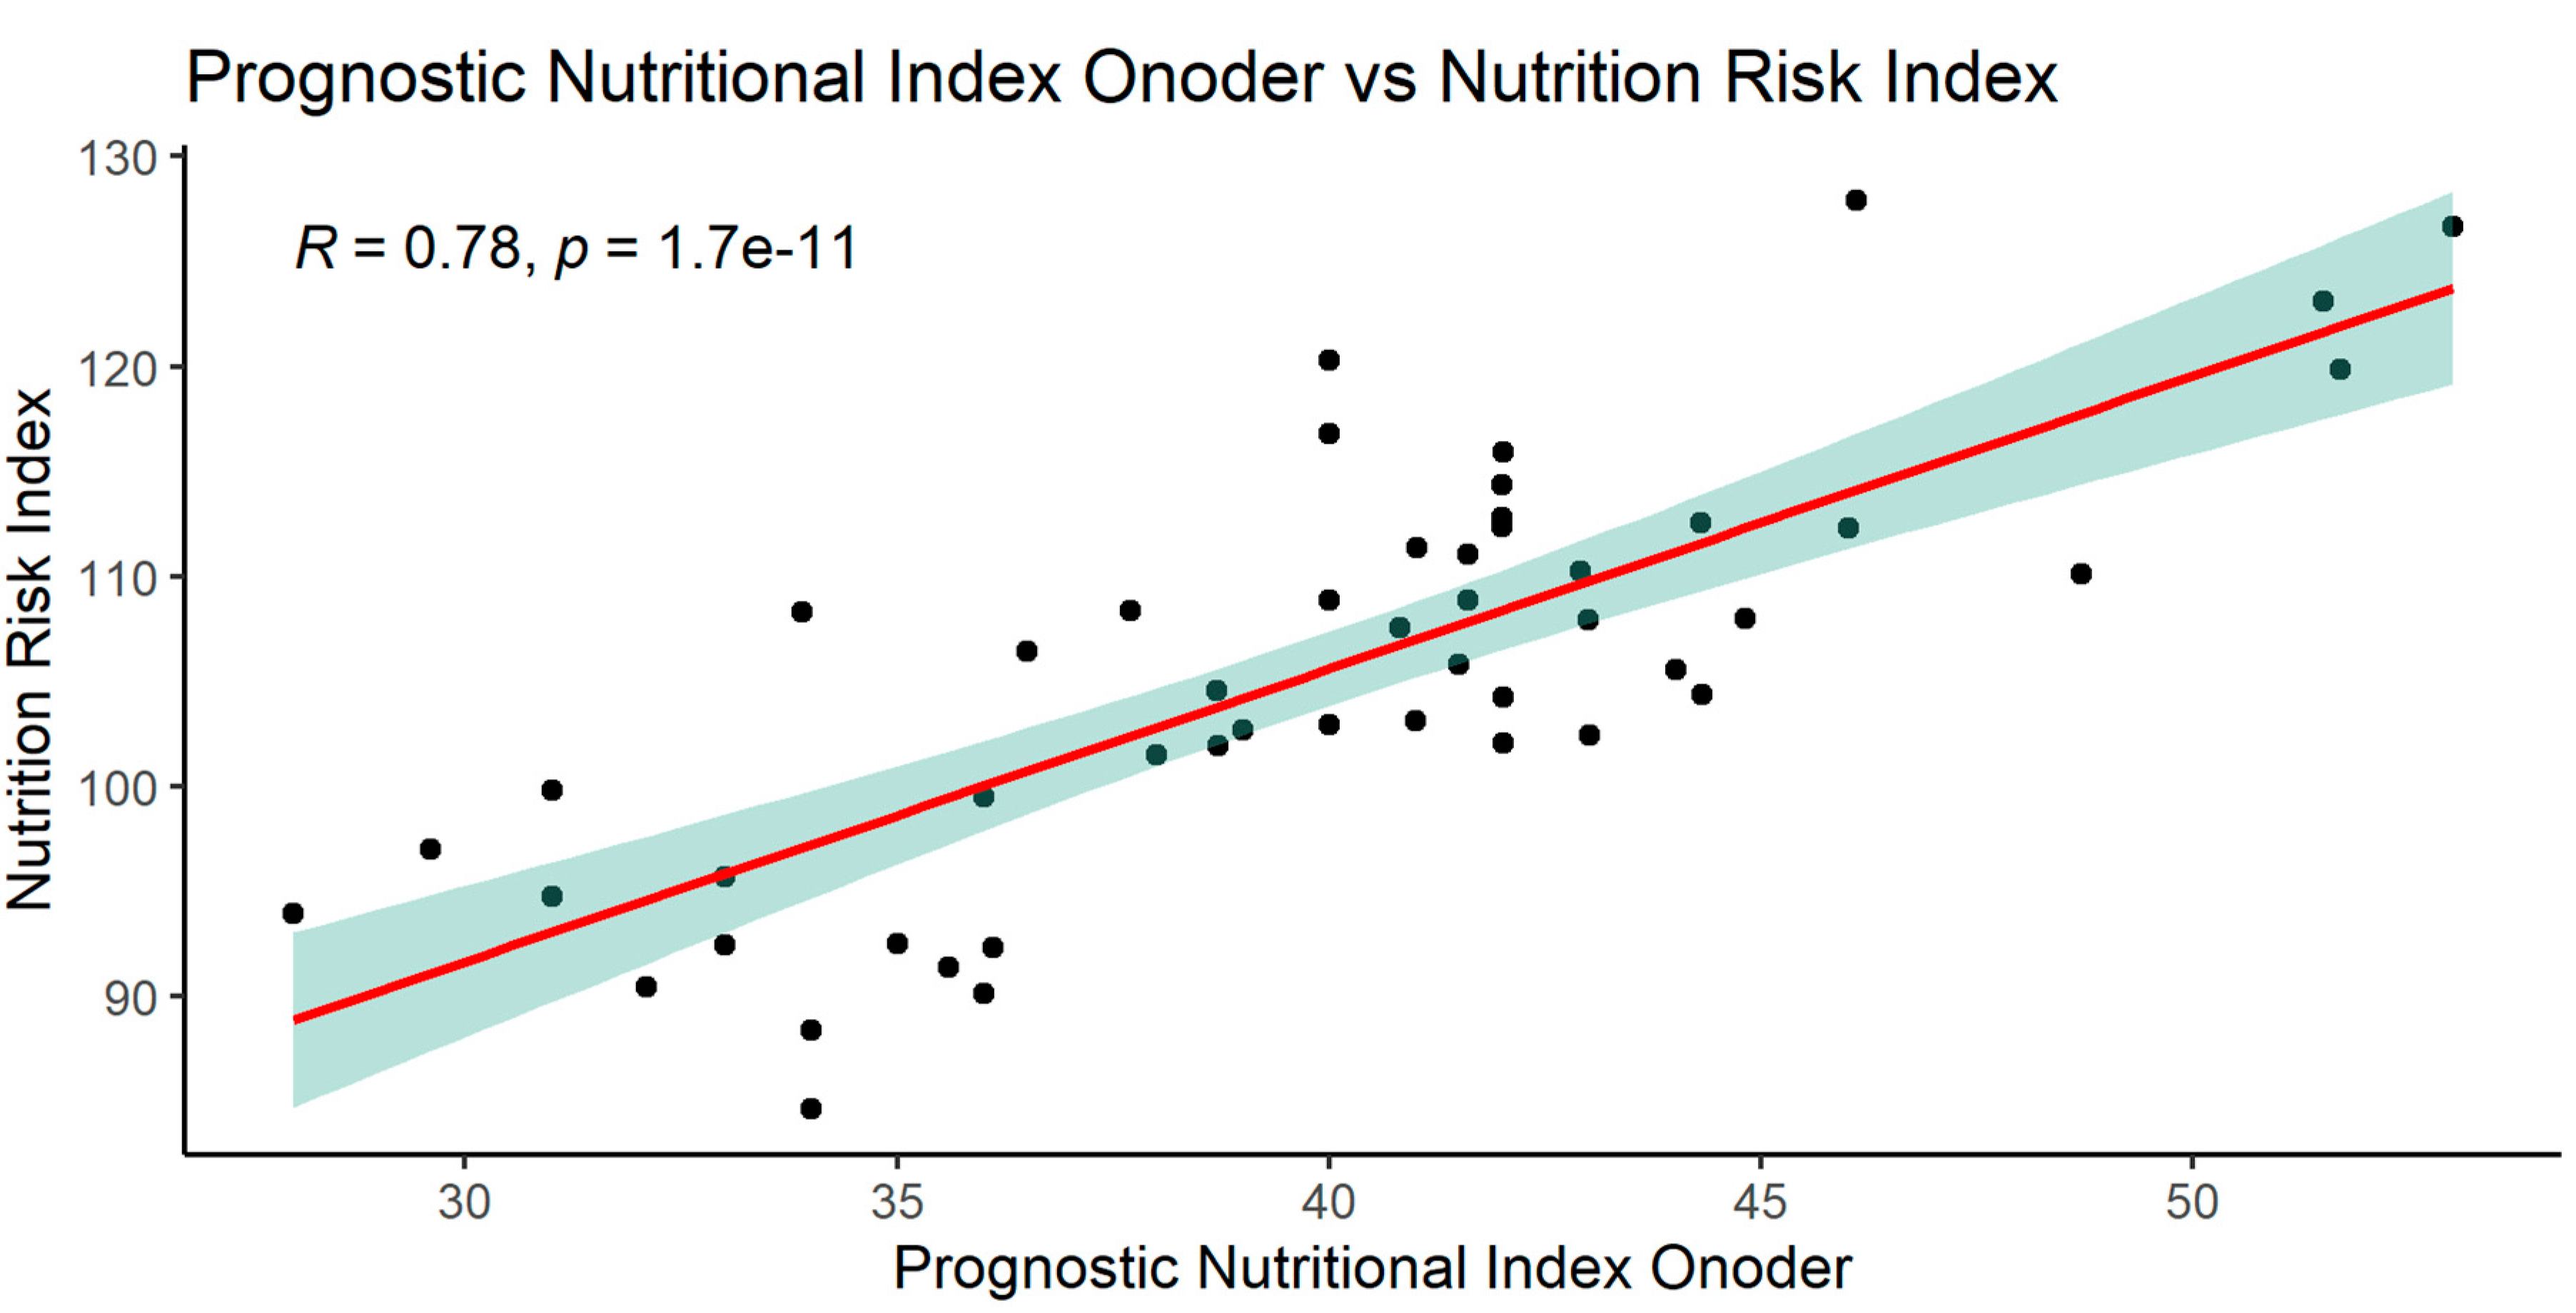
Figure 13.
Correlation of the PNIO index with the MCV in the study group of patients.
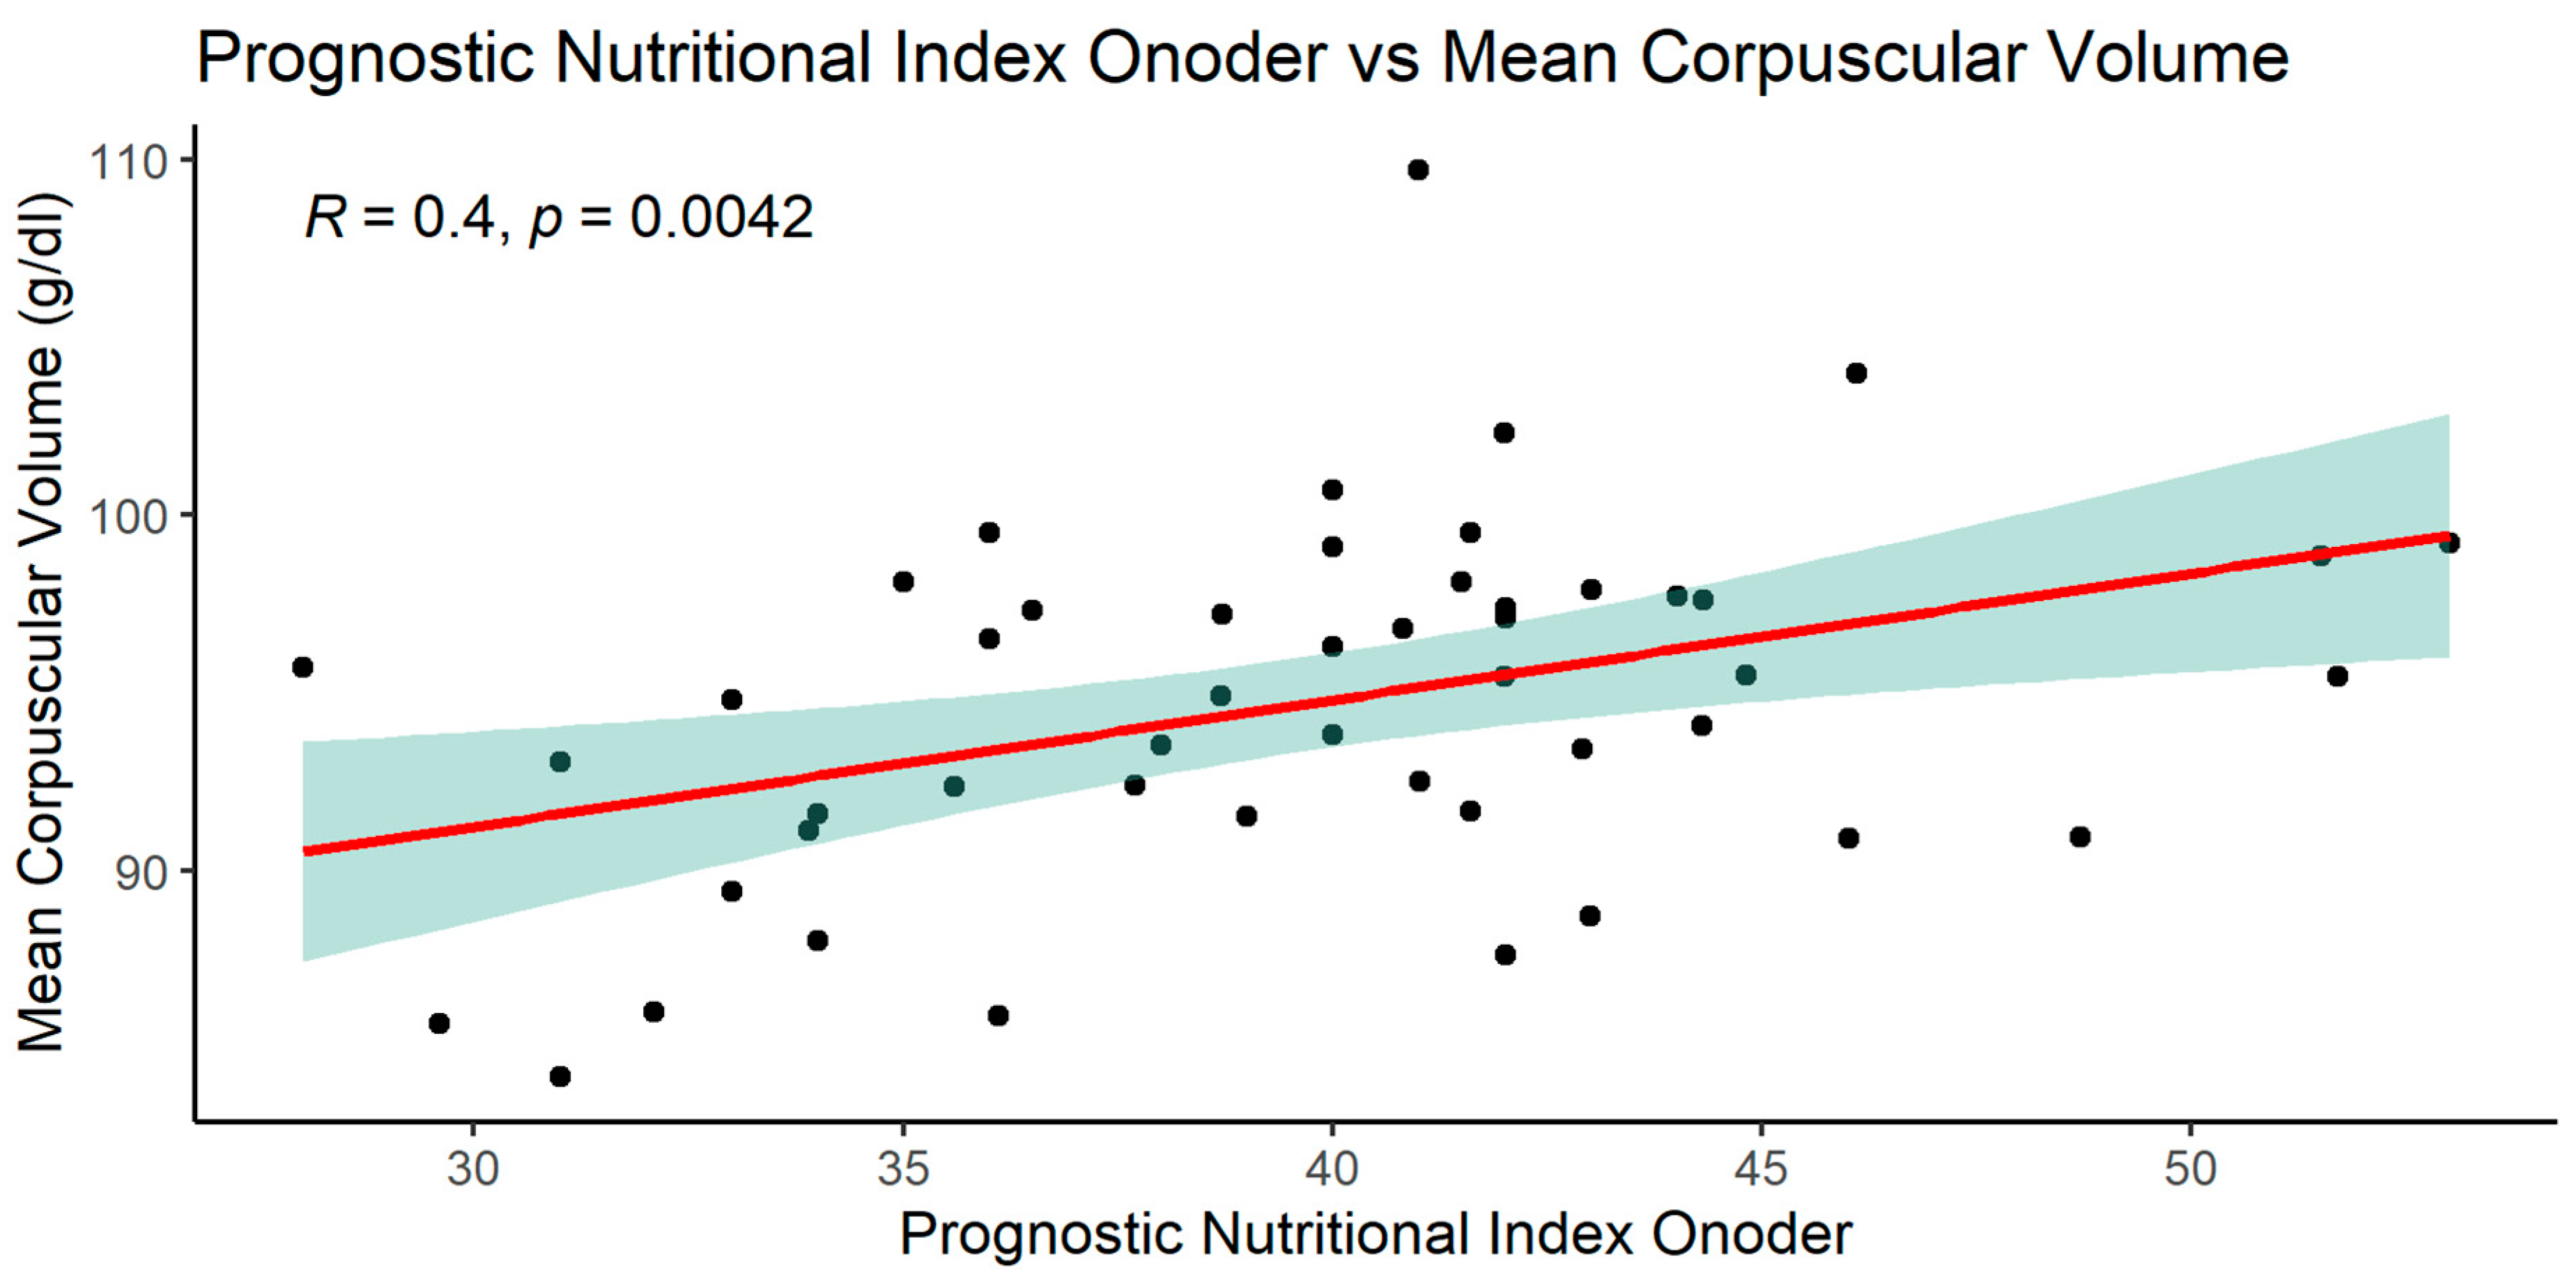
Figure 14.
Correlation of the NRI index with the MCV (fl) in the study group of patients.
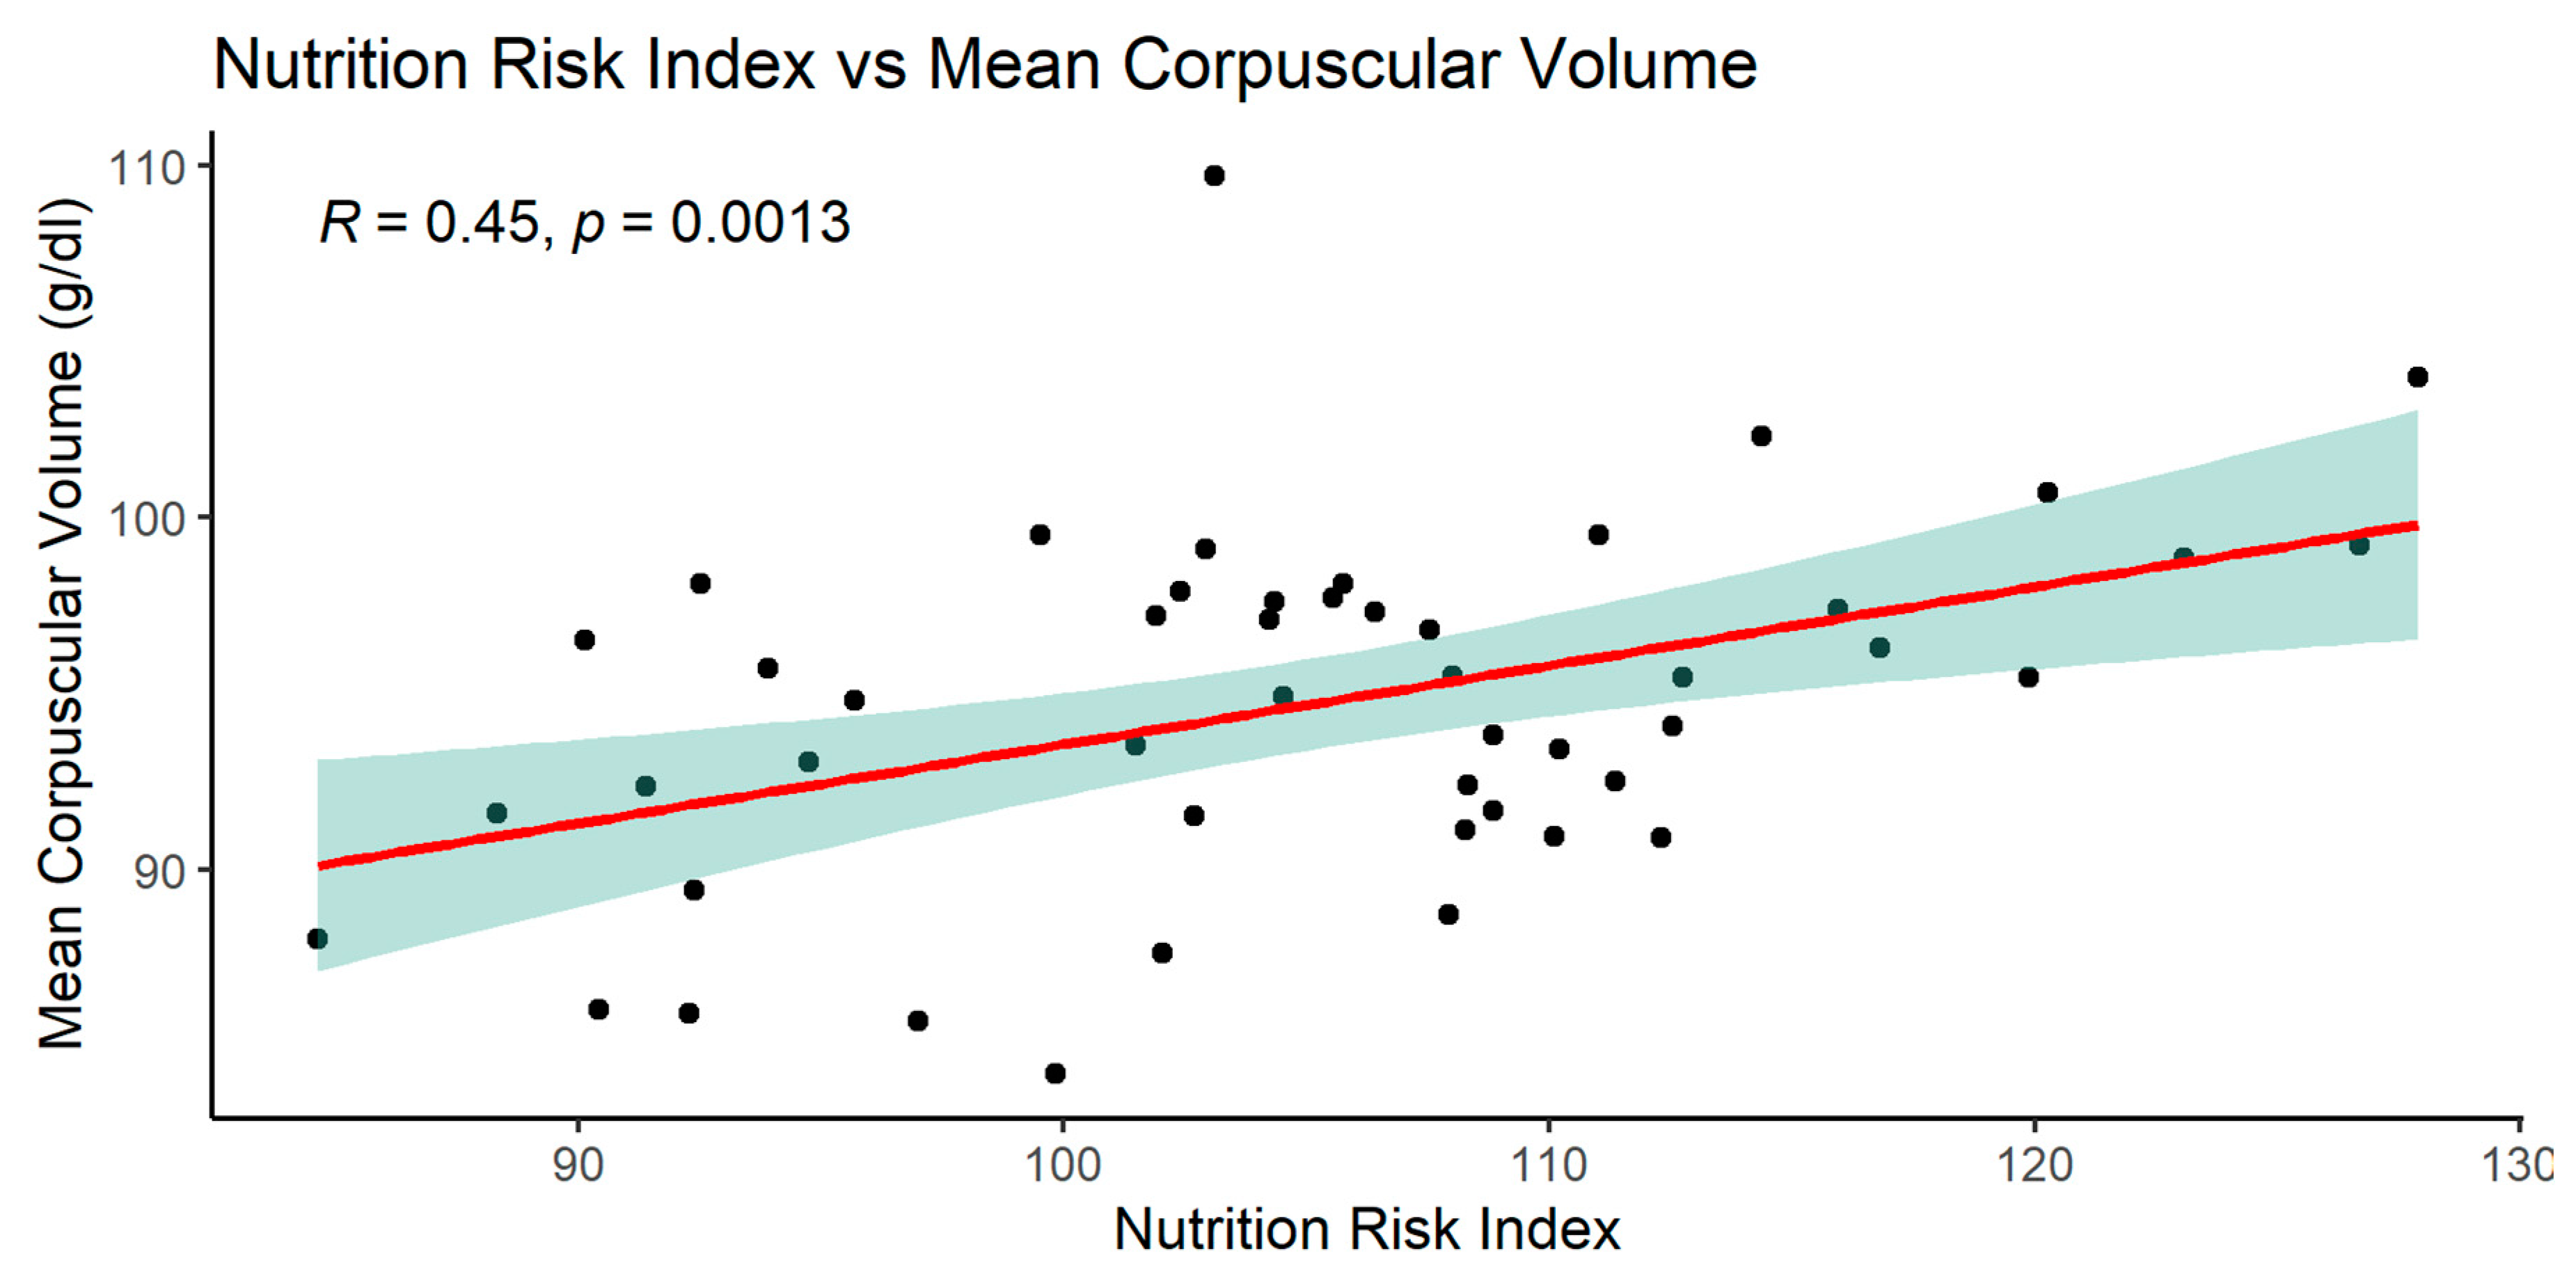
Figure 15.
Correlation of the NRI index with serum glucose in the study group of patients.
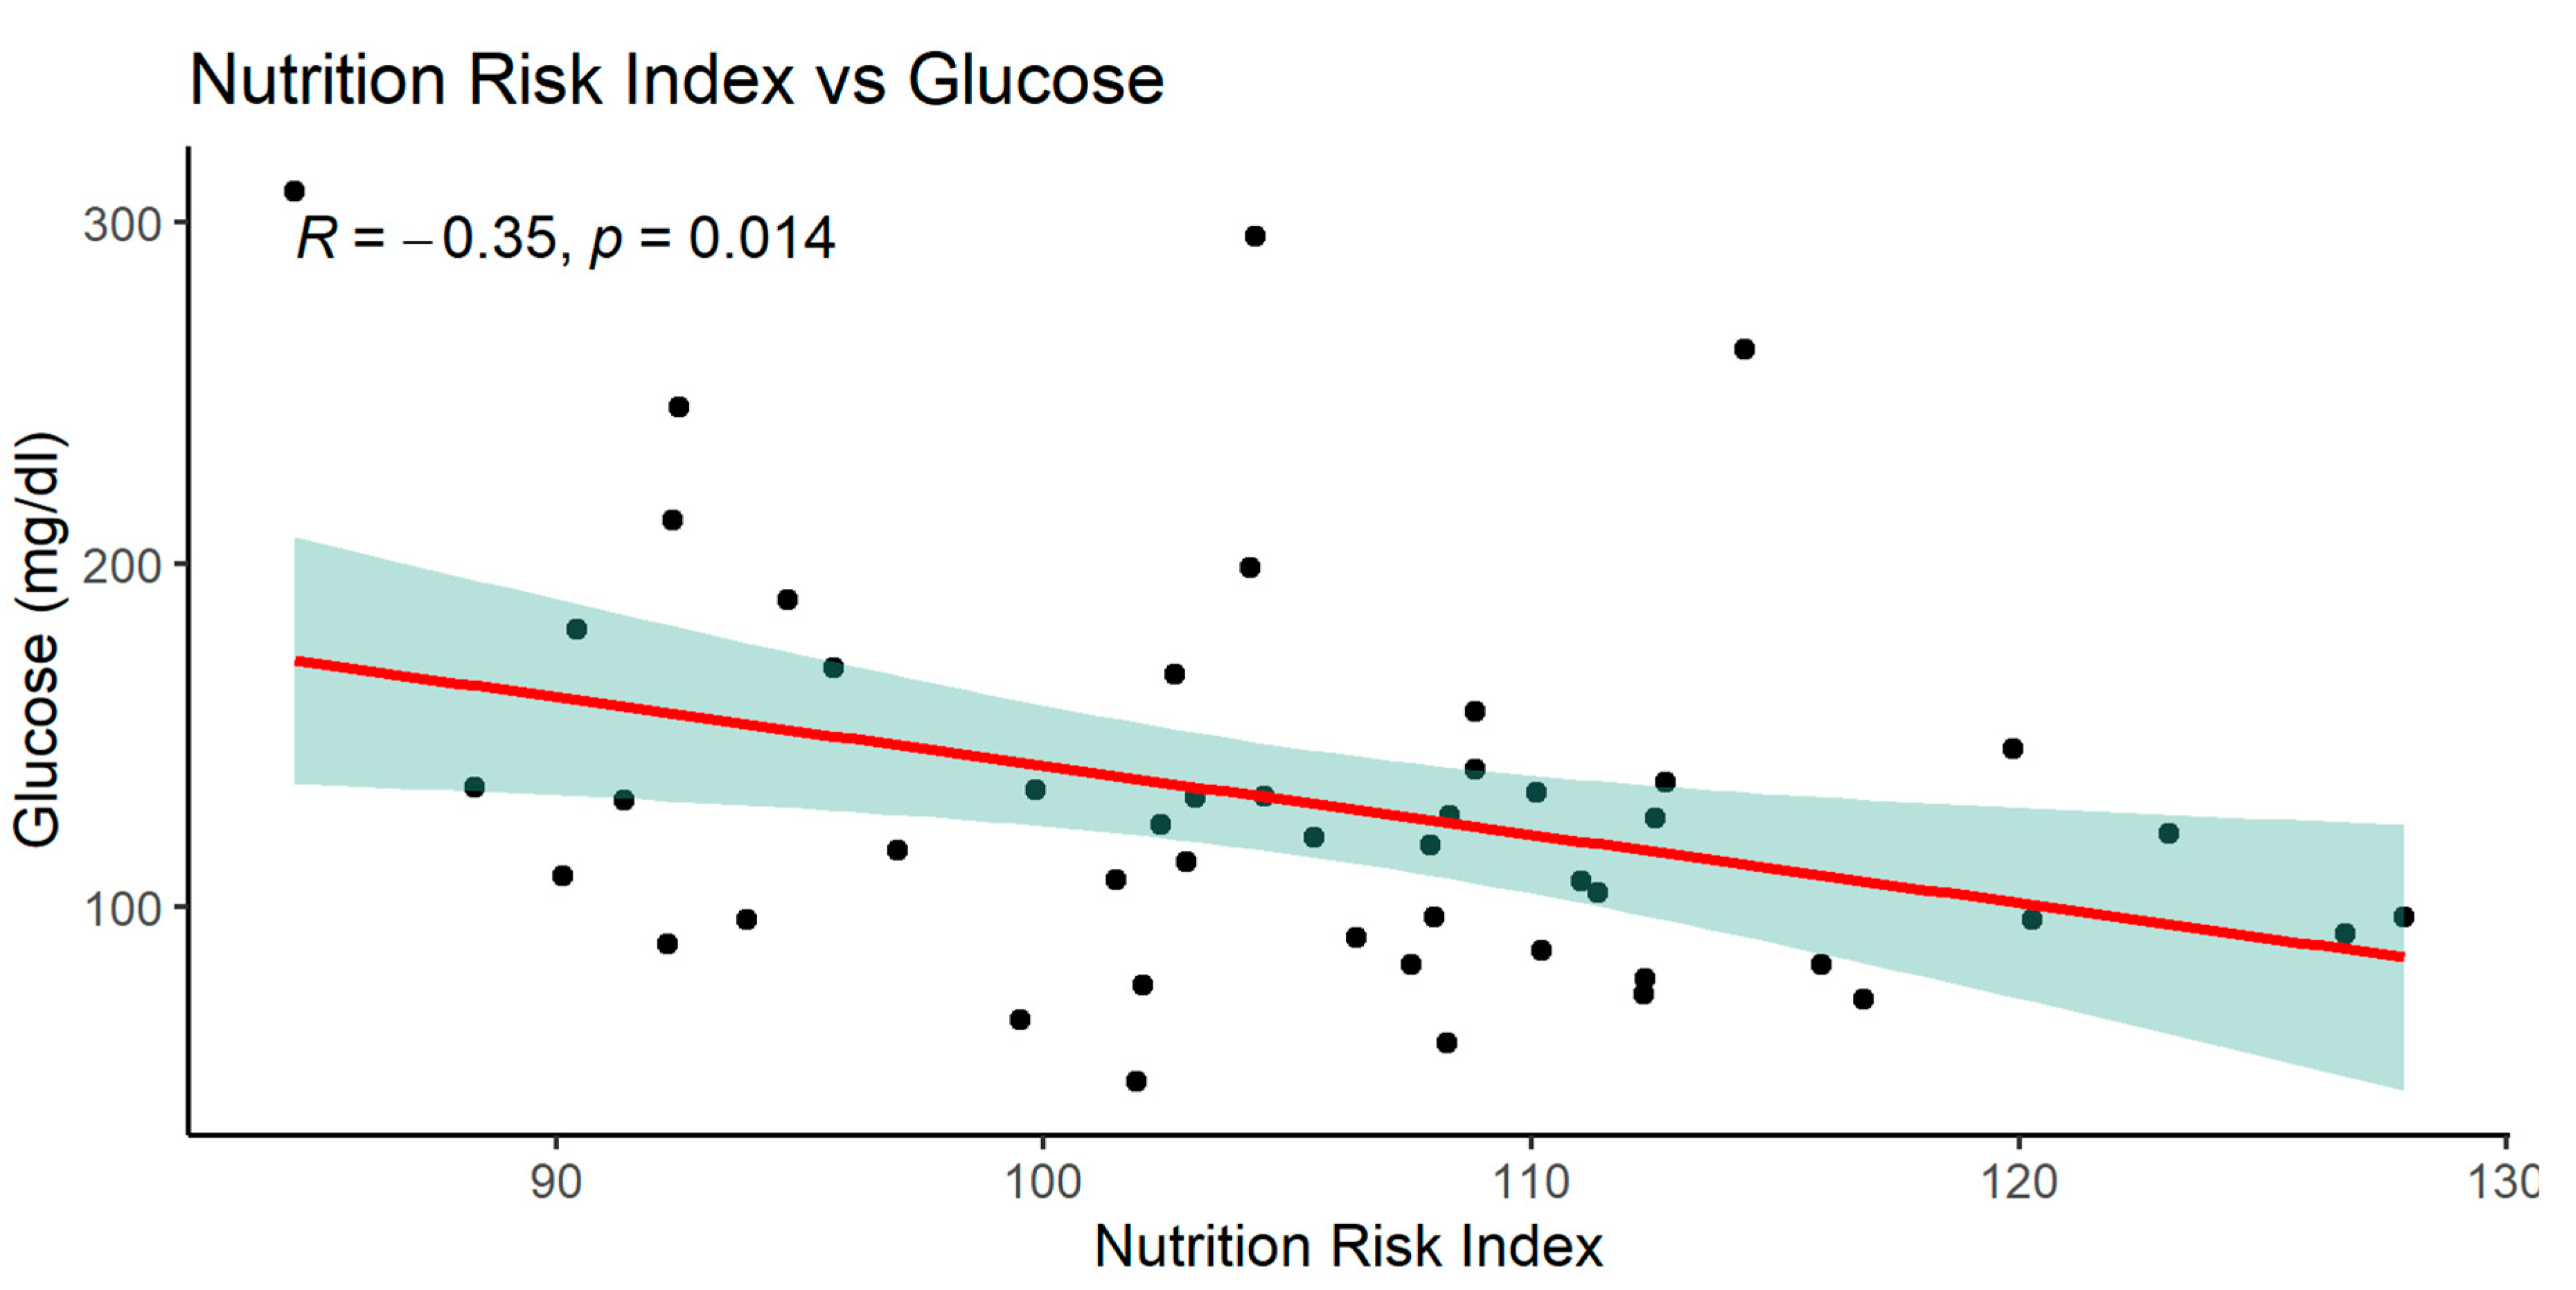
Figure 16.
Correlation of the NRI index with serum albumin in the study group of patients.
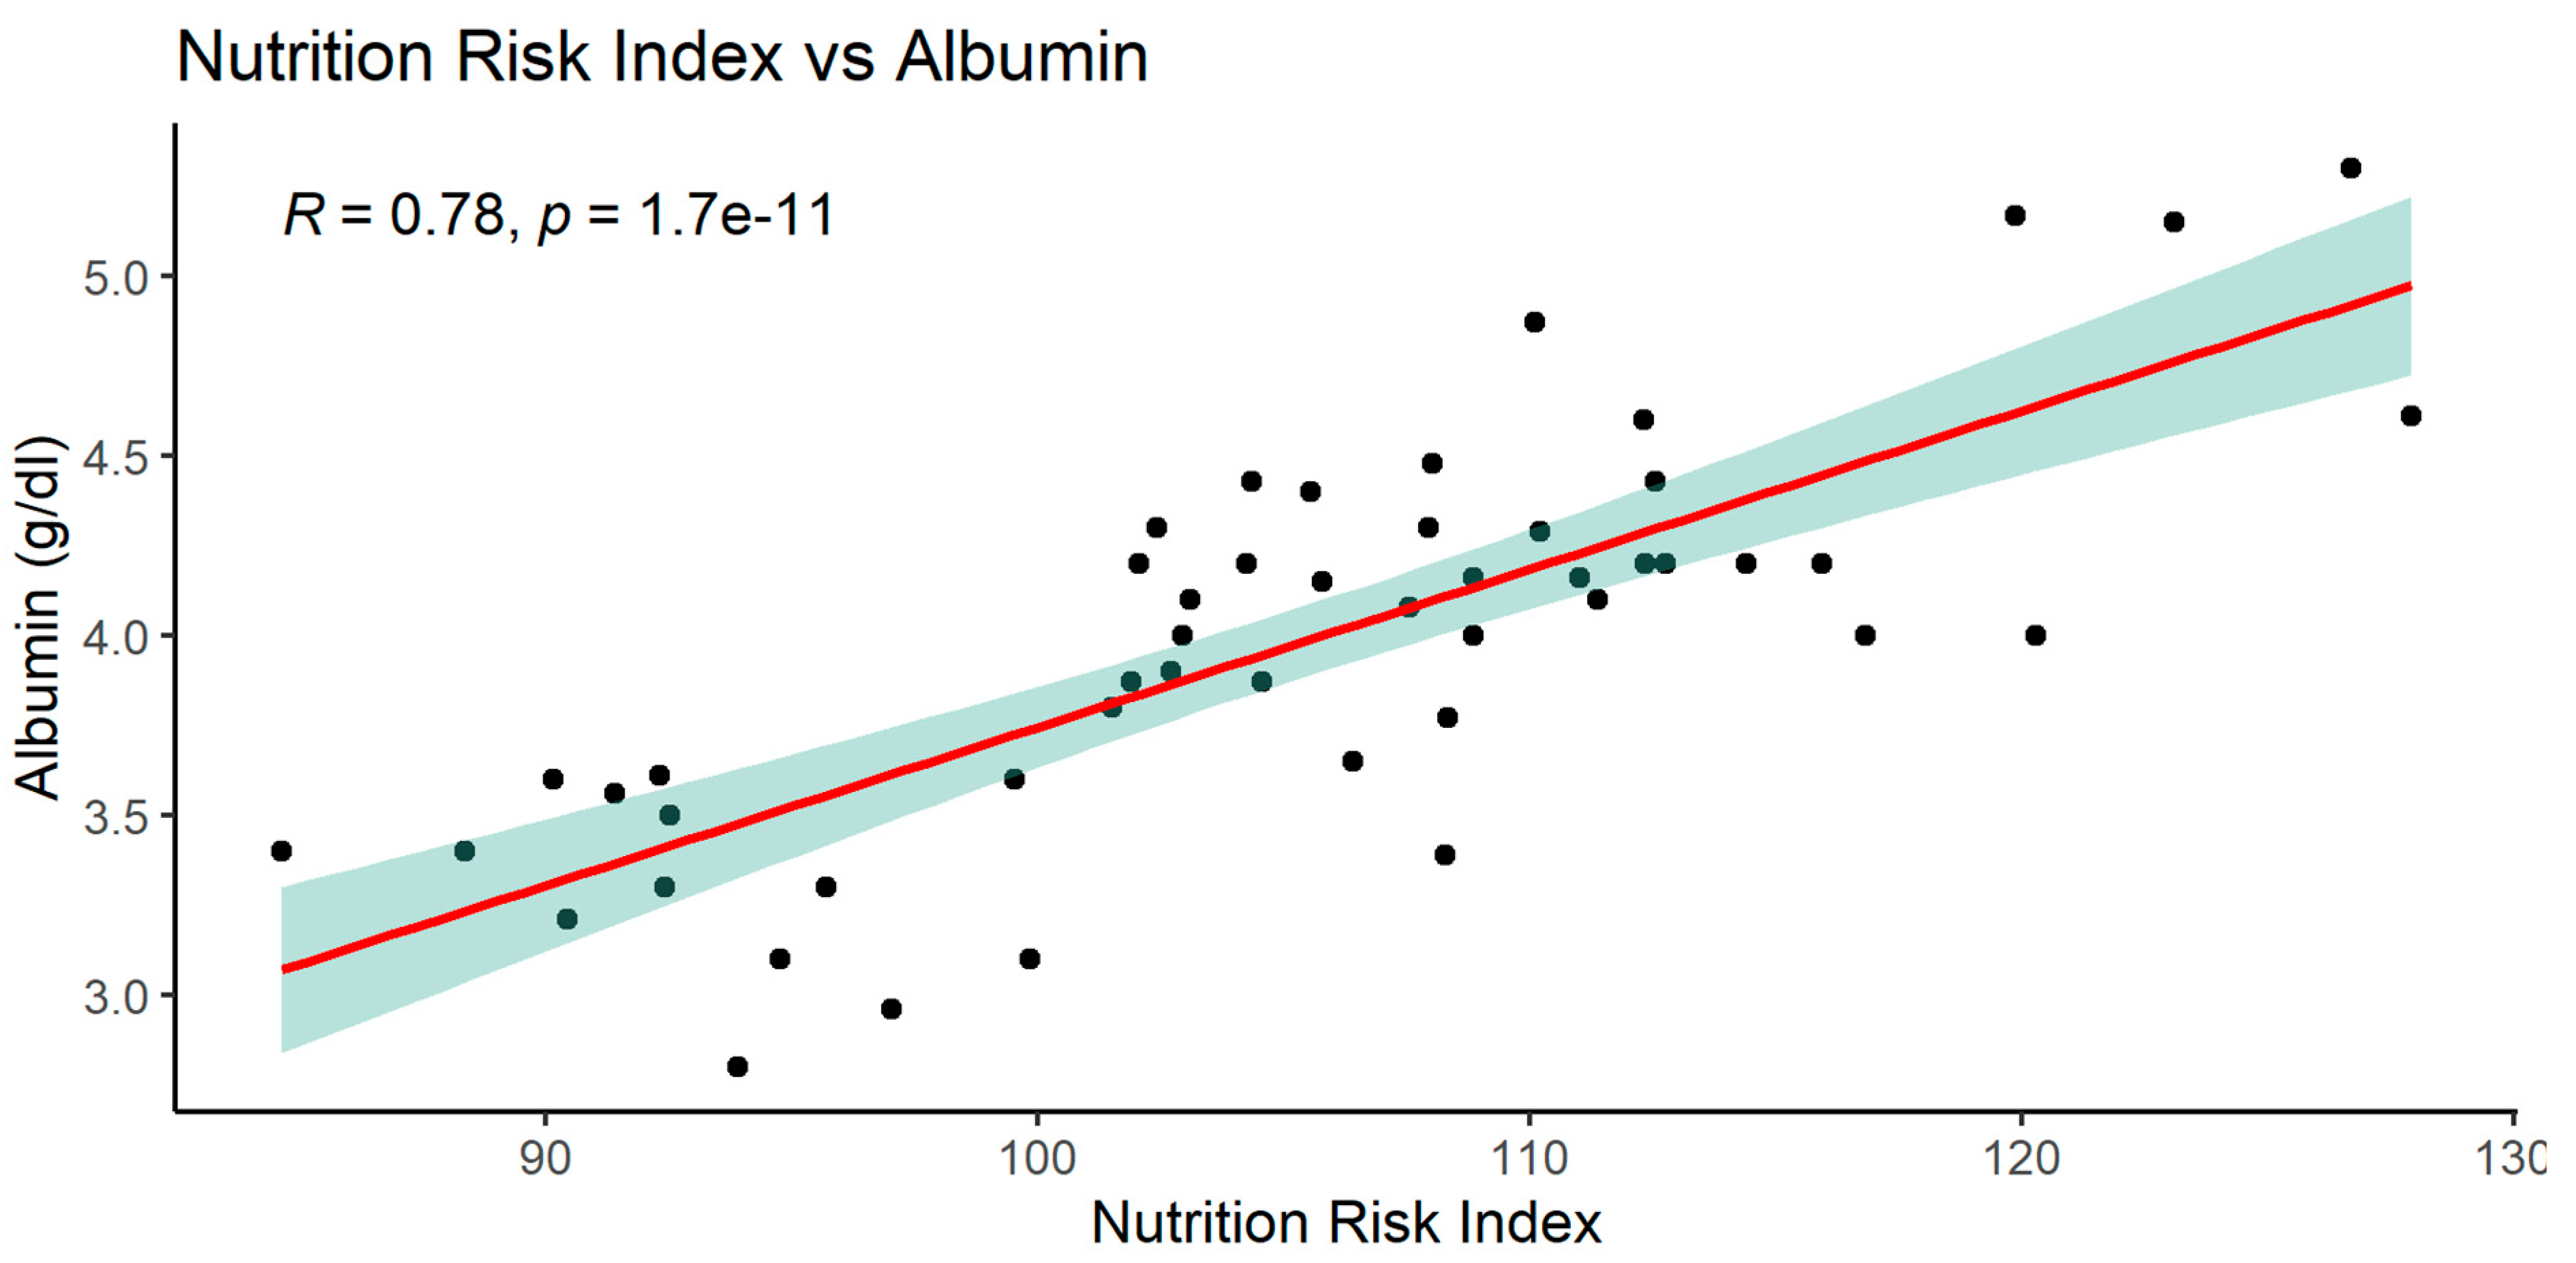
Figure 17.
Correlation of the NRI index with BMI in the study group of patients.
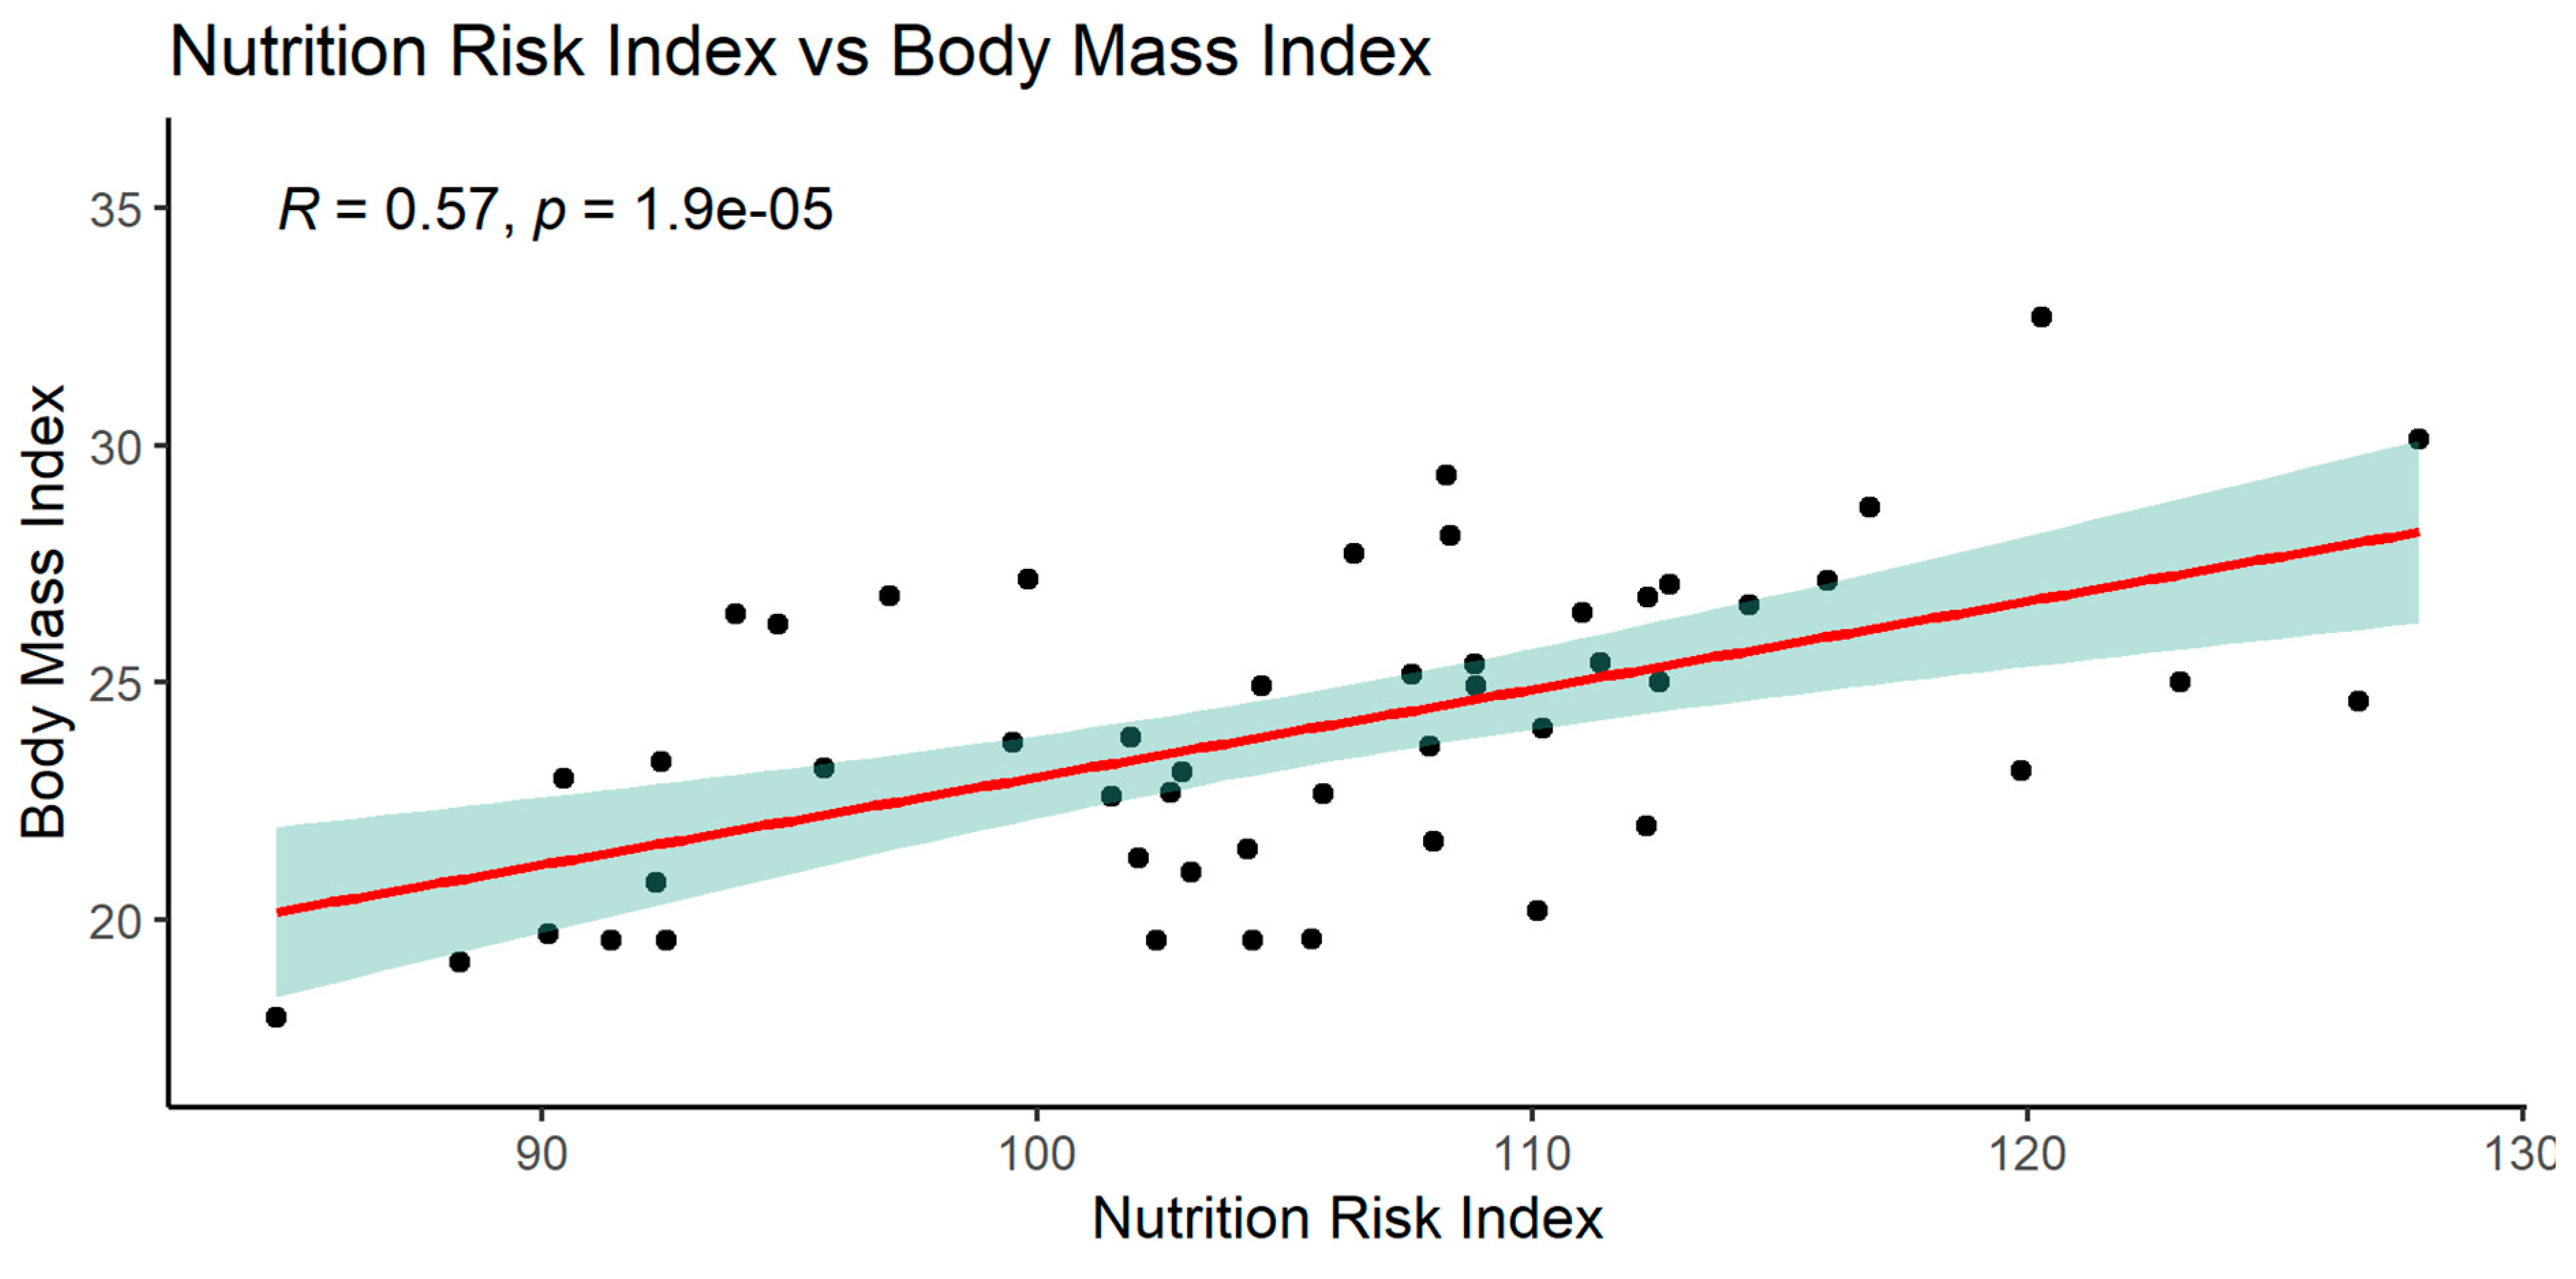
Table 1.
A Characteristics of a study group according to gender.
| Parameters | Male pts n=23 (mean±SD) |
Female pts n=36 (mean±SD) |
p-value |
|---|---|---|---|
| Age [years] | 45.96 ±10.56 | 44.00 ±10.75 | 0.4917 |
| Body weight [kg] | 78.94 ±15.09 | 62.09 ±11.21 | <0.0001 |
| Height [m] | 1.76 ±0.07 | 1.63 ±0.06 | <0.0001 |
| BMI [kg/m2] | 25.45 ±3.65 | 23.39 ±4.01 | <0.05 |
Statistical significance at p<0.05 BMI- body mass index.
Table 5.
Characteristics of nutritional parameters of transplant candidates taking into account study groups. Mean ± SD is presented.
Table 5.
Characteristics of nutritional parameters of transplant candidates taking into account study groups. Mean ± SD is presented.
| Parameters | KTx | SPKTx | p-value |
|---|---|---|---|
| BMI | 24.4 ± 3,0 | 24.1 ±4.5 | 0.761 |
| IBW (Lorenz) | 63.47 ±8.61 | 60.45 ±6.60 | 0.1344 |
| PNIO | 41.1 ± 4,5 | 38.8 ± 6.2 | 0.144 |
| NRI | 108.22 ±9.23 | 103.03 ±10.01 | 0.0655 |
| NLR | 11.20 ±16.99 | 12.5 ± 29.7 | 0.8471 |
statistical significance at p<0.05. *BMI- body mass index, PNIO - Prognostic Nutritional Index Onoder's, NRI - Nutrition Risk Index, NLR - neutrophil-to-lymphocyte ratio, NRS-2002 - clinical scale for nutritional assessment.
Disclaimer/Publisher’s Note: The statements, opinions and data contained in all publications are solely those of the individual author(s) and contributor(s) and not of MDPI and/or the editor(s). MDPI and/or the editor(s) disclaim responsibility for any injury to people or property resulting from any ideas, methods, instructions or products referred to in the content. |
© 2023 by the authors. Licensee MDPI, Basel, Switzerland. This article is an open access article distributed under the terms and conditions of the Creative Commons Attribution (CC BY) license (http://creativecommons.org/licenses/by/4.0/).
Copyright: This open access article is published under a Creative Commons CC BY 4.0 license, which permit the free download, distribution, and reuse, provided that the author and preprint are cited in any reuse.


