
Submitted:
17 July 2023
Posted:
18 July 2023
You are already at the latest version
Abstract
When developing bone implants Young's modulus is one of the primary characteristics of the material that should be considered. The study focuses on the possibility of regulating the modulus of the alloy Ti-50.8 at % Ni by varying its initial structure as well as aging-induced microstructure in a wide range. Microstructure observations were performed using TEM and SEM observations. The calorimetric studies of martensitic transformations were carried out using "Mettler Toledo 822e". Tensile tests were performed in a test temperature range of ‒196≤T≤+100°C using an «IN-STRON 5966». The grain/subgrain size of B2-austenite strongly affects the modulus magnitude. This effect is ambiguous for a material with a grain size of 0.13–3 µm and depends on the test temperature. The effectiveness of aging on the modulus reduction depends on the initial structure: it is most pronounced in an alloy with a relatively coarse grain size of 9 µm and brings a decrease by 3.8 times at a temperature of 37°C. Bone-like elastic modulus (10–30 GPa) at a human body temperature of 37°C is realized in an aged fine-grained NiTi alloy. An ultrafine-grained sub-structure exhibits he same values of Young's modulus in the temperature range from -100°С to 25°С.
Keywords:
Ni-rich Ti-Ni alloy
; grain-subgrain size
; aging-induced microstructure
; martensitic transformations
; Young’s modulus
1. Introduction
Among shape memory alloys (SMAs) applied for medical intelligent devices, Ni-rich NiTi alloys remain extremely attractive for designing intelligent devices for medical application due to their unique set of functional properties. The scope of their clinical use in surgery is extremely wide: various manipulators, cava filters, septal occlusion devices, vascular stents as well as stents for the tubular structures, the prosthesis (osseous, ligamental, dental), compressive devices, implants etc [1−3]. Traditional processing of NiTi alloys includes thermomechanical treatment as well as subsequent post-deformation annealing (PDA) [3−5]; variation of the aging modes makes it possible to precisely control of aging-induced microstructure, transformation and functional response in a wide temperature range [6−9].
When developing the bone implants, the elastic modulus (or Young’s modulus) is one of the primary characteristics of the material that should be considered. The low bone-like Young’s modulus of an implant prevents a stress shielding effect in bone fixation and minimizes bone resorption [10]. According to the data from various sources, its values for bone tissue amount 0,04–30 GPa [11,12,13]. Such an impressive data scatter is due to the fact that the density and porosity of bone tissue differs in various kind of bones [11,12], as well it differs in various age groups, for example in athletes, regular training leads to bone hypertrophy [14].
Ni-rich NiTi alloys are characterized by the elastic modulus with a magnitude somewhat higher than the upper limit of the above indicated range: in a coarse-grained material it amounts 33−73 GPa [15,16,17] and 52−77 GPa in an extruded rod [18]. The NiTi SMAs exhibit an expressed V-shaped temperature dependence of Young’s modulus with a minimum at the Ms temperature (the onset temperature of martensitic transformation) [15,16,17,18] which correlates with the similar V-shaped temperature behavior of the plateau stress (or transformation yield stress) [4,19,20].
It is important to note here that in the above cited references, the minimum values of E = 30−35 GPa are realized in the negative temperature range in a coarse-grained NiTi alloy [15,16], and at a temperature of a human body of 37°C (which should be considered the operating temperature of the implant) the values of E are much higher than that of bone tissue. This reason is a serious obstacle that limits the use of NiTi SMAs for the development and manufacture of bone implants. Therefore, when developing implants, scholars turn to nickel-free SMAs [13,21,22,23].
To reduce Young’s modulus of authors of [16], used a deformation with an accumulated strain of 20%. As a result, they reduced Young’s modulus in Ti49.2Ni50.8 alloy from 68 to 30 GPa at a temperature of 0°C. This result, however, exhibits a low value for practical use because at a human body temperature the magnitude of E amounts 40 GPa after deformation. Moreover, this is a basic knowledge that deformation brings suppression of MTs and degradation of shape memory effects [4,5].
To regulate the values of Young’s modulus of TiNi alloy at a human body temperature knowledge about its response to structure evolution is required. The corresponding information remains limited because traditionally, the comparative studies of the elastic modulus in a material with different structures are carried out at room temperature.
The cited publications, however, do not provide an exhaustive idea of the structural response of Young’s modulus, since comparative tests in the above cited studies are restricted by one or two kinds of structure (mainly recrystallized [15,17] or as-deformed [16,18]). Meanwhile, post-deformation annealing (PDA) is an obligatory procedure to provide a necessary temperature range of shape recovery as well as other functional characteristics [3,4,5,6,7,8,9,19].
It was proved in [19] that the efficiency of aging in terms of the control of the functional and mechanical response (tensile behavior) is determined by the specific features of the initial (unaged) substructure. The possibilities of aging with a variation of the initial structure as a factor affecting the elastic modulus of Ni-rich titanium nickelide remain unexplored. The absence of such data indicates the existence of serious gaps that limits the scope of Ni-rich SMAs.
In this work, we report the possibility of regulating the modulus of elasticity of Ti49.2Ni50.8 alloy when varying the initial structural state as well as aging-induced microstructure in a test temperature range of −196 ≤ T ≤ +100°C. The specific features of the temperature dependence of Young modulus vs grain/subgrain size as well as its response to aging using various initial structural states are revealed. We suggest a mode of thermomechanical processing which produces a 2.7−3.6 reduction in Young’s modulus to realize its bone-like value at a human body temperature.
Obviously, such studies are of fundamental importance, since it is known that the variation of the initial (before aging) structure, is a powerful tool for control of functional characteristics [8,19,24]. The studies performed in the framework of this research, fill the indicated gap and make it possible to reveal the role of structural heredity under aging in the control of the elastic modulus in a wide temperature range.
2. Materials and Methods
A Ti-50,8 at.% Ni alloy ingot with a total impurity content of 0.1 at % was prepared by ‘‘MATEK-SMA’’ (Russia) using a vacuum-induction melting furnace with the graphite crucible. Subsequent metal forming included pressing, rotary forging, radial shear rolling, and warm drawing to obtain 0.8-mm-wires. Subsequent solution treatment was performed at 700°С (20 min) followed by water-quenching. A 0.8-mm wire was then finished by multipass cold drawing to obtain a 0.6-mm wire with an accumulated true (logarithmic) strain of e = 0.6. Post-deformation annealing (PDA) was performed using the following modes; (i) 550°C, 0.5 h, (ii) 600°С, 1 h and (iii) 800°С, 1 h.
At the next stage, the as-deformed samples as well as (ii) and (iii) samples were subjected to aging at 430°C for 10 h (the temperature range 420–440°C was determined in [25] as optimal in terms of the maximum intensity of aging.
Microstructure observations were performed using a JEM-2100 transmission electron microscope (TEM, JEOL, Tokyo, Japan) operated at 200 kV. The foils were cut off the middle of the wire along the drawing direction by local precision ion etching using a scanning ion microscope “Strata FIB 205” (FEI Company, USA), with the accelerating voltage of a focused ion beam of 30 kV were cut.
The solution treated samples were studied using a scanning electron microscope JSM-6460L (JEOL, Japan)
Сalorimetric studies of the martensitic transformations (MTs) were carried out using a “Mettler Toledo 822e” calorimeter at a rate of 10 °C/min in the range of −100°C ≤ T ≤ +100°C. The start and finish temperatures of MTs were determined using the ASTM F2004-05 (2010) standard.
Tensile tests were carried out in a temperature range of −196°C ≤ T ≤+100°C with a speed of 20 mm/min using an «INSTRON 5966» using 5−6 samples for a test temperature. In all cases, one of the test temperatures corresponded to a temperature Ms (the onset temperature of the forward MTs R → M or A → M). Elastic modulus was evaluated by conventional means from a macroscopic mechanical response by the slope of the stress-strain curve at zero strain.
3. Results
Thermomechanical processing at room temperature by drawing with the accumulated logarithmic strain of е = 0.6 brings the formation of a well-developed dislocation substructure of B2 austenite with partial amorphization. The selected area diffraction pattern (SAED) reveals the diffraction arcs (110) and (200) belong to B2-austenite and the reflections (113) and (003) of B19′martensite [8].
PDA at a temperature of 550°C, 30 min forms a mixed ultrafine-grained (UFG) structure which contains the recrystallized grains as well as the polygonized subgrains of B2 austenite with an average size of 130 nm; their fractions are comparable (Figure 1a,b). The elements with the size of 80−120 nm occupy 43 % of the volume; the elements with the size of 160−200 nm occupy 43 % of the volume. The maximum size of grains/subgrains reaches 340 nm (Figure 1d). The reflections of Ti3Ni4 precipitates are not revealed. The diffraction arcs (110) and (211) belong to B2-austenite; the reflections () belong to R-martensite (Figure 1c). The subgrains form conglomerates of 480×730 nm; they are surely observed in dark field images. Since the structural elements in the bright-field (BF) TEM images cannot be reliably identified as grains or subgrains, we measured their average longitudinal and transverse diameters; the corresponding histograms of their size distribution are shown in Figure 1.
Solution heat treatment at 600°C, 1 h and 800°C, 1 h of as-deformed samples brings the formation of the recrystallized microstructure with the average grain size of 3 µm and 9 µm, respectively (Figure 1e,f and 1d,h respectively). After PDA at 600°C the maximum grain size reaches 8 µm; the grains with a diameter of 2−4 µm occupy 60% of the volume (Figure 1f). After PDA at 800°C the maximum grain size reaches 24 µm; the grains with the diameter of 6−9 µm occupy 50% of the volume (Figure 1h).
In the SAED, the superposition of arc reflections from the nano-subgrains and point reflections from nano-sized grains distributed over a ring are observed, and the reflections of the (110)B2, (221)R, and ()B19′ are detected. It is believed that aging is suppressed at this temperature, nevertheless, the reflections (003) of Ti3Ni4 precipitates are also detected; their interpretation was performed using data of [26].
Additional aging was carried out at a temperature of 430°C, 10 h using the as-deformed and recrystallized samples (ii) and (iii). The aging of an as-deformed material forms a mixed microstructure of B2 austenite, which consists of recrystallized nanograins and nano-subgrains of the polygonized substructure. Their fractions are comparable, and the average size amounts to 37 ± 3 nm. The subgrains form conglomerates of 100−150 nm; they are surely observed in dark field images. The microstructure elements with the size of 30−40 nm occupy ~40% of the volume. The maximum size of grains/subgrains reaches 130 nm.
The Ti3Ni4 precipitates in the bright-field and dark-field images are not visually detected, although the corresponding reflections (133) and () are present in the SAED (Figure 2a,b). The reflections of B2 austenite, R martensite and B19′ martensite are detected as well.
The size of the Ti3Ni4 precipitates as well as their distribution in the recrystallized structure depend on the grain size. In both cases the distribution of precipitates is heterogeneous: it is mild in a fine-grain structure (Figure 2b) and becomes pronounced with the grain growth (Figure 2c).
The precipitate size is minimal in the grain boundary zones and increases towards the grain center, the distance between the precipitates increases, and the linear frequency of their distribution as well as the volume fraction decrease.
Figure 3 permits tracing the evolution of specific features of martensitic transformations (MTs) vs grain/subgrain size as well as after additional aging.
In an as-deformed material the exothermic and endothermic peaks of the forward and reverse martensitic transformation are absent, which is typical for a strongly work-hardened material [3,5,8].
After PDA at 550°C, 0.5 h (an UFG mixed substructure) the calorimetric curves show two distinct exothermic peaks upon cooling: A→R at 4°С and R→M at −51°С. Upon heating, one peak of MT M→(R)→A is recorded at a temperature of 9°С (see Table 1 for more details concerning the onset and endset temperatures of MTs).
After the solution treatment at 600°C (a recrystallized structure with an average grain size of 3 μm) similar forward transformations with very close peaks at 9°C and 1°C, are detected respectively, and a single reverse MT M→(R)→A with a peak at 34°C are registered. After PDA at 800°C (a recrystallized structure with an average grain size of 9 μm), one forward A→M transformation with a peak at −37°C and the corresponding reverse one at −13°C, are detected.
Subsequent aging of (ii) samples brings separation of the calorimetric peaks of the forward MTs.
After subsequent aging of (iii) samples, the triple-stage MT proceeds under cooling: A→R, R→M and A→M with the peaks at 43°С, 6°С and −10°С, respectively. Upon heating, two overlapping MTs M→A(2) and M(1)→A are determined with the peaks at 45 and 50°С respectively.
Table 2 shows the average values of Young’s modulus (E) of NiTi alloy, determined from the stress-strain diagrams; Figure 4 illustrates the temperature-dependent Young’s modulus of the material with different grain/subgrain sizes, temperatures Ms and Af are indicated. After PDA in the temperature range of 550–800°C, the diagrams exhibit a pronounced V-shaped character with a minimum at Ms temperature.
The lowest magnitude of Young’s modulus (11–22 GPa) is determined in a material with a mixed UFG structure (PDA 550°C) at test temperatures below –20°C. The completion of recrystallization (PDA 600°C) is accompanied by an increase in the modulus to 14–26 GPa) in this temperature range; in the temperature range of −20°С to 100°С the values of Е of the UFG material exceed that of the fine-grained material and reach 47 GPa. The grain growth up to 9 µm (PDA 800°С) is accompanied by a significant increase in the modulus to 27–54 GPa; this structure provides the highest level of E over the entire test temperature range.
Figure 5 permits tracing the temperature dependence of Young’s modulus in various initial structural states before and after aging.
In as-deformed material, the material exhibits atypical behavior: in the temperature range from –196°C to 25°C, the values of E are determined in the range of 30–42 GPa (Figure 5a). With a further increase in the test temperature to 100°С, Young’s modulus reduced to 20–30 GPa; such a temperature dependence is characteristic of the materials without phase transformations [27] and is caused by the relaxation of internal stresses upon heating. The observed scatter of data over a wide range is caused by the technical features of the experiment (the curved shape of the as-deformed specimens), which is reflected in the quality of recording the stress-strain diagrams.
After PDA, in all cases the temperature dependence of Young’s modulus exhibits a V-shaped character both in the recrystallized material (blue curves) as well as after aging (red curves).
Aging brings a reduction of the modulus values in the entire temperature range if compared to the initial unaged state. The exception is the temperature region above 25°С in Figure 5a, in which the values of E after aging are comparable to the initial state and somewhat higher.
It should be noted that despite the significant difference in Young’s modulus in a material with a different initial structure, its values and the nature of evolution after aging become very close and exhibit an identical symmetry about the Ms point. In Figure 5c after aging, the area of minimum values of E is somewhat stretched along the temperature axis, since two direct MTs R→M and A→M are determined in the material with this structure with temperatures Мs at 5 and −6°С, respectively.
After aging, there is a slight increase in the minimum values of E in the region of the Ms point 8 GPa (Figure 4a) to 13 GPa (Figure 4c) with a coarsening of the initial structure. At test temperatures higher than Af, the maximum values of Е=42–44 GPa are realized after aging of the material with a dislocation substructure. After aging of an alloy with a recrystallized structure, the values of E over the entire temperature range are very close.
The values of Young’s modulus in the region of existence of metastable austenite B2-austenite exceeds that in the state of B19’ martensite, regardless of the initial structure which is in good agreement with the data [28]. The maximum values of Young’s modulus in the aged material reach their maximum E = 40−45 after aging of the as-deformed material.
Figure 6 shows the stress-strain curves obtained at 37°C obtained at a test temperature of 37°C before and after aging (“BA” and “AA” respectively). As a result of aging, a fine-grained material exhibits a 2.7 times reduction from 34 GPa to 14 GPa and a coarse-grained material exhibits a 3.6 times reduction from 55 GPa to 15 GPa at a temperature of clinical use of 37°C. Thus, the aging of the initially recrystallized material makes it possible to obtain the values of E = 12–13 GPa at an operating temperature of 37°C, which is essential in clinical use.
The stress-plateau which characterizes the magnitude of the transformation yield stress (σtr), remains unchanged at a level of 200 MPa after aging of a fine-grained material (Figure 6a). Aging of a material with a coarser grain size results in an expressed reduction of the stress plateau from 600 MPa to 350 MPa.
4. Discussion
The observed difference in aging-induced microstructure is determined by the defect density and specific features of their distribution in the initial (unaged) microstructure: the higher the defect density, the more the number of the nucleation centers of precipitates [4]. Among three types of initial (before aging) structures, the cold-drawn material exhibits the highest defect density (ρ≅1012−13cм−2 [29]) with a relatively uniform distribution. The Ti3Ni4 precipitates that nucleate in this structure remain within the limit of 3−5 nm due to competing growth under similar conditions [8,26].
In the fine-grained initial structure (PDA 600°C) the defect density drops to the magnitude of ρ ≅ 108cм−2; further grain growth (PDA 800°C) results in the decrease in the defect density (ρ ≅ 106−7cм−2) [29]. According to [30], the defect concentration is higher near the grain boundaries than in the grain center; this difference is most pronounced in the coarse grains if compared with the fine ones. A similar difference in nickel concentration in the grain cross-section was reported in [8] using energy dispersive spectroscopy: the segregation of Ni near the grain boundary reaches 54 at.% in a coarser grain These factors explain the observed differences in the precipitates distribution: the concentration of nucleation centers is higher in a fine grain with the uniform nickel concentration over the grain cross section, the Ti3Ni4 precipitates nucleate and grow in competing conditions [31,32]. In a coarse-grained structure which exhibits the lower the defect density, the concentration of nucleation centers is lower, and the precipitates reach much larger sizes in the volumes with the higher nickel concentration, in the grain boundary zones. The same factors explain the observed difference in the size and distribution of Ti3Ni4 precipitates in the grain boundary zone and the grain center.
The histogram of the nanocrystalline structure as well as exhibits a bimodal distribution of grains/subgrains which testifies to the different nature of recrystallized grains and nano-subgrains: under PDA, polygonization starts in the areas with the well-developed dislocation substructure and the crystallization of the grain starts in the amorphized areas [3,5].
The nature of the evolution of MTs is quite logical and well-studied in Ni-rich Ti-Ni alloy; its interrelation with specific features of microstructure is analyzed in [8,31]. The observed features of MTs in a material with various initial structure generally corresponds to known regularities.
A decrease in the concentration of structural defects with an increase in the PDA temperature to the “degeneration” of the B2→R transformation, the transition to a single-stage MT, narrowing of the transformation ranges due to an increase in the structural homogeneity of austenite, and their shift to higher temperatures [4,8,29].
After aging at 430°С of the initially cold-drawn material the defect density remains high enough (ρ ≅ 1010cм−2) [29] that creates serious obstacles for the movement of interphase boundaries and suppresses the formation of martensite. Following the Gaussian function, the fine-grained structure contains 25% of grains with a diameter of less than 2 μm (see Figure 1f), in which the formation of martensite is also suppressed due to the precipitation of dispersed Ti3Ni4 particles with a high density of their distribution [32]. Following «in situ» observations [31], the formation of cooling-induced martensite is also suppressed in the grain boundary zones with fine precipitates and their high density. Such structural inhomogeneity explains the expansion of the range of the direct MTs.
In a structure with an initial grain size of 9 μm, according to «in situ» observations [31], MTs in a grain with a heterogeneous distribution of precipitates proceed sequentially in different grain zones that differ in size, morphology and distribution density of precipitates. Such a structure contains all types of single-stage MTs inherent in aging Ti–Ni alloys [4]. Under cooling and heating, the forward MTs develop through an intermediate R-phase in the near-grain boundary zone. The single-stage В2→В19′ transformation proceeds in the central zone of the grain at the lower temperature [31]. This is caused by the violation of coherency in the area with the coarse precipitates with an average diameter of ~350 nm and the depletion of В2-austenite in nickel [25]. The sequence of MT is determined by dividing the grain into zones: the larger the grain size, the more zones.
Based on the results of calorimetric studies, the test temperatures corresponding to different phase states were selected for tensile tests were selected; the onset temperature Мs, also known as the temperature of slight deformation [3,4]) was chosen for all structural states.
Following the theory of internal friction, which describes the interaction of dislocations with the point defects, a decrease in Young’s modulus after plastic deformation is a natural consequence of an increase in the dislocation density [6,27,34,35]. It is also known that any discontinuities, for example, nanopores that appear in the process of significant plastic deformation, lead to a decrease in the E magnitudes [36,37,38]. In this regard, in the material with the highest defect density of (immediately after cold deformation (ρ ≅ 1012−13 cм−2) one could expect the minimum values of Е.
It is known, however, that, a highly inhomogeneous stress-strain state that arises under cold plastic deformation, causes the appearance of non-equilibrium structures of various scales and affects the elastic properties of the material [39].
Under the cold drawing processing, the material is subjected to tensile stresses, which accumulate internal stresses of the opposite sign, i.e., compressive, directed inwards the ingot [39]. During subsequent stretching under experimental conditions, internal compressive stresses contribute to the resistance to deformation, increasing Young’s modulus. The absence of a minimum at the Ms point (see Figure 5a) is explained by the suppression of all MTs in the deformed state, and the decrease in E values in the temperature range of 25–100°C is due to the relaxation of internal stresses during heating that is typical for materials without phase transformations [27].
The observed V-shaped elastic modulus curve after PDA (see Figure 4 and Figure 5) as a function of temperature is in good agreement [16,40,41].
Under annealing in the temperature range of 550–800°C, the dominant mechanism in Young’s modulus evolution is the process of irreversible relaxation which is accompanied by a decrease in the internal stresses, a decrease in the defect density of crystal lattice, polygonization, recrystallization, and the transition from non-equilibrium grain boundaries to equilibrium ones. For a material with a recrystallized structure with different grain sizes, the obtained values of E are in good agreement with the theory over the entire temperature range. The E values obtained in the material with UFG structure are generally lower than in the recrystallized material (see Figure 4). At test temperatures above −20°C, however, they exceed the E level obtained in a fine-grained material. The obvious reason is the shift of the Ms point of the UFG material concerning to the Ms point of the fine-grained one. However, in the temperature range above Af, Young’s modulus of the UFG material are higher than those of the fine-grained material. Note that the same values of E are realized in a nanostructured material obtained as a result of 10 h aging (see Figure 5a).
It can be assumed that the observed behavior of the UFG NiTi alloy is caused by the long-range residual stresses of the deformed B2-austenite, which contribute to an increase in the values of E [42] (in our case, to a change in the ratio of the values of E in the B2 austenite of the UFG material and fine-grained one, see Figure 4). High internal stresses can arise both due to different crystallographic orientation of grains/subgrains, as well as non-equilibrium state of grain boundaries [43,44,45]. In addition, it is necessary to take into account the effect of the specific features of texture, which also affects Young’s modulus [46]. The differences observed in the texture of nanocrystalline and recrystallized titanium nickelide are analyzed in detail in [24]; this problem, however, requires additional clarification).
The former like the B2-B19′ transition in TiNi alloys is a symmetry-lowering transition (also referred to thermoelastic martensitic transformation), presents a “V”-shaped elastic modulus curve as a function of temperature, and can be described by classical Landau theory [16].
The appearance of a minimum at the Ms point is associated with the implementation of a symmetry-lowering MT (see Figure 4 and Figure 5) which explains the lowest values of Young’s modulus.
The described regularities exhibit a good agreement with the data of [15,16,46], obtained after high-temperature solution treatment. The higher values of Young’s modulus in the cited works confirm the revealed nature of the synchronous growth of E values with the grain size in an alloy with finer structures (see Figure 3).
Thus, varying the grain/subgrain size makes it possible to adjust the values of Young’s modulus: its magnitude decreases with structure refinement. Nevertheless, the obtained results prove that it is impossible to obtain the E magnitude in the range of 10–30 GPa at an implant operating temperature of 37°C only due to microstructure refinement. The E values in this range are realized in an alloy with UFG and a fine-grained structure at temperatures below −50°C (see Figure 4).
The revealed regularities allow us to conclude that the reduction of Young’s modulus to the desired values can be obtained through aging. According to [27] the precipitation of new phases from a supersaturated solid solution is accompanied by a change in the elastic modulus. In this case, the value of E is affected not only by the change in the chemical composition and the lattice period of the matrix, but also by the magnitude of the distortion of the crystal lattice of the precipitated particles and the magnitude of the elastic modulus [27]. The corresponding data on the E magnitude of the Ti3Ni4 precipitates would be surely useful in explaining the observed decrease in Young’s modulus under aging, but they were not discovered in the published articles. Nevertheless, it is known that the Ti3Ni4 phase has a rhombohedral crystal lattice, the symmetry of which is lower than that of B2-austenite and higher than that of B19-martensite [4].
Based on the revealed patterns we can conclude that the efficiency of aging on the elastic modulus of titanium nickelide is determined by the features of the initial structure, in particular, the defects density and their distribution in the crystal lattice, as well as the grain size. The shift in the minimum of V-shaped curves on the diagrams presented in Figure 4 and Figure 5 exactly coincides with the shift in the position of the Ms point on the calorimetric curves that permits us to judge the efficiency of aging as well.
In a cold-worked material, the competing processes of aging and softening proceed simultaneously at a temperature of 430°C. The observed decrease E magnitude after aging (Figure 5 and Figure 6) suggests that the elastic modulus is more sensitive to aging compared to softening.
The observed identity of the values of Е after aging of an alloy with different initial structures allows us to conclude that Young’s modulus is insensitive to the size of the Ti3Ni4 precipitates and the nature of their distribution, although these structural differences are quite pronounced (the effect of the initial structure on aging-induced microstructure was described in details in [8].
According to [12], the femoral cortical bone exhibits the value of T = 18 GPa and tensile yield stress 130 MPa in a longitudinal direction. An aged fine-grained titanium nickelide exhibits the same magnitude E at 37°C (see Figure 5) and the most close magnitude of stress plateau (200 MPa) to the cortical bone tissue.
It is important to note, that the transformation yield stress in a fine-grained exhibits an excellent agreement with that of a human bone, therefore we can evaluate the corresponding structure as the most preferred for the bone implant.
The regularities obtained can be used to predict the complex of functional and mechanical properties formed as a result of the aging of titanium nickelide with different initial structures.
5. Conclusions
- Variation of the initial structure of Ni-rich NiTi alloy when using the same aging mode makes it possible to precise control of the kinetics, sequence, and stages of martensitic transformations
- The grain/subgrain size of B2-austenite together with the aging-induced microstructure, exhibits a pronounced effect on Young’s modulus magnitude. This effect is ambiguous for a material with a grain size of 0.13–3 µm and depends on the test temperature. The highest values of E = 32–55 GPa over the entire temperature range are realized in a recrystallized alloy with a grain size of 9 μm.
- Aging of the recrystallized material results in a decrease in Young’s modulus over the entire test temperature range in an as-deformed material brings a decrease in Young’s modulus in the range of −196<Т<25°С (E can be adjusted by varying grain/subgrain size and aging).
- After PDA the temperature dependence of Young’s modulus exhibits a pronounced V-shaped character with a minimum at the onset temperature of the forward martensitic transformation Ms, regardless of the structure. The Young’s modulus is always higher in the region of existence of metastable B2-austenite compared to B19’-martensite due to the higher symmetry of the austenite crystal lattice. The exception is an as-deformed material, which is characterized by the suppression of martensitic transformations and significant residual stresses.
- The observed decrease in E due to the aging of an as-deformed material proves that its magnitude is more sensitive to aging than to softening.
- The effectiveness of aging on Young’s modulus reduction depends on the initial structure: it is most pronounced in an alloy with a relatively coarse grain size of 9 µm and brings a decrease by 3.8 times at a temperature of 37°C.
- Aging provides an equivalent magnitude of Young’s modulus in a wide temperature range, regardless of the of the initial structural state. The revealed identity of the E magnitudes after aging of the alloy with different initial structure proves that the value of E is insensitive to the size and distribution of the Ti3Ni4 precipitates.
- Bone-like elastic modulus (10–30 GPa) at a human body temperature of 37°C is realized in an aged fine-grained NiTi alloy. An ultrafine-grained substructure exhibits he same values of Young’s modulus in the low temperature range from −100°С to 25°С.
- It is important to note, that the transformation yield stress in a fine-grained titanium nickelide exhibits a good agreement with yield stress of a human bone, therefore we can evaluate the corresponding structure as the most preferred for the bone implant.
- The revealed regularities can be used in the development of intelligent devices for medical purposes.
Author Contributions
Conceptualization, E.R.; methodology, E.R., V.K. and K.P., software, K.P. and S.M.; validation, E.R. and K.P., formal analysis, E.R. and K.P.; investigation, K.P., V.K., E.R., and N.R.; resources, V.A.; data curation E.R., writing—original draft preparation, E.R.; writing—review and editing, E.R. and K.P.; visualization, K.P. and S.M.; supervision, E.R. and K.P. All authors have read and agreed to the published version of the manuscript.
Funding
The reported study was performed with the financial support of the state task of NUST MISIS (Project Code FSME-2023-0006).
Data Availability Statement
Not applicable.
Conflicts of Interest
The authors declare no conflict of interest. The funders had no role in the design of the study; in the collection, analyses, or interpretation of data; in the writing of the manuscript; or in the decision to publish the results.
References
- Auricchio, F., Boatti E., Conti, M., Marconi, S. SMA biomedical applications. Shape Memory Alloy Engineering: For Aerospace, Structural, and Biomedical Applications. Butterworth-Heinemann. 2021. pp. 627–658.
- Mohd-Jani, J.; Leary, M.; Subic, A.; Gibson, M.A. A review of shape memory alloy research, applications and opportunities. Mater. Des. 2014, 56, 1078–1113. [Google Scholar] [CrossRef]
- Brailovski, V, Prokoshkin, S, Terriault, P, Trochu, F Shape memory alloy: fundamentals, modeling and applications. ETS Publ, Montreal, 2003; 861 p.
- Otsuka, K.; Ren, X. Physical metallurgy of Ti–Ni-based shape memory alloys. Prog. Mater. Sci. 2005, 50, 511–678. [Google Scholar] [CrossRef]
- Resnina, N., Rubanik, V. Shape memory alloys: properties, technologies, opportunities, Publisher: Trans Tech Publications, Switzerland, 2015, 640 p.
- Khalil-Allafi, J.; Eggeler, G.; Dlouhy, A.; Schmahl, W.; Somsen, C. On the influence of heterogeneous precipitation on martensitic transformations in a Ni-rich NiTi shape memory alloy. Mater. Sci. Eng. A 2004, 378, 148–151. [Google Scholar] [CrossRef]
- Kim, J.; Miyazaki, S. Effect of nano-scaled precipitates on shape memory behavior of Ti-50.9at.%Ni alloy. Acta Mater. 2005, 53, 4545–4554. [Google Scholar] [CrossRef]
- Ryklina, E.P.; Polyakova, K.A.; Resnina, N.N. Role of Structural Heredity in Aging-Induced Microstructure and Transformation Behavior in Ni-rich Titanium Nickelide. Shape Mem. Superelasticity 2022, 8, 200–214. [Google Scholar] [CrossRef]
- Ryklina, E.P., Prokoshkin, S.D., Khmelevskaya, I.Yu., Shakhmina, A.A. One-way and two-way shape memory effect in thermomechanically treated TiNi-based alloys Mat. Sci. Eng. A 2008, 481-482 (1-2 C), 134 – 137.
- Wilson. J., Metallic biomaterials: State of the art and new challenges, Fundamental Biomaterials: Metals, Woodhead Publishing Series in Biomaterials, 2018, pp. 1-33.
- Nicholson, P.; Cheng, X.; Lowet, G.; Boonen, S.; Davie, M.; Dequeker, J.; Van der Perre, G. Structural and material mechanical properties of human vertebral cancellous bone. Med Eng. Phys. 1997, 19, 729–737. [Google Scholar] [CrossRef] [PubMed]
- Morgan, Elise F. , Ginu, U. Unnikrisnan, Amira, I. Hussein Bone Mechanical Properties in Healthy and Diseased States. Annu Rev Biomed Eng. 2018, 20, 119–143.
- Davis, JR. Handbook of materials for medical devices. Materials Park (OH): ASM International; 2003; 341 p.
- Kohrt, W, Bloomfield, S, Little, K, Nelson, M, Yingling, V; American College of Sports Medicine Position Stand: physical activity and bone health. Med Sci Sports Exerc. 36(11), 1985–96. [CrossRef] [PubMed]
- Pushin, V. G., Prokoshkin, S. D., R. Z. Valiev, et al., Titanium Nickelide Alloys with Shape memory Effect. Part 1. Structure, Phase Transformations and Properties, lzd-vo UrO RAN, Ekaterinburg, 2006 [in Russian].
- Xu, Zhizhi ; Hao, Yanshuang ; Ji, Yuanchao ; Xiao, Andong ; Qian, Yu ; Wang, Wenjia ; Ren, Xiaobing Simultaneously Increasing the Strength and Decreasing the Modulus in TiNi Alloys via Plastic Deformation. Scr Mater. 2022, 209, p 114374. [CrossRef]
- Šittner, P.; Heller, L.; Pilch, J.; Curfs, C.; Alonso, T.; Favier, D. Young’s Modulus of Austenite and Martensite Phases in Superelastic NiTi Wires. J. Mater. Eng. Perform. 2014, 23, 2303–2314. [Google Scholar] [CrossRef]
- Thomasová, M., Seiner, H., Sedlák, P., Frost, M., Ševčík, M., Szurman, I., Kocich, R., Drahokoupil, J., Šittner, P., Landa, M. Evolution of macroscopic elastic moduli of martensitic polycrystalline NiTi and NiTiCu shape memory alloys with pseudoplastic straining Acta Mater. 2017, 123, pp. 146 – 156.
- Ryklina, E.P.; Polyakova, K.A.; Murygin, S.R.; Komarov, V.S.; Resnina, N.N.; Andreev, V.A. Role of Structural Heredity in Control of Functional and Mechanical Characteristics of Ni-Rich Titanium Nickelide. Phys. Met. Met. 2022, 123, 1226–1233. [Google Scholar] [CrossRef]
- Gunderov, D.V., Maksutova, G., Churakova, A., Lukyanov, A., Kreitcberg, A., Raab, G.I., Sabirov, I., Prokoshkin, S. Strain rate sensitivity and deformation activation volume of coarse-grained and ultrafine-grained TiNi alloys Scr. Mater., 2015 102, 99 - 102.
- Sheremetyev, V.; Lukashevich, K.; Kreitcberg, A.; Kudryashova, A.; Tsaturyants, M.; Galkin, S.; Andreev, V.; Prokoshkin, S.; Brailovski, V. Optimization of a thermomechanical treatment of superelastic Ti-Zr-Nb alloys for the production of bar stock for orthopedic implants. J. Alloy. Compd. 2022, 928, 167143. [Google Scholar] [CrossRef]
- Sheremetyev, V.; Kudryashova, A.; Dubinskiy, S.; Galkin, S.; Prokoshkin, S.; Brailovski, V. Structure and functional properties of metastable beta Ti-18Zr-14Nb (at.%) alloy for biomedical applications subjected to radial shear rolling and thermomechanical treatment. J. Alloy. Compd. 2018, 737, 678–683. [Google Scholar] [CrossRef]
- Betekhtin, V.I., Kolobov, Y., Golosova, O., Dvorak, J., Sklenička, V., Kardashev, B.K., Kadomtsev, A.G., Narykova, M., Ivanov, M., Elastic modulus, microplastic properties and durability of titanium alloys for biomedical applications. Rev. Adv. Mater. Sci 2016, 45. 42-51.
- Ryklina, E.P., Polyakova, K.A., Murygin, S.R., Isaenkova, M.G., Zaripova, M.M., Fesenko, V.A., Komarov, V.S., Andreev, N.V., Resnina, N.N., Andreev, V.A. On Textural Heredity of Ni-rich Ti–Ni alloy: Specific Features of Transformation and Tensile Behavior Shap. Mem. Superelasticity 2023.
- Kolobova, A.Y., Ryklina, E.P., Prokoshkin, S.D., Inaekyan, K.E., Brailovskii, V. Study of the Evolution of the Structure and Kinetics of Martensitic Transformations in a Titanium Nickelide upon Isothermal Annealing after Hot Helical Rolling Phys. Met. Metall. 2018, 119 (2), 134–145.
- Poletika, T.M., Girsova, S.L., Lotkov, A.I. Ti3Ni4 precipitation features in heat-treated grain/subgrain nanostructure in Ni-rich TiNi alloy Intermet. 2020, 127, № 106966.
- Lifshits, B.G., Kraposhin, V.S., Linetsky Y.L. Physical properties of metals and alloys. M.: Metallurgy. 1980. 320 p. [in Russian].
- Sun, Z., S. Hao, G. Kang, Y. Ren, J. Liu, Y. Yang, X. Kong, B. Feng, C. Wang, K. Zhao, L. Cui, Exploiting ultra-large linear elasticity over a wide temperature range in nanocrystalline NiTi alloy J. Mater. Sci. Technol. 2020, 57 197–203.
- Prokoshkin, S., Brailovski V., Inaekyan K., Korotitskiy A., Kreitsberg A. Thermomechanical Treatment of TiNi Intermetallicc-Based Shape Memory Alloys In Book Shape Memory Alloys: Properties, Thechnologies, Opportunities Ed. N. Resnina and V. Rubanik. 2015, pp. 260-341.
- Gorelik, S.S., Dobatkin, S.V., Kaputkina, L.M. Rekrystallizatsiya metallov i splavov [Recrystallization of Metals and Alloys], MISIS Publ., Moscow, 2005 432 p. [in Russian].
- Karbakhsh Ravari, B., Farjami, S., Nishida, M. Effects of Ni concentration and aging conditions on multistage martensitic transformation in aged Ni-rich Ti–Ni alloys Acta Mater. 2014, 69, 17–29.
- Wang, X.; Li, C.; Verlinden, B.; Van Humbeeck, J. Effect of grain size on aging microstructure as reflected in the transformation behavior of a low-temperature aged Ti–50.8at.% Ni alloy. Scr. Mater. 2013, 69, 545–548. [Google Scholar] [CrossRef]
- Zel’dovich, V.I., Khomskaya, I.V., Frolova, N.Yu., Sbitneva, G.A., Nucleation of the R martensite in titanium nickelide Phys. Met. Metall. 2001 92(5), 490-495.
- Nikanorov, S.P., Kardashev, B.K., Elasticity and Dislocation Inelasticity of Crystals, Moscow: Nauka, 1985, 256 p.
- Gremaud, G. Dislocation-Point Defects Interactions. Mater. Sci. Forum 1993, 119-121, 771–774. [Google Scholar] [CrossRef]
- Chaim, R., Hefetz, M., Effect of Grain Size on Elastic Modulus and Hardness of Nanocrystalline ZrO2–3 wt % Y2O3 Ceramic, J. Mater. Sci., 2004, 39, 3057–3061.
- Huang, H.; Spaepen, F. Tensile testing of free-standing Cu, Ag and Al thin films and Ag/Cu multilayers. Acta Mater. 2000, 48, 3261–3269. [Google Scholar] [CrossRef]
- Zhu, K.; Li, C.; Zhu, Z.; Liu, C.S. Measurement of the dynamic Young’s modulus of porous titanium and Ti6Al4V. J. Mater. Sci. 2007, 42, 7348–7353. [Google Scholar] [CrossRef]
- Lin, J.; Balint, D.; Pietrzyk, M. Microstructure evolution in metal forming processes; Sawston, Reino Unido: Woodhead Publishing; 2012 416 p. [CrossRef]
- Zhang, Zh., Wang, Yu, , Wang, D., Zhou Y., Otsuka, K., Ren X. Phase diagram of Ti50−xNi50+x: Crossover from martensite to strain glass Phys. Rev. B 2010 81, 224102.
- Miyazaki, S.; Ohmi, Y.; Otsuka, K.; Suzuki, Y. Characteristics of deformation and transformation pseudoelasticity in Ti-Ni alloys. J. De Phys. Colloq. 1982, 43, C4–255. [Google Scholar] [CrossRef]
- Chernov, V.M., Kardashev, B.K., Krjukova, L.M., Mamaev, L.I., Plaksin, O.A., Rusanov, A.E., Solonina, M.I., Stepanov, V.A., Votinova, S.N., and Zavialski, L.P., Internal Friction and Anelastic Properties of Vanadium and V-Ti-Cr Alloys, J. Nucl. Mater., 1998, 257, 263–273.
- Dudarev, E.F.; Pochivalova, G.P.; Kolobov, Y.R.; Kashin, O.A.; Galkina, I.G.; Girsova, N.V.; Valiev, R.Z. True Grain-Boundary Slipping in Coarse- and Ultrafine-Grained Titanium. Russ. Phys. J. 2004, 47, 617–625. [Google Scholar] [CrossRef]
- Liu, Y.; Zhou, J.; Ling, X. Impact of grain size distribution on the multiscale mechanical behavior of nanocrystalline materials. Mater. Sci. Eng. A 2010, 527, 1719–1729. [Google Scholar] [CrossRef]
- Alhajeri, S.N.; Fox, A.G.; Langdon, T.G. A convergent-beam electron diffraction study of strain homogeneity in severely strained aluminum processed by equal-channel angular pressing. Acta Mater. 2011, 59, 7388–7395. [Google Scholar] [CrossRef]
- Kardashev, B. K., Narykova, M. V., Betekhtin, V. I., Kadomtsev, A. G. Evolution of Elastic Properties of Ti and Its Alloys due to Severe Plastic Deformation Phys. Mesomech. 2020, 23, 193–198. [CrossRef]
Figure 1.
Microstructure after PDA and corresponding histograms: (a−d) 550°C, 0,5 h, TEM, BF (a) and DF (b) images, the SAED negatives (c), and histogram (d); (e, f) 600°C, 1 h, SEM (e) and histogram (f); (g, h): 800°C, 1 h, SEM (g) and histogram (h).
Figure 1.
Microstructure after PDA and corresponding histograms: (a−d) 550°C, 0,5 h, TEM, BF (a) and DF (b) images, the SAED negatives (c), and histogram (d); (e, f) 600°C, 1 h, SEM (e) and histogram (f); (g, h): 800°C, 1 h, SEM (g) and histogram (h).
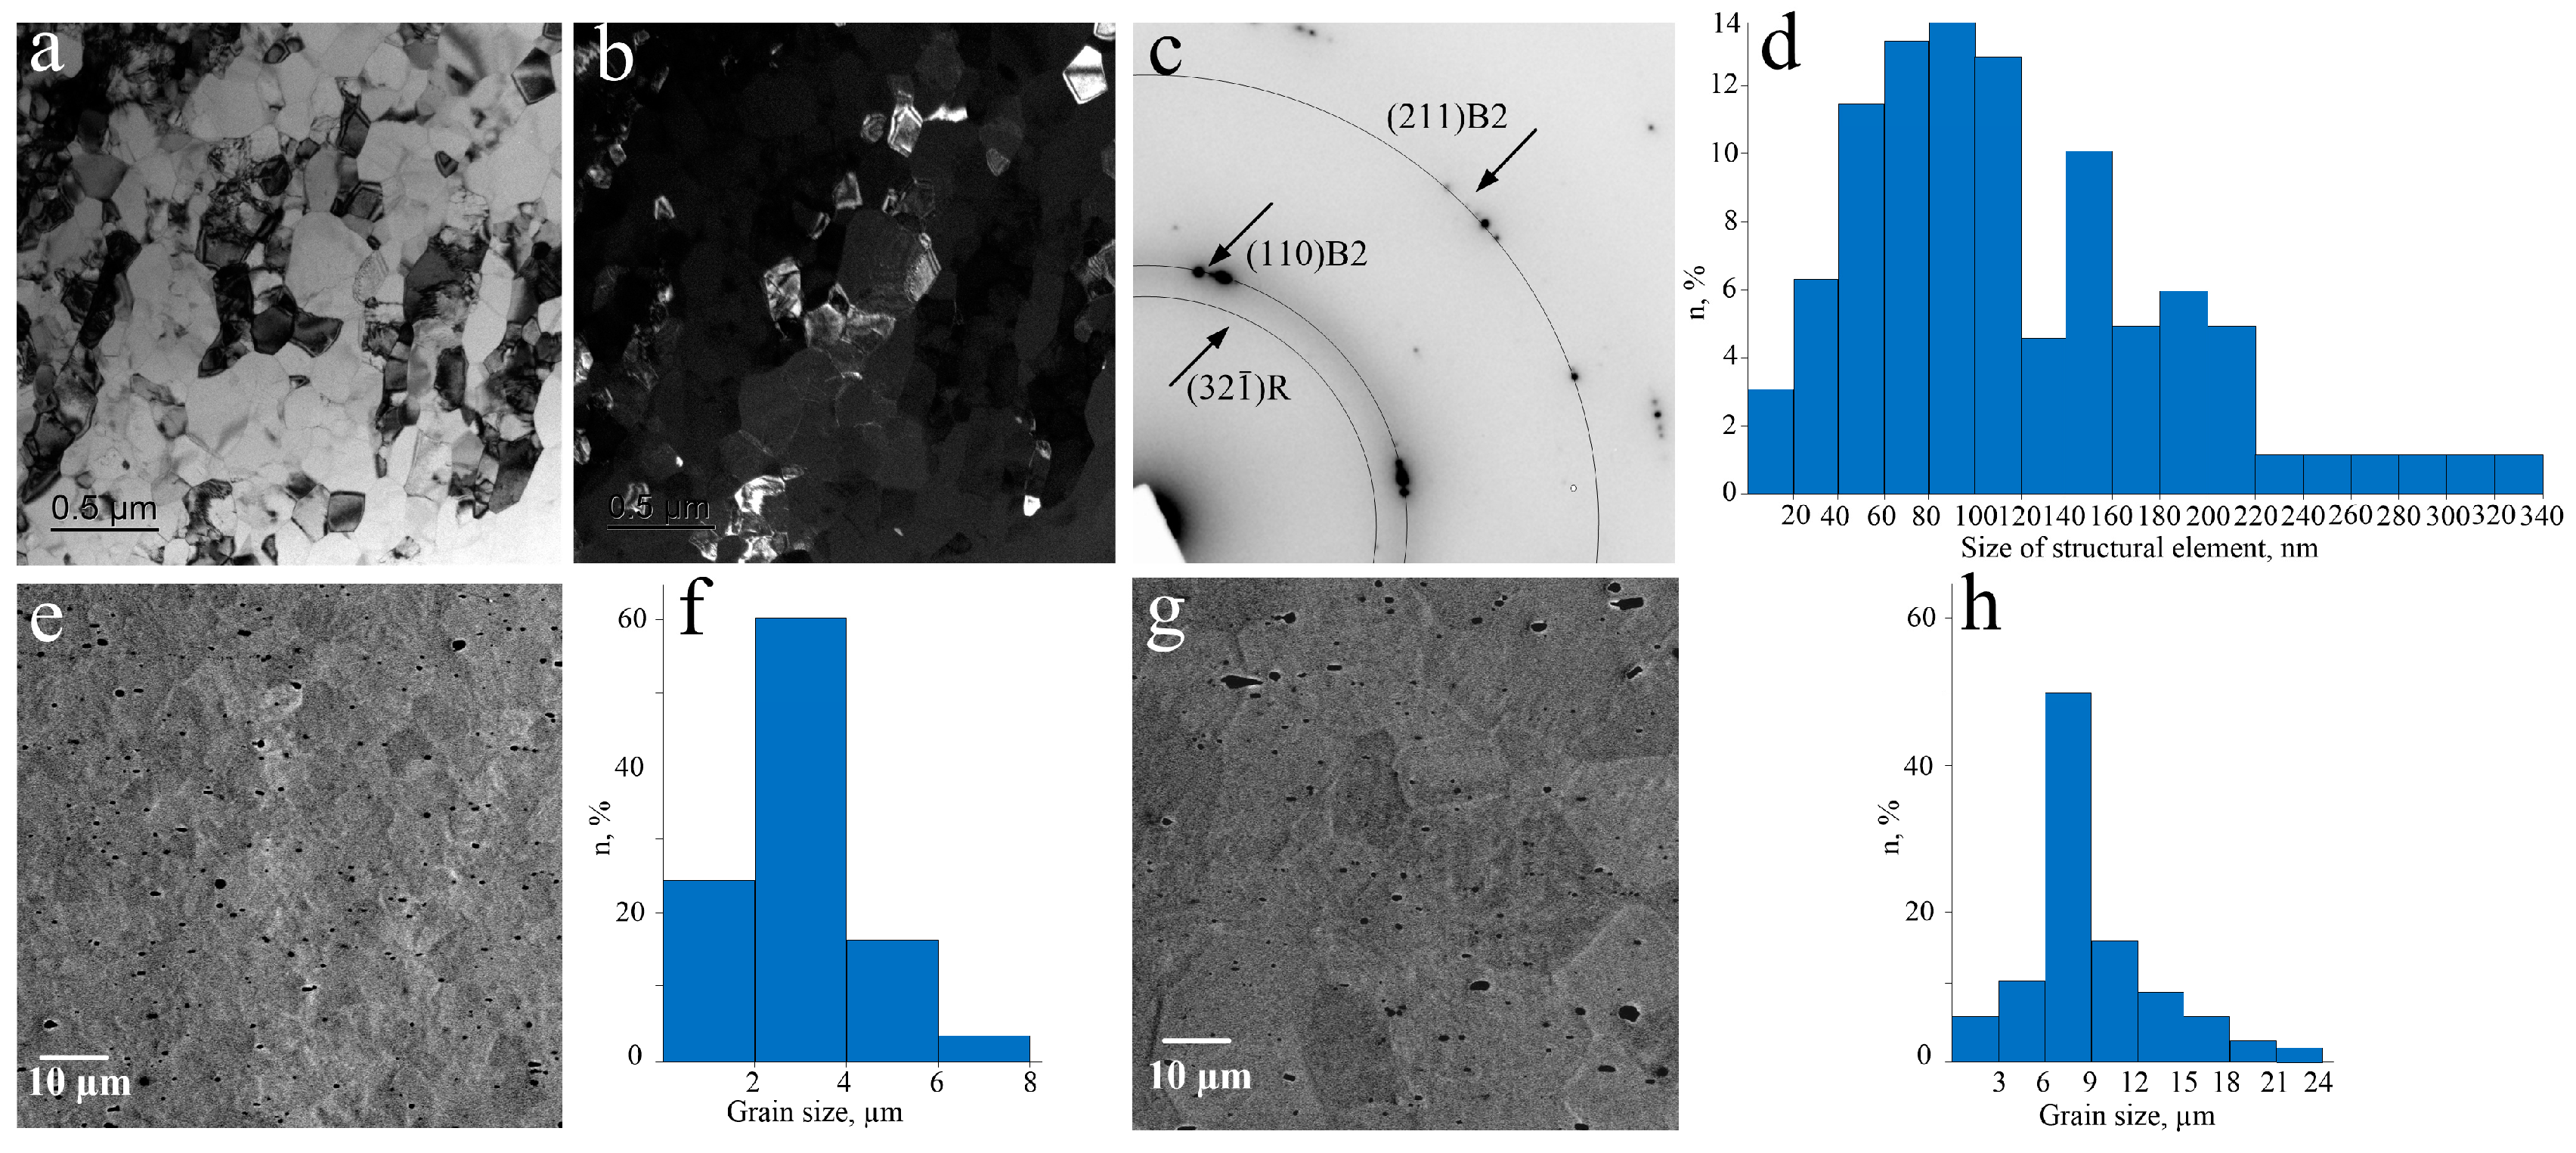
Figure 2.
TEM microstructure after aging at 430°C, 10 h using various initial states: (a−d) initial as-deformed structure, BF (a) and DF (b) images the SAED negative (c), and histogram (d); (e, f) initial fine-grained structure with the average grain size of 3 µm (preliminary PDA 600°C, 1 h); (g, h) initial coarse-grained structure with the average grain size of 9 µm (preliminary PDA 800°C, 1 h).
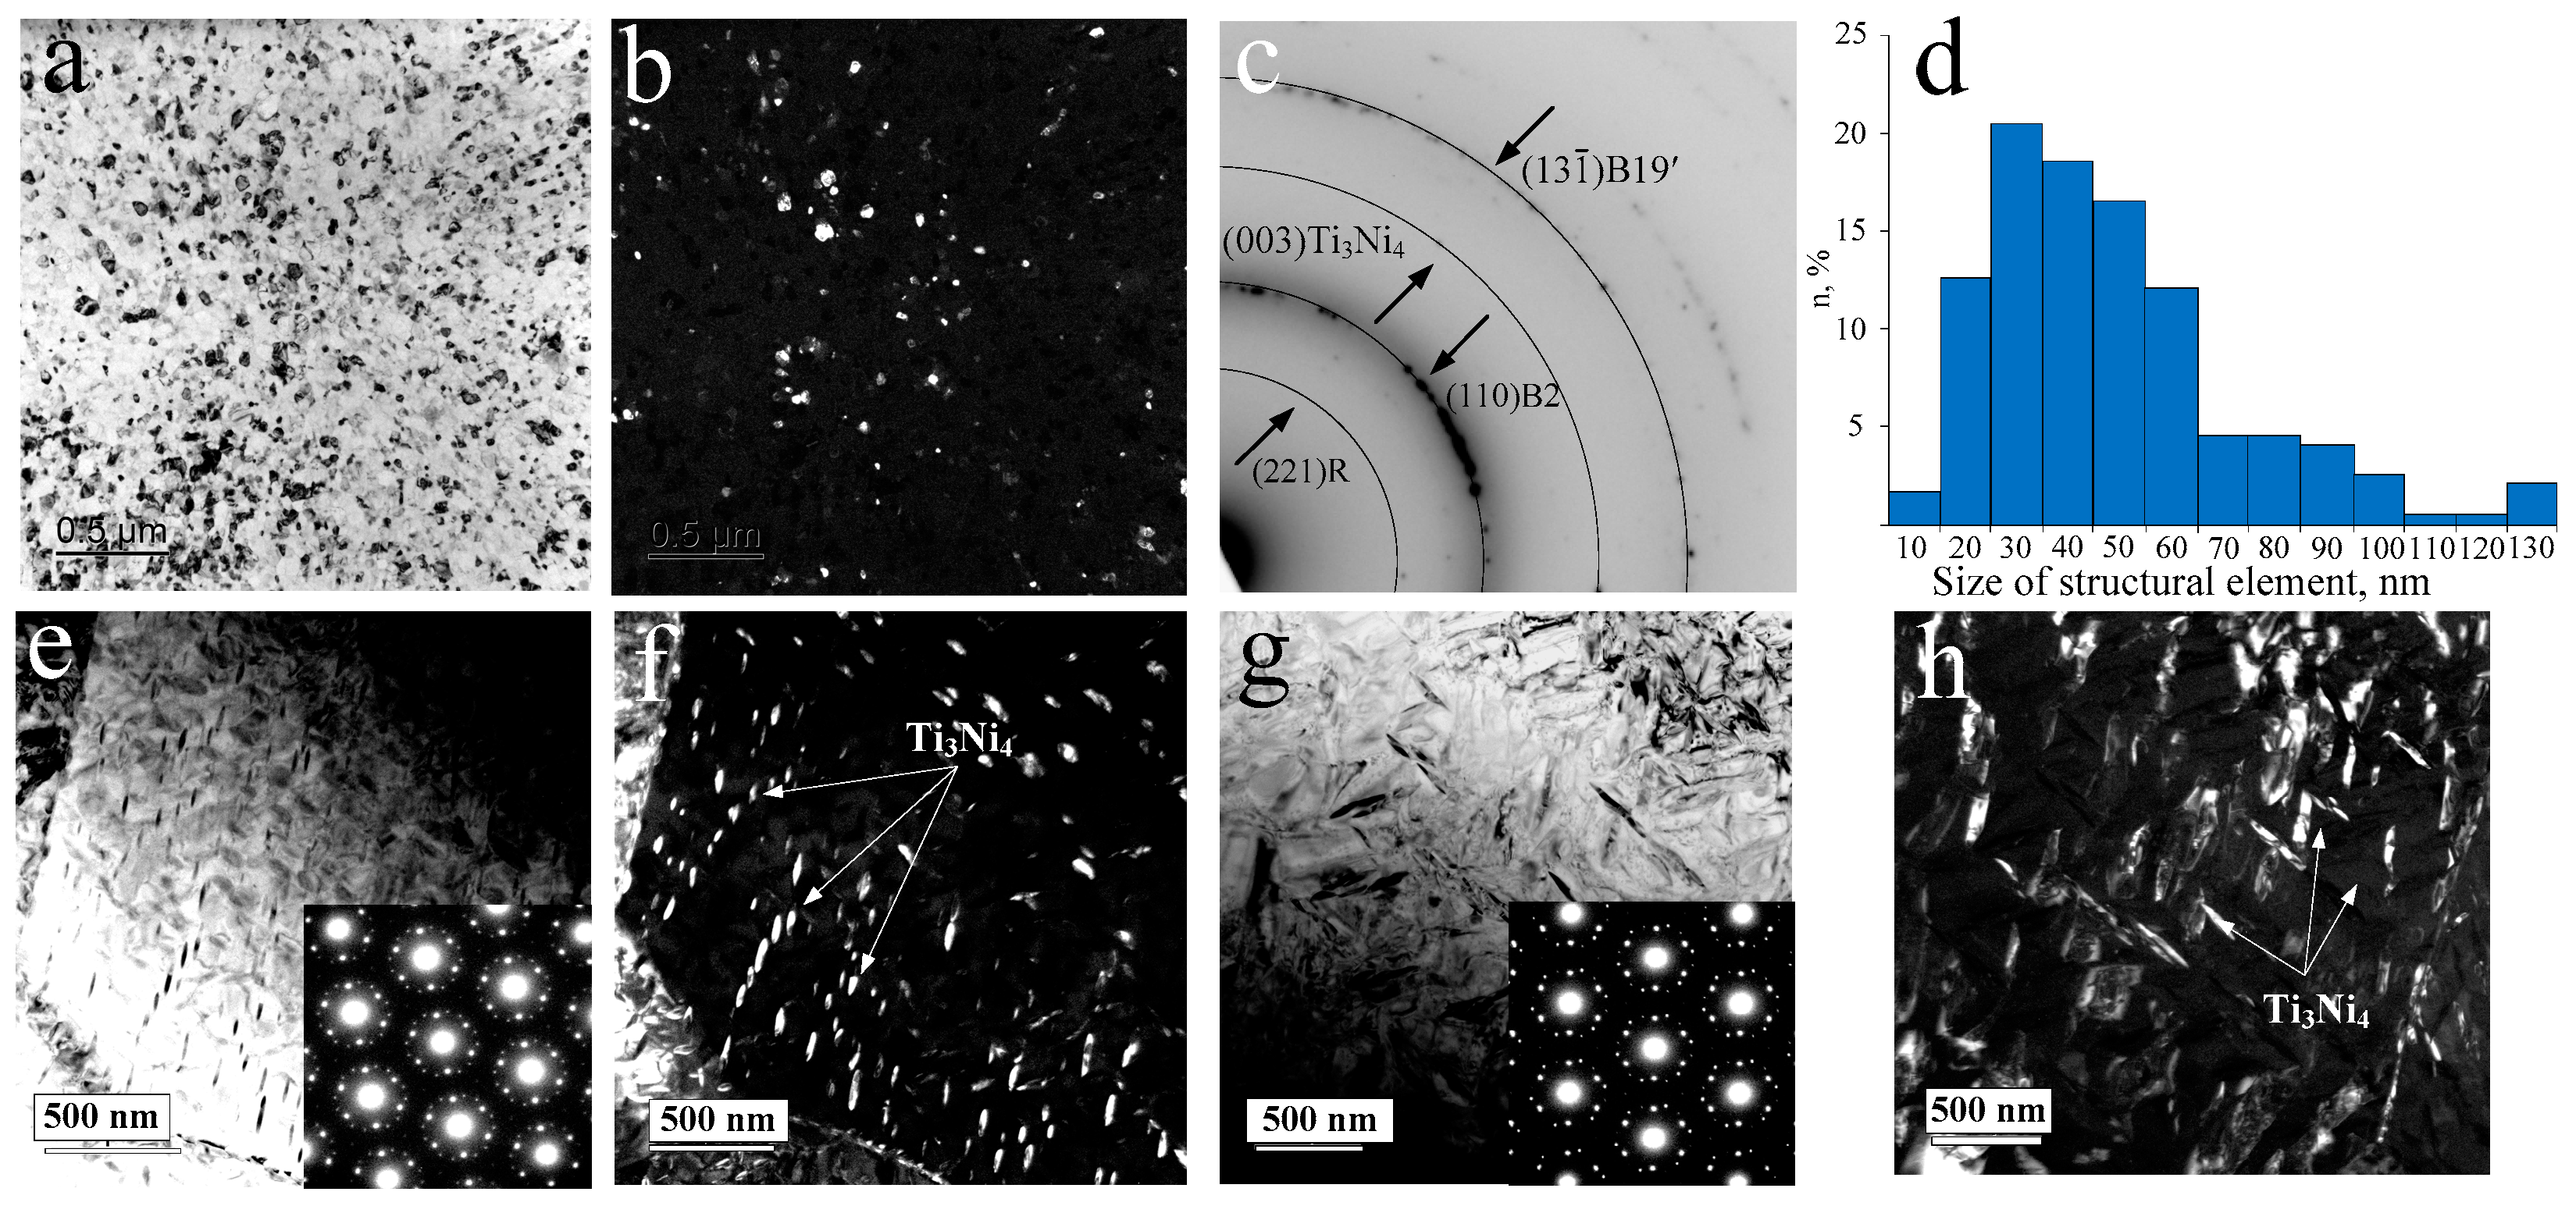
Figure 3.
Calorimetric curves: cooling (upper, blue) and heating (lower, red) after the cold drawing (CD) and PDA (a); (b) 600°C, 1 h (b); 800°C, 1 h (c).
Figure 3.
Calorimetric curves: cooling (upper, blue) and heating (lower, red) after the cold drawing (CD) and PDA (a); (b) 600°C, 1 h (b); 800°C, 1 h (c).
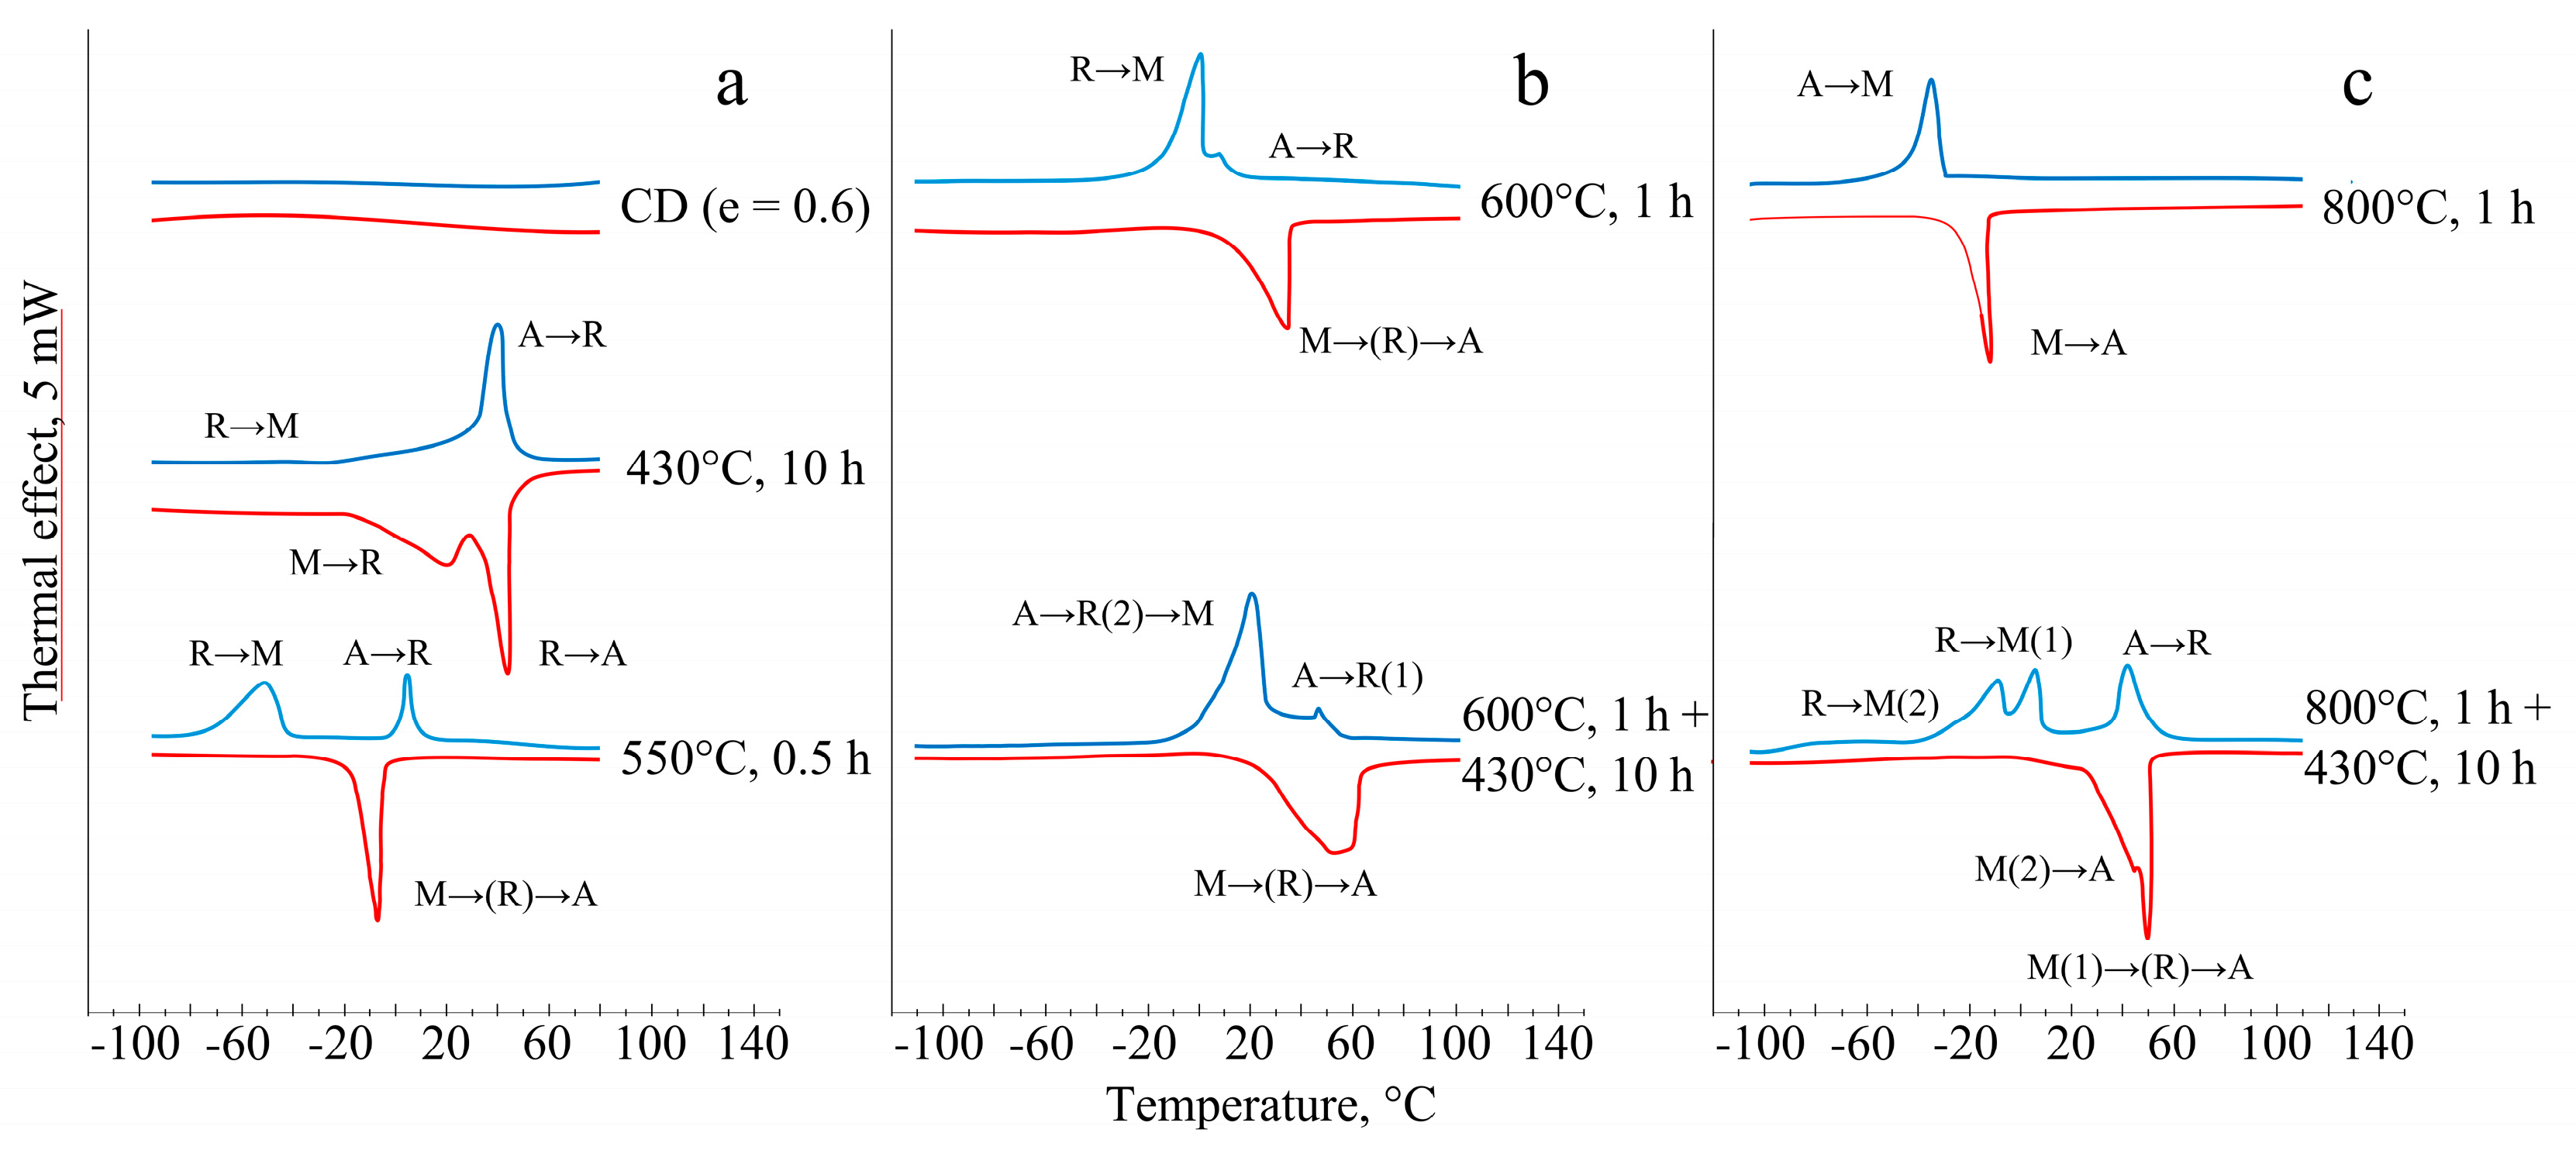
Figure 4.
Test temperature dependence of Young’s modulus of titanium nickelide with different grain/subgrain sizes: a) 130 nm (550°C, 30 min); b) 3 µm (600°С, 1 h); c) 9 µm (800°C, 1 h); symbols ∇ and ▼ denote Ms and Af points, respectively.
Figure 4.
Test temperature dependence of Young’s modulus of titanium nickelide with different grain/subgrain sizes: a) 130 nm (550°C, 30 min); b) 3 µm (600°С, 1 h); c) 9 µm (800°C, 1 h); symbols ∇ and ▼ denote Ms and Af points, respectively.
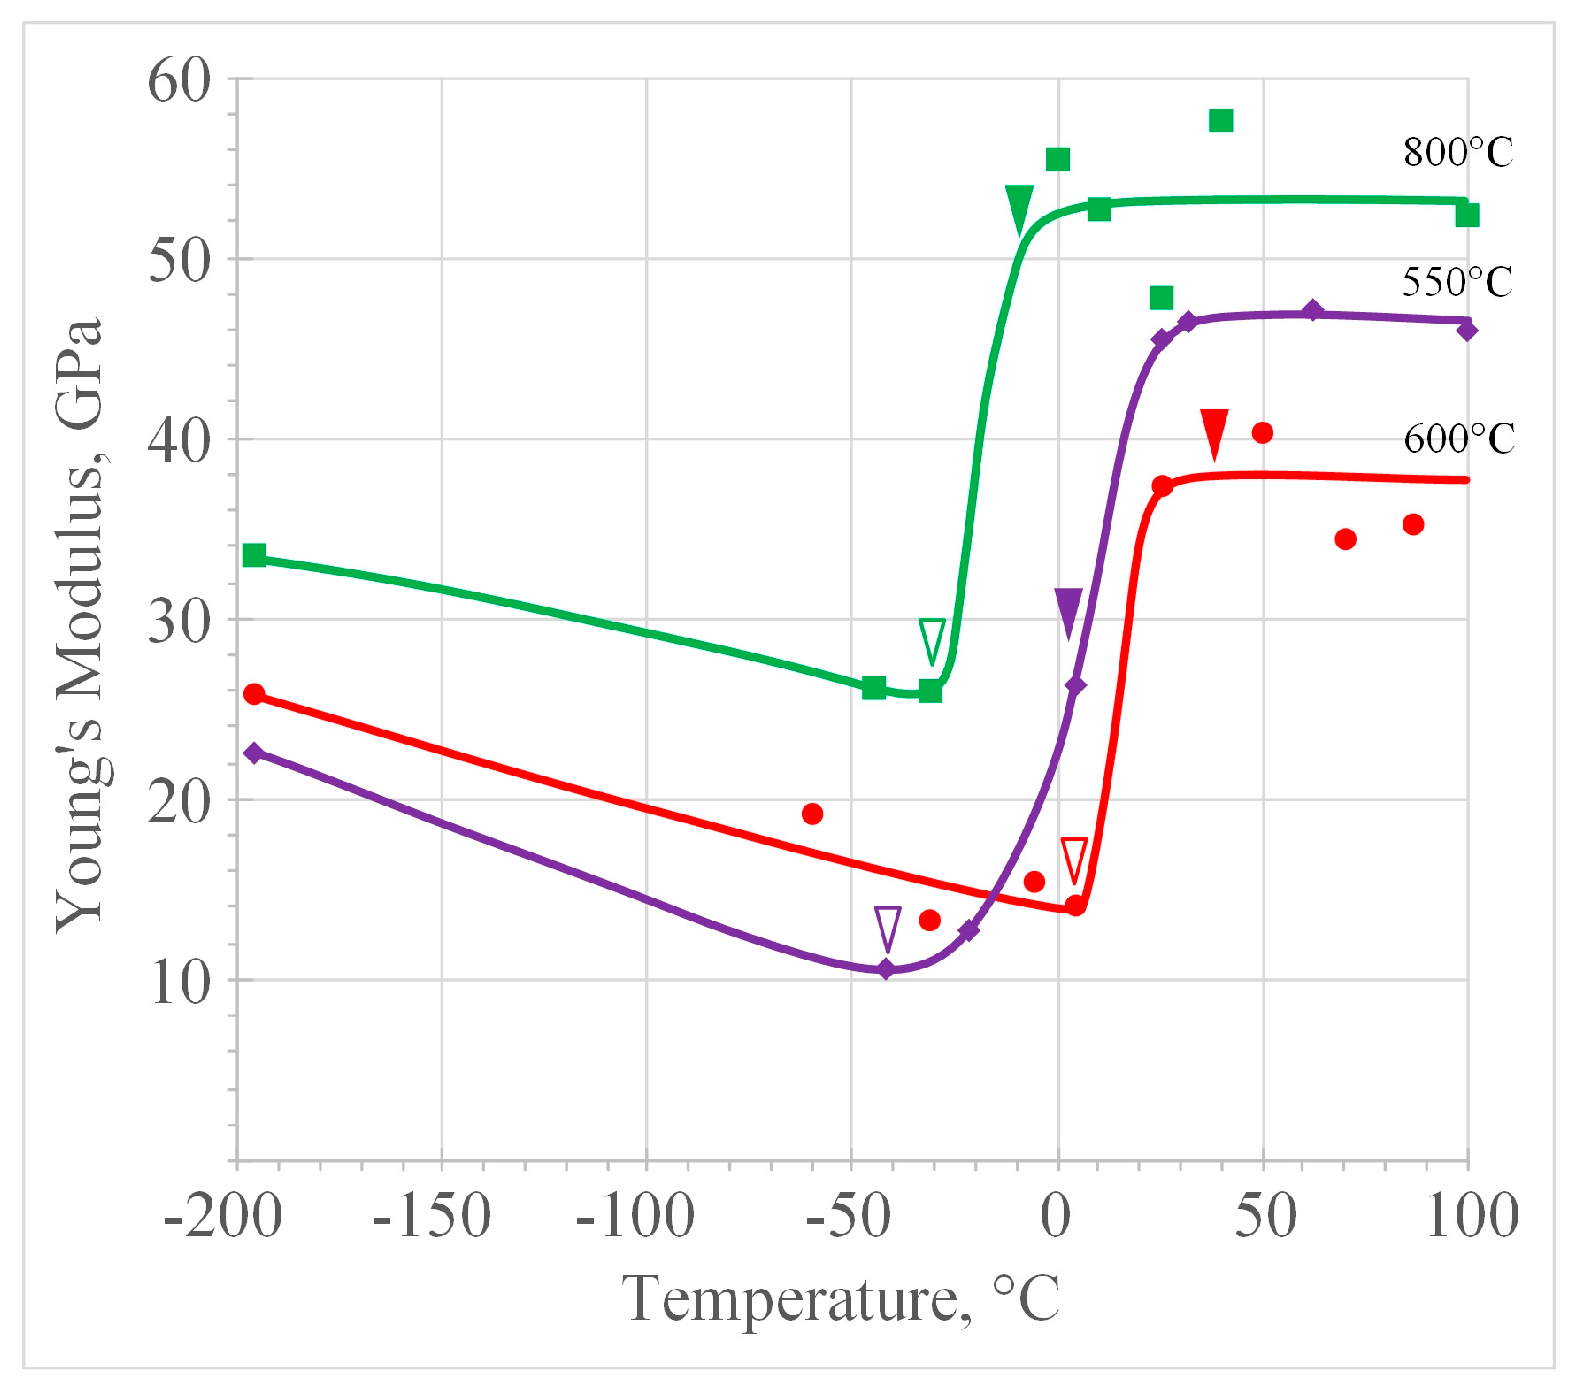
Figure 5.
Evolution of Young’s modulus before aging a) as-deformed; b) 600°С, 1 h; c) 800°С, 1 h (blue curves) and after aging at 430°С, 10 h (red curves); the symbols ∇ and ▼ denote the points Ms and Af, respectively.
Figure 5.
Evolution of Young’s modulus before aging a) as-deformed; b) 600°С, 1 h; c) 800°С, 1 h (blue curves) and after aging at 430°С, 10 h (red curves); the symbols ∇ and ▼ denote the points Ms and Af, respectively.
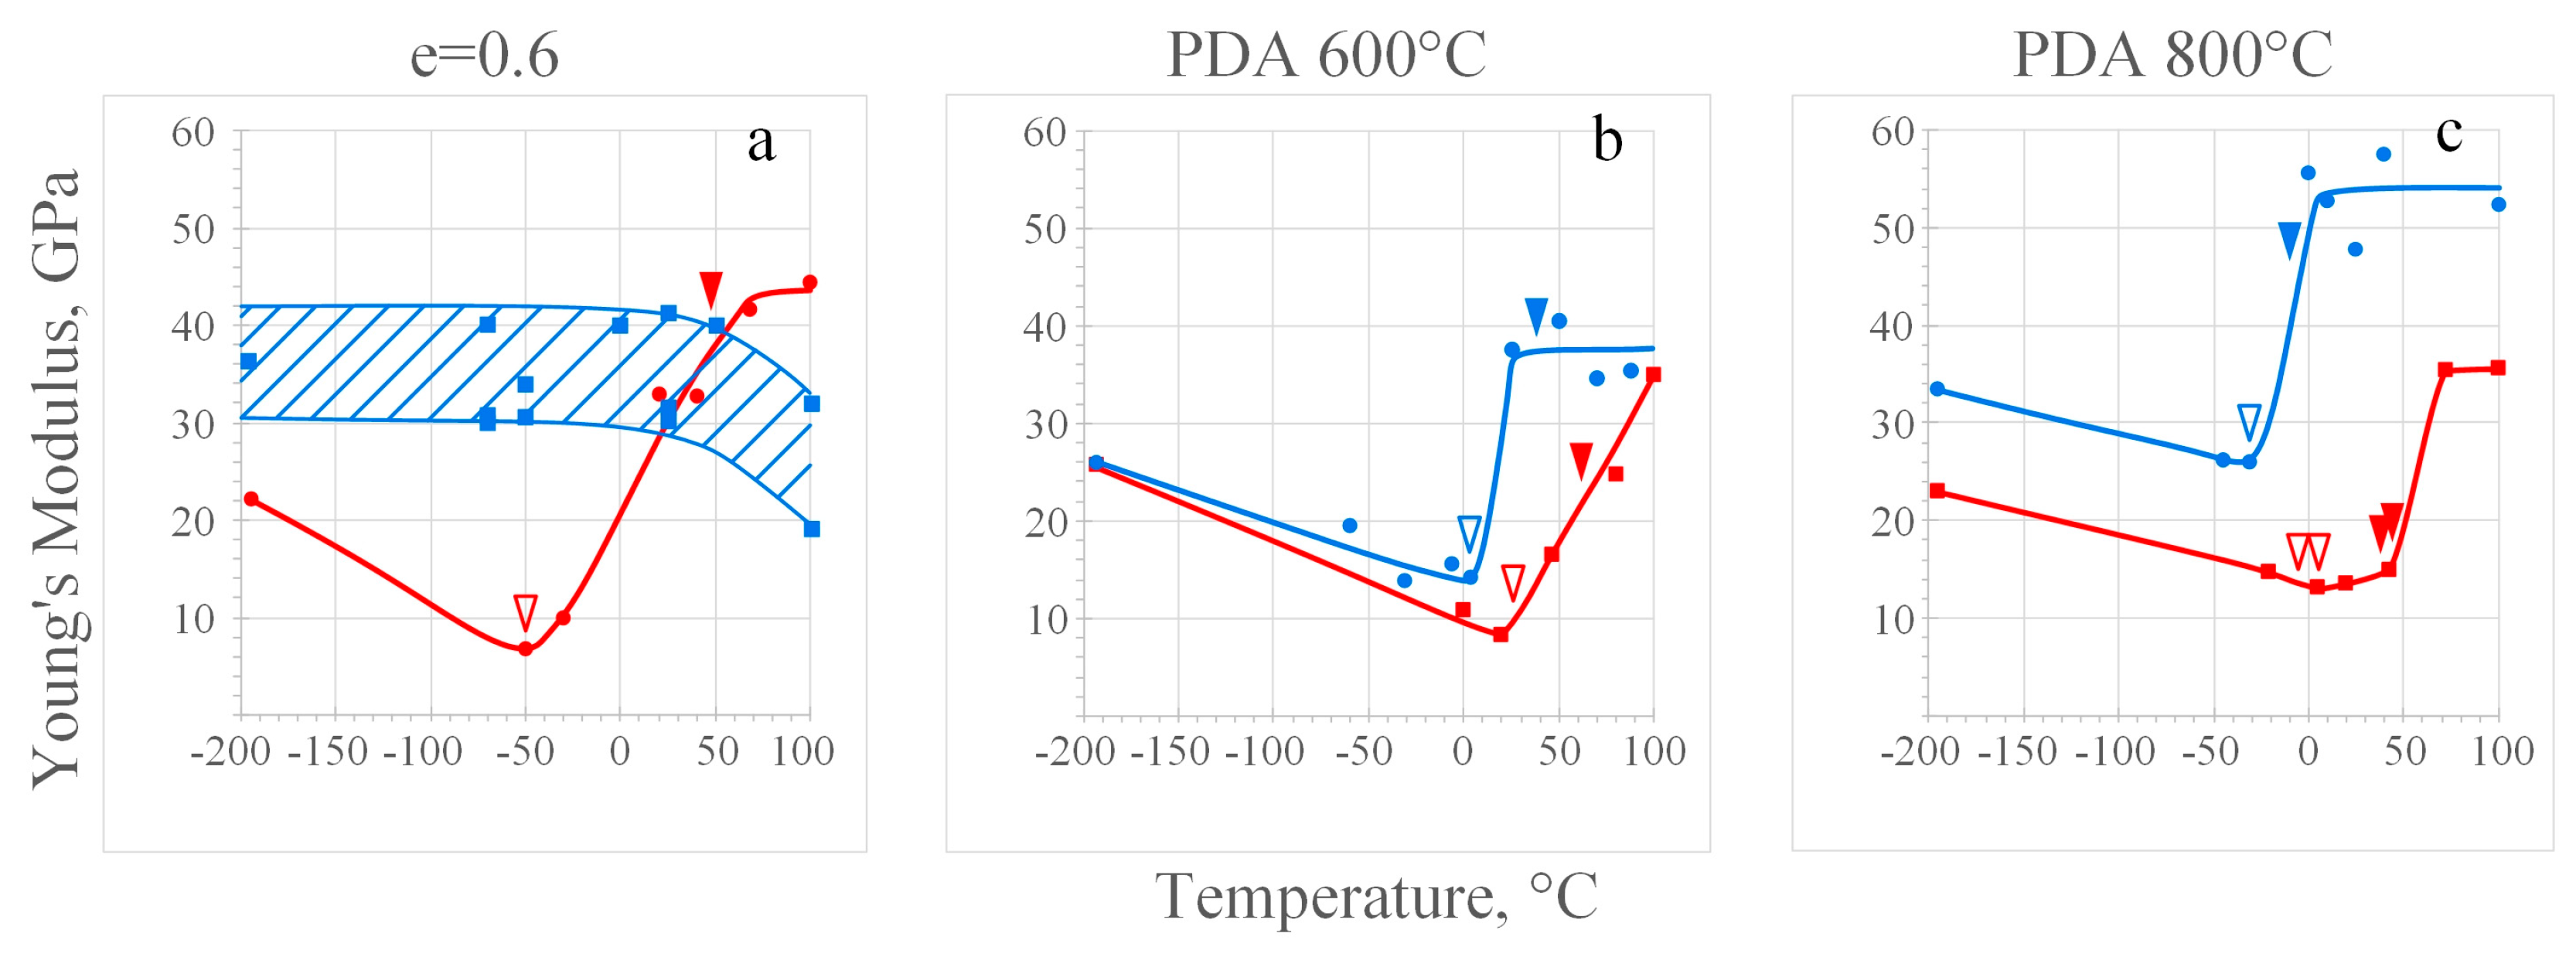
Figure 6.
Comparative stress-strain diagrams before aging (ЕВА, blue curves) and after aging for 430°C, 10 h (ЕВА, red curves): a) 600°C, 1 h; b) 800°C, 1 h.
Figure 6.
Comparative stress-strain diagrams before aging (ЕВА, blue curves) and after aging for 430°C, 10 h (ЕВА, red curves): a) 600°C, 1 h; b) 800°C, 1 h.
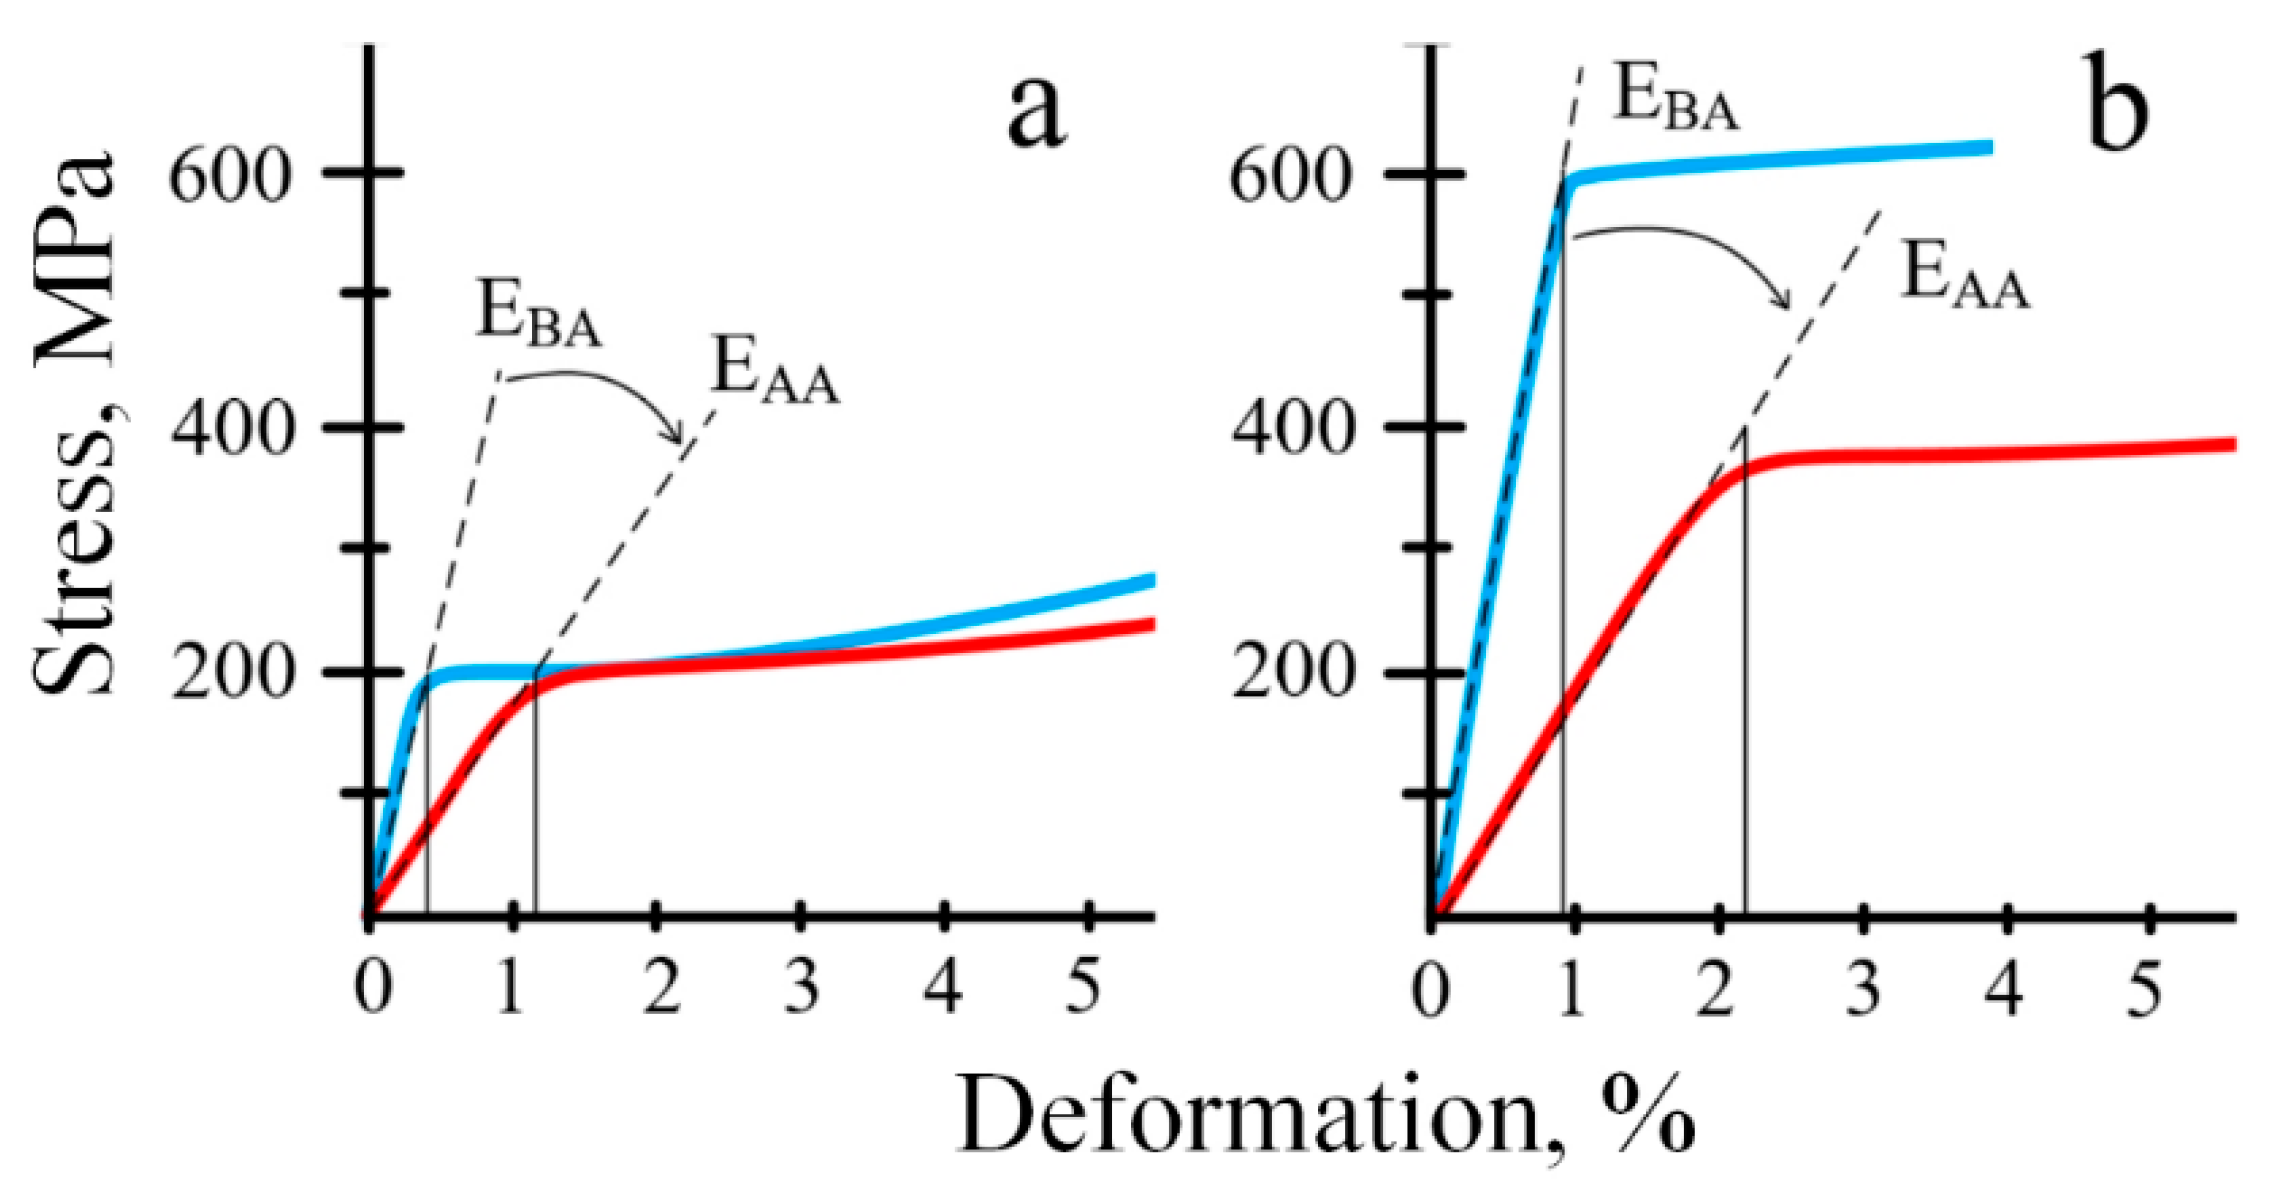

Table 1.
Characteristic temperatures of martensitic transformations; indexes “p, s, f” mean the peak, start and finish temperatures of corresponding MTs.
Table 1.
Characteristic temperatures of martensitic transformations; indexes “p, s, f” mean the peak, start and finish temperatures of corresponding MTs.
| PDA mode | Cooling, °С | ||||||||
|---|---|---|---|---|---|---|---|---|---|
| A→R | R→M | A→M | |||||||
| Tp | Tp | Tp | Мs | Мf | |||||
| as-deformed + aging | 40 | 45 | 34 | – | –48 | – | – | – | – |
| 550 °С, 0.5 h | 4 | 8 | 1 | –51 | –42 | –61 | – | – | – |
| 600 °С, 1 h | 9 | 17 | – | 1 | 4 | –7 | – | – | – |
| 600 °С, 1 h + aging | 46 | 48 | – | 20 | 26 | 0 | – | – | – |
| 800 °С, 1 h | – | – | – | – | – | – | –37 | –31 | -44 |
| 800 °С, 1 h + aging | 43 | 51 | 37 | 6 | 5 | –10 | –9 | –6 | -21 |
, Тp, and are the onset, peak, and endset temperatures of the forward B2→R MT, respectively; , Тp, and are those of the forward R→B19’ MT; Ms, Tp, and Mf are those of the forward B2→(R)→B19’ MT; As, Tp, and Af are those of the reverse B19’→(R)→B2 MT; , Tp, and are those of the reverse B19’→R MT; As, Tp, and Af are those of the reverse R→B2 MT; * The magnitude cannot be determined reliably.
Table 2.
The average magnitudes of Young’s modulus in the temperature range of −196°С≤Т≤100°С (E values determined at Ms temperature are highlighted in bold).
Table 2.
The average magnitudes of Young’s modulus in the temperature range of −196°С≤Т≤100°С (E values determined at Ms temperature are highlighted in bold).
| PDA modes | Young’s modulus, GPa / Test temperature, °С | ||||||||||||||||||
|---|---|---|---|---|---|---|---|---|---|---|---|---|---|---|---|---|---|---|---|
| −196 | −70 | −50 | −40 | −30 | −21 | −7 | 0 | 4 | 9 | 25 | 30 | 43 | 50 | 60 | 70 | 80 | 100 | ||
| CD* (е=0,6) | u.b. | 42 | 42 | 42 | 41 | 32 | |||||||||||||
| l.b. | 30 | 30 | 30 | 29 | 19 | ||||||||||||||
| CD + aging | 22 | 7 | 10 | 33 | 33 | 42 | 44 | ||||||||||||
| 550°С, 0.5 h | 28 | 10 | 13 | 26 | 45 | 46 | 47 | 36 | 34 | 47 | |||||||||
| 600°С, 1 h | 26 | 14 | 15 | 14 | 38 | 40 | 35 | 36 | |||||||||||
| 600°С, 1 h + aging | 26 | 10 | 9 | 17 | 25 | 35 | |||||||||||||
| 800°С, 1 h | 33 | 27 | 27 | 55 | 54 | 54 | 52 | 58 | 52 | ||||||||||
| 800°С, 1 h + aging | 23 | 15 | 13 | 13 | 15 | 35 | 35 | ||||||||||||
*the upper (u.b.) and lower (l.b.) boundaries of the area in which the values of Е are determined.
Disclaimer/Publisher’s Note: The statements, opinions and data contained in all publications are solely those of the individual author(s) and contributor(s) and not of MDPI and/or the editor(s). MDPI and/or the editor(s) disclaim responsibility for any injury to people or property resulting from any ideas, methods, instructions or products referred to in the content. |
© 2023 by the authors. Licensee MDPI, Basel, Switzerland. This article is an open access article distributed under the terms and conditions of the Creative Commons Attribution (CC BY) license (http://creativecommons.org/licenses/by/4.0/).
Copyright: This open access article is published under a Creative Commons CC BY 4.0 license, which permit the free download, distribution, and reuse, provided that the author and preprint are cited in any reuse.


