
Submitted:
20 July 2023
Posted:
20 July 2023
You are already at the latest version
Abstract
Superconductivity in highly-pressurized hydrides became primary direction for the exploration of fundamental upper limit for the superconducting transition temperature, Tc, after Drozdov et al (Nature 2015, 525, 73) discovered superconducting state with Tc=203 K in highly-compressed sulphur hydride. To date several dozens of high-temperature superconducting polyhydrides have been discovered. In addition, recently, it was reported that highly-compressed titanium and scandium exhibit record-high (up to 36 K), which is by manifold exceeded of niobium, which is the record high- ambient pressure metallic superconductor. Here we analysed experimental data on for recently discovered high-pressure superconductors (which exhibit high transition temperatures within their classes): elemental titanium (Zhang et al, Nature Communications 2022; Liu et al, Phys. Rev. B 2022), TaH3 (He et al, Chinese Phys. Lett. 2023), LaBeH8 (Song et al, Phys. Rev. Lett. 2023), and black (Li et al, Proc. Natl. Acad. Sci. 2018) and violet (Wu et al, arXiv 2023) phosphorous, to reveal the nonadiabaticity strength constant, TθTF (where Tθ is the Debye temperature, and TF the Fermi temperature) in these superconductors. The analysis showed that δ-phase of titanium and black phosphorous exhibit the Tθ/TF which are nearly identical to ones associated in A15 superconductors, while studied hydrides and violet phosphorous exhibit the constants in the same ballpark with H3S and LaH10.
Keywords:
hydrogen-rich superconductors
; highly-compressed superconductors
; electron-phonon coupling constant
; Debye temperature
; nonadiabaticity
1. Introduction
The discovery of near-room temperature superconductivity in highly compressed sulphur hydride by Drozdov et al [1] manifested a new era in superconductivity. This research field represents one of the most fascinating scientific and technological exploration in modern condensed matter physics where advanced first principles calculations [2,3,4,5,6,7,8,9,10,11] are essential part of the experimental quest for the discovery of new hydrides phases [12,13,14,15,16,17,18,19,20,21], and both of these directions drive the development of new experimental techniques to study highly-pressurized materials [22,23,24,25,26,27,28,29,30,31].
From 2015 till now, several dozens of high-temperature superconducting polyhydride phases have been discovered and studied [1,12,13,14,15,16,17,18,19,20,21,24,32,33,34,35,36,37,38,39,40,41,42,43]. At the same time, high-pressure studies of the superconductivity in non-hydrides are also progressed recently [44,45,46,47,48,49,50,51,52,53], including observation of in highly-compressed elemental titanium [54,55] and scandium [56,57], and in [58].
First principles calculations [12,13,14,15,16,17,18,19,20,21,59,60,61,62,63,64,65,66,67,68] are essential tool in the quest for room-temperature superconductivity (which was used [65] to explain experimental result [69] for one of the most difficult to explain hydride case, ), and primary calculated parameter in these calculations is the transition temperature, . As, the confirmation of the predicted , as the determination of other fundamental ground state parameters, for instance, the upper critical field, [5,24,33,39], the lower critical field, [12,22], the self-field critical current density, [24,70,71,72], the London penetration depth, [22,23,73,74], the superconducting energy gap amplitude, [75,76,77], and gap symmetry [78,79], etc., are the task for experiment and data analysis
Another complication in understanding of the superconductivity in highly-pressurized materials is the phenomenon of nonadiabaticity, which originates from a fact that Migdal-Eliashberg theory of the electron-phonon mediated superconductivity [80,81] is based on primary assumption/postulate that the superconductor obeys the inequality:
where, is the Debye temperature, and is the Fermi temperature. In other words, Eq. 1 implies that the superconductor exhibits fast electric charge carriers and slow ions. This assumption simplifies theoretical model of the electron-phonon mediated superconductivity, however, Eq. 1 is not satisfied for many unconventional superconductors [82,83,84,85,86,87,88,89,90] (which was first pointed out by Pietronero and co-workers [91,92,93,94]) and many highly-compressed superconductors [79,89,95,96,97].
While theoretical aspects of the non-adiabatic effects can be found elsewhere [11,82,88,91,92,93,94,95], in practice, the strength of the nonadiabatic effects can be quantified by the ratio [89,90] for which in Ref. [89] three characteristic ranges were proposed:
It was found in Ref. [89], and confirmed in Ref. [79], that superconductors with (from a dataset of 46 superconductors from all major superconductors families) exhibit the ratio in the range .
This is interesting and theoretically unexplained empirical observation.
In this study we further extended empirical database by deriving several fundamental parameters:
(1) the Debye temperature, ;
(2) the electron-phonon coupling constant, ;
(3) the ground state coherence length, ;
(4) the Fermi temperature ;
(5) the nonadiabaticity strength constant, ;
(6) and the ratio ;
for five recently discovered highly-compressed superconductors for which reported raw experimental data are enough to deduce mentioned above parameters, and which represent materials with high or record high in their families:
(2) [21];
(3) [98];
(5) violet phosphorous [53].
2. Utilized models and data analysis tools
2.1. Debye temperature
Debye temperature, , is one of fundamental parameters which determines the superconducting transition temperature, , within electron-phonon phenomenology [81,102,103,104,105,106]. This parameter can be deduced as a free-fitting parameter from a fit of temperature dependent resistance, , to the saturated resistance model within the Bloch-Grüneisen (BG) equation [107,108,109,110]:
where , , and are free fitting parameters.
2.2. The electron-phonon coupling constant
From the deduced and measured , which we defined by as strict as possible resistance criterion of , where is the sample resistance at the onset of the superconducting transition, the electron-phonon coupling constant, , can be calculated as the root of advanced McMillan equation [103,104,105,106]:
where
where is the Coulomb pseudopotential parameter, which we assumed to be (which is typical value utilized in the first principles calculation for many electron-phonon mediated superconductors [54,111]).
2.3. Ground state coherence length
To deduce the ground state coherence length, , we fitted the upper critical field datatset, , to analytical approximant of the Werthamer-Helfand-Hohenberg model [112,113], which was proposed by Baumgartner et al [114]:
where is the superconducting flux quantum, is Planck constant, , and and are free fitting parameters.
2.4. The Fermi temperature
Simplistic approach to calculate the Fermi temperature, , is to use the expression of free-electron model [115,116]:
where is bare electron mass, is reduced Planck constant, is Boltzmann constant, and is the charge carrier density per volume (). Equation 8 can be used, if the Hall resistance measurements were analysed to estimate the charge carrier density, .
2.5. The gap-to-transition temperature ratio
To calculate the Fermi temperature by Eq. 9 there is a need to know . In this study, to determine we utilized the following approach. Carbotte [111] collected various parameters for 32 electron-phonon mediated superconductors, which exhibit and . In Figure 1 we presented the dataset reported by Carbotte in his Table IV [111]. The dependence vs can be approximate by linear function (Figure 1) [117]:
where , and .
As far as one can determine by utilized Equations (3)-(6), the ratio can be estimated from the Eq. (10).
3. Results
3.1. Highly-compressed titanium
Zhang et al [54] and Liu et al [55] reported on record high in phase compressed at megabar pressures. In Figure 2 we showed the fit of the dataset measured by Zhang et al [54] for the phase compressed at to Equation 3.
Deduced Debye temperature (Figure 2,a) for -phase () is which is in ballpark value with for uncompressed pure elemental titanium, which exhibits phase [118].
To calculate the electron-phonon coupling strength constant, , by Equations 4-6, we defined the superconducting transition temperature, , by the use of criterion, which was chosen based on the lowest temperature, at which experimental data measured at was reported by Zhang et al [54]. Deduced , which is very close to the of pure elemental aluminium (Figure 1, and Ref. [111]).
We also confirmed the power-law exponent (reported by Zhang et al [54]) for the temperature dependent , which was extracted by Zhang et al [54] from the simple power-law fit of at temperature range of :
where , and are free fitting parameters. As we showed earlier [119], Eq. 10 does not always return correct -values, and data fit to Eq. 3, where is free-fitting parameter, is the reliable approach to derive the power-law exponent. However, for the given case, our fit to Eq. 3 (Figure 2,b) returns the same power-law exponent, , to the one reported by Zhang et al [54].
In Figure 3 we showed data measured by Zhang et al [54] and Liu et al [55] and data fits to Equations 3-7 for the phase compressed at (Figure 3,a), (Figure 3,b), (Figure 3,c), and (Figure 3,d).
While Liu et al [55] reported first principles calculation result for and logarithmic frequency for highly compressed titanium over wide range of applied pressure, in Figure 4 we presented a comparison of the deduced and values from experiment and calculated ones [55]. To compare (calculated by first principles calculations) and deduced from experiment, we used theoretical expression proposed by Semenok [120]:
In Figure 4,c we also show values calculated by Eq. 8, where we used derived and bulk density of charge carriers in compressed titanium, , measured by Zhang et al [54]. Due to Zhang et al [54] reported the and measured at different pressures, for calculations we assumed the following approximations: ; ; .
The evolution of the adiabaticity strength constant vs pressure is also showed in Figure 4,c.
It can be seen (Figure 4) that there is a very good agreement between calculated by first principles calculations and extracted from experiment and characteristic phonon temperatures, and , at low and high applied pressures. More experimental data is required to perform more detailed comparison between calculated and experimental values.
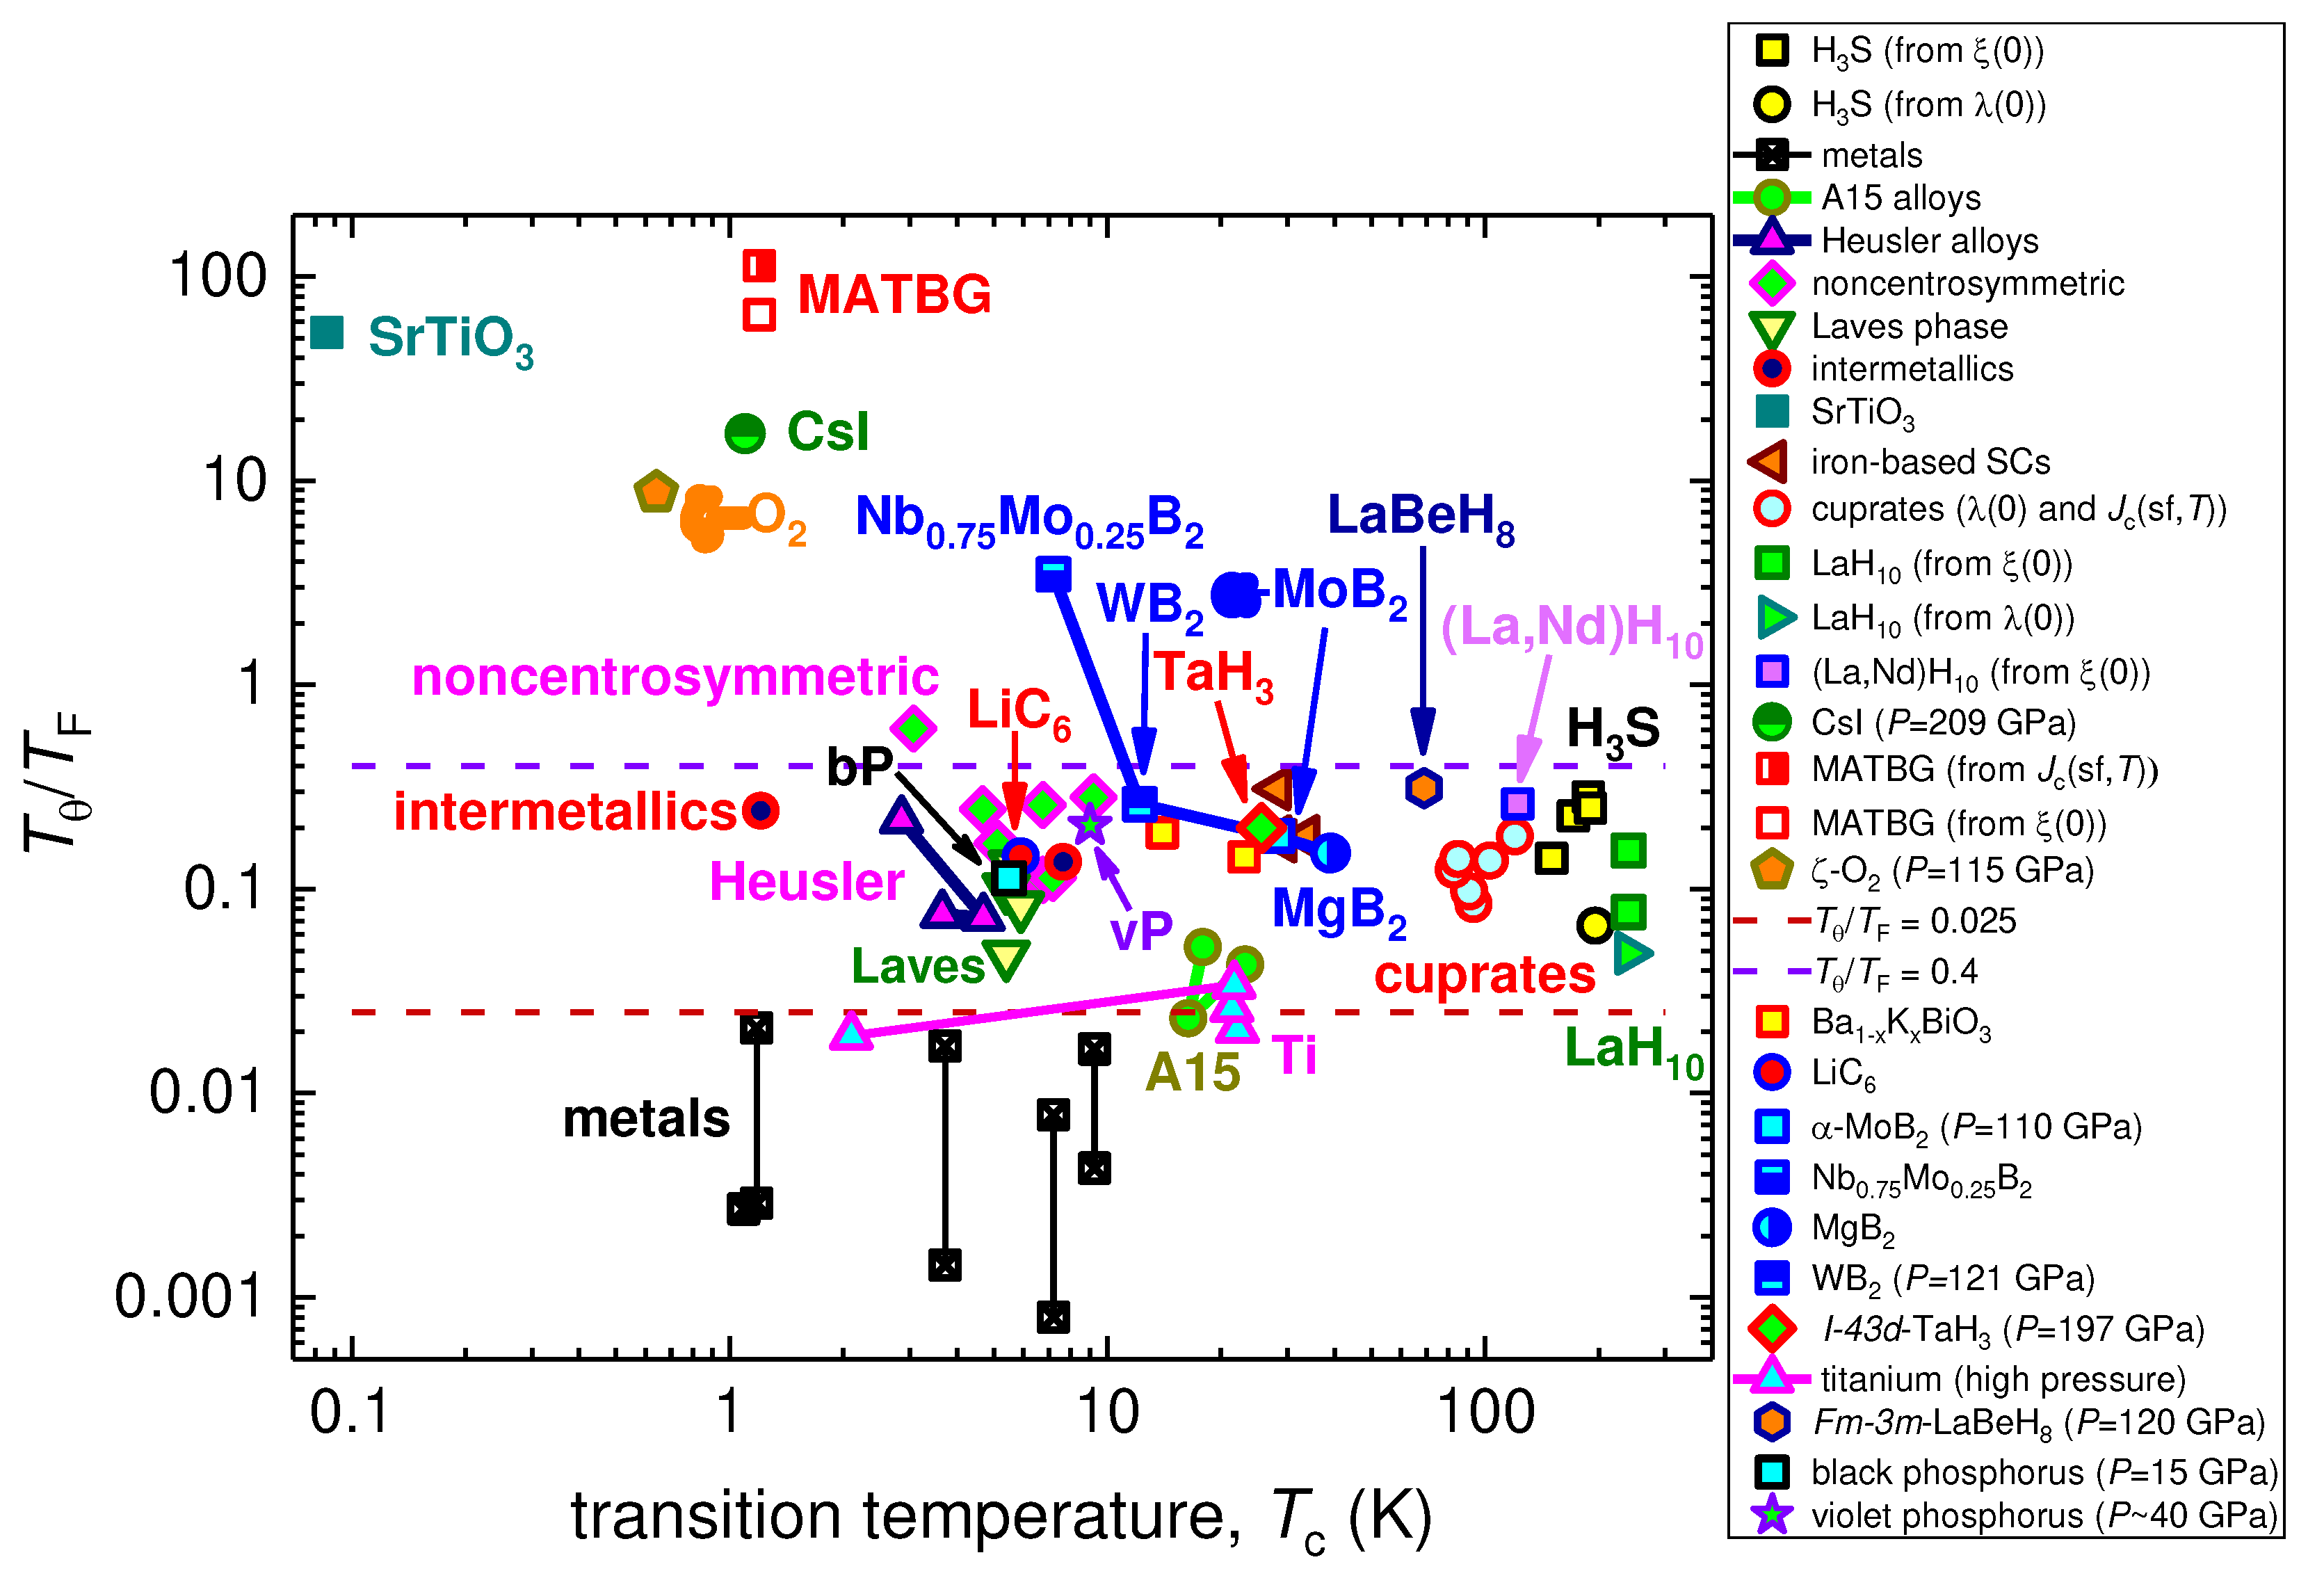
Derived values for highly-compressed titanium are in Figures 5 to 7, which are widely used representation of main superconducting families (while other global scaling laws are utilized different variables [71,121,122,123,124,125,126,127]).
It is interesting to note, that is located in close proximity to A15 superconductors in all of these plots (Figures 5 to 7). It is more likely, that this is a reflection that the highest performance of the electron-phonon mediated superconductivity in metals and alloys is achieved for these materials.
Figure 5.
Uemura plot, where highly-compressed , , , and black and violet phosphorous (BP and VP, respectively) are shown together with several families of superconductors: metals, iron-based superconductors, diborides, cuprates, Laves phases, hydrides, and others. References on original data can be found in Refs. [79,89,128,129].
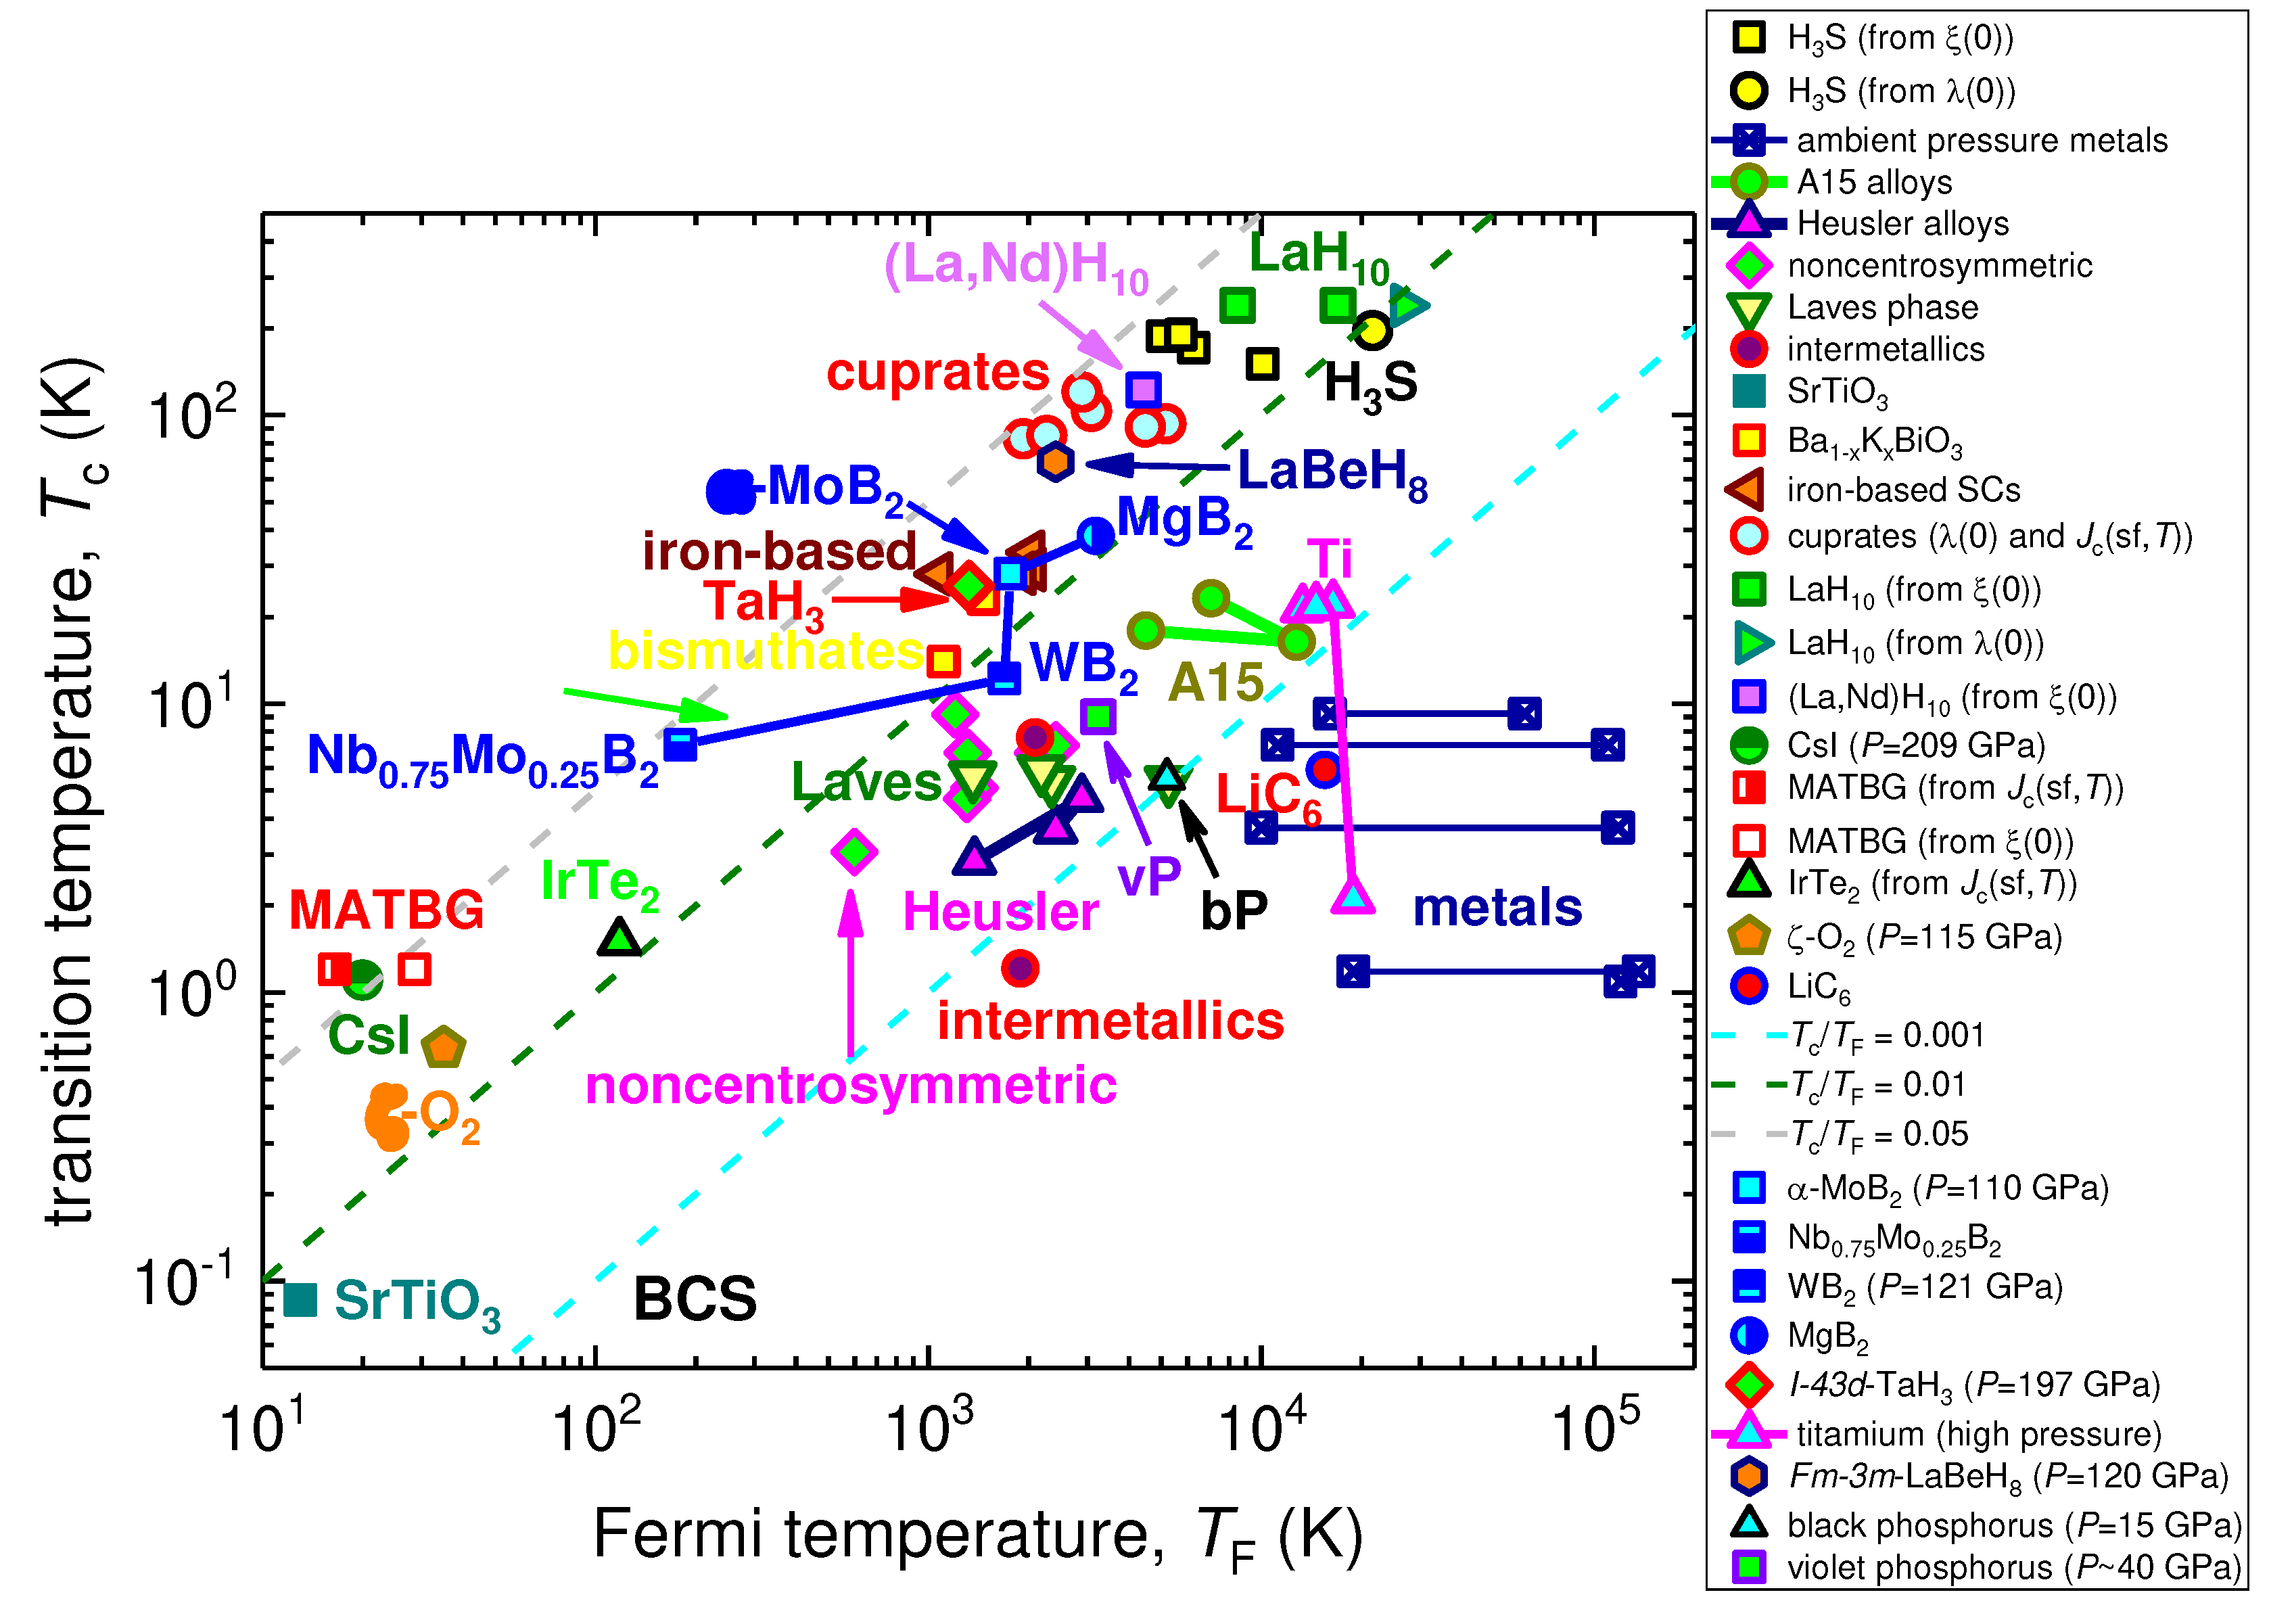
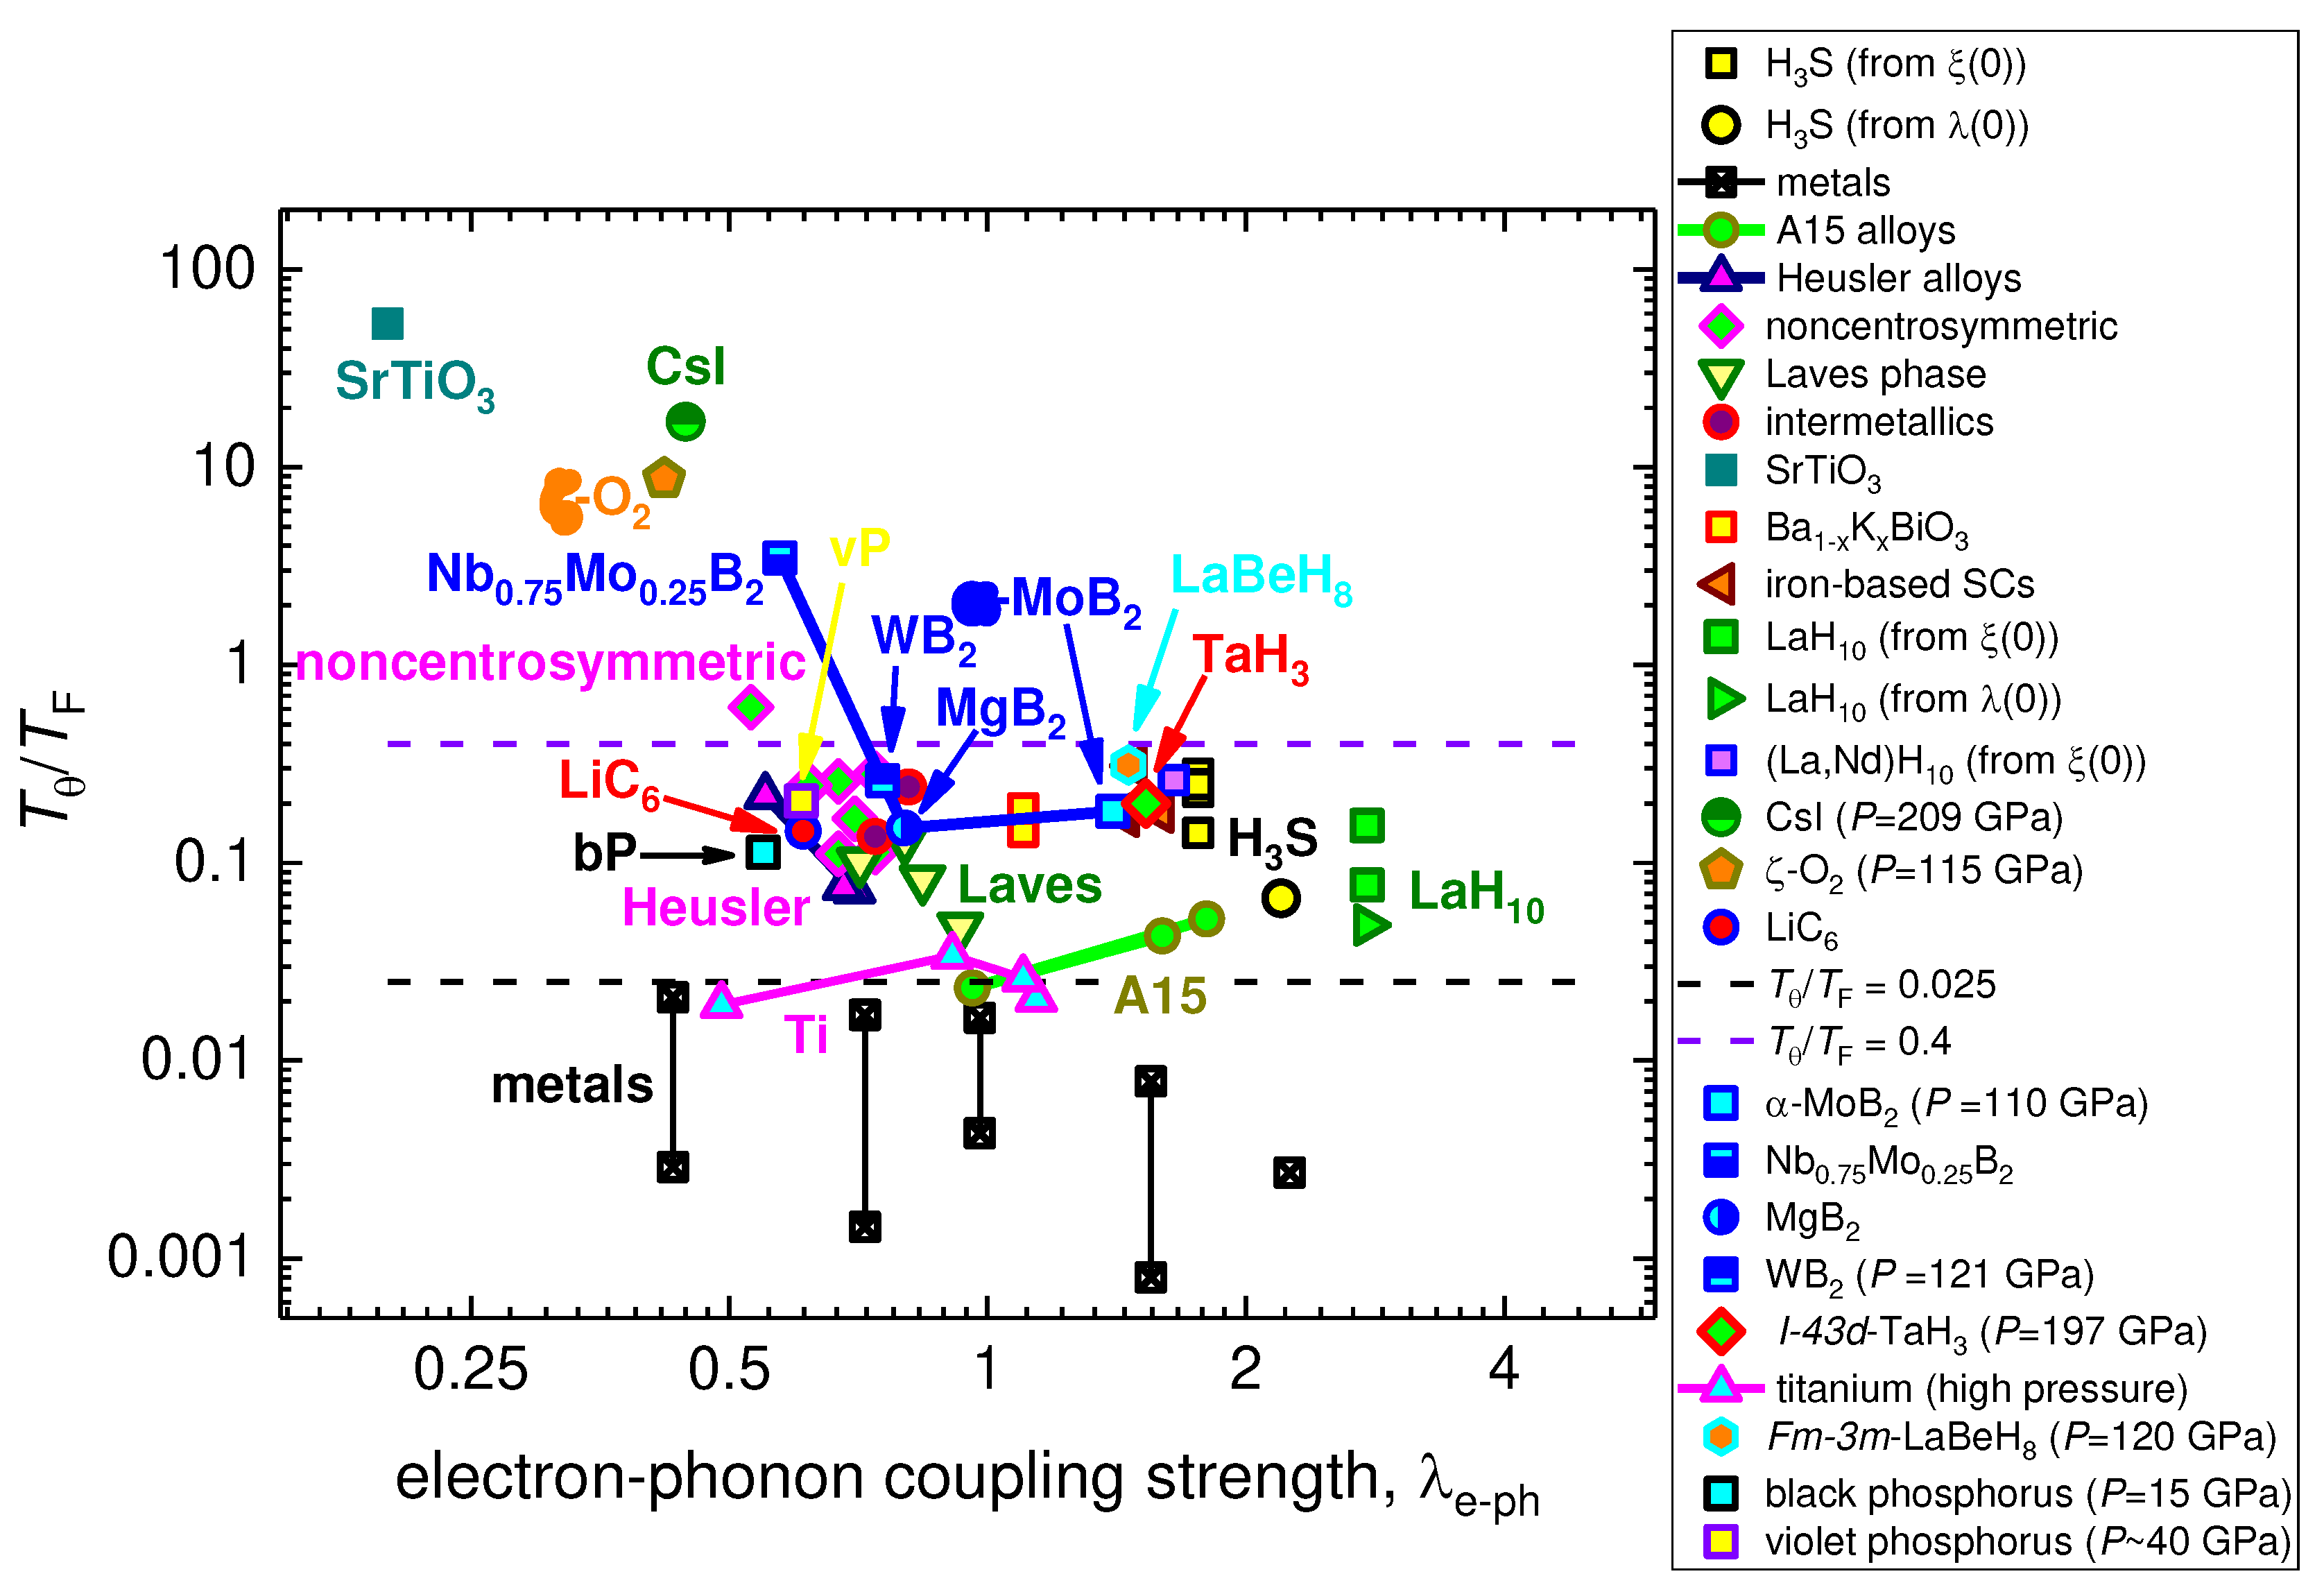
Figure 6.
The nonadiabaticity strength constant vs where several families of superconductors and highly-compressed , , , black and violet phosphorous are shown. References on original data can be found in Refs. [79,89,128,129].
3.2. Highly-compressed I-43d-phase of TaH3
Recently, He et al [21] reported on the observation of high-temperature superconductivity in highly-compressed I-43d-phase of TaH3. In Figure 8 we showed the fit of the dataset measured by He et al [21] for the tantalum hydride compressed at .
By utilizing Eqs. 4-6, we deduced (Figure 8), which is within ballpark value for other highly compressed hydride superconductors [3,106].
Because He et al [21] did not report result of Hall coefficient measurements, we deduced the Fermi temperature by the use of Eq. 9, and this we deduced dataset from R(T,B) curves reported by He et al [21] in their Figure 2,a [21], for which we utilized the criterion of . Obtained data and data fit are shown in Figure 8(b). Deduced .
To calculate the Fermi temperature in I-43d-phase of TaH3 at P = 197 GPa, we substituted derived and in Eq. 9, where was obtained by substituting in Eq. 10 (Figure 1).
In the result of our analysis the following fundamental parameters of the I-43d-phase of TaH3 () have been extracted:
(1) the Debye temperature, ;
(2) the electron-phonon coupling constant, ;
(3) the ground state coherence length, ;
(4) the Fermi temperature, ;
(5) , which implies that the this phase falls in unconventional superconductors band in the Uemura plot;
(6) the nonadiabaticity strength constant, .
In Figure 5, Figure 6 and Figure 7 one can see the position of the I-43d-phase of TaH3 at P = 197 GPa (within other representative materials from main families of superconductors), from which can be concluded that TaH3 are typical superhydride exhibited similar strength of nonadiabatic effects to its near room temperature counterparts, i.e. H3S and LaH10.
3.3. Highly-compressed Fm-3m-phase of LaBeH8
Recently, Song et al [98] reported on the observation of high-temperature superconductivity with in highly-compressed LaBeH8. Crystalline structure of this superhydride at was identified as , which was predicted (as one of several possibilities) by Zhang et al [130]. In Figure 9(a) we showed the fit of the dataset measured by Song et al [98] in the LaBeH8 compressed at .
dataset was extracted from R(T,B) curves reported Song et al [98] in their Figure 3,a [98]. For definition we utilized the criterion of . Obtained data and data fit are shown in Figure 9(b). Deduced .
Data analysis by the same routine described in previous Section 3.2 showed that -phase of LaBeH8 at P = 120 GPa exhibits the following parammeters:
(1) the Debye temperature, ;
(2) the electron-phonon coupling constant, ;
(3) the ground state coherence length, ;
(4) the Fermi temperature, ;
(5) , which implies that this phase falls in unconventional superconductors band in the Uemura plot;
(6) the nonadiabaticity strength constant, .
3.4. Highly-compressed black phosphorous
Impact of high pressure on the superconducting parameters of black phosphorous has studied over several decades [99,100,101]. Recent detailed studies in this field have reported by Guo et al [100] and Li et al [99].
To show the reliability of high-pressure studies of superconductors (which was recently questioned by non-experts in the field [131,132]) in Figure 10 we showed raw datasets measured at by two independent groups, by Shirotani et al [101] and Li et al [99], whose reports have been published within a time frame of 24 years.
The agreement between deduced (Figure 10) from two datasets [99,101] is remarkable. It should be noted that the approach, used for this analysis (Figure 10), has been developed to analyze data measured in highly-compressed near-room temperature superconductors [106], which particularly implies that concerns expressed by non-experts in the field [131,132,133,134] in regard of highly-compressed near-room temperature hydride superconductors do not have any scientific background.
In Figure 11 we showed datasets extracted from raw datasets measured at very close pressure, [100] and [99], which were also reported by two independent groups. For the definition we utilized the same strict criterion of for both datasets in Figure 11.
Average deduced parameters for black phosphorus , which we derived from experimental data analysis reported by three different groups and which were used to position the black phosphorus in Figures 1,5-7 are:
(1) the Debye temperature, ;
(2) the electron-phonon coupling constant, ;
(3) the ground state coherence length, ;
(4) the Fermi temperature, ;
(5) , which implies that black phosphorus falls in conventional superconductors band in the Uemura plot;
(6) the nonadiabaticity strength constant, .
Deduced parameters show that the black phosphorus compressed at exhibits low strength of nonadiabatic effects.
3.5. Highly-compressed violet phosphorous
Recently, Wu et al [53] reported on the observation of the superconducting state in violet phosphorus (vP) with when the material is subjected to high pressure in the range of . In Figure 12(a) we showed the dataset, and data fit to Eq. 3, measured by Wu et al [53] in the violet phosphorus compressed at .
dataset was extracted from the only R(T,B) dataset reported by Wu et al [53] for material compressed at Wu et al [53]. For definition we utilized the criterion of . Deduced dataset is shown in Figure 12(b). The fit to Equation 7 (which is single band model) has low quality, because has an upturn at . We interpreted this upturn as an evidence for the second band opening at , and, thus, we fitted data used two-band model [128,135]:
where and exhibit their independent transition temperature and the coherence length. Deduced values are listed in the Figure Caption to Figure 12. However for further analysis we used and .
Processing data by the same approach described in previous Sections, we derived the following parameters for violet phosphorus compressed at :
(1) the Debye temperature, ;
(2) the electron-phonon coupling constant, ;
(3) the ground state coherence length, ;
(4) the Fermi temperature, ;
(5) , which implies that this phase falls in close proximity to conventional superconductors band in the Uemura plot;
(6) the nonadiabaticity strength constant, .
Derived parameters imply that the violet phosphorus compressed at exhibit moderate level of nonadiabatic effects similar to the ones in highly-compressed hydrogen-rich near-room temperature superconductors and .
4. Discussion
As it was mentioned above superconductors can be classified by the ratio of maximum phonon energy, (where is Debye frequency) to the charge carrier energy at the Fermi level, . For practical use, it is more convenient to replace term by , where is the Debye temperature, which can be deduced from experimental measurements.
Thus, in so-called adiabatic regime, , superconductors exhibit very fast charge carriers and relatively slow phonons. This condition is satisfied for pure metals and some superconducting alloys (Figure 5, Figure 6 and Figure 7).
However, as it can be seen in Figures 6,7, more than ¾ of superconductors (including important for practical use Nb3Sn, MgB2, pnictides, cuprates and record high-Tc near-room temperature superconducting hydrides) have the ratio in a different range [79,89]:
These materials are [79,89]: Nb0.75Mo0.25B2, Nb0.5Os0.5, highly compressed metalized oxygen, magic-angle twisted bilayer graphene, SrTiO3, and highly compressed metalized ionic salt CsI. It should be stressed that all these superconductors exhibit low transition temperature, .
In this regard, studied in this report five recently discovered superconductors (Section 3.1-3.5) confirmed the validity of Equation 14. And, thus, perhaps a deep physical origin related to the strength of the nonadiabaticity within a range indicated in Equation 14 can be revealed
4. Conclusions
In this work, we analyzed experimental data reported for five recently discovered highly-compressed superconductors: [54,55], [21], [98], black phosphorous [99,100,101], and violet phosphorous [53], for which we established several superconducting parameters, including the strength of nonadiabaticity, .
Funding
This research was funded by the Ministry of Science and Higher Education of the Russian Federation, grant number No. 122021000032-5 (theme “Pressure”). The research funding from the Ministry of Science and Higher Education of the Russian Federation (Ural Federal University Program of Development within the Priority-2030 Program) is gratefully acknowledged.
Data Availability Statement
Not applicable.
Conflicts of Interest
The author declares no conflict of interest. The funders had no role in the design of the study; in the collection, analyses, or interpretation of data; in the writing of the manuscript; or in the decision to publish the results.
References
- Drozdov, A.P.; Eremets, M.I.; Troyan, I.A.; Ksenofontov, V.; Shylin, S.I. Conventional Superconductivity at 203 Kelvin at High Pressures in the Sulfur Hydride System. Nature 2015, 525, 73–76. [Google Scholar] [CrossRef] [PubMed]
- Duan, D.; Liu, Y.; Tian, F.; Li, D.; Huang, X.; Zhao, Z.; Yu, H.; Liu, B.; Tian, W.; Cui, T. Pressure-Induced Metallization of Dense (H2S)2H2 with High-Tc Superconductivity. Sci. Rep. 2014, 4, 6968. [Google Scholar] [CrossRef] [PubMed]
- Lilia, B.; Hennig, R.; Hirschfeld, P.; Profeta, G.; Sanna, A.; Zurek, E.; Pickett, W.E.; Amsler, M.; Dias, R.; Eremets, M.I.; et al. The 2021 Room-Temperature Superconductivity Roadmap. J. Phys. Condens. Matter 2022, 34, 183002. [Google Scholar] [CrossRef] [PubMed]
- Li, Y.; Hao, J.; Liu, H.; Li, Y.; Ma, Y. The Metallization and Superconductivity of Dense Hydrogen Sulfide. J. Chem. Phys. 2014, 140. [Google Scholar] [CrossRef] [PubMed]
- Sun, D.; Minkov, V.S.; Mozaffari, S.; Sun, Y.; Ma, Y.; Chariton, S.; Prakapenka, V.B.; Eremets, M.I.; Balicas, L.; Balakirev, F.F. High-Temperature Superconductivity on the Verge of a Structural Instability in Lanthanum Superhydride. Nat. Commun. 2021, 12, 6863. [Google Scholar] [CrossRef] [PubMed]
- Ma, L.; Wang, K.; Xie, Y.; Yang, X.; Wang, Y.; Zhou, M.; Liu, H.; Yu, X.; Zhao, Y.; Wang, H.; et al. High-Temperature Superconducting Phase in Clathrate Calcium Hydride <math Display="inline"> <mrow> <msub> <mrow> <mi>CaH</Mi> </Mrow> <mrow> <mn>6</Mn> </Mrow> </Msub> </Mrow> </Math> up to 215 K at a Pressure of 172 GPa. Phys. Rev. Lett. 2022, 128, 167001. [Google Scholar] [CrossRef]
- Wang, H.; Tse, J.S.; Tanaka, K.; Iitaka, T.; Ma, Y. Superconductive Sodalite-like Clathrate Calcium Hydride at High Pressures. Proc. Natl. Acad. Sci. 2012, 109, 6463–6466. [Google Scholar] [CrossRef]
- Bi, J.; Nakamoto, Y.; Zhang, P.; Shimizu, K.; Zou, B.; Liu, H.; Zhou, M.; Liu, G.; Wang, H.; Ma, Y. Giant Enhancement of Superconducting Critical Temperature in Substitutional Alloy (La,Ce)H9. Nat. Commun. 2022, 13, 5952. [Google Scholar] [CrossRef]
- Du, M.; Song, H.; Zhang, Z.; Duan, D.; Cui, T. Room-Temperature Superconductivity in Yb/Lu Substituted Clathrate Hexahydrides under Moderate Pressure. Research 2022, 2022. [Google Scholar] [CrossRef]
- Alarco, J.A.; Almutairi, A.; Mackinnon, I.D.R. Progress Towards a Universal Approach for Prediction of the Superconducting Transition Temperature. J. Supercond. Nov. Magn. 2020, 33, 2287–2292. [Google Scholar] [CrossRef]
- Kostrzewa, M.; Szczęśniak, K.M.; Durajski, A.P.; Szczęśniak, R. From LaH10 to Room–Temperature Superconductors. Sci. Rep. 2020, 10, 1592. [Google Scholar] [CrossRef] [PubMed]
- Drozdov, A.P.; Kong, P.P.; Minkov, V.S.; Besedin, S.P.; Kuzovnikov, M.A.; Mozaffari, S.; Balicas, L.; Balakirev, F.F.; Graf, D.E.; Prakapenka, V.B.; et al. Superconductivity at 250 K in Lanthanum Hydride under High Pressures. Nature 2019, 569, 528–531. [Google Scholar] [CrossRef] [PubMed]
- Somayazulu, M.; Ahart, M.; Mishra, A.K.; Geballe, Z.M.; Baldini, M.; Meng, Y.; Struzhkin, V. V.; Hemley, R.J. Evidence for Superconductivity above 260 K in Lanthanum Superhydride at Megabar Pressures. Phys. Rev. Lett. 2019, 122, 027001. [Google Scholar] [CrossRef] [PubMed]
- Semenok, D. V.; Kvashnin, A.G.; Ivanova, A.G.; Svitlyk, V.; Fominski, V.Y.; Sadakov, A. V.; Sobolevskiy, O.A.; Pudalov, V.M.; Troyan, I.A.; Oganov, A.R. Superconductivity at 161 K in Thorium Hydride ThH10: Synthesis and Properties. Mater. Today 2020, 33, 36–44. [Google Scholar] [CrossRef]
- Troyan, I.A.; Semenok, D. V.; Kvashnin, A.G.; Sadakov, A. V.; Sobolevskiy, O.A.; Pudalov, V.M.; Ivanova, A.G.; Prakapenka, V.B.; Greenberg, E.; Gavriliuk, A.G.; et al. Anomalous High-Temperature Superconductivity in YH 6. Adv. Mater. 2021, 33, 2006832. [Google Scholar] [CrossRef]
- Semenok, D. V.; Troyan, I.A.; Ivanova, A.G.; Kvashnin, A.G.; Kruglov, I.A.; Hanfland, M.; Sadakov, A. V.; Sobolevskiy, O.A.; Pervakov, K.S.; Lyubutin, I.S.; et al. Superconductivity at 253 K in Lanthanum–Yttrium Ternary Hydrides. Mater. Today 2021, 48, 18–28. [Google Scholar] [CrossRef]
- Kong, P.; Minkov, V.S.; Kuzovnikov, M.A.; Drozdov, A.P.; Besedin, S.P.; Mozaffari, S.; Balicas, L.; Balakirev, F.F.; Prakapenka, V.B.; Chariton, S.; et al. Superconductivity up to 243 K in the Yttrium-Hydrogen System under High Pressure. Nat. Commun. 2021, 12, 5075. [Google Scholar] [CrossRef]
- Zhang, C.; He, X.; Li, Z.; Zhang, S.; Feng, S.; Wang, X.; Yu, R.; Jin, C. Superconductivity in Zirconium Polyhydrides with Tc above 70 K. Sci. Bull. 2022, 67, 907–909. [Google Scholar] [CrossRef]
- Zhang, C.L.; He, X.; Li, Z.W.; Zhang, S.J.; Min, B.S.; Zhang, J.; Lu, K.; Zhao, J.F.; Shi, L.C.; Peng, Y.; et al. Superconductivity above 80 K in Polyhydrides of Hafnium. Mater. Today Phys. 2022, 27, 100826. [Google Scholar] [CrossRef]
- Minkov, V.S.; Prakapenka, V.B.; Greenberg, E.; Eremets, M.I. A Boosted Critical Temperature of 166 K in Superconducting D 3 S Synthesized from Elemental Sulfur and Hydrogen. Angew. Chemie 2020, 132, 19132–19136. [Google Scholar] [CrossRef]
- He, X.; Zhang, C.L.; Li, Z.W.; Zhang, S.J.; Min, B.S.; Zhang, J.; Lu, K.; Zhao, J.F.; Shi, L.C.; Peng, Y.; et al. Superconductivity Observed in Tantalum Polyhydride at High Pressure. Chinese Phys. Lett. 2023, 40, 057404. [Google Scholar] [CrossRef]
- Minkov, V.S.; Bud’ko, S.L.; Balakirev, F.F.; Prakapenka, V.B.; Chariton, S.; Husband, R.J.; Liermann, H.P.; Eremets, M.I. Magnetic Field Screening in Hydrogen-Rich High-Temperature Superconductors. Nat. Commun. 2022, 13, 3194. [Google Scholar] [CrossRef] [PubMed]
- Minkov, V.S.; Ksenofontov, V.; Bud’ko, S.L.; Talantsev, E.F.; Eremets, M.I. Magnetic Flux Trapping in Hydrogen-Rich High-Temperature Superconductors. Nat. Phys. 2023. [Google Scholar] [CrossRef]
- Troyan, I.A.; Semenok, D. V; Ivanova, A.G.; Sadakov, A. V; Zhou, D.; Kvashnin, A.G.; Kruglov, I.A.; Sobolevskiy, O.A.; Lyubutina, M. V; Perekalin, D.S.; et al. Non-Fermi-Liquid Behavior of Superconducting SnH$_4$. arXiv 2023. [Google Scholar] [CrossRef]
- Flores-Livas, J.A.; Boeri, L.; Sanna, A.; Profeta, G.; Arita, R.; Eremets, M. A Perspective on Conventional High-Temperature Superconductors at High Pressure: Methods and Materials. Phys. Rep. 2020, 856, 1–78. [Google Scholar] [CrossRef]
- Bhattacharyya, P.; Chen, W.; Huang, X.; Chatterjee, S.; Huang, B.; Kobrin, B.; Lyu, Y.; Smart, T.J.; Block, M.; Wang, E.; et al. Imaging the Meissner Effect and Flux Trapping in a Hydride Superconductor at Megabar Pressures Using a Nanoscale Quantum Sensor. 2023.
- Goh, S.K.; Zhang, W.; Yip, K.Y. Trapped Magnetic Flux in Superconducting Hydrides. Nat. Phys. 2023. [Google Scholar] [CrossRef]
- Ho, K.O.; Leung, M.Y.; Wang, W.; Xie, J.; Yip, K.Y.; Wu, J.; Goh, S.K.; Denisenko, A.; Wrachtrup, J.; Yang, S. Spectroscopic Study of N- <math Display="inline" Overflow="scroll"> <mi>V</Mi> </Math> Sensors in Diamond-Based High-Pressure Devices. Phys. Rev. Appl. 2023, 19, 044091. [Google Scholar] [CrossRef]
- Ho, K.O.; Leung, M.Y.; Reddy, P.; Xie, J.; Wong, K.C.; Jiang, Y.; Zhang, W.; Yip, K.Y.; Leung, W.K.; Pang, Y.Y.; et al. Probing the Evolution of the Electron Spin Wave Function of the Nitrogen-Vacancy Center in Diamond via Pressure Tuning. Phys. Rev. Appl. 2022, 18, 064042. [Google Scholar] [CrossRef]
- Ho, K.O.; Leung, M.Y.; Jiang, Y.; Ao, K.P.; Zhang, W.; Yip, K.Y.; Pang, Y.Y.; Wong, K.C.; Goh, S.K.; Yang, S. Probing Local Pressure Environment in Anvil Cells with Nitrogen-Vacancy (N- <math Display="inline" Overflow="scroll"> <msup> <mi>V</Mi> <mo>−</Mo> </Msup> </Math> ) Centers in Diamond. Phys. Rev. Appl. 2020, 13, 024041. [Google Scholar] [CrossRef]
- Yip, K.Y.; Ho, K.O.; Yu, K.Y.; Chen, Y.; Zhang, W.; Kasahara, S.; Mizukami, Y.; Shibauchi, T.; Matsuda, Y.; Goh, S.K.; et al. Measuring Magnetic Field Texture in Correlated Electron Systems under Extreme Conditions. Science (80-. ). 2019, 366, 1355–1359. [Google Scholar] [CrossRef]
- Sakata, M.; Einaga, M.; Dezhong, M.; Sato, T.; Orimo, S.; Shimizu, K. Superconductivity of Lanthanum Hydride Synthesized Using AlH 3 as a Hydrogen Source. Supercond. Sci. Technol. 2020, 33, 114004. [Google Scholar] [CrossRef]
- Mozaffari, S.; Sun, D.; Minkov, V.S.; Drozdov, A.P.; Knyazev, D.; Betts, J.B.; Einaga, M.; Shimizu, K.; Eremets, M.I.; Balicas, L.; et al. Superconducting Phase Diagram of H3S under High Magnetic Fields. Nat. Commun. 2019, 10, 2522. [Google Scholar] [CrossRef]
- Chen, W.; Semenok, D. V.; Kvashnin, A.G.; Huang, X.; Kruglov, I.A.; Galasso, M.; Song, H.; Duan, D.; Goncharov, A.F.; Prakapenka, V.B.; et al. Synthesis of Molecular Metallic Barium Superhydride: Pseudocubic BaH12. Nat. Commun. 2021, 12, 1–9. [Google Scholar] [CrossRef]
- Zhou, D.; Semenok, D. V.; Duan, D.; Xie, H.; Chen, W.; Huang, X.; Li, X.; Liu, B.; Oganov, A.R.; Cui, T. Superconducting Praseodymium Superhydrides. Sci. Adv. 2020, 6, 1–9. [Google Scholar] [CrossRef]
- Hong, F.; Shan, P.F.; Yang, L.X.; Yue, B.B.; Yang, P.T.; Liu, Z.Y.; Sun, J.P.; Dai, J.H.; Yu, H.; Yin, Y.Y.; et al. Possible Superconductivity at ∼70 K in Tin Hydride SnHx under High Pressure. Mater. Today Phys. 2022, 22, 100596. [Google Scholar] [CrossRef]
- Li, Z.; He, X.; Zhang, C.; Lu, K.; Min, B.; Zhang, J.; Zhang, S.; Zhao, J.; Shi, L.; Peng, Y.; et al. Superconductivity above 70 K Observed in Lutetium Polyhydrides. Sci. China Physics, Mech. Astron. 2023, 66, 267411. [Google Scholar] [CrossRef]
- Chen, W.; Semenok, D. V.; Huang, X.; Shu, H.; Li, X.; Duan, D.; Cui, T.; Oganov, A.R. High-Temperature Superconducting Phases in Cerium Superhydride with a <math Display="inline"> <mrow> <msub> <mrow> <mi>T</Mi> </Mrow> <mrow> <mi>c</Mi> </Mrow> </Msub> </Mrow> </Math> up to 115 K below a Pressure of 1 Megabar. Phys. Rev. Lett. 2021, 127, 117001. [Google Scholar] [CrossRef] [PubMed]
- Semenok, D. V.; Troyan, I.A.; Sadakov, A. V.; Zhou, D.; Galasso, M.; Kvashnin, A.G.; Ivanova, A.G.; Kruglov, I.A.; Bykov, A.A.; Terent’ev, K.Y.; et al. Effect of Magnetic Impurities on Superconductivity in LaH 10. Adv. Mater. 2022, 34, 2204038. [Google Scholar] [CrossRef]
- Li, Z.; He, X.; Zhang, C.; Wang, X.; Zhang, S.; Jia, Y.; Feng, S.; Lu, K.; Zhao, J.; Zhang, J.; et al. Superconductivity above 200 K Discovered in Superhydrides of Calcium. Nat. Commun. 2022, 13, 2863. [Google Scholar] [CrossRef]
- Chen, W.; Huang, X.; Semenok, D. V.; Chen, S.; Zhou, D.; Zhang, K.; Oganov, A.R.; Cui, T. Enhancement of Superconducting Properties in the La–Ce–H System at Moderate Pressures. Nat. Commun. 2023, 14, 2660. [Google Scholar] [CrossRef]
- Purans, J.; Menushenkov, A.P.; Besedin, S.P.; Ivanov, A.A.; Minkov, V.S.; Pudza, I.; Kuzmin, A.; Klementiev, K. V.; Pascarelli, S.; Mathon, O.; et al. Local Electronic Structure Rearrangements and Strong Anharmonicity in YH3 under Pressures up to 180 GPa. Nat. Commun. 2021, 12, 1765. [Google Scholar] [CrossRef] [PubMed]
- Shao, M.; Chen, W.; Zhang, K.; Huang, X.; Cui, T. High-Pressure Synthesis of Superconducting Clathratelike <math> <mrow> <mi Mathvariant="normal">Y</Mi> <msub> <mi Mathvariant="normal">H</Mi> <mn>4</Mn> </Msub> </Mrow> </Math>. Phys. Rev. B 2021, 104, 174509. [Google Scholar] [CrossRef]
- Mariappan, S.; Bhoi, D.; Krishnan, M.; Shoko, N.; Vajeeston, P.; Arushi; Kushwaha, R. K.; Singh, R.P.; Sonachalam, A.; Uwatoko, Y. Electronic Properties of α -Mn-Type Non-Centrosymmetric Superconductor Re 5.5 Ta under Hydrostatic Pressure. Supercond. Sci. Technol. 2023, 36, 025002. [Google Scholar] [CrossRef]
- Lim, J.; Hire, A.C.; Quan, Y.; Kim, J.S.; Xie, S.R.; Sinha, S.; Kumar, R.S.; Popov, D.; Park, C.; Hemley, R.J.; et al. Creating Superconductivity in WB2 through Pressure-Induced Metastable Planar Defects. Nat. Commun. 2022, 13, 7901. [Google Scholar] [CrossRef] [PubMed]
- Pei, C.; Zhang, J.; Wang, Q.; Zhao, Y.; Gao, L.; Gong, C.; Tian, S.; Luo, R.; Li, M.; Yang, W.; et al. Pressure-Induced Superconductivity at 32 K in MoB2. Natl. Sci. Rev. 2023, 10. [Google Scholar] [CrossRef]
- Li, C.; Su, Y.; Zhang, C.; Pei, C.; Cao, W.; Wang, Q.; Zhao, Y.; Gao, L.; Zhu, S.; Zhang, M.; et al. Pressure-Tuning Superconductivity in Noncentrosymmetric Topological Materials ZrRuAs. Materials (Basel). 2022, 15, 7694. [Google Scholar] [CrossRef] [PubMed]
- Pei, C.; Zhang, J.; Gong, C.; Wang, Q.; Gao, L.; Zhao, Y.; Tian, S.; Cao, W.; Li, C.; Lu, Z.-Y.; et al. Distinct Superconducting Behaviors of Pressurized WB2 and ReB2 with Different Local B Layers. Sci. China Physics, Mech. Astron. 2022, 65, 287412. [Google Scholar] [CrossRef]
- Zamyatin, D.A.; Pankrushina, E.A.; Streltsov, S. V.; Ponosov, Y.S. Pressure-Induced Reversible Local Structural Disorder in Superconducting AuAgTe4. Inorganics 2023, 11, 99. [Google Scholar] [CrossRef]
- Liu, Z.Y.; Dong, Q.X.; Yang, P.T.; Shan, P.F.; Wang, B.S.; Sun, J.P.; Dun, Z.L.; Uwatoko, Y.; Chen, G.F.; Dong, X.L.; et al. Pressure-Induced Superconductivity up to 9 K in the Quasi-One-Dimensional <math Display="inline"> <mrow> <msub> <mrow> <mi>KMn</Mi> </Mrow> <mn>6</Mn> </Msub> <msub> <mi>Bi</Mi> <mn>5</Mn> </Msub> </Mrow> </Math>. Phys. Rev. Lett. 2022, 128, 187001. [Google Scholar] [CrossRef]
- Shimizu, K. Superconducting Elements under High Pressure. Phys. C Supercond. its Appl. 2018, 552, 30–33. [Google Scholar] [CrossRef]
- Zhang, H.; Zhong, W.; Meng, Y.; Yue, B.; Yu, X.; Wang, J.-T.; Hong, F. Superconductivity above 12 K with Possible Multiband Features in CsCl-Type PbS. Phys. Rev. B 2023, 107, 174502. [Google Scholar] [CrossRef]
- Wu, Y.Y.; Mu, L.; Zhang, X.; Dai, D.Z.; Xin, L.; Kong, X.M.; Huang, S.Y.; Meng, K.; Yang, X.F.; Tu, C.P.; et al. Pressure-Induced Superconductivity in the van Der Waals Semiconductor Violet Phosphorus. 2023. [Google Scholar] [CrossRef]
- Zhang, C.; He, X.; Liu, C.; Li, Z.; Lu, K.; Zhang, S.; Feng, S.; Wang, X.; Peng, Y.; Long, Y.; et al. Record High Tc Element Superconductivity Achieved in Titanium. Nat. Commun. 2022, 13, 5411. [Google Scholar] [CrossRef] [PubMed]
- Liu, X.; Jiang, P.; Wang, Y.; Li, M.; Li, N.; Zhang, Q.; Wang, Y.; Li, Y.-L.; Yang, W. <math> <msub> <mi>T</Mi> <mi>c</Mi> </Msub> </Math> up to 23.6 K and Robust Superconductivity in the Transition Metal <math> <mi>δ</Mi> <mtext>−</Mtext> <mi>Ti</Mi> </Math> Phase at Megabar Pressure. Phys. Rev. B 2022, 105, 224511. [Google Scholar] [CrossRef]
- Ying, J.; Liu, S.; Lu, Q.; Wen, X.; Gui, Z.; Zhang, Y.; Wang, X.; Sun, J.; Chen, X. Record High 36 K Transition Temperature to the Superconducting State of Elemental Scandium at a Pressure of 260 GPa. Phys. Rev. Lett. 2023, 130, 256002. [Google Scholar] [CrossRef]
- He, X.; Zhang, C.; Li, Z.; Liu, C.; Feng, S.; Zhao, J.; Bin, K.L.B.; Zhang, S.; Peng, Y.; Wang, X.; et al. Superconductivity above 30 K Achieved in Dense Scandium. 2023. [Google Scholar] [CrossRef]
- Sun, H.; Huo, M.; Hu, X.; Li, J.; Liu, Z.; Han, Y.; Tang, L.; Mao, Z.; Yang, P.; Wang, B.; et al. Signatures of Superconductivity near 80 K in a Nickelate under High Pressure. Nature 2023. [Google Scholar] [CrossRef]
- Errea, I.; Belli, F.; Monacelli, L.; Sanna, A.; Koretsune, T.; Tadano, T.; Bianco, R.; Calandra, M.; Arita, R.; Mauri, F.; et al. Quantum Crystal Structure in the 250-Kelvin Superconducting Lanthanum Hydride. Nature 2020, 578, 66–69. [Google Scholar] [CrossRef] [PubMed]
- Meninno, A.; Errea, I. Ab Initio Study of Metastable Occupation of Tetrahedral Sites in Palladium Hydrides and Its Impact on Superconductivity. Phys. Rev. B 2023, 107, 024504. [Google Scholar] [CrossRef]
- Meninno, A.; Errea, I. Absence of Sizable Superconductivity in Hydrogen Boride: A First-Principles Study. Phys. Rev. B 2022, 106, 214508. [Google Scholar] [CrossRef]
- Belli, F.; Novoa, T.; Contreras-García, J.; Errea, I. Strong Correlation between Electronic Bonding Network and Critical Temperature in Hydrogen-Based Superconductors. Nat. Commun. 2021, 12, 5381. [Google Scholar] [CrossRef]
- Pickard, C.J.; Errea, I.; Eremets, M.I. Superconducting Hydrides Under Pressure. Annu. Rev. Condens. Matter Phys. 2020, 11, 57–76. [Google Scholar] [CrossRef]
- Errea, I. Superconducting Hydrides on a Quantum Landscape. J. Phys. Condens. Matter 2022, 34, 231501. [Google Scholar] [CrossRef] [PubMed]
- Hou, P.; Belli, F.; Bianco, R.; Errea, I. Strong Anharmonic and Quantum Effects in <math> <mrow> <mi>P</Mi> <mi>m</Mi> <mover Accent="true"> <mn>3</Mn> <mo>¯</Mo> </Mover> <mi>n</Mi> </Mrow> </Math> <math> <msub> <mi>AlH</Mi> <mn>3</Mn> </Msub> </Math> under High Pressure: A First-Principles Stud. Phys. Rev. B 2021, 103, 134305. [Google Scholar] [CrossRef]
- Errea, I.; Calandra, M.; Pickard, C.J.; Nelson, J.; Needs, R.J.; Li, Y.; Liu, H.; Zhang, Y.; Ma, Y.; Mauri, F. High-Pressure Hydrogen Sulfide from First Principles: A Strongly Anharmonic Phonon-Mediated Superconductor. Phys. Rev. Lett. 2015, 114, 157004. [Google Scholar] [CrossRef] [PubMed]
- Errea, I.; Calandra, M.; Pickard, C.J.; Nelson, J.R.; Needs, R.J.; Li, Y.; Liu, H.; Zhang, Y.; Ma, Y.; Mauri, F. Quantum Hydrogen-Bond Symmetrization in the Superconducting Hydrogen Sulfide System. Nature 2016, 532, 81–84. [Google Scholar] [CrossRef]
- Lyakhov, A.O.; Oganov, A.R.; Stokes, H.T.; Zhu, Q. New Developments in Evolutionary Structure Prediction Algorithm USPEX. Comput. Phys. Commun. 2013, 184, 1172–1182. [Google Scholar] [CrossRef]
- Goncharenko, I.; Eremets, M.I.; Hanfland, M.; Tse, J.S.; Amboage, M.; Yao, Y.; Trojan, I.A. Pressure-Induced Hydrogen-Dominant Metallic State in Aluminum Hydride. Phys. Rev. Lett. 2008, 100, 045504. [Google Scholar] [CrossRef]
- Talantsev, E.F.; Tallon, J.L. Universal Self-Field Critical Current for Thin-Film Superconductors. Nat. Commun. 2015, 6, 7820. [Google Scholar] [CrossRef]
- Talantsev, E.F.; Crump, W.P.; Tallon, J.L. Universal Scaling of the Self-Field Critical Current in Superconductors: From Sub-Nanometre to Millimetre Size. Sci. Rep. 2017, 7, 10010. [Google Scholar] [CrossRef]
- Park, S.; Kim, S.Y.; Kim, H.K.; Kim, M.J.; Kim, T.; Kim, H.; Choi, G.S.; Won, C.J.; Kim, S.; Kim, K.; et al. Superconductivity Emerging from a Stripe Charge Order in IrTe2 Nanoflakes. Nat. Commun. 2021, 12, 3157. [Google Scholar] [CrossRef]
- Talantsev, E.F.; Crump, W.P.; Storey, J.G.; Tallon, J.L. London Penetration Depth and Thermal Fluctuations in the Sulphur Hydride 203 K Superconductor. Ann. Phys. 2017, 529, 1–5. [Google Scholar] [CrossRef]
- Khasanov, R.; Guguchia, Z.; Maisuradze, A.; Andreica, D.; Elender, M.; Raselli, A.; Shermadini, Z.; Goko, T.; Knecht, F.; Morenzoni, E.; et al. High Pressure Research Using Muons at the Paul Scherrer Institute. High Press. Res. 2016, 36, 140–166. [Google Scholar] [CrossRef]
- Talantsev, E.F. Classifying Superconductivity in Compressed H3S. Mod. Phys. Lett. B 2019, 33, 1950195. [Google Scholar] [CrossRef]
- Talantsev, E.F. Electron–Phonon Coupling Constant and BCS Ratios in LaH 10−y Doped with Magnetic Rare-Earth Element. Supercond. Sci. Technol. 2022, 35, 095008. [Google Scholar] [CrossRef]
- Khasanov, R. Perspective on Muon-Spin Rotation/Relaxation under Hydrostatic Pressure. J. Appl. Phys. 2022, 132. [Google Scholar] [CrossRef]
- Grinenko, V.; Das, D.; Gupta, R.; Zinkl, B.; Kikugawa, N.; Maeno, Y.; Hicks, C.W.; Klauss, H.-H.; Sigrist, M.; Khasanov, R. Unsplit Superconducting and Time Reversal Symmetry Breaking Transitions in Sr2RuO4 under Hydrostatic Pressure and Disorder. Nat. Commun. 2021, 12, 3920. [Google Scholar] [CrossRef]
- Talantsev, E.F. D-Wave Superconducting Gap Symmetry as a Model for Nb1−xMoxB2 (x = 0.25; 1.0) and WB2 Diborides. Symmetry (Basel). 2023, 15, 812. [Google Scholar] [CrossRef]
- Migdal, A.B. Interaction between Electrons and Lattice Vibrations in a Normal Metal. Sov. Phys.–JETP 1958, 7, 996. [Google Scholar]
- G. M. Eliashberg Interactions between Electrons and Lattice Vibrations in a Superconductor. Sov. Phys.–JETP 1960, 11, 696. [Google Scholar]
- Gor’kov, L.P. Phonon Mechanism in the Most Dilute Superconductor n -Type SrTiO 3. Proc. Natl. Acad. Sci. 2016, 113, 4646–4651. [Google Scholar] [CrossRef]
- Takada, Y. Plasmon Mechanism of Superconductivity in Two- and Three-Dimensional Electron Systems. J. Phys. Soc. Japan 1978, 45, 786–794. [Google Scholar] [CrossRef]
- Lin, X.; Zhu, Z.; Fauqué, B.; Behnia, K. Fermi Surface of the Most Dilute Superconductor. Phys. Rev. X 2013, 3, 021002. [Google Scholar] [CrossRef]
- Szczeşńiak, D.; Drzazga-Szczeşńiak, E.A. Non-Adiabatic Superconductivity in the Electron-Doped Graphene. EPL (Europhysics Lett. 2021, 135, 67002. [Google Scholar] [CrossRef]
- Drzazga-Szczȩśniak, E.A.; Szczȩśniak, D.; Kaczmarek, A.Z.; Szczȩśniak, R. Breakdown of Adiabatic Superconductivity in Ca-Doped h-BN Monolayer. Condens. Matter 2022, 7, 60. [Google Scholar] [CrossRef]
- Szczęśniak, D.; Kaczmarek, A.Z.; Drzazga-Szczęśniak, E.A.; Szczęśniak, R. Phonon-Mediated Superconductivity in Bismuthates by Nonadiabatic Pairing. Phys. Rev. B 2021, 104, 094501. [Google Scholar] [CrossRef]
- Szcze¸śniak, D. Scalability of Non-Adiabatic Effects in Lithium-Decorated Graphene Superconductor. Europhys. Lett. 2023, 142, 36002. [Google Scholar] [CrossRef]
- Talantsev, E.F. Quantifying Nonadiabaticity in Major Families of Superconductors. Nanomaterials 2022, 13, 71. [Google Scholar] [CrossRef]
- Yoon, H.; Swartz, A.G.; Harvey, S.P.; Inoue, H.; Hikita, Y.; Yu, Y.; Chung, S.B.; Raghu, S.; Hwang, H.Y. Low-Density Superconductivity in SrTiO$_3$ Bounded by the Adiabatic Criterion. 2021. [Google Scholar] [CrossRef]
- Pietronero, L.; Strässler, S.; Grimaldi, C. Nonadiabatic Superconductivity. I. Vertex Corrections for the Electron-Phonon Interactions. Phys. Rev. B 1995, 52, 10516–10529. [Google Scholar] [CrossRef]
- Grimaldi, C.; Pietronero, L.; Strässler, S. Nonadiabatic Superconductivity. II. Generalized Eliashberg Equations beyond Migdal’s Theorem. Phys. Rev. B 1995, 52, 10530–10546. [Google Scholar] [CrossRef]
- Cappelluti, E.; Ciuchi, S.; Grimaldi, C.; Pietronero, L.; Strässler, S. High <math Display="inline"> <mrow> <msub> <mrow> <mi>T</Mi> </Mrow> <mrow> <mi>c</Mi> </Mrow> </Msub> </Mrow> </Math> Superconductivity in <math Display="inline"> <mrow> <msub> <mrow> <mi>MgB</Mi> </Mrow> <mrow> <mn>2</Mn> </Mrow> </Msub> </Mrow> </Math>. Phys. Rev. Lett. 2002, 88, 117003. [Google Scholar] [CrossRef]
- Grimaldi, C.; Cappelluti, E.; Pietronero, L. Isotope Effect on m * in High- T c Materials Due to the Breakdown of Migdal’s Theorem. Europhys. Lett. 1998, 42, 667–672. [Google Scholar] [CrossRef]
- Pietronero, L.; Boeri, L.; Cappelluti, E.; Ortenzi, L. Conventional/Unconventional Superconductivity in High-Pressure Hydrides and beyond: Insights from Theory and Perspectives. Quantum Stud. Math. Found. 2018, 5, 5–21. [Google Scholar] [CrossRef]
- Eremets, M.I.; Shimizu, K.; Kobayashi, T.C.; Amaya, K. Metallic CsI at Pressures of up to 220 Gigapascals. Science (80-. ). 1998, 281, 1333–1335. [Google Scholar] [CrossRef]
- Talantsev, E.F. Fermi-Liquid Nonadiabatic Highly Compressed Cesium Iodide Superconductor. Condens. Matter 2022, 7, 65. [Google Scholar] [CrossRef]
- Song, Y.; Bi, J.; Nakamoto, Y.; Shimizu, K.; Liu, H.; Zou, B.; Liu, G.; Wang, H.; Ma, Y. Stoichiometric Ternary Superhydride <math Display="inline"> <mrow> <msub> <mrow> <mi>LaBeH</Mi> </Mrow> <mrow> <mn>8</Mn> </Mrow> </Msub> </Mrow> </Math> as a New Template for High-Temperature Superconductivity at 110 K under 80 GPa. Phys. Rev. Lett. 2023, 130, 266001. [Google Scholar] [CrossRef] [PubMed]
- Li, X.; Sun, J.; Shahi, P.; Gao, M.; MacDonald, A.H.; Uwatoko, Y.; Xiang, T.; Goodenough, J.B.; Cheng, J.; Zhou, J. Pressure-Induced Phase Transitions and Superconductivity in a Black Phosphorus Single Crystal. Proc. Natl. Acad. Sci. 2018, 115, 9935–9940. [Google Scholar] [CrossRef]
- Guo, J.; Wang, H.; von Rohr, F.; Yi, W.; Zhou, Y.; Wang, Z.; Cai, S.; Zhang, S.; Li, X.; Li, Y.; et al. Electron-Hole Balance and the Anomalous Pressure-Dependent Superconductivity in Black Phosphorus. Phys. Rev. B 2017, 96, 224513. [Google Scholar] [CrossRef]
- Shirotani, I.; Mikami, J.; Adachi, T.; Katayama, Y.; Tsuji, K.; Kawamura, H.; Shimomura, O.; Nakajima, T. Phase Transitions and Superconductivity of Black Phosphorus and Phosphorus-Arsenic Alloys at Low Temperatures and High Pressures. Phys. Rev. B 1994, 50, 16274–16278. [Google Scholar] [CrossRef]
- Bardeen, J.; Cooper, L.N.; Schrieffer, J.R. Theory of Superconductivity. Phys. Rev. 1957, 108, 1175–1204. [Google Scholar] [CrossRef]
- McMillan, W.L. Transition Temperature of Strong-Coupled Superconductors. Phys. Rev. 1968, 167, 331–344. [Google Scholar] [CrossRef]
- Dynes, R.C. McMillan’s Equation and the Tc of Superconductors. Solid State Commun. 1972, 10, 615–618. [Google Scholar] [CrossRef]
- Allen, P.B.; Dynes, R.C. Transition Temperature of Strong-Coupled Superconductors Reanalyzed. Phys. Rev. B 1975, 12, 905–922. [Google Scholar] [CrossRef]
- Talantsev, E.F. Advanced McMillan’s Equation and Its Application for the Analysis of Highly-Compressed Superconductors. Supercond. Sci. Technol. 2020, 33, 094009. [Google Scholar] [CrossRef]
- Bloch, F. Zum Elektrischen Widerstandsgesetz Bei Tiefen Temperaturen. Zeitschrift f�r Phys. 1930, 59, 208–214. [Google Scholar] [CrossRef]
- Grüneisen, E. Die Abhängigkeit Des Elektrischen Widerstandes Reiner Metalle von Der Temperatur. Ann. Phys. 1933, 408, 530–540. [Google Scholar] [CrossRef]
- Fisk, Z.; Webb, G.W. Saturation of the High-Temperature Normal-State Electrical Resistivity of Superconductors. Phys. Rev. Lett. 1976, 36, 1084–1086. [Google Scholar] [CrossRef]
- Wiesmann, H.; Gurvitch, M.; Lutz, H.; Ghosh, A.; Schwarz, B.; Strongin, M.; Allen, P.B.; Halley, J.W. Simple Model for Characterizing the Electrical Resistivity in <math Display="inline"> <mi>A</Mi> <mo>−</Mo> <mn>15</Mn> <mn/> </Math> Superconductors. Phys. Rev. Lett. 1977, 38, 782–785. [Google Scholar] [CrossRef]
- Carbotte, J.P. Properties of Boson-Exchange Superconductors. Rev. Mod. Phys. 1990, 62, 1027–1157. [Google Scholar] [CrossRef]
- Helfand, E.; Werthamer, N.R. Temperature and Purity Dependence of the Superconducting Critical Field, <math Display="inline"> <mrow> <msub> <mrow> <mi>H</Mi> </Mrow> <mrow> <mi>c</Mi> <mn>2</Mn> <mn/> </Mrow> </Msub> </Mrow> </Math>. II. Phys. Rev. 1966, 147, 288–294. [Google Scholar] [CrossRef]
- Werthamer, N.R.; Helfand, E.; Hohenberg, P.C. Temperature and Purity Dependence of the Superconducting Critical Field, <math Display="inline"> <mrow> <msub> <mrow> <mi>H</Mi> </Mrow> <mrow> <mi>c</Mi> <mn>2</Mn> <mn/> </Mrow> </Msub> </Mrow> </Math>. III. Electron Spin and Spin-Orbit Effects. Phys. Rev. 1966, 147, 295–302. [Google Scholar] [CrossRef]
- Baumgartner, T.; Eisterer, M.; Weber, H.W.; Flükiger, R.; Scheuerlein, C.; Bottura, L. Effects of Neutron Irradiation on Pinning Force Scaling in State-of-the-Art Nb 3 Sn Wires. Supercond. Sci. Technol. 2014, 27, 015005. [Google Scholar] [CrossRef]
- P. Poole, C. Properties of the Normal Metallic State. In Handbook of Superconductivity; Elsevier, 2000; pp. 29–41.
- Poole, C.P.; Farach, H.; Creswick, R.; Prozorov, R. Superconductivity; 2nd ed.; Academic Press: London, UK, 2007.
- Talantsev, E.F. The Compliance of the Upper Critical Field in Magic-Angle Multilayer Graphene with the Pauli Limit. Materials (Basel). 2022, 16, 256. [Google Scholar] [CrossRef] [PubMed]
- Ho, C.Y.; Powell, R.W.; Liley, P.E. Thermal Conductivity of the Elements. J. Phys. Chem. Ref. Data 1972, 1, 279–421. [Google Scholar] [CrossRef]
- Talantsev, E.F. The Dominance of Non-Electron–Phonon Charge Carrier Interaction in Highly-Compressed Superhydrides. Supercond. Sci. Technol. 2021, 34, 115001. [Google Scholar] [CrossRef]
- Semenok, D. Computational Design of New Superconducting Materials and Their Targeted Experimental Synthesis. PhD Thesis; Sk. Inst. Sci. Technol. [CrossRef]
- Harshman, D.R.; Fiory, A.T. High-TC Superconductivity in Hydrogen Clathrates Mediated by Coulomb Interactions Between Hydrogen and Central-Atom Electrons. J. Supercond. Nov. Magn. 2020, 33, 2945–2961. [Google Scholar] [CrossRef]
- Homes, C.C.; Dordevic, S. V.; Strongin, M.; Bonn, D.A.; Liang, R.; Hardy, W.N.; Komiya, S.; Ando, Y.; Yu, G.; Kaneko, N.; et al. A Universal Scaling Relation in High-Temperature Superconductors. Nature 2004, 430, 539–541. [Google Scholar] [CrossRef]
- Koblischka, M.R.; Koblischka-Veneva, A. Calculation of Tc of Superconducting Elements with the Roeser–Huber Formalism. Metals (Basel). 2022, 12, 337. [Google Scholar] [CrossRef]
- Dew-Hughes, D. Flux Pinning Mechanisms in Type II Superconductors. Philos. Mag. 1974, 30, 293–305. [Google Scholar] [CrossRef]
- Kramer, E.J. Scaling Laws for Flux Pinning in Hard Superconductors. J. Appl. Phys. 1973, 44, 1360–1370. [Google Scholar] [CrossRef]
- Talantsev, E.F. New Scaling Laws for Pinning Force Density in Superconductors. Condens. Matter 2022, 7, 74. [Google Scholar] [CrossRef]
- Godeke, A.; Haken, B. ten; Kate, H.H.J. ten; Larbalestier, D.C. A General Scaling Relation for the Critical Current Density in Nb3Sn. Supercond. Sci. Technol. 2006, 19, R100–R116. [Google Scholar] [CrossRef]
- Talantsev, E.F.; Mataira, R.C.; Crump, W.P. Classifying Superconductivity in Moiré Graphene Superlattices. Sci. Rep. 2020, 10, 212. [Google Scholar] [CrossRef] [PubMed]
- Talantsev, E.F. Classifying Hydrogen-Rich Superconductors. Mater. Res. Express 2019, 6, 106002. [Google Scholar] [CrossRef]
- Zhang, Z.; Cui, T.; Hutcheon, M.J.; Shipley, A.M.; Song, H.; Du, M.; Kresin, V.Z.; Duan, D.; Pickard, C.J.; Yao, Y. Design Principles for High-Temperature Superconductors with a Hydrogen-Based Alloy Backbone at Moderate Pressure. Phys. Rev. Lett. 2022, 128, 047001. [Google Scholar] [CrossRef] [PubMed]
- Hirsch, J.E.; Marsiglio, F. On Magnetic Field Screening and Expulsion in Hydride Superconductors. J. Supercond. Nov. Magn. 2023, 36, 1257–1261. [Google Scholar] [CrossRef]
- Hirsch, J.E.; Marsiglio, F. Evidence Against Superconductivity in Flux Trapping Experiments on Hydrides Under High Pressure. J. Supercond. Nov. Magn. 2022, 35, 3141–3145. [Google Scholar] [CrossRef]
- Hirsch, J.E. Enormous Variation in Homogeneity and Other Anomalous Features of Room Temperature Superconductor Samples: A Comment on Nature 615, 244 (2023). J. Supercond. Nov. Magn. 2023. [Google Scholar] [CrossRef]
- Hirsch, J.E. Electrical Resistance of Hydrides Under High Pressure: Evidence of Superconductivity or Confirmation Bias? J. Supercond. Nov. Magn. 2023. [Google Scholar] [CrossRef]
- Talantsev Classifying Induced Superconductivity in Atomically Thin Dirac-Cone Materials. Condens. Matter 2019, 4, 83. [CrossRef]
Figure 1.
The gap-to-transition temperature ratio, , vs the electron-phonon coupling constant, , dataset reported by Carbotte in the Table IV of Ref. [111]. Linear fit is shown by pink line. Positions for some representative superconductors and superconductors studied in this report (where bP stands for black phosphorus and vP stands for violet phosphorus) are shown. 95% confidence bands for the linear fit are shown by pink shadow area.
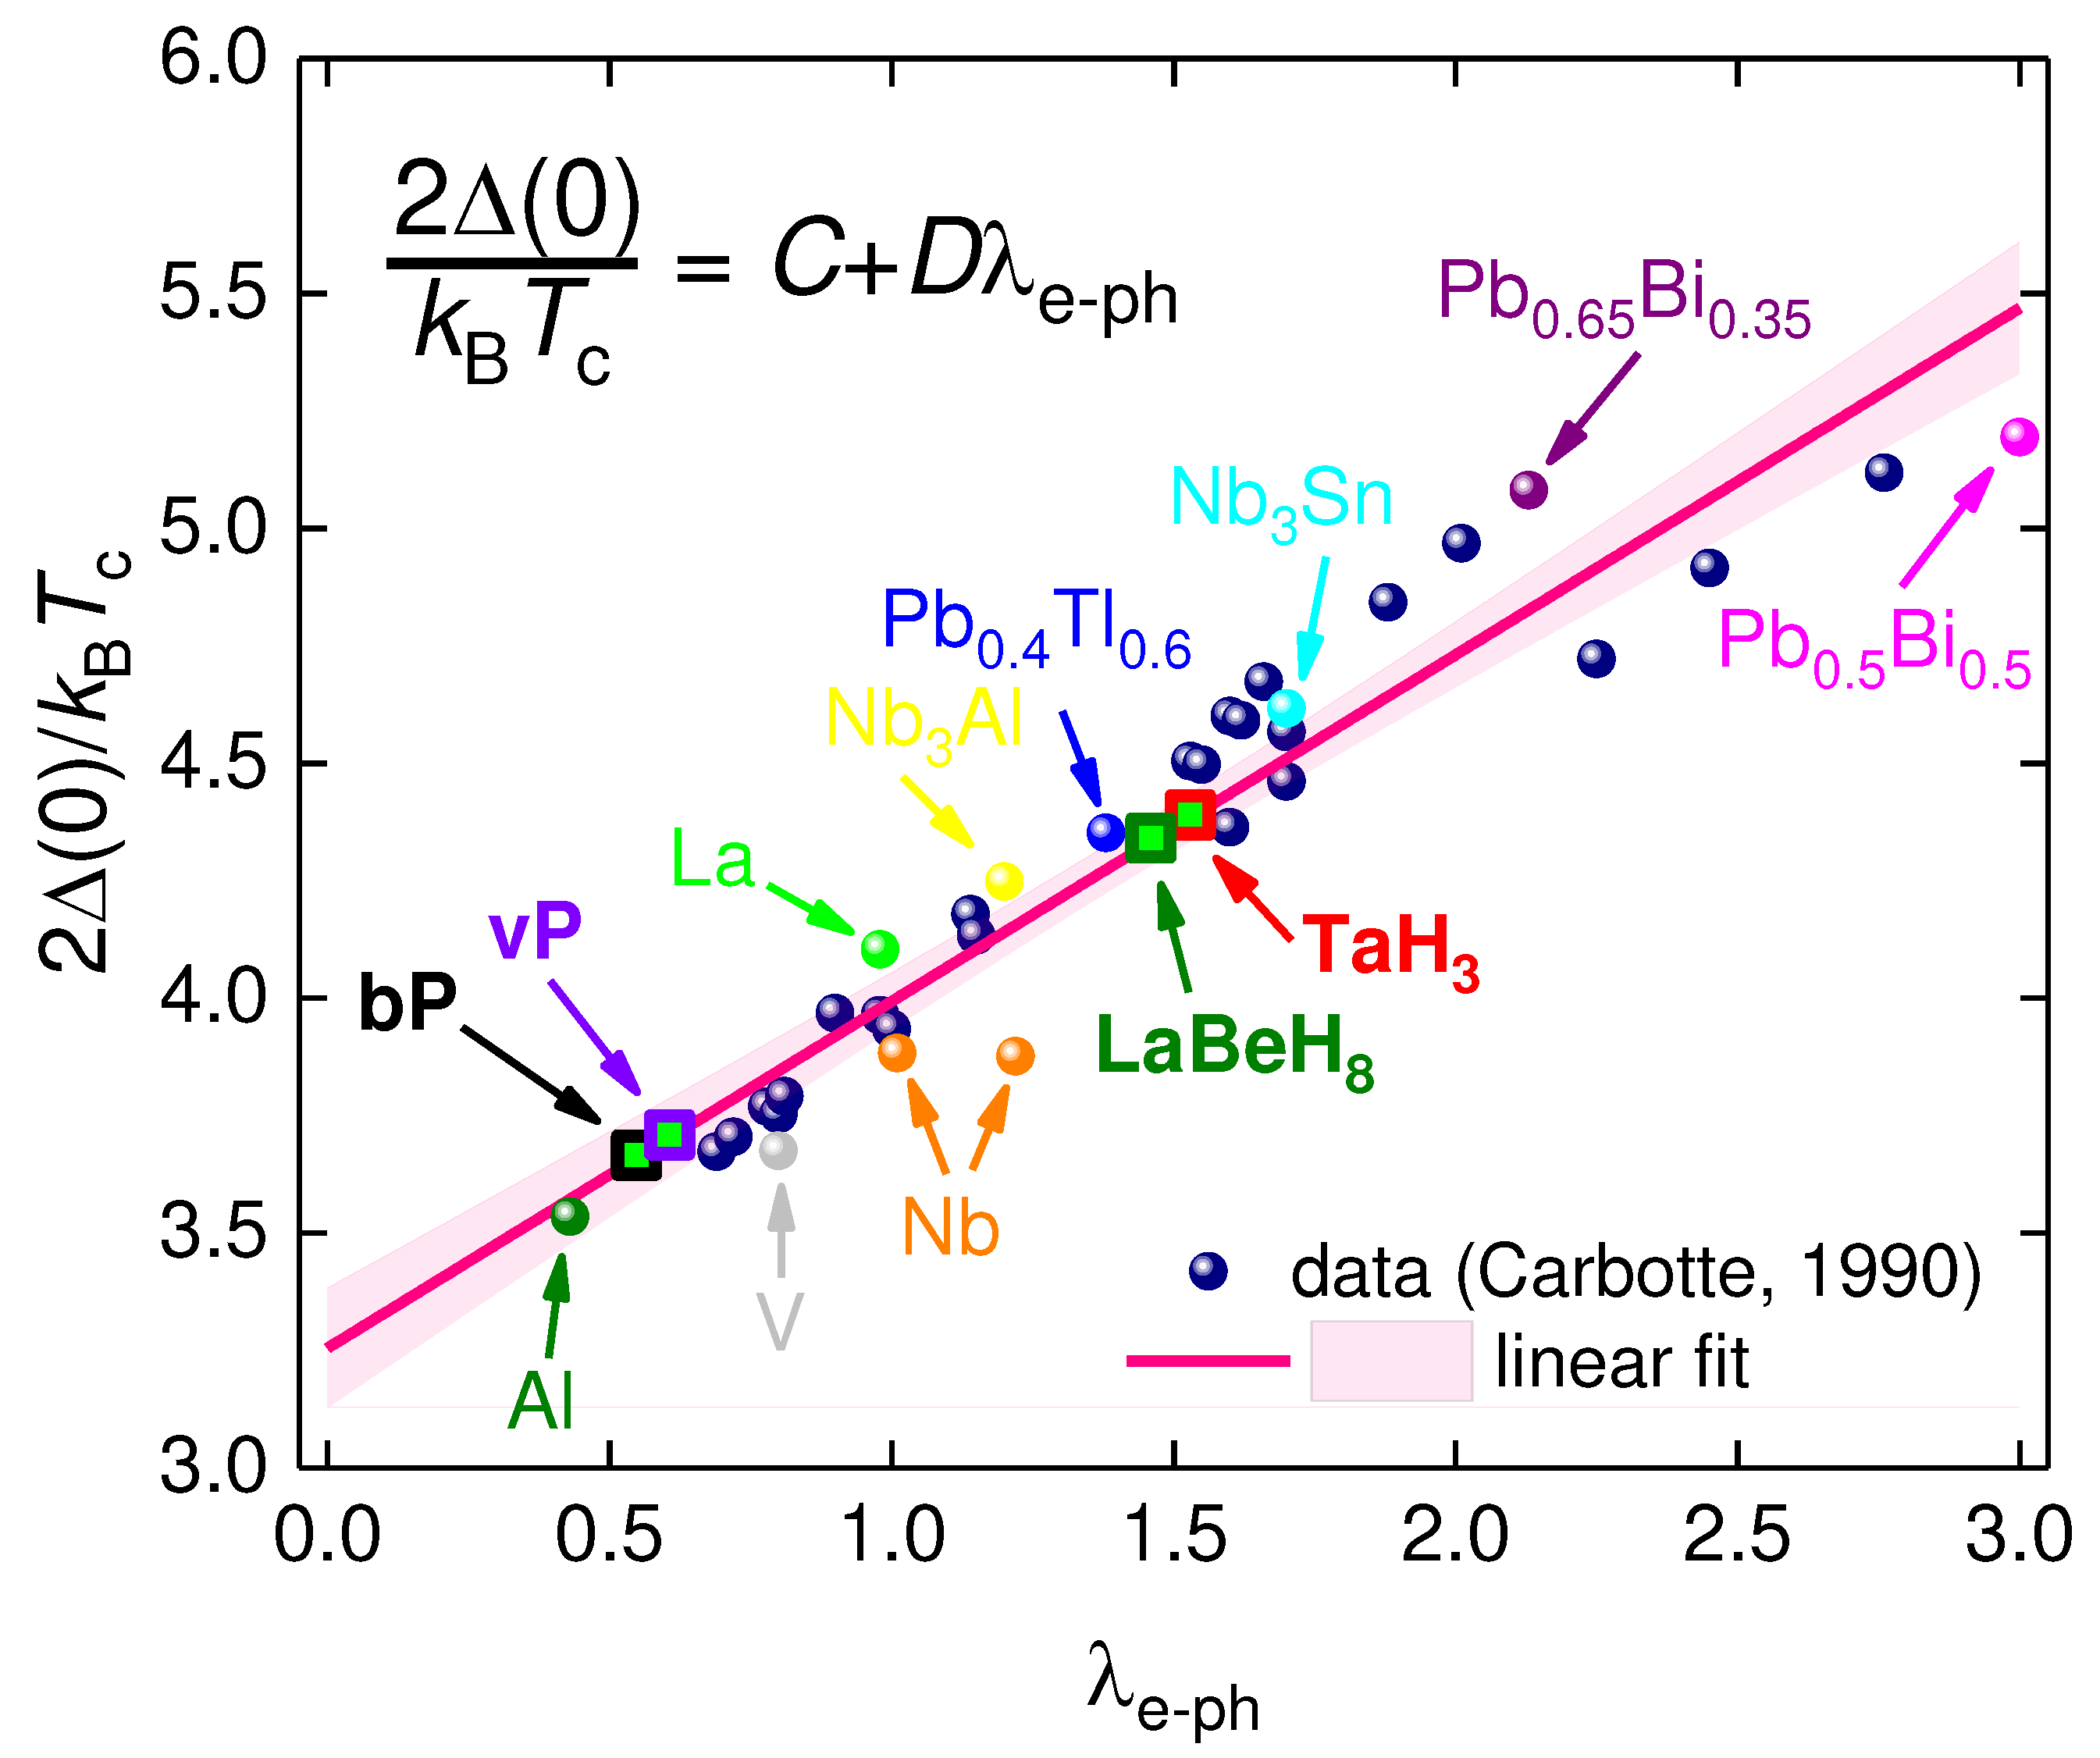
Figure 2.
Temperature dependent resistance data, R(T), for compressed titanium (-phase at P = 18 GPa) and data fit to Eq. 3 (raw data reported by Zhang et al [54]). Green balls indicate the bounds for which R(T) data was used for the fit to Eq. 3. (a) Fit to Debye model: , , , , fit quality is 0.99988. (b) Fit to Eq. 3: , , , fit quality is 0.99995. 95% confidence bands are shown.
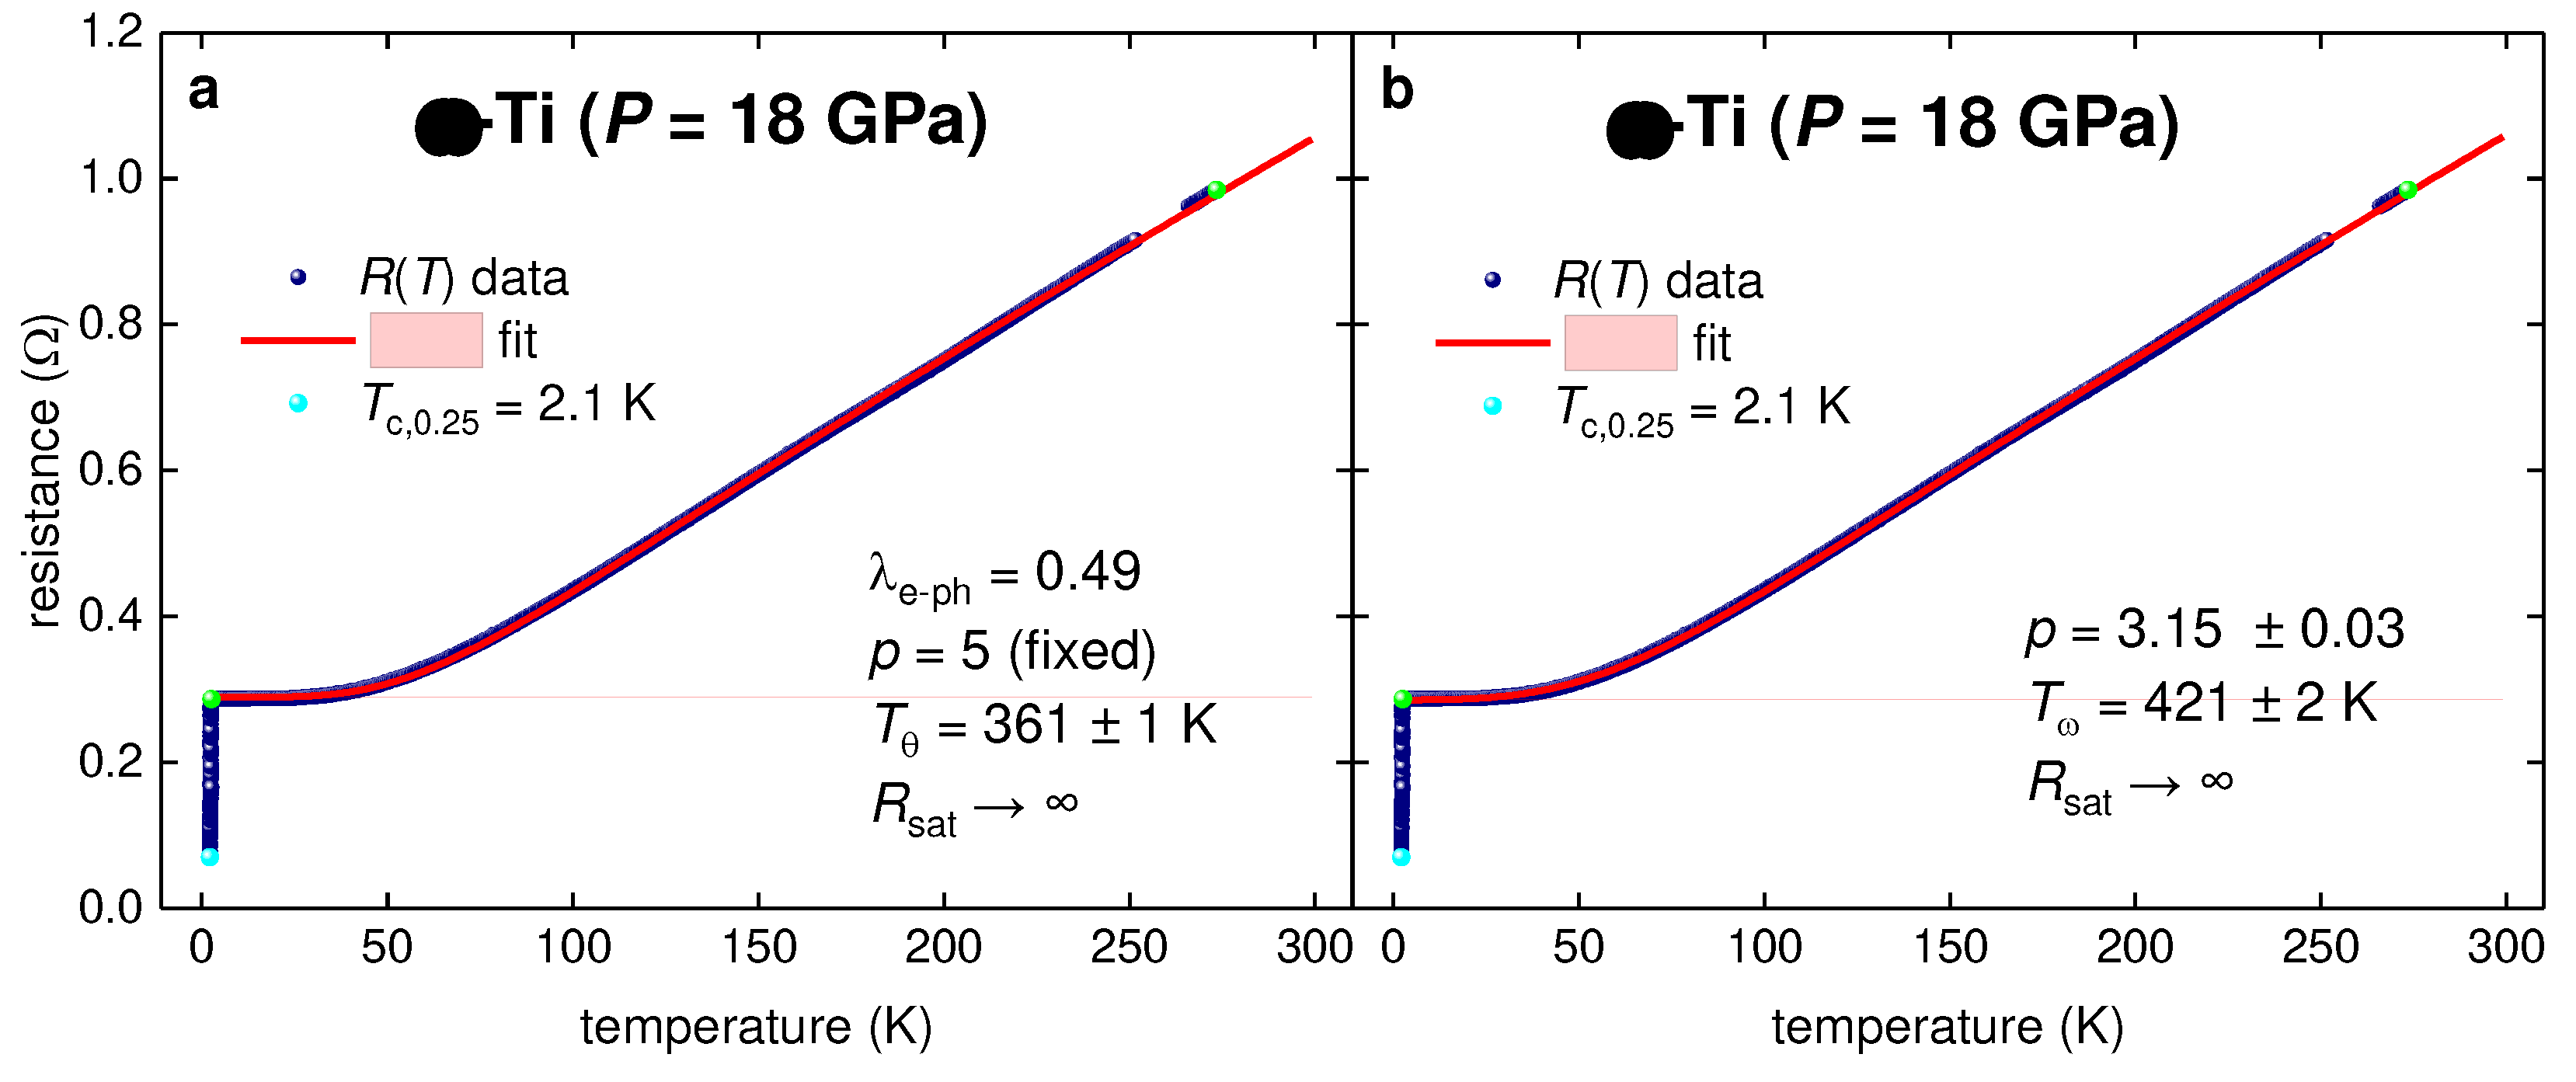
Figure 3.
Temperature dependent resistance data, R(T), for compressed titanium (-phase) and data fit to the Debye model (Eq. 3, ). Raw data reported by Zhang et al [54] (Panels a,b,d) and Liu et al [55] (Panel c). Green balls indicate the bounds for which R(T) data was used for the fit to Eq. 3. Deduced parameters are (a) , , , fit quality is 0.99992. (b) , , , fit quality is 0.9998. (c) , , , fit quality is 0.9996. (d) , , , fit quality is 0.9997. 95% confidence bands are shown.
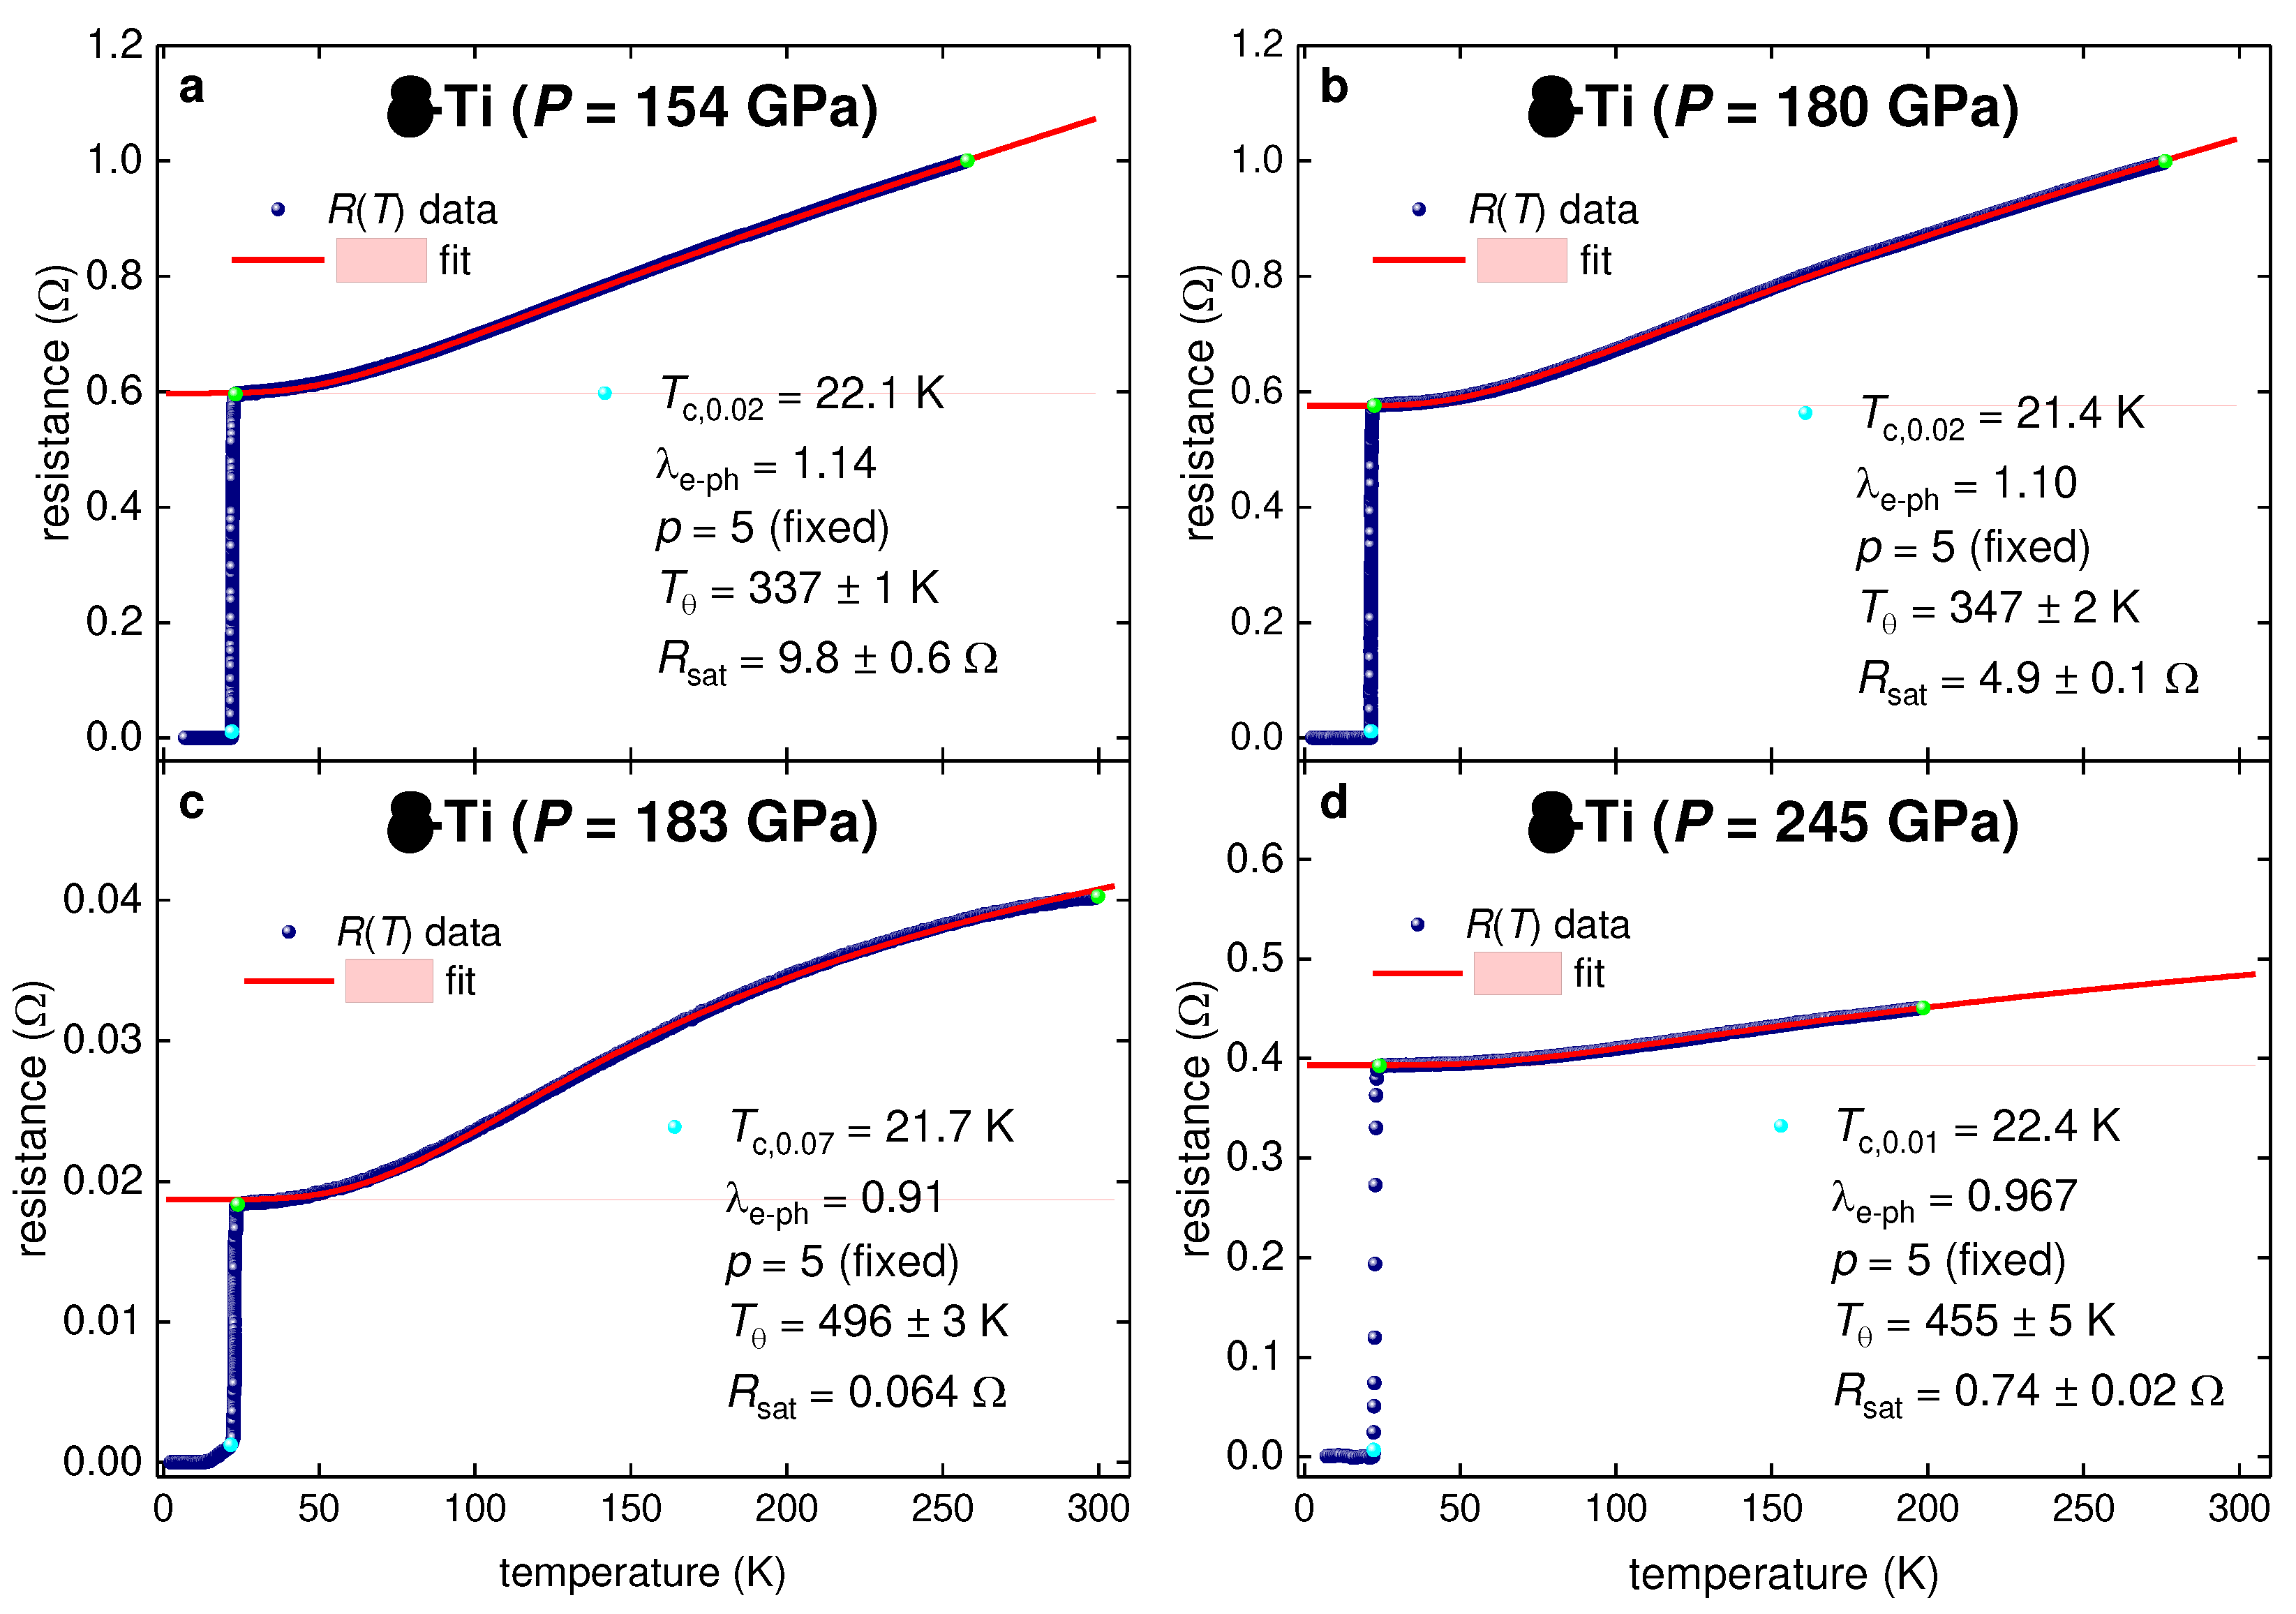
Figure 4.
Evolution of (a) the electron-phonon coupling constant ; (b) characteristic phonon temperatures and ; and (c) Fermi temperature, , calculated by Eq. 8 and the used of carrier density reported by Zhang et al [54] and deduced (in Panel (a)) and the nonadiabaticity strength constant, , for highly compressed titanium.
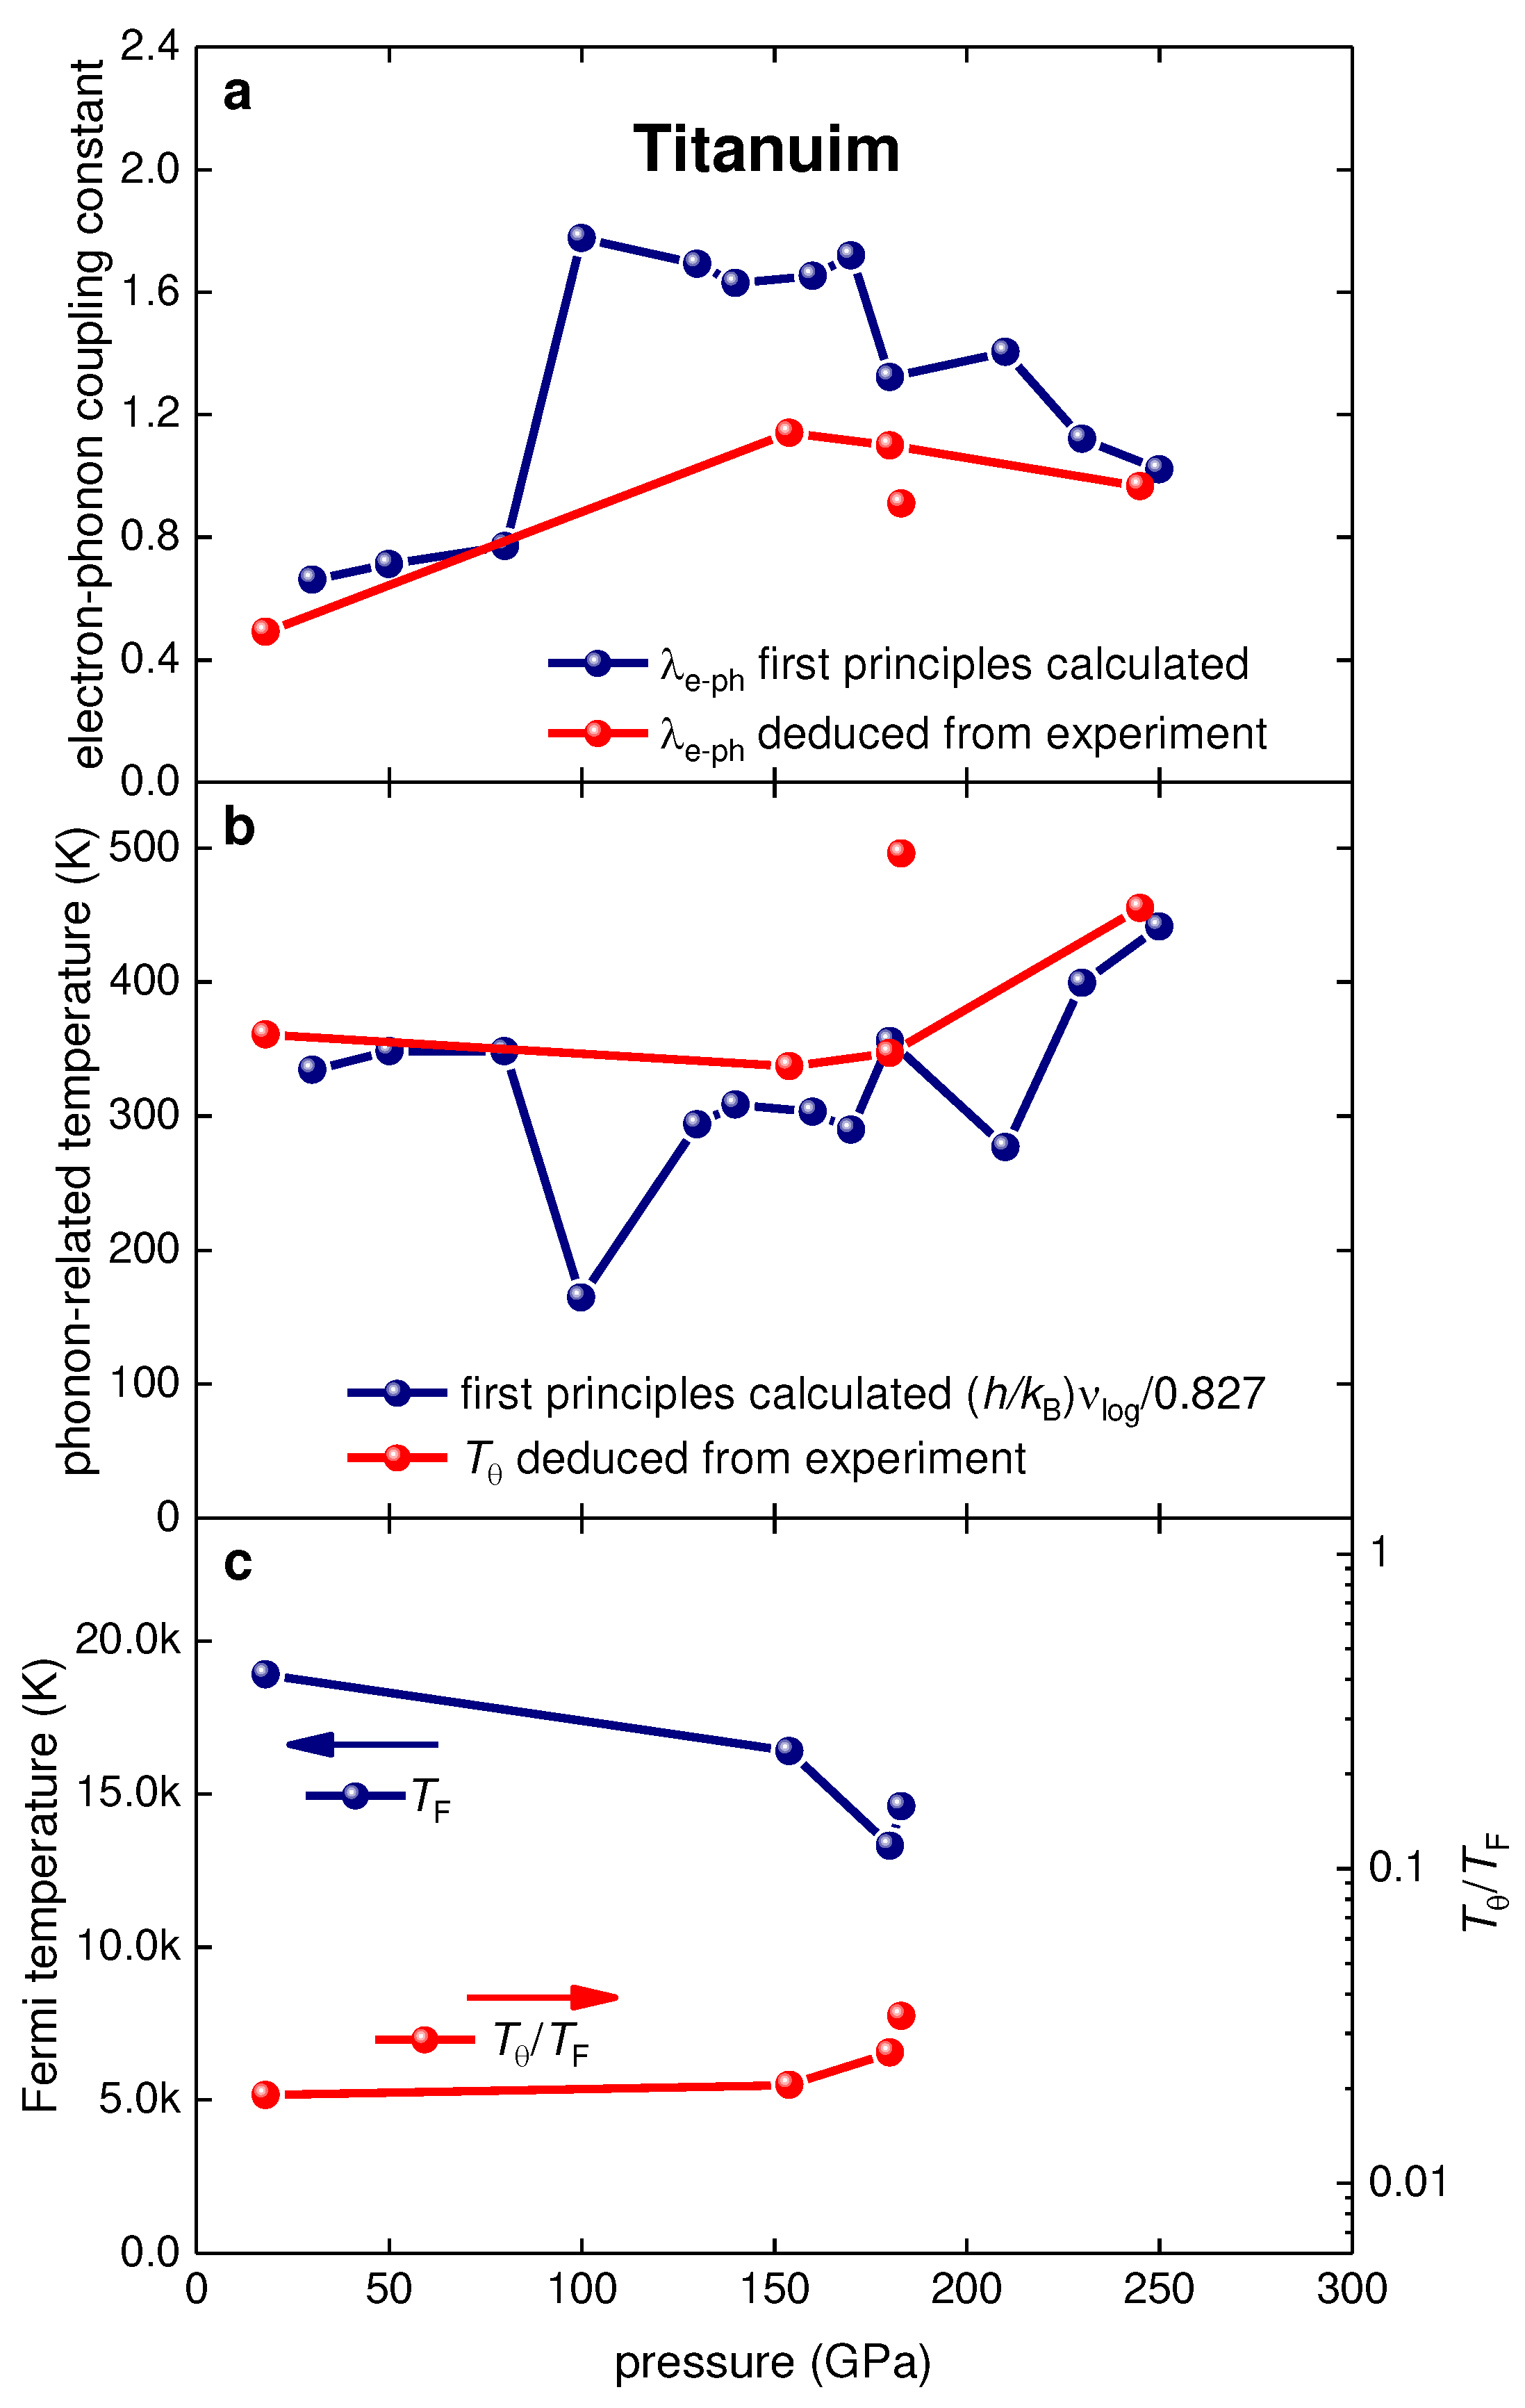
Figure 8.
Analyzed experimental data for I-43d-phase of TaH3 at P = 197 GPa (raw data reported by He et al [21]). (a) Temperature dependent resistance data, R(T), and data fit to Eq. 3. Green balls indicate the bounds for which R(T) data was used for the fit to Eq. 3. Deduced , , , fit quality is 0.99998. (b) The upper critical field data, Bc2(T), and data fit to Eq. 7. Definition Bc2(T) criterion of was used. Deduced parameters are: , . Fit quality is 0.9943. 95% confidence bands are shown by pink shadow areas in both panels.
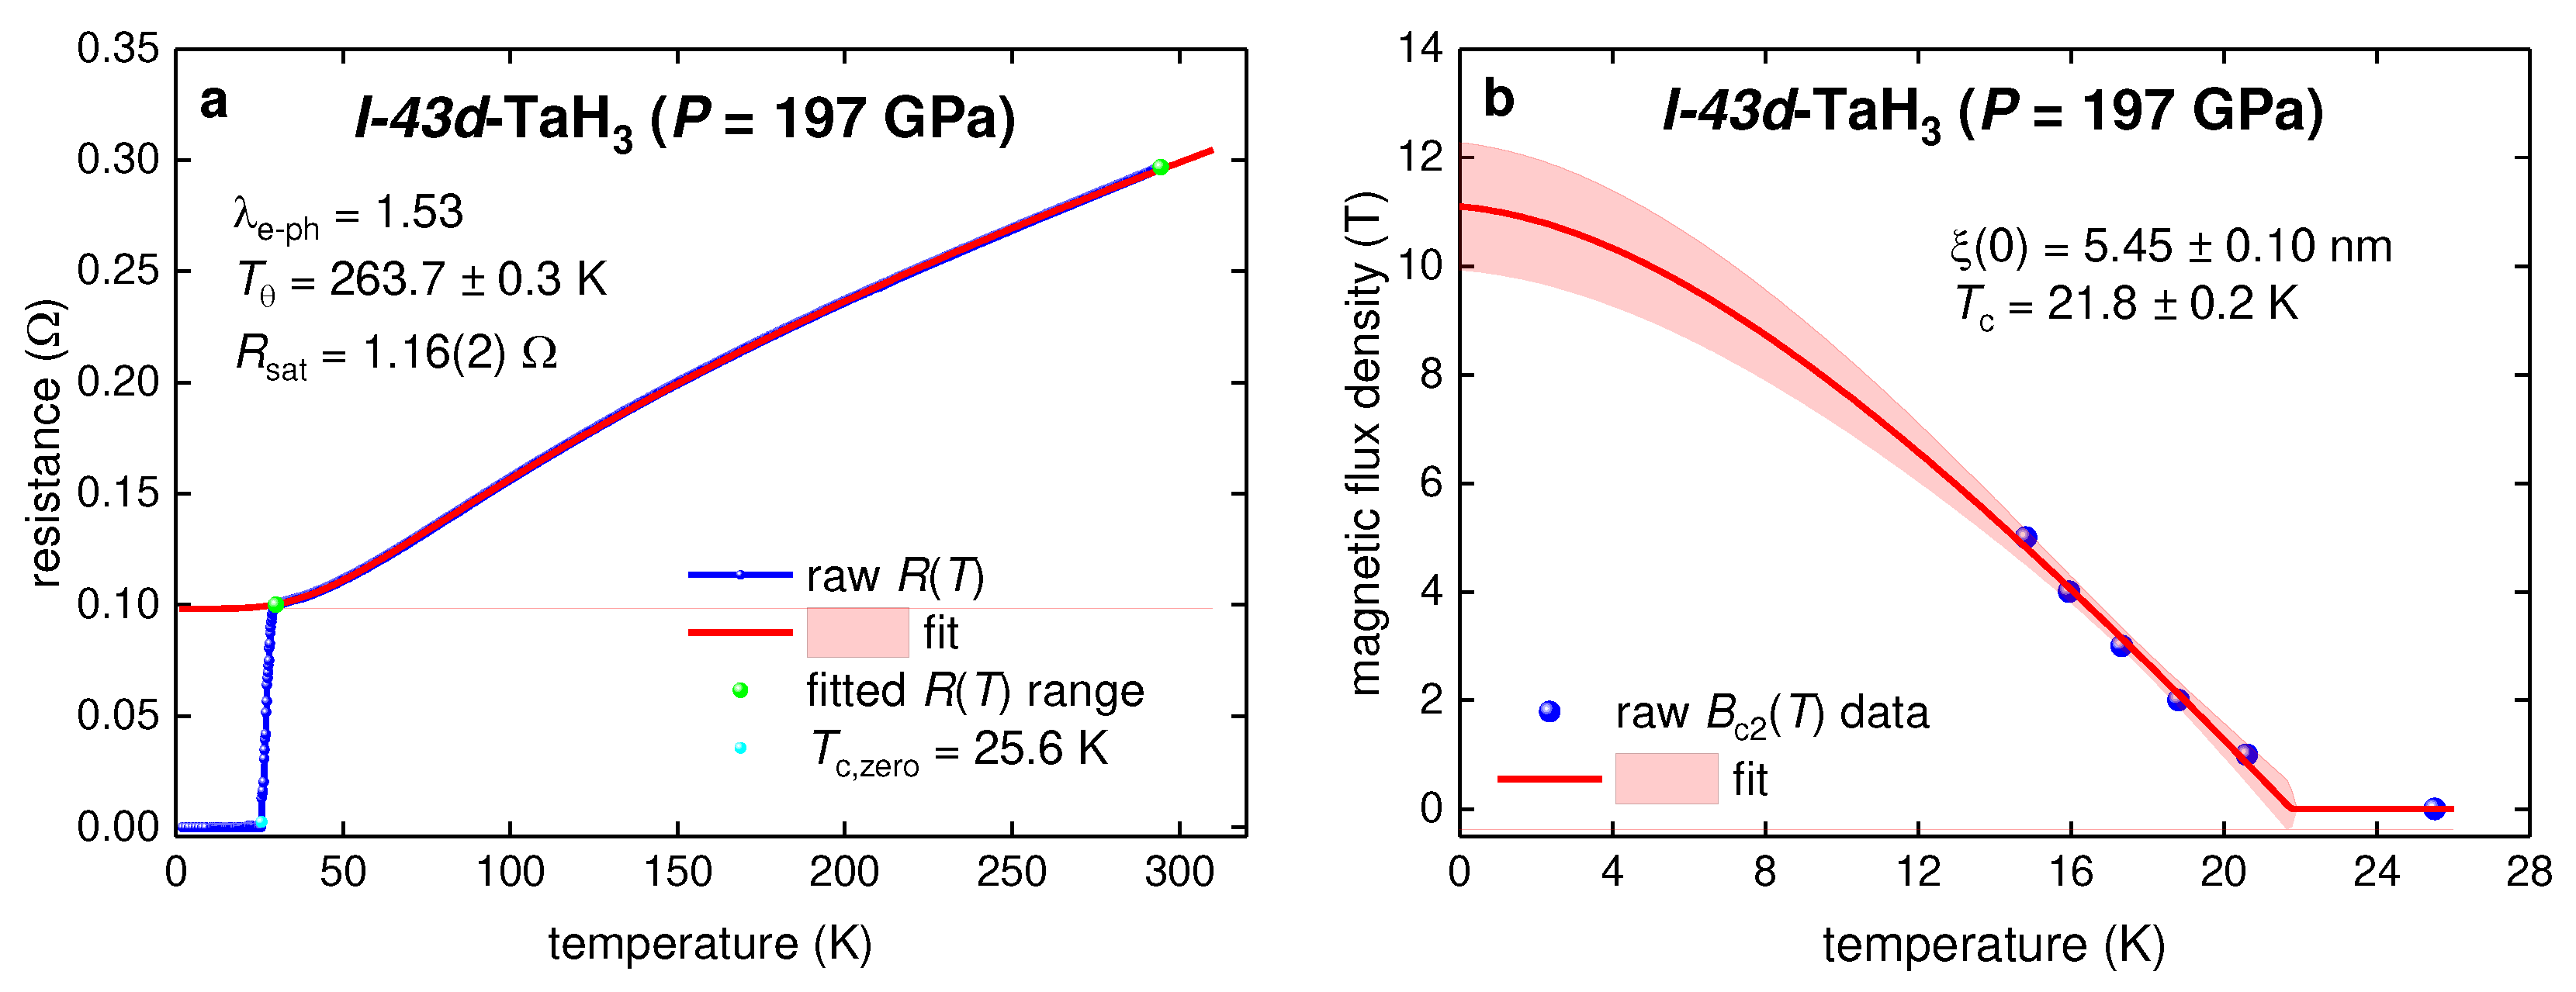
Figure 9.
Analyzed experimental data for -phase of LaBeH8 at P = 120 GPa (raw data reported by Song et al [98]). (a) Temperature dependent resistance data, R(T), and data fit to Eq. 3. Green balls indicate the bounds for which R(T) data was used for the fit to Eq. 3. Deduced , , , fit quality is 0.9990. (b) The upper critical field data, Bc2(T), and data fit to Eq. 7. Definition Bc2(T) criterion of was used. Deduced parameters are: , . Fit quality is 0.9995. 95% confidence bands are shown by pink shadow areas in both panels.
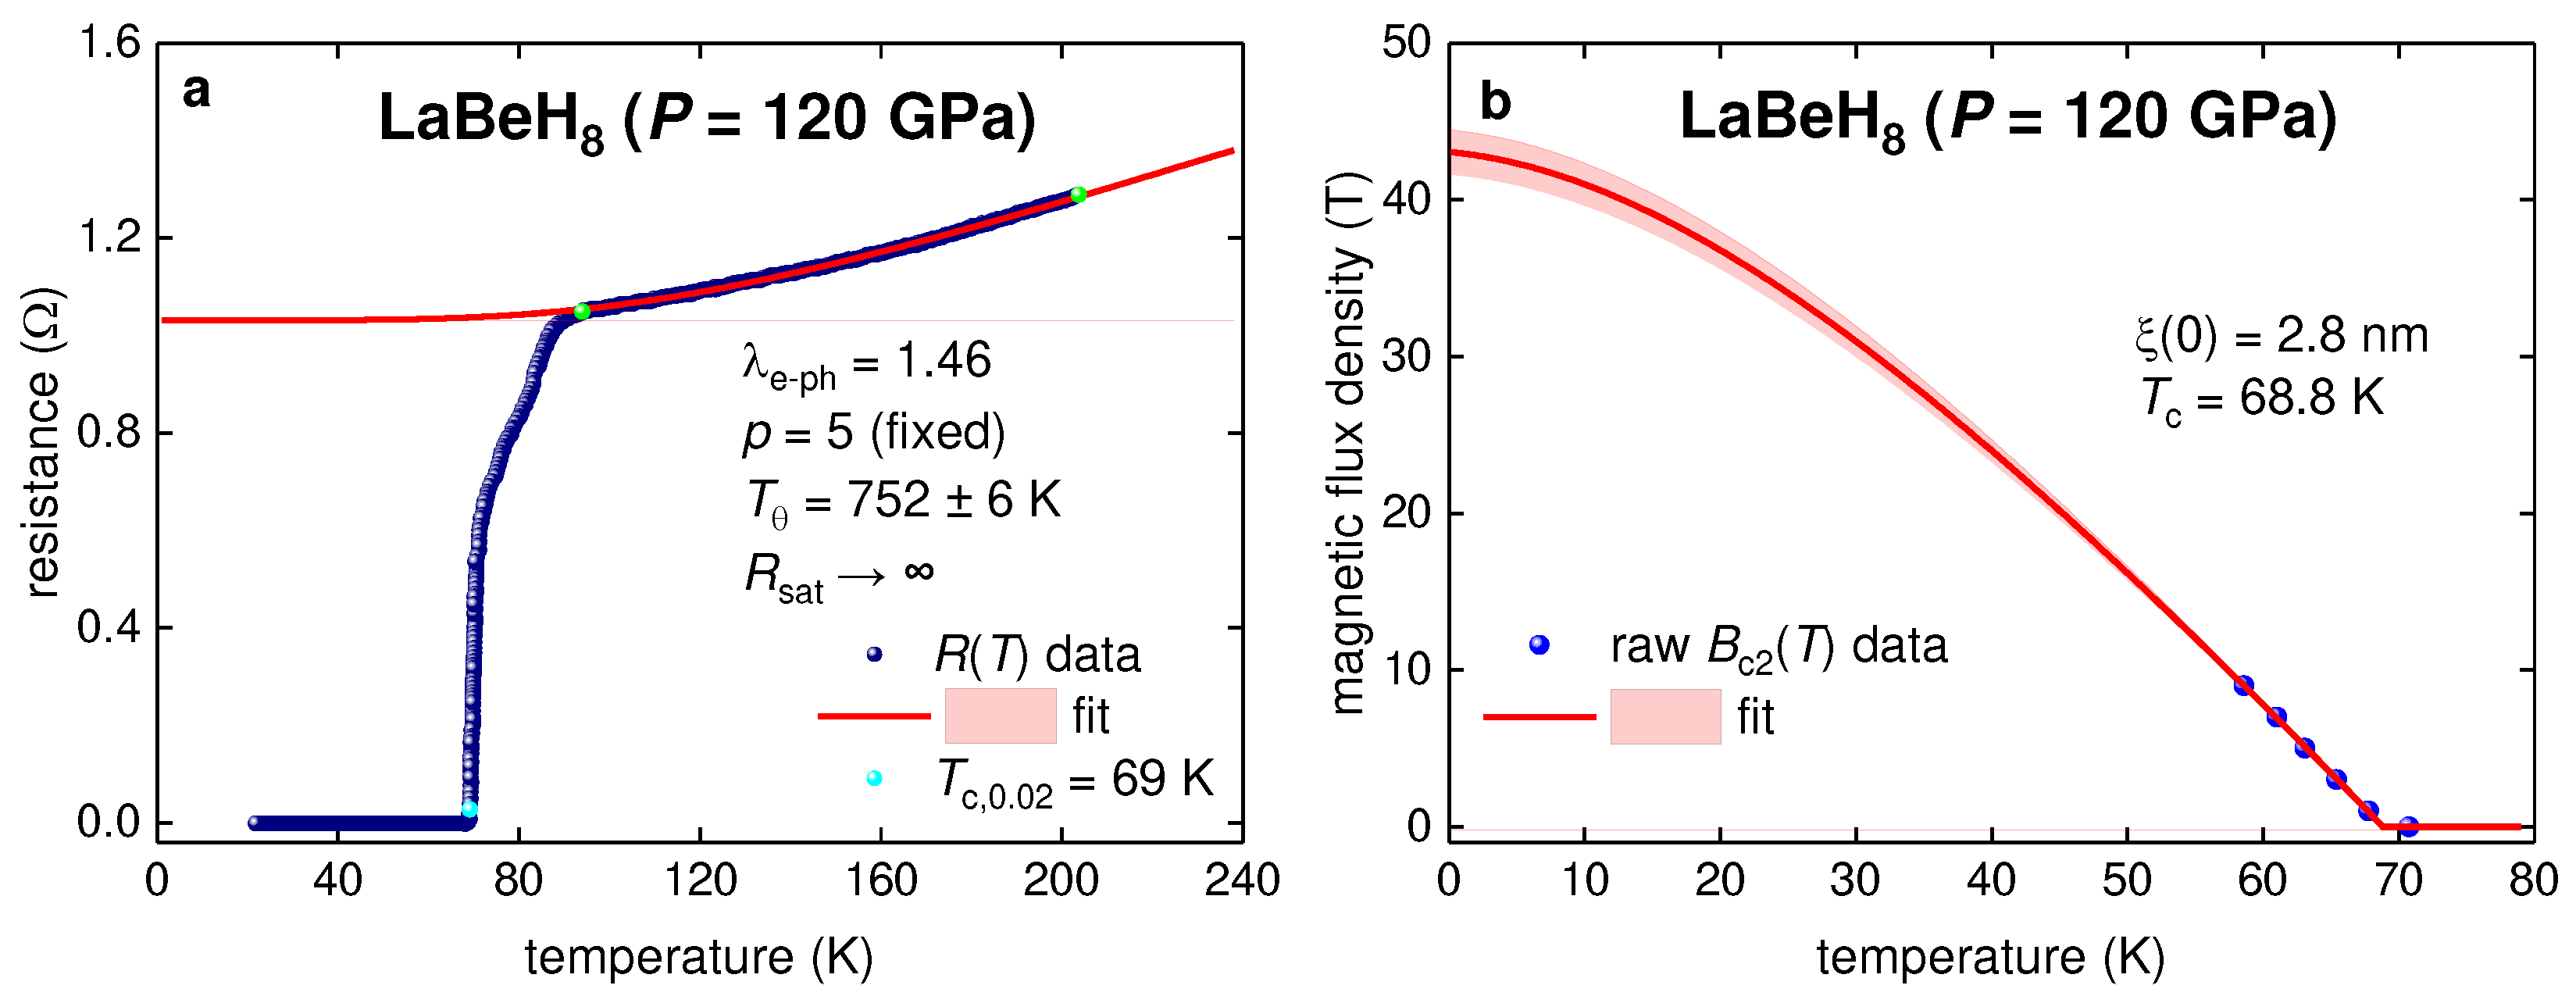
Figure 10.
Analysis of experimental datasets for black phosphorus compressed at P = 15 GPa reported by (a) Shirotani et al [101] and by (b) Li et al [99]. Green balls indicate the bounds for which data were used for the fit to Eq. 3. Deduced parameters are: (a) , , , fit quality is 0.9983; (b) (a) , , , fit quality is 0.9998. 95% confidence bands are shown by pink shadow areas in both panels.
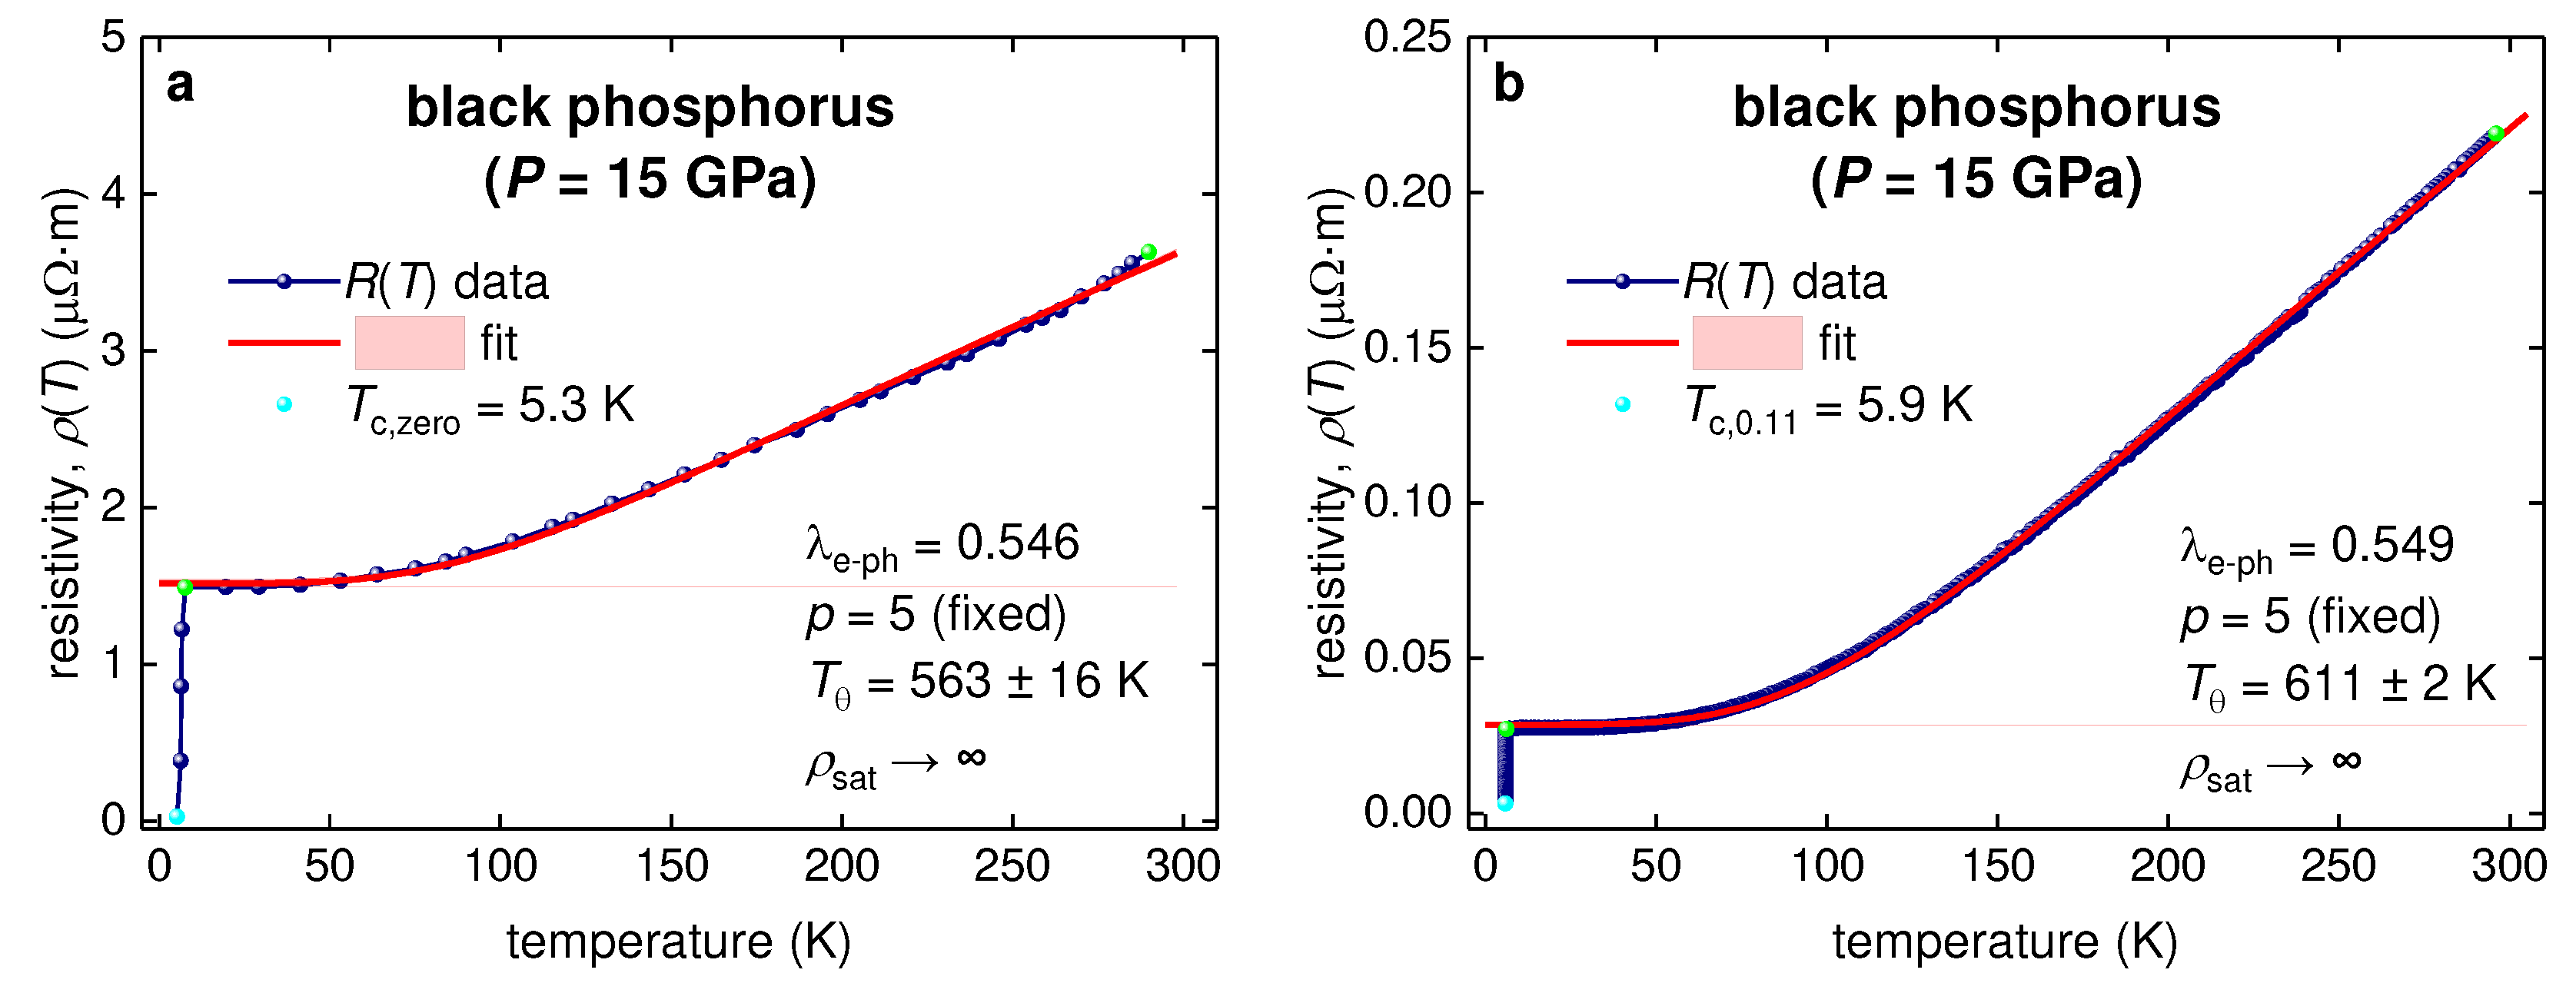
Figure 11.
Analysis of experimental datasets for black phosphorus compressed at (a) P = 15 GPa reported by Li et al [99], and (b) P = 15.9 GPa reported by Guo et al [100]. Deduced parameters are: (a) , , fit quality is 0.9965; (b) (a) , , fit quality is 0.9981. 95% confidence bands are shown by pink shadow areas in both panels.
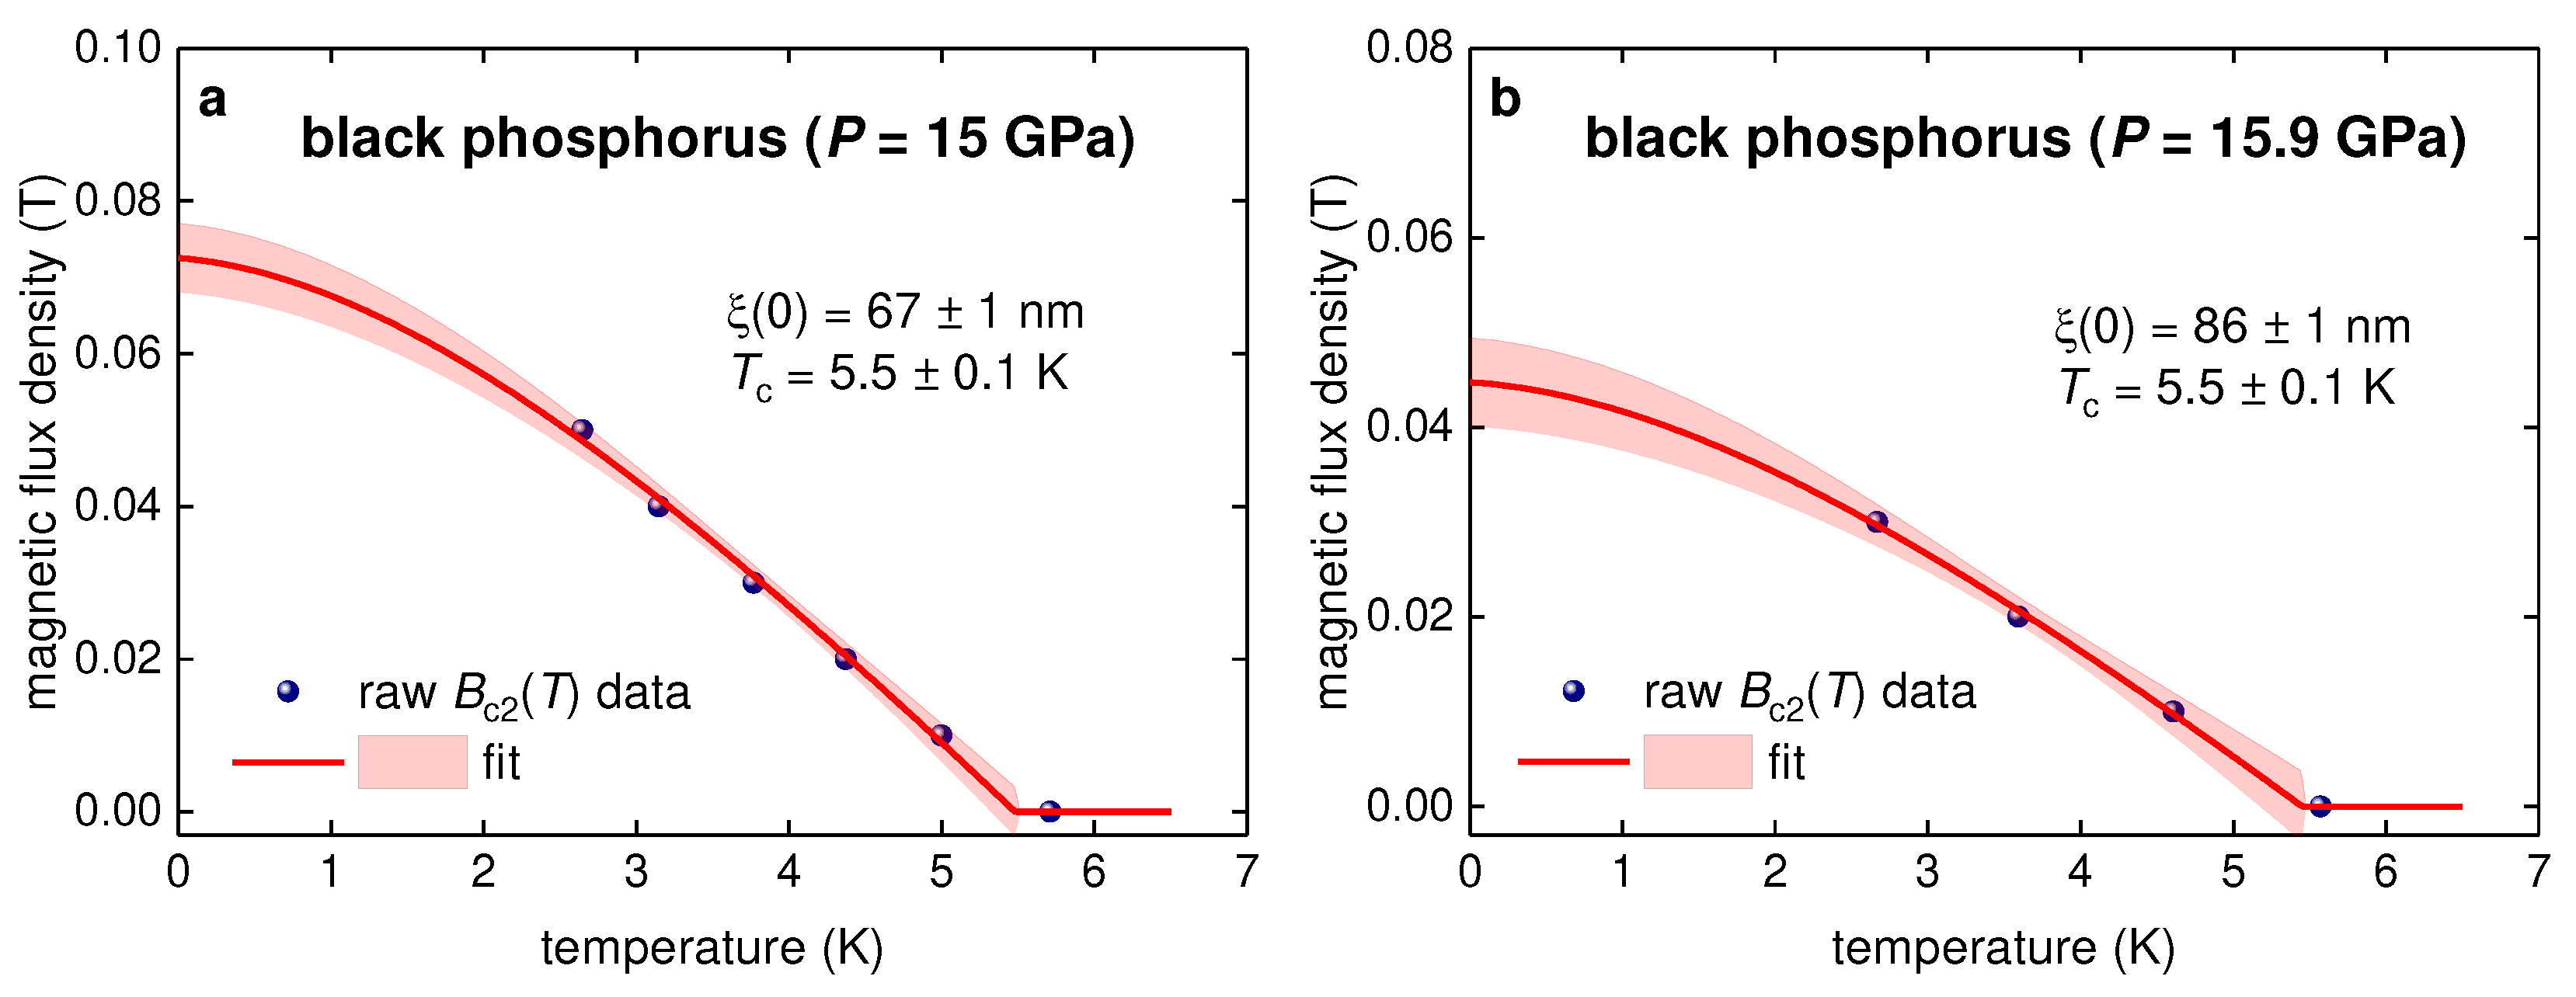
Figure 12.
Analysis of experimental data for violet phosphorus compressed at (a) and (b) . Raw data reported Wu et al [53]. (a) Temperature dependent resistance data, R(T), and data fit to Eq. 3. Green balls indicate the bounds for which R(T) data was used for the fit to Eq. 3. Deduced , , , fit quality is 0.9991. (b) The upper critical field data, Bc2(T), and data fit to Eq. 13. Definition Bc2(T) criterion of was used. Deduced parameters are: , , , . Fit quality is 0.9977. 95% confidence bands are shown by pink shadow areas in both panels.

Disclaimer/Publisher’s Note: The statements, opinions and data contained in all publications are solely those of the individual author(s) and contributor(s) and not of MDPI and/or the editor(s). MDPI and/or the editor(s) disclaim responsibility for any injury to people or property resulting from any ideas, methods, instructions or products referred to in the content. |
© 2023 by the authors. Licensee MDPI, Basel, Switzerland. This article is an open access article distributed under the terms and conditions of the Creative Commons Attribution (CC BY) license (http://creativecommons.org/licenses/by/4.0/).
Copyright: This open access article is published under a Creative Commons CC BY 4.0 license, which permit the free download, distribution, and reuse, provided that the author and preprint are cited in any reuse.


