Submitted:
13 July 2023
Posted:
14 July 2023
You are already at the latest version
Abstract
The volatile fatty acids (VFAs) productions, as well as particulate organics decomposition, soluble chemical oxygen demand (SCOD) yield, and the VFAs production pathways, of mesophilic and thermophilic anaerobic fermentation were investigated. Batch experiments showed that the decomposition rate of volatile suspended solids (VSS), particulate carbohydrate (P-C) and particulate protein (P-P) followed the first-order kinetic model at different temperature. However, the intermediates, accumulated in the process of protein or carbohydrate digestion had a more significant inhibitory effect on the production of VFAs during the mesophilic anaerobic acidification process. Thermophilic fermentation led to more accumulation of VFAs compared to mesophilic fermentation. Then 13C stable isotope labeling experiment demonstrated that, acetic (HAc), propionic (HPr) and butyric (HBu) could be produced from carbohydrate and protein digestion, but valeric (HVa) was only generated from the degradation of protein. Finally, the possible pathway of HVa synthesis was proposed.
Keywords:
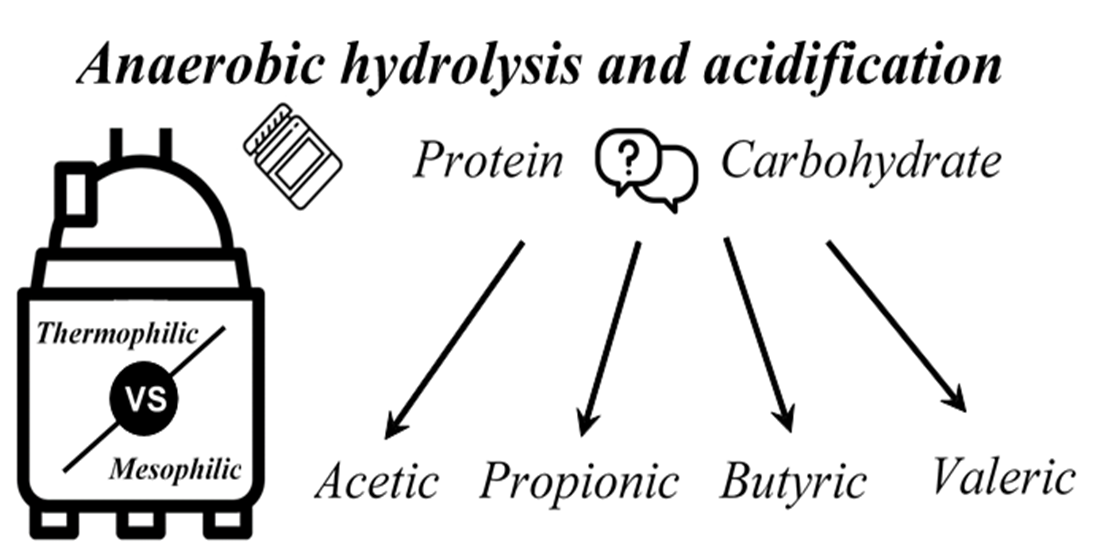
Anaerobic hydrolysis and acidification
; mesophilic
; thermophilic
; waste activated sludge
; volatile fatty acids
1. Introduction
In recent decades, economic growth, urbanization and climate change require the development and implementation of more sustainable strategies to maximize resource recovery from waste (Fernández-Domínguez et al., 2020). Anaerobic fermentation for volatile fatty acid (VFA) production is one of the efficient method for resource utilization of waste activated sludge (WAS) (Yuan et al., 2019). Short-chain fatty acids (SCFAs) production by anaerobic fermentation of waste activated sludge has attracted growing attention in wastewater treatment plants (WWTPs) since SCFAs can be widely used in bioenergy, bioplastics and biological removal of nutrient from wastewater (Wang et al., 2017, Liu et al., 2019, Xu et al., 2019, Adeleye et al., 2020, Wang et al., 2022). In order to achieve a great VFAs yield, the adjust and control of fermentation temperature is a simple and practical strategy since temperature can exert tremendous influences on fermentation products (Fernández-Domínguez et al., 2020). Conventional mesophilic conditions (30 - 40℃) have long been adopted for anaerobic digestion with a good operational performance, but the accumulation of VFAs is limited due to the slow hydrolysis rate of large organic molecules associated with microbial cells (Eskicioglu et al., 2006). In contrast, a higher fermentation temperature (i.e., thermophilic regimes, 50 - 60℃) is more favorable because it can result in higher metabolic activities and substrate conversion rates (Cho et al., 2015). Several successful cases of sludge thermophilic treatment in full-scale digesters approved the stability of the thermophilic operation (Nielsen & Petersen, 2000, Ahring et al., 2002). However, few researchers are concerned about VFAs yield and composition during sludge thermophilic fermentation, particularly WAS treatment (Şentürk et al., 2010, Xiong et al., 2012) have also been adopted for anaerobic digestion (Tian et al., 2015, Zhang et al., 2015) as thermophilic process derives from higher metabolic activities and substrate conversion rates than mesophilic.
The valeric (HVa) was beneficial to produce a polymer enriched in ployhydroxyvalerate (PHV) (Lemos et al., 2006) which improved more elastic and flexible and raise the price of polyhydroxyalkanoates (PHAs) (Kulkarni et al., 2010, Kulkarni et al., 2011, Tamis et al., 2014). Although HVa was found in several researches for anaerobic acidification and PHA synthesis (Wang et al., 2013, Zheng et al., 2013, Jie et al., 2014), no one proposed a possible pathway for HVa synthesis in the anaerobic acidification process. In this study, the sludge produced by the sewage treatment plant was used as the raw material, and the key parameters such as particle size, particle organic matter degradation, SCOD, and VFAs were analyzed to evaluate the hydrolysis and acidification effect of mesophilic and high-temperature anaerobic digestion. Further analysis of the source of VFA during carbohydrate and protein degradation. Finally, a possible pathway of HVA synthesis was proposed.
2. Materials and Methods
2.1. Source of Waste Activated Sludge
The waste active sludge (Sludge A) used for anaerobic hydrolysis and acidification analysis was obtained from a drum thickener of Xiaohongmen municipal wastewater treatment plant in Beijing, China. This plant using typical anaerobic–anoxic–oxic (AAO) treatment process, with treatment capacity of 600,000 m3/day. The waste active sludge (Sludge B) used for stable isotopic labeling test was taken from a sludge thickening tank of the Ashbridges Bay treatment plant in Toronto, Canada. This plant have a treatment capacity of 576,000 m3/day. All collected samples were transported to laboratory within 2 h after sampling and stored at 4℃.
The characteristics of WAS were listed in Table 1. The ratio of VSS in TSS is more than 67.71%. This indicated that sludge A and B contained mainly activated biomass or organic matter. Furthermore, particulate protein (P-P), particulate carbohydrate (P-C) and particulate lipid (P-L) are the three predominant types of organic compounds in the two types of WAS, and they account for above 80% of TCOD. Obviously, P-P was the top organic compound in WAS. But the concentration of P-L and P-C were slightly different. It changes considerably, due to seasonal variations and human habits between two countries.
2.2. Anaerobic Hydrolysis and Acidification Batch Experiment
The pretreatment was performed in six identical flasks, each was fed with 1500 mL WAS (Sludge A), and the pH was not controlled. The flasks capped with rubber stoppers were placed in two rotary shakers at 170 rpm. The operation conditions for each of the digestion systems are summarized in Table S1. The samples in all flasks were assayed every certain interval. During operation process, flasks maintained anoxic condition and experimental domestication adopted natural selection. All tests were performed in triplicate.
2.3. Kinetics Analysis of Mixed Liquid Volatile Suspended Solids (MLVSS) Disintegration
As reported before,hydrolysis of organic polymers is often described by a first-order kinetic model [Eq. (1)] as the enzymatic activity is not directly coupled to the bacterial growth (Eastman & Ferguson, 1981, Sosnowski et al., 2008, Sosnowski et al., 2008).
where XX was the concentration of X type particulate organics (g/L or mg/L), kX was the hydrolysis constant of X type organics (h-1) and t was time (h).
After mergering polynomial, Eq. 1 can be shown as:
2.4. Stable Isotopic Labeling Test
Stable isotopic labeling (SIL) test was prepared with 72 mL with different feed and 8 mL inoculum (Hydrolyzed Sludge B) in a 160 mL glass serum bottles, as shown in Table S2. The inoculated sludge is the mixed sludge obtained after 1.5 L of thickened sludge was incubated at 50 °C for 2 d. The feed included glucose, bovine serum albumin (BSA) and vegetable oil (VO) to simulate the elements of sludge and control the same total COD (TCOD) of feed for all SIL tests. TCOD was about 2.1g for 72 ml feed volume. D-Glucose-13C6 was the stable isotopic chemicals. All serum bottles were incubated at 50℃ for 5 days, respectively in a rotary shaker at 170 rpm without pH control. Samples were taken at predetermined time for the analysis of VFAs and 13C. All tests were performed twice.
2.5. Analytical Methods
2.5.1. Excitation-Emission Matrix (EEM) Fluorescence Spectroscopy
All EEM spectra were measured on luminescence spectrometry (F-7000, Hitachi Co., Japan). The EEM spectra were recorded at 5 nm intervals for excitation spectra between 220 and 600 nm and emission spectra between 230 and 650 nm at a scanning speed of 1200nm/min. The spectrum of distilled water was recorded as the blank. The supernatant obtained after centrifuging the WAS at 4℃ and 10,000 rpm for 10 min. The centrifuged supernatant could be used for EEM analysis after filtrating through a 0.22 mm-pore-size glass fibre filter. The software Origin Pro 8.5 (Origin Lab Inc., USA) was employed for handling EEM data.
EEM spectra are illustrated as the elliptical shape of contours. The X-axis represents the emission spectra from 250 to 550 nm, and the Y-axis is the excitation wavelength from 250 to 450 nm.
2.5.2. Determination of 13C Stable Isotopic Label
The negative ions of 13C-VFAs stable isotopic label were determinated by mass selective detection (MSD, Thermo Scientific Q Exactivated, USA), such as CH3COO- and so on. The WAS before and after the digestion were centrifuged at 4°C and 10,000 rpm for 10 minutes to obtain the supernatants, which were filtered with the glass fiber filter (0.22 μm) and stored at 4°C before testing.
2.5.3. Other Items’ Detected Methods
The measurement of pH, soluble COD, NH4-N, TN, OP, TP, TSS, VSS and VFAs were the same as described in our previous work (Xiong et al., 2012). Soluble carbohydrate (S-C) was measured by the phenol-sulfuric method with glucose as standard (Herbert et al., 1971). Soluble protein (S-P) and humic acids (HA) were determined by the Modified Lowry method (Peterson, 1979, Frolund et al., 1995) with BSA (Prod # 23209, Thermo) and humic acid (53680 MSDS, Sigma-Aldrich) as standard.
Total carbohydrate (T-C) was according to standard of GB/T 15672-2009. Total protein (T-P) was according to standard of ISO1871:2009. Total lipid (T-L) was extracted by the Bligh-Dyer method from the acidified sample, and was then measured gravimetrically after the solvent was evaporated at 80℃ (Bligh & Dyer, 1959).
Particle size analysis was carried out using the LS I3 320 (stirrer speed=350; use pump =50%; ultrasonic=off) at Beckman Instruments Ltd., USA. For analysis, each sample was not diluted. The results were then averaged to produce the particle size distribution, and recorded as the particle volume percent between 0.45 and 2000 μm.
2.6. Calculation
The COD conversion factors of VSS, proteins, carbohydrates, lipids, and VFAs, used in this study, were performed according to Grady’s description (Grady et al., 1999). All formulars were shown in the Supplementary Information (Table S3, Page 5).
3. Results and discussion
3.1. Effects of Mesophilic and Thermophilic Anaerobic Digestion on Sludge Particle Size
Sludge particles are approximately spherical, so average particle size can often be used as an indicator to characterize the physical properties of WAS (Brittain, 2001). Figure 1 shows the change of particle size distribution of WAS with time under mesophilic and thermophilic hydrolysis conditions. The particle size of WAS all decreased with time, and the mean particle sizes were 234 μm (35℃) and 121 μm (50℃) at 48 h, respectively. High temperature had significant decreased the particle sizes of the sludge floc. It can be inferred that the rate of VSS destruction at 50℃ may be better than at 35℃.
3.2. Kinetics Analysis of MLVSS, P-C and P-P Hydrolysis
Particulate protein (P-P), particulate carbohydrates (P-C) and particulate lipid (P-L) are important particulate organic substances in waste activated sludge. During the mesophilic and thermophilic anaerobic hydrolysis, the main decomposed organics were P-P and P-C, while the degradation rate of P-L was less than 5%,as shown in Table 2. The reason for this phenomenon is that P-L is hardly disintegrated during hydrolysis and acidification. Some researchers have come up with similar results in their study (Eastman & Ferguson, 1981, Miron et al., 2000, Martínez et al., 2012). Therefore, P-L was not considered in the subsequent analysis process. The decomposition rates of MLVSS, P-C and P-P in thermophilic digestion were all higher than those in mesophilic digestion, indicating that higher temperature helps to improve the hydrolysis efficiency of WAS.
As reported by Siegrist et al., the hydrolysis of particulate organic matter and dead biomass, converting carbohydrates, proteins, and lipids to sugars, amino acids, and long-chain fatty acids, follows first-order reaction kinetics (Siegrist et al., 2002). According to the equation. 2, XMLVSS0=21365.8 mgCOD/L, XP-C0=2369.56 mgCOD/L and XP-P0=12850.06 mgCOD/L, and the degradation equations of MLVSS, P-C and P-P are obtained, see Table 3. The kx value were found during thermophilic hydrolysis process in the following order: kP-C > kMLVSS > kp-p. This means that P-C is more easily degraded by microorganisms than P-P. The composition of sludge are complicated, including P-P, P-C, dead microbes, etc. Then kVSS value must be restricted by above mentioned organics and should locate in the middle range. The hydrolysis constant of MLVSS (kMLVSS) will be affected by these organic substances, so kMLVSS lies between kP-C and kp-p.
3.3. Effects of Mesophilic and Thermophilic Anaerobic Digestion on Particulate Organics Degradation
Particulate organics mainly composed of P-P, P-C, P-L and other unknown particulate organics. Through the analysis of the degradation ratio of various types of particulate organic matter, the degradation types of the mesophilic and thermophilic digestion processes can be revealed. The COD content of MLVSS, P-P and P-C was estimated by mass balance analysis, and the result was shown in Figure 2. Unknown particulate organics were main degradable matters in mesophilic digestion process. After 48 h of digestion, the degradation ratios of unknown particulate organic matter, P-P and P-C accounted for 48.14%, 40.67% and 11.19% of MLVSS, respectively. Mesophilic microorganisms can utilize unknown particulate organics as substrates,probably because mesophilic microorganisms are more diversity than thermophilic microorganisms (Kim et al., 2002). These mesophilic anaerobic microorganisms can use unknown particulate organic matter as a substrate for catabolism and microbial anabolism.
In the thermophilic digestion process, in the initial stage of the digestion (0-12 h), unknown particulate organics and P-C were the main degraded substances. However, in the late stage of the digestion (24-48 h), P-P was main degradable substance. After 48 h of digestion, the degradation ratios of unknown particulate organic matter, P-P and P-C accounted for 22.99%, 62.24% and 14.76% of MLVSS, respectively. It can be seen from Figure 2A,C, the degradation of P-P mainly occurred after 36h under the condition of mesophilic digestion, while that of P-P occurred after 12h under the condition of thermophilic digestion, which means that the activity of protein-degrading bacteria at high temperature is significantly better than that at mesophilic temperature Song et al. (2004).
3.4. Effects of Mesophilic and Thermophilic Anaerobic Digestion on Hydrolysis and Acidification
Hydrolysis and acidification are two steps in anaerobic digestion. Hydrolysis means both the solubilization of insoluble particulate matter and the biological decomposition of organic polymers to monomers or dimers, which can pass the cell membrane and enter into aqueous phase. Then SCOD will increase in hydrolysis process. During the acidification step, the dissolved organic matter is biodegraded mainly to VFAs and alcohols by a heterogeneous microbial population. The concentration of SCOD will keep balance as organic macromolecules degrade into smaller organic molecules in acidification step.
As shown in Figure 3, the SCOD value of mesophilic anaerobic digestion continued to increase from 0 h to 48 h. Then the reactor had been in hydrolysis step. From 0 h to 24 h, the SCOD value of thermophilic anaerobic digestion increased rapidly. After that, the SCOD value kept stably. Then thermophilic digestion had an obvious cut-off point: hydrolysis (0-24 h) and acidification (24-48 h). Thermophilic digestion was faster into acidification stage than mesophilic, as in Table 3, the hydrolysis constant values for thermophilic digestion were significantly higher than for mesophilic digestion.
SCOD mainly includes VFAs, humic acid (HA), soluble carbohydrate (S-C), soluble protein (S-P), and uncertain organics. The compositional changes of SCOD during hydrolysis and acidification are shown in Figure S2 (Supplementary Information, Page 6). VFAs, HA and uncertain organics were main soluble organic ingredients of mesophilic and thermophilic digestion. HA and uncertain organics were degraded after 12 h of thermophilic digestion with the raise of VFAs concentration. However, HA and uncertain organics had been accumulated in mesophilic digestion as the activity of microbes in mesophilic was lower than thermophilic digestion. This phenomenon suggests that the degradation of uncertain organic matter contributes to the acid production process of anaerobic systems.
Qualitative analysis of uncertain organics was detected by EEM fluorescence spectroscopy. As shown in Figure 4A,B, two peaks were readily identified from EEM fluorescence spectra of digestion supernatant. Peak A was identified at excitation/emission wavelengths (Ex/Em) of 220/350nm, while peak B was detected at Ex/Em of 275/350nm. These peaks had been inferred as protein-like peaks, in which the fluorescence is associated with the aromatic amino acid and tryptophan (Sheng & Yu, 2006, Wang et al., 2009). Therefore, uncertain organics might be intermediates of the decomposition of protein or carbohydrate. The VFAs yield of mesophilic digestion was less than thermophilic digestion because of the inhibitory effect of these intermediates.
3.5. Effects of Mesophilic and Thermophilic Anaerobic Digestion on VFAs Yield
The production of six VFAs, acetic (HAc), propionic (HPr), iso-butyric (i-HBu), n-butyric (n-HBu), iso-valeric (i-HVa), and n-valeric (n-HVa), were investigated. As seen in Figure 5A–D, HAc was the predominant product at any time of digestion at mesophilic and thermophilic condition. During the mesophilic digestion, the content of HAc increased with digestion time and the maximum amount of HAc was 596.21 mgCOD/L at 48 hour. However, the concentration of HAc can reach a maximum of 1072.04 mgCOD/L within 24 h during thermophilic digestion. HAc concentration decreased slightly after 24 h and its concentration was 913.75 mgCOD/L at 48 h.
In mesophilic digestion, HPr was the second predominant VFAs before 36 h. However, after 36 h, i-HVa acid became the second major VFA and reached a concentration of 216.55 mgCOD/L at 48 h. Compared to mesophilic digestion, i-HVa acid became the second predominant VFAs within 18 h, reaching a maximum content of 745.75 mgCOD/L at 48 h in the thermophilic digestion.
According to the degradation of P-C and P-P in Figure 5E,F, HAc and HPr increased with a large number of P-C consumption and a small amount of P-P degradation. It seemed that HAc and HPr mainly derived from P-C degradation (Zehnder, 1988). When a large amount of P-P was degraded during thermophilic digestion, the concentration of i-HBu and i-HVa also increased rapidly, while the concentration of HAc also increased. This is because the conversion of amino acids to valeric, butyric, and propionic acids, also produces HAc (Ramsay & Pullammanappallil, 2001). So the conclusion is the lower molecular weight VFAs, such as HAc and HPr, are largely relevant to the digestion of P-C and P-P. But the higher molecular weight VFAs are only dependent on the degradation of P-P, just like i-HBu, n-HBu, i-HVa and n-HVa.
3.6. Concentration Changes of VFAs in 13C Stable Isotope Labeling Experiment
The concentrations of six VFAs (HAc, HPr, i-HBu, n-HBu, i-HVa, n-HVa) produced by using sludge B (Series 3#) were also analyzed, as shown in Figure S3 (Supplementary Information, Page 7). The concentration of i-HVa in VFAs was higher when P-P was the main particulate organic matter in the thickened sludge. To further verify this result, stable isotope labeling experiment were designed to reveal the proportions of different kinds of VFAs derived from P-P or P-C.
In the series 4#, the substrate used in anaerobic fermentation was glucose, so the fermentation product VFAs only contained three organic acids (n-HBu, HAc and HPr), as shown inFigure 6A,B. Three kinds of VFAs accounted for approximately 69%, 26% and 5% of total VFAs within 2 to 5 days of digestion. This result well matched with the butyric acid type digestion (BATF) without pH control when the substrate was only or mainly glucose during anaerobic acidification (Zoetemeyer et al., 1982, Cohen et al., 1984).
However, five types of VFAs can be produced in the series 5#, with the following order: n-HBu, HAc, i-HVa, HPr and i-HBu, as shown in Figure 6C,D. A significant lag in iso-valeric acid production, with a yield of only 16.76%. The reason for this difference may have been caused by obvious change from 12C to 13C in the substrate. The rate of microbe metabolism would be slightly varied when 13C entered into the metabolic pathway of VFAs yield because of the atomic radius, electronic force and so on.
3.7. The Source of VFAs
The Thermo Q Exactivated MSD’s library has not the isomeride of butyric and valeric acids. Therefore, it should be defined that HBu contained iso-HBu and n-HBu. Similarly, HVa included iso-HVa and n-HBu.According to the different amounts of 12C and 13C atoms, HAc, HPr, HBu and HVa have lots of existing forms which were shown in Table S4.
In the stable isotopic trail, three kinds of VFAs would be simultaneously produced from carbohydrate and protein digestion, such as HAc, HPr and HBu, as shown in Figure 7A–F. Most of HAc and HBu were gained from the degradation of carbohydrate. But HPr was mainly acquired from the decomposition of protein (Figure 7C,D). Especially HVa was only generated from the degradation of protein, not from carbohydrate digestion, shown in Figure 7G,H.
A simplified diagram of the proportion of carbohydrate and protein anaerobic production of VFAs was drawn, as shown in Figure S4. It was found that 77% of HAc and 86% of HBu were produced from carbohydrate degraded, low yields of HAc and HBu are produced by protein. And 85% of HPr and 99% of HVa were gained from protein, afterwards the remains of HPr and HVa were obtained from carbohydrate.
In the production of PHAs, HAc and HBu mainly synthesize PHB, and HPr and Hva mainly synthesize PHV (Lemos et al., 2006). It is well known that high-purity PHB tends to make PHAs plastic hard and brittle, but mixing a small amount of PHV can make PHAs plastic more elastic. Therefore, the ratio of carbohydrates and proteins in the fermentation matrix can be adjusted according to the needs for the production of PHAs.
3.8. The Synthesis Pathway of HVa
The metabolic pathway of carbohydrate and protein during anaerobic digestion proposed by Zehnder shown in Figure S5 (Zehnder, 1988). However, this metabolic pathway missed the key step in the formation of HVa. Based on the lipid metabolism (Hames & Hooper, 2010), Propionyl acyl carrier protein (Propionyl-ACP) which had three carbon atoms was regarded as the original compound for fatty acids with odd carbon atoms, not Malonyl acyl carrier protein (Malonyl-ACP) which add two carbon atoms into the original compound each time. Therefore, this study proposed a possible pathway of HVa yield, as shown in Figure 8. This pathway started from acetyl coenzyme A (Acety-CoA) and proionyl coenzyme A (Proionyl-CoA). Then HVa was gained by the process of condensation, reduction, dehydration and reduction.
4. Conclusions
Hydrolysis of VSS, P-C and P-P obeyed first-order kinetic model, and the kx value was found in the following order: kP-C > kVSS > kp-p during thermophilic anaerobic process. Thermophilic fermentation resulted in greater VFA accumulation and higher percentages of acetic acid and iso-valeric acid compared to mesophilic fermentation due to intermediates accumulated during protein or carbohydrate breakdown. Then 13C stable isotope labeling experiment demonstrated that, HAc, HPr and HBu were produced from carbohydrate and protein digestion, but HVa was only generated from the degradation of protein. Finally, the possible pathway of HVa synthesis was proposed.
Author Contributions
Conceptualization, Hanchang Shi and Lanhua Liu; methodology, Huilei Xiong and Lanhua Liu; software, Baodong Song; investigation, Huilei Xiong and Baodong Song; resources, Hanchang Shi; writing—original draft preparation, Huilei Xiong; writing—review and editing, Lanhua Liu; funding acquisition, Baodong Song. All authors have read and agreed to the published version of the manuscript.
Acknowledgments
This research was supported by the National key research and development program intergovernmental international technology innovation cooperation (2019YFE0109000), the National Nature Science Foundation (22106144) and the special fund of State Key Joint Laboratory of Environment Simulation and Pollution Control (21K06ESPCT).
References
- Adeleye, A.T.; Odoh, C.K.; Enudi, O.C.; Banjoko, O.O.; Osiboye, O.O.; Odediran, E.T.; Louis, H. Sustainable synthesis and applications of polyhydroxyalkanoates (PHAs) from biomass. Process Biochem. 2020, 96, 174–193. [Google Scholar] [CrossRef]
- Ahring, B.K.; Mladenovska, Z.; Iranpour, R.; Westermann, P. State of the art and future perspectives of thermophilic anaerobic digestion. Water Sci. Technol. 2002, 45, 293–298. [Google Scholar] [CrossRef] [PubMed]
- Bligh, E.G.; Dyer, W.J. A rapid method of total lipid extraction and purification. Can. J. Biochem. Physiol. 1959, 37, 911–917. [Google Scholar] [CrossRef] [PubMed]
- Brittain, H.G. What is the correct method to use for particle-size determination? Pharm. Technol. 2001, 25, 96–98. [Google Scholar]
- Cho, H.U.; Kim, Y.M.; Choi, Y.N.; Kim, H.G.; Park, J.M. Influence of temperature on volatile fatty acid production and microbial community structure during anaerobic fermentation of microalgae. Bioresour. Technol. 2015, 191, 475–480. [Google Scholar] [CrossRef]
- Cohen, A.; Van Gemert, J.M.; Zoetemeyer, R.J.; Breure, A.M. Main characteristics and stoichiometric aspects of acidogenesis of soluble carbohydrate containing wastewater. Process Biochem. 1984, 19, 228–232. [Google Scholar]
- Eastman, J.A.; Ferguson, J.F. Solubilization of particulate organic carbon during the acid phase of anaerobic digestion. Journal (Water Pollution Control Federation) 1981, 352–366. [Google Scholar]
- Eskicioglu, C.; Kennedy, K.J.; Droste, R.L. Characterization of soluble organic matter of waste activated sludge before and after thermal pretreatment. Water Res. 2006, 40, 3725–3736. [Google Scholar] [CrossRef] [PubMed]
- Fernández-Domínguez, D.; Astals, S.; Peces, M.; Frison, N.; Bolzonella, D.; Mata-Alvarez, J.; Dosta, J. Volatile fatty acids production from biowaste at mechanical-biological treatment plants: Focusing on fermentation temperature. Bioresour. Technol. 2020, 314, 123729. [Google Scholar] [CrossRef]
- Frolund, B.; Griebe, T.; Nielsen, P.H. Enzymatic activity in the activated-sludge floc matrix. Appl Microbiol Biotechnol 1995, 43, 755–761. [Google Scholar] [CrossRef]
- Grady, C.; Daigger, G.; Lim, H. Effects of cycling characteristics. Biological Wastewater Treatment, 2nd ed; Marcel Dekker, Inc: New York, NY, USA, 1999. [Google Scholar]
- Hames, D.; Hooper, N. 2010 Instant Notes in Biochemistry, 3rd Edition ed; Taylor & Francis.
- Herbert, D.; Philipps, P.; Strange, R. Carbohydrate analysis. Methods Enzym. B 1971, 5, 265–277. [Google Scholar]
- Jie, W.; Peng, Y.; Ren, N.; Li, B. Volatile fatty acids (VFAs) accumulation and microbial community structure of excess sludge (ES) at different pHs. Bioresour. Technol. 2014, 152, 124–129. [Google Scholar] [CrossRef] [PubMed]
- Kim, M.; Ahn, Y.H.; Speece, R.E. Comparative process stability and efficiency of anaerobic digestion; mesophilic vs. thermophilic. Water Res. 2002, 36, 4369–4385. [Google Scholar] [CrossRef] [PubMed]
- Kulkarni, S.O.; Kanekar, P.P.; Nilegaonkar, S.S.; Sarnaik, S.S.; Jog, J.P. Production and characterization of a biodegradable poly (hydroxybutyrate-co-hydroxyvalerate) (PHB-co-PHV) copolymer by moderately haloalkalitolerant Halomonas campisalis MCM B-1027 isolated from Lonar Lake, India. Bioresour. Technol. 2010, 101, 9765–9771. [Google Scholar] [CrossRef] [PubMed]
- Kulkarni, S.O.; Kanekar, P.P.; Jog, J.P.; Patil, P.A.; Nilegaonkar, S.S.; Sarnaik, S.S.; Kshirsagar, P.R. Characterisation of copolymer, poly (hydroxybutyrate-co-hydroxyvalerate) (PHB-co-PHV) produced by Halomonas campisalis (MCM B-1027), its biodegradability and potential application. Bioresour. Technol. 2011, 102, 6625–6628. [Google Scholar] [CrossRef]
- Lemos, P.C.; Serafim, L.S.; Reis, M.A. Synthesis of polyhydroxyalkanoates from different short-chain fatty acids by mixed cultures submitted to aerobic dynamic feeding. J. Biotechnol. 2006, 122, 226–238. [Google Scholar] [CrossRef]
- Liu, X.; Xu, Q.; Wang, D.; Yang, Q.; Wu, Y.; Yang, J.; Liu, Y.; Wang, Q.; Ni, B.J.; Li, X. Enhanced short-chain fatty acids from waste activated sludge by heat–CaO2 advanced thermal hydrolysis pretreatment: parameter optimization, mechanisms, and implications. ACS Sustain. Chem. Eng. 2019, 7, 3544–3555. [Google Scholar] [CrossRef]
- Martínez, E.; Fierro, J.; Sánchez, M.; Gómez, X. Anaerobic co-digestion of FOG and sewage sludge: Study of the process by Fourier transform infrared spectroscopy. Int. Biodeterior. Biodegrad. 2012, 75, 1–6. [Google Scholar] [CrossRef]
- Miron, Y.; Zeeman, G.; Van Lier, J.B.; Lettinga, G. The role of sludge retention time in the hydrolysis and acidification of lipids, carbohydrates and proteins during digestion of primary sludge in CSTR systems. Water Res. 2000, 34, 1705–1713. [Google Scholar] [CrossRef]
- Nielsen, B.; Petersen, G. Thermophilic anaerobic digestion and pasteurisation. Practical experience from Danish wastewater treatment plants. Water Sci. Technol. 2000, 42, 65–72. [Google Scholar] [CrossRef]
- Peterson, G.L. Review of the Folin phenol protein quantitation method of Lowry, Rosebrough, Farr and Randall. Anal. Biochem. 1979, 100, 201–220. [Google Scholar] [CrossRef] [PubMed]
- Ramsay, I.R.; Pullammanappallil, P.C. Protein degradation during anaerobic wastewater treatment: derivation of stoichiometry. Biodegradation 2001, 12, 247–256. [Google Scholar] [CrossRef] [PubMed]
- Şentürk, E.; İnce, M.; Onkal Engin, G. Treatment efficiency and VFA composition of a thermophilic anaerobic contact reactor treating food industry wastewater. Journal of hazardous materials 2010, 176, 843–848. [Google Scholar] [CrossRef] [PubMed]
- Sheng, G.P.; Yu, H.Q. Characterization of extracellular polymeric substances of aerobic and anaerobic sludge using three-dimensional excitation and emission matrix fluorescence spectroscopy. Water Res. 2006, 40, 1233–1239. [Google Scholar] [CrossRef]
- Siegrist, H.; Vogt, D.; Garcia-Heras, J.L.; Gujer, W. Mathematical model for meso-and thermophilic anaerobic sewage sludge digestion. Environ. Sci. Technol. 2002, 36, 1113–1123. [Google Scholar] [CrossRef]
- Song, Y.C.; Kwon, S.J.; Woo, J.H. Mesophilic and thermophilic temperature co-phase anaerobic digestion compared with single-stage mesophilic- and thermophilic digestion of sewage sludge. Water Res. 2004, 38, 1653–1662. [Google Scholar] [CrossRef]
- Sosnowski, P.; Klepacz-Smolka, A.; Kaczorek, K.; Ledakowicz, S. Kinetic investigations of methane co-fermentation of sewage sludge and organic fraction of municipal solid wastes. Bioresour. Technol. 2008, 99, 5731–5737. [Google Scholar] [CrossRef]
- Tamis, J.; Lužkov, K.; Jiang, Y.; Loosdrecht, M.C.; Kleerebezem, R. Enrichment of Plasticicumulans acidivorans at pilot-scale for PHA production on industrial wastewater. J. Biotechnol. 2014, 192, 161–169. [Google Scholar] [CrossRef]
- Tian, Z.; Zhang, Y.; Li, Y.; Chi, Y.; Yang, M. Rapid establishment of thermophilic anaerobic microbial community during the one-step startup of thermophilic anaerobic digestion from a mesophilic digester. Water Res. 2015, 69, 9–19. [Google Scholar] [CrossRef]
- Wang, D.; Chen, Y.; Zheng, X.; Li, X.; Feng, L. Short-chain fatty acid production from different biological phosphorus removal sludges: the influences of PHA and Gram-staining bacteria. Environmental science & technology 2013, 47, 2688–2695. [Google Scholar]
- Wang, J.; Lou, Y.; Feng, K.; Zhou, H.; Liu, B.; Xie, G.; Xing, D. Enhancing the decomposition of extracellular polymeric substances and the recovery of short-chain fatty acids from waste activated sludge: Analysis of the performance and mechanism of co-treatment by free nitrous acid and calcium peroxide. J. Hazard. Mater. 2022, 423, 127022. [Google Scholar] [CrossRef]
- Wang, Y.; Wang, D.; Liu, Y.; Wang, Q.; Chen, F.; Yang, Q.; Li, X.; Zeng, G.; Li, H. Triclocarban enhances short-chain fatty acids production from anaerobic fermentation of waste activated sludge. Water Res. 2017, 127, 150–161. [Google Scholar] [CrossRef]
- Wang, Z.; Wu, Z.; Tang, S. Characterization of dissolved organic matter in a submerged membrane bioreactor by using three-dimensional excitation and emission matrix fluorescence spectroscopy. Water Res. 2009, 43, 1533–1540. [Google Scholar] [CrossRef]
- Xiong, H.L.; Chen, J.; Wang, H.; Shi, H.C. Influences of volatile solid concentration, temperature and solid retention time for the hydrolysis of waste activated sludge to recover volatile fatty acids. Bioresour. Technol. 2012, 119, 285–292. [Google Scholar] [CrossRef] [PubMed]
- Xu, Q.; Liu, X.; Wang, D.; Liu, Y.; Wang, Q.; Ni, B.J.; Li, X.; Yang, Q.; Li, H.B. Enhanced short-chain fatty acids production from waste activated sludge by sophorolipid: performance, mechanism, and implication. Bioresour. Technol. 2019, 284, 456–465. [Google Scholar] [CrossRef] [PubMed]
- Yuan, Y.; Hu, X.; Chen, H.; Zhou, Y.; Zhou, Y.; Wang, D. Advances in enhanced volatile fatty acid production from anaerobic fermentation of waste activated sludge. Sci. Total Environ. 2019, 694, 133741. [Google Scholar] [CrossRef]
- Zehnder, A.J. Biology of anaerobic microorganisms; John Wiley and Sons Inc, 1988. [Google Scholar]
- Zhang, T.; Mao, C.; Zhai, N.; Wang, X.; Yang, G. Influence of initial pH on thermophilic anaerobic co-digestion of swine manure and maize stalk. Waste Manag. 2015, 35, 119–126. [Google Scholar] [CrossRef] [PubMed]
- Zheng, X.; Su, Y.; Li, X.; Xiao, N.; Wang, D.; Chen, Y. Pyrosequencing reveals the key microorganisms involved in sludge alkaline fermentation for efficient short-chain fatty acids production. Environ. Sci. Technol. 2013, 47, 4262–4268. [Google Scholar] [CrossRef] [PubMed]
- Zoetemeyer, R.J.; Arnoldy, P.; Cohen, A.; Boelhouwer, C. Influence of temperature on the anaerobic acidification of glucose in a mixed culture forming part of a two-stage digestion process. Water Res. 1982, 16, 313–321. [Google Scholar] [CrossRef]
Figure 1.
Particle size distribution of WAS during hydrolysis. (A) mesophilic digestion and (B) thermophilic hydrolysis.
Figure 1.
Particle size distribution of WAS during hydrolysis. (A) mesophilic digestion and (B) thermophilic hydrolysis.
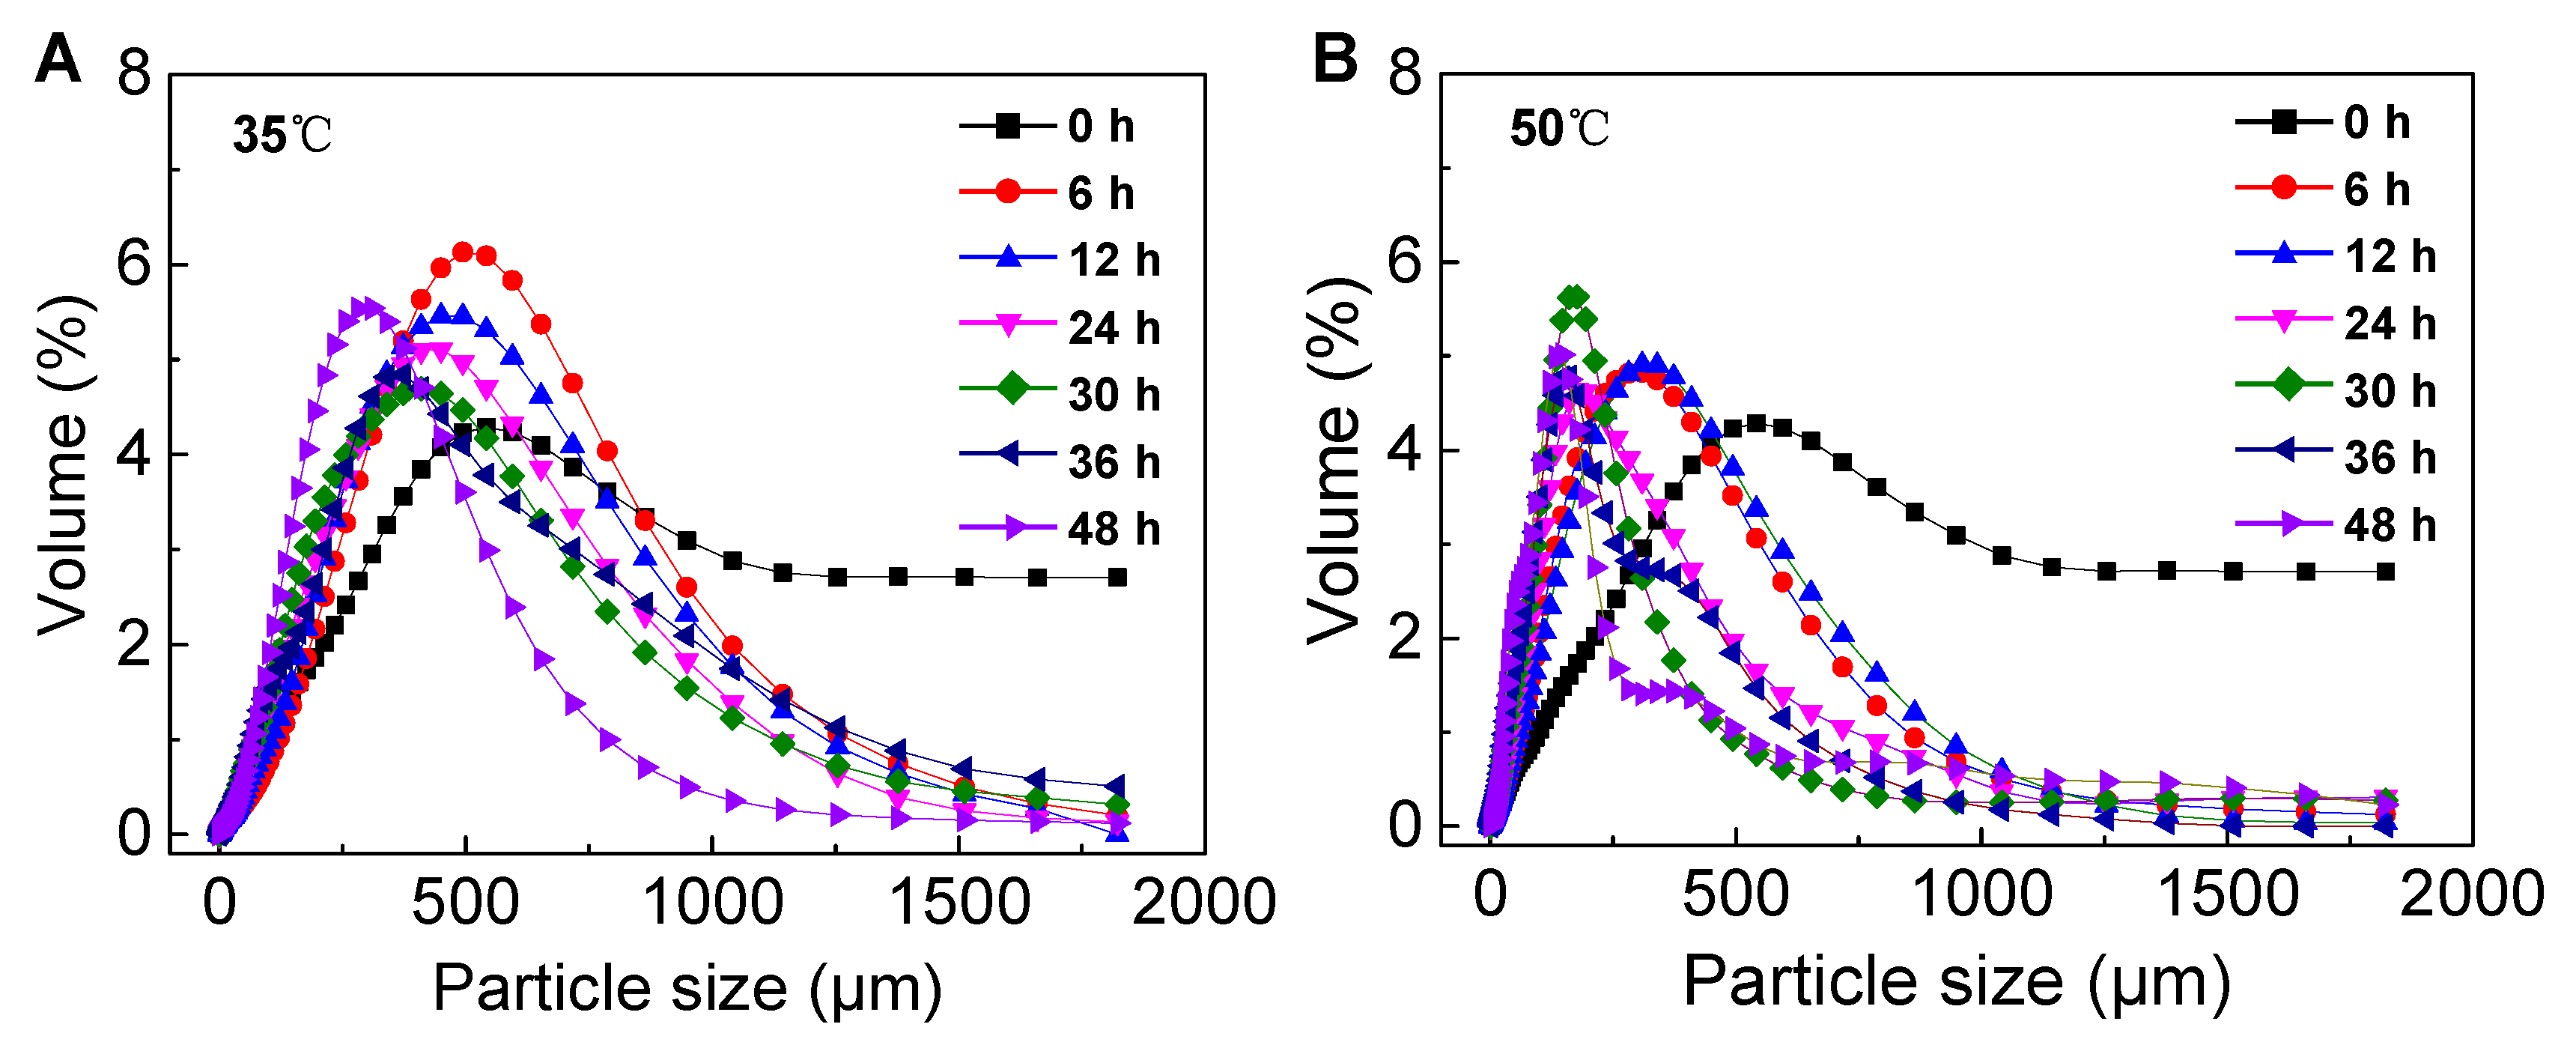
Figure 2.
Particulate organics decomposition balance analysis of the digestion system. (A) and (B) mesophilic digestion; (C) and (D) thermophilic digestion.
Figure 2.
Particulate organics decomposition balance analysis of the digestion system. (A) and (B) mesophilic digestion; (C) and (D) thermophilic digestion.
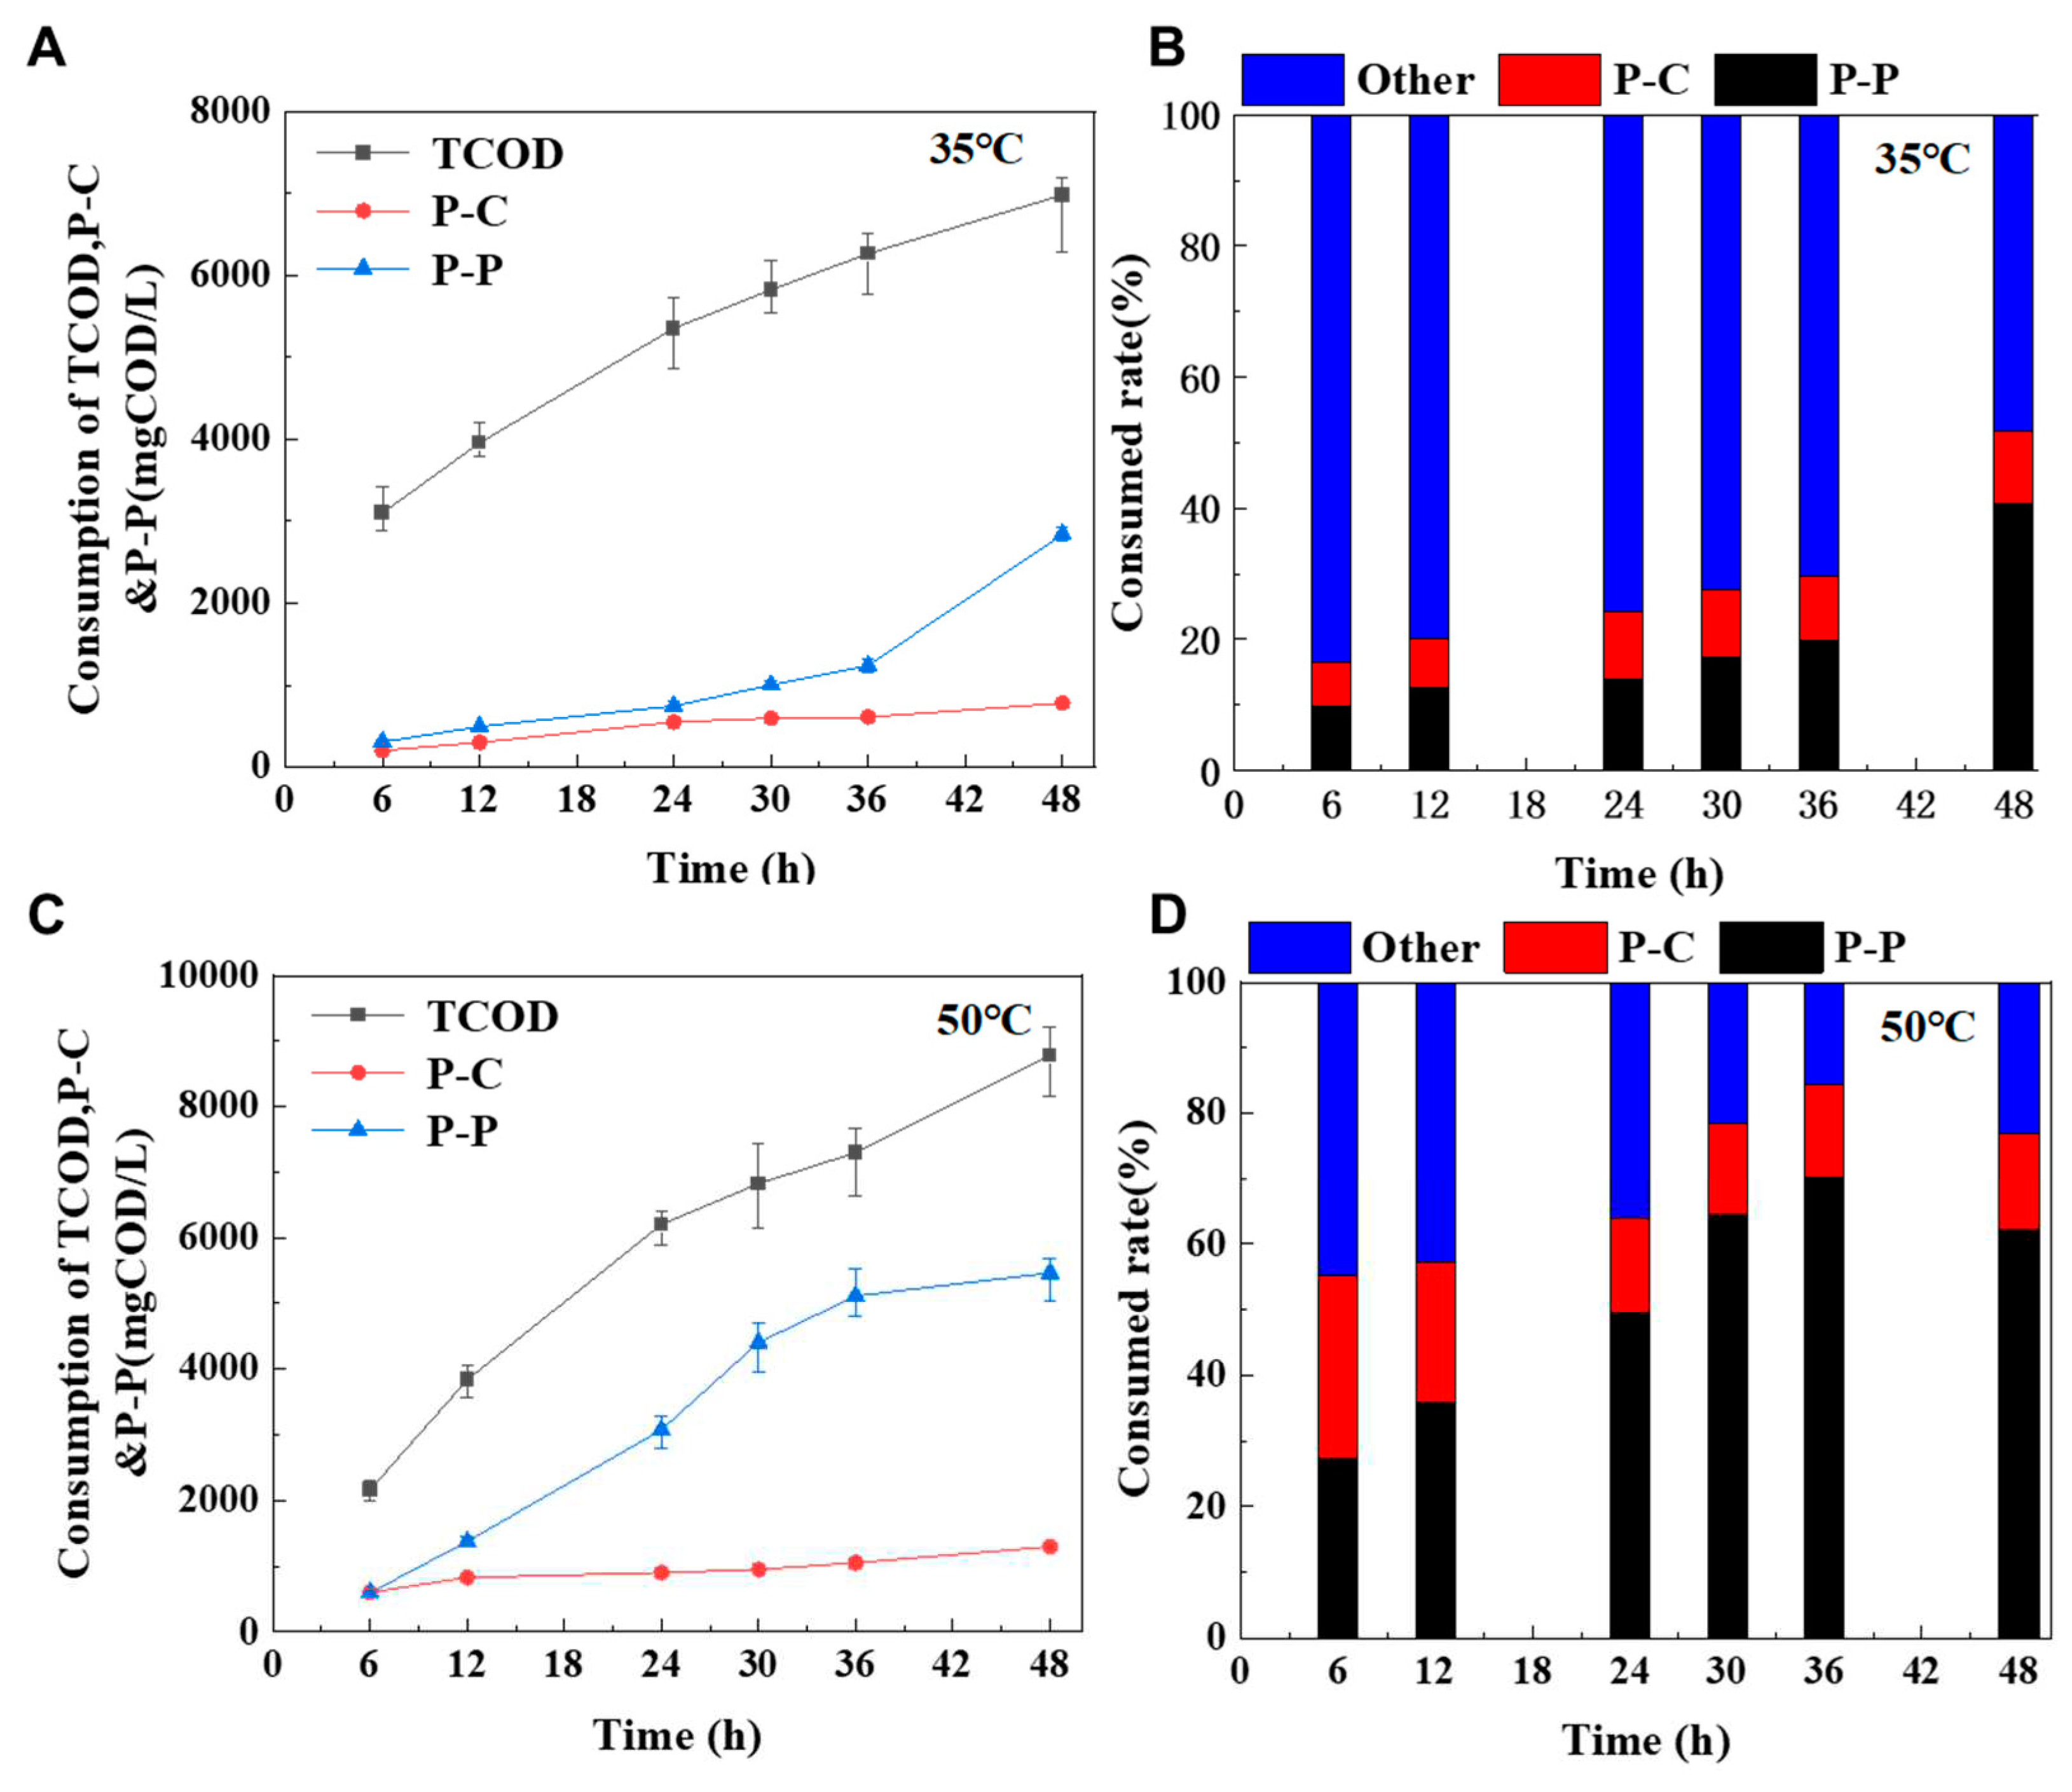
Figure 3.
SCOD change between mesophilic and thermophilic anaerobic digestion.
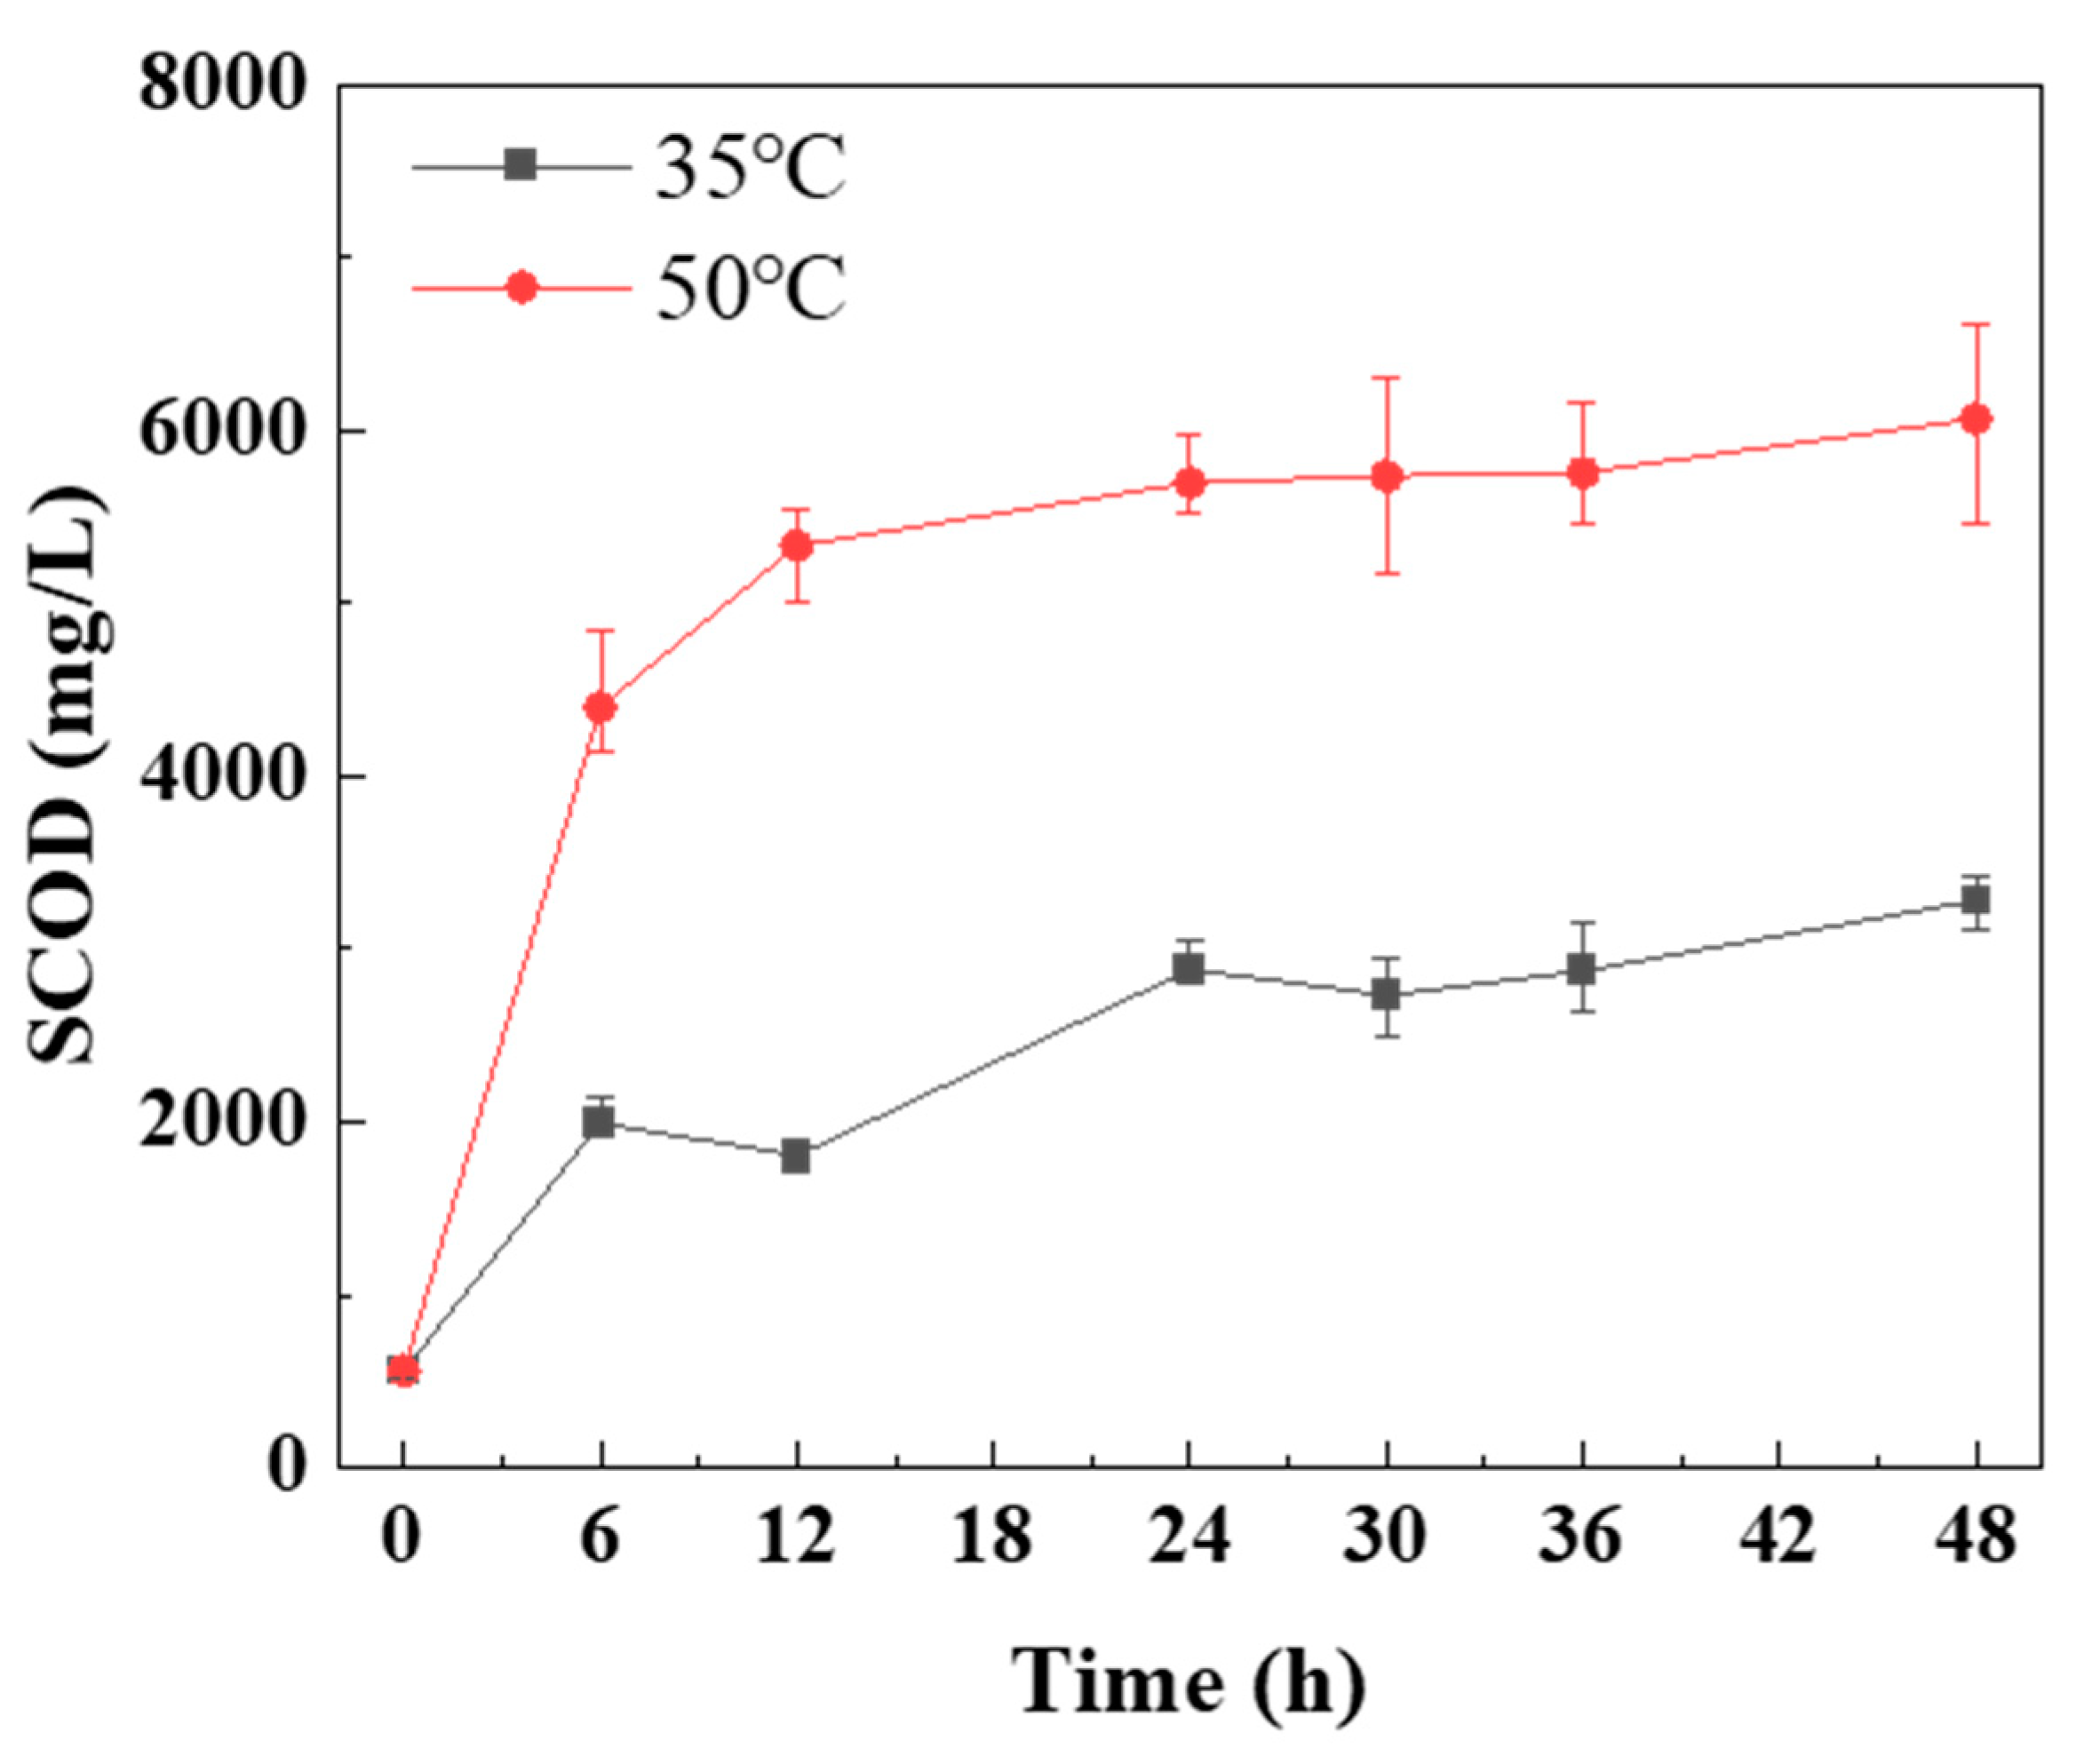
Figure 4.
Fluorescence EEM spectra of the digestion supernatant. (A) mesophilic digestion and (B) thermophilic digestion.
Figure 4.
Fluorescence EEM spectra of the digestion supernatant. (A) mesophilic digestion and (B) thermophilic digestion.
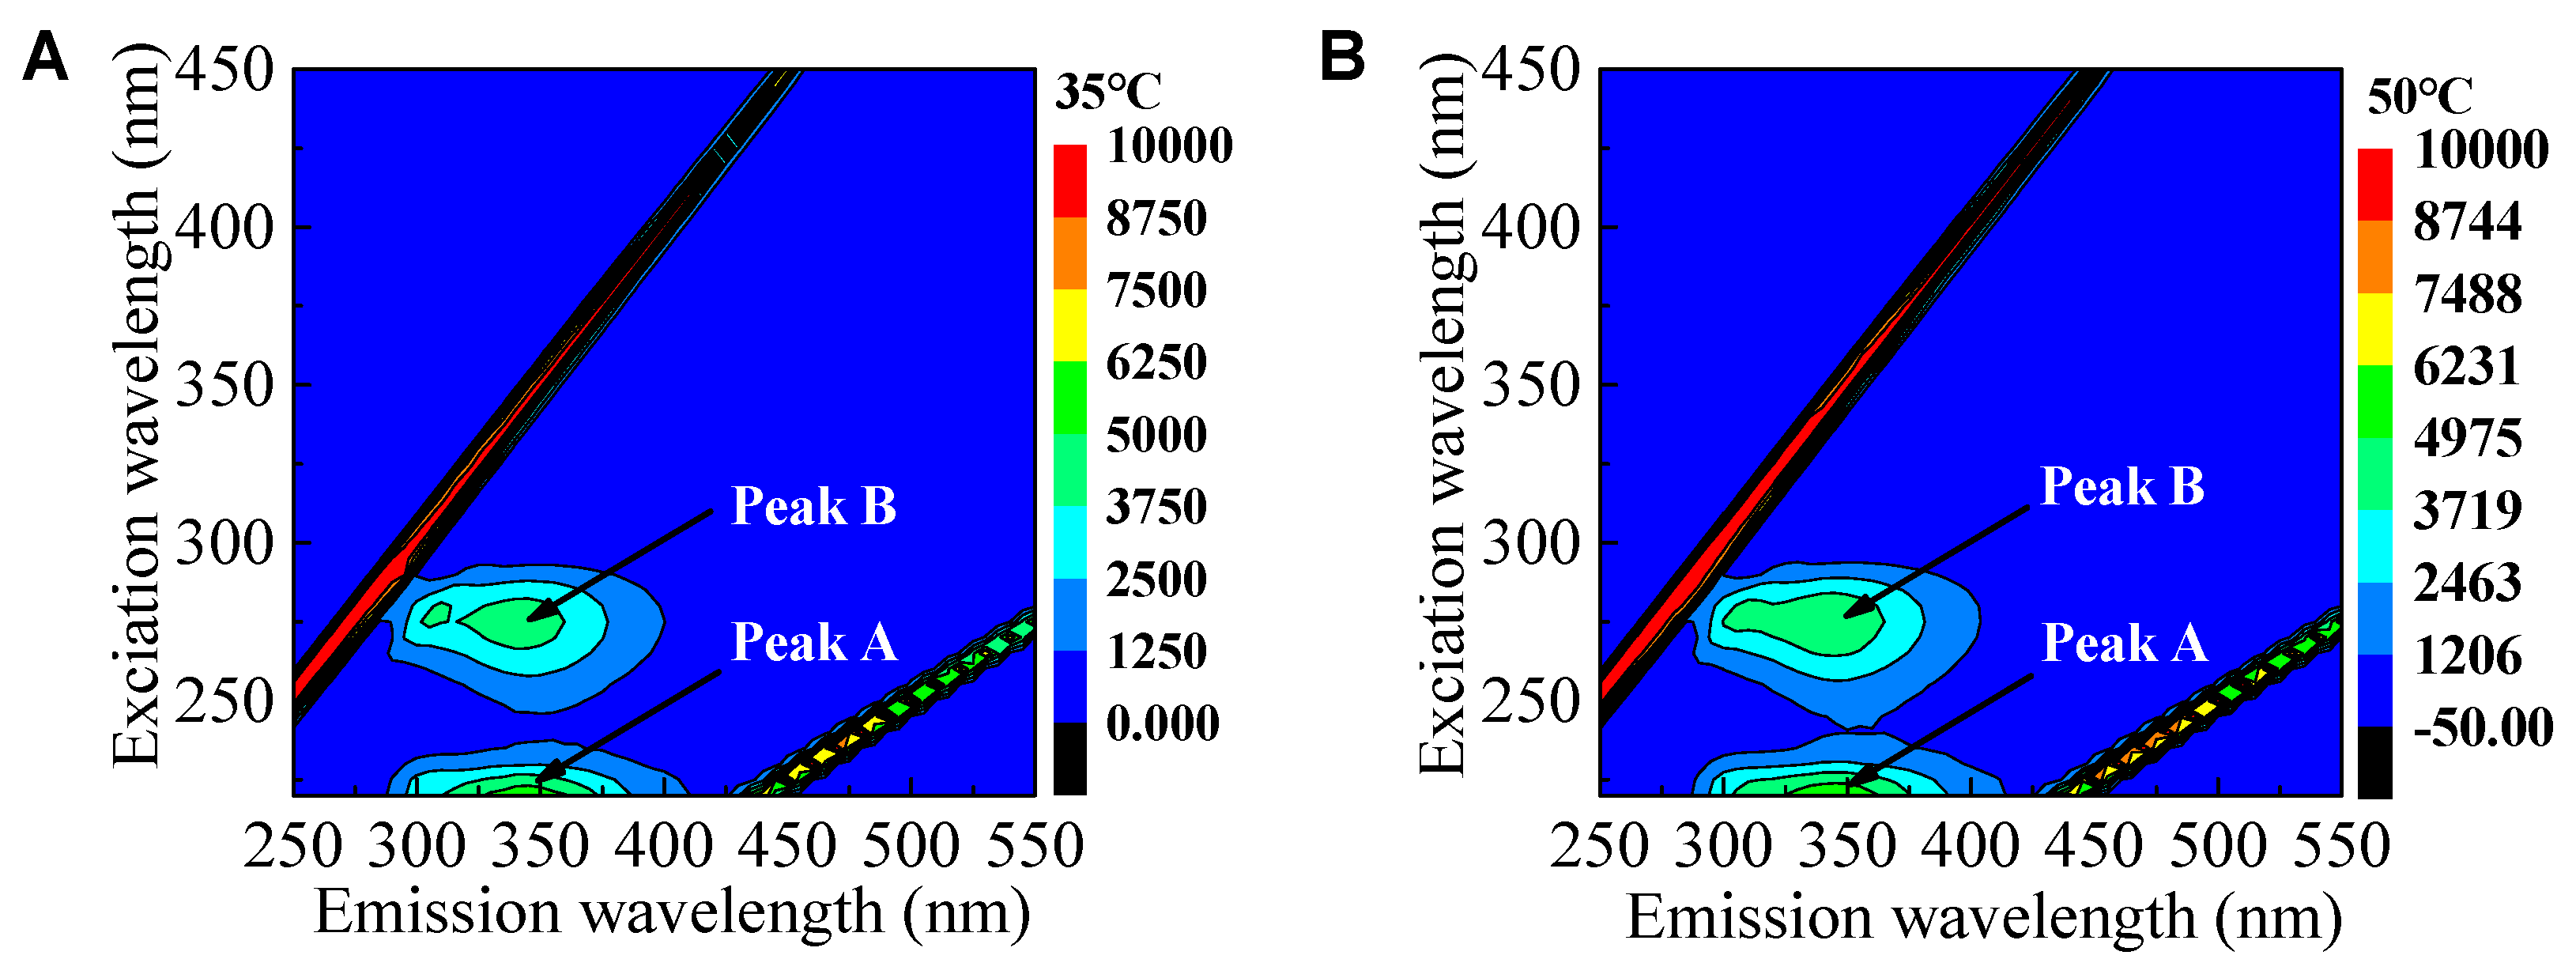
Figure 5.
The relation among individual VFAs, P-C and P-P. A and B: VFAs production in mesophilic digestion, C and D: VFAs production in thermophilic digestion, E and F: P-C and P-P degradation.
Figure 5.
The relation among individual VFAs, P-C and P-P. A and B: VFAs production in mesophilic digestion, C and D: VFAs production in thermophilic digestion, E and F: P-C and P-P degradation.
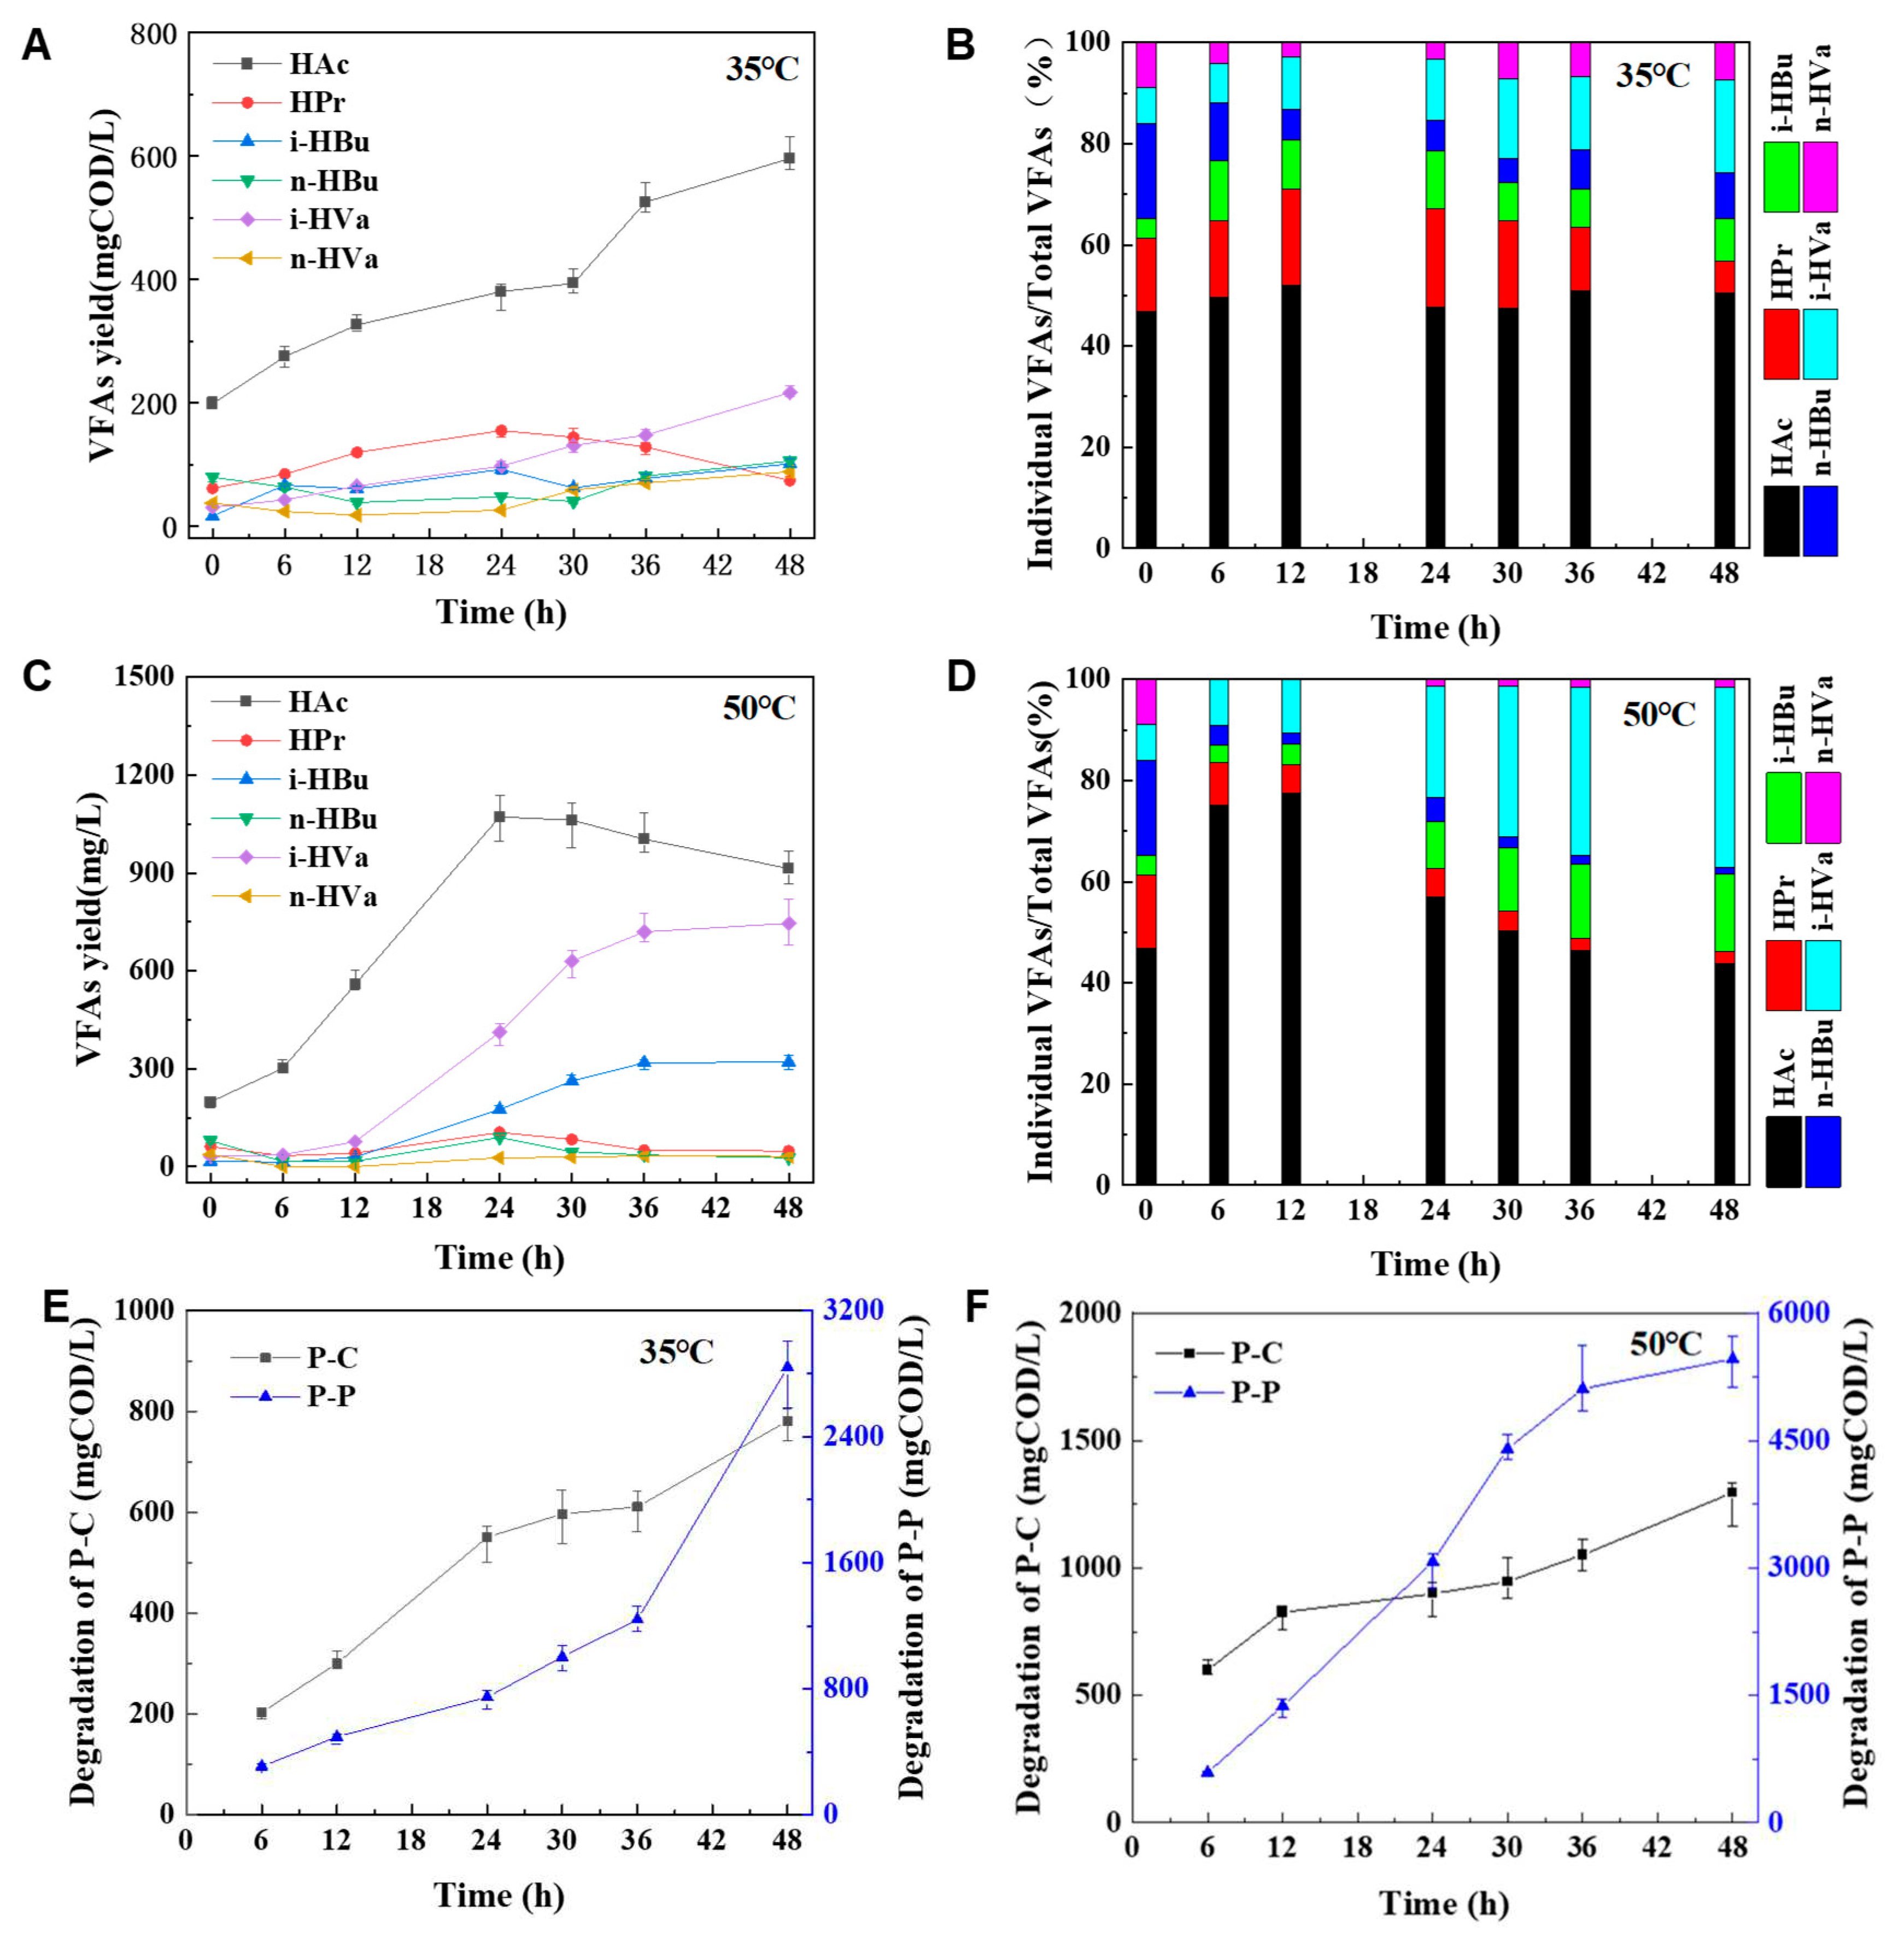
Figure 6.
The concentration variation of VFAs under thermophilic anaerobic digestion. (A) and (B) Series 4#; (C) and (D) Series 5#.
Figure 6.
The concentration variation of VFAs under thermophilic anaerobic digestion. (A) and (B) Series 4#; (C) and (D) Series 5#.
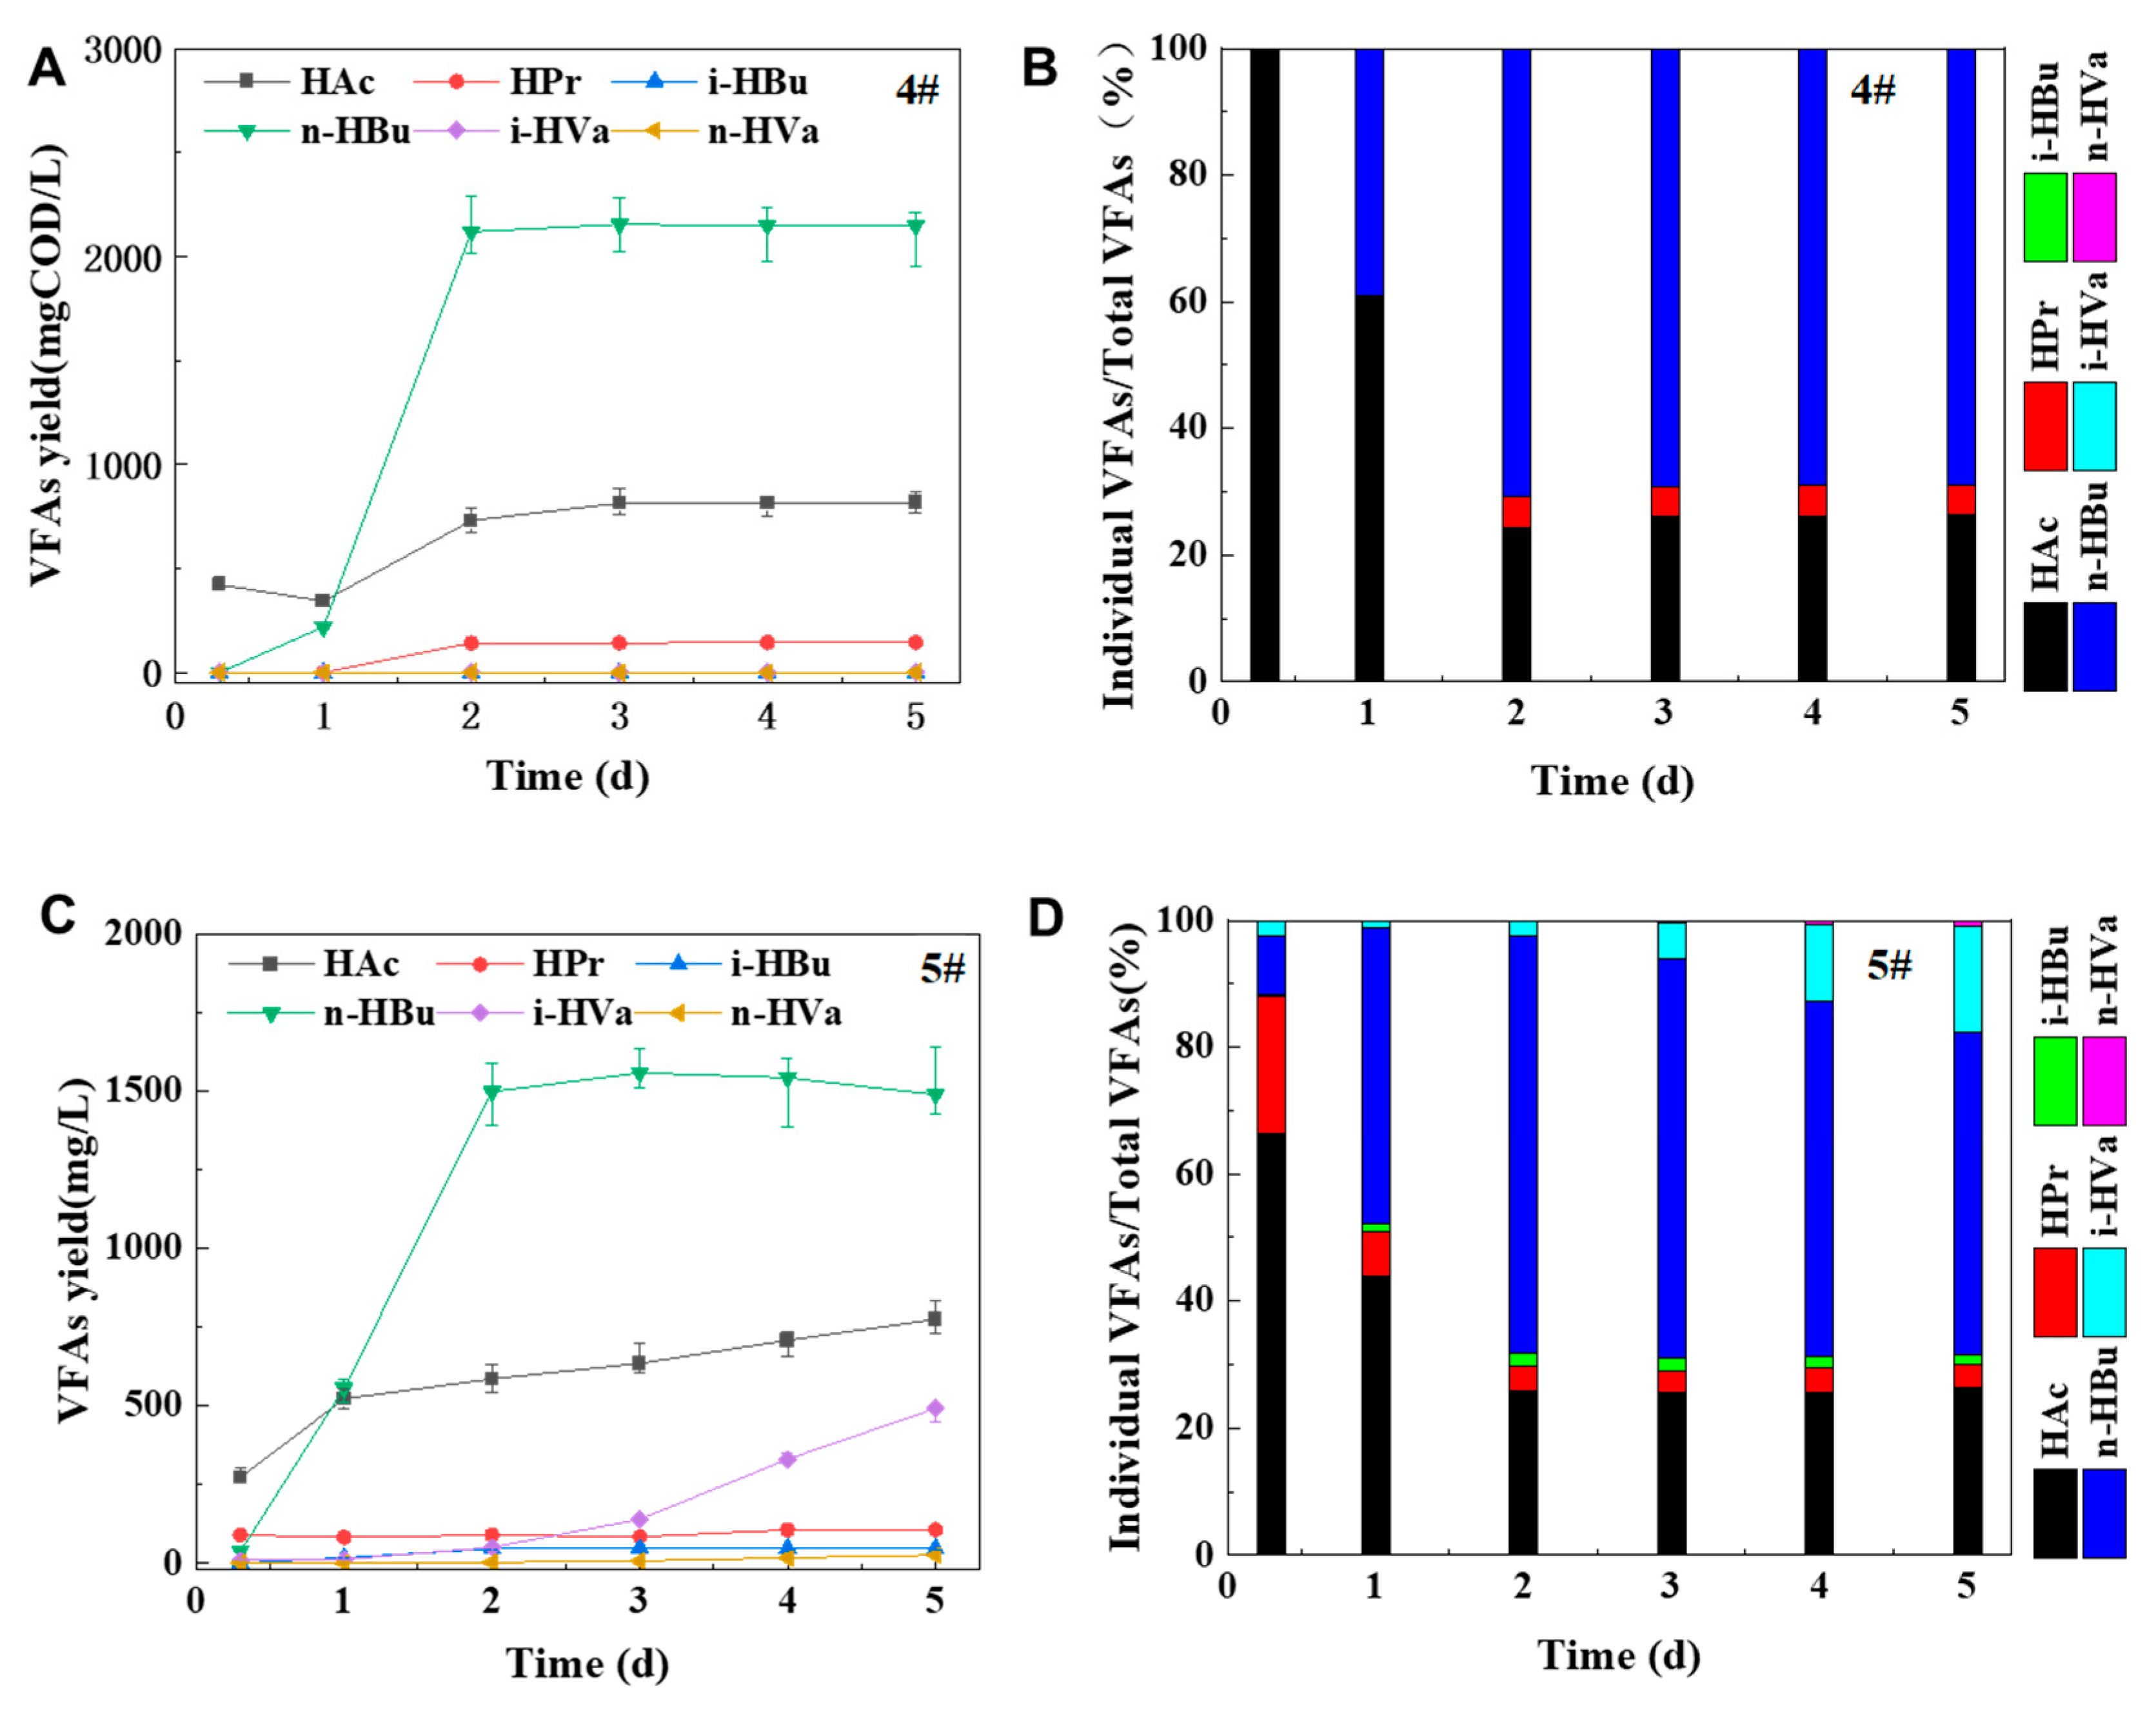
Figure 7.
The source of carbon atoms for VFAs yield. (A) and (B) HAc; (C) and (D) HPr; (E) and (F) HBu; (G) and (H) HVa.
Figure 7.
The source of carbon atoms for VFAs yield. (A) and (B) HAc; (C) and (D) HPr; (E) and (F) HBu; (G) and (H) HVa.
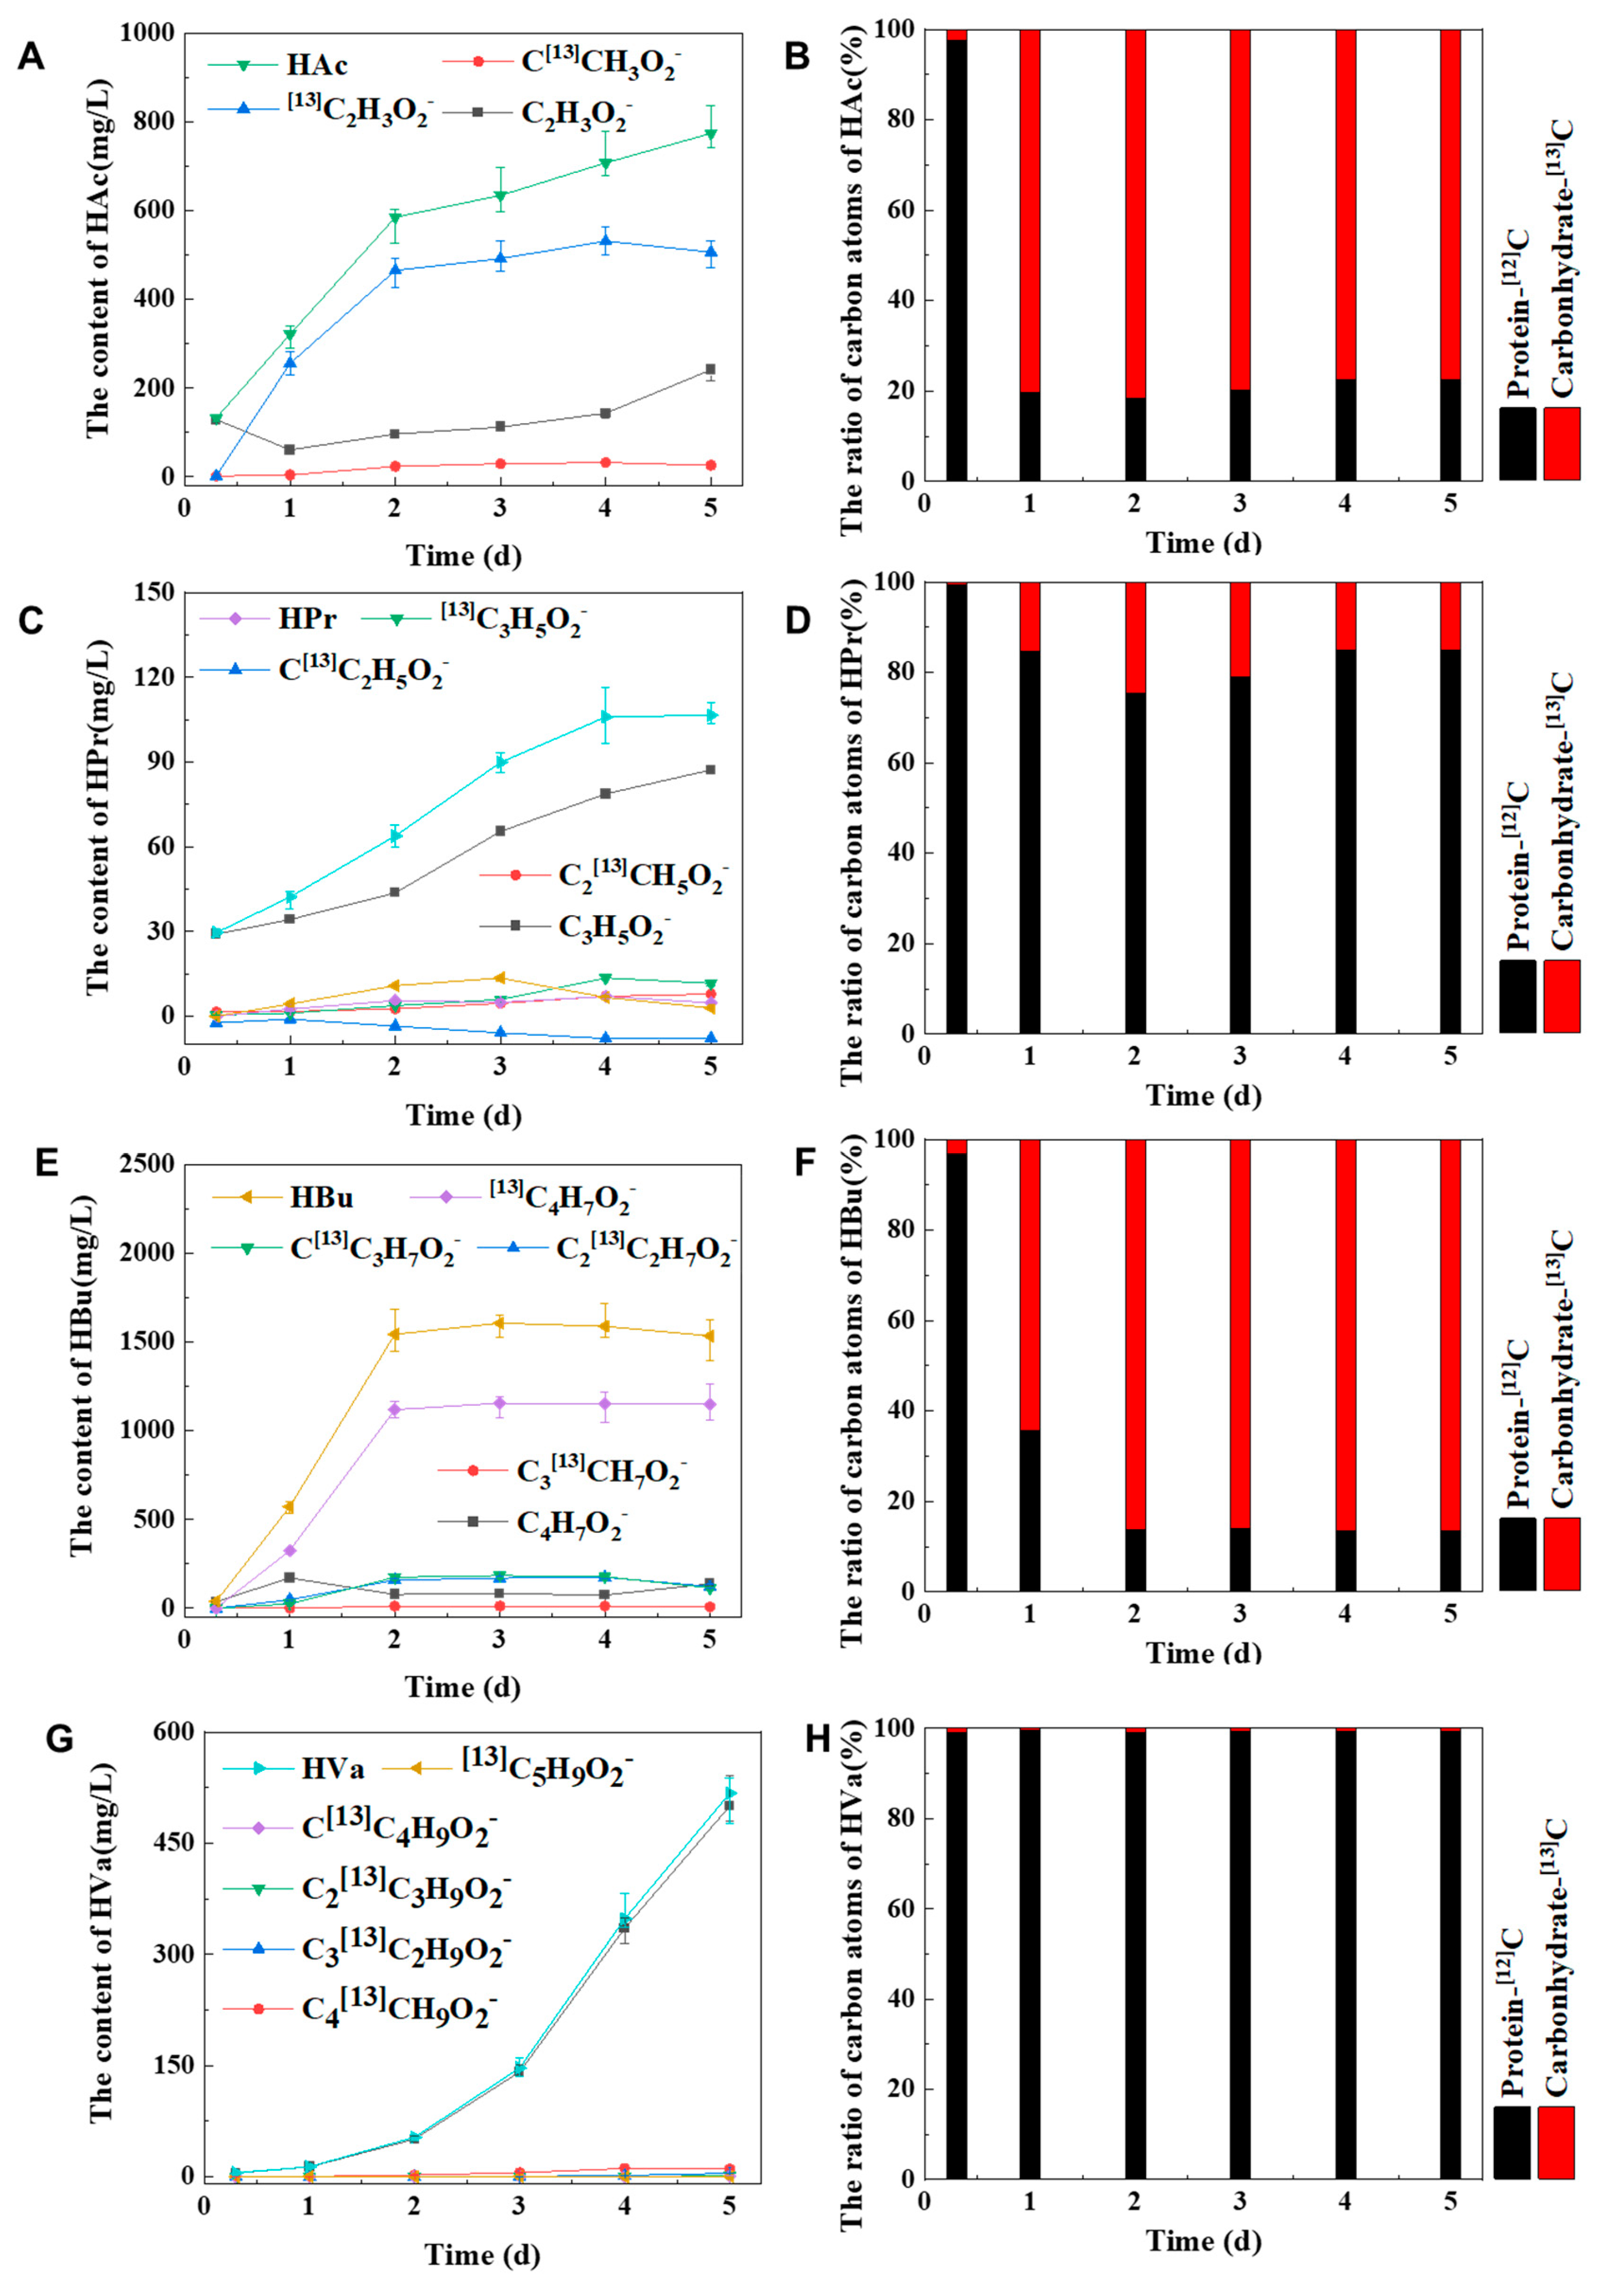
Figure 8.
The digestion pathway for HVa yield.
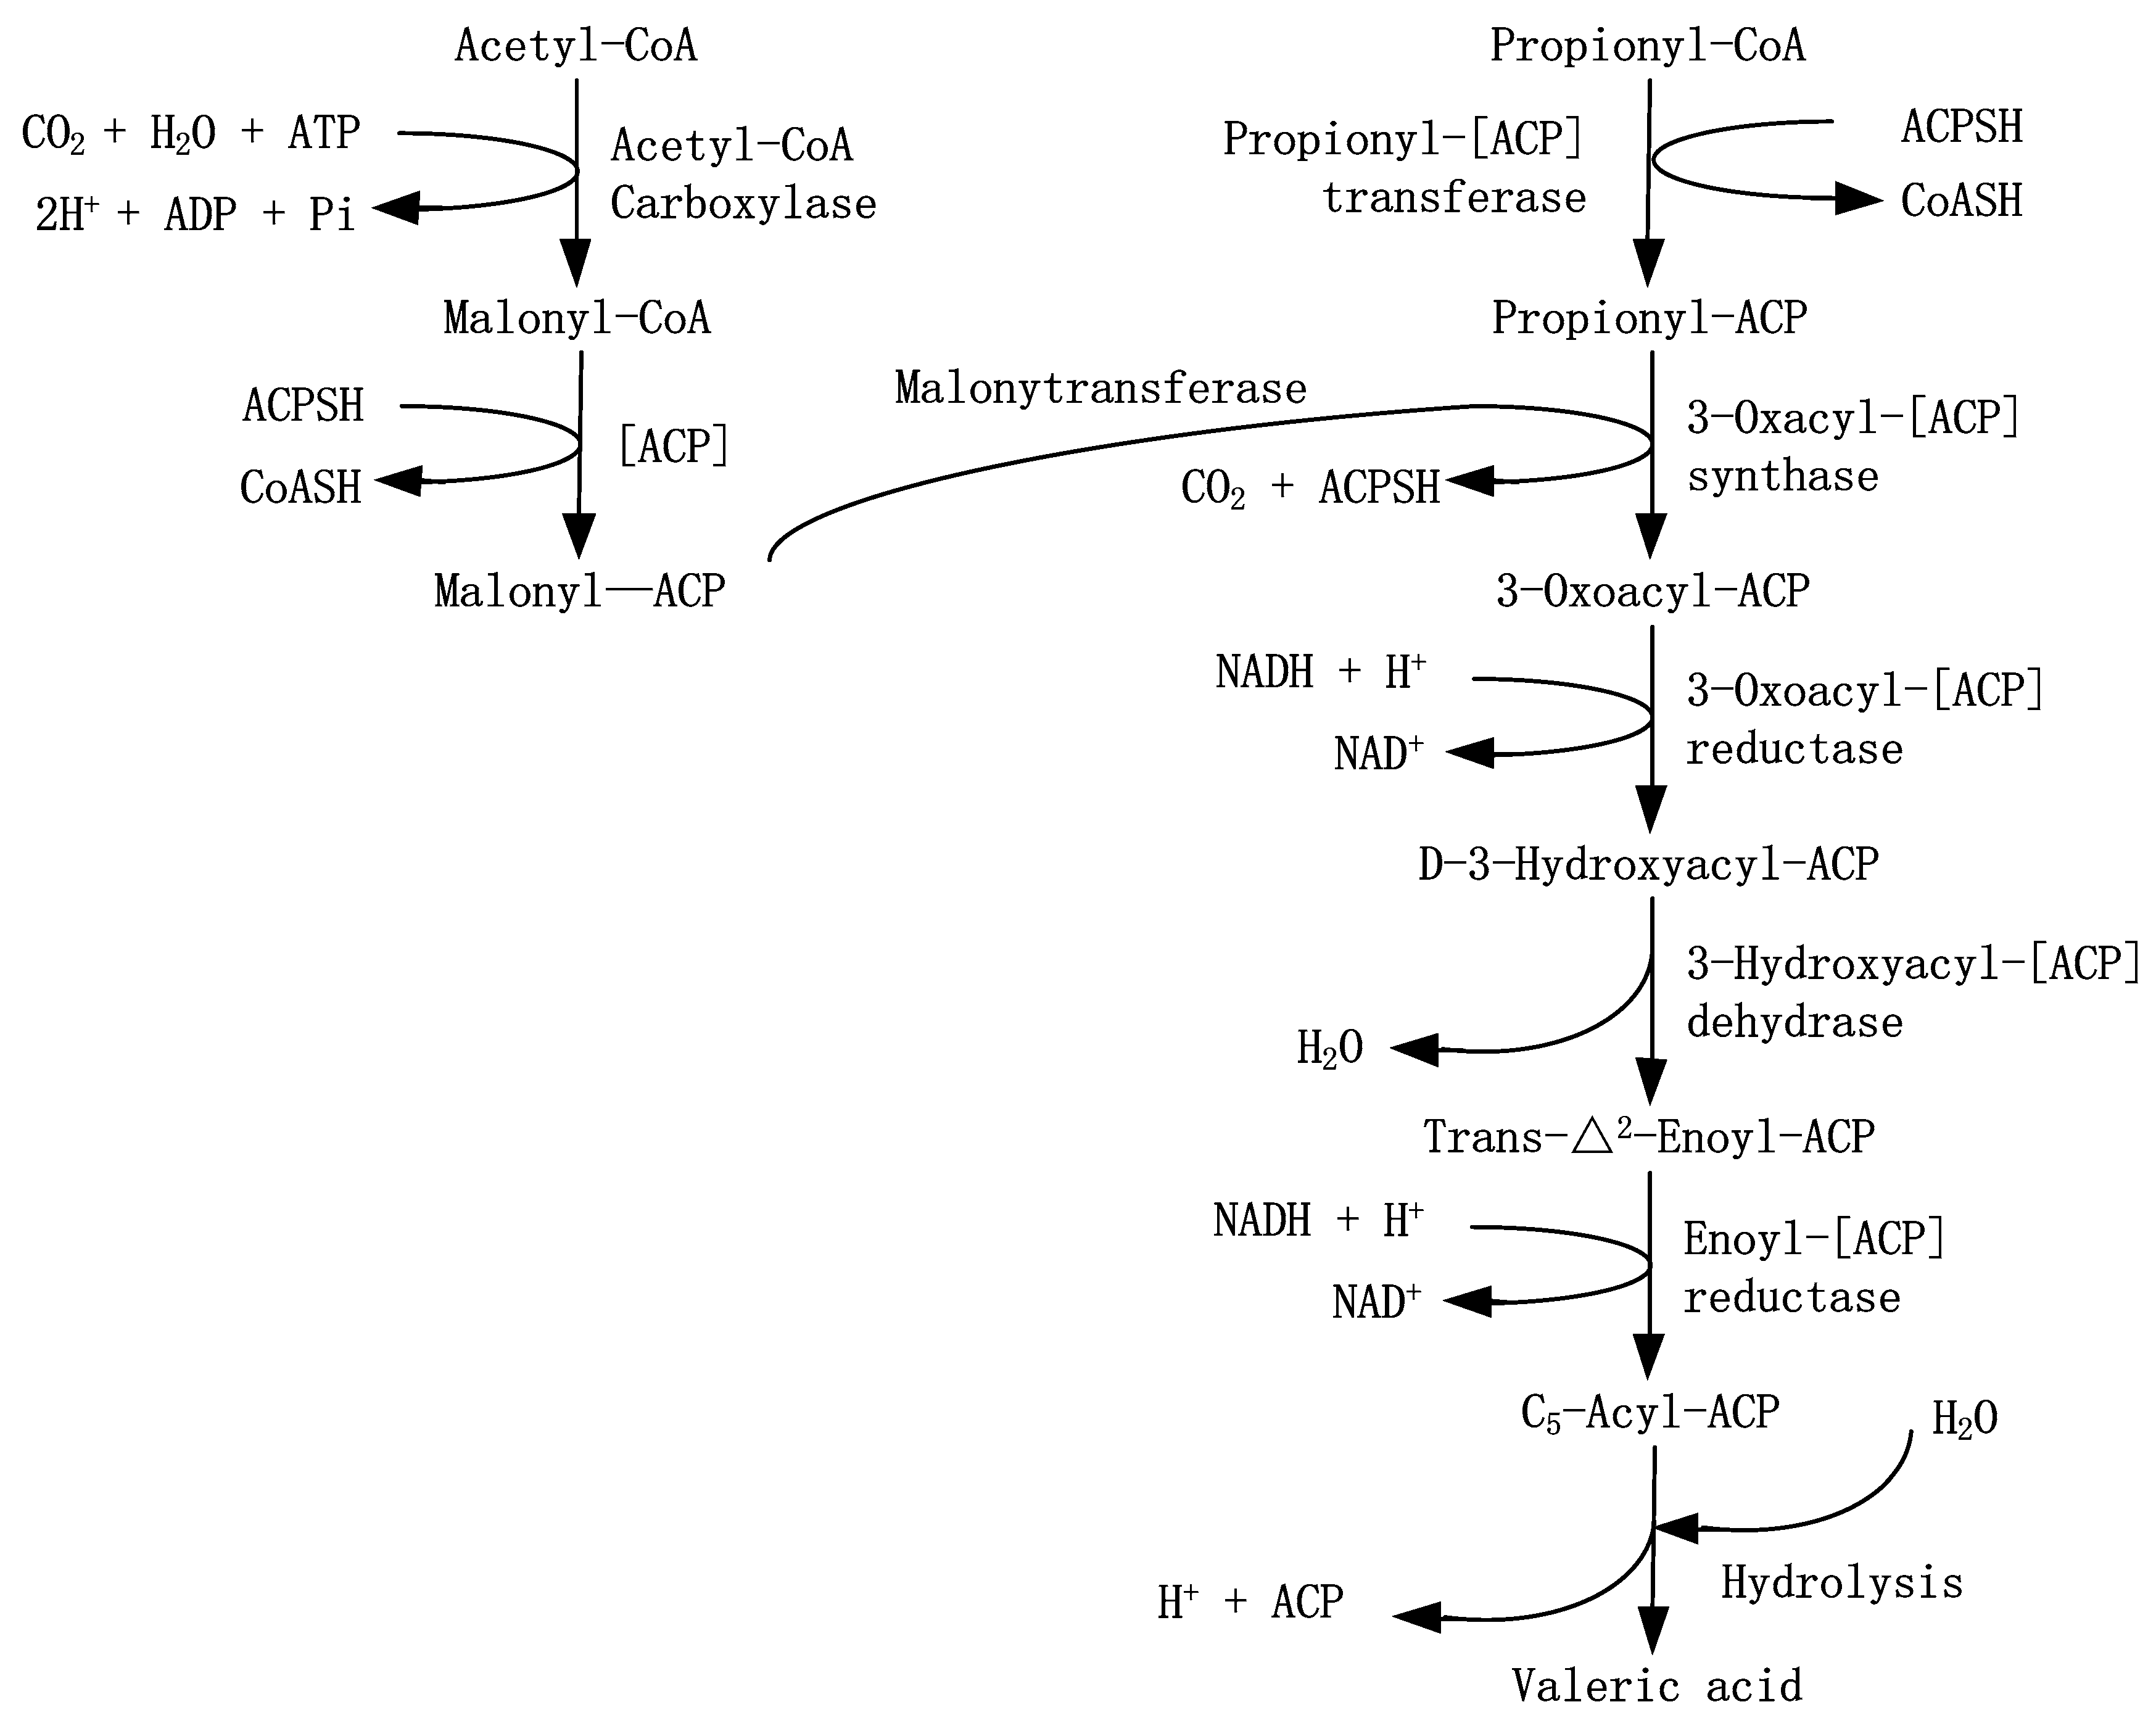

Table 1.
Characteristics of thickened waste activated sludge sample.
| Parameter | Unit | Sludge A Meana ± SDb |
Sludge B Meana ± SDb |
|---|---|---|---|
| TSS (total suspended solids) | g/L | 22.21±1.21 | 23.37±1.60 |
| VSS (volatile suspended solids) | g/L | 15.04±2.52 | 17.58±2.10 |
| pH | 7.02±0.01 | 6.97±0.01 | |
| SCOD (soluble chemical oxygen demand) | mg/L | 561.79±11.03 | 590.81±21.32 |
| TCOD (Total chemical oxygen demand) | mg/L | 21326.72±125.62 | 24166.11±372. 23 |
| P-P (particulate protein)c | mg COD/L | 12850.06±242.50 | 12202.50±142.65 |
| P-C(particulate carbohydrate)c | mg COD/L | 2369.56±47.39 | 4647.18±36.73 |
| P-L (particulate lipid) c | mg COD/L | 4066.57±86.63 | 3050.35±63.39 |
| S-P (soluble protein) c | mg COD/L | 73.20±1.45 | 31.22±2.36 |
| S-C (soluble carbohydrate) c | mg COD/L | 38.46±1.76 | 195.76±10.82 |
| HA (humic acid)d | mg COD/L | 14.73±0.82 | 71.31±3.26 |
| TVFAs (total volatile fatty acids) | mg COD/L | 423.32±16.93 | 222.05±21.63 |
a. Mean value of three individual determinations. b. Standard deviation. c. The COD conversion factors for protein, carbohydrate and lipid is described by Grady(Grady et al., 1999). d. The COD conversion factors of HA was 1.2236, detailedly shown in Supplementary Information (Figure S1, Page 2).
Table 2.
The degradation rate of P-C, P-P and P-L at 48h.
| Degradation Rate (%) | 35℃ | 50℃ | |
|---|---|---|---|
| MLVSS | |||
| P-C | 32.98 | 54.70 | |
| P-P | 22.10 | 42.52 | |
| P-L | 3.27 | 4.26 | |
| MLVSS | 32.69 | 41.10 |
Table 3.
The hydrolysis rate constant of P-C, P-P and MLVSS.
| Temperature (℃) | Kinetic equation | kx (h-1) | Coefficient R2 |
|---|---|---|---|
| 35℃ | y=2369.54×exp(-0.00915x) | kp-c= 0.00915 | 0.9486 |
| y=12850.06×exp(-0.00372x) | kp-p = 0.00915 | 0.8208 | |
| y=15.04×exp(-0.0101x) | kMLVSS = 0.01018 | 0.7697 | |
| 50℃ | y=2369.54×exp(-0.02060x) | Kp-c = 0.02060 | 0.6370 |
| y=12850.06×exp(-0.01220x) | kp-p = 0.01220 | 0.9606 | |
| y=15.04×exp(-0.0126x) | kMLVSS = 0.0126 | 0.9474 |
Disclaimer/Publisher’s Note: The statements, opinions and data contained in all publications are solely those of the individual author(s) and contributor(s) and not of MDPI and/or the editor(s). MDPI and/or the editor(s) disclaim responsibility for any injury to people or property resulting from any ideas, methods, instructions or products referred to in the content. |
© 2023 by the authors. Licensee MDPI, Basel, Switzerland. This article is an open access article distributed under the terms and conditions of the Creative Commons Attribution (CC BY) license (http://creativecommons.org/licenses/by/4.0/).
Copyright: This open access article is published under a Creative Commons CC BY 4.0 license, which permit the free download, distribution, and reuse, provided that the author and preprint are cited in any reuse.


